Correction: Czerkawski et al. Deep Internal Learning for Inpainting of Cloud-Affected Regions in Satellite Imagery. Remote Sens. 2022, 14, 1342

 ,
,  , , , ,
  ,
,  ,
,  , and
, and 
| i_ssim_val = ssim(s2_out[mask == mask.min()], |
| s2_gt[mask == mask.min()], |
| multichannel=True) |
| whole_ssim, ssim_img = ssim(s2_gt, |
| s2_out, |
| multichannel = True, |
| full = True) |
| i_ssim_val = ssim_img[mask == mask.min()].mean() |
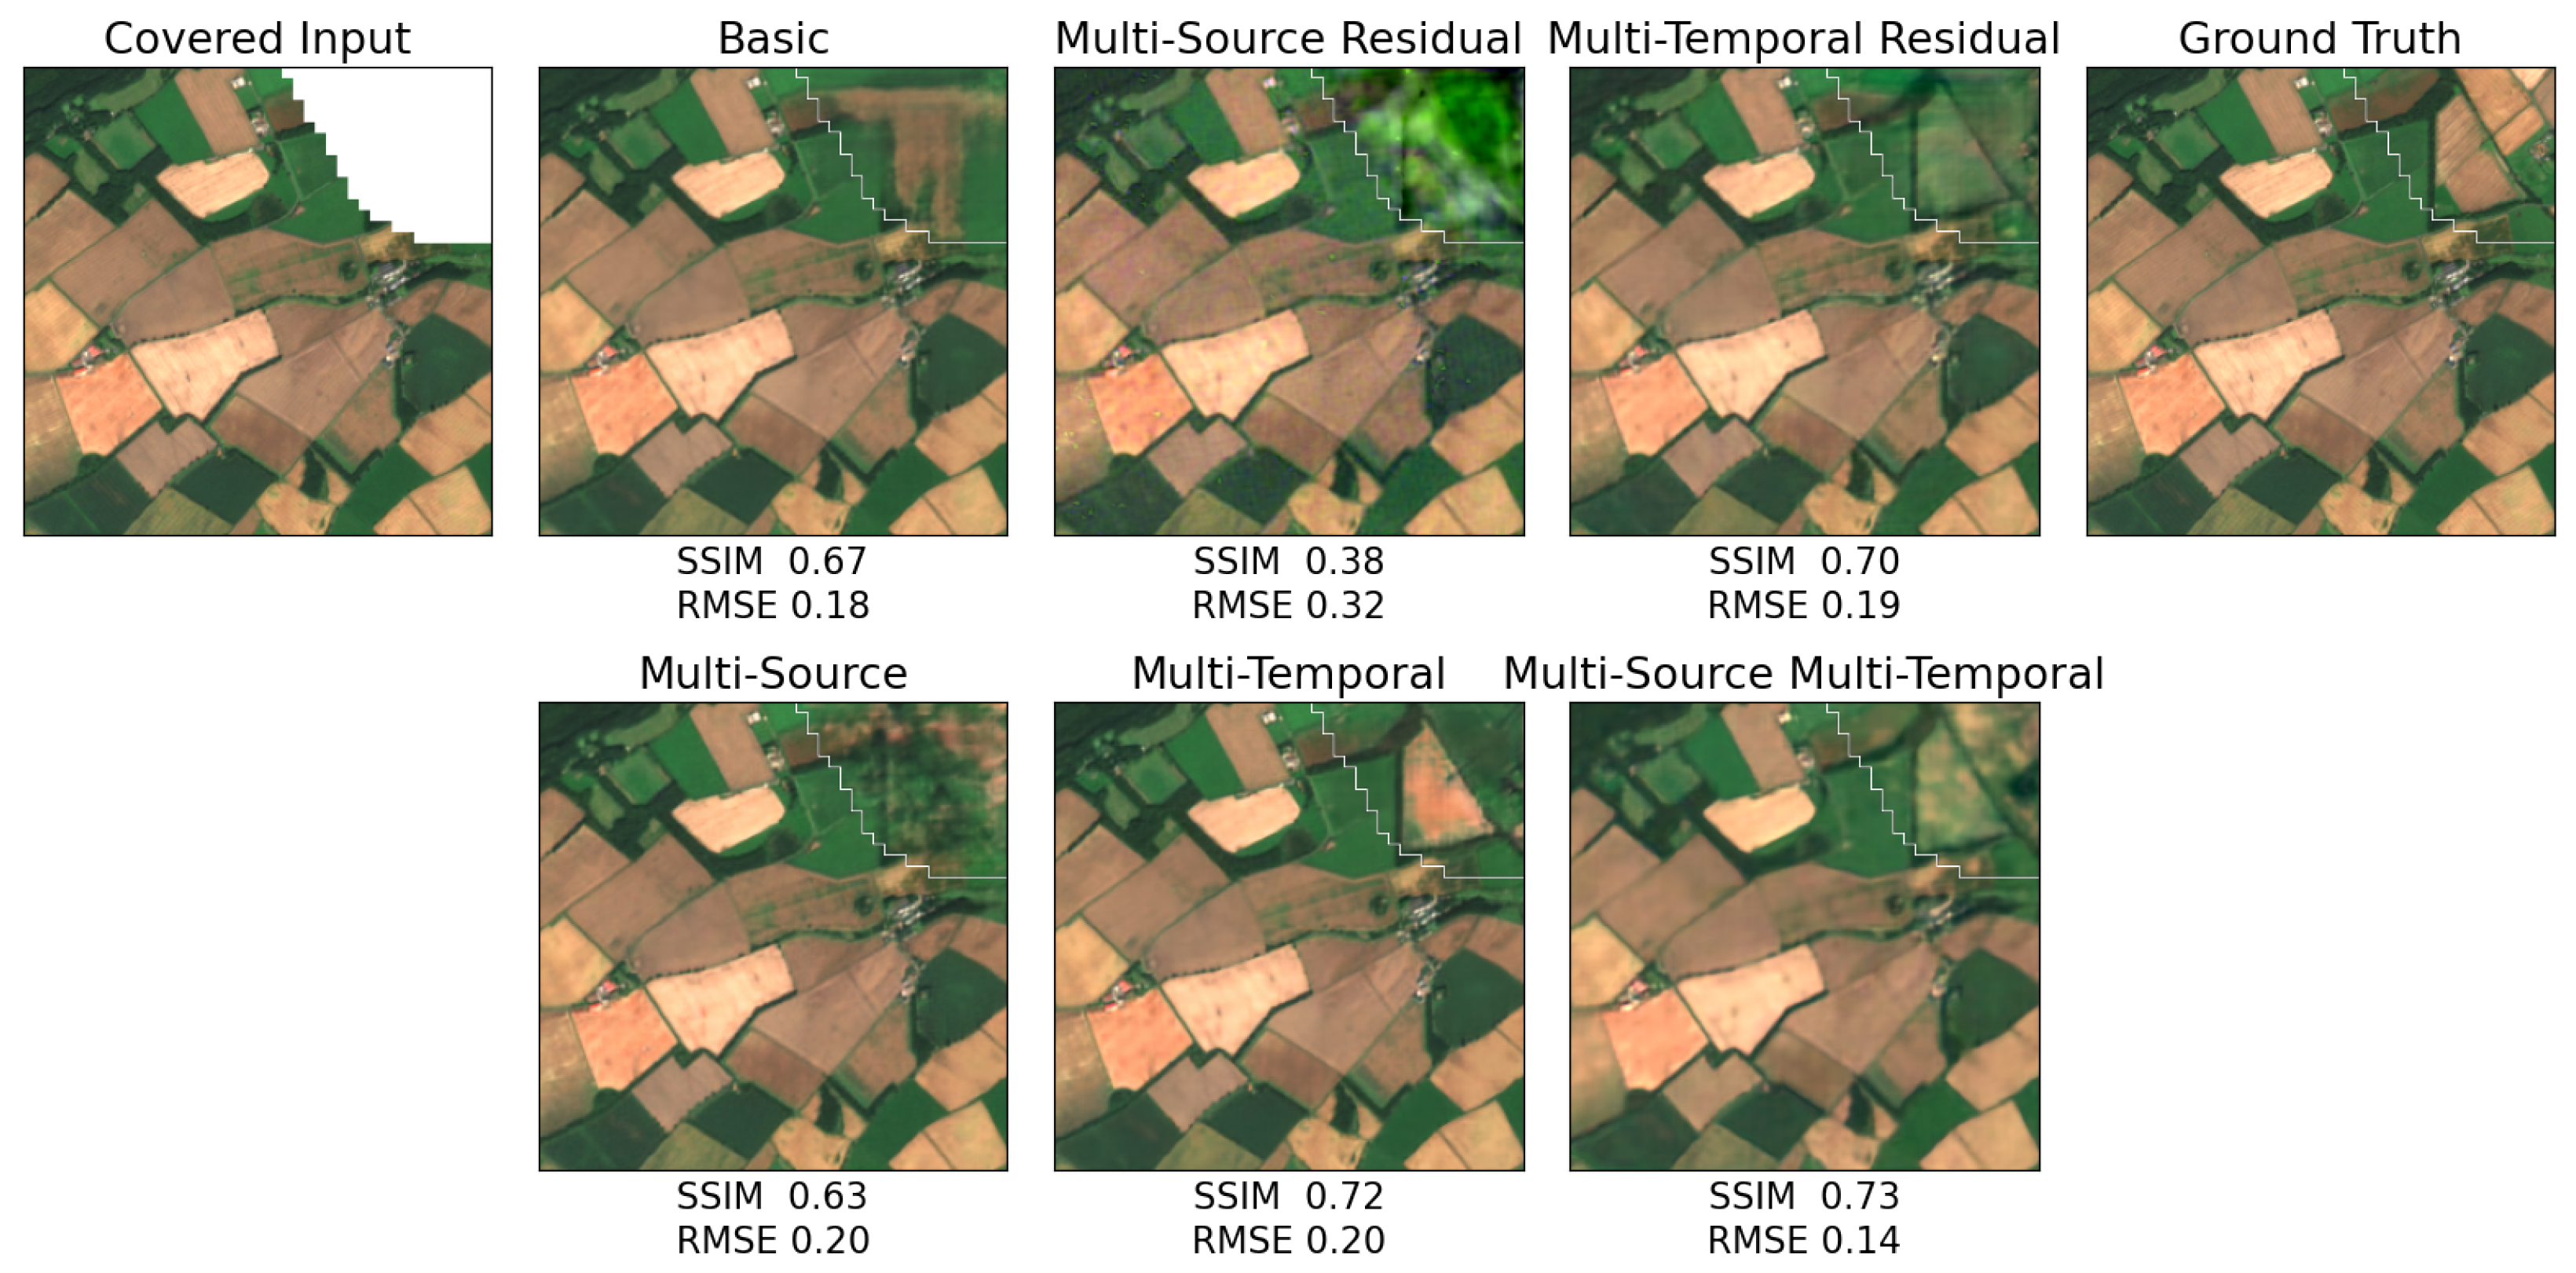
- Figure 2 caption delete duplicate explanation “(c) multi-source residual”
- Figure 4 SSIM values
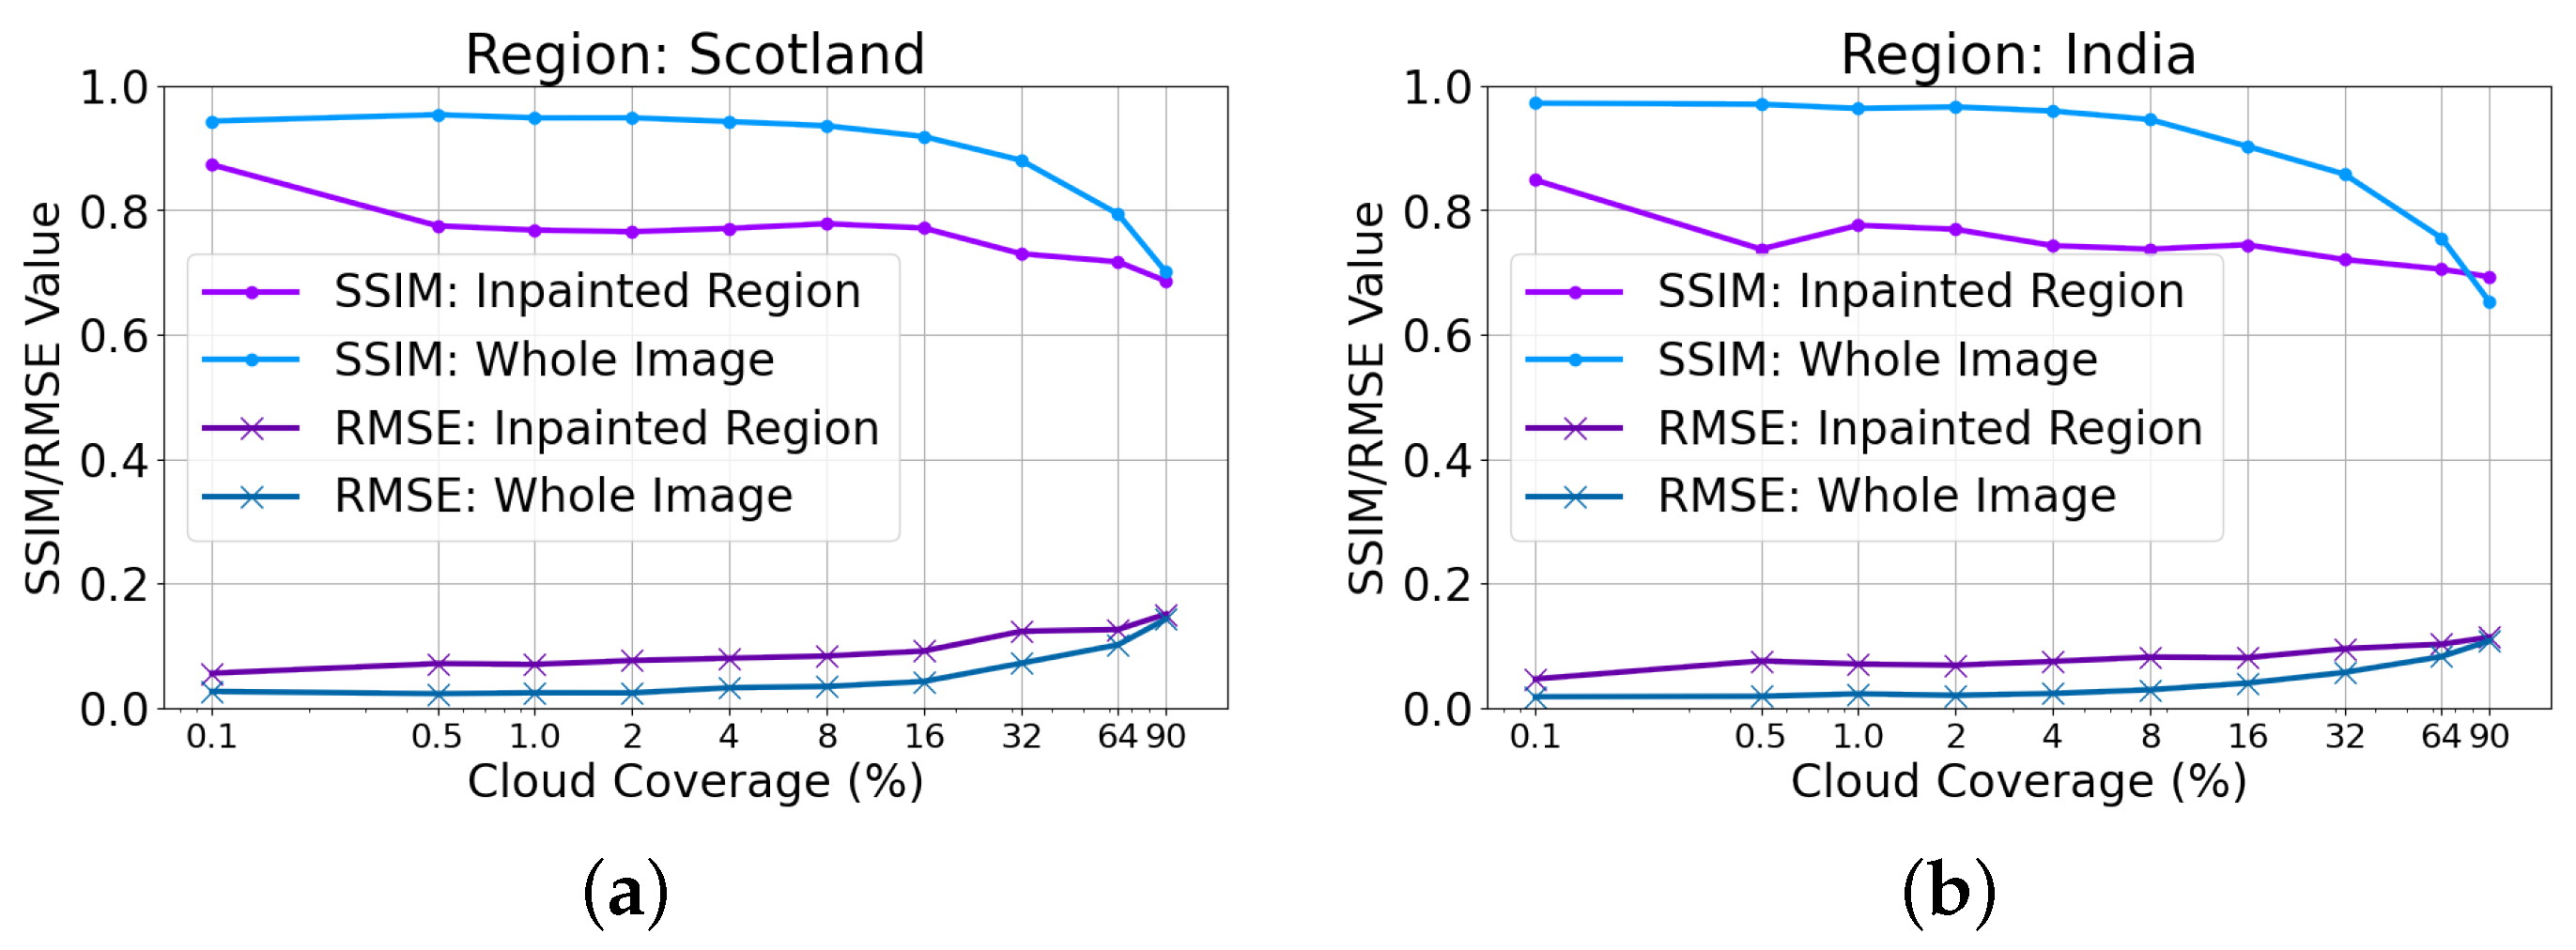
- Figure 5 SSIM of inpainted Region (purple trace)
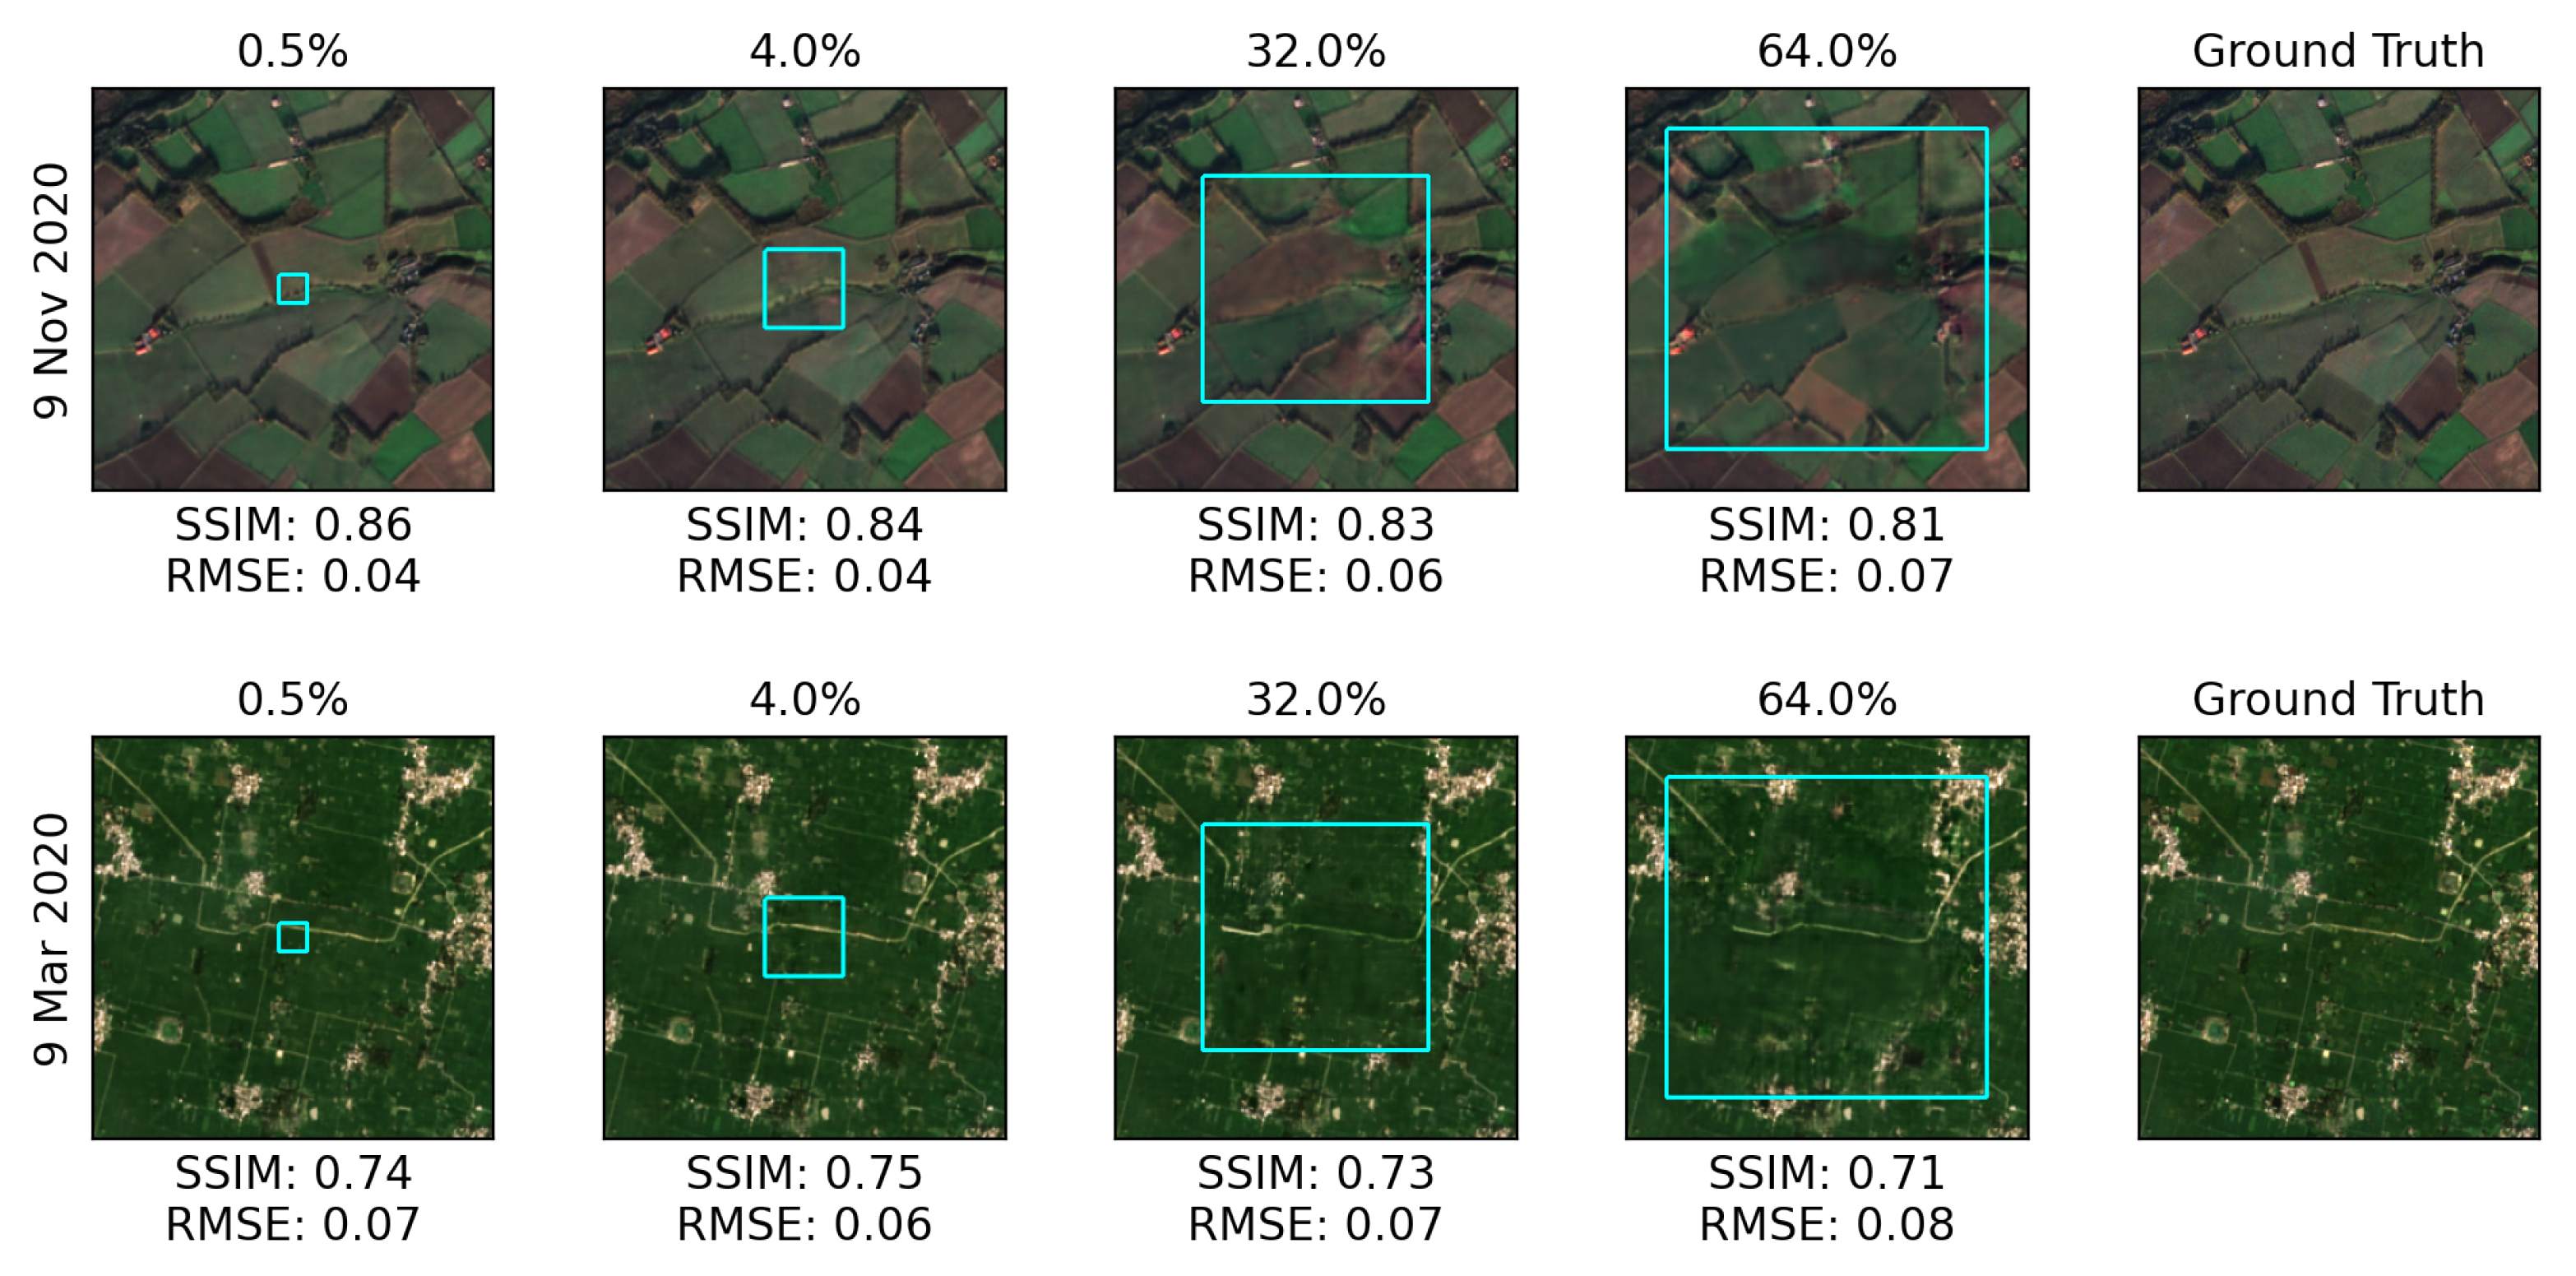
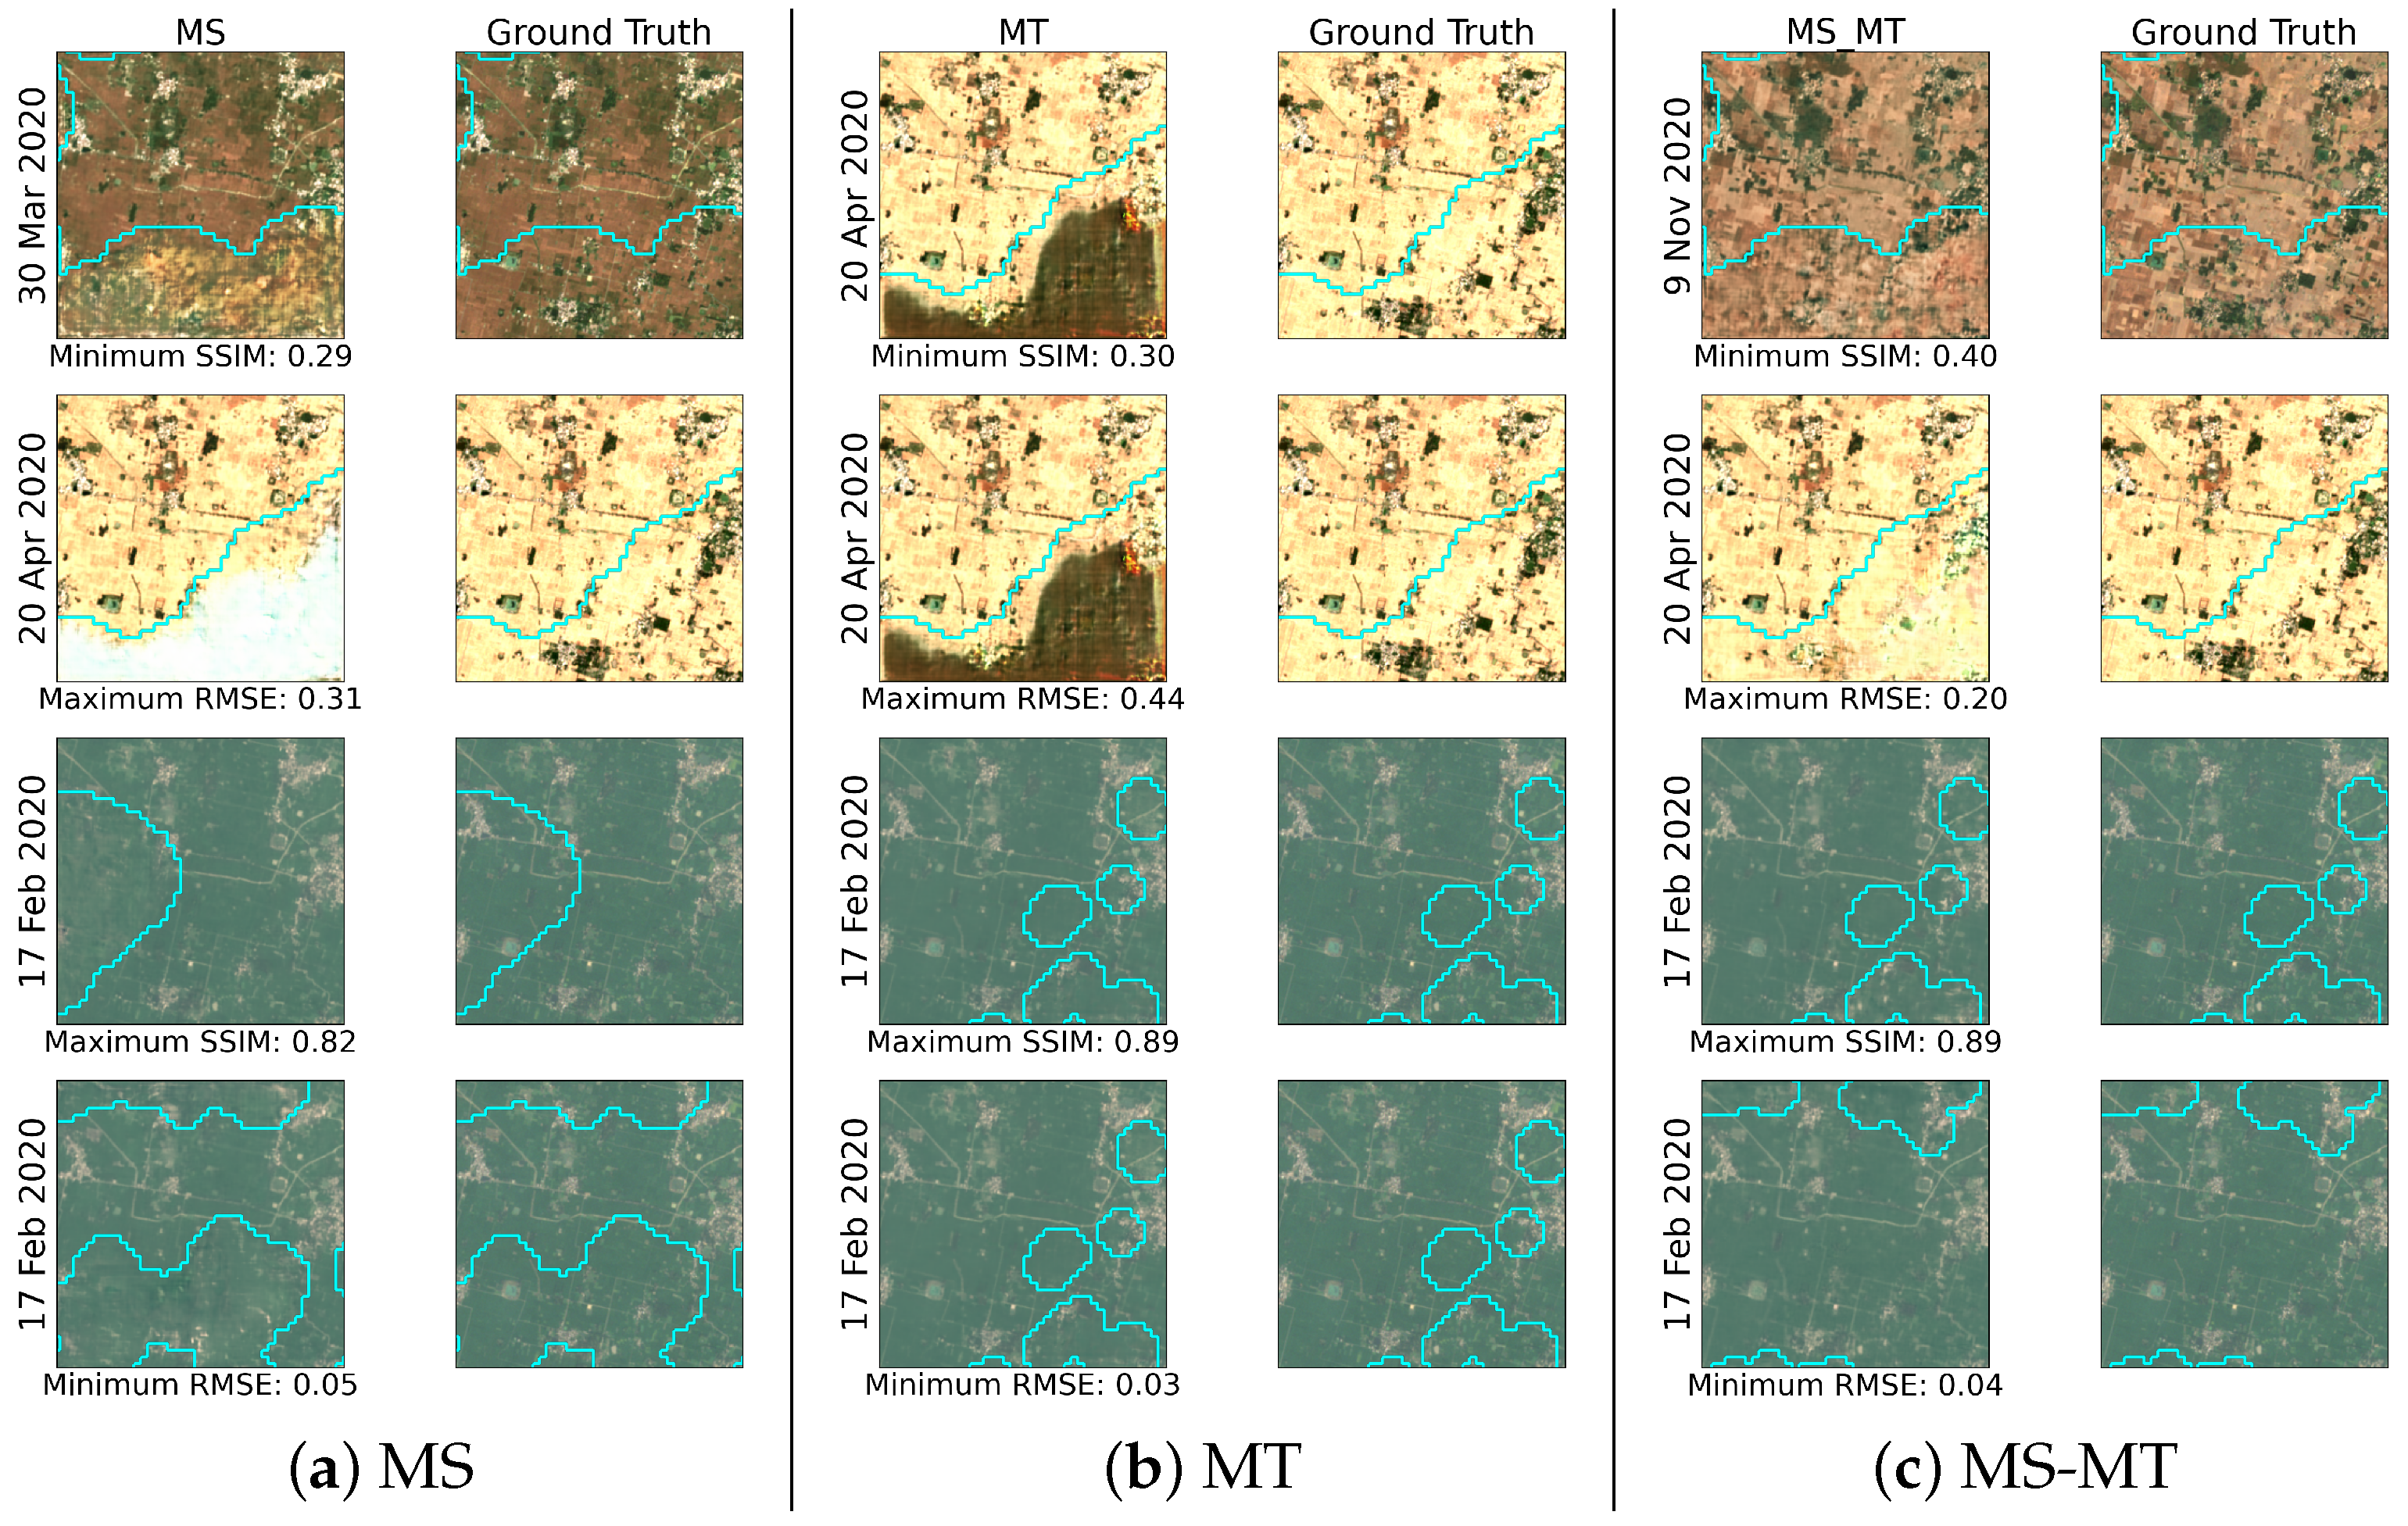
- Figure 6 SSIM values
- Table 2 Inpainting SSIM
- The sentence in line 257 should read “The inpainting quality appears to be consistent for cloud coverage ratio between 0.1% to 16%, where the inpainted region SSIM is approximately 0.75 for the Scotland and India regions.”
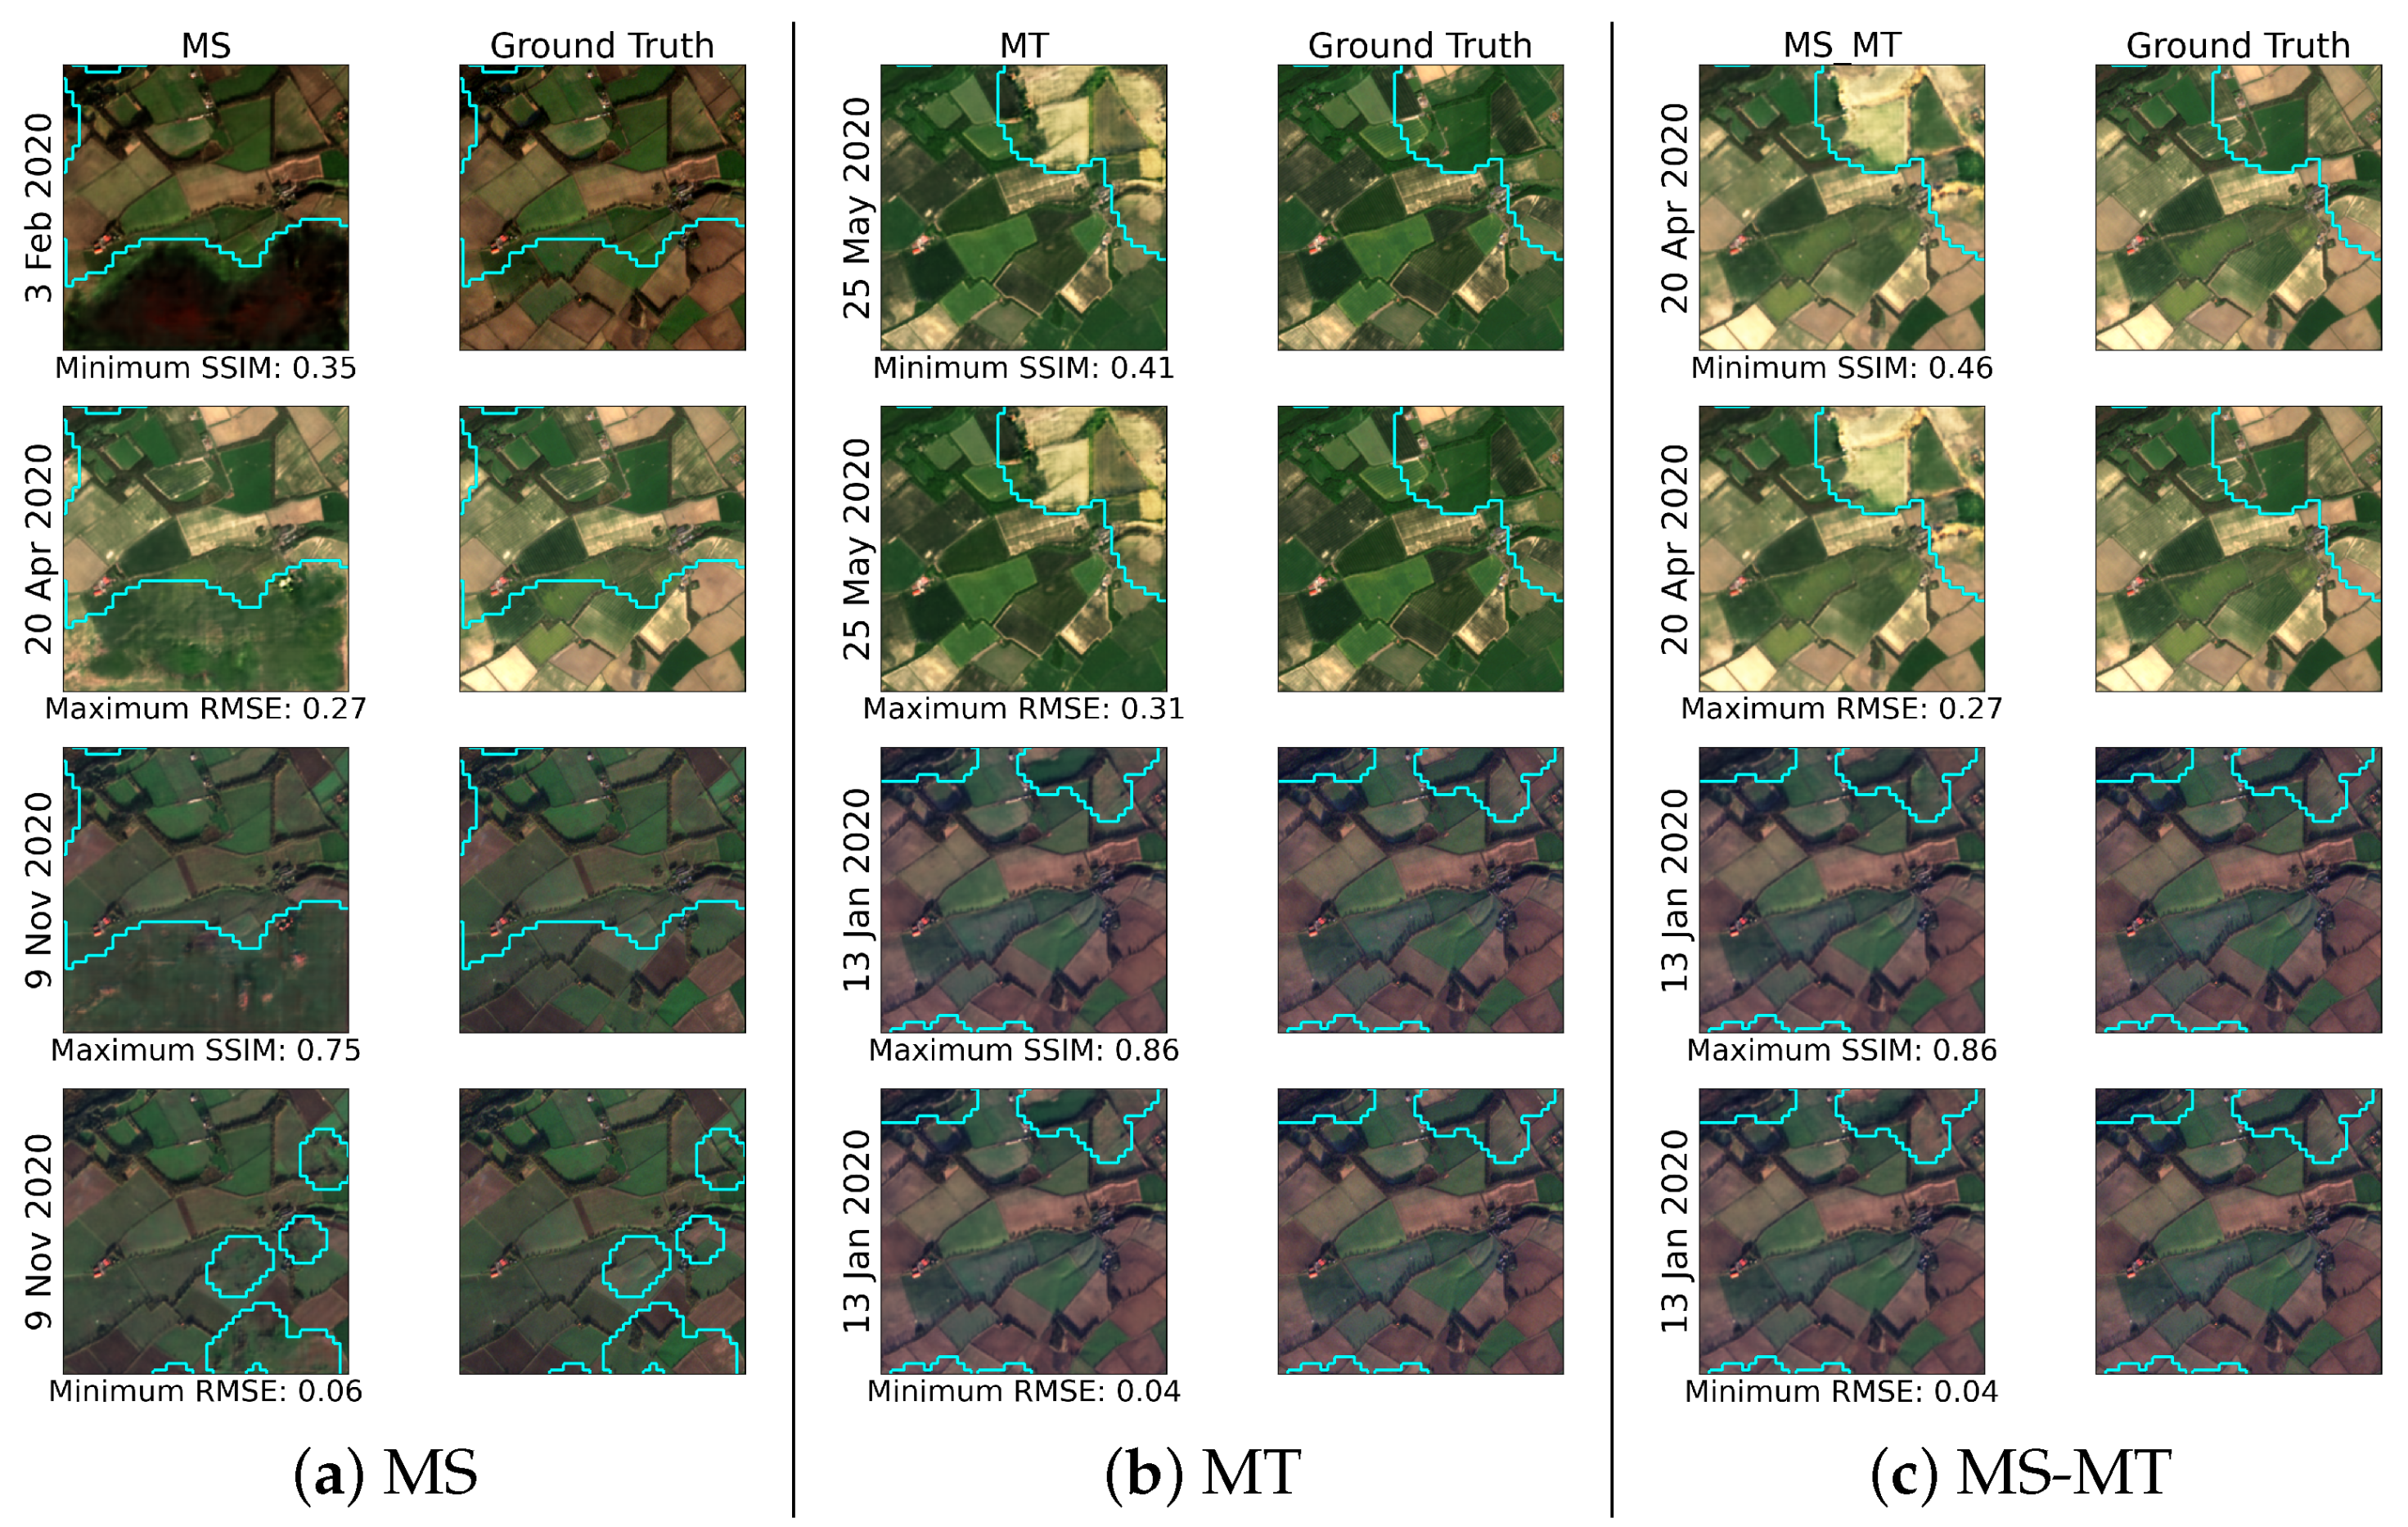
- Sentence in line 355 should read “The multi-temporal and multi-source (MS-MT) mode offers the highest performance of the three evaluated modes with an average SSIM greater than 0.87 and 0.64 for the whole image and inpainting regions, respectively.”
References
- Czerkawski, M.; Upadhyay, P.; Davison, C.; Werkmeister, A.; Cardona, J.; Atkinson, R.; Michie, C.; Andonovic, I.; Macdonald, M.; Tachtatzis, C. Deep Internal Learning for Inpainting of Cloud-Affected Regions in Satellite Imagery. Remote Sens. 2022, 14, 1342. [Google Scholar] [CrossRef]
- Module: Metrics. Available online: https://scikit-image.org/docs/dev/api/skimage.metrics.html#skimage.metrics.structural_similarity (accessed on 19 May 2022).

| Dataset | Direct Modes | Stacked Modes | ||||||
|---|---|---|---|---|---|---|---|---|
| Basic | MS-R | MT-R | MS | MT | MS-MT | |||
| Scotland | Whole | SSIM ↑ | 0.84 | 0.73 | 0.86 | 0.84 | 0.88 | 0.88 |
| RMSE ↓ | 0.09 | 0.13 | 0.08 | 0.08 | 0.07 | 0.07 | ||
| Inpainting | SSIM ↑ | 0.58 | 0.33 | 0.66 | 0.58 | 0.73 | 0.73 | |
| RMSE ↓ | 0.15 | 0.23 | 0.15 | 0.14 | 0.12 | 0.11 | ||
| India | Whole | SSIM ↑ | 0.84 | 0.74 | 0.84 | 0.84 | 0.87 | 0.87 |
| RMSE ↓ | 0.07 | 0.12 | 0.08 | 0.07 | 0.06 | 0.05 | ||
| Inpainting | SSIM ↑ | 0.53 | 0.32 | 0.57 | 0.53 | 0.64 | 0.66 | |
| RMSE ↓ | 0.13 | 0.21 | 0.15 | 0.12 | 0.11 | 0.09 | ||
Publisher’s Note: MDPI stays neutral with regard to jurisdictional claims in published maps and institutional affiliations. |
© 2022 by the authors. Licensee MDPI, Basel, Switzerland. This article is an open access article distributed under the terms and conditions of the Creative Commons Attribution (CC BY) license (https://creativecommons.org/licenses/by/4.0/).
Share and Cite
Czerkawski, M.; Upadhyay, P.; Davison, C.; Werkmeister, A.; Cardona, J.; Atkinson, R.; Michie, C.; Andonovic, I.; Macdonald, M.; Tachtatzis, C. Correction: Czerkawski et al. Deep Internal Learning for Inpainting of Cloud-Affected Regions in Satellite Imagery. Remote Sens. 2022, 14, 1342. Remote Sens. 2022, 14, 6324. https://doi.org/10.3390/rs14246324
Czerkawski M, Upadhyay P, Davison C, Werkmeister A, Cardona J, Atkinson R, Michie C, Andonovic I, Macdonald M, Tachtatzis C. Correction: Czerkawski et al. Deep Internal Learning for Inpainting of Cloud-Affected Regions in Satellite Imagery. Remote Sens. 2022, 14, 1342. Remote Sensing. 2022; 14(24):6324. https://doi.org/10.3390/rs14246324
Chicago/Turabian StyleCzerkawski, Mikolaj, Priti Upadhyay, Christopher Davison, Astrid Werkmeister, Javier Cardona, Robert Atkinson, Craig Michie, Ivan Andonovic, Malcolm Macdonald, and Christos Tachtatzis. 2022. "Correction: Czerkawski et al. Deep Internal Learning for Inpainting of Cloud-Affected Regions in Satellite Imagery. Remote Sens. 2022, 14, 1342" Remote Sensing 14, no. 24: 6324. https://doi.org/10.3390/rs14246324
APA StyleCzerkawski, M., Upadhyay, P., Davison, C., Werkmeister, A., Cardona, J., Atkinson, R., Michie, C., Andonovic, I., Macdonald, M., & Tachtatzis, C. (2022). Correction: Czerkawski et al. Deep Internal Learning for Inpainting of Cloud-Affected Regions in Satellite Imagery. Remote Sens. 2022, 14, 1342. Remote Sensing, 14(24), 6324. https://doi.org/10.3390/rs14246324