Abstract
Impact echo (IE) is a non-destructive evaluation method commonly used to detect subsurface delamination in reinforced concrete bridge decks. Existing analysis methods are based on frequency domain which can lead to inaccurate assessments of reinforced concrete bridge decks since they do not consider features of the IE signals in the time domain. The authors propose a new method for IE classification by combining features in the time and the frequency domains. The features used in this study included normalized peak values, energy, power, time of peaks, and signal lengths that were extracted from IE signals after they are preprocessed. We used a dataset containing IE data collected from four in-service bridges, annotated using chain dragging. A support vector machine (SVM) classifier was constructed using combined features to classify IE signals. A 1DCNN with unfiltered IE signals and a two-dimensional CNN using wavelet scalograms (2D representations of unfiltered IE signals) were also used to classify IE signals. The SVM model performed significantly better than the other models, with an accuracy rate, true positive rate, and true negative rate of 97%, 92%, and 98%, respectively. The SVM model also generated more accurate defect maps for all investigated bridges. IE data from the Federal Highway Administration’s InfoBridge website were used to investigate the efficacy of the developed models. The investigation yielded promising results for the proposed SVM model when used for a new set of IE data.
1. Introduction
Bridges and decks are some of the most important types of infrastructure, covering approximately four billion square meters across the United States, which is an area the size of Detroit, Michigan [1]; therefore, monitoring their health condition is critical for mitigating premature failures and expensive rehabilitation and repairs [2,3]. Traditional bridge health condition monitoring requires visual inspections and an inspector’s expertise, time, and skills [3]. Old bridges need more visual inspections because the likelihood of finding a defect increases over time. The non-destructive evaluation (NDE) approach is used for visual inspections because it can be used to obtain essential information about a bridge’s age, material, and defects without causing damage to the structure [4,5]. Impact echo is an NDT method adopted by many bridge stakeholders, such as the Federal Highway Administration (FHWA), to detect subsurface defects, including delamination, voids, and debonding [4,5,6]. Raw IE data consist of a time-series or signal representation vibration response of a medium due to a mechanical impact. It is common to use an IE signal frequency response, such as peak frequency, to interpret these defects. This method has been used to classify IE data collected through the Long-Term Bridge Performance Program (LTBP) from several bridges across the U.S. The LTBP data can be found on the FHWA InfoBridge website [6]. Researchers have created different condition ratings for an inspected bridge based on the peak frequency values [7]. Ohtsu et al. (2002) stated that obtaining the maximum frequency in the frequency domain is sometimes difficult because of technical problems, such as IE data application in a serviced structure [8]. Colla et al. (2003) stated that frequency sources could influence the quality of the IE data quality and measured frequencies in concrete structures because the wave is generated at the impact point. Some parameters for on-site and artificial structures were compared, including impact contact time, wave center, and maximum frequency. This study indicated that the IE signal’s measured frequency and maximum energy should be considered to obtain an optimized quality data interpretation [9]. Gucunski et al. (2015) used the frequency method and RABIT system to collect IE data to detect delamination features. The results of the frequency approach revealed a dominant peak frequency of approximately 11 kHz for the solid or sound areas; however, shallow delamination areas had a dominant peak frequency of approximately 1.5 kHz [10]. Zhang et al. (2016) mentioned that frequency analysis results could not precisely detect defect size or location; therefore, machine learning techniques and wavelet decomposition were introduced to conduct a new, comprehensive analysis for detecting IE signal patterns [11]. Hajin et al. (2018) used the frequency–wave number (f–k) domain to obtain frequencies associated with the deck’s thickness using an air-coupled impact-echo device. The results indicated that using the f–k domain analysis decreased the direct acoustic noise, which allowed researchers to detect the thickness mode frequency more accurately [12]. Liu et al. (2019) used an impact-echo device to detect defects in grouted lapping connections. The results indicated that the IE device could detect defects present in grouted lap-splice connections well; however, using the frequency approach as an estimation process could be affected by grouting depth [13]. Results from previous research have determined that IE devices are not reliable enough to evaluate concrete structure conditions because the frequency approach used to interpret IE signals cannot distinguish IE signal patterns in different surface conditions [14,15]. Sengupta et al. (2021) used IE signal characteristics to predict the condition rates (CRs) of 72 bridges to classify them into three categories based on the frequency approach: good, fair, and poor. Raw impact-echo data from the LTBP website were used as input data to create predictive SVM models. The CR values were predicted with an accuracy rate of 87.5%, based on IE-signal signatures [16]. More advanced techniques have been used recently to interpret IE signals, including the support vector machine (SVM), artificial neural networks (ANN), and deep learning. A mobile robot equipped with an impact-echo non-destructive evaluation (NDE) device was used to collect data for research conducted by Li et al. (2014). The fast Fourier transform of the impact-echo signals and SVM were employed to analyze bridge structure data [17]. Epp et al. (2018) used a semi-automated air-coupled impact-echo method and artificial neural network (ANN) to detect defect positions using IE signals gathered from reinforced concrete beams. The results of this study indicated that using ANN and a least-square distance approach led to fewer errors in the classification approach [18].
Deep learning architecture has revolutionized bridge evaluation. Models developed with deep learning are trained on large datasets and can identify bridge defects with a considerably higher accuracy rate than conventional methods [18]; however, they require large, annotated datasets for model training. Dorafshan et al. (2020a and b) developed convolutional neural networks (CNN) to classify IE data for the first time using IE data collected from laboratory-made concrete bridge decks with artificial defects. The results of this research indicated that the one-dimensional convolutional neural network (1DCNN) approach had the highest accuracy rates compared to the conventional peak frequency method [2]. The 1DCNN in references [2,3] was directly trained and tested with IE data in the time domain; therefore, it can be concluded that there are features in IE signals that can be leveraged for interpretation, which have been somewhat neglected in the past since the majority of the research efforts have only focused on IE features in the frequency domain. Developing a more comprehensive approach for interpreting IE signals in the time and frequency domains could lead to developing more robust classification models. A typical IE signal could have hundreds or thousands of null or zero values due to the data acquisition system’s type and sampling rate, which can interfere with proper IE signal feature selection, leading to inaccuracies in the developed models based on the features. The authors have developed a preprocessing approach to remove the null values from IE signals to mitigate this issue, called a filtering approach. The filtering approach was used to detect IE signal features necessary for classification on a set IE signal collected from the laboratory-created specimens. Using the filtering approach decreased the amount of time required for the analysis and improved the accuracy rate of the tested models [19]. Wavelet transforms also can be used to interpret IE signals, improving the results of the frequency approach [19]. Defect detection was more accurate when IE signal features were captured in the time and the frequency domains using wavelet transform [19,20,21,22]; however, the wavelet transforms and frequency approach were not compared to other classification approaches, such as deep learning, in previous studies [23,24,25]. The wavelet transformation was also used to generate two-dimensional representations of the IE signals to capture both time and frequency characteristics. A deep learning image classifier was trained and tested on the two-dimensional data. A 1DCNN trained only on time domain characteristics was tested for this study. The performance of the developed models was also evaluated using the IE data of a bridge deck available on InfoBridge. Combining signal processing with other health monitoring devices, such as UAVs, to monitor structure health has been the subject of much current research [26,27,28,29]. Fascista et al. reviewed UAV applications and assisted structural health monitoring to monitor bridge health conditions [26] and address using drones for infrastructure inspection. Ichi et al. [29] presented an annotated NDE dataset for subsurface structural defect detection in concrete bridge decks. The authors addressed knowledge deficits related to benchmarking and developed advanced deep learning models for concrete bridge evaluations by presenting an annotated and validated NDE dataset. The dataset containing GPR, impact echo, and thermal images was collected by applying UAS from five bridges; therefore, it is one of the most important datasets related to bridge inspections. In the following, we listed the more notable previous studies. The most notable previous research is listed in Table 1.

Table 1.
Methodology and analysis of impact-echo devices in previous research.
The results from the previous studies on laboratory concrete decks indicate that analyzing IE signals based on time domain features can improve previous classification methods [26]. Numerical and experimental methods are used to classify IE data; however, their performance was not tested against a validated ground truth. Filtered IE signal features in the time domain, with and without subsurface defects, were extracted to develop a novel classification model using an SVM in this study. The features were selected from an annotated and validated IE dataset: SDNET 2021 [29]. The wavelet transformation was also used to generate two-dimensional representations of the IE signals to capture both time and frequency characteristics. A deep learning image classifier was trained and tested on the two-dimensional data. A 1DCNN trained only on time domain characteristics was trained and tested for this study. The performance of the developed models was also evaluated using the IE data from a bridge deck available on InfoBridge. The main contributions of this paper are:
- Development of classification models based on realistic IE data;
- Feature extraction using both the time and frequency characteristics of IE data;
- Benchmarking different types of IE classification models;
- Evaluation of the sensor-agnostic properties of the developed IE classification models using InfoBridge data.
2. Materials and Methods
2.1. Impact Echo
The impact-echo (IE) device is a non-destructive instrument that consists of four components: a mechanical spherical impactor to produce waves, a displacement transducer near the impact dot, a sensor located near the IE device to save the wave response, and a monitor that displays waves in two formats [2,3]. Impact echo is used to determine a defect’s depth or structure’s thickness. Frequency analyses were used to evaluate structure conditions by categorizing IE data into two main datasets: defect and sound. Equation (1) was used to calculate the deck’s thickness (t) and defect depth [23].
where (), (), (t), and () represent the velocity of the waves in concrete thickness, associated frequency, deck thickness, and correction factor, respectively [2,3]. The () values were compared in two datasets, defect and sound, to classify the IE data. The IE signals were collected from a defect area when the signals’ frequency response had a single distinguished peak higher or lower than the thickness frequency, low-frequency responses of the flexural mode, or two distinct peaks [2]; however, IE signals collected from sound areas exhibited a detectable peak in the frequency response near the thickness frequency [2,3].
2.2. Ground Truth
Five bridge decks were studied to identify the location of subsurface delamination and sizes using a chain-dragging device. The first 75 mm of each bridge’s deck was removed before using the chain-dragging device, and then the delaminated areas were identified. Chain dragging was used to further identify possible deeper delamination areas, which were classified as deeper delamination in SDNET 2021. Deeper delamination and delamination were classified as defect areas (class 2). The areas without delamination were classified as sound areas (class 1). The GPS coordinates, areas of delamination (removal area), and sound areas were also identified in the ground truth map (Figure 1). This ground truth map was used before starting repairs, indicating the locations of the sound surface (no delamination) and delamination [29].
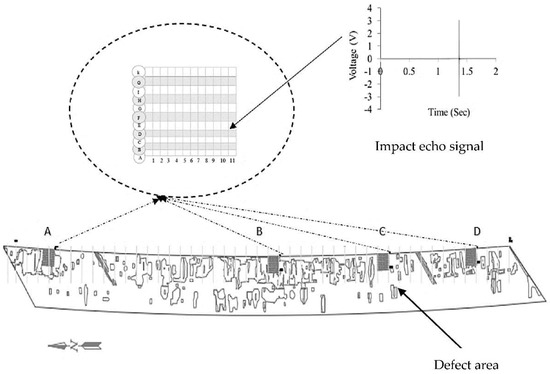
Figure 1.
Impact echo collection grid for one of the investigated bridges.
2.3. Impact-Echo Dataset and Classification
IE signals were collected from four service bridges in Grand Forks, North Dakota. Three or four regions (A, B, C, and D) on each of the five bridges were chosen to collect IE data [29]. Each area was divided using a gridline, from A to K and 1 to 11, with IE performed at each grid point. The spacing between points was set at 0.030 meters by 0.030 meters. Figure 1 depicts bridge regions, gridlines, and cross-sections of the FOREST RIVER southbound (FRSB) bridge in North Dakota. The decks were inspected using the chain-dragging method and then repaired by hacking the regions susceptible to delamination. A map of delimitation (ground truth) was produced for each bridge deck (Figure 1). The IE data collected from the inspected areas were annotated in accordance with the type of delamination observed in the ground truth map from the SDNET dataset 2021. Access to validated ground truth can enhance an AI model’s performance.
Table 2 lists the names of the bridges, the year the bridge was built, length, width, overlay thickness, and traffic direction. The bridge dimensions establish that the IE signals were collected from a large surface area, demonstrating that the IE signals in this study were generalized and diverse compared to previous research [24]. A balanced dataset can be crucial for developing robust machine learning and artificial neural networks [30,31,32,33,34,35]. We used four training models based on IE signals in two classes. Table 2 also lists the IE data from each bridge used for dataset training and testing. SDNET2021 contains 1573 IE signals from four bridges in total. Under sampling is an approach used to create a balanced dataset by maintaining all of the data in the smaller class and reducing the size of the data in the larger class [30,31,32,33,34,35]. A balanced training set was created using an under-sampling strategy in this study. A total of 842 IE signals, 421 collected from defect and 421 collected from sound areas, were selected randomly to create training datasets. The remaining IE signals were used to test all trained models. Table 2 also lists the number of IE signals in each class for the test and train sets. We calculated the percentage of sound and defect areas for all bridges based on the chain-dragging results, summarized in Table 2. We divided the data to ensure that we had enough IE signals in the test set to evaluate all AI models. “D” and “S” represent the defect and sound groups in Table 2.

Table 2.
Bridge list and IE classification for the AI models.
2.4. Analytical Approaches
2.4.1. Feature Selection and Filtering Approach
The authors produced a set of filtered IE signals based on the distinguishable peaks of the raw IE signals [26]. Figure 2 depicts the filtering process on a typical IE signal. A frequency analysis was used to interpret the IE signals; however, the absolute and local peak signal values in the time domain could also be employed to classify the data [28]. The mathematical algorithm used to detect distinguishable IE signal peaks is illustrated in Figure 2a. The first and last points, less than 0.1 of the absolute maximum points, would lead to removing the left and right signal sections. (star point, Figure 2b). On average, the summation from removing normalized points is approximately zero, which does not impact data classification. The authors of [28] provided more details on the filtering approach. A threshold of 0.1 was defined as the index of trivial point removal. Feature extraction methods may consider the lengths and locations of these points as important features for classification, which would yield inaccurate classification.

Figure 2.
The filtering approach processes: (a) IE signals with absolute peak points, (b) filtered IE signals, and (c) filtered IE signals with segments.
We used the filtering approach to remove trivial points from a random set of IE signals to validate this claim. The filtered signals were compared to the raw IE signals, revealing that the frequency responses of the filtered and raw IE signals were approximately the same. The filtered signals were then segmented into five equal parts (Figure 2c). The time interval of the IE signals (start time (ST) and end time (ET)), normalized peak values obtained by dividing the local peak to the maximum peak, and filtered IE signal lengths for each part were chosen as the main features of the IE signals (Figure 2). These features contributed substantially to IE classification in the authors’ previous work [28]. The goal of using feature extraction is to obtain the most compacted and informative set of features (detectable patterns) to improve the classifier’s efficiency [28]. This efficiency included decreasing computational complexity or increasing accuracy rate. Classifying IE signals with 200,000 points in a dataset with 2000 signals requires more processing time than classifying IE signals using only 25 features per IE signal. The points with values near zero cannot help the classification approach separate IE signals collected from sound and defect areas; therefore, these trivial points were removed from the signals using this filtering approach before AI model processing began. The absolute values for all points were extracted for each signal after applying the filtering approach to all IE signals. The most important IE signal features, such as maximum peak point, average, FFT, power, and energy, were extracted for all filtered IE signals. Figure 3 depicts the absolute point values for the filtered IE signals.

Figure 3.
IE signal features: (a) raw IE signals and (b) normalized IE signals.
P1, P2, P3, P4, and P5 are the peak values for the IE signals in each segment (Figure 3). T1 and T2 are the start and end times of the impact-echo signals, respectively. The impact-echo signals contained distinguishable peak points because they were cut at different times; therefore, the signal length, end times, and start times were not constant. Power and energy, two important IE signal features (continuous-time complex signal x(t)), were extracted from all IE signals using Equations (2) and (3) [2,3].
2.4.2. Support Vector Machine
The support vector machine (SVM) uses a variety of supervised learning approaches, such as classification, regression, and outlier recognition, to classify IE signals [25]. The primary goal of using an SVM is to determine the best hyperplanes that result in separating the positive (+1) from the negative (+0) values in the training set with the largest possible margin; therefore, a set of input variables (xi, xi + 1, …, xn) are associated with its labels (Y(i) ∈+1 (defect) or 0 (sound)). The dataset is usually divided into two parts: training and testing. The training set is used to build predictive models, while the test data are used to check the model’s performance. The dataset was extracted from the IE dataset X (IE signals), and the class label was obtained from two sets ((0) and (1)). Five features, ET, ST, truncated signal length, signal energy, and IE signal power, were the input layers used for classification [35]. Figure 4 depicts the proposed input and the expected output of the proposed classification model.
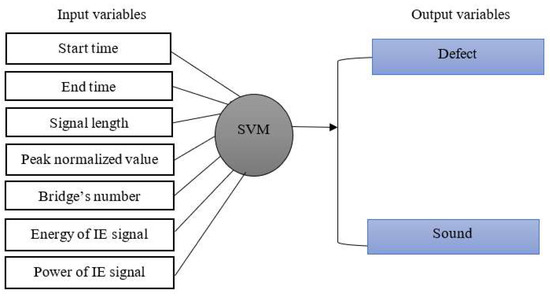
Figure 4.
SVM architecture.
2.4.3. 1D Convolutional Neural Networks 1DCNN (1DCNN)
Figure 5 illustrates the architecture of a one-dimensional conventional network successfully developed and implemented to detect delamination in laboratory-created concrete bridge deck specimens [3]. The CBR layers in this figure consisted of three convolution layers, batch normalization, and a rectified linear unit (ReLU). Two max pooling (MP) layers were used in this net to connect the CBR layers. FRD, which is a combination of three fully connected layers, ReLU, drop out, [3] and a SoftMax layer, was also implemented before the output layers to summarize the probability of each class. This figure also indicates the number and kernel size of each layer. The input layer was a one-dimensional matrix (1 × 2,000,000). The value of the IE signals with labels, defect or sound, was moved to the next layers. Batch normalization and the rectified linear unit (ReLU) were also used in the 1DCNN net, which could help increase the training process speed and normalize the active map. The maximum epochs, batch size, and optimization function were 40, 50, and the Adam algorithm, respectively. The detail’s net was the same as in the previous research [2,3].
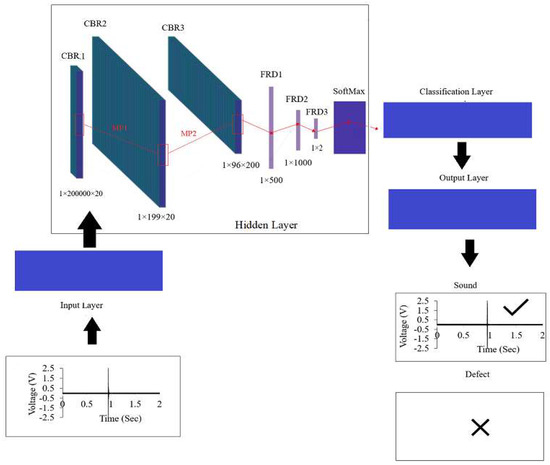
Figure 5.
Architecture of the adapted 1DCNN.
2.4.4. Conventional Neural Network
AlexNet is a well-known deep CNN trained on ImageNet, which won the ImageNet competition in 2012 in terms of accuracy rate and speed [3]. A deep learning-based CNN is essentially a classifier where the features used for classification are obtained through training and backpropagation. The adapted CNN model can be trained in different ways. We used CNN with 25 layers (FL), CNN (TL), and CNN (CL) (Figure 6). The maximum epochs, batch size, and optimization function were 10, 50, and the Adam algorithm, respectively. The detail’s net was the same as in the previous research [2,3]. A trained CNN was used to classify a different dataset with deep domain adaption and a classifier (CL). Only the last fully connected layer was required for updating the CL model to match this layer to the target labels, both sound and defect. The model should be retrained as a pretrained network for transfer learning (TL) and have the layers, classifiers, and weights changed in agreement with a new dataset in the transfer learning model, or TL model. All IE signals were transferred to an image using a wavelet. Figure 7 illustrates the spectrum generated by a continuous wavelet (CW) on the IE signals to create the image dataset. The wavelet transform is based on the shape of a series of sinus and cosine functions in the Fourier transform. A scalogram was generated for each IE signal using a set of Morlet wavelet functions. The Y scale and widths were selected empirically and in accordance with earlier research [36,37]. The logarithm scales and [1,2,3,4,5,6,7,8,9,10,11,12,13,14,15,16,17,18,19,20,21,22,23,24,25,26,27,28,29,30,31] were chosen for the Y scale and width bands, respectively. Finally, the scalogram’s outcomes revealed the location of the peak points for all IE signals collected from the defect and sound areas. Dash lines in the wavelet scalogram can be used as visually noticeable features that can be leveraged for IE classification.
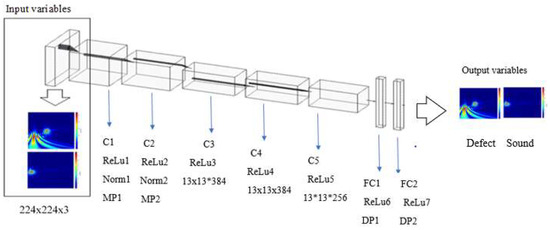
Figure 6.
CNN architecture with input and output variables.
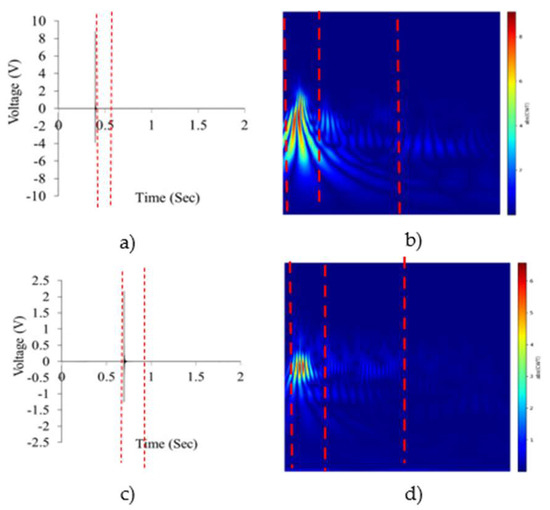
Figure 7.
(a) IE signals with defect labels, (b) scalogram for IE with defect labels, (c) IE signals with sound labels, and (d) scalogram for IE signals with sound labels.
2.4.5. Model Evaluation
The authors used the true positive rate (TPR), true negative rate (TNR), and accuracy rate (ACC) to evaluate classifier performances. IE signals collected from defect areas were classified as true positive (TP) if correctly labeled as defected. The defect IE signals were classified as false negative (FN) if they were mislabeled as sound. Sound IE signals were classified as true negative (TN) if they were labeled correctly as sound and classified as false positive (FP) if the model mislabeled sound as defect. The performance metrics were evaluated using Equations (4)–(6) [2,3,38]:
2.4.6. Workstation
We used a desktop computer to create all deep learning models. This system has a 64-bit operating system, 24 GB memory, Intel® CoreTM i7 CPU, and 15.8 GPU. MATLAB 2021 and python were used to generate models and feature selection algorithms, respectively. We changed the hyperparameters empirically to optimize the predicted processes.
3. Results
3.1. Training
The accuracy rates of CNN with 25 layers (FL), CNN (TL), CNN (CL), and SVM-based feature selection were 85%, 95%, 93%, and 99%, respectively. The 1DCNN model required 172,800 s to finish the training process; however, CNN (TL) and CNN (CL) required 779 and 785 s to finish both training processes and create image scalograms, respectively. The SVM completed the training process and feature selection in 328 s with an accuracy rate higher than 99%, demonstrating that it was faster than 1DCNN and 2D CNN because this model was only trained on the predetermined features in the IE signals. The 1DCNN model must be trained on all IE signal points, which were significantly slower than other methods.
3.2. Model Complexity:
Several factors, such as model size, data size, and model framework, can directly affect a model’s complexity, which we discuss here [39]:
- -
- Model framework: Choosing the model framework can affect model complexity, as stated in previous studies. Overall, deep learning algorithms are far more complex than machine learning models; therefore, choosing the SVM based on IE signal features leads to decreased model complexity compared to 1DCNN and 2DCNN [40].
- -
- Model size: Artificial intelligence model size directly affects model complexity. The number of layers, layer diversity, and number of filters directly affect the model’s complexity. The type of layers, and kernel size were more complex in 1DCNN and 2DCNN than in simple SVM approaches with simple RBF layers (Figure 4 and Figure 5). Using RBF kernels leads to a faster, simpler, and more scalable model [40], which is why we selected it for this paper. The SVM, AlexNet, and 1DCNN used 0, 25, and 7 layers. The diversity of the AlexNet layers was higher than the 1DCNN and SVM without layers (Figure 4 and Figure 5). In addition, we used a higher number of layers and kernel filter size for AlexNet than 1DCNN; therefore, the model complexity decreased when using the SVM based on feature selection and 1DCNN compared to 2DCNN in terms of model size.
- -
- Data complexity: 1DCNN worked directly on IE signals; however, the IE signals were converted to 2D images for AlexNet using the wavelet as transformations. RGB images with a size of 227 × 227 × 3 were selected as the input size for AlexNet. As mentioned in the training section, the preprocessing algorithms were also used to select IE signals for preparing SVM inputs; however, the IE signals were used for 1DCNN without a preprocessing approach, indicating that we should not spend time preparing inputs for 1DCNN models. The total time for training the SVM model and extracting features was lower compared to the training process in 1DCNN. In addition, 2DCNN, in the case of wavelet transformation, used less time than 1DCNN in similar conditions. In contrast, 2DCNN used more total time than the SVM-based feature selection approach; however, the input size of the models was decreased in the SVM based on feature selection compared to 1DCNN and 2DCNN. The input size was 2.95 GB, 153 MB, and 60 KB for 1DCNN, AlexNet, and SVM, respectively. We selected only 25 features per signal as an input instead of selecting IE signals with 200,000 points (1DCNN) or 2D images; therefore, the input size of the IE dataset was also reduced, which can decrease the model complexity. The SVM-based feature selection had less model complexity compared to other approaches.
3.3. Testing
The results of testing the 1DCNN, CNN (TL), CNN (CL), and SVM were used to predict the IE signal labels, illustrated in Figure 8a through 8d, respectively. The results indicated that the proposed SVM based on feature selection had the maximum TPR, TNR, and accuracy rates and provided the most consistency in classification among different bridges. The CNN (TL) performed better than 1DCNN. The CNN models were trained based on time and frequency features extracted from a scalogram; therefore, they benefited from the wavelet transform for predictions. The CNN (CL) did not perform well and had the highest false negative (defect) detections, which was expected since the CNN (CL) demonstrated poor performance in previous studies [2,3] compared to the 1DCNN and CNN (TL).
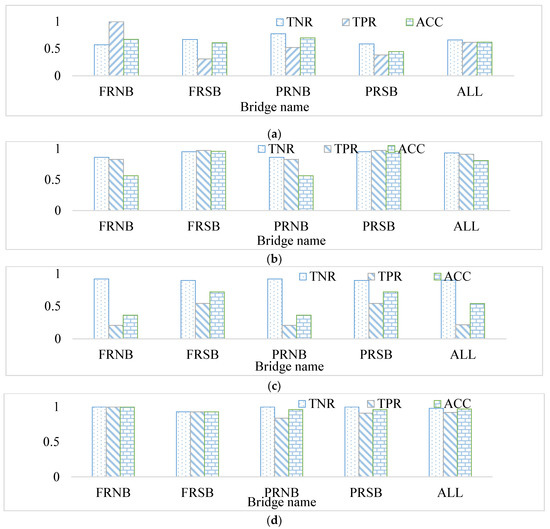
Figure 8.
Performance metrics results for: (a) 1DCNN, (b) CNN (TL), (c) CNN (CL), and (d) SVM-based feature selection.
The model outcomes indicate that the performance metrics had the highest values based on SVM feature selection. The TNR, TPR, and ACC values for this model were 98%, 92%, and 97% for all bridges, respectively. The TPR, TNR, and ACC values for the CNN (TL) were 91%, 82%, and 87%, respectively. The 1DCNN model performed poorly compared to the two other models (SVM-based feature selection and CNN (TL)), indicating that the network was not properly trained because of the trivial points in the IE signals. The IE signals contained 200,000 points; however, the filtering approach indicated that only 1000 IE signal points had considerable value peaks. The value of the remaining points was close to zero; therefore, the points were considered trivial. The model performance was improved by eliminating these points through feature selection or scalogram creation. Table 3 lists all performance metrics’ average, minimum, maximum, and covariance values.

Table 3.
Performance metrics results.
The results of the performance metrics indicate that the SVM-based feature selection model was the most effective for detecting defect areas on all bridges. The results of previous studies revealed that classifying IE signals in bridges with overlays may be more difficult than classifying IE signals in bridges without overlays [3,4,5,6,7,8,9,10,11,12,13,14,15,16,17,18,19,20,21,22,23,24,25,26,27,28,29,30,31,32,33,34,35,36,37]. Previous research has established that changing the aggregate, moisture, and air voids could influence the frequency approach results for IE classification [40,41].
We detected defect areas by collecting IE signals from various bridges in this study. The results indicate that the proposed SVM model was a successful classifier for IE signals collected from different bridge decks with overlays, which is a more challenging task than IE classification in laboratory-made specimens [2,3] primarily because the aggregate, defect types, overlay thickness, and construction years (age) were constant in most laboratory scale investigations but were not constant in the bridges investigated in this study. The accuracy rate, TPR, and TNR increased by 12%, 10%, and 5%, respectively, using SVM-based feature selection and corrected labeling in a balanced dataset compared to the 1DCNN. The SVM-based feature selection model’s robustness was confirmed by the low coefficient of variation (COV) values ranging from 0.02 to 0.05 (Table 3). We have attempted to compare the proposed SVM-based feature selection with other common models to understand the model’s performance. The accuracy rate of 0.95 was very high on average, indicating that even the model with material diversity and a small number of IE signals in the training set can identify defect points with a high accuracy rate compared to other approaches. Previous studies have suggested using wavelet without a deep learning approach [41]; however, we compared deep learning and wavelet to other AI models in this study, which had not yet been discussed in previous studies. The results revealed that wavelet-based scalograms could be used as a proper classifier to detect delaminations with acceptable accuracy. The model’s accuracy was increased by 15%, indicating that the IE signals using the wavelet transform and corrected labeling in a balanced training dataset could help increase the accuracy rate. In general, all artificial intelligent models developed in this study were improved in accuracy as the training dataset’s size was increased.
3.4. Defect Maps
Defects maps were generated for two regions of the Park River South Band bridge to better visualize the results of the IE models investigated in this study. The region with Origin B was selected since it was predominantly defected concrete, as depicted in Figure 9, and the region with Origin A was chosen since it represented a mostly sound concrete, as illustrated in Figure 10. These two origins are also displayed in Figure 1. Ground truth, frequency approach, 1DCNN, CNN (TL), CNN (CL), and SVM were used to generate the defect maps in region B, as illustrated in Figure 9a–f, respectively. Similarly, the results are depicted in the same order for region A in Figure 10a through 10f. The defect maps were generated based on output models.
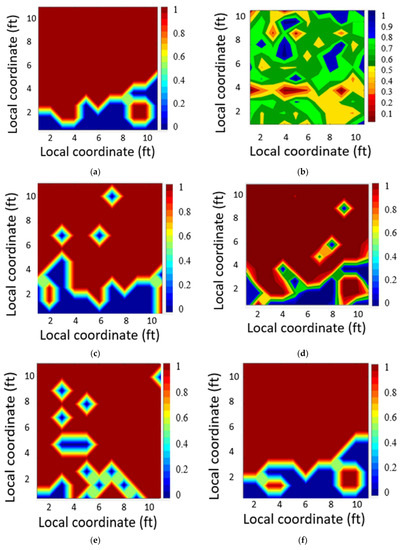
Figure 9.
Defect map for PRSB (Origin B): (a) ground truth, (b) frequency approach (normalized value), (c) 1DCNN, (d) CNN (TL), (e) CNN (CL), and (f) SVM-based feature selection.
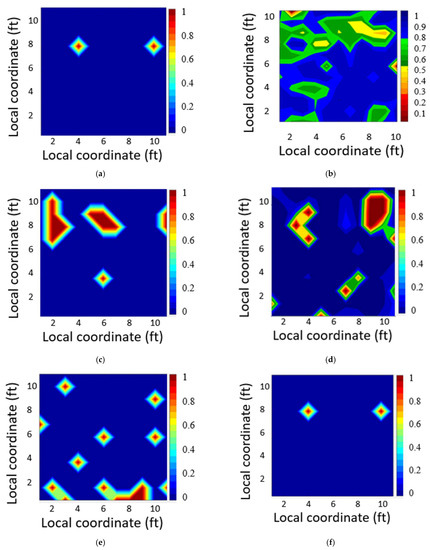
Figure 10.
Park River SB—Origin A: (a) ground truth, (b) frequency approach (normalized value), (c) 1DCNN, (d) CNN (TL), (e) CNN (CL), and (f) SVM-based feature selection.
The linear color contour of the MATLAB code depicts the presence of defects at a coordinate system relative to each IE signal. The contours for the ground truth and SVM are composed of two colors: red for defect and blue for sound (Figure 9a and Figure 10a). IE signals as predicted as defects are labeled 1; however, IE signals predicted as sound areas are labeled (0). The linear contour of the SVM heat map represents the probability of defects for all coordinates on the map (Figure 9f and Figure 10f). The contours represent the normalized peak frequency values in the defect maps generated using the normalized peak frequency, or the peak frequency value for each coordinate divided by the maximum peak frequency values on the defect map (Figure 9b and Figure 10b). The IE signals with normalized peak frequency values between 0.75 to 1 were classified as sound areas according to previous studies [2,3]; however, the probability of having defected area increased if the IE signals had normalized peak frequency values beyond [0.75–1].The contours of the maps generated using the CNN (TL), CNN (CL), and 1DCNN represent the probability of a defect presence extracted from the softmax layer in each model (Figure 9c–e, and Figure 10c–e). The results indicated that inspectors using the frequency approach could not detect all defective areas, particularly at the bridge borders. A careful inspection of the produced maps also revealed that the SVM-based feature selection could detect defect points with higher accuracy than the other approaches. The CNN (TL) detected the defected areas with higher accuracy than the two other approaches.
Figure 10 illustrates that the frequency approach incorrectly detected defect regions when classifying IE signals from the boundaries, while deep learning and SVM models produced more accurate defect maps. Comparing the defect maps in both origins indicated that the proposed SVM model was more successful in classifying the IE data. The results of the SVM analysis revealed that filtered IE signal features could be used to detect up to 97% of the defect points. The SVM-based feature selection and CNN (TL) had the potential to aid with identifying defect areas more precisely than other investigated models based on the defect map results and performance metrics. There was indeed some miss-detection of the defect areas in the 1DCNN, 2DCNN, and frequency approaches in some coordinates (Figure 9 and Figure 10). The accuracy rate for the 1DCNN and 2DCNN was lower than the SVM-based feature selection; however, the results are still reasonable compared to previous studies [2,3], which indicates that we do not need to retrain the 1DCNN and 2DCNN. The accuracy rate for the 2DCNN and SVM-based feature selection was higher than 80%, establishing that the models can predict defect and sound areas better than models from previous studies [2,3].
4. Discussion
The IE data from Route 1 NB over the Dyke Branch Rd bridge with structure number (1912N083) were used to test the developed models. The slab heights, widths, and thicknesses were 73 m, 20 m, and 0.2 m, respectively. A total of 4700 IE signals were collected from this bridge in two traffic lanes. The classification of the IE signals in InfoBridge is based on the common frequency approach. We used IE data collected from Route 1 NB over the Dyke Branch Rd bridge as a test set to determine if the results of the AI classification models were close to the frequency approach. We used a test dataset containing 2350 IE points to create a defect map for the lower lane depicted in Figure 11. A frequency approach method was used to classify IE data into four groups based on peak frequency value: good, fair, poor, and serious. The IE signals in the frequency domain, which had a detectable peak within the thickness resonance of 8 to 12 kHz, were classified as ‘good’. The thickness resonances of the detectable peak points for IE signals collected from fair, poor, and serious groups beyond this range were classified as defect areas. Figure 12a displays the defect map of this bridge after the IE data were classified based on their peak frequency values. The fair, poor, and serious groups were classified as defects, and IE signals in the ’good’ class were classified as sound to generate a binary defect map in accordance with the classification mentioned above. The defect area locations are denoted with red, while sound regions are depicted as blue in Figure 11.
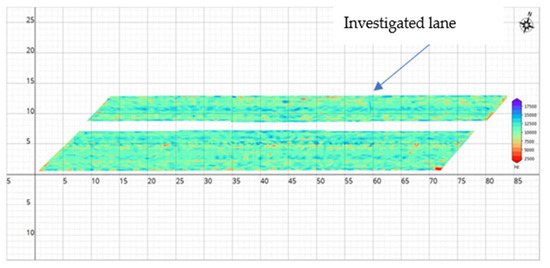
Figure 11.
Defect map for 1_ Route 133 EB over the Rocky Brook bridge on the InfoBridge website [4].
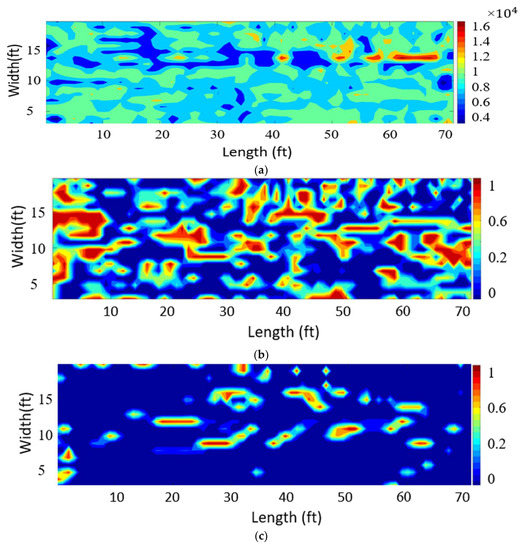
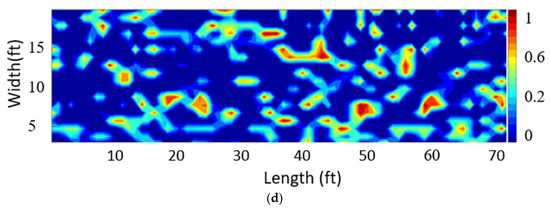
Figure 12.
Defect map for 1 Route 133 EB over the Rocky Brook bridge: (a) frequency approach, (b) CNN (TL), (c) CNN (CL), and (d) SVM-based feature selection.
The IE data for the EB Rocky Brook bridge were different than the IE data in SDNET 2021 (1 × 200,000); however, all developed models, except for the 1DCNN, could be used directly on the new IE dataset. A defective map of the 1DCNN was not generated in this section. Figure 12a–d display the Rocky Brook bridge defect map generated by the CNN (CL), CNN (TL), and SVM. The defect map reveals that the CNN (CL) classified defect areas as sound areas. The TNR of the CNN (CL) in the SDNET data also indicates that this model could not detect defect areas completely in the SDNET dataset (Figure 8c). The CNN (TL) was more conservative than other approaches, with more defect detection in the prediction process. The SVM-based feature selection had a higher accuracy rate with the least amount of false detection in both testing datasets, indicating this method’s potential for sensor-agonistic IE classification.
The results yielded less impressive performance metrics in all models when no IE data from the testing dataset were used to train the models. Changing the impact-echo device, materials, overlay thickness, aggregates, inspectors, and classifications have potential impacts on the performance metrics in all AI models. The results indicate that the SVM-based feature selection had a higher accuracy rate with the least amount of false detection in the new dataset. Previous research has indicated that AI models with more data in the training set can detect defect areas in bridges with greater accuracy [2,3]. The current study’s findings using the SDNET2020 and InfoBridge data indicated that more data with ground truth in the training set are required from different bridges, impact-echo devices, and subsurface defect types to create the generalized models. Having a generalized dataset allows us to create more accurate AI models. Using chain dragging to classify IE signals can give IE device users a better understanding of IE signals, defected areas, and the physics of the data. It is recommended to use chain dragging to identify the location of subsurface delamination by applying a chain-dragging device before using an IE device on the bridge’s surface to create a large IE dataset.
5. Conclusions
We have developed four artificial intelligence (AI) models and compared their performance for labeling impact-echo data corresponding to subsurface delamination in real reinforced concrete bridge decks. The IE dataset was validated using a non-destructive evaluation dataset, which in turn was validated using a dataset from destructive evaluations. A one-dimensional conventional neural network (1DCNN) and CNN (convolutional neural network) were applied to one-dimensional IE signals and their wavelet scalograms, respectively. A prefiltering process was also applied to IE data in the time domain. A set of features was extracted from the processed IE data, which was then used to create a support vector machine (SVM) model. The performance of these models was tested using the annotated IE dataset. Model performance was compared when classifying new IE data collected using a different device available on the FHWA’s InfoBridge website. The most notable findings of this study were:
- The proposed SVM model classified all defect and sound areas with the lowest number of false positives and false negatives compared to other approaches. The SVM model achieved TPR, TNR, and accuracy rates of 93%, 97%, and 1, respectively. The results suggested the feasibility of using feature selection-fusion SVM for IE signal classification; however, feature-selection SVM should be used for different datasets because this model became more accurate as its training datasets increased in size.
- The SVM model and its features are recommended for field adaptation due to its noticeably faster training time. The proposed model only required 328 s to predict labels, including the training time, while the 1DCNN required 172,800 s to finish the training process. The CNN (TL) and CNN (CL) required 779 and 785 s to complete the training process, respectively. Additionally, the SVM-based feature selection has less model complexity compared to other models.
- We recommend using feature selection with other deep learning models while increasing the training set size. The CNN (TL) based on IE wavelet scalograms could also be used and compared to the SVM-based feature selection. This model correctly predicted 70% of the defect areas and 84% of the sound areas on average in the SDNET dataset.
- The CNN with wavelet and SVM-based feature selection could be used as a predictive model to obtain defect maps for IE signals from the InfoBridge website because these predictive models are not limited to the size of the IE signals, thus demonstrating the advantage of using these models over the 1DCNN. The results indicate that using AI models can help the IE user classify data more accurately. The SVM-based feature selection results were closer to the InfoBridge defect map.
Author Contributions
Conceptualization, F.J. and S.D.; methodology, F.J. and S.D.; validation, F.J.; formal analysis, F.J.; investigation, F.J. and S.D.; resources, S.D.; data curation, S.D.; writing—original draft preparation, F.J.; writing—review and editing, F.J. and S.D.; visualization, F.J. and S.D.; supervision, S.D.; project administration, S.D.; funding acquisition, S.D. All authors have read and agreed to the published version of the manuscript.
Funding
This research received no external funding.
Institutional Review Board Statement
Not applicable.
Informed Consent Statement
Not applicable.
Data Availability Statement
All data used in this study are publicly available.
Conflicts of Interest
The authors declare no conflict of interest.
References
- Ahmadvand, M.; Dorafshan, S.; Azari, H.; Shams, S. 1D-CNNs for Autonomous Defect Detection in Bridge Decks Using Ground Penetrating Radar. Health Monit. Struct. Biol. Syst. XV 2021, 11593, 97–113. [Google Scholar]
- Dorafshan, S.; Azari, H. Deep Learning Models for Bridge Deck Evaluation Using Impact Echo. Constr. Build. Mater. 2020, 263, 120109. [Google Scholar] [CrossRef]
- Dorafshan, S.; Azari, H. Evaluation of Bridge Decks With Overlays Using Impact Echo: A Deep Learning Approach. Autom. Constr. 2020, 113, 103133. [Google Scholar] [CrossRef]
- Available online: https://infobridge.fhwa.dot.gov/Data/BridgeDetail/23749045 (accessed on 1 October 2017).
- Johnson, B.V. Long-Term Bridge Performance Committee Letter Report, Long-Term Bridge Performance Committee Letter Report: February 19; National Academies Press: Washington, DC, USA, 2013. [Google Scholar]
- Dorafshan, S.; Maguire, M. Bridge Inspection: Human Performance, Unmanned Aerial Systems and Automation. J. Civ. Struct. Health Monit. 2018, 8, 443–476. [Google Scholar] [CrossRef]
- Azari, H.; O’Shea, D.; Campbell, J. Application of Unmanned Aerial Systems for Bridge Inspection. Transp. Res. Rec. 2022, 2676, 401–407. [Google Scholar] [CrossRef]
- Ohtsu, M.; Watanabe, T. Stack Imaging of Spectral Amplitudes Based on Impact-Echo for Flaw Detection. NDT E Int. 2002, 35, 189–196. [Google Scholar] [CrossRef]
- Colla, C.; Lausch, R. Influence of Source Frequency on Impact-Echo Data Quality for Testing Concrete Structures. NDT E Int. 2003, 364, 203–213. [Google Scholar] [CrossRef]
- Gucunski, N.; Kee, S.; La, H.; Basily, B.; Maher, A. Delamination and Concrete Quality Assessment of Concrete Bridge Decks Using a Fully Autonomous RABIT Platform. Struct. Monit. Maint. 2015, 2, 19–34. [Google Scholar] [CrossRef]
- Zhang, J.K.; Yan, W.; Cui, D.M. Concrete Condition Assessment Using Impact-Echo Method and Extreme Learning Machines. Sensors 2016, 16, 447. [Google Scholar] [CrossRef]
- Hajin, C.; Sadegh, S.; Hoda, A. Frequency Wave Number–Domain Analysis of Air-Coupled Impact-Echo Tests in Concrete Slab1; American Society of Civil Engineers: Reston, VA, USA, 2018. [Google Scholar]
- Liu, Y.L.; Shi, J.J.; Huang, J.Q.; Wei, G.S.; Wu, Z.X. Grouting Defect Detection of Lapped Bar Connections Based on Impact-Echo Method. Shock Vib. 2019, 2019, 1934240. [Google Scholar] [CrossRef]
- Xu, J.; Yu, X. Detection of concrete structural defects using impact echo based on deep networks. J. Test. Eval. 2020, 49, 109–120. [Google Scholar] [CrossRef]
- Ghomi, M.T.; Mahmoudi, J.; Darabi, M. Concrete Plate Thickness Measurement Using the Indirect Impact-Echo Method. Non-Destr. Test. Eval. 2013, 28, 119–144. [Google Scholar] [CrossRef]
- Sengupta, A.; Guler, S.I.; Shokou, P. Interpreting Impact Echo Data to Predict Condition Rating of Concrete Bridge Decks: A Machine-Learning Approach. J. Bridge Eng. 2021, 26, 04021044. [Google Scholar] [CrossRef]
- Li, B.; Cao, J.; Xiao, J.; Zhang, X.; Wang, H. Robotic Impact-Echo Non-Destructive Evaluation Based on FFT and SVM. In Proceedings of the 11th World Congress on Intelligent Control and Automation, Shenyang, China, 29 June–4 July 2014; pp. 2854–2859. [Google Scholar]
- Epp, T.; Svecova, D.; Cha, Y.J. Semi-Automated Air-Coupled Impact-Echo Method for Large-Scale Parkade Structure. Sensors 2018, 18, 1018. [Google Scholar] [CrossRef]
- Schittkowski, K. EASY-FIT: A Software System for Data Fitting in Dynamical Systems. Struct. Multidiscip. Optim. 2002, 23, 153–169. [Google Scholar] [CrossRef]
- Qu, H.; Li, M.; Chen, G.; Sneed, L.H.; Anderson, N.L. Multi-Bandwidth Wavelet Transform of Impact Echo Signals for Delamination Detection of Thin Concrete Slabs. J. Civ. Struct. Health Monit. 2016, 6, 649–664. [Google Scholar] [CrossRef]
- Grinstead, C.M.; Snell, J.L. Conditional Probability–Discrete Conditional. In Grinstead & Snell’s Introduction to Probability; Orange Grove Texts; American Mathematical Society: Providence, RI, USA, 2009. [Google Scholar]
- Frigge, M.; Hoaglin, D.C.; Iglewicz, B. Some Implementations of the Boxplot. Am. Stat. 1989, 43, 50–54. [Google Scholar]
- Sarmadi, H.; Entezami, A.; Salar, M.; de Michele, C. Bridge Health Monitoring in Environmental Variability by New Clustering and Threshold Estimation Methods. J. Civ. Struct. Health Monit. 2021, 11, 629–644. [Google Scholar] [CrossRef]
- Shokouhi, P.; Gucunski, N.; Maher, A. Time-Frequency Techniques for the Impact Echo Data Analysis and Interpretations. In Proceedings of the 9th European NDT conference (ECNDT 2006), Berlin, Germany, 25–29 September 2006; pp. 25–29. [Google Scholar]
- Guan, S.; Zhu, Z.; Wang, G. A Review on UAV-Based Remote Sensing Technologies for Construction and Civil Applications. Drones 2022, 6, 117. [Google Scholar] [CrossRef]
- Fascista, A. Toward Integrated Large-Scale Environmental Monitoring Using WSN/UAV/Crowdsensing: A Review of Applications, Signal Processing, and Future Perspectives. Sensors 2022, 22, 1824. [Google Scholar] [CrossRef]
- Sreenath, S.; Malik, H.; Husnu, N.; Kalaichelavan, K. Assessment and Use of Unmanned Aerial Vehicle for Civil Structural Health Monitoring. Procedia Comput. Sci. 2020, 170, 656–663. [Google Scholar] [CrossRef]
- Jafari, F.; Dorafshan, S. Bridge Inspection and Defect Recognition with Using Impact Echo Data, Probability and Naive Bayes Classifiers. Infrastructures 2021, 6, 132. [Google Scholar] [CrossRef]
- Ichi, E.; Jafari, F.; Dorafshan, S. Detection in Concrete Bridge Decks, SDNET2021: Annotated NDE Dataset for Subsurface Structural Defects. Infrastructures 2022, 7, 107. [Google Scholar] [CrossRef]
- Wei, Q.; Dunbrack, R.L., Jr. The Role of Balanced Training and Testing Data Sets for Binary Classifiers in Bioinformatics. PLoS ONE 2013, 8, e67863. [Google Scholar] [CrossRef] [PubMed]
- Shaikh, S.; Daudpota, S.M.; Imran, A.S.; Kastrati, Z. Towards Improved Classification Accuracy on Highly Imbalanced Text Dataset Using Deep Neural Language Models. Appl. Sci. 2021, 11, 869. [Google Scholar] [CrossRef]
- Sun, Y.; Wong, A.K.; Kamel, M.S. Classification of Imbalanced Data: A Review. Int. J. Pattern Recognit. Artif. Intell. 2009, 23, 687–719. [Google Scholar] [CrossRef]
- Khoei, T.T.; Ismail, S.; Kaabouch, N. Boosting-based Models with Tree-structured Parzen Estimator Optimization to Detect Intrusion Attacks on Smart Grid. In Proceedings of the 2021 IEEE 12th Annual Ubiquitous Computing, Electronics & Mobile Communication Conference (UEMCON), New York, NY, USA, 1–4 December 2021; pp. 0165–0170. [Google Scholar]
- Ismail, S.; Khoei, T.T.; Marsh, R.; Kaabouch, N. A Comparative Study of Machine Learning Models for Cyber-attacks Detection in Wireless Sensor Networks. In Proceedings of the 2021 IEEE 12th Annual Ubiquitous Computing, Electronics & Mobile Communication Conference (UEMCON), New York, NY, USA, 1–4 December 2021; pp. 0313–0318. [Google Scholar]
- Jakkula, V. Tutorial on Support Vector Machine (SVM); School of EECS, Washington State University: Pullman, WA, USA, 2006; Volume 37. [Google Scholar]
- Akansu, A.N.; Haddad, R.A.; Haddad, P.A. Multiresolution Signal Decomposition: Transforms, Subbands, and Wavelets; Academic Press: Cambridge, MA, USA, 2001. [Google Scholar]
- Duong, B.P.; Kim, J.Y.; Jeong, I.; Im, K.; Kim, C.H.; Kim, J.M. A Deep-Learning-Based Bearing Fault Diagnosis Using Defect Signature Wavelet Image Visualization. Appl. Sci. 2020, 10, 8800. [Google Scholar] [CrossRef]
- Subasi, A. Practical Guide for Biomedical Signals Analysis Using Machine Learning Techniques: A MATLAB Based Approach; Academic Press: Cambridge, MA, USA, 2019. [Google Scholar]
- Hu, X.; Chu, L.; Pei, J.; Liu, W.; Bian, J. Model Complexity of Deep Learning: A Survey. Knowl. Inf. Syst. 2021, 63, 2585–2619. [Google Scholar] [CrossRef]
- Azari, H.; Lin, S. Evaluation of the Impact Echo Method for Concrete Bridge Decks with Asphalt Overlays. Transp. Res. Rec. 2019, 2673, 436–444. [Google Scholar] [CrossRef]
- Sutan, N.M.; Jaafar, M.S. Defect Detection of Concrete Material by Using Impact Echo Test. Russ. J. Nondestruct. Test. 2003, 8, 1–5. [Google Scholar]
Publisher’s Note: MDPI stays neutral with regard to jurisdictional claims in published maps and institutional affiliations. |
© 2022 by the authors. Licensee MDPI, Basel, Switzerland. This article is an open access article distributed under the terms and conditions of the Creative Commons Attribution (CC BY) license (https://creativecommons.org/licenses/by/4.0/).