Article

SRODNet: Object Detection Network Based on Super Resolution for Autonomous Vehicles

1
Department of Control and Instrumentation Engineering, Changwon National University, Changwon 51140, Republic of Korea
2
School of Electrical, Electronics and Control Engineering, Changwon National University, Changwon 51140, Republic of Korea
3
Department of Electrical and Computer Engineering, Princeton University, Princeton, NJ 08544, USA
*
Author to whom correspondence should be addressed.
Remote Sens. 2022, 14(24), 6270; https://doi.org/10.3390/rs14246270
Submission received: 29 November 2022 / Revised: 8 December 2022 / Accepted: 9 December 2022 / Published: 10 December 2022
(This article belongs to the Special Issue Machine Vision and Advanced Image Processing in Remote Sensing)

Abstract

:
Object detection methods have been applied in several aerial and traffic surveillance applications. However, object detection accuracy decreases in low-resolution (LR) images owing to feature loss. To address this problem, we propose a single network, SRODNet, that incorporates both super-resolution (SR) and object detection (OD). First, a modified residual block (MRB) is proposed in the SR to recover the feature information of LR images, and this network was jointly optimized with YOLOv5 to benefit from hierarchical features for small object detection. Moreover, the proposed model focuses on minimizing the computational cost of network optimization. We evaluated the proposed model using standard datasets such as VEDAI-VISIBLE, VEDAI-IR, DOTA, and Korean highway traffic (KoHT), both quantitatively and qualitatively. The experimental results show that the proposed method improves the accuracy of vehicular detection better than other conventional methods.

1. Introduction

Object detection is a key aspect of computer vision research and has increased usage owing to the adoption of various machine and deep-learning techniques. Upon the detection of objects related to particular aerial and traffic scenes, additional information can be extracted, thus rendering the localization of the remaining objects in the scenes possible; this simplifies the classification of instances. It also broadens the applicability of object detection in various fields, such as security [1], medical image analysis [2,3], business analytics, anomaly detection [4], crowd counting [5,6], video surveillance [7], transportation (i.e., autonomous vehicles) [8], industrial applications [9], trash collection [10], machine vision used in industrial robotics [11], agriculture [12], gesture classification [13], and remote sensing for aerial-vehicular detection [14,15,16,17,18].
Autonomous vehicles have attracted considerable interest in several fields. They employ advanced driver assistance systems [19] as a core technology for the execution of numerous tasks, such as the recognition of lanes, pedestrians, cyclists, traffic lights, and speed signs, vehicular detection on roads, aerial imagery, and traffic surveillance. Object detection is a necessary feature for the realization of autonomous driving. Accomplishing the aforementioned tasks requires various sensors, such as cameras [20], light detection and ranging [21], and radio detection and ranging [22]. Among these, cameras perform well and are more cost-effective. Therefore, this study focused on vehicular-object detection based on the use of a single camera.
In autonomous driving, detection [23] of vehicular objects in a lane environment is essential for safe driving. Additionally, aerial images are acquired at high altitudes, and the target is expected to degrade the performance of vehicular-object detection significantly. In these complex conditions [24] coupled with suboptimal backgrounds that prevent accurate detection, the targeted object is not visible. Consequently, single-image, super-resolution (SISR) [25,26,27] techniques are used to alleviate the poor detection performance in high-resolution (HR) images compared with the original low-resolution (LR) images. The interrelationship between SR and object-detection algorithms has been improved [28,29]. Ivan et al. [28] enhanced object detection with the use of SR and convolutional neural networks (CNN). Sheng et al. [29] developed an efficient video detection method for public safety by using SR and deep-fusion networks.
In addition to SR, object detection plays a vital role in providing current information as input to the driving systems through the detectors. The main aim of the object detector is to determine its classes, regardless of the scale, location, pose, and view, with respect to the camera. Presently, the object-detection approach for detectors is based on deep-learning methods, and is extremely important owing to its speed and accuracy characteristics that meet real-time requirements. Object detection may involve two stages, wherein detection and recognition are executed as two distinct processes; alternatively, it may only involve one stage, wherein detection and recognition occur together. In general, multistage detectors have better accuracy and lower speed characteristics than single-stage detectors. Therefore, we focused on a single-stage detector to obtain better results in terms of both speed and accuracy. Xinqing et al. [30] enhanced the single-shot multibox detector (SSD) for object detection in traffic scenes. Luc et al. [31] implemented a network by using SR with auxiliary generative adversarial networks (GAN) for small object detection, and Yun et al. [32] optimized GAN to detect planes with SR in remote sensing images. Despite these prior studies, we present herein a new, approach and the contributions of this study are outlined below.
  • Here, we propose an SRODNet that associates a super-resolution network and an object detection network to detect objects. The proposed SR method enhances the perceptual quality of small objects with a deep residual network. This network is designed with the proposed modified residual blocks (MRB) and dense connections. In particular, MRBs accumulate all the hierarchical features with global residual learning.
  • The proposed model is a structure in which the object detection component, YOLOv5, holds a super-resolution network. This implies that the model functions as a single network for both super-resolution and object detection in the training step. This ensures better feature learning, which enhances the condition of LR images to super-resolved images.
  • Finally, the proposed structure was jointly optimized to benefit from hierarchical features that helped the network to learn more efficiently and improve its accuracy. The structure also accumulates multi-features that help to perceive small objects and are useful in remote sensing applications.
  • We trained the model on vehicle detection in aerial imagery (VEDAI)-VISIBLE [33], VEDAI-IR [33], the dataset for object detection in aerial images (DOTA) [33], and KoHT datasets in order to evaluate the performance both quantitative and qualitatively.
  • We evaluated the SR model in terms of the peak-signal-to-noise-ratio (PSNR), structural similarity index (SSIM), and perception-image-quality-evaluator (PIQE) metrics. Further, we evaluated SRODNet performance by using the mean average precision (mAP) and F1 score metrics.
The remainder of this study is organized as follows. In Section 2, the SR-related conventional methods based on deep learning and object-detection models are described. In Section 3, the proposed method and its implementation are presented. In Section 4, experimental results are provided and discussed. Finally, in Section 5, the conclusions of the study are outlined.

2. Related Work

Contemporary research focuses on object detection, even in complex and abnormal conditions. In this case, the input image of the model contains LR details useful for the detection or recognition of an object in order to achieve this, we implemented SR to reconstruct the image and used the detector. Thus, this study combined two individual research areas: single-image SR and object-detection methods [33]. Prior studies on SR that used deep-learning and object-detection methods are described in Section 2.1 and Section 2.2.

2.1. Single Image Super-Resolution Using Deep Learning Methods

SISR techniques have been extensively studied in the field of computer vision. Recently, CNNs have been used in SR methods because they aid in the recovery of high-frequency details in SR images. Dong et al. [34] proposed a three-layered CNN, referred to as SR-CNN, to learn an end-to-end mapping between LR and HR images with some additional pre/postprocessing performed post-optimization; it was subsequently modified to a fast SRCNN [35] that rendered it 40 times faster, and yielded superior quality outcomes. Wang et al. [36] proposed a sparse coding-based network to build a multilayer network that mimicked the SR-CNN; it was subsequently modified by using very deep super-resolution (VDSR) [37]. In VDSR [37], it was shown that increasing the trained network depth with tunable gradient clipping by implementing an efficient SSIR method improved significantly the visual quality of the SR images. Image quality was improved further following the incorporation of a pyramidal hierarchy to provide good quality with respect to reduced parameters, commonly referred to as a deep Laplacian pyramid super-resolution network [38]. Finally, the enhanced deep super-resolution (EDSR) [39] outperforms all residual networks; it optimizes the performance of its model by removing the batch normalization layers from the existing residual networks, that is, the SRResNet [40].
Moreover, existing methods have focused on shallow networks with the aim of deeper networks. This design creates a vanishing gradient problem during training that affects the computational cost. To decrease the computational cost, Wazir et al. [41] proposed a multiscale inception-based SR by using the deep-learning method which replaced convolutional layers with asymmetric convolution. Yan et al. [42,43] implemented an efficient SR network based on aggregated residual transformations to reduce the parameters and temporal complexity. However, all of these methods applied interpolation to the LR input; therefore, some useful information is lost and the computational cost is increased as justified by the poor outcomes. In this study, we have proposed the residual in modified residual blocks (MRB) instead of the residual block in the EDSR model for SR. The proposed SRODNet model was implemented to improve the detection performance and additionally reduce the computational cost. In this study, our model produced high-quality images from LR to facilitate the detection of the object in them. Thus, the implementation is described in Section 3.

2.2. Deep Learning-Based Object-Detection Models

Prior research on object detection has focused on template-matching and part-based models. Subsequently, research focused on statistical classifiers, such as support vector machines [44], AdaBoost [45], Bayes’ theorem [46], decision trees [47], K-nearest neighbors [48], and random forest techniques [49]. All of these are initial object detectors based on statistical classifiers.
Additional research was based on deep-learning methods owing to their accuracy. Ross et al. [50] proposed regions with CNN features that helped localize and segment objects. These authors investigated fast R-CNN [51] that improved the detection accuracy, training, and testing speed. Shaoqing et al. [52] introduced a region-proposal network that helped share convolutional features. Moreover, it was designed for real-time object detection. Joseph et al. [53] proposed a new approach for the detection of classes with the YOLOv1 base model which was applied to real-time object detection; this resulted in an increased number of localization errors. Joseph et al. [54] improved YOLOv1 with anchor boxes and applied and executed a multi-scaling training method at various sizes. Joseph et al. [55] updated YOLOv2 to YOLOv3 with a new network design trained on the COCO dataset. The YOLOv3 structure was designed by using a variant of the Darknet-53. YOLOv3 performed well on small objects but not on medium and larger objects. Alexey et al. [56] proposed a novel, two-stage, object-detector approach to improve further the performance of the previous versions of YOLO. It performed a large number of calculations and detected objects of various sizes. Chien-Yao et al. [57] designed a YOLOv4 network based on the cross-stage partial network approach, which is applicable to small and large networks at optimal speed and accuracy. Yingfeng et al. [58] improved the performance by using a new fusion module in the PAN++ network. This model enhanced the detection accuracy of small objects. However, it limited the real-time performance owing to the availability of vehicle-mounted computational resources. Lian et al. [59] investigated small-object detection in a challenging case of an LR image that contained limited information. Therefore, we propose a method that focuses on vehicular object detection to increase accuracy based on the use of SR in LR aerial and traffic images, as described in Section 3.

3. Proposed Object Detection Network Based on SR

Object detection and SR methods have been adopted in various applications. Generally, object detection is challenging in LR images, which deteriorates the detection performance. In this section, we propose an object detection model that performs SR and object detection on aerial and traffic images. It also focuses on enhancing perceptual quality; hence, it improves detection performance. The input to the SR model included the LR aerial and traffic images, while the output was adopted to predict objects as trained classes, as illustrated in Figure 1.
The core idea of SRODNet is as follows. First, an SR model was proposed to recover the feature information of LR images, and this network was optimized with YOLOv5 to detect small objects. The proposed SRODNet comprises SR for object detection. The SR model is based on the residual network. In network design, residual networks typically use skip connections to avoid vanishing gradients and achieve flexibility in designing deep-neural networks. Recently, the EDSR network boosted the SR performance [39]. The core idea of this study pertains to the enhancement of the SR by removing the BN layers and producing better results, even though the computational cost is poor. We proposed the SRODNet to improve the perceptual quality of the LR image and also a computational cost. We implemented an SR-based method, which was designed based on a single-stage residual network [25].
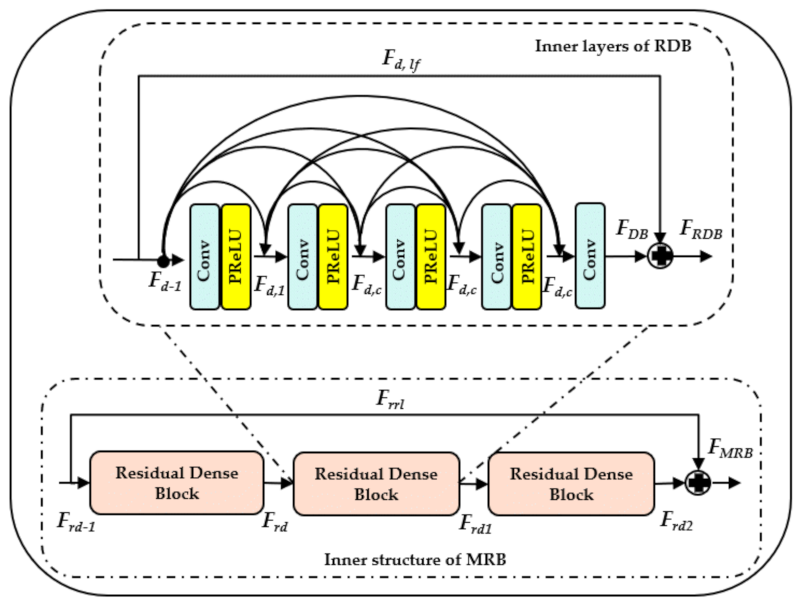
The basic SR model is illustrated in Figure 1 and consists of B (=24) linearly connected MRB blocks for perceptual features. The main difference between the residual block in the EDSR and the proposed MRB is that the residual block has two convolutional layers with a rectified linear unit as the activation function. The proposed MRB adopts three residual dense blocks (RDB), each of which has five convolutional layers; among four comprise 3 × 3 kernels and 64 feature maps, followed by a parametric rectified linear unit (PReLU) as the activation function, as illustrated in Figure 2. The final convolution layer is used to aggregate the features with residual learning in the RDB. The process of this model begins with LR images as the input and as the output of the SR model. The feature map information from the LR images is x. Mathematically, the convolutional layer can be represented as shown in Equation (1).
F e x =   W l   *   G l 1   G
where l is the l th convolution layer, W l represents the number of filters of the l th layer and G l 1 denotes the previous layer output feature map, F e is the output of feature map and * represents the convolution operation. The output of the MRB layers are mathematically expressed by Equation (2).
F M R B =   H R D B ,   r d H R D B ,   r d 1 F r d 1 H R D B ,   r d 2 F r d 2 + F r r l
where r d is the r d th residual layer in RDB, H R D B ,   r d represents the combined operations of the convolution and PReLU of r d th layer of RDB, and F M R B is obtained all combined RDB’s and residual in residual learning F r r l . The output of the RDB in Equation (3).
F R D B =   H D B , d   F d 1 +   F d , l f
where F R D B is obtained using all the convolutional layers with PReLU, F   l f   is a local feature of the dense block (DB), and the inner layers of the DB are formulated using Equation (4).
F d , c =   σ ( W d , c     F d 1 ,   F d , 1 ,   ,   F d , c 1  
where, σ denotes PReLU activation function. W d , c   denotes the weights of the cth convolutional layer, and   F d 1 ,   F d , 1 ,   ,   F d , c 1   denotes the concatenation of the feature-maps yielded by the (d − 1)th DB, convolutional layers 1, …, (c − 1) in the dth DB. The fusion of the network F f u s i o n is represented in (5).
F f u s i o n = F e + F M R B + F G R L
Here F f e is the feature map output, F M R B is the output of MRB, and F G R L is the global residual learning. Finally, the SR image that is drawn from the SR model is expressed by Equation (6).
y s r =   H S R   x l r  
where H S R denotes the convolutional operation of SR model,   y s r is the output image after super-resolved of model, and x l r is the LR input image.
The super-resolved images are fed to the ODNet, which is YOLOv5, and trained on an optimized single network. The detector network consists of three stages with an upsampled block: the backbone, neck, and head. The first stage is a backbone network, which typically consists of a cross-stage spatial network and a Darknet (CDN). The second stage is the neck network, which typically consists of a path aggregation network (PANet). The final stage is the head network, also called the YOLO layer. The data are first input to the CDN for feature extraction and then fed to the PANet for feature fusion. Finally, the YOLO layer detects the classified results, such as cars, trucks, traffic, and speed-limit signs, as expressed by Equation (7).
P D =   H f e   C D N ( y s r ) + H f f   C D N ( y s r + P A N   y s r ) + H Y O L O   y c l s
Herein H f e     is the convolution operation for feature extraction of the y s r   through the CSP Net and Darknet, H f f     is the feature fusion of the CDN and PAN, and H Y O L O   is the convolution operation of the head network used to classify the objects in the SR image. The final output of the SRODNet is expressed by Equation (8).
  y p =   P D c l s   y s r
Herein, P D c l s is the prediction of the class used to classify the objects y s r on SR image and y p are the predicted vehicular-objects in SR images. Additionally, the network will not learn perfectly; thus, there should be some loss during the training. An extensively used method to optimize the network based on the content loss during the training, which is also called a pixel-wise loss or mean-square error (MSE), is formulated mathematically according to Equation (9).
L c o n t =   1 N   n = 1 N 1 W H     x = 1 W y = 1 H I n H R x , y S R I n L R x , y 2
Here W   and   H are width and height of the image and S R I n L R is the super-resolved image through the SR network for N training samples. The total loss of the network is defined as the summation of MSEs and the detector losses for the optimization of the network to retrieve the high-frequency details for better object detection in the LR aerial and traffic images. Particularly, the SRODNet performance was verified based on actual road data in Korea, DOTA, and VEDAI-VISIBLE, VEDAI-IR, and as described in Section 4.

4. Experimental Results

This section presents the experimental procedures and the results of the proposed model. All the models were tested and trained on a single deep-learning computer equipped with an NVIDIA GeForce RTX A6000 graphics card in conjunction with the use of CUDA (version 11.6). The experiments were performed on VEDAI-VISIBLE, VEDAI-IR, DOTA, and on a manually annotated dataset denoted by the Korean highway traffic dataset (KoHT) in conjunction with COCO pre-trained weights. Both the VEDAI-VISIBLE and VEDAI-IR datasets are related to aerial applications, and KoHT is used for traffic surveillance applications. The configuration details of the experimental system for the hardware and software are listed in Table 1.
We focused on object detection in aerial and K-road applications. First, for these types of applications, publicly available datasets, such as VEDAI-VISIBLE and VEDAI-IR, were used and split into LR and HR datasets for training. Both datasets consisted of 688 images (sizes = 512 × 512). The LR dataset was down-sampled 4× times (and comprised 128 × 128 images) by using the bicubic interpolation method. For testing, the training and validation sets were created by randomly splitting the training set in half. DOTA is a large-scale, multi-sensor, and multi-resolution aerial dataset. Data were collected from Google Earth, GF-2, and JL-1 satellites, while aerial images were collected using Cyclo Media. The DOTA dataset was from 800 × 800 to 20,000 × 20,000 pixels, and DOTA 1.0 was adopted in this study. DOTA v1.0 comprises 2806 images and 188 282 instances, and we created 512 × 512 patches from the original images. The dataset contains 15 categories with a wide variety of scales, orientations, and shapes: plane, ship, storage tank, baseball diamond, tennis court, basketball court, ground track field, harbor, bridge, swimming pool, large vehicle, small vehicle, helicopter, roundabout, and soccer ball field. We omitted all classes except for large and small vehicles.
Second, for K-roads, most of the available datasets were non-Korean datasets used for object detection in LR images pertaining to autonomous driving in outdoor settings irrespective of the time; additionally, a dataset was constructed to train and verify our model. This dataset comprised 15 video sequences from Korean highway traffic scenes. These sequences were converted into a series of 3168 images. Subsequently, the dataset was split into the LR and HR datasets, which were denoted as KoHT_LR and KoHT_HR, respectively. KoHT_LR is a synthetic dataset used to train our SR model to evaluate its performance. The dataset consisted of 241 images for training and 40 images for validation, which were down-sampled HR images obtained by using the bicubic model (down-sampling by a factor of four); the remaining images were used for testing. The KoHT_HR dataset consisted of 281 images and included four classes: cars, trucks, traffic, and speed-limit signs. Because of the lack of GT, the KoHT_HR dataset was considered as the GT. A software program was used to annotate the labels manually; they were then converted into the YOLO format for training. This constituted the highway dataset, and no other classes were available. Therefore, other classes, such as buses, lights, signs, persons, bikes, motors, trains, and riders, as mentioned in the BDD dataset, could not be labeled.
For training, the VEDAI-VISIBLE, VEDAI-IR, and KoHT datasets were used; these were evaluated by using the tested images of all the models. The training parameters were as follows: the optimizer was the stochastic gradient descent algorithm used to minimize the loss function, momentum = 0.937, weight decay function = 0.0005, initial learning rate = 0.01, batch size = 16, the intersection of union (IoU) threshold = 0.25, epochs = 300, and the input image size = 512 × 512. The warmup momentum was set to 0.8, and some of the image augmentation methods, such as random hue, saturation, value, image rotation (horizontal and vertical), image flipping in the upward and downward directions, and image flipping on the left and right directions, were employed. For testing, the batch size = 1, the input size of the image was the same as that used in training, the confidence threshold for the prediction box = 0.001, and the IoU threshold for non-maximum suppression = 0.65. During the implementation, the input image sizes ranged from 512 × 512–1280 × 672 pixels. Note that during training and validation, the network calculates the coordinate, bounding box regression, objectness, and classification losses for each detection layer based on Equation (10).
L d e t e c t i o n = λ c o o r d i = 0 S 2 j = 0 B 1 i j o b j   x i x ^ i 2 + y i y ^ i 2 + λ c o o r d i = 0 S 2 j = 0 B 1 i j o b j   w i w ^ i 2 + h i h ^ i 2 + i = 0 S 2 j = 0 B 1 i j o b j   l C i , C ^ i + λ n o o b j   i = 0 S 2 j = 0 B 1 i j o b j   l C i , C ^ i + i = 0 S 2 1 i o b j c c l a s s e s l p i c p ^ i c
Herein 1 i j o b j is the object detected by the j t h boundary box of grid cell i. x i ,   y i ,   w i ,   h i are the actual bounding box coordinates and predicted bounding box coordinates are x ^ i ,   y ^ i ,   w ^ i ,   h ^ i . C i is the confidence score of actual box in cell i, C ^ i is the confidence score of the predicted box.

4.1. Quantitative Results of Proposed Model for Generic SR Application

For generic evaluation, we adopted the Diverse2k resolution (Div2K) [60] training dataset, and quantitative evaluation was performed using a public benchmark dataset as set 5 [61], set 14 [62], BSD 100 [63], and urban 100 [64]. The primary objective of these datasets is to test and predict the proposed model, which can be easily compared with existing SR models.

4.1.1. Div2k Training Dataset

This dataset comprises 800 trainings, 100 validations, and 100 testing 2k-resolution high-quality images. In addition, it contains LR bicubic images for various scale factors (×2, ×3, ×4, and ×8) to be utilized during training and evaluation.

4.1.2. Public Benchmark Datasets

Set 5 [61]: It is a 5-image standard dataset. Set 14 [62]: This is a 14-image dataset including set 5. BSD 100 [63]: This is a 100-image dataset comprising plants, people, food, animals, devices, etc. Urban 100 [64]: The dataset composed of 100 images with artificial structures which are made by humans. This dataset contains 100 images with artificial structures made by humans. The quantitative evaluation of the proposed model on the public benchmark test results is presented in Table 2.
We trained the model using the parameters given by Bee et al. [39]. The comparison of the predicted SR begins with the bicubic method and continues with deep-learning models, i.e., from SRCNN [35] to EDSR [39]. Each model has been designed with its own purpose to improve the SR performance, faster, and network complexity. We designed our network to improve the visual quality using a simple network. If we analyze the data presented in Table 2, the proposed model exhibits better quality in all datasets except the urban 100 in PSNR and SSIM. Hence, the proposed SR model improves performance. Subsequently, we observed that the addition of MRB layers helped in generating better quality images in Table 2.

4.2. Super-Resolution Results for Remotesensing Application

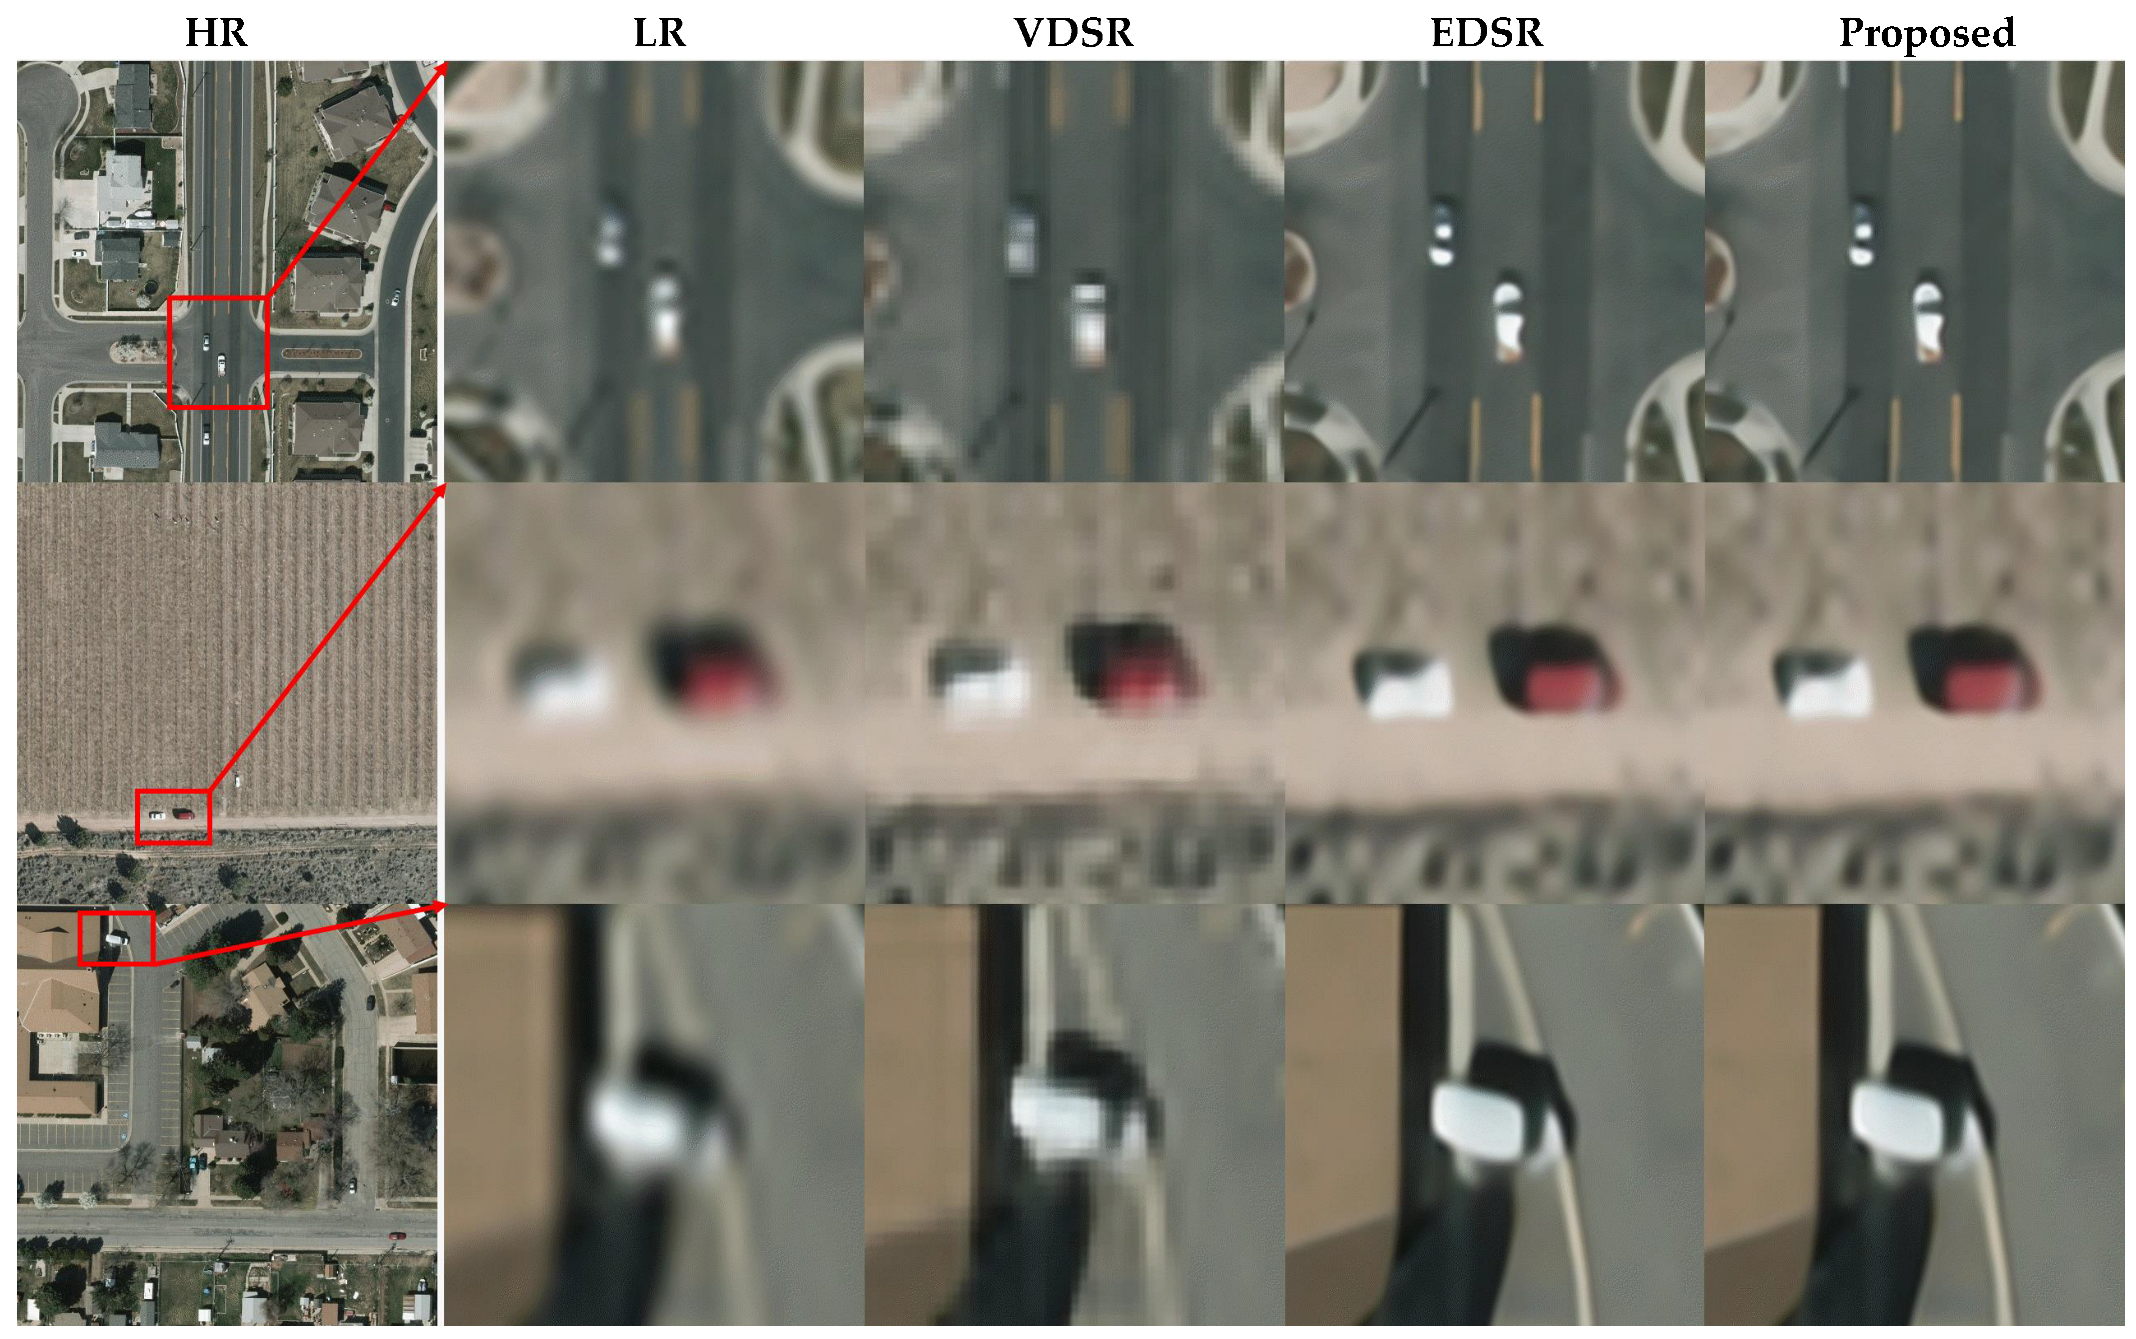
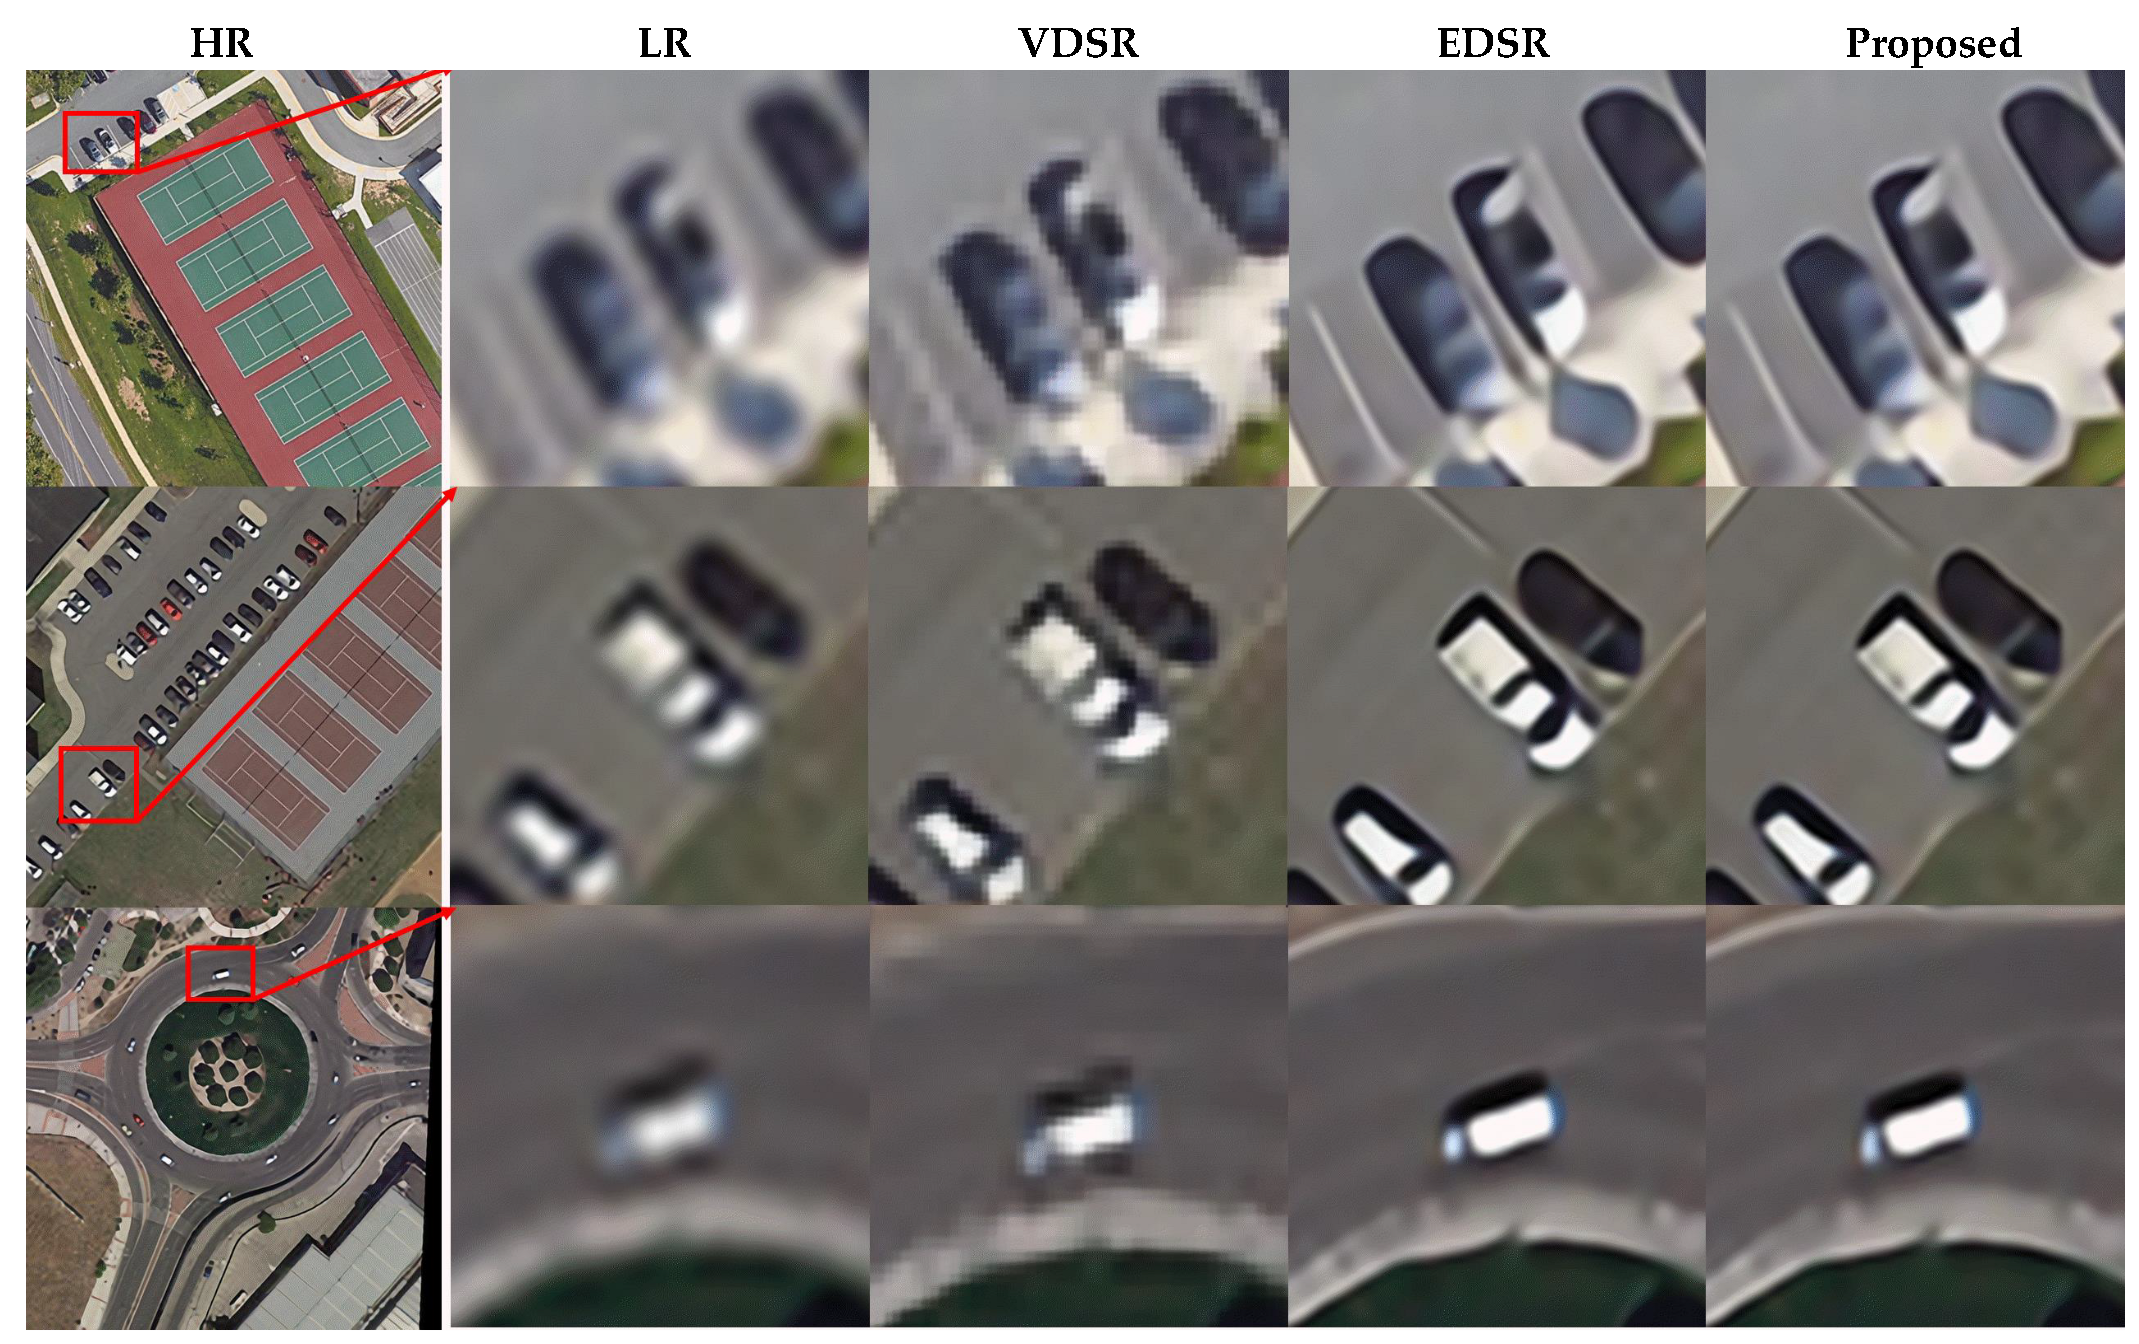
A visual comparison of the SR models for different datasets is shown in Figure 3, Figure 4 and Figure 5. The selected part of the target in the GT was compared with the super-resolved images of VDSR, EDSR, and the SRODNet shown in Figure 3 for VEDAI-VISIBLE, Figure 4 for VEDAI-IR, and Figure 5 for DOTA. To evaluate the performance, the PSNR [65], SSIM [65], and PIQE [66] metrics were utilized. Table 3 presents a comparative analysis of our approach with other conventional methods on the aerial and KoHT datasets.
For comparison, first, results from VDSR, which is a basic residual network, were included. Subsequently, the EDSR architecture, one of the pioneering outcomes of residual-network-based SR introduced by Lim et al. [39], was included. As expected, the performance of this network [39] was superior to those of the previous approaches because of the removal of BN layers which enabled the network to achieve better visual quality.
We observed that the inclusion of MRB layers enhanced the perceptual quality of generated images as shown in Table 3. The MRB was designed using the residual and dense connections that accumulated all hierarchical features with global residual learning in the residual architecture. These features are transferred to the next stage of fusion, which helped the network in enhancing the perceptual quality of the object. The block ensures better feature learning, resulting in a qualitative improvement of LR images. We also compared the results obtained experimentally for MRB, which is part of the SR shown in Figure 3, Figure 4 and Figure 5.
A higher score indicates better image quality for both PSNR and SSIM, and a smaller score indicates better perceptual quality for PIQE. Comparatively, we recognize the image in LR and VDSR is blurred and deteriorated; while the proposed SR model produced similar results as EDSR with better perceptual quality.

4.3. Detection Results and Performance Analysis

The accuracy results of the existing and proposed models are presented in Table 4 for all the datasets. To evaluate the performance, we used quantitative metrics for vehicular detection on aerial and K-road applications, such as mean average precision (mAP) @ 0.5 and F1 scores. The mAP values and F1 scores were reported on the VEDAI-VISIBLE, VEDAI-IR, KoHT, and DOTA datasets for most of the models based on their availability. We calculated the mAP as the average of maximum precisions at different recall values in the range of 0.0–1.0. The mAP was calculated based on the use of the AP for each class and was divided by the total number of classes.
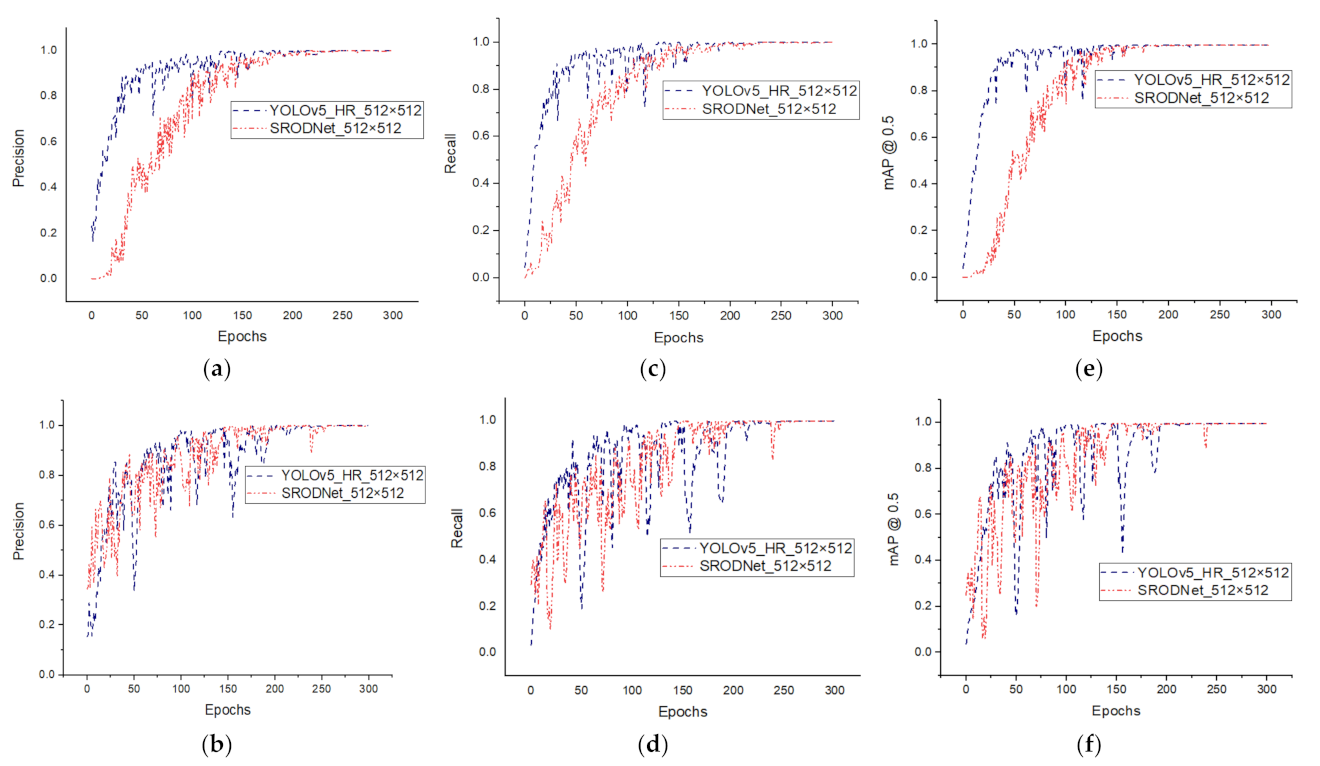
The precision curves (P-curves) of the four datasets are shown in Figure 6a,b and Figure 7a,b. The probabilistic events of precision, recall, and F1 were true positives, false positives, and false negatives, respectively. True positive predicts the existence of an object when there is an object, false positive predicts the existence of an object when there is no object, and false negative predicts the lack of an object when there is an object. Precision is the number of true positives divided by the sum of the true and false positives. Thus, the APs of the SRODNet for the four datasets were equal to 0.7989, 0.7839, 0.9496, and 0.9147 respectively.
The recall (R) curves of the four datasets are shown in Figure 6c,d and Figure 7c,d. Recall measures the extent to which a true box is predicted correctly and can be defined as the number of true positives divided by the sum of the true positives and false negatives. Thus, the average recall values of the SRODNet for the three datasets were equal to 0.8409, 0.8172, 0.9080, and 0.8699 respectively. The mAP curves of all four datasets are shown in Figure 6e,f and Figure 7e,f. The mAP was evaluated with the use of various IoU thresholds, whereby each IoU provided different predictions. We calculated the mAP at a threshold of 0.5, whereby the mAPs of all the datasets of the SRODNet were equal to 81.38, 79.82, 93.02, and 92.08 respectively.
The F1 score was evaluated by using precision and recall in the range of 0.0–1.0. We show the precision, recall, and mAP graphs for each dataset at various IoU thresholds 0.3–0.7 for the YOLOv5 performed on super-resolved images from the GT. The proposed model is shown in Figure 6 and Figure 7. The same testing data were used to evaluate all the methods. Findings confirmed that our proposed model was stable for vehicular detection on the aerial and K-road datasets. In addition, we compared the detection results of recent CNN-based object detectors, namely Faster R-CNN [46] with the use of the Z and F model, Faster R-CNN [46] with the use of the VGG-16 model, and Fast R-CNN [51] with the use of the VGG-model for the VEDAI dataset.
Furthermore, we compared our findings with those of Zhong et al. [18], Chen et al. [67], and the most recently proposed algorithm, YOLOv3 [55]. It is evident from the results presented in Table 4 that our proposed model yielded the best performance compared with other detection methods, and yielded the best mAP (81.38%, 79.82%, 92.08%, and 93.02%) and F1 score (0.819, 0.800, 0.892, and 0.928) values respectively. Thus, the comparative analysis demonstrated that the detection performance of the SRODNet outperformed conventional methods, such as YOLOv3_SRGAN [33], YOLOv3-_MsSR-GAN_512 [33], and YOLOv3_EDSR [39]. As indicated by the results in Table 4, the performance of the proposed method is better than those of the VEDAI-VISIBLE, VEDAI-IR and DOTA datasets in [39]. During testing, we tested the original images of the DOTA dataset, irrespective of the trained images. Accordingly, we observed that our model improved the detection performance for DOTA. Additionally, we quantified the performance of our model on the KoHT dataset. During the experiments, we observed a significant improvement in the detection performance for this dataset on K-roads, as shown in Figure 7; presented in the fourth column in Table 4. The aforementioned experiments have verified that the presence of MRB in the SR model helped the proposed structure to enhance the accuracy for small object detection as shown in Table 4.
The speed performance outcomes of the existing and proposed models are listed in Table 5. We experimented and compared data from other models, such as YOLOv3_GT [55], YOLOv3_EDSR [39], and SRODNet (our model). To show that our model achieved a low-computational cost, we compared the hardware, such as the number of graphics processing units (GPUs) utilized, and the number of giga floating point operations (G-FLOPs) which were performed. Generally, the metric FLOPS is used to measure the computing performance of the system. We also compared the speed, which is related to the time required to train and test the model, such as inference. Third, we compared the total number of model parameters. The data presented in Table 5 reveals that the proposed model required 15.8 G-FLOPs for the DOTA, VEDAI-VISIBLE, and VEDAI-IR datasets along with 16.4 FLOPs for the KoHT dataset to train the model compared with the existing models. In contrast, the existing model required 154.8 G-FLOPs for the VEDAI-VISIBLE, VEDAI-IR, and KoHT datasets; and 154.6 G-FLOPs for the DOTA dataset.
A comparison of the training speeds showed that the proposed model was completed in 0.143 h, 0.140 h, 0.382 h, and 0.140 h compared with that proposed by Bee lim et al. [39] which required 0.403 h, 0.396 h, 1.150 h, and 0.394 h respectively. Finally, the total number of parameters of the proposed model was smaller than that of Bee lim. et al. [39]. Based on the listings in Table 5, we can conclude that the performance of the proposed model outperforms the rest in terms of hardware and speed, hence the proposed MRB in the SR of SRODNet proving that it yields improved visual results with a low-computational cost.
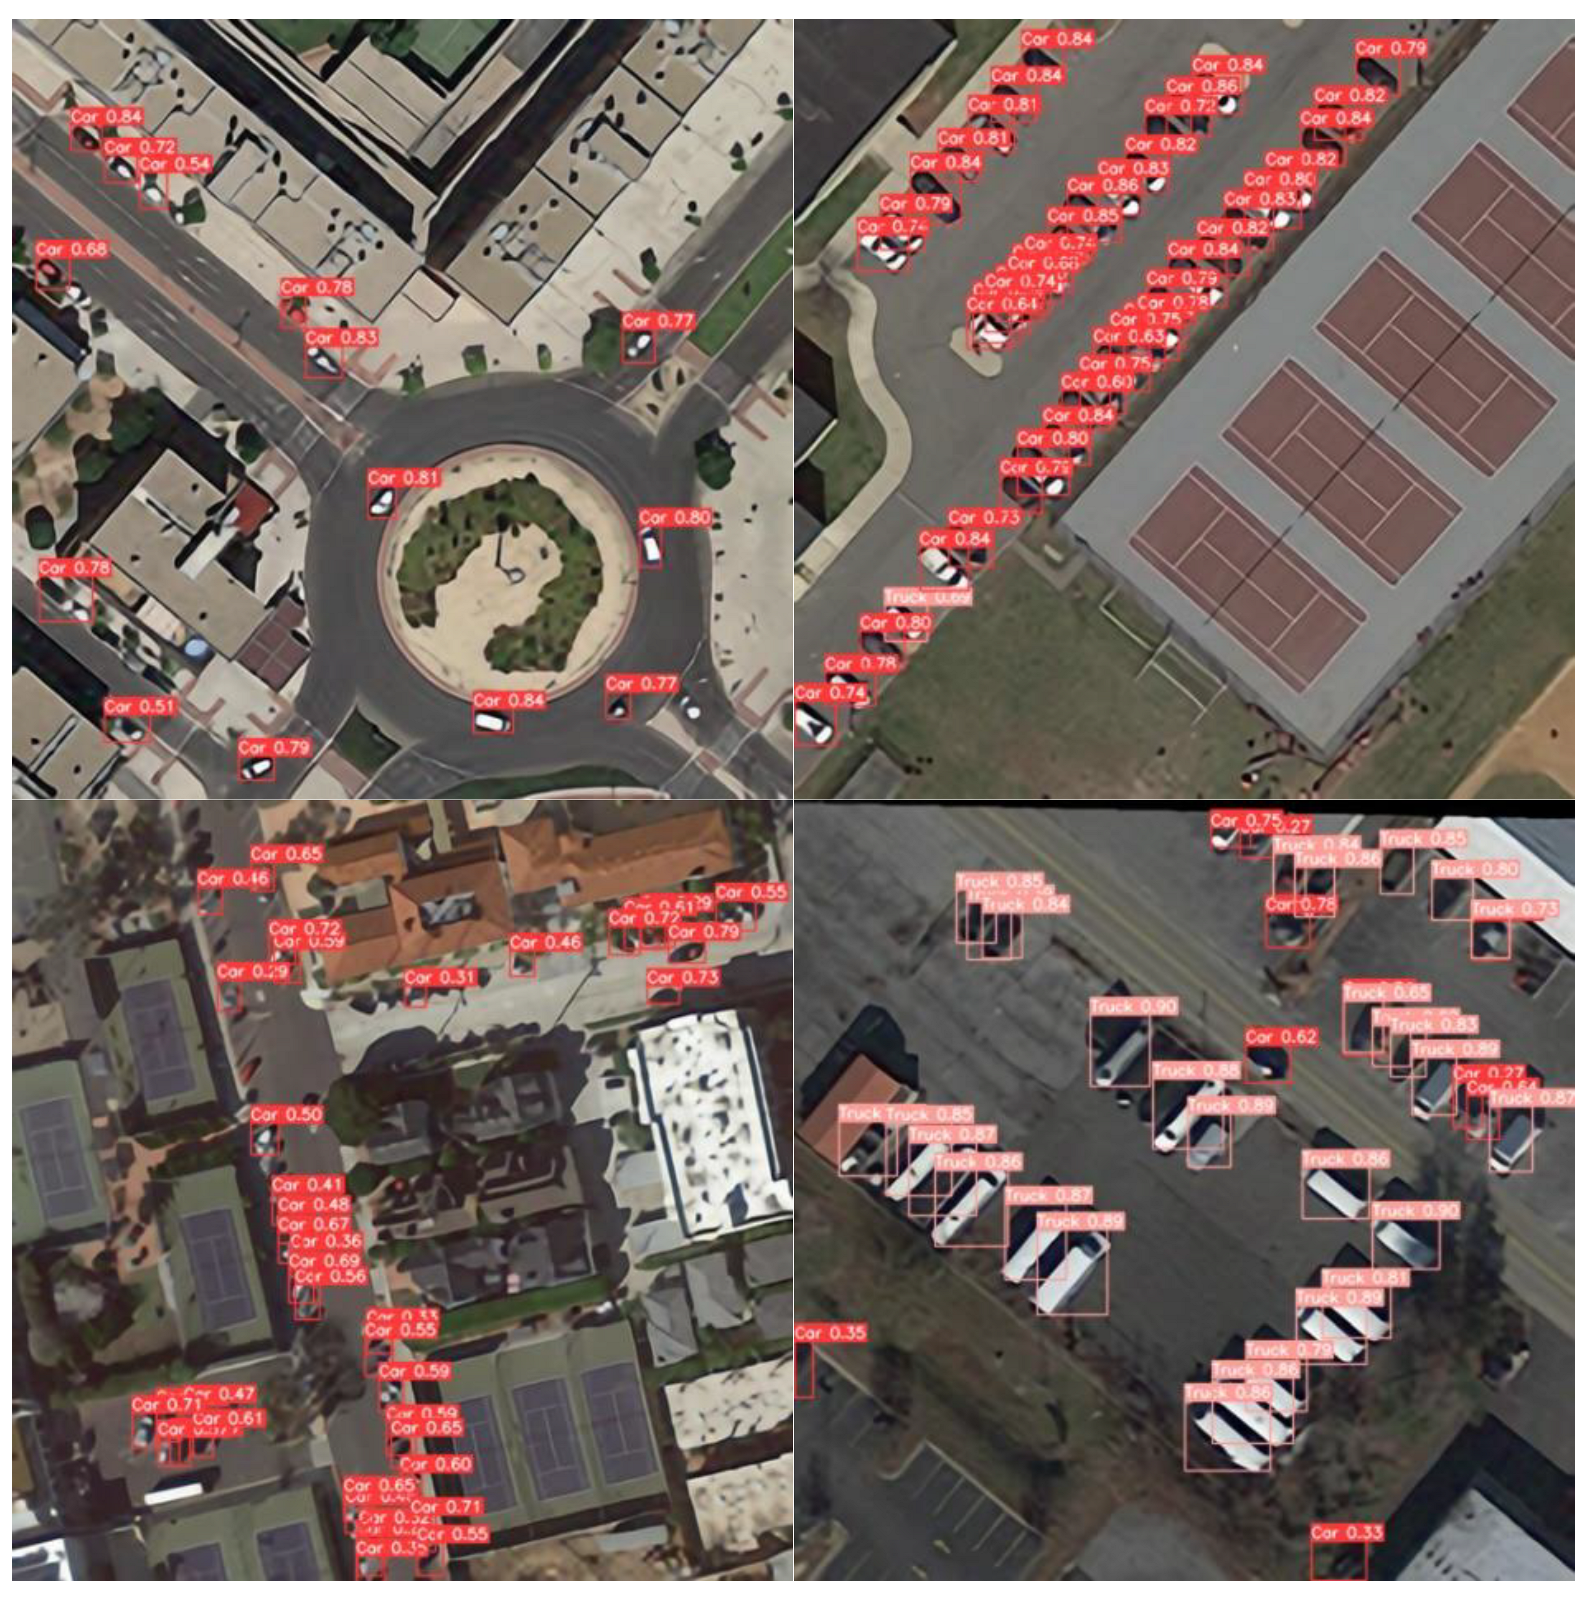
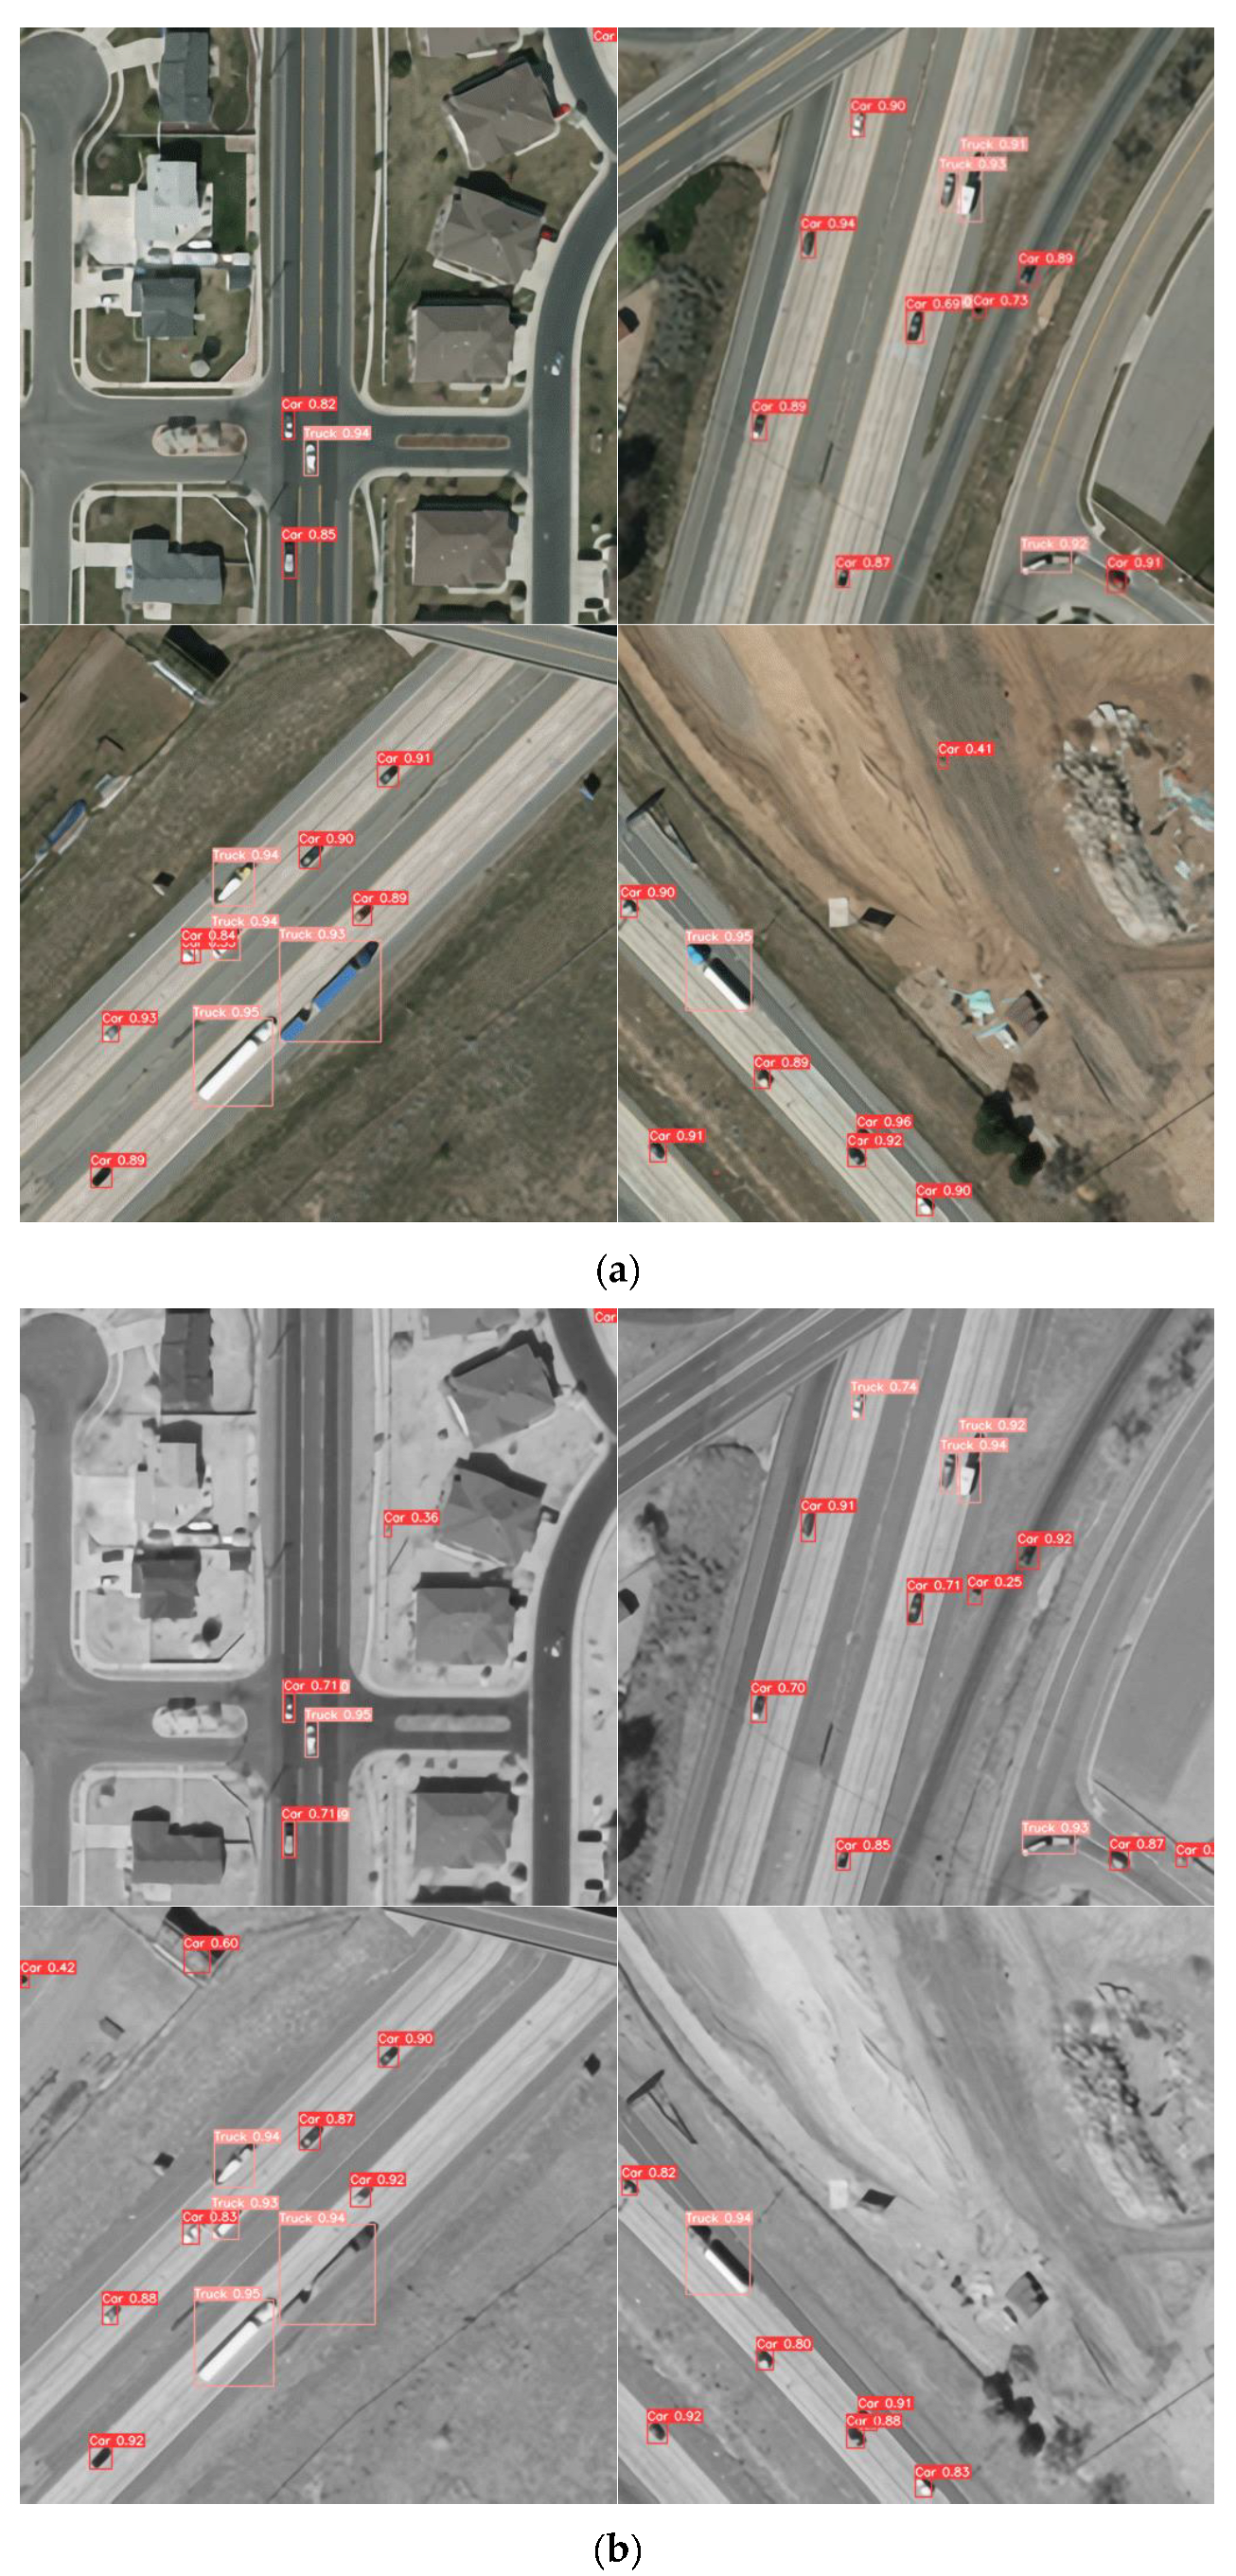
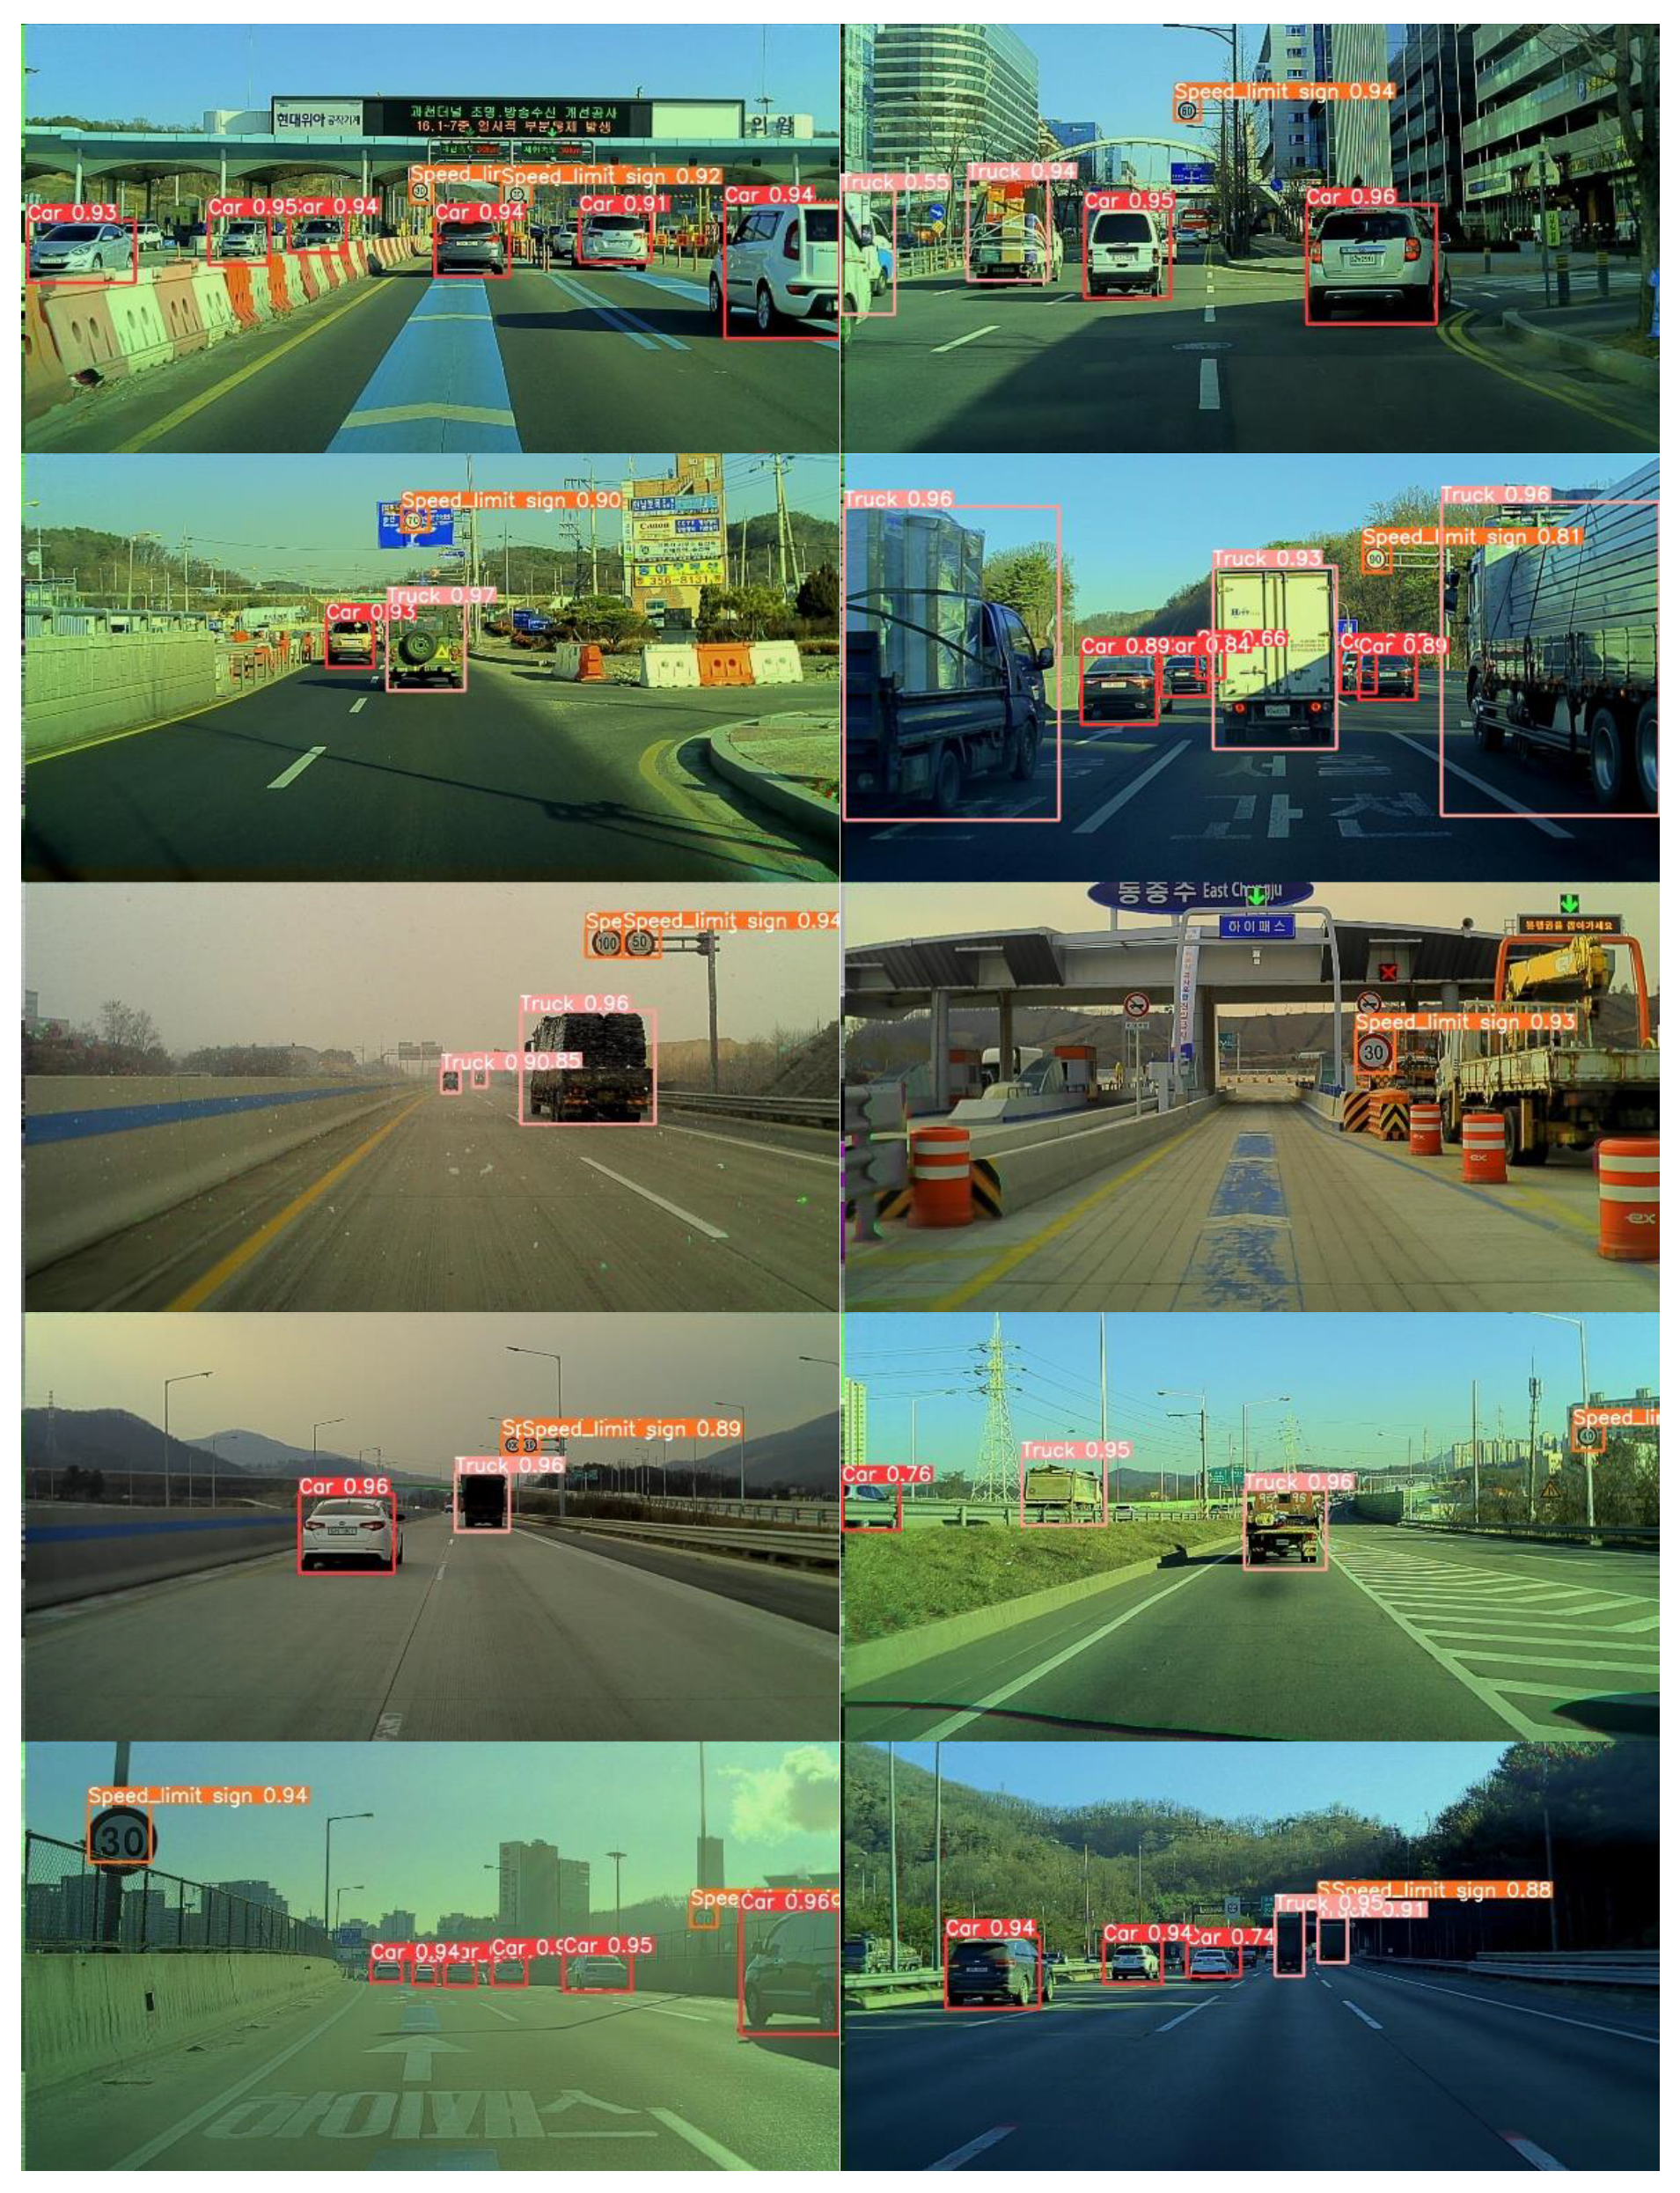
Additionally, the vehicular detection performances on DOTA, VEDAI-VISIBLE, and VEDAI-IR are shown visually in Figure 8 and Figure 9a,b. The vehicles are detected properly while the labels are trained, i.e., cars and trucks. Furthermore, object detection of various scenarios on KoHT, such as sunny, gloomy, and rainy, is shown in Figure 10. Figure 8, Figure 9 and Figure 10 show the performance of our model as predicted according to trained labels as cars, trucks, traffic_sign, and speed_limit_sign, respectively.

5. Conclusions

Here, we proposed an SRODNet model that incorporates SR and object-detection modules to detect small objects in LR images. First, the SR model was designed to generate high-quality images from LR images to enlarge the target with minimal degradation. Subsequently, the super-resolved data generated by the SR model were fed to a single optimized network to improve the performance. Moreover, in addition to focusing on the increase in the detection performance of aerial and traffic images, the proposed model also minimized the computational cost of the model. To evaluate our model’s performance, we conducted experiments on publicly available DOTA, VEDAI-VISIBLE, VEDAI-IR, and KoHT datasets. Accordingly, the obtained results demonstrated that the proposed model produced better results than other conventional approaches in terms of mAP @ 0.5 and F1 score. Furthermore, we will test our model in the future using actual video data captured on K-roads.

Author Contributions

Conceptualization, Y.R.M. and O.-S.K.; methodology, Y.R.M., O.-S.K. and S.-Y.K.; software, Y.R.M.; investigation, Y.R.M., O.-S.K. and S.-Y.K.; writing—original draft preparation, Y.R.M.; writing—review and editing, Y.R.M., O.-S.K. and S.-Y.K.; supervision, O.-S.K.; project administration, O.-S.K.; funding acquisition, O.-S.K. All authors have read and agreed to the published version of the manuscript.

Funding

This research was supported by Basic Science Research Program through the National Research Foundation of Korea (NRF) funded by the Ministry of Science, ICT and Future Planning No.2019R1F1A1058489.

Data Availability Statement

Not applicable.

Conflicts of Interest

The authors declare no conflict of interest.

References

  1. Akcay, S.; Kundegorski, M.; Willcocks, C.; Breckon, T. Using Deep Convolutional Neural Network Architectures for Object Classification and Detection within X-ray Baggage Security Imagery. IEEE Trans. Inf. Forensics Secur. 2018, 13, 2203–2215. [Google Scholar] [CrossRef] [Green Version]
  2. Bastan, M. Multi-view object detection in dual-energy X-ray images. Mach. Vis. Appl. 2015, 26, 1045–1060. [Google Scholar] [CrossRef]
  3. Mery, D.; Svec, E.; Arias, M.; Riffo, V.; Saavedra, J.; Banerjee, S. Modern Computer Vision Techniques for X-ray Testing in Baggage Inspection. IEEE Trans. Syst. Man Cybern. Syst. 2017, 47, 682–692. [Google Scholar] [CrossRef]
  4. Choi, K.; Yi, J.; Park, C.; Yoon, S. Deep Learning for Anomaly Detection in Time-Series Data: Review, Analysis, and Guidelines. IEEE Access 2021, 9, 120043–120065. [Google Scholar] [CrossRef]
  5. Shi, X.; Li, X.; Wu, C.; Kong, S.; Yang, J.; He, L. A Real-Time Deep Network for Crowd Counting. In Proceedings of the 2020 IEEE International Conference on Acoustics, Speech and Signal Processing (ICASSP), Barcelona, Spain, 4–8 May 2020. [Google Scholar]
  6. Zhao, P.; Adnan, K.; Lyu, X.; Wei, S.; Sinnott, R. Estimating the Size of Crowds through Deep Learning. In Proceedings of the 2020 IEEE Asia-Pacific Conference on Computer Science and Data Engineering (CSDE), Gold Coast, Australia, 16–18 December 2020. [Google Scholar]
  7. Xu, J. A deep learning approach to building an intelligent video surveillance system. Multimed. Tools Appl. 2021, 80, 5495–5515. [Google Scholar] [CrossRef]
  8. Wu, X.; Sahoo, D.; Hoi, S. Recent Advances in Deep Learning for Object Detection. Neurocomputing 2020, 396, 39–64. [Google Scholar] [CrossRef] [Green Version]
  9. Mingyu, G.; Qinyu, C.; Bowen, Z.; Jie, S.; Zhihao, N.; Junfan, W.; Huipin, L. A Hybrid YOLOv4 and Particle Filter Based Robotic Arm Grabbing System in Nonlinear and Non-Gaussian Environment. Electronics 2021, 10, 1140. [Google Scholar]
  10. Kulshreshtha, M.; Chandra, S.S.; Randhawa, P.; Tsaramirsis, G.; Khadidos, A.; Khadidos, A. OATCR: Outdoor Autonomous Trash-Collecting Robot Design Using YOLOv4-Tiny. Electronics 2021, 10, 2292. [Google Scholar] [CrossRef]
  11. Nelson, R.; Corby, J.R. Machine vision for robotics. IEEE Trans. Ind. Electron. 1983, 30, 282–291. [Google Scholar]
  12. Loukatos, D.; Petrongonas, E.; Manes, K.; Kyrtopoulos, I.-V.; Dimou, V.; Arvanitis, K.G. A Synergy of Innovative Technologies towards Implementing an Autonomous DIY Electric Vehicle for Harvester-Assisting Purposes. Machines 2021, 9, 82. [Google Scholar] [CrossRef]
  13. Schulte, J.; Kocherovsky, M.; Paul, N.; Pleune, M.; Chung, C.-J. Autonomous Human-Vehicle Leader-Follower Control Using Deep-Learning-Driven Gesture Recognition. Vehicles 2022, 4, 243–258. [Google Scholar] [CrossRef]
  14. Thomas, M.; Farid, M. Automatic Car Counting Method for Unmanned Aerial Vehicle Image. IEEE Trans. Geosci. Remote Sens. 2014, 3, 1635–1647. [Google Scholar]
  15. Liu, K.; Mattyus, G. Fast multi-class vehicle detection on aerial images. IEEE Geosci. Remote Sens. Lett. 2015, 12, 1938–1942. [Google Scholar]
  16. Shengjie, Z.; Jinghong, L.; Yang, T.; Yujia, Z.; Chenglong, L. Rapid Vehicle Detection in Aerial Images under the Complex Background of Dense Urban Areas. Remote Sens. 2022, 14, 2088. [Google Scholar]
  17. Xungen, L.; Feifei, M.; Shuaishuai, L.; Xiao, J.; Mian, P.; Qi, M.; Haibin, Y. Vehicle Detection in Very-High-Resolution Remote Sensing Images Based on an Anchor-Free Detection Model with a More Precise Foveal Area. Int. J. Geo-Inf. 2021, 10, 549. [Google Scholar]
  18. Jiandan, Z.; Tao, L.; Guangle, Y. Robust Vehicle Detection in Aerial Images Based on Cascaded Convolutional Neural Networks. Sensors 2017, 17, 2720. [Google Scholar]
  19. Jaswanth, N.; Chinmayi, N.; Rolf, A.; Hrishikesh, V. A Progressive Review—Emerging Technologies for ADAS Driven Solutions. IEEE Trans. Intell. Veh. 2021, 1, 326–341. [Google Scholar]
  20. Kim, J.; Hong, S.; Kim, E. Novel On-Road Vehicle Detection System Using Multi-Stage Convolutional Neural Network. IEEE Access 2021, 9, 94371–94385. [Google Scholar]
  21. Kiho, L.; Kastuv, T. LIDAR: Lidar Information based Dynamic V2V Authentication for Roadside Infrastructure-less Vehicular Networks. In Proceedings of the 2019 16th IEEE Annual Consumer Communications & Networking Conference (CCNC), Las Vegas, NV, USA, 11–14 January 2019. [Google Scholar]
  22. Aldrich, R.; Wickramarathne, T. Low-Cost Radar for Object Tracking in Autonomous Driving: A Data-Fusion Approach. In Proceedings of the 2018 IEEE 87th Vehicular Technology Conference (VTC Spring), Porto, Portugal, 3–6 June 2018. [Google Scholar]
  23. Kwang-ju, K.; Pyong-kun, K.; Yun-su, C.; Doo-hyun, C. Multi-Scale Detector for Accurate Vehicle Detection in Traffic Surveillance Data. IEEE Access 2019, 7, 78311–78319. [Google Scholar]
  24. Khatab, E.; Onsy, A.; Varley, M.; Abouelfarag, A. Vulnerable objects detection for autonomous driving: A review. Integration 2021, 78, 36–48. [Google Scholar] [CrossRef]
  25. Saeed, A.; Salman, K.; Nick, B. A Deep Journey into Super-resolution: A Survey. ACM Comput. Surv. 2020, 53, 1–34. [Google Scholar]
  26. Yogendra Rao, M.; Arvind, M.; Oh-Seol, K. Single Image Super-Resolution Using Deep Residual Network with Spectral Normalization. In Proceedings of the 17th International Conference on Multimedia Technology and Applications (MITA), Jeju, Republic of Korea, 6–7 June 2021. [Google Scholar]
  27. Yogendra Rao, M.; Oh-Seol, K. Deep residual dense network for single image super-resolution. Electronics 2021, 10, 555. [Google Scholar]
  28. Ivan, G.A.; Rafael Marcos, L.B.; Ezequiel, L.R. Improved detection of small objects in road network sequences using CNN and super resolution. Expert Syst. 2021, 39, e12930. [Google Scholar]
  29. Sheng, R.; Jianqi, L.; Tianyi, T.; Yibo, P.; Jian, J. Towards Efficient Video Detection Object Super-Resolution with Deep Fusion Network for Public Safety. Wiley 2021, 1, 9999398. [Google Scholar]
  30. Xinqing, W.; Xia, H.; Feng, X.; Yuyang, L.; Xiaodong, H.; Pengyu, S. Multi-Object Detection in Traffic Scenes Based on Improved SSD. Electronics 2018, 7, 302. [Google Scholar]
  31. Luc, C.; Minh-Tan, P.; Sebastien, L. Small Object Detection in Remote Sensing Images Based on Super-Resolution with Auxiliary Generative Adversarial Networks. Remote Sens. 2020, 12, 3152. [Google Scholar]
  32. Yunyan, W.; Huaxuan, W.; Luo, S.; Chen, P.; Zhiwei, Y. Detection of plane in remote sensing images using super-resolution. PLoS ONE 2022, 17, 0265503. [Google Scholar]
  33. Mostofa, M.; Ferdous, S.; Riggan, B.; Nasrabadi, N. Joint-SRVDNet: Joint Super Resolution and Vehicle Detection Network. IEEE Access 2020, 8, 82306–82319. [Google Scholar] [CrossRef]
  34. Dong, C.; Loy, C.C.; He, K.; Tang, X. Image super-resolution using deep convolutional networks. IEEE Trans. Pattern Anal. Mach. Intell. 2015, 38, 295–307. [Google Scholar] [CrossRef] [Green Version]
  35. Chao, D.; Chen, C.L.; Xiaoou, T. Accelerating the Super-Resolution Convolutional Neural Network. In Proceedings of the 14th European Conference on Computer Vision (ECCV), Amsterdam, The Netherlands, 8–16 October 2016. [Google Scholar]
  36. Zhaowen, W.; Ding, L.; Jianchao, Y.; Wei, H.; Thomas, H. Deep Networks for Image Super-Resolution with Sparse Prior. In Proceedings of the 2015 IEEE International Conference on Computer Vision (ICCV), Santiago, Chile, 7–13 December 2015. [Google Scholar]
  37. Simonyan, K.; Zisserman, A. Very deep convolutional networks for large-scale image recognition. In Proceedings of the CVPR 2015, Boston, MA, USA, 7–12 June 2015. [Google Scholar]
  38. Wei-Sheng, L.; Jia-Bin, H.; Narendra, A.; Ming-Hsuan, Y. Deep Laplacian Pyramid Networks for Fast and Accurate Super-Resolution. In Proceedings of the 2017 IEEE Conference on Computer Vision and Pattern Recognition (CVPR), Honolulu, HI, USA, 21–26 July 2017. [Google Scholar]
  39. Bee, L.; Sanghyun, S.; Heewon, K.; Seungjun, N.; Kyoung Mu, L. Enhanced Deep Residual Networks for Single Image Super-Resolution. In Proceedings of the IEEE Conference on computer Vision and Pattern Recognition (CVPR), Honolulu, HI, USA, 21–26 June 2017. [Google Scholar]
  40. Krizhevsky, A.; Sutskever, I.; Hinton, G.E. ImageNet classification with deep convolutional neural networks. Commun. ACM 2017, 60, 84–90. [Google Scholar] [CrossRef] [Green Version]
  41. Wazir, M.; Supavadee, A. Multi-Scale Inception Based Super-Resolution Using Deep Learning Approach. Electronics 2019, 8, 892. [Google Scholar]
  42. Yan, L.; Guangrui, Z.; Hai, W.; Wei, Z.; Min, Z.; Hongbo, Q. An efficient super-resolution network based on aggregated residual transformations. Electronics 2019, 8, 339. [Google Scholar]
  43. Xie, S.; Girshick, R.; Dollár, P.; Tu, Z.; He, K. Aggregated residual transformations for deep neural networks. In Proceedings of the Computer Vision and Pattern Recognition (CVPR), Honolulu, HI, USA, 21–26 June 2017. [Google Scholar]
  44. Zhiqian, C.; Kai, C.; James, C. Vehicle and Pedestrian Detection Using Support Vector Machine and Histogram of Oriented Gradients Features. In Proceedings of the 2013 International Conference on Computer Sciences and Applications, Wuhan, China, 14–15 December 2013. [Google Scholar]
  45. Zahid, M.; Nazeer, M.; Arif, M.; Imran, S.; Fahad, K.; Mazhar, A.; Uzair, K.; Samee, K. Boosting the Accuracy of AdaBoost for Object Detection and Recognition. In Proceedings of the 2016 International Conference on Frontiers of Information Technology (FIT), Islamabad, Pakistan, 19–21 December 2016. [Google Scholar]
  46. Silva, R.; Rodrigues, P.; Giraldi, G.; Cunha, G. Object recognition and tracking using Bayesian networks for augmented reality systems. In Proceedings of the Ninth International Conference on Information Visualization (IV’05), London, UK, 6–8 July 2005. [Google Scholar]
  47. Qi, Z.; Wang, L.; Xu, Y.; Zhong, P. Robust Object Detection Based on Decision Trees and a New Cascade Architecture. In Proceedings of the 2008 International Conference on Computational Intelligence for Modelling Control & Automation, Vienna, Austria, 10–12 December 2008. [Google Scholar]
  48. Fica Aida, N.; Purwalaksana, A.; Manalu, I. Object Detection of Surgical Instruments for Assistant Robot Surgeon using KNN. In Proceedings of the 2019 International Conference on Advanced Mechatronics, Intelligent Manufacture and Industrial Automation (ICAMIMIA), Batu, Indonesia, 9–10 October 2019. [Google Scholar]
  49. Liu, Z.; Xiong, H. Object Detection and Localization Using Random Forest. In Proceedings of the 2012 Second International Conference on Intelligent System Design and Engineering Application, Sanya, China, 6–7 January 2012. [Google Scholar]
  50. Girshick, R.; Donahue, J.; Darrell, T.; Malik, J. Rich feature hierarchies for accurate object detection and semantic segmentation. In Proceedings of the 2014 IEEE Conference on Computer Vision and Pattern Recognition (CVPR), Columbus, OH, USA, 23–28 June 2014. [Google Scholar]
  51. Girshick, R. Fast R-CNN. In Proceedings of the 2015 IEEE International Conference on Computer Vision (ICCV), Santiago, Chile, 18 February 2016. [Google Scholar]
  52. Ren, S.; He, K.; Girshick, R.; Sun, J. Faster R-CNN: Towards Real-Time Object Detection with Region Proposal Networks. IEEE Trans. Pattern Anal. Mach. Intell. 2017, 39, 1137–1149. [Google Scholar] [CrossRef] [PubMed] [Green Version]
  53. Redmon, J.; Divvala, S.; Girishick, R.; Farhadi, A. You Only Look Once: Unified, Real-Time Object Detection. In Proceedings of the 2016 IEEE Conference on Computer Vision and Pattern Recognition (CVPR), Las Vegas, NV, USA, 27–30 June 2016. [Google Scholar]
  54. Redmon, J.; Farhadi, A. YOLO9000: Better, Faster, Stronger. In Proceedings of the 2017 IEEE Conference on Computer Vision and Pattern Recognition (CVPR), Honolulu, HI, USA, 21–26 July 2017. [Google Scholar]
  55. Redmon, J.; Farhadi, A. YOLOv3: An Incremental Improvement. arXiv 2018, arXiv:1804.02767. [Google Scholar]
  56. Bochkovskiy, A.; Wang, C.-Y.; Mark Liao, H.-Y. YOLOv4: Optimal Speed and Accuracy of Object Detection. arXiv 2020, arXiv:2004.10934. [Google Scholar]
  57. Wang, C.-Y.; Bochkovskiy, A.; Mark Liao, H.-Y. Scaled-YOLOv4: Scaling Cross Stage Partial Network. arXiv 2020, arXiv:2011.08036. [Google Scholar]
  58. Yingfeng, C.; Tianyu, L.; Hongbo, G.; Hai, W.; Long, C.; Yicheng, L.; Miguel, S.; Zhixiong, L. YOLOv4-5D: An Effective and Efficient Object Detector for Autonomous Driving. IEEE Trans. Instrum. Meas. 2021, 70, 4503613. [Google Scholar]
  59. Lian, J.; Yin, Y.; Li, L.; Wang, Z.; Zhou, Y. Small Object Detection in Traffic Scenes based on Attention Feature Fusion. Sensors 2021, 21, 3031. [Google Scholar] [CrossRef] [PubMed]
  60. Timofte, R.; Agustsson, E.; Van Gool, L.; Yang, M.-H.; Zhang, L.; Lim, B.; Son, S.; Kim, H.; Nah, S.; Lee, K.M. Ntire 2017 challenge on single image super-resolution: Methods and results. In Proceedings of the Computer Vision and Pattern Recognition (CVPR), Honolulu, HI, USA, 21–26 June 2017. [Google Scholar]
  61. Bevilacqua, M.; Roumy, A.; Guillemot, C.; Alberi-Morel, M.L. Low-complexity single-image super-resolution based on nonnegative neighbor embedding. In Proceedings of the 23rd British Machine Vision Conference Location (BMVC), Guildford, UK, 3–7 September 2012. [Google Scholar]
  62. Timofte, R.; De Smet, V.; Van Gool, L. A+: Adjusted anchored neighborhood regression for fast super-resolution. In Proceedings of the Asian Conference on Computer Vision (ACCV), Singapore, 1–2 November 2014. [Google Scholar]
  63. Martin, D.; Fowlkes, C.; Tal, D.; Malik, J. A database of human segmented natural images and its application to evaluating segmentation algorithms and measuring ecological statistics. In Proceedings of the 8th international Conference of Computer Vision (ICCV), Vancouver, BC, Canada, 7–14 July 2001. [Google Scholar]
  64. Huang, J.B.; Singh, A.; Ahuja, N. Single image super-resolution from transformed self-exemplars. In Proceedings of the Computer Vision and Pattern Recognition (CVPR), Boston, MA, USA, 8–10 June 2015. [Google Scholar]
  65. Horé, A.; Ziou, D. Image quality metrics: PSNR vs. SSIM. In Proceedings of the 20th International Conference on Pattern Recognition, ICPR 2010, Istanbul, Turkey, 23–26 August 2010. [Google Scholar]
  66. Venkatanath, N.; Praneeth, D.; Chandrasekhar, B.M.; Channappayya, S.S.; Medasani, S.S. Blind Image Quality Evaluation Using Perception Based Features. In Proceedings of the 21st National Conference on Communications (NCC), Mumbai, India, 27 February–1 March 2015. [Google Scholar]
  67. Chen, C.; Zhong, J.; Tan, Y. Multiple-oriented and small object detection with convolutional neural networks for aerial image. Remote Sens. 2019, 11, 2176. [Google Scholar] [CrossRef]
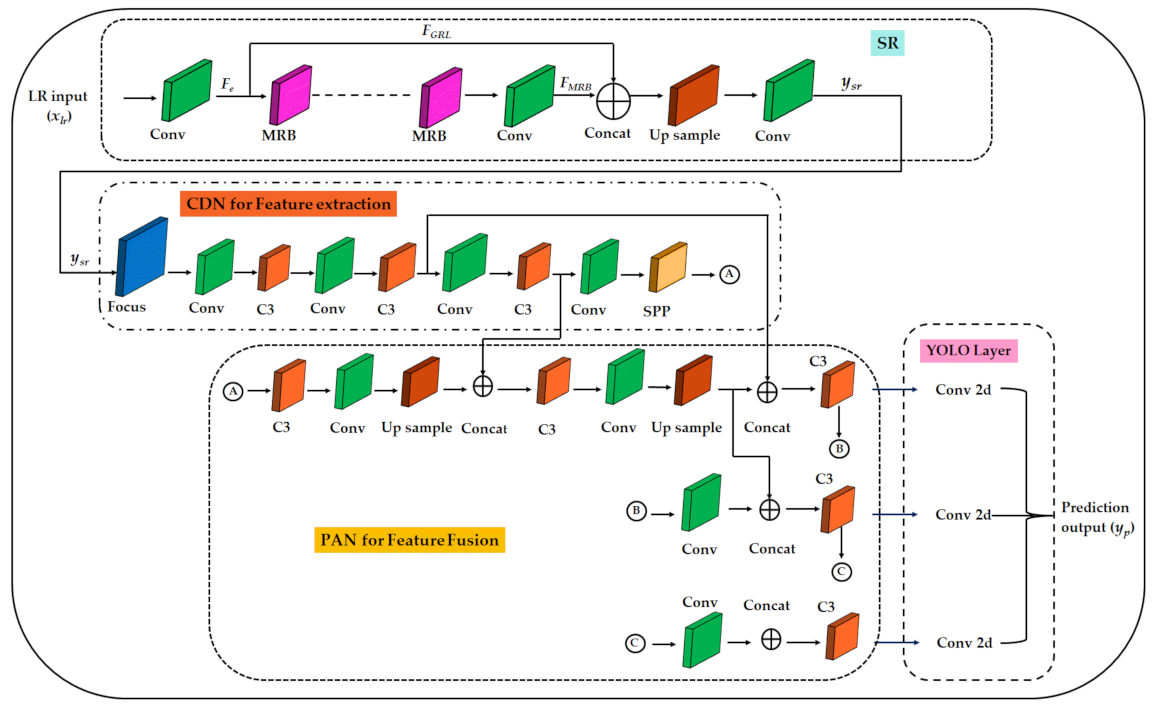
Figure 1. Proposed object detection network based on SR (SRODNet) for autonomous vehicles.
Remotesensing 14 06270 g001
Figure 2. Structure of modified residual block for SR model.
Remotesensing 14 06270 g002
Figure 3. Visual comparisons: VISIBLE images from VEDAI-VISIBLE dataset.
Remotesensing 14 06270 g003
Figure 4. Visual comparisons: IR images from VEDAI-IR dataset.
Remotesensing 14 06270 g004
Figure 5. Visual comparisons: aerial images from the DOTA dataset.
Remotesensing 14 06270 g005
Figure 6. Precision, recall, and mAP @ 0.5 curves on various datasets, such as VEDAI-VISIBLE and VEDAI-IR: (a,b) P-curves, (c,d) R-curves, and (e,f) mAP @ 0.5.
Remotesensing 14 06270 g006
Figure 7. Precision, recall, and mAP @ 0.5 curves on various datasets, such as KoHT and DOTA: (a,b) P-curves, (c,d) R-curves, and (e,f) mAP @ 0.5.
Remotesensing 14 06270 g007
Figure 8. Various object detection results on aerial images of the DOTA dataset.
Remotesensing 14 06270 g008
Figure 9. Visual results of detection performance on aerial images on VEDAI dataset: (a) VEDAI-VISIBLE, and (b) VEDAI-IR.
Remotesensing 14 06270 g009
Figure 10. Various object detection results in different scenarios on K-roads.
Remotesensing 14 06270 g010
Table 1. Experimental hardware and software configurations.
S. NoComponentSpecification
1CPUIntel Xenon Silver 4214R
2RAM512 GB
3GPUNVIDIA 2x RTX A6000
4Operating SystemWindows 10 Pro.10.0.19042, 64 bit
5CUDACUDA 11.2 with Cudnn 8.1.0
6Data ProcessingPython 3.9, OpenCV 4.0
7Deep Learning FrameworkPytorch 1.7.0
Table 2. Quantitative evaluation of the public benchmark test results of the PSNR/SSIM of Scale 4.
DatasetsSet 5 [61]Set 14 [62]BSD 100 [63]Urban 100 [64]
S. NoArchitecturePSNRSSIMPSNRSSIMPSNRSSIMPSNRSSIM
1Bicubic [35]28.430.810926.000.702325.960.667823.140.6574
2SRCNN [35]30.480.862827.500.751326.900.710324.520.7226
3FSRCNN [25]30.700.865727.590.753526.960.712824.600.7258
4SCN [25]30.390.862027.480.751026.870.71024.520.725
5VDSR [37]31.350.883828.020.767827.290.725225.180.7525
6DRCN [25]31.530.885428.030.767327.240.723325.140.7511
7LapSRN [25]31.540.886628.090.769427.320.726425.210.7553
8SRGAN [25]32.050.891028.530.780427.570.735426.070.7839
9EDSR [39] (simulated)32.310.882928.800.769328.600.748026.400.7805
10Proposed model32.350.883528.830.770428.590.748226.340.7796
Table 3. Comparison of SR architectures based on up-sampled (4×) aerial datasets.
ArchitectureEDSR [39]Proposed Model
S. NoDatasetsPSNRSSIMPIQEPSNRSSIMPIQE
1VEDAI-VISIBLE29.5430.685777.68729.5200.685376.573
2VEDAI-IR32.0400.744278.23032.0400.744378.160
3DOTA26.9830.733872.46926.9540.731667.444
4KoHT27.5070.820993.87927.4380.820193.631
Table 4. Comparative detection performance in terms of mean average precision (mAP) and F1-score of the proposed model and existing state-of-the-art approaches.
DatasetVEDAI-VISIBLEVEDAI-IRDOTAKoHT
ArchitecturemAP @ 0.5F1 ScoremAP @ 0.5F1 ScoremAP @ 0.5F1 ScoremAP @ 0.5F1 Score
Ren, et al. (Z and F) [46]32.000.212------
Girishik, et al. (VGG-16) [51]37.300.224------
Ren, et al. (VGG-16) [46]40.900.225------
Zhong, et al. [67]50.200.305------
Chen, et al. [18]59.500.451------
YOLOv3_SRGAN_512 [33]62.450.59170.100.68786.180.837--
YOLOv3_MsSRGAN_512 [33]66.740.64374.610.72387.020.859--
YOLOv3_EDSR [39]74.320.75470.620.72791.470.88991.460.926
SRODNet (ours)81.380.81979.820.80092.080.89293.020.928
Table 5. Comparison of speed performance of the proposed and existing models.
ArchitectureHardwareSpeedModel
Parameters
S. NoModelGFLOP’sInferenceTraining (hours)
VEDAI-VSIRKoHTDOTA(s)VISIBLEIRKoHTDOTA(million)
1YOLOv3_GT [55]154.8154.8154.8154.60.0140.4020.4001.1510.396~61.51
2YOLOv3_ EDSR [39]154.8154.8154.8154.60.0130.4030.3961.1500.396~104.6
3SRODNet (ours)15.815.816.415.80.0100.1430.1400.3820.140~24.62
Publisher’s Note: MDPI stays neutral with regard to jurisdictional claims in published maps and institutional affiliations.