Article

DSM Generation from Multi-View High-Resolution Satellite Images Based on the Photometric Mesh Refinement Method

1
College of Geodesy and Geomatics, Shandong University of Science and Technology, Qingdao 266590, China
2
College of Oceanography and Space Informatics, China University of Petroleum (East China), Qingdao 266580, China
*
Author to whom correspondence should be addressed.
Remote Sens. 2022, 14(24), 6259; https://doi.org/10.3390/rs14246259
Submission received: 13 November 2022 / Revised: 7 December 2022 / Accepted: 8 December 2022 / Published: 10 December 2022
(This article belongs to the Special Issue Computer Vision-Based Methods and Tools in Remote Sensing)

Abstract

:
Automatic reconstruction of DSMs from satellite images is a hot issue in the field of photogrammetry. Nowadays, most state-of-the-art pipelines produce 2.5D products. In order to solve some shortcomings of traditional algorithms and expand the means of updating digital surface models, a DSM generation method based on variational mesh refinement of satellite stereo image pairs to recover 3D surfaces from coarse input is proposed. Specifically, the initial coarse mesh is constructed first and the geometric features of the generated 3D mesh model are then optimized by using the information of the original images, while the 3D mesh subdivision is constrained by combining the image’s texture information and projection information, with subdivision optimization of the mesh model finally achieved. The results of this method are compared qualitatively and quantitatively with those of the commercial software PCI and the SGM method. The experimental results show that the generated 3D digital surface has clearer edge contours, more refined planar textures, and sufficient model accuracy to match well with the actual conditions of the ground surface, proving the effectiveness of the method. The method is advantageous for conducting research on true 3D products in complex urban areas and can generate complete DSM products with the input of rough meshes, thus indicating it has some development prospects.

Graphical Abstract

1. Introduction

A digital surface model (DSM) is a series of point clouds or a mesh model with three-dimensional coordinates that represent the undulations of the surface (including artificial buildings, vegetation, etc.). It is an important data source for making true digital orthophoto maps (TDOM), extracting digital elevation models (DEMs), updating geographic information databases, and extracting buildings and generating contour lines in the process of producing map products [1,2,3,4]. Most of the current methods for generating DSMs are based on photogrammetry and involve acquiring the corresponding points in airborne images before then relying on image-matching techniques to complete the generation of the DSM. However, most reconstruction pipelines are usually based on pairwise images and point cloud fusion (such as S2P [5], ASP [6], and so on), do not take full advantage of multi-view data, and generally require fusion of point clouds to obtain better results. In addition to traditional dense matching methods facing window size adaptation problems, there are also implied intra-window parallax consistency limitations [7]. The method represented by semi-global matching (SGM) achieves a compromise between quality and cost, but its computational cost and memory overhead are large and depend on the maximum parallax search range and the number of pixels in the image [8].
Remarkable progress has been made in dense geometry reconstruction from aerial images. However, the satellite domain has been much less studied than the traditional pinhole camera model, probably because of the limited availability of high-resolution data. Along with the increased availability of satellite data, the use of satellite data for 3D reconstruction and other aspects is gaining more and more attention [9,10,11,12,13,14].
Most reconstruction schemes adopt the process of dense matching first and then depth map fusion [15,16,17,18,19]. Recently, there have been more and more mesh reconstruction studies based on satellite images, but due to the computational efficiency and cost, many studies are based on the SGM algorithm or its variants. The SGM algorithm was first released in 2011 and performed well on ISPRS test data [20]. After that, Gong, K. et al. used the hierarchical method of the SGM to conduct experiments, further expanding the SGM algorithm [21]. Li, Y. S. et al. adopted an efficient hierarchical matching strategy, which significantly reduced the matching cost of the SGM algorithm [22]. Ghuffar, S. simplified the production process of DSMs by directly applying the SGM algorithm to voxel space [23]. De Francis et al. proposed the open-source project S2p, which performed well with benchmark satellite data [24]. Xu, Z. et al. proposed an improved SGM matching aggregation optimization constraint, which converts the matching aggregation formula into the optimization of the global energy function and uses the local solution of the energy function to strengthen disparity consistency between adjacent pixels [25]. In addition to the general SGM algorithm, Saeed, M. et al. combined image segmentation and 3D reconstruction and introduced a neural network to improve the SGM algorithm [26].
In addition to the above SGM algorithm and its variants, a layered segmentation method was proposed by Kim, S. et al., which subdivides the DSM geometrically; the results were compared to laser radar DSM products to illustrate the effectiveness of the method [27]. Krau ß, T. et al. introduced the computer vision method and proposed a pre-segmentation method, which uses parallax map and spectral information to enhance DSMs [28]. In addition, Zhang, L. et al. used the coarse-to-fine layered method combined with a variety of matching algorithms to complete the process of automatically generating DSMs from linear array images [29]. Eckert, S. et al. used different geometric model methods to compare the quality of DSM generation, and the results showed that there were advantages and disadvantages between different methods [30]. Hu, D. T. et al. used computer vision and a multi-image matching algorithm to generate DSMs with high accuracy [31]. Wang, W. et al. achieved low-cost DSM production based on slam technology [32]. Gong, K. et al. completed the DSM product reconstruction of multi-view satellite images through use of a semi-global matching method combined with a median filter [33]. Rongjun Qin et al. exploited the statistical depth fusion of multiple DSMs generated from individual stereo pairs [34].
Some other methods bypass traditional dense matching and depth map fusion processes (such as those of D’Angelo, P. and others), directly substituting the photometric cost into the three-dimensional space and directly estimating the DSM [35]. Wang, K. et al. estimated elevation values and combined the semantic information of other satellite images [36]. Pollard, T. et al. proposed a model based on probabilistic voxels to jointly reconstruct surface voxels and their corresponding texture information [37]. Some scholars have also used neural networks to carry out their research [38,39,40].
The study of mesh refinement is more common in pinhole models (UAV images or airborne images), and less research is available on satellites. Vu et al. proposed a mesh refinement method that constructs an energy function composed of texture transfer errors and smooth terms and optimized the mesh using the gradient descent method [41]. Li, S. W. et al. significantly improved the level of detail in their study [42]. Blaha, M. et al. proposed guiding the process of mesh subdivision through semantic segmentation [43]. Mesh segmentation and refinement algorithms have been less applied to satellite imagery. By applying mesh optimization algorithms to the field of satellite imagery, it becomes advantageous to carry out the generation of real scene products by easily updating existing meshes and DSM products. A new method for 3D reconstruction through mesh refinement is proposed, which applies the mesh refinement method to the satellite domain and guides the subdivision process by using image information. The proposed method maximizes the consistency of the photographs to recover the ground truth. It starts with an initial mesh, which is then refined by iteratively moving its vertices to reduce photometric errors for all images.

2. Methods

The basic fundamentals of photometric mesh refinement with frame sensors are presented in article [43]: When positioning the vertices of the mesh and transferring the texture from image i to image j, their textures should match each other. As long as the textures do not correspond, they generate a gradient which can be propagated through the sensor model to obtain each gradient of every vertex. Finally, define the direction where it is supposed to be positioned to increase photometric similarity. Iterative calculation via gradient descent then obtains a refined mesh with maximal photometric similarity and minimal photometric reprojection error.
The actual standard for modeling object-to-image space mapping for satellite images is RPC (or RFM). In this paper, a photometric refinement algorithm based on frame sensors is extended to a mesh refinement framework based on linear array satellite images. The overall technical flow chart is shown in Figure 1. The basic framework and the adaptation are described in the following paragraph.
(1) Construction of the energy function is based on the RPC model. (2) Subdivision of the mesh with a triangulation projection area threshold and a texture complexity threshold is performed. (3) The gradient descent method is used to solve and limit the moving step to optimize the solution process. (4) By refining the original mesh, the vertices are driven to move closer to the actual position corresponding to the ground truth, and the x, y, and z coordinates are close to the 3D coordinates of the corresponding points in the real 3D world after the end of the iterative solution, which thus obtains the final optimization result. Moving step size is limited to optimize the solution process. At the same time, through continuous subdivision and refinement of the mesh, the original mesh is continuously optimized and the vertex is driven to move closer to the actual position in the corresponding research area. The x, y, and z coordinates are close to the 3D coordinate of the corresponding point in the real world, and the final refinement result is the DSM.

2.1. Construction of the Energy Function

The process of mesh refinement is actually the process of using image information to drive the motion of triangular mesh vertices, and this problem can be expressed by minimizing the energy function. The projection relationship between images is known, and one image can be projected onto other visible images after being induced by the mesh model. The energy function constructed from the image correlation coefficients drives the motion of the triangular mesh surface to the optimal position, and the motion of the triangular mesh vertices is also constrained by the regularization term.
(1) Energy function E consists of two parts. One is the data item E p h o t o , which is calculated according to the correlation between images. The other part is regularization terms E s m o o t h , which is based on first order Laplace and second order Laplace transforms. Data items rely on external energy to solve special problems, which is manifested in the process of 3D mesh optimization, that is, in the process of triangular mesh vertex driving. This allows for correlations between multi-view images to meet requirements and achieve the maximum degree of similarity. The purpose of the regularization term function is to provide smooth constraints for the optimization of a 3D mesh, which requires that the surface of the 3D mesh meets certain smoothness requirements. Therefore, according to the initial three-dimensional mesh and linear array satellite stereo image pair, the data energy term and smoothing energy term of the energy function are calculated, and the energy function expression is constructed as follows:
E ( S ) = E p h o t o ( S ) + λ E s m o o t h ( S )
S is a 3D mesh surface.
E p h o t o ( S ) is the energy function of the 3D mesh.
E s m o o t h ( S ) is the regularization term of the 3D mesh.
λ is the regularization term weight.
Zero normalized cross correlation (ZNCC) is used as the main index to calculate the energy term of photometric consistency, and the regularization term of gradient smoothing is calculated with Laplacian first-order and second-order degree as the main indexes.
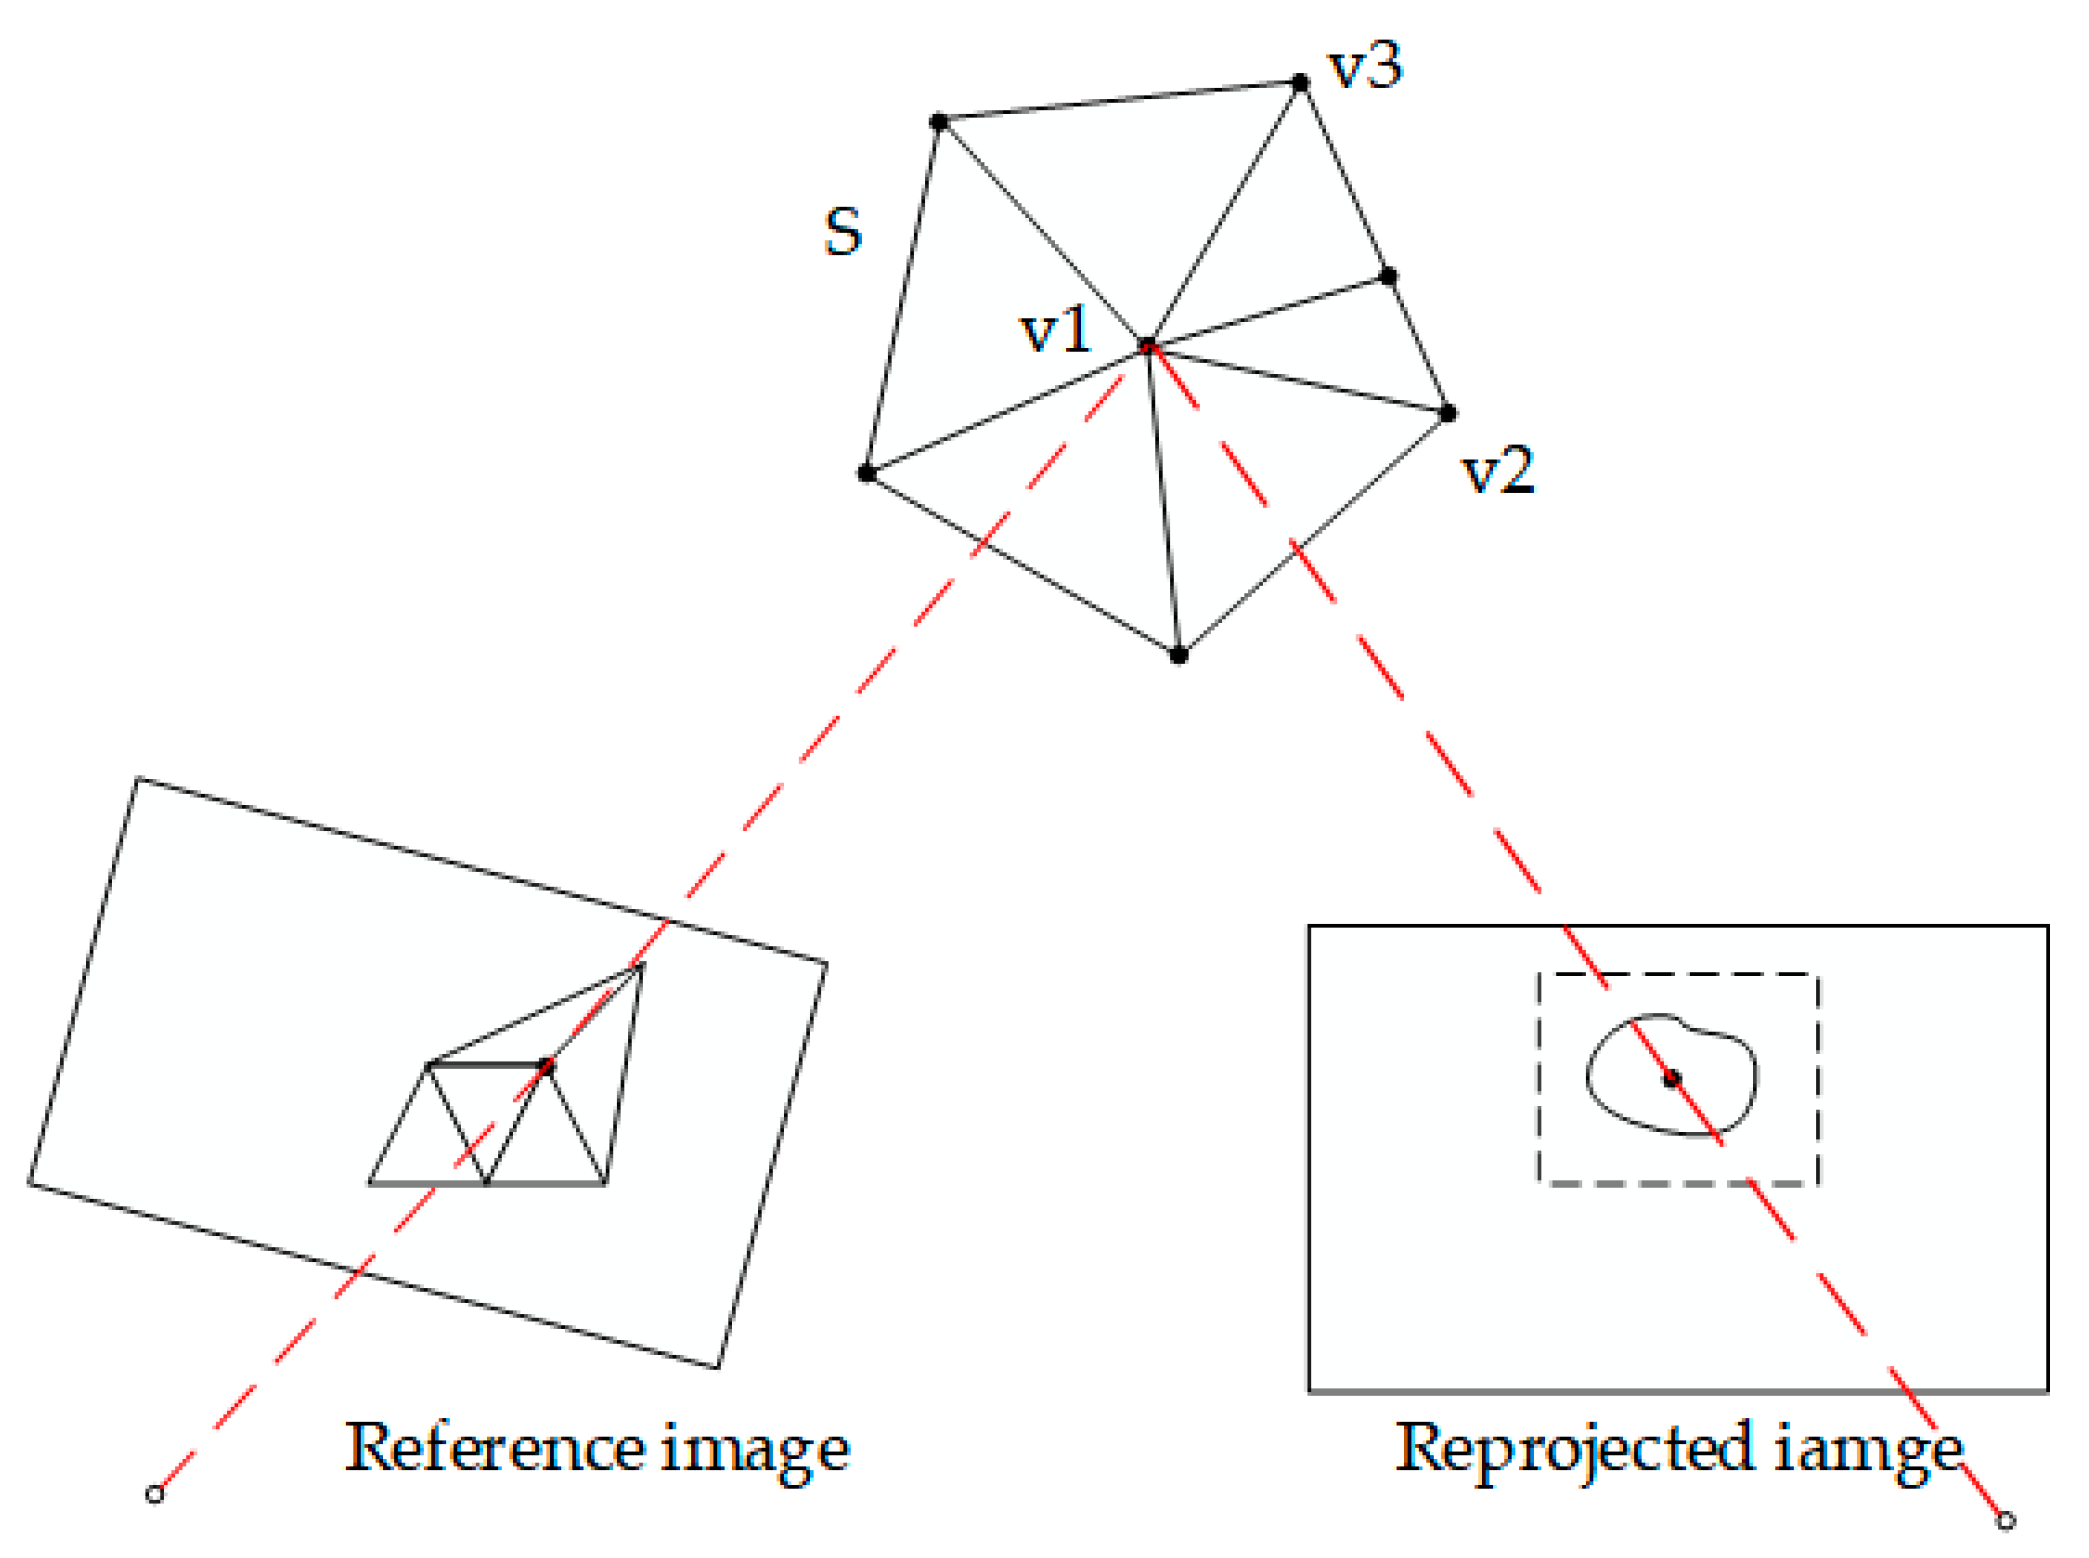
(2) The energy term of photometric consistency. Using ZNCC as the main index to calculate image similarity, the purpose is to measure the degree of deviation in a scene image when it is reprojected to another scene image through a three-dimensional mesh. As shown in Figure 2, when the vertex of the reference image is reprojected to another image through the mesh surface S, there is a reprojection error. Thus, the energy term of photometric consistency is constructed. The formula is as follows:
E p h o t o ( S ) = i , j Ω i , j S h ( I i , I i j S ) ( x i ) d x i
Among them, E p h o t o ( S ) is the energy term of the photometric consistency of the mesh surface in the energy function, and h ( I i , I i j S ) is used to measure the similarity between images I i and images I j . I i j S = Π i 1 Π j I j , which indicates that image I j is reprojected to image I i through surface S . Although the initial input mesh is rough, it is a basically correct platform generated by dense matching. Therefore, it is effective for vertex driving and energy function composition when reprojecting one scene image to another by means of reprojection. Π i 1 indicates that image I j is reprojected onto I i through surface S , and Π j indicates that image I j is reprojected onto S . I i and I j represents a pair of visible stereoscopic images on the surface.
(3) The regularization term E s m o o t h ( S ) . This term penalizes strong bending, not large surface area:
E s m o o t h ( S ) = S ( k 1 2 + k 2 2 ) d S
where k 1 and k 2 are the principal curvatures of the surface at the considered point. The above equation can be described as:
E f a i r ( V i ) = | ξ 1 Δ V i + ξ 1 Δ 2 V | 2 / τ 2
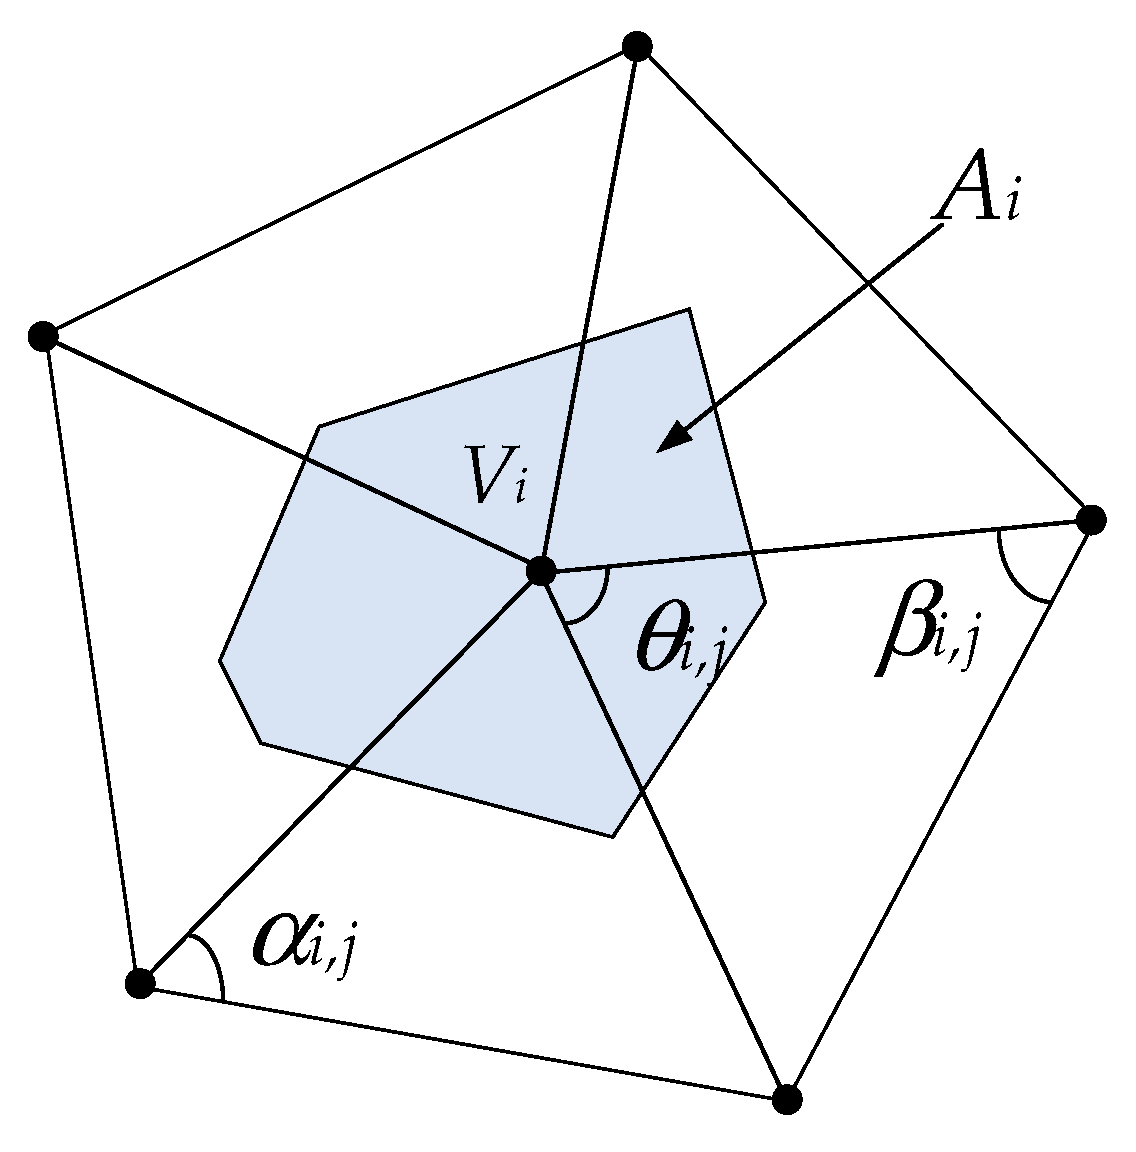
Δ ( V i ) = 1 2 A i V j N 1 ( V i ) ( cot α i , j + cot β i , j ) ( V j V i )
Δ 2 ( V i ) = 1 2 A i V j N 1 ( V i ) ( cot α i , j + cot β i , j ) ( Δ ( V j ) Δ ( V i ) )
where V i is the vertex in the mesh, τ is the average of all edge lengths in the mesh, ξ 1 and ξ 2 are the coefficients, and Δ is the Laplacian operator. The discrete operation in the mesh is shown in Equations (5) and (6), and Figure 3. A i is the area of the Voronoi diagram corresponding to vertex V i , and N l ( V i ) is the vertex in the first-order neighborhood of vertex V i .

2.2. Vertex Optimization Process

When considering only the data energy of the two visible images I m and I n , the correlation function between the two images can be expressed by ZNCC. The equation E p h o t o ( S ) = i , j Ω i , j S h ( I m , I m n S ) ( x i ) d x i expresses the data energy between the two images, and by taking the partial derivative of x i for this image point, we can obtain:
E d a t a ( I m , I n ) = lim h ( I m , I m n S + ε δ I m n S ) ε = Ω S 2 h ( I m , I m n S ) ( p i ) δ I m n S ( p i ) d p i
When the image point x i on image I m corresponds to a point on surface S , denoted as V x i , the projection points of the object point on the image (m,n) according to the projection relationship are expressed as follows: x i = Π m ( V x i ) ,   p s = Π n ( V x i ) . Considering the relationship between the resolution of the image point and the object point, as shown in Figure 4, d i is the vector connecting the projection center of image I m and the object point V x i , Z i is the depth value of object point V x i in image I m , and N is the normal vector of object surface S at point V x i . Therefore, the following relation between the image point and the object point can be obtained:
d x i = N T d m d V x i / Z m
The symbol f m , n ( x i ) = 2 h ( I m , I m n S ) ( x i )   δ I n ( x s )   δ Π n ( V x i )   d m , with the gradient of the data energy of the two visual images at the object point represented by V x i , is defined as:
E d a t a ( I m , I n ) ( V x i ) = [ 2 h ( I m , I m n S ) ( x i )   δ I n ( x s )   δ Π n ( V x i ) d m Z m ] N = f m , n ( x i ) N Z m
Optimization of the 3D mesh model is achieved by driving the vertex V k motion of the triangulated mesh, and the direction of vertex motion is constrained to the normal vector N. When considering all visible images and partial derivatives, the vertices of the mesh are as follows:
d E d a t a ( V k ) d V k = m , n ω m n Ω S ϕ k ( x i ) f m , n ( x i ) N Z m d V p i = m , n ω m n Ω S ϕ k ( x i ) f m , n ( x i ) N Z m Z m N T d i d x i = m , n ω m n Ω S ϕ k ( x i ) f m , n ( x i ) N N T d i d x i
The above geometric relationship is based on depth Z and ray d, the latter is simulated in Section 2.3. As for depth, (10) is in fact independent of the absolute length dm = |dm|. For the variation in image space coordinates, x i , due to the large focal length of the satellite image, the denominator can be approximated as 1/z instead.

2.3. Simulation of Light

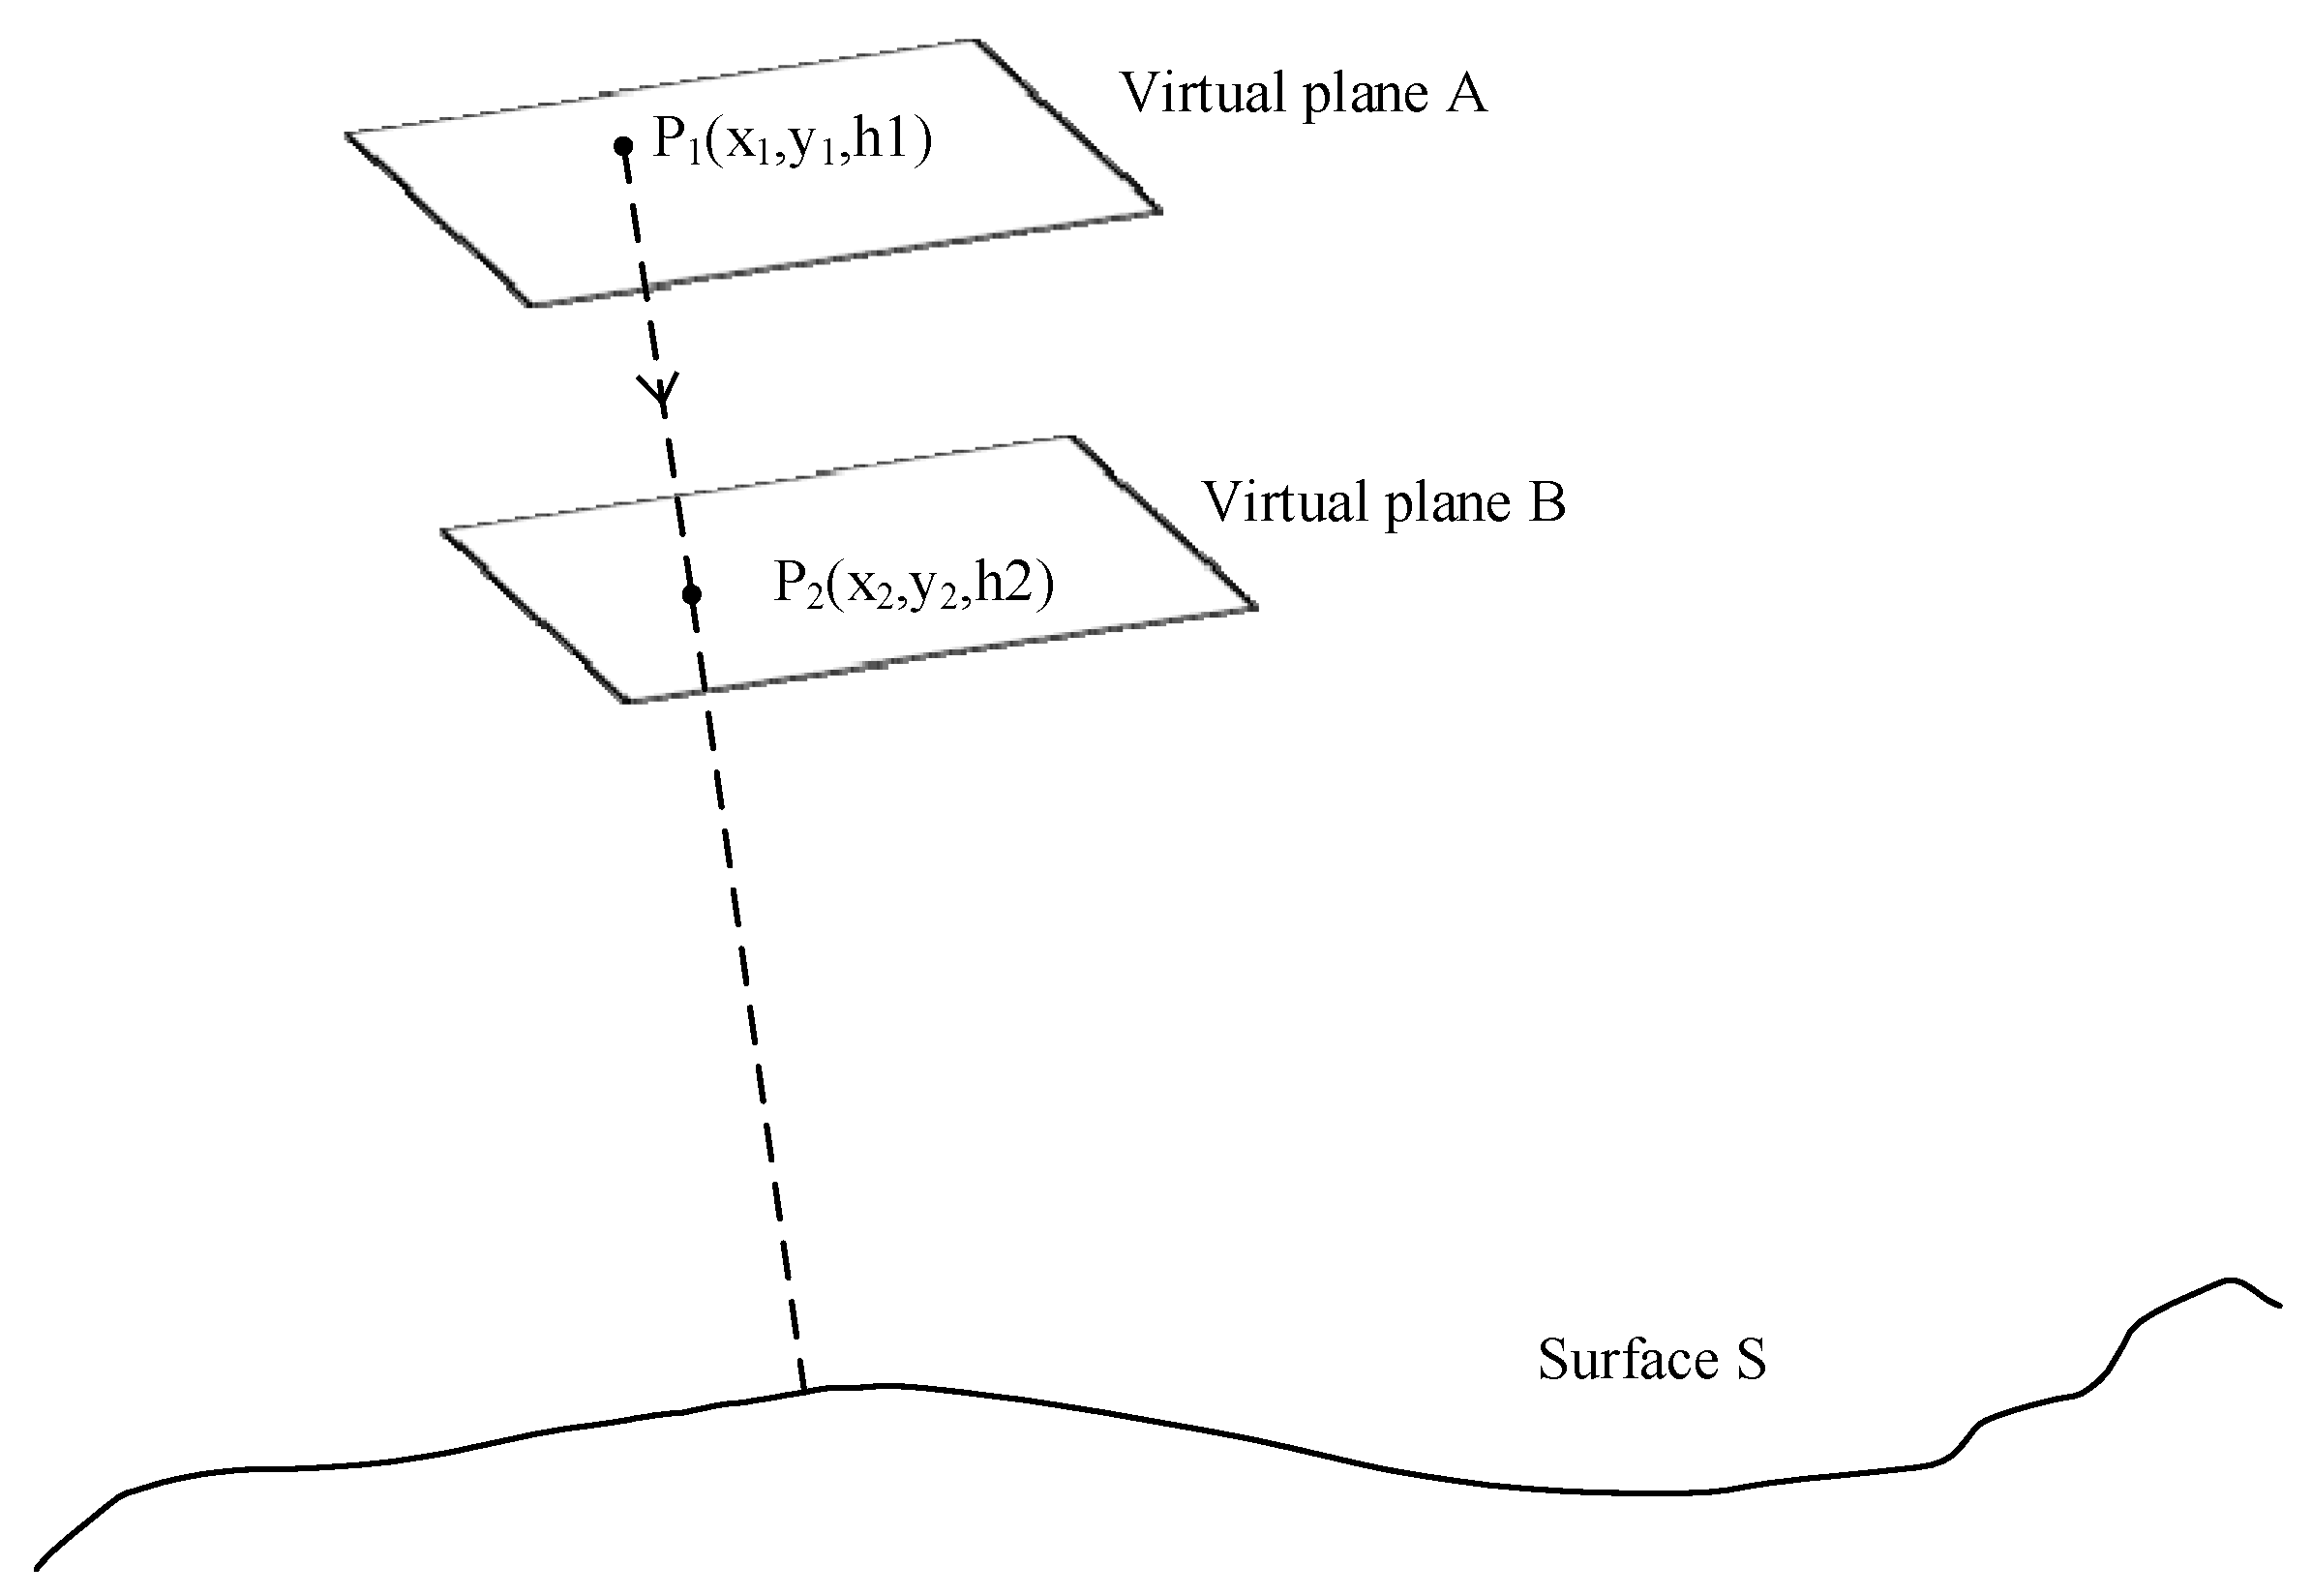
In the calculation of h ( I i , I i j S ) ( x i ) , image I j needs to be reprojected onto image I i through surface S . This involves a ray casting process, which is required to simulate ray direction. The direction of light as defined by two virtual planes is denoted as A and B, which are h 1 and h 2 away from the ground. The pixels of multi-view satellite images are projected to these two virtual planes by an RPC model. In this way, each pixel corresponds to two virtual points, p 1 ( x 1 , y 1 , h ) and p 2 ( x 2 , y 2 , h 2 ) , on two virtual planes. The ray direction corresponding to the pixel can be then expressed as R a y d i r e c t i o n = p 1 p 2 = ( x 1 x 2 , y 1 y 2 , h 2 h 1 ) . The schematic diagram is shown in Figure 5.

2.4. Reformulation of the Jacobian Matrix

In order to adapt to the projection form of the RPC model, its Jacobian matrix, J , needs to be adjusted. Let U = B L o n O f f L o n S c a l e , V = L L a t O f f L a t S c a l e , and W = H H e i O f f H e i S c a l e . These are the normalized geographical coordinates of the object point (B,L,H). N L , N S , D L , and D S each contains 20 RPC coefficients. P ( U , V , W ) is a 20-dimensional vector containing a cubic polynomial. The coordinates of image points can then be expressed as follows:
[ x y ] = [ N S T P ( U , V , W ) D S T P ( U , V , W ) × S a m p l e S c a l e + S a m p l e O f f N L T P ( U , V , W ) D L T P ( U , V , W ) × L i n e S c a l e + L i n e O f f ]
J ( B , L , H ) = [ S a m p l e S c a l e × N S T P D S T L o n S c a l e × ( D S T P ) 2 ( P U ) S a m p l e S c a l e × N S T P D S T L a t S c a l e × ( D S T P ) 2 ( P V ) S a m p l e S c a l e × N S T P D S T H e i g h t S c a l e × ( D S T P ) 2 ( P H ) L i n e S c a l e × N L T P D L T L o n S c a l e × ( D L T P ) 2 ( P U ) L i n e S c a l e × N L T P D L T L a t S c a l e × ( D L T P ) 2 ( P V ) L i n e S c a l e × N L T P D L T H e i g h t S c a l e × ( D L T P ) 2 ( P H ) ]

2.5. Subdivision of the Mesh

When projecting a triangular facet, if the number of corresponding pixels exceeds the threshold, or texture complexity exceeds the subdivision threshold, the triangle is divided. The next step is to take the midpoint of each edge as a new vertex and divide the original triangle into four new triangles. The purpose is to realize subdivision of the mesh and make the details more perfect.

2.5.1. Projection Area Parameters of 3D Mesh Subdivision

The area parameter of the projection area is based on the projection relationship between the two-dimensional image and the three-dimensional mesh. When each triangular surface constituting the three-dimensional mesh is projected back to the image, each face corresponds to a series of points on the two-dimensional image, and the collection of points is the area parameter of the projection area. That is, according to the projection relationship, the corresponding points of each surface on multiple two-dimensional images are obtained; the sum of the corresponding points on each image is the projection subdivision parameter value of each face that constitutes the 3D mesh. Among these values, the maximum value is taken as the projection area value for 3D mesh subdivision.

2.5.2. Texture Complexity Parameters of 3D Mesh Subdivision

Calculation of texture complexity is based on the method proposed in reference [44], which is used to calculate the texture complexity of the result area obtained by hog (histograms of oriented gradients). Gradient direction histograms are a common feature used to describe the local texture of images [45] and are widely used in the field of computer vision and pattern recognition [46,47,48]. The computational complexity of each mesh is as follows:
1) For pixels on the image, the gradients g r a d _ x and g r a d _ y in the horizontal and vertical directions are first calculated using a Sobel gradient operator. The x’s direction of the pixels for gradient θ ( x ) can then be calculated. The direction range obtained is between [ 0 , 2 π ] .
2) A histogram of the gradient direction of the image should then needs to be obtained. The window size is set to n*n and divided into a bin. Based on the gradient direction histogram, texture complexity at pixel x is defined as:
Γ ( x ) = 1 γ + b = 1 B min ( H b ( x ) , H ¯ ( x ) ) γ + b = 1 B H b ( x ) = b = 1 B H b ( x ) b = 1 B min ( H b ( x ) , H ¯ ( x ) ) γ + b = 1 B H b ( x )
where H b ( x ) represents the frequency of the B bin in the histogram of gradient direction, H ¯ ( x ) represents the average frequency of all bin additions, and γ is a constant that prevents division overflow.
γ = 4 × K × K × α
Here, 4 is the normalization factor of gradient size based on the Sobel operator, K represents the window size at the time of calculation, and α is a self-set control quantity.

3. Results and Analysis

First, the method was tested on two QuickBird images to obtain successful results. Subsequently, two different test sites were selected from the MVS satellite benchmark. The details of implementation are illustrated in the Section 3.1. The details of the two-image program are illustrated in Section 3.2. The details of the test sites and the ground truth data are illustrated in Section 3.3.

3.1. Implementation Details

The overall implementation of pipelines is as follows:
First, before the refinement process, the pipelines need an initial mesh as the processing input. In this paper, a mesh is generated by using a conventional dense stereo matching technique and gridding the resulting 3D model by Poisson reconstruction.
Since the RPC model is a correspondence conversion between latitude and longitude and image coordinates, when this correspondence is used it needs to pre-process the coordinate system. For mesh refinement, it is not only easier but also numerically advantageous to operate in local Cartesian coordinates. In this paper, the geographic coordinates [B,L,H] are transformed into a quasi-local Cartesian coordinate system. In this paper, this is achieved by scaling the geographic coordinates to the unit level of elevation, H. Let [B,L,H] be the geographic coordinates of a point, and let [X, Y, H] be the corresponding coordinate in the quasi-Cartesian coordinate system. The method treats it simply as X = L × 108,000 , Y = B × 108,000 . The transformation simulates the Cartesian coordinate system locally, so that the Jacobi matrix from the space-like coordinate system to the local quasi-Cartesian coordinate system can be expressed as:
J ( B , L , H ) = [ B × α L × α 1 B × α L × α 1 ] J ( B , L , H )
Here, α = 108,000 and means element-wise multiplication.
By constructing a quasi-local Cartesian coordinate system, the latitude and longitude coordinates are converted to metric units (meters) so that the x, y, and elevation z units are unified. The refinement then enters an iterative process where the intensities of image i are reprojected onto surface S and then back into image j. The photometric similarity between two images is calculated by ZNCC. Next, according to the simulation of rays, the gradient of each vertex is obtained. In addition, a surface fairing term is added to penalize bending. After construction of the initial mesh, the displacement of each vertex by the gradient descent is obtained. This serves as the input of the next iteration. The basic form for construction of the energy function is described in the previous section (Section 2.1).
Third, the initial input for the iteration is the initial rough mesh, and the gradient descent method is used to obtain the optimal solution. The offset of each vertex of the triangle is calculated in each iteration, and the iteration is continued until the triangulation vertex moves to the optimal position close to the real situation of the surface. In the gradient descent method, the initial gradient is the set of all vertex gradients in the mesh, and each vertex is composed of coordinates in x, y, and z directions. In the process of solving this problem, the values of the x, y, and z directions change iteratively, which makes the coordinates of the vertices move continuously.
In the iterative solution process, in order to avoid missing the optimization result due to the excessive movement of a vertex in the triangulation, the amount of movement for each vertex must be limited. Taking the average edge length of the 3D mesh as the threshold, the movement of driving vertices is constrained to make each vertex move synchronously. The basic process is to calculate the side length of each triangulation that constitutes the whole three-dimensional mesh as the judgment basis of the limited step size. When movement in the x, y, and z directions is greater than the average side length of each triangle, movement (gradient variation) in the x, y, and z directions is limited to half of the average side length of the three-dimensional mesh. This makes the three vertices of the triangle move synchronously, which avoids situations where the gradient descent method cannot obtain good results due to excessive vertex movement.
In the meanwhile, a multi-scale refinement strategy is taken. In order to make full use of the image information when driving triangular mesh surface motion, the coarse-to-fine mesh optimization strategy is adopted in this project and is shown in Figure 6. The method starts with low-scale images, and the algorithm is then advanced from low to high to obtain the result. To obtain the results, multiple scales of images with different resolutions are weighted based on the resolution of each pair.
In this paper, the weighting factor S c a l e   f a c t o r is defined as the following equation:
S c a l e   f a c t o r = i m a g e A . r e s o l u t i o n × i m a g e B . r e s o l u t i o n i m a g e A . s c a l e × i m a g e B . s c a l e
It accounts for different scales across datasets and mesh resolutions.
The experiment in this paper sets the parameter λ to 0.2. To avoid non-convergence, the step size is limited, and 225 iterations are run to obtain the result. The scale is set to four to finish refinement from low to high resolution. The average size of the triangle is set to two pixels and the texture is set to 0.2 or 0.3.

3.2. Experiments of Two Images

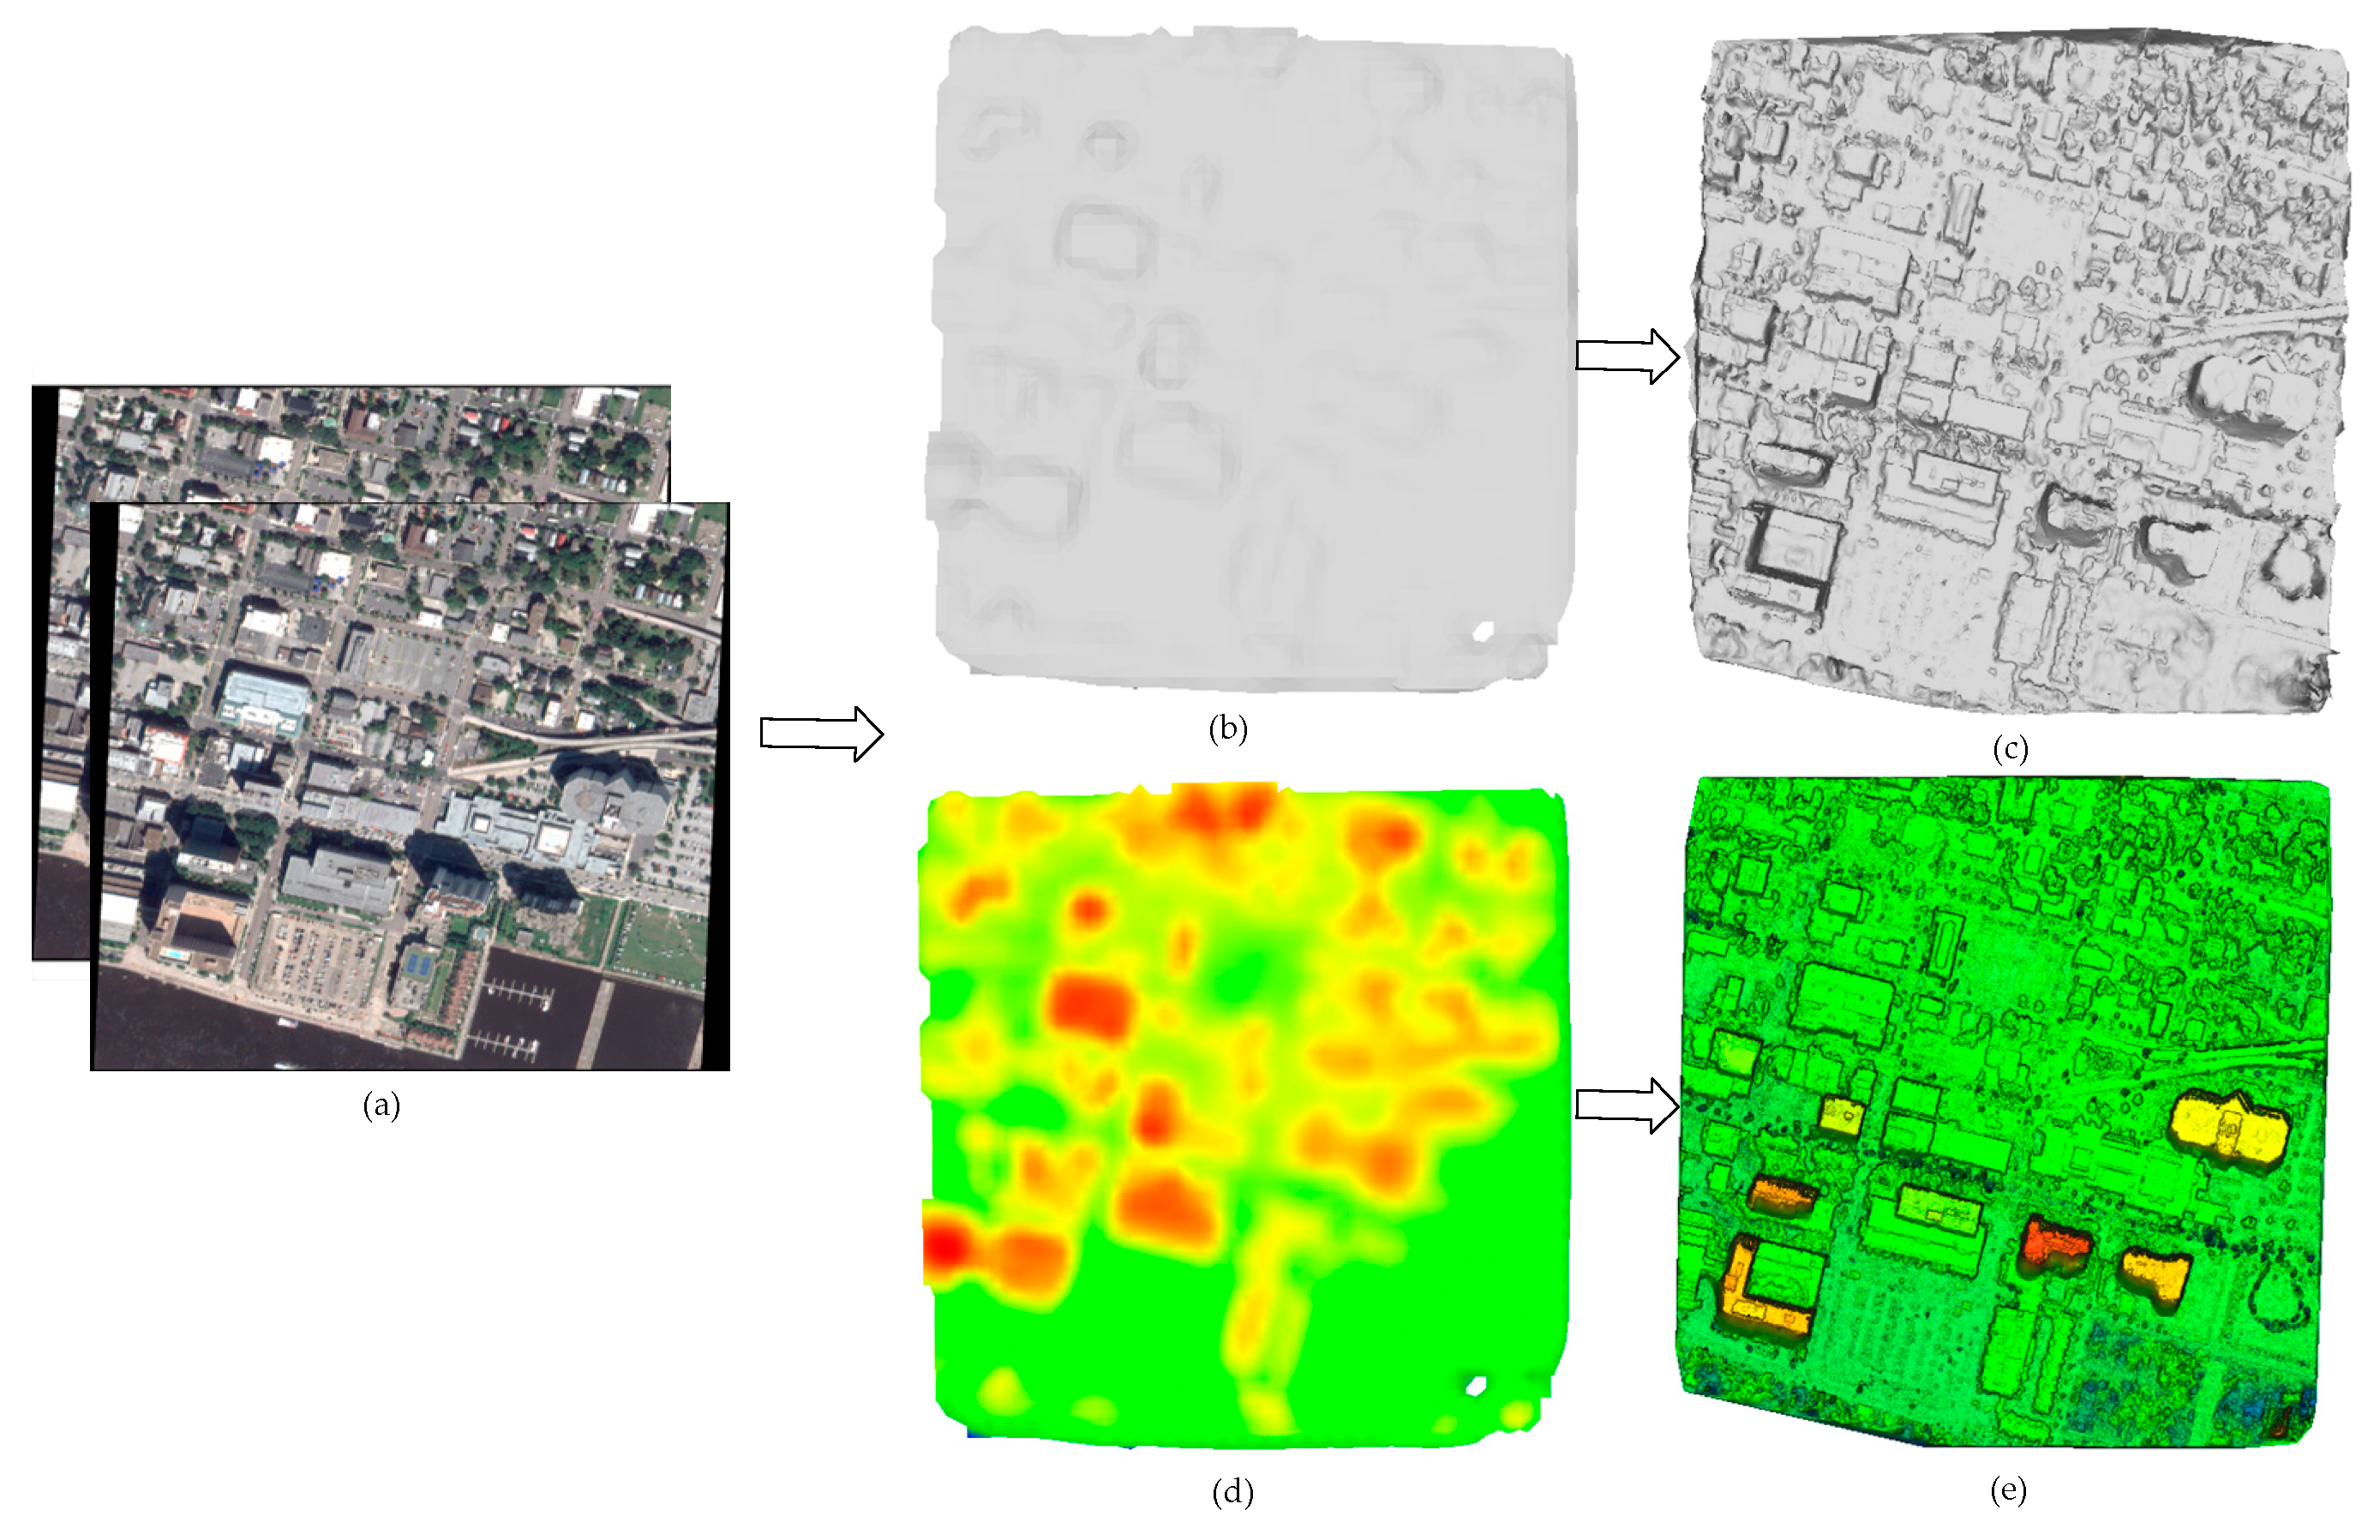
Two QuickBird images were tested, and the obtained DSM is shown in Figure 7.
Firstly, the satellite image pair was used as input (shown in Figure 7a). The basic properties for the initial input mesh are shown in Table 1. Taking experiment 1 as an example, it can be seen from Figure 7b,c that the whole mesh is very rough with obvious hollow conditions, and the input mesh has unclear building contours, inaccurate surface elevation information, is close to the plane, and is located a large distance away from the actual surface (Figure 7a).
The results are shown in Figure 7c,e. Compared to the original input mesh shown in Figure 7b,d, the generated results are significantly richer in detail level, the building contours are clearly visible, and the voids existing in the original mesh are filled. It is obvious that this method can recover the appearance of realistic urban areas from the nearly flat input. Additionally, a certain degree of smoothing is performed to get a geographic product that can meet the requirements. Comparison of the before-and-after results in Figure 7 shows that the buildings have a clear outline and their boundaries are clearer and smoother compared to Figure 7a The method in this paper can recover the surface condition of real landscapes more completely, and the method can also recover building outlines smoothly in terms of the shadow phenomenon that exists due to the angle at which the building is photographed. Furthermore, the mesh optimization algorithm can start from a mesh with lower fineness and recover feature shapes and elevation information.
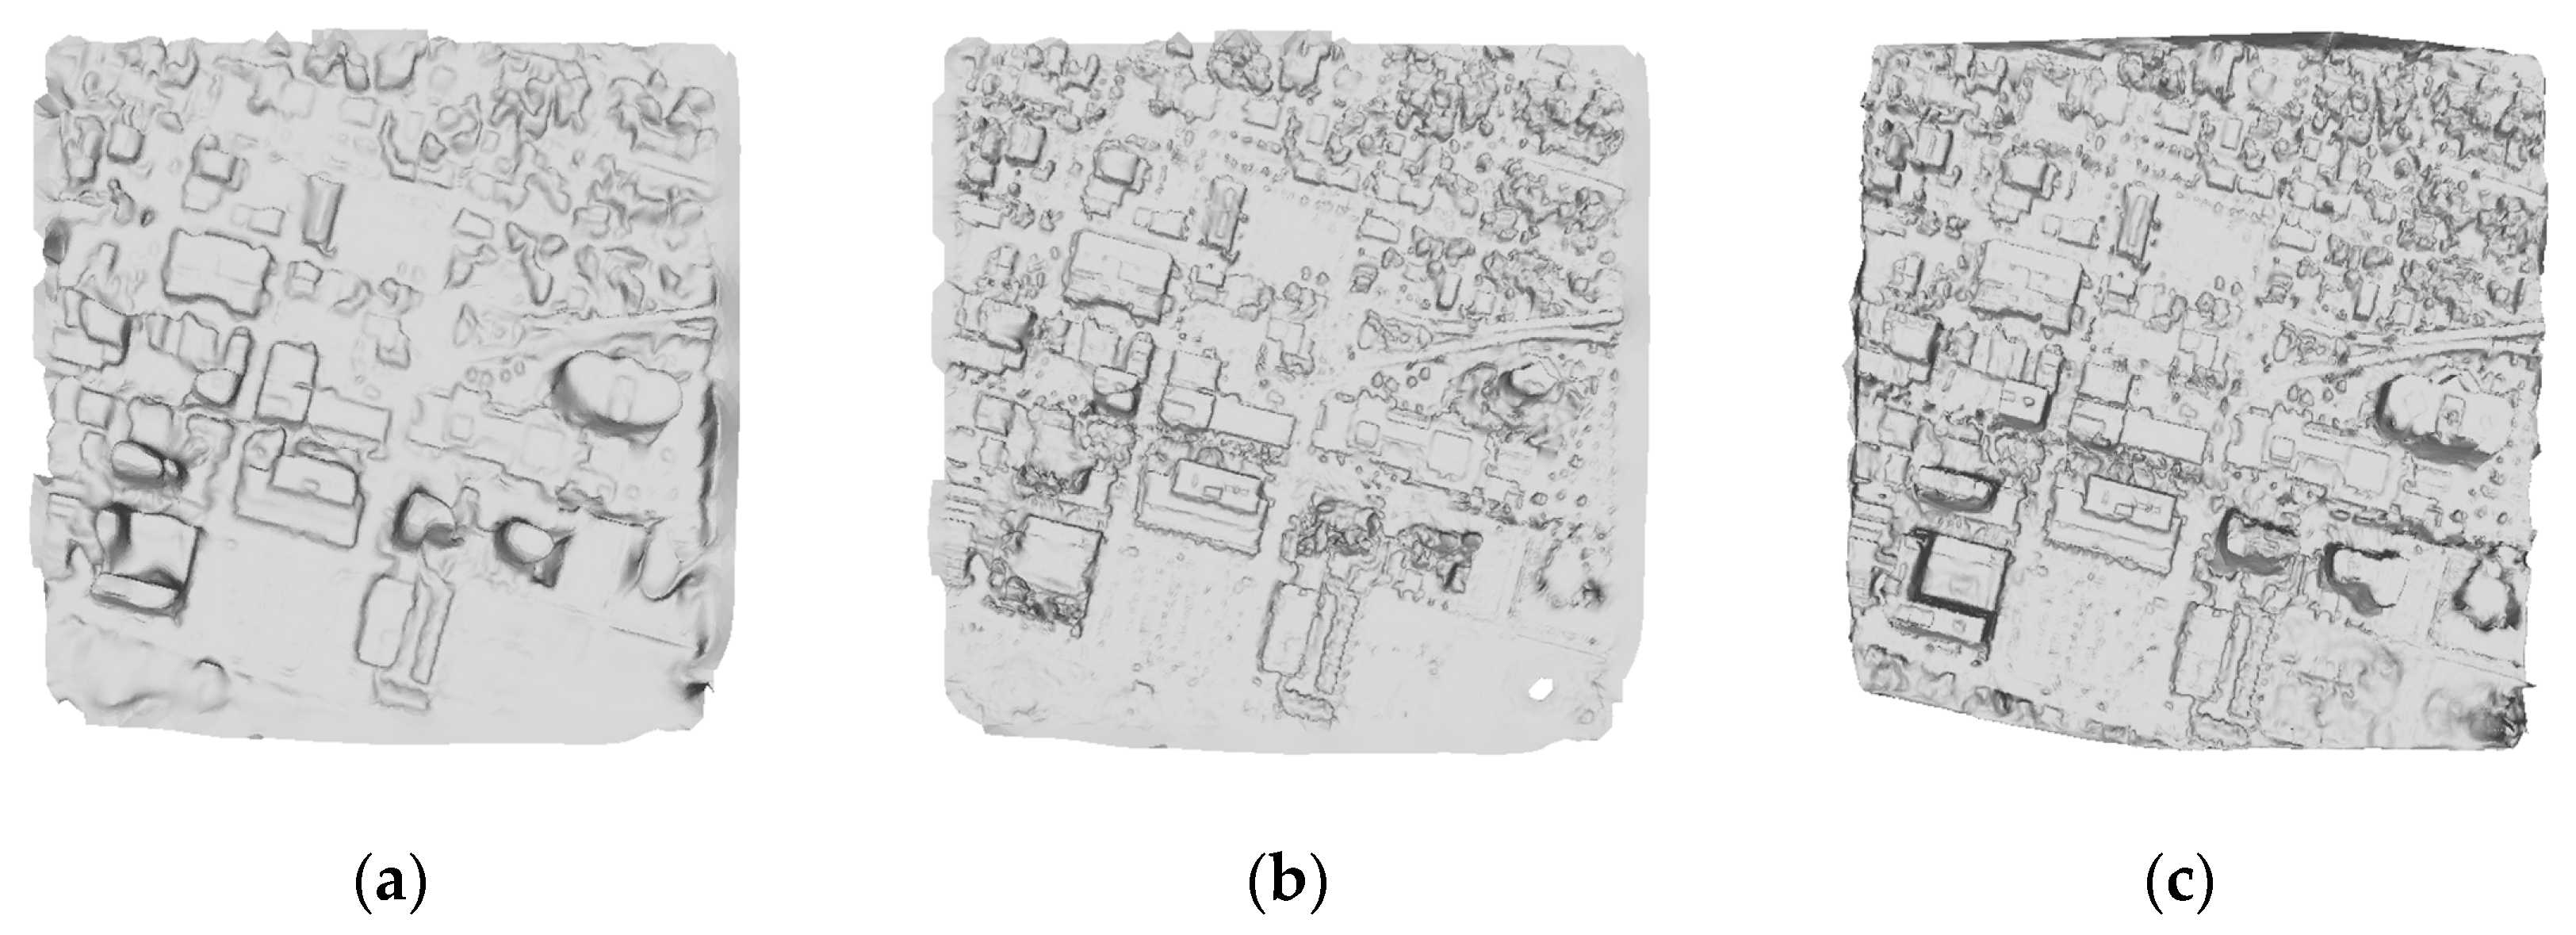
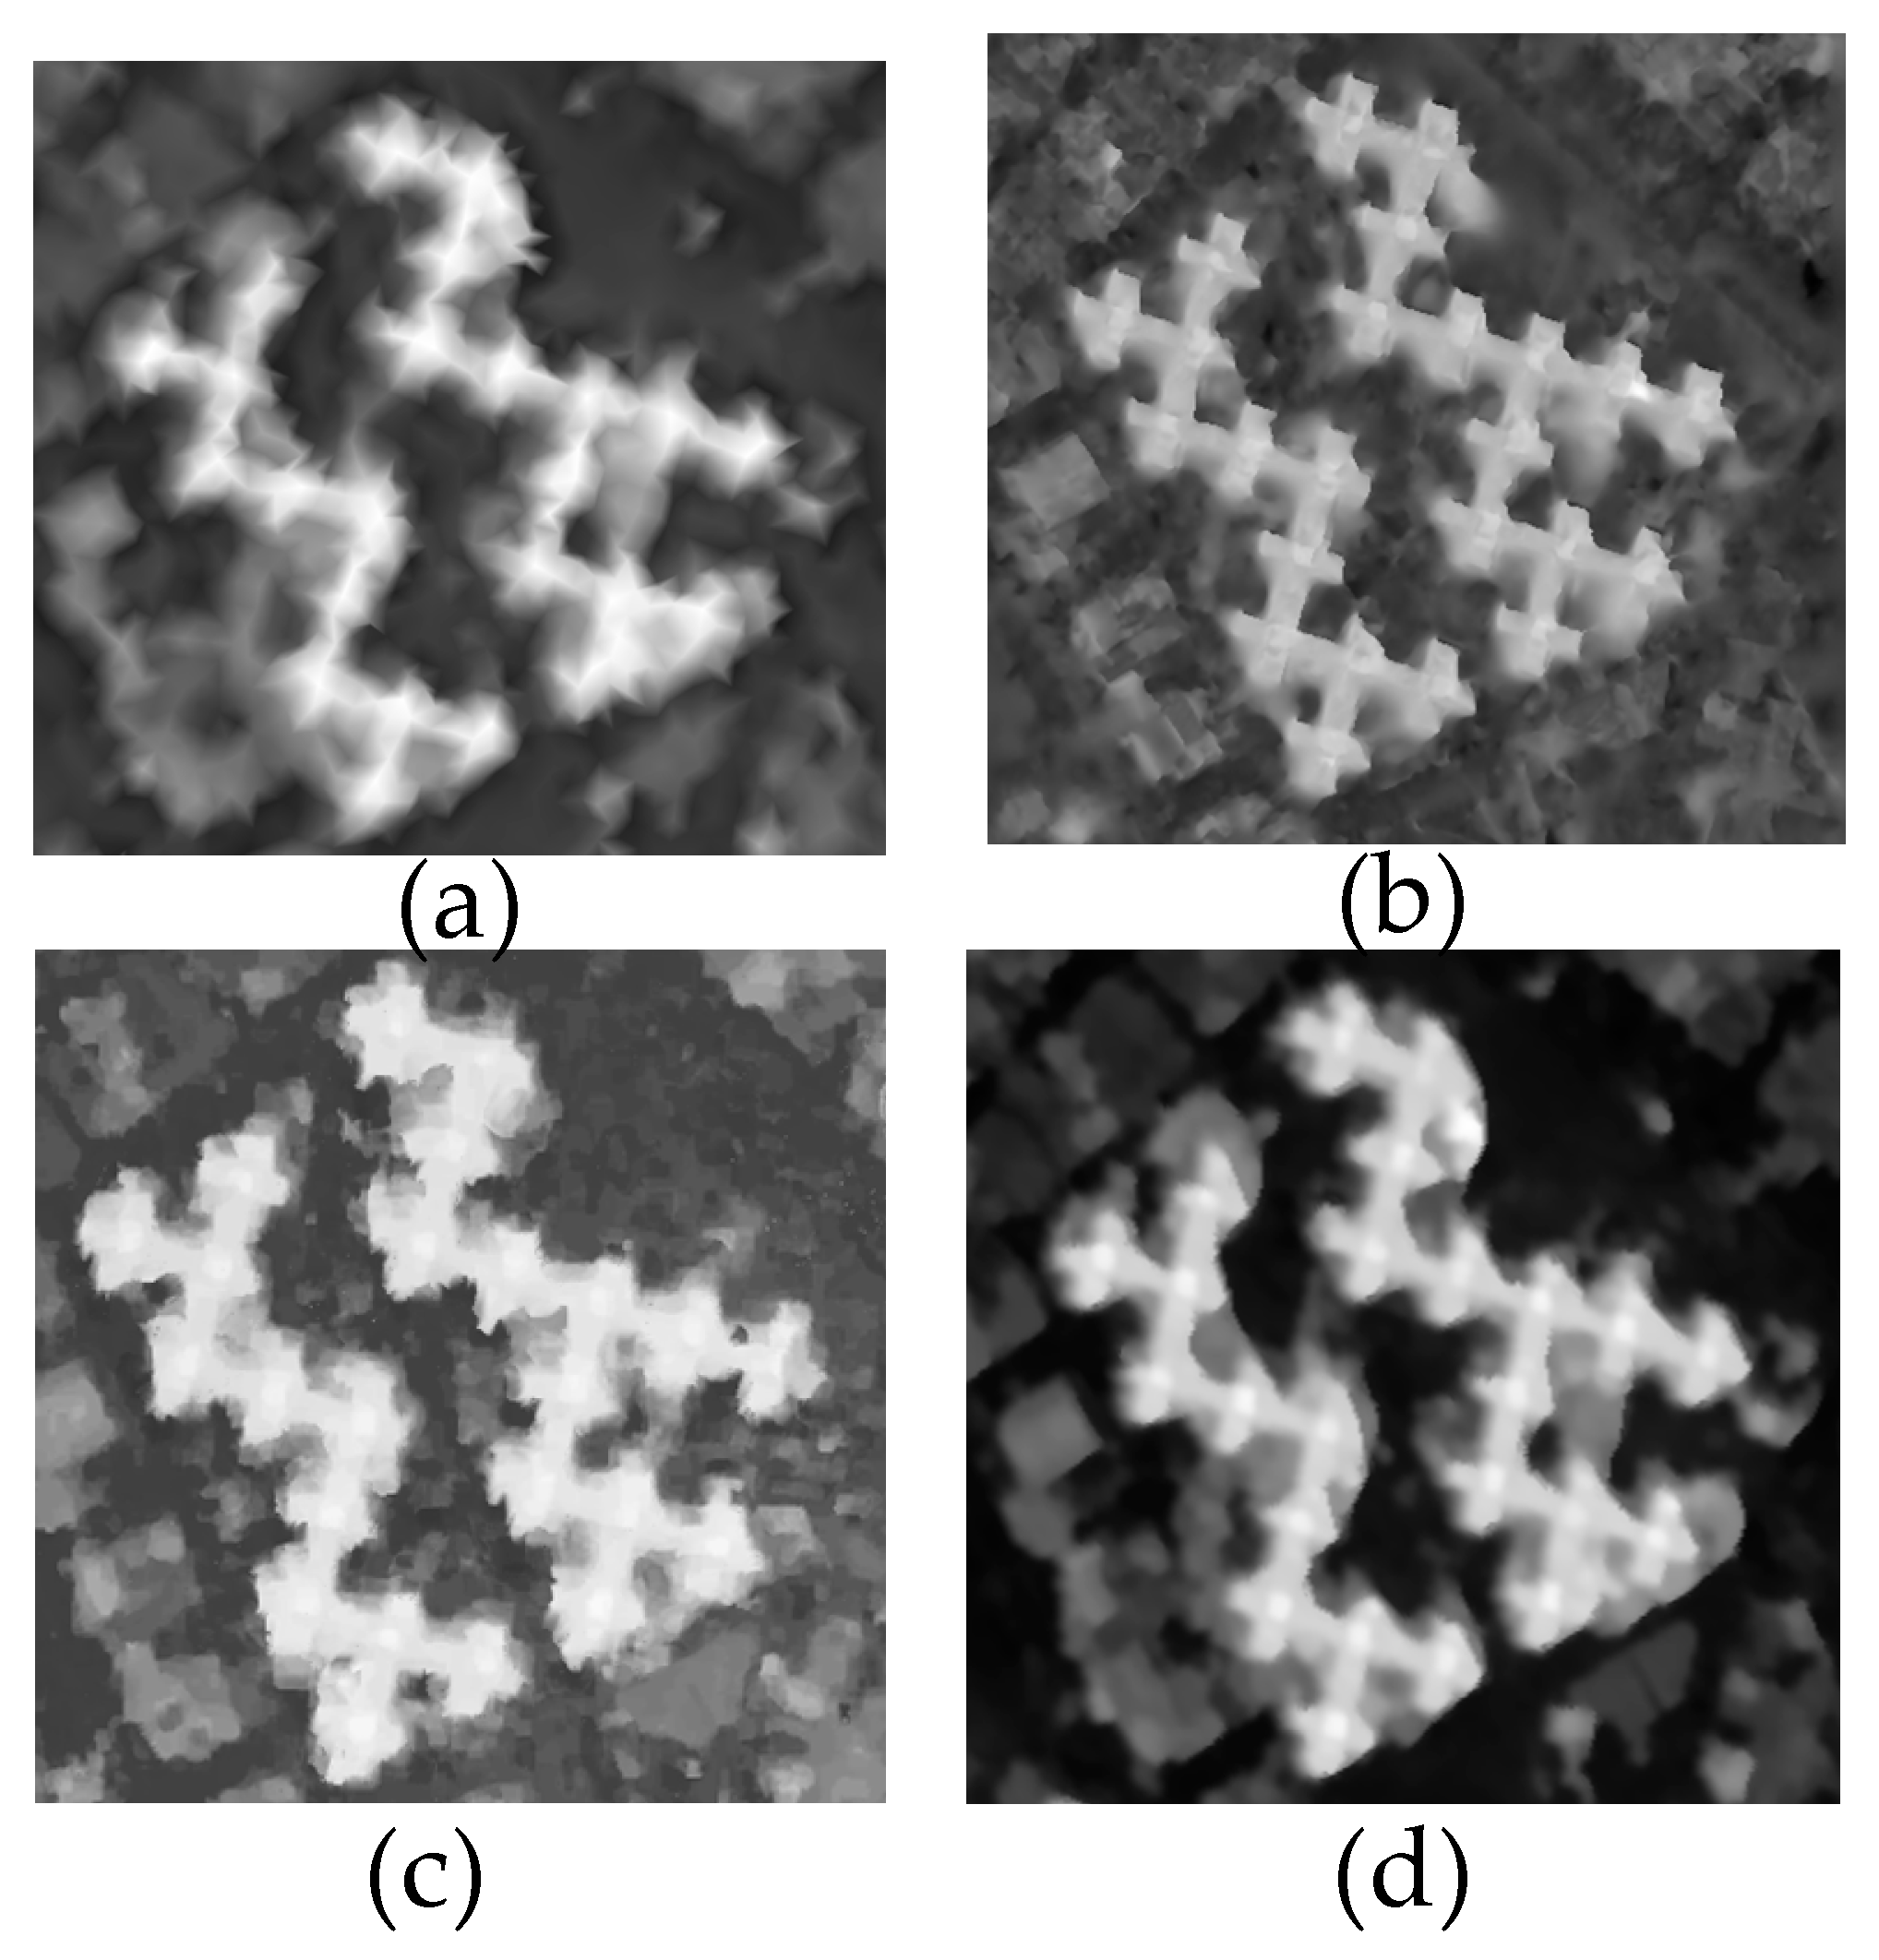
The results were tested with different parameters and conditions. As shown in Figure 8, when there are texture and projection area thresholds, the basic shape of the study area can be recovered and fineness is influenced by the projection area threshold (see Figure 8a). When only the projected area threshold is available, some tall buildings in the study area may not be fully recovered and wrongly stop iterations (see Figure 8b). Through reasonable setting of both parameters, the fine-mesh model can then be obtained (see Figure 8c).

3.3. Test Site and Results of Test Sites

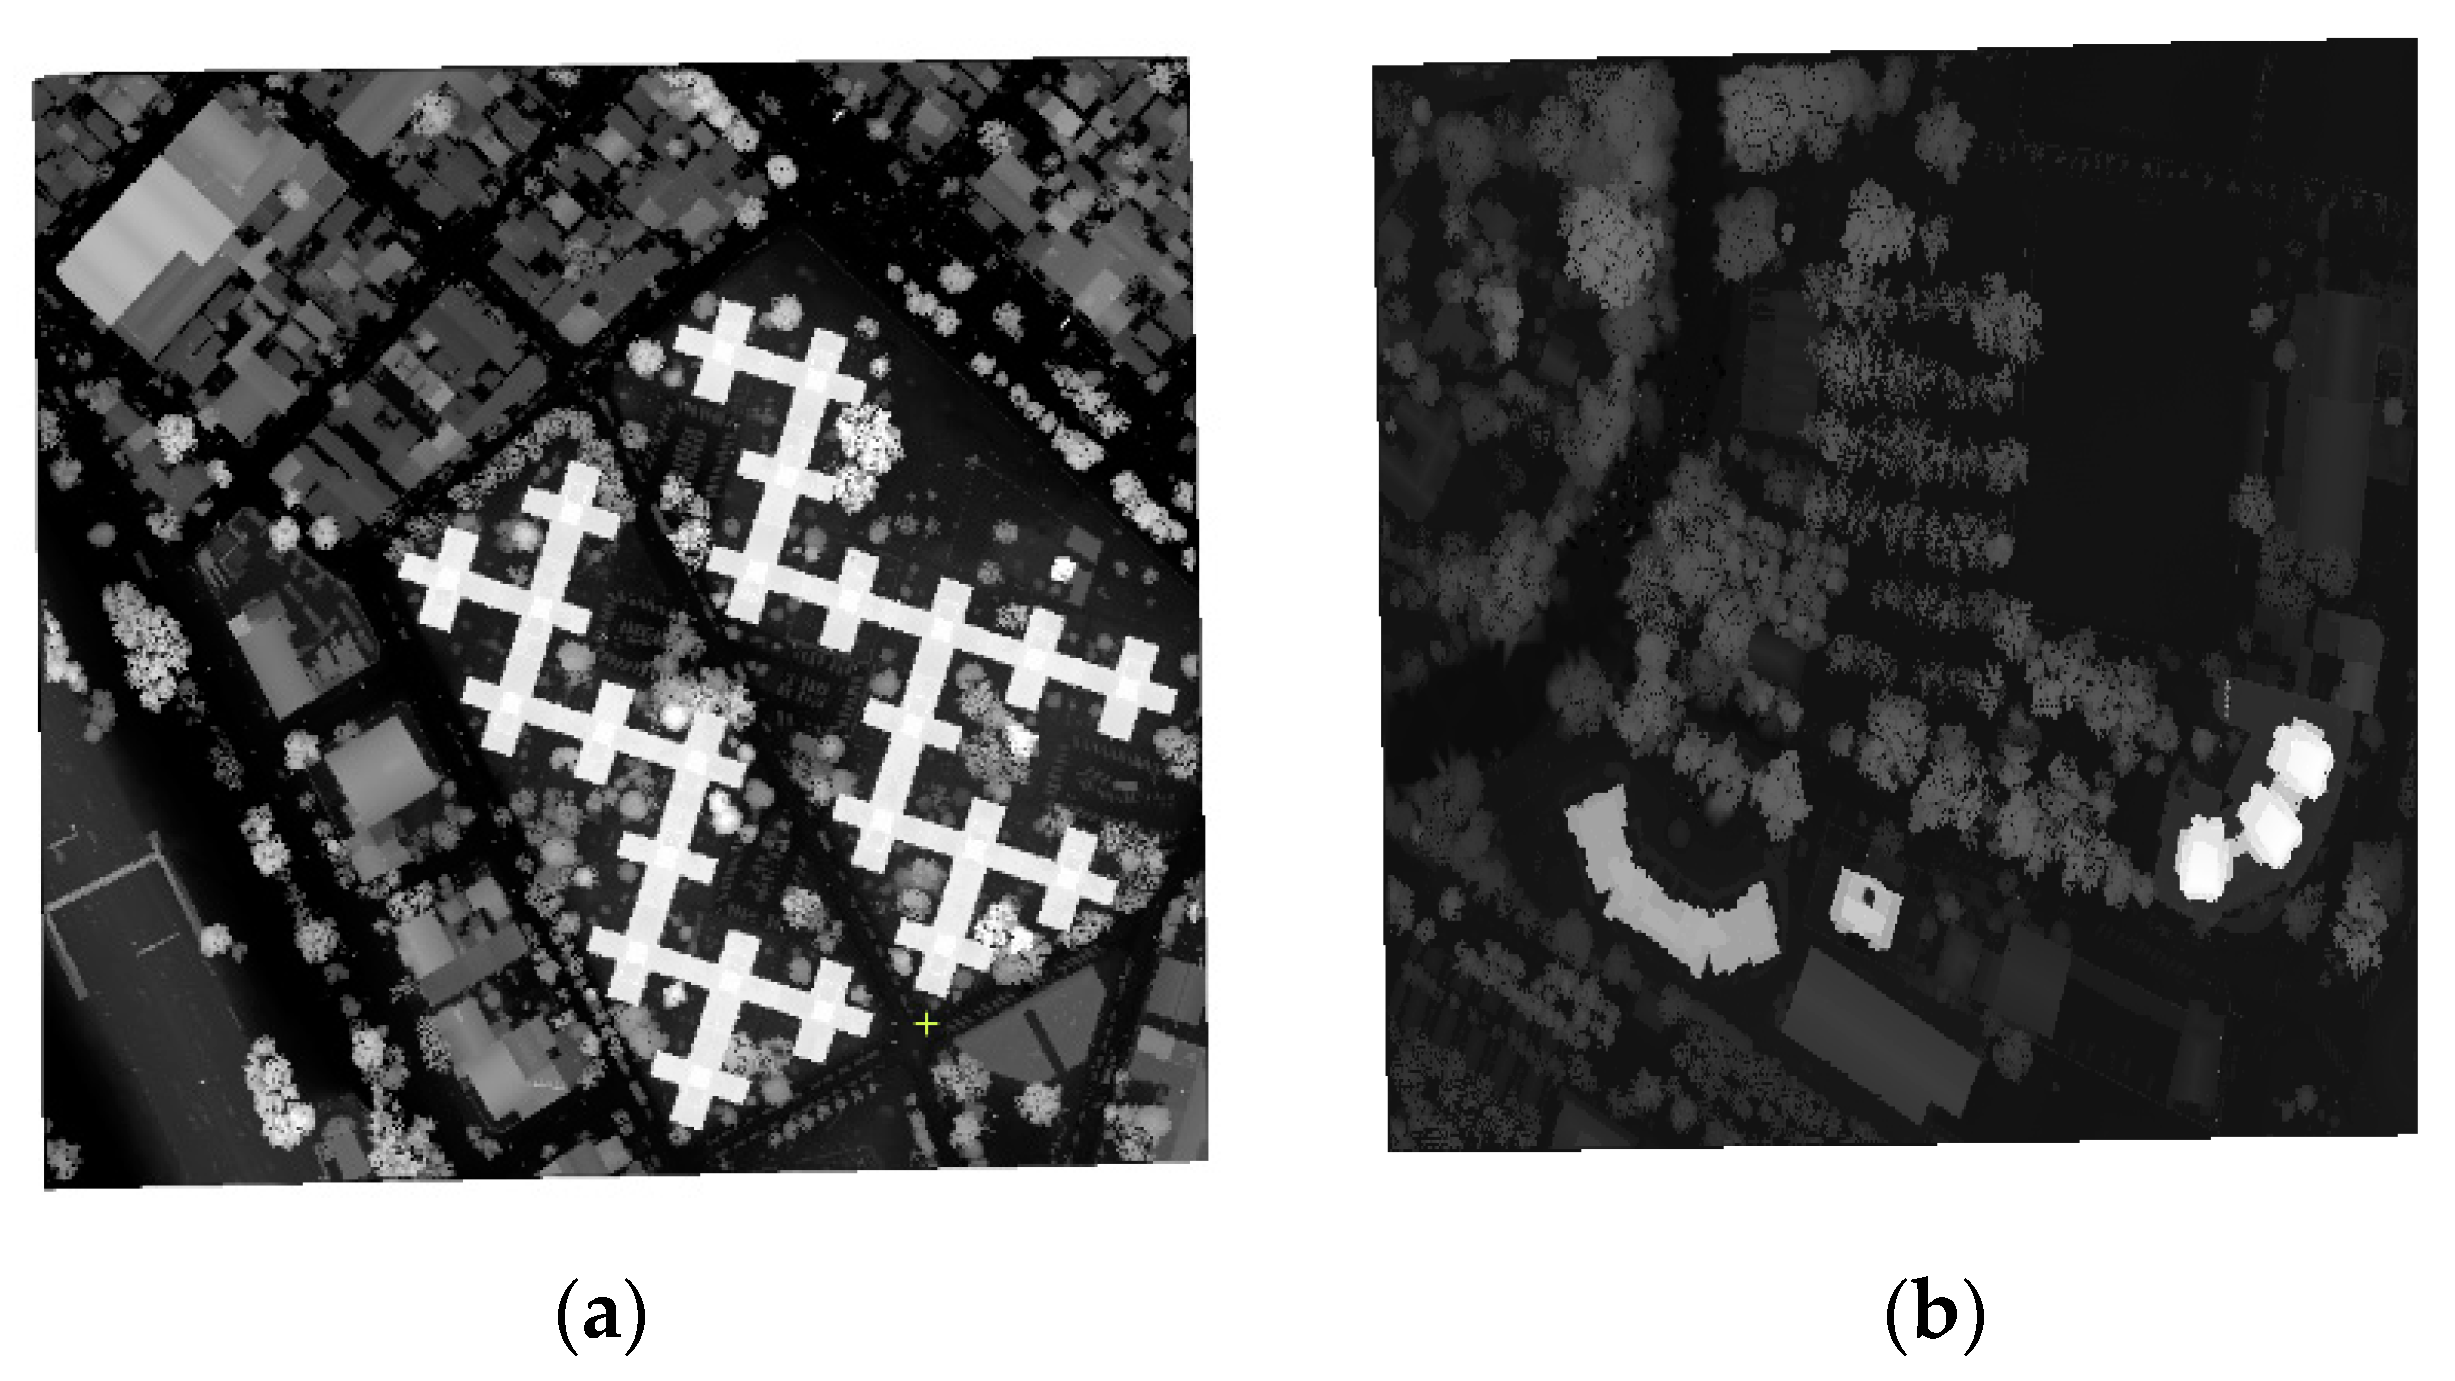
To verify the general applicability of the algorithm, this paper supplements the experiment with two sites from the IAPRA MVS3DM dataset [49]. The images were captured over a span of two years by the WorldView-3 satellite with a resolution of 30 cm per pixel in nadir views, providing fifty DigitalGlobe WorldView-3 panchromatic and multispectral images of a 100 square kilometer area near San Fernando, Argentina. A 2.5D LiDAR DSM was provided to serve as ground truth for both test sites (see Figure 9). The images contain a range of different terrain types, such as fields, residential areas, and vegetation. Test site 2 contained several high-rise buildings. The cropped data provided by the benchmark dataset were tested. In this paper, the accuracy assessment was computed by software provided by Brown [49] et al. for quantitative analysis.
The selected image pairs have a very high degree of redundancy, with significant overlap at almost all locations. In this paper, satellite images with suitable lighting conditions were selected for mesh refinement. According to the image selection strategy, 20 stereo image pairs were selected as input data for test site 1. In test site 2, 16 stereo image pairs were chosen through the image selection strategy. Two regions were tested for quantitative analysis (test site 1 and test site 2).
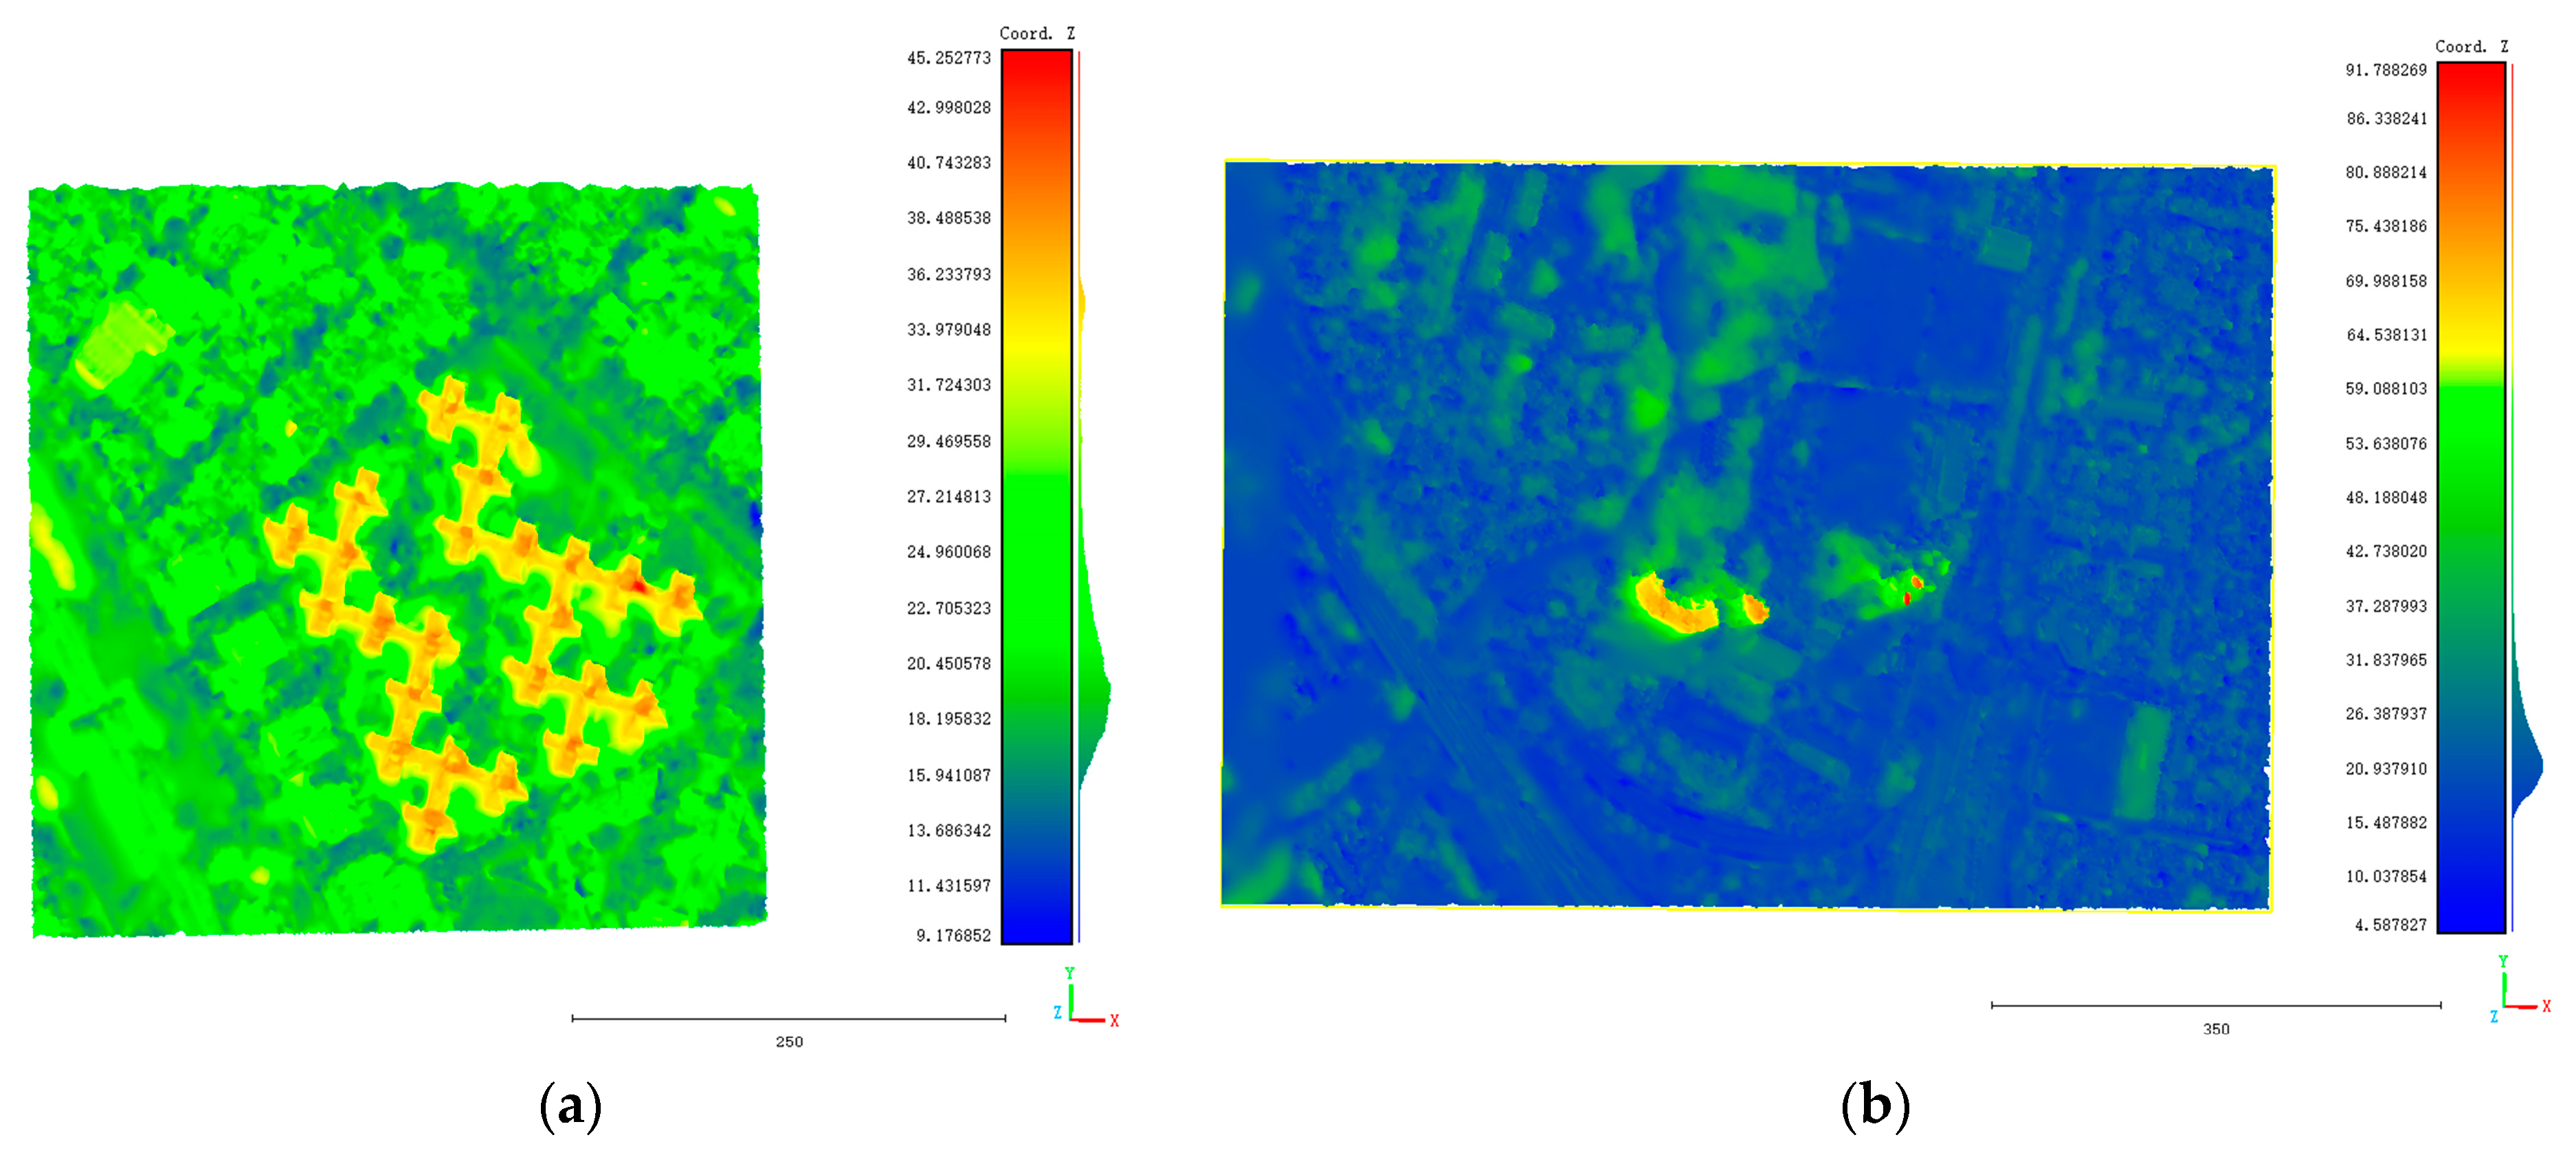
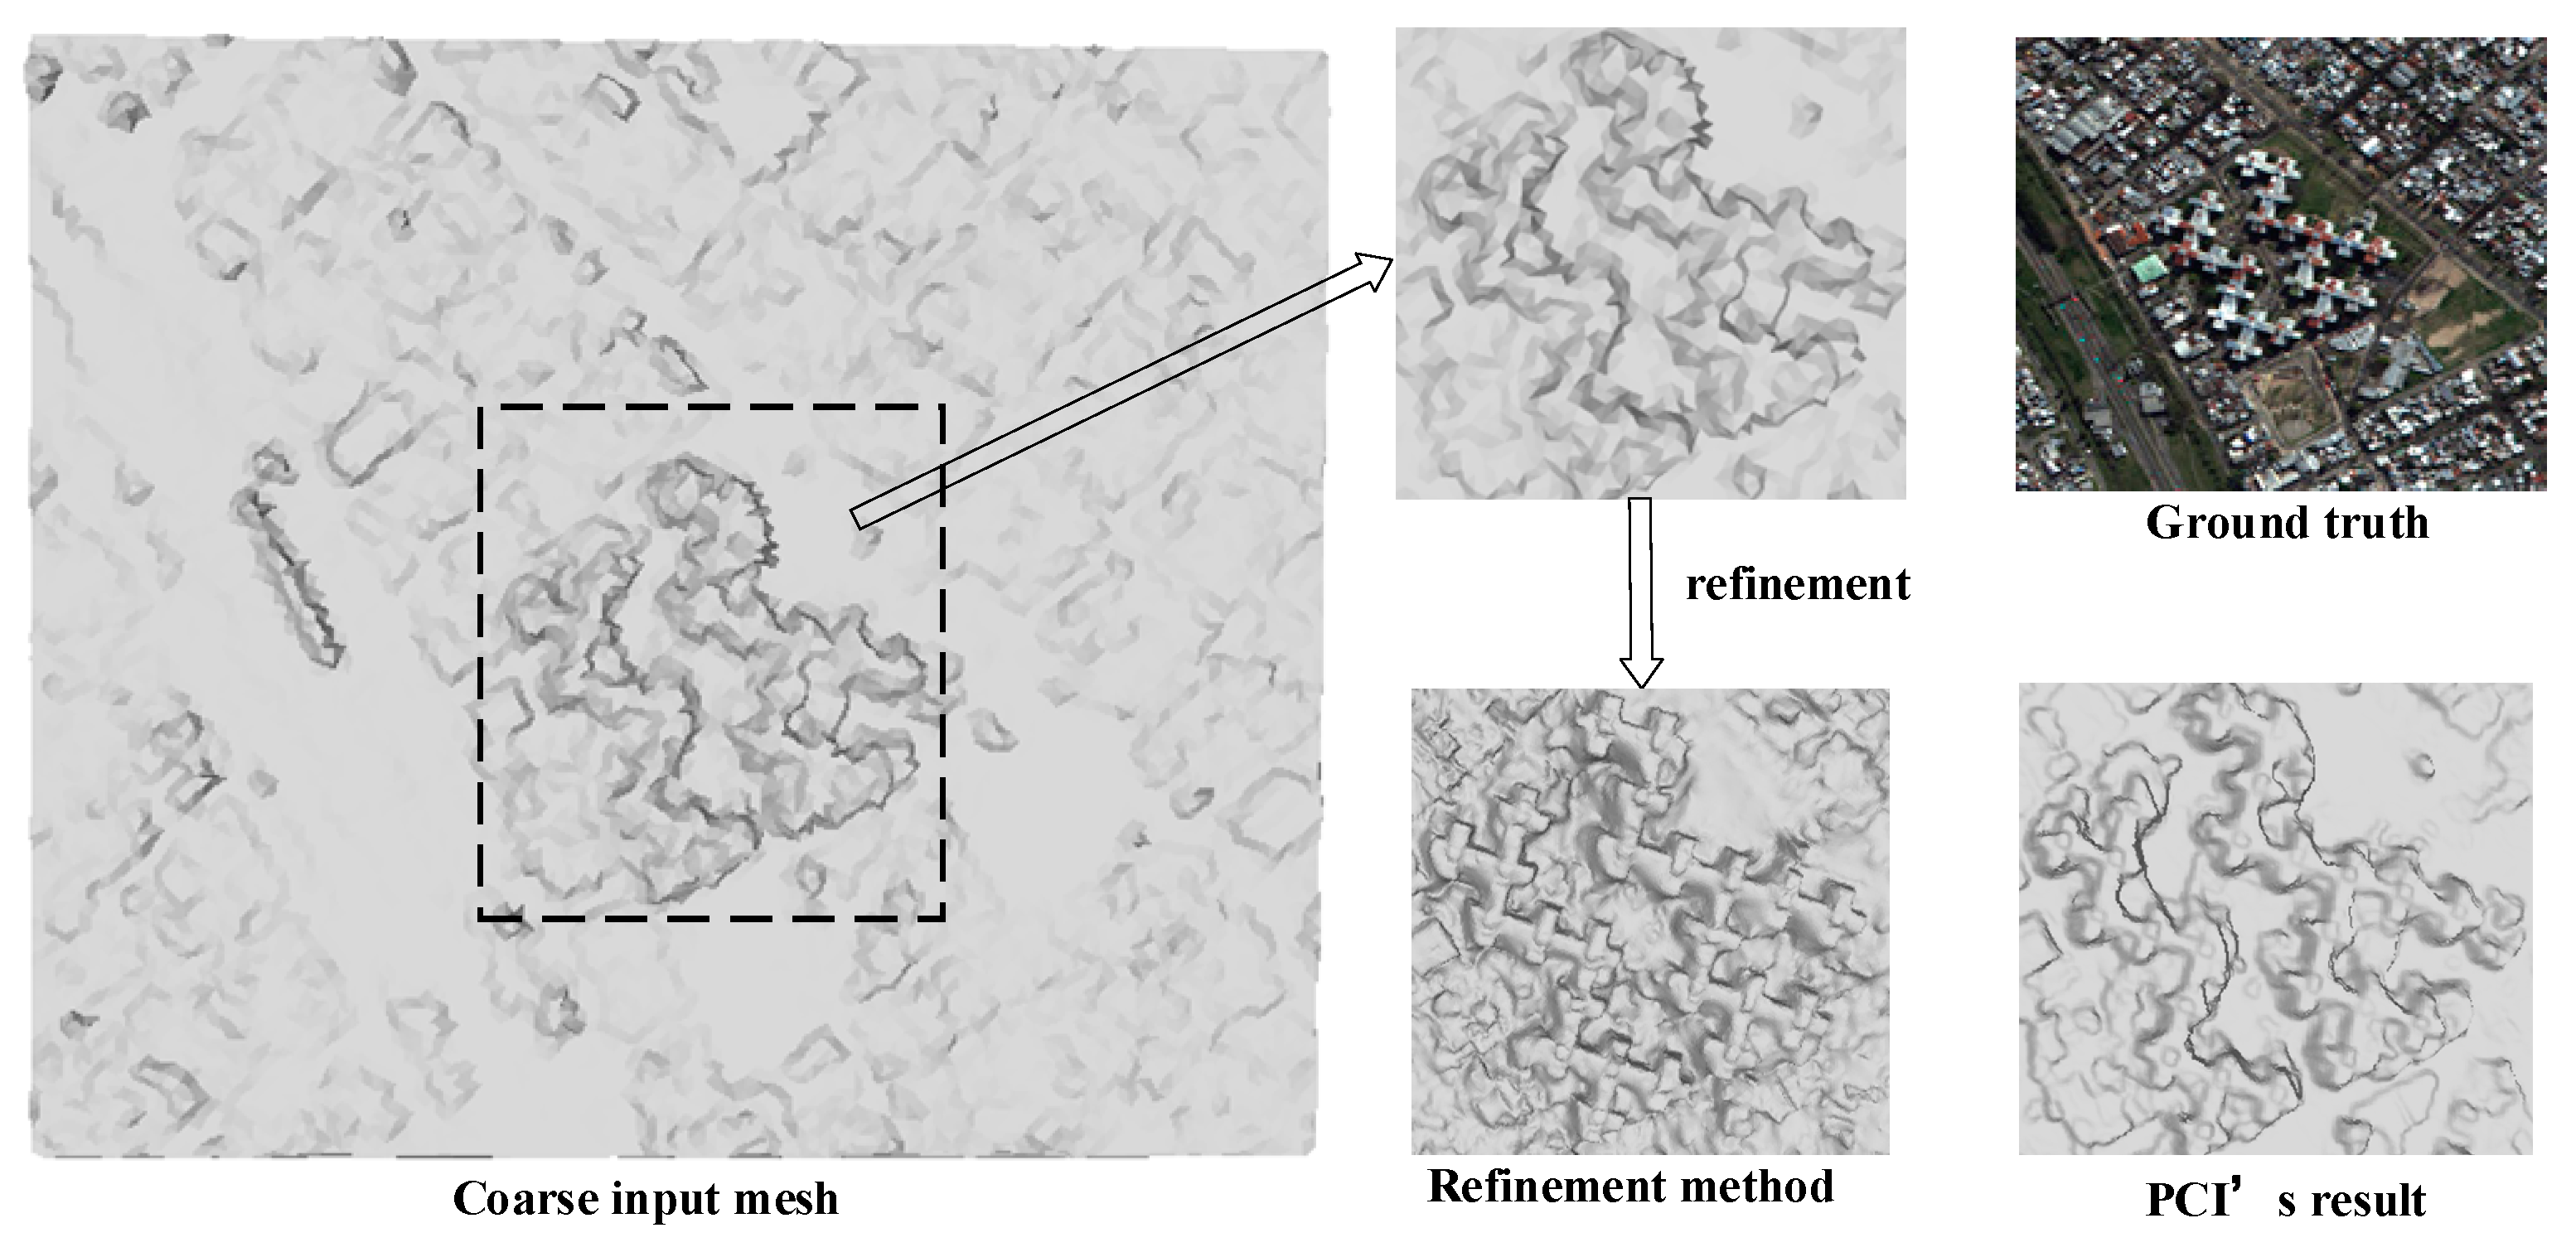
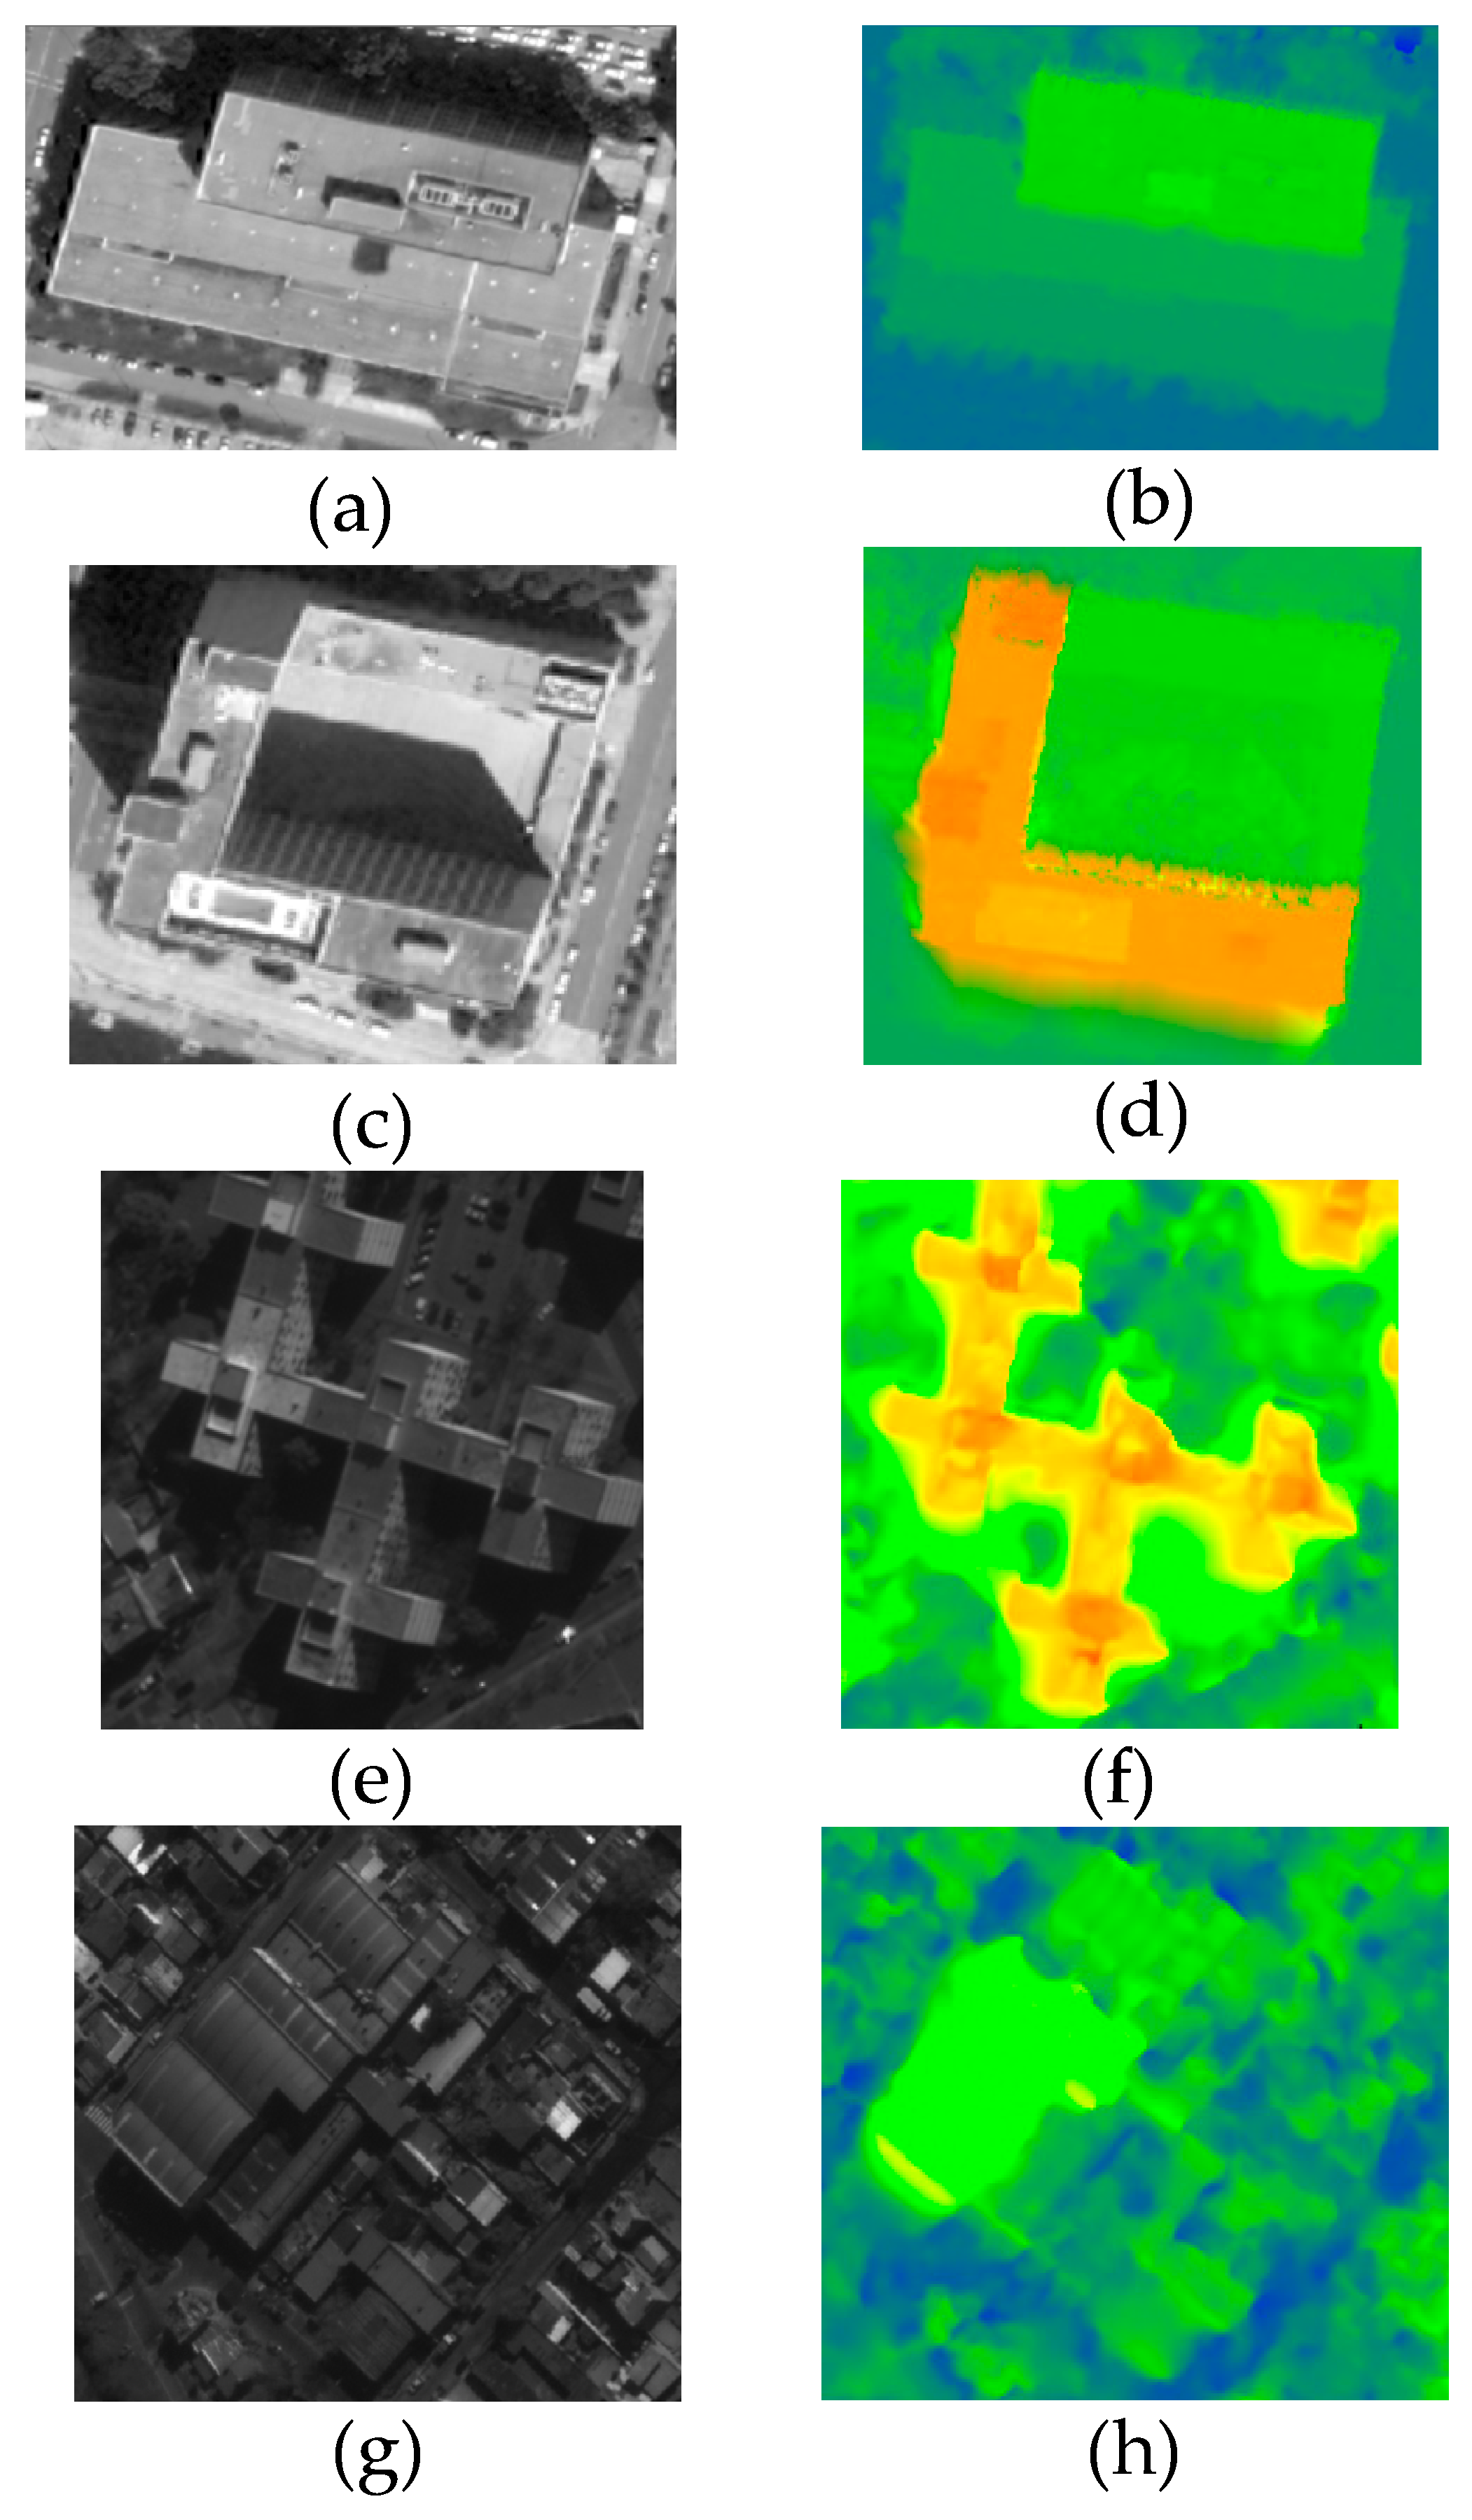
Rough initial meshes were used as input. In this paper, the refinement method is compared with the results of CATALYST (PCI) and SGM [20], and the differences were calculated using laser data as a benchmark. The input images and LIDAR ground truth are shown in Figure 9 and Figure 10. The results of the refinement method are shown in Figure 11. The details are shown in Figure 12 and Figure 13. The local results for different methods are shown in Figure 13. The left-hand row in Figure 14 shows the ROI extracted from the satellite image, and the right-hand row shows the corresponding area of the reconstruction results.

4. Discussion

This paper demonstrates the ability of the mesh optimization algorithm to recover details of 3D shapes that cannot be represented in the 2.5D height field. Figure 11 shows the reconstruction results for the study area. Figure 12 shows that the mesh refinement algorithm is able to recover some of the original topography of the feature from the coarse input (Figure 12, left). Compared to the PCI and SGM results, the method in this paper is significantly smoother in recovering the building planes and the floor boundaries are clearer (Figure 12, tall building outline). For the traditional 2.5D DSM product, which consists mainly of a network of point clouds generated by dense matching, the elevation information is inaccurate and not sufficiently realistic or smooth, while the improved model has distinctly folded edges. On building planes with elevations, the mesh refinement method was able to recover further detail. However, the resulting optimized façade is too uneven in places, possibly due to the presence of shadows when the images were taken. Compared to the PCI results, the mesh-refinement surfaces refine the coarse mesh, provide more detail, and appear less noisy.

4.1. Quantitative Evaluation

Of the two test sites, test site 1 had higher completeness due to test site 2 having a higher number of buildings and more high-rise buildings with several stories, resulting in shaded areas. The high-rise buildings and the excessive number of trees resulted in a loss of completeness.
To test the method, the results generated by PCI and SGM were compared. The LiDAR ground truth is provided in the form of a 2.5D DSM. Consequently, the refined 3D meshes had to be converted back to 2.5D elevation maps. To accomplish this process, we aligned the mesh to the 2.5D DSM, cast a vertical ray through the center of each mesh cell, and extracted the highest intersection point with the reconstructed mesh.
The reference DSMs for the two test sites are shown in Figure 10. To quantitatively assess the quality of our refined DSM, comparisons were made between the DSM and the reference LiDAR DSM at both test sites. The RMS of the height difference and the completeness of the results were calculated to check accuracy. In addition, we calculated the normalized median deviation (NMAD) to evaluate the robustness of the fused DSM. The statistical evaluation results are shown in Table 1.
As shown in Table 2, the integrity of test site 1 was 68% with an RMS of 2.04 m. The DSM of test site 2 had an RMS of 2.04 m. The integrity of the two test sites was 68% and 49%, respectively. As discussed previously in this paper, the areas of test site 2 shaded by dense trees and high-rise buildings reduced accuracy and completeness. The NMADs of test sites 1 and 2 are 0.76m and 1.08 m, respectively. Dense residential areas and high-rise buildings cause more shadows and negatively affect robustness. From Completeness, RMS, and NMAD, the method in this paper has met or exceeded existing algorithms and software in terms of accuracy.
Table 2 illustrates that the method significantly improves coarse meshes. RPC parameters without block adjustment are used in this paper, and the accuracy of the DSM elevation produced by the mesh refinement method basically reaches an accuracy level that is consistent with commercial PCI software. While the SGM method is superior in terms of satellite position, it is not well corrected and the reconstruction effect may be lacking. This indicates that the method in this paper has good robustness. Usually, better DSM results need to be fused by multiple point clouds; however, the method in this paper avoids this redundant operation. It is found that the error metrics do not fully reflect the degree of visualization in the reconstruction and the error results are affected by seasonal changes, object movement, and other aspects. In general, the mesh optimization method is less affected by the initial input mesh and basically reaches the accuracy level of advanced commercial software and algorithms. Additionally, the mesh optimization algorithm does not require steps such as fusion of point clouds and can run on the basis of the results of SGM/ASP/s2p. By further simplifying the steps required to construct the initial mesh and generating DSM products by only using mesh refinement algorithms, this work is still worthwhile.

4.2. Qualitative Evaluation

To show the 3D capability of the reconstructed point cloud and to perform some qualitative analysis, the reconstruction results were visualized by the open-source software Cloud Compare. Several partitions were extracted from the three data as regions of interest (ROI) to analyze the reconstruction details. The ROI for point clouds and satellite images are shown in Figure 11. The comparison of different algorithms for local areas is shown in Figure 10.
From the results generated by the different methods (Figure 10), the input is very coarse (see Figure 10a) and obtains the refined DSM (see Figure 10b). The mesh refinement method optimizes the rough edge structure of the original building, which makes the contour features of the building more obvious, leading to clearer folded edges. The result is also clearer compared to the SGM results (see Figure 13c), which suggests that the mesh refinement method may be superior to the SGM pipeline that usually produces multiple point clouds for fusion to achieve the best effect. The SGM results achieved in this paper may not represent the best visual effects, while PCI software produced fair results. However, there is also the problem of unclear edges.
The left row in Figure 14 shows the ROI extracted from the satellite image, and the right row shows the corresponding area of the reconstructed point cloud. In Figure 14a,c, we can find a large, isolated building in the extracted area. In Figure 14e, the edges of the reconstructed building are sharp and the edge features are obvious, except for the error in the middle area. The details of the isolated building area are also recovered to some extent compared to the actual image (e.g., the pool area in Figure 14d and the small steps in Figure 14b,g shows an area with some connected buildings surrounded by low-rise buildings. The reconstruction shows poor performance because the buildings are too close and the shadows of the buildings are often cast on the nearby buildings. The reconstructed buildings are connected to each other and the boundaries are completely blurred. The pipeline performs poorly with high-rise buildings and dense residential areas, where vegetation, shadows, and dense building coverage cause difficulty during the reconstruction process.
From the overall comparison of DSM extraction results with the original initial input mesh, the DSM generation algorithm based on mesh refinement can better restore 3D features and can reduce the nearly flat initial input mesh to a digital surface model with clear building contours. The edge contours of the building can be clearly distinguished, and the elevation information of the building is also more obviously extracted, i.e., the height information of the real building can be accurately reflected by the mesh-optimized vertex-driven method. With multi-scale subdivision, the number of faces and vertices in the mesh also changes. Compared to the results of current advanced commercial software, the building edge contours are better reproduced. Overall comparison shows the effectiveness of the algorithm for generating DSM products through mesh refinement.

5. Conclusions and Future Work

In this paper, a method of generating satellite stereo image pairs based on mesh refinement is proposed, which realizes the three-dimensional reconstruction of urban area surfaces. The three-dimensional surface mesh is refined by minimizing the photometric error between two satellite images. The sensor pose of these satellite images is specified by RPC parameters.
Through analysis of the experimental results, the following conclusions are drawn:
(1) In this paper, the proposed method based on mesh refinement for driving vertex movement to generate DSM products was effective and could better restore surface features. It was able to generate a fine-mesh model by subdivision refinement based on only inputting a rough mesh model.
(2) Making full use of image information when guiding the subdivision process of the mesh enhances the local details of DSM products and causes the subdivision of complex texture regions to be deeper, which can improve operation speed and enrich details to a certain extent.
This paper shows that the workflow is beneficial to the study of true 3D products in complex urban areas and has some development prospects. Current implementation can generate relatively complete DSM products with only a coarse mesh input, which demonstrates the great potential of the mesh refinement approach. The DSM products can be easily and quickly updated using this method. However, considering that the current implementation method utilizes RPC parameters provided by the satellite provider, it has not been refined and does not yet achieve sub-pixel level accuracy. The next research work will focus on simplifying the initial mesh construction process and further refinement of the model. Even if the mesh is coarser or even blank, it can still be subdivided into more detailed and complete scenes.

Author Contributions

Conceptualization, B.L.; data curation, B.L.; formal analysis, B.L. and J.L.; funding acquisition, J.L.; methodology, J.L. and B.L.; project administration, B.L. and J.L.; resources, B.L. and J.L.; validation, J.L.; visualization, B.L.; writing—original draft, B.L.; writing—review and editing, B.L., P.W., J.L. and M.Y.; supervision, M.Y. All authors have read and agreed to the published version of the manuscript.

Funding

This work was financially supported by the National Natural Science Foundation of China (No. 42171439) and Qingdao Science and Technology Demonstration and Guidance Project (Grant No. 22-3-7-cspz-1-nsh).

Data Availability Statement

The data that support the findings of this study are openly available from https://spacenet.ai/iarpa-multi-view-stereo-3d-mapping/ (accessed on 12 July 2022), reference number [38].

Conflicts of Interest

The authors declare no conflict of interest.

References

  1. Gonçalves, D.; Gonçalves, G.; Pérez-Alvávez, J.A.; Andriolo, U. On the 3D Reconstruction of Coastal Structures by Unmanned Aerial Systems with Onboard Global Navigation Satellite System and Real-Time Kinematics and Terrestrial Laser Scanning. Remote Sens. 2022, 14, 1485. [Google Scholar] [CrossRef]
  2. Järnstedt, J.; Pekkarinen, A.; Tuominen, S.; Ginzler, C.; Holopainen, M.; Viitala, R. Forest variable estimation using a high-resolution digital surface model. ISPRS J. Photogramm. Remote Sens. 2012, 74, 78–84. [Google Scholar] [CrossRef]
  3. Misra, P.; Avtar, R.; Takeuchi, W. Comparison of digital building height models extracted from AW3D, TanDEM-X, ASTER, and SRTM digital surface models over Yangon City. Remote Sens. 2018, 10, 2008. [Google Scholar] [CrossRef] [Green Version]
  4. Chai, D. A probabilistic framework for building extraction from airborne color image and DSM. IEEE J. Sel. Top. Appl. Earth Obs. Remote Sens. 2016, 10, 948–959. [Google Scholar] [CrossRef]
  5. Facciolo, G.; De Franchis, C.; Meinhardt-Llopis, E. Automatic 3D Reconstruction from Multi-Date Satellite Images. In Proceedings of the IEEE Conference on Computer Vision and Pattern Recognition Workshops, Honolulu, HI, USA, 21–26 July 2017; pp. 57–66. [Google Scholar]
  6. Moratto, Z.M.; Broxton, M.J.; Beyer, R.A.; Lundy, M.; Husmann, K. Ames Stereo Pipeline, NASA’s Open Source Automated Stereogrammetry Software. In Proceedings of the Lunar and Planetary Science Conference, The Woodlands, TX, USA, 1–5 March 2010; p. 2364. [Google Scholar]
  7. Wu, J.; Cheng, M.; Yao, Z.; Peng, Z.; Li, J.; Ma, J. Automatic generation of high-quality urban DSM with airborne oblique images. J. Image Graph. 2015, 20, 117–128. [Google Scholar]
  8. Hirschmuller, H. Stereo processing by semiglobal matching and mutual information. IEEE Trans. Pattern Anal. Mach. Intell. 2007, 30, 328–341. [Google Scholar] [CrossRef]
  9. Yin, L.; Wang, L.; Zheng, W.; Ge, L.; Tian, J.; Liu, Y.; Yang, B.; Liu, S. Evaluation of empirical atmospheric models using Swarm-C satellite data. Atmosphere 2022, 13, 294. [Google Scholar] [CrossRef]
  10. Zhao, T.; Shi, J.; Lv, L.; Xu, H.; Chen, D.; Cui, Q.; Jackson, T.J.; Yan, G.; Jia, L.; Chen, L.; et al. Soil moisture experiment in the Luan River supporting new satellite mission opportunities. Remote Sens. Environ. 2020, 240, 111680. [Google Scholar] [CrossRef]
  11. Tian, H.; Qin, Y.; Niu, Z.; Wang, L.; Ge, S. Summer Maize Mapping by Compositing Time Series Sentinel-1A Imagery Based on Crop Growth Cycles. J. Indian Soc. Remote Sens. 2021, 49, 2863–2874. [Google Scholar] [CrossRef]
  12. Tian, H.; Wang, Y.; Chen, T.; Zhang, L.; Qin, Y. Early-Season Mapping of Winter Crops Using Sentinel-2 Optical Imagery. Remote Sens. 2021, 13, 3822. [Google Scholar] [CrossRef]
  13. Tian, H.; Pei, J.; Huang, J.; Li, X.; Wang, J.; Zhou, B.; Qin, Y.; Wang, L. Garlic and winter wheat identification based on active and passive satellite imagery and the google earth engine in northern china. Remote Sens. 2020, 12, 3539. [Google Scholar] [CrossRef]
  14. Tian, H.; Huang, N.; Niu, Z.; Qin, Y.; Pei, J.; Wang, J. Mapping winter crops in China with multi-source satellite imagery and phenology-based algorithm. Remote Sens. 2019, 11, 820. [Google Scholar] [CrossRef] [Green Version]
  15. Xie, L.; Zhu, Y.; Yin, M.; Wang, Z.; Ou, D.; Zheng, H.; Liu, H.; Yin, G. Self-feature-based point cloud registration method with a novel convolutional Siamese point net for optical measurement of blade profile. Mech. Syst. Signal Process. 2022, 178, 109243. [Google Scholar] [CrossRef]
  16. Kuschk, G. Large scale urban reconstruction from remote sensing imagery. Int. Arch. Photogramm. Remote Sens. Spat. Inf. Sci. 2013, XL-5/W1, 139–146. [Google Scholar] [CrossRef] [Green Version]
  17. Wohlfeil, J.; Hirschmüller, H.; Piltz, B.; Börner, A.; Suppa, M. Fully automated generation of accurate digital surface models with sub-meter resolution from satellite imagery. Int. Arch. Photogramm. Remote Sens. Spat. Inf. Sci. 2012, XXXIX-B1, 75–80. [Google Scholar] [CrossRef] [Green Version]
  18. d’Angelo, P.; Reinartz, P. Semiglobal matching results on the ISPRS stereo matching benchmark. Int. Arch. Photogramm. Remote Sens. Spatial Inf. Sci. 2011, XXXVIII–4/W19, 79–84. [Google Scholar] [CrossRef] [Green Version]
  19. Zhang, K.; Snavely, N.; Sun, J. Leveraging Vision Reconstruction Pipelines for Satellite Imagery. In Proceedings of the IEEE/CVF International Conference on Computer Vision Workshops, Seoul, Republic of Korea, 27–28 October 2019. [Google Scholar]
  20. Rothermel, M.; Wenzel, K.; Fritsch, D.; Haala, N. SURE: Photogrammetric Surface Reconstruction from Imagery. In Proceedings of the Proceedings LC3D Workshop, Berlin, Germany, 4–5 December 2012. [Google Scholar]
  21. Gong, K.; Fritsch, D. DSM generation from high resolution multi-view stereo satellite imagery. Photogramm. Eng. Remote Sens. 2019, 85, 379–387. [Google Scholar] [CrossRef]
  22. Li, Y.; Zheng, S.; Wang, X.; Ma, H. An efficient photogrammetric stereo matching method for high-resolution images. Comput. Geosci. 2016, 97, 58–66. [Google Scholar] [CrossRef]
  23. Ghuffar, S. Satellite stereo based digital surface model generation using semi global matching in object and image space. In ISPRS Annals of Photogrammetry, Remote Sensing & Spatial Information Sciences, Proceedings of the XXIII ISPRS Congress, Prague, Czech Republic, 12–19 July 2016; ISPRS: Hannover, Germany, 2016; Volume III-1. [Google Scholar]
  24. De Franchis, C.; Meinhardt-Llopis, E.; Michel, J.; Morel, J.-M.; Facciolo, G. An automatic and modular stereo pipeline for pushbroom images. ISPRS Ann. Photogramm. Remote Sens. Spatial Inf. Sci. 2014, II–3, 49–56. [Google Scholar] [CrossRef] [Green Version]
  25. Huang, X.; Han, Y.; Hu, K. An Improved Semi-Global Matching Method with Optimized Matching Aggregation Constraint. In Proceedings of the IOP Conference Series: Earth and Environmental Science, Chengdu, China, 18–20 July 2020; Volume 569, p. 012050. [Google Scholar]
  26. Saeed, M.; Ghuffar, S. Semantic Stereo Using Semi-Global Matching and Convolutional Neural Networks. In Proceedings of the Image and Signal Processing for Remote Sensing XXVI, Online Only, UK, 21–25 September 2020; pp. 297–304. [Google Scholar]
  27. Kim, S.; Rhee, S.; Kim, T. Digital surface model interpolation based on 3D mesh models. Remote Sens. 2018, 11, 24. [Google Scholar] [CrossRef] [Green Version]
  28. Krauß, T.; Reinartz, P. Enhancment of Dense Urban Digital Surface Models from Vhr Optical Satellite Stereo Data by Pre-Segmentation and Object Detection. In Proceedings of the Canadian Geomatics Conference 2010, Calgary, AB, Canada, 15–18 June 2010. [Google Scholar]
  29. Li, Z.; Gruen, A. Automatic DSM Generation from Linear Array Imagery Data. In Proceedings of the ISPRS 2004, Istanbul, Turkey, 12–23 July 2004; pp. 12–23. [Google Scholar]
  30. Eckert, S.; Hollands, T. Comparison of automatic DSM generation modules by processing IKONOS stereo data of an urban area. IEEE J. Sel. Top. Appl. Earth Obs. Remote Sens. 2010, 3, 162–167. [Google Scholar] [CrossRef]
  31. Hu, D.; Ai, M.; Hu, Q.; Li, J. An Approach of DSM Generation from Multi-View Images Acquired by UAVs. In Proceedings of the 2nd ISPRS International Conference on Computer Vision in Remote Sensing (CVRS 2015), Xiamen, China, 28–30 April 2015; pp. 310–315. [Google Scholar]
  32. Wang, W.; Zhao, Y.; Han, P.; Zhao, P.; Bu, S. Terrainfusion: Real-Time Digital Surface Model Reconstruction Based on Monocular Slam. In Proceedings of the 2019 IEEE/RSJ International Conference on Intelligent Robots and Systems (IROS), Macau, China, 3–8 November 2019; pp. 7895–7902. [Google Scholar]
  33. Zhou, W.; Guo, Q.; Lei, J.; Yu, L.; Hwang, J.-N. IRFR-Net: Interactive recursive feature-reshaping network for detecting salient objects in RGB-D images. IEEE Trans. Neural Netw. Learn. Syst. 2021, 1–13. [Google Scholar] [CrossRef]
  34. Yin, M.; Zhu, Y.; Yin, G.; Fu, G.; Xie, L. Deep Feature Interaction Network for Point Cloud Registration, With Applications to Optical Measurement of Blade Profiles. IEEE Trans. Ind. Inform. 2022, 1–10. [Google Scholar] [CrossRef]
  35. Gong, K.; Fritsch, D. A Detailed Study about Digital Surface Model Generation Using High Resolution Satellite Stereo imagery. In ISPRS Annals of Photogrammetry, Remote Sensing & Spatial Information Sciences, Proceedings of the XXIII ISPRS Congress, Prague, Czech Republic, 12–19 July 2016; ISPRS: Hannover, Germany, 2016; Volume III-1. [Google Scholar]
  36. Qin, R.; Ling, X.; Farella, E.M.; Remondino, F. Uncertainty-Guided Depth Fusion from Multi-View Satellite Images to Improve the Accuracy in Large-Scale DSM Generation. Remote Sens. 2022, 14, 1309. [Google Scholar] [CrossRef]
  37. d’Angelo, P.; Kuschk, G. Dense Multi-View Stereo from Satellite Imagery. In Proceedings of the 2012 IEEE International Geoscience and Remote Sensing Symposium, Munich, Germany, 22–27 July 2012; pp. 6944–6947. [Google Scholar]
  38. Wang, K.; Stutts, C.; Dunn, E.; Frahm, J.-M. Efficient Joint Stereo Estimation and Land Usage Classification for Multiview Satellite Data. In Proceedings of the 2016 IEEE Winter Conference on Applications of Computer Vision (WACV), Lake Placid, NY, USA, 7–10 March 2016; pp. 1–9. [Google Scholar]
  39. Pollard, T.; Mundy, J.L. Change Detection in a 3-d world. In Proceedings of the 2007 IEEE Conference on Computer Vision and Pattern Recognition, Minneapolis, MN, USA, 17–22 June 2007; pp. 1–6. [Google Scholar]
  40. Zhang, Y.; Zheng, Z.; Luo, Y.; Zhang, Y.; Wu, J.; Peng, Z. A CNN-Based Subpixel Level DSM Generation Approach via Single Image Super-Resolution. Photogramm. Eng. Remote Sens. 2019, 85, 765–775. [Google Scholar] [CrossRef]
  41. Vu, H.-H.; Labatut, P.; Pons, J.-P.; Keriven, R. High accuracy and visibility-consistent dense multiview stereo. IEEE Trans. Pattern Anal. Mach. Intell. 2011, 34, 889–901. [Google Scholar] [CrossRef] [PubMed]
  42. Li, S.; Siu, S.Y.; Fang, T.; Quan, L. Efficient Multi-View Surface Refinement with Adaptive Resolution Control. In Proceedings of the European Conference on Computer Vision, Amsterdam, The Netherlands, 11–14 October 2016; pp. 349–364. [Google Scholar]
  43. Blaha, M.; Rothermel, M.; Oswald, M.R.; Sattler, T.; Richard, A.; Wegner, J.D.; Pollefeys, M.; Schindler, K. Semantically Informed Multiview Surface Refinement. In Proceedings of the IEEE International Conference on Computer Vision, Venice, Italy, 22–29 October 2017; pp. 3819–3827. [Google Scholar]
  44. Li, L.; Yao, J.; Lu, X.; Tu, J.; Shan, J. Optimal seamline detection for multiple image mosaicking via graph cuts. ISPRS J. Photogramm. Remote Sens. 2016, 113, 1–16. [Google Scholar] [CrossRef]
  45. Dalal, N.; Triggs, B. Histograms of Oriented Gradients for Human Detection. In Proceedings of the 2005 IEEE Computer Society Conference on Computer Vision and Pattern Recognition (CVPR’05), San Diego, CA, USA, 20–25 June 2005; pp. 886–893. [Google Scholar]
  46. Solic, P.; Colella, R.; Catarinucci, L.; Perkovic, T.; Patrono, L. Proof of presence: Novel vehicle detection system. IEEE Wirel. Commun. 2019, 26, 44–49. [Google Scholar] [CrossRef]
  47. Liu, Y.; Ge, Y.; Wang, F.; Liu, Q.; Lei, Y.; Zhang, D.; Lu, G. A Rotation Invariant HOG Descriptor for Tire Pattern Image Classification. In Proceedings of the ICASSP 2019-2019 IEEE International Conference on Acoustics, Speech and Signal Processing (ICASSP), Brighton, UK, 12–17 May 2019; pp. 2412–2416. [Google Scholar]
  48. Song, P.-L.; Zhu, Y.; Zhang, Z.; Zhang, J.-D. Subsampling-Based HOG for Multi-Scale Real-Time Pedestrian Detection. In Proceedings of the 2019 IEEE International Conference on Cybernetics and Intelligent Systems (CIS) and IEEE Conference on Robotics, Automation and Mechatronics (RAM), Bangkok, Thailand, 18–20 November 2019; pp. 24–29. [Google Scholar]
  49. Bosch, M.; Kurtz, Z.; Hagstrom, S.; Brown, M. A Multiple View Stereo Benchmark for Satellite Imagery. In Proceedings of the 2016 IEEE Applied Imagery Pattern Recognition Workshop (AIPR), Washington, DC, USA, 18–20 October 2016; pp. 1–9. [Google Scholar]
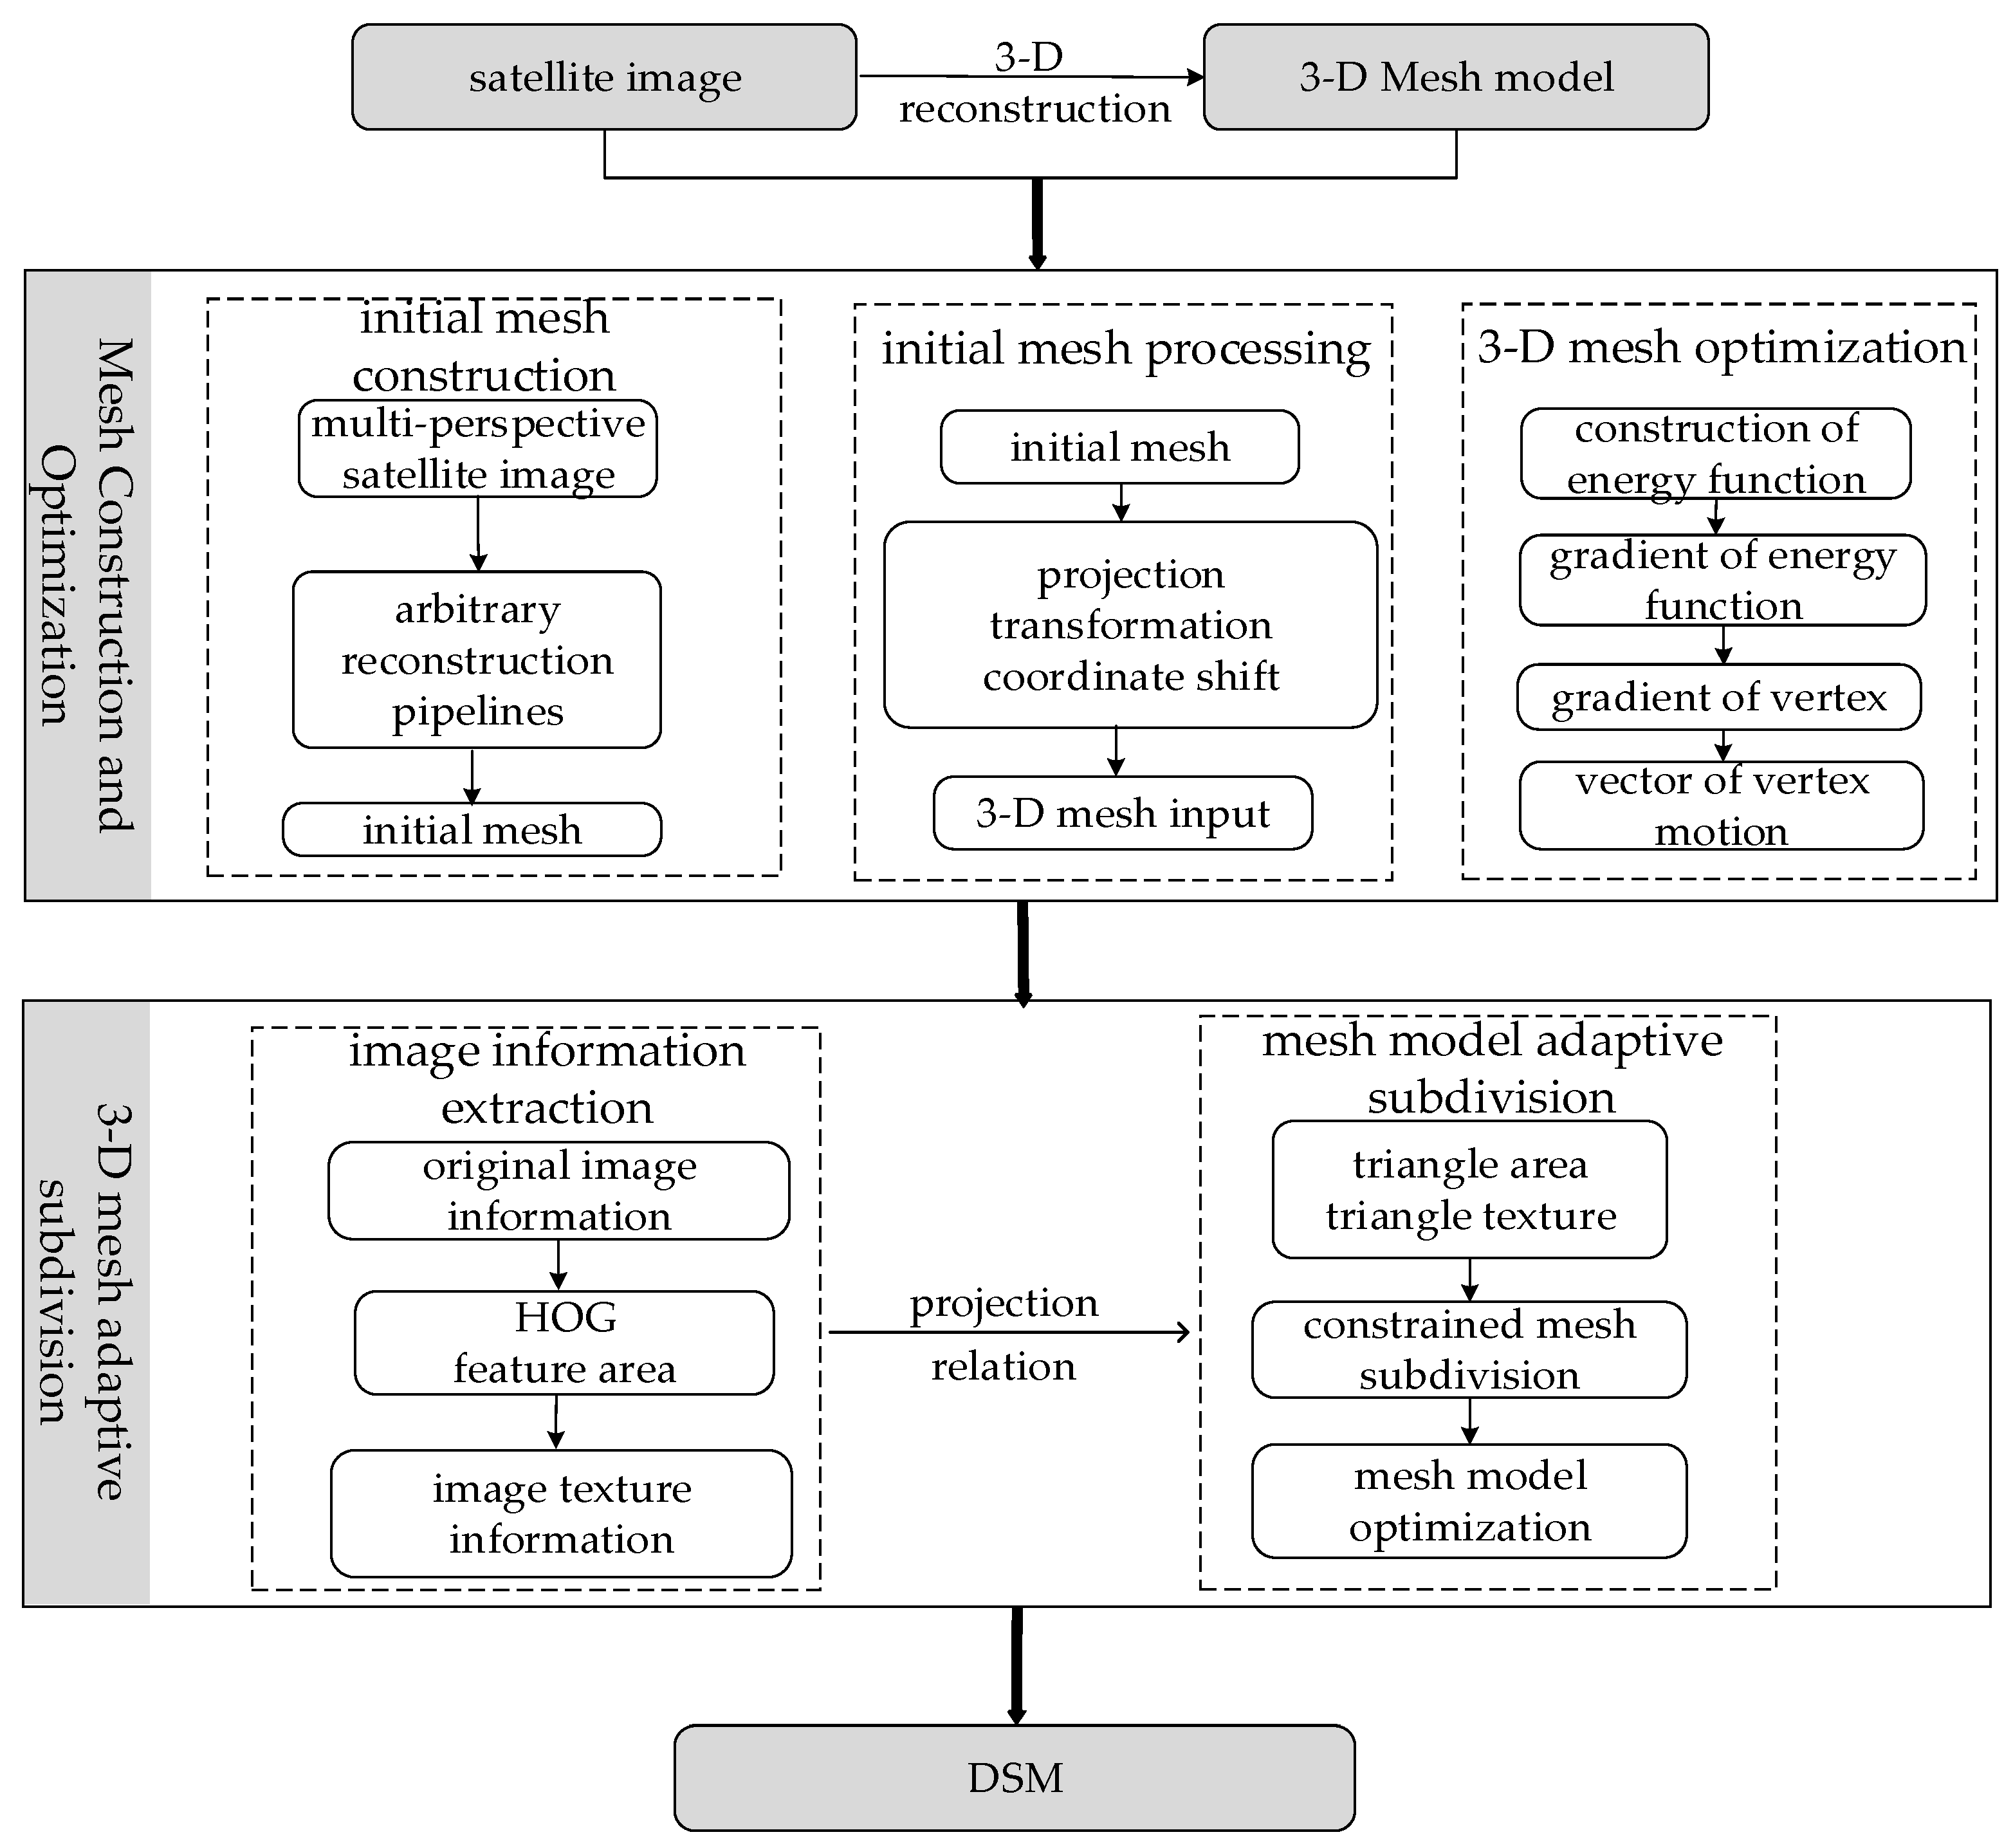
Figure 1. Flow chart of the mesh refinement method.
Remotesensing 14 06259 g001
Figure 2. Reprojection diagram between a reference image and reprojected image.
Remotesensing 14 06259 g002
Figure 3. Diagram of the Laplace operation for vertices in a mesh.
Remotesensing 14 06259 g003
Figure 4. Diagram of the resolution between image point and object point.
Remotesensing 14 06259 g004
Figure 5. Simulation of a ray.
Remotesensing 14 06259 g005
Figure 6. Multi-scale refinement strategies from low to high.
Remotesensing 14 06259 g006
Figure 7. Results of the two views: (a) original image pair, (b) coarse mesh generated by the pair, (c) the result after refinement (grayscale rendering), (d) coarse mesh (color rendering), (e) refined result (color rendering).
Remotesensing 14 06259 g007
Figure 8. Results with different conditions (a) result with higher projection area threshold (b) result with low texture complexity threshold (c) result with suitable parameters.
Remotesensing 14 06259 g008
Figure 9. WorldView-3 image: (a) test site 1, (b) test site 2.
Remotesensing 14 06259 g009
Figure 10. Ground truth LiDAR DSM data: (a) test site 1, (b) test site 2.
Remotesensing 14 06259 g010
Figure 11. Results of refinement: (a) test site 1, (b) test site 2.
Remotesensing 14 06259 g011
Figure 12. Local details of refinement and the PCI result (test site 1).
Remotesensing 14 06259 g012
Figure 13. Results for test site 1 with different methods: (a) input, (b) refinement, (c) SGM, (d) PCI.
Remotesensing 14 06259 g013
Figure 14. Details of local areas (a) Low-rise buildings (b) Point cloud of Low-rise buildings (c) Single building (d) Point cloud of Single building (e) Mid-rise buildings (f) Point cloud of Mid-rise buildings (g) Dense building area (h) Point cloud of Dense building area.
Remotesensing 14 06259 g014
Table 1. Experimental Results with Different Parameters.
Texture Complexity ThresholdProjection Area ThresholdIterations
a0.324255
b02255
c0.32255
Table 2. Evaluation results for the test sites with the benchmark PCI and refinement methods.
PCI ResultSGMRefinement Result
Test site 1Completeness [%]645768
RMS [m]2.262.782.04
NMAD [m]0.790.850.76
Test site 2Completeness [%]524649
RMS [m]3.364.173.88
NMAD [m]1.441.671.08
Publisher’s Note: MDPI stays neutral with regard to jurisdictional claims in published maps and institutional affiliations.