Abstract
Although previous studies have recorded that tropical cyclones cause a significant increase in chlorophyll a concentration (Chl-a), most of these results were only based on surface Chl-a observed by satellite data. Using satellite, reanalysis and model data, this study investigated the response of the upper ocean and sea surface Chl-a to three different levels of tropical cyclones in the South China Sea. In our results, the severe tropical storm (STS) did not cause an increase in surface Chl-a or depth-integrated Chl-a in the short term (i.e., ~2 days); the typhoon (TY) increased the surface Chl-a from 0.12 mg·m−3 to 0.15 mg·m−3 in the short term, but the depth-integrated Chl-a did not increase significantly; the super typhoon (STY) caused the surface Chl-a to increase from 0.15 mg·m−3 to 0.37 mg·m−3 in the short term, and also increased the depth-integrated Chl-a from 40.41 mg·m−2 to 42.59 mg·m−2. These results suggest that the increase in the surface Chl-a after TY and STY were primarily caused by physical processes (e.g., vertical mixing). However, the increase in the depth-integrated Chl-a of STY may be due to the entrainment of both nutrients and phytoplankton through upwelling and turbulent mixing under the influence of STY.
1. Introduction
Tropical cyclones primarily occur in tropical and subtropical regions. The South China Sea (SCS) is affected by tropical cyclones all year round, including those that move from the Northwest Pacific to the SCS and those generated within the SCS itself. Due to its location on the west coast of the Pacific Ocean, combined with a long coastline, China is the country most frequently hit by tropical cyclones, with an average of 9.3 per year [1]. Tropical cyclones are divided into tropical depression, tropical storm, severe tropical storm (STS), typhoon (TY), severe typhoon and super typhoon (STY), according to the Chinese national standard Intensity Category for Tropical Cyclones (GB/T 19201–2006) [2]. Tropical cyclones severely impact the marine environment. They induce upwelling, vertical mixing and entrainment processes, thus impacting the growth of marine phytoplankton in the upper ocean. Chlorophyll a concentration (Chl-a) is generally used to characterize the biomass of phytoplankton, which is an important measure of marine primary productivity [3,4,5]. The vertical distribution of Chl-a in the ocean is irregular [6]. In most tropical and subtropical regions, a subsurface chlorophyll maximum (SCM) exists all year round [7] and is responsible for 30~70% of total productivity of the whole water column [8,9]. Satellite data only show the distribution of sea surface Chl-a, and hence miss information about Chl-a below the surface layer.
Before satellite-based remote sensing techniques became readily available, researchers observed tropical cyclones passing through an area using a number of fixed-point buoy stations, and obtained some sparse measured data to help people study and understand, preliminarily, the response of the upper ocean to tropical cyclones [10,11,12,13,14]. With the development of satellite-based remote sensing techniques, more comprehensive observation data of severe weather processes (such as tropical cyclones) became possible, augmenting field measurements in the study of tropical cyclones. Many such studies have documented a large increase in surface Chl-a caused by tropical cyclones. Based on 13 tropical cyclones passing through the oligotrophic sea, Babin et al. [15] found that the surface Chl-a increased significantly in the cooling area of the sea surface after the tropical cyclone passed, which was apparently a response to the injection of nutrients into the oligotrophic surface water. Zheng and Tang [16] analyzed the phytoplankton bloom events induced by tropical cyclone “Damrey” in the SCS and showed that vertical mixing and upwelling caused two phytoplankton blooms in the northern SCS. Sun et al. [17] reached a similar conclusion in the central SCS, where strong upwelling was generated when the forcing time of the tropical cyclone was long enough, leading a more significant phytoplankton response in the upper ocean. Obtaining measurements or observations from ships to understand the key processes is very difficult due to the severe sea surface conditions during tropical cyclones. Therefore, based on satellite data, previous studies have been limited to the discussion of surface Chl-a and environmental factors, without analysis of the biogeochemical process at vertical depth.
Entrainment mixing and Ekman pumping can both bring nutrients upwards to the euphotic zone, thus promoting the increase in Chl-a [18,19,20,21]. More importantly, entrainment mixing induced by tropical cyclones can also bring phytoplankton in the SCM layer to the surface or subsurface, resulting in the reduction in phytoplankton in the SCM layer. Individual studies have shown that the increase in surface Chl-a during tropical cyclones was not only related to the growth and reproduction of phytoplankton, but also related to the physical redistribution of phytoplankton [22,23,24]. As early as 2005, Walker et al., speculated that the Chl-a increase caused by hurricanes might be due to phytoplankton carried up from the SCM layer to the surface [25]. More recent studies have shown that the initial rapid increase in the surface Chl-a and the decrease in the subsurface Chl-a were mainly caused by physical processes (e.g., vertical mixing), by a one-dimensional physical-biogeochemical coupled model [23], or by strong near-inertial turbulent mixing induced by tropical cyclones [22].
The purpose of this study was to determine the relative importance of the two potential impacts of tropical cyclones on algal blooms, namely: (1) local phytoplankton blooms caused by nutrient supply; and (2) the redistribution of phytoplankton in the SCM layer, caused by vertical transport during the short period (i.e., ~2 days) of storm transit (Figure 1). In addition, this study aimed to determine whether the intensity of a tropical cyclone changed the relative importance of these two processes.
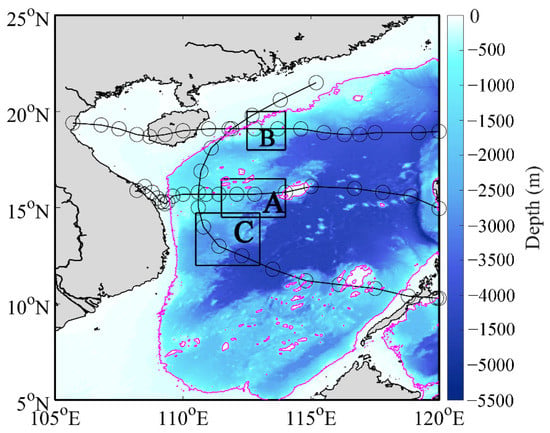
Figure 1.
Depth map of the SCS. The black box A represented the selected study area (111.5–114°E, 14.5–16.5°N) of STS “Conson”; The black box B represented the selected study area (112.5–114°E, 18–20°N) of TY “Kompasu”; The black box C represented the selected study area (110.5–113°E, 12–14.725°N) of STY “Rai”. The pink line represented the 200 m isobath; the black circle represented the location of the tropical cyclones every 6 h; the black line represented the path of the tropical cyclones.
2. Materials and Methods
2.1. Data
2.1.1. Tropical Cyclones Data
The tropical cyclones data were available from the best-track typhoon dataset from Typhoon Online (www.typhoon.org.cn, accessed on 19 July 2022) [26,27], which included the location and intensity of tropical cyclones in the northwest Pacific Ocean, including the SCS, with an interval of every 3 to 6 h since 1949. The data used in this study contained the maximum sustained wind speed (MSW) and the longitude/latitude of the center of the tropical cyclones every 3 h.
The STS “Conson” was formed on 5 September 2021 in the Pacific Northwest Ocean. It began to enter the SCS at around 16:00 on 8 September, with a MSW of 28 m·s−1, and finally disappeared in the China-Indochina Peninsula on 19 September (Figure 2a). The TY “Kompasu” was formed on the surface of the Northwest Pacific Ocean on 8 October 2021. It began to enter the SCS at around 18:00 on 10 October, with a MSW of 33 m·s−1. Around 7:00 on 13 October, it landed on the coast of Qionghai City, Hainan Province. At 12:00 on 14 October, the weakened tropical depression of TY “Kompasu” landed on the coast of northern Vietnam (Figure 2b). The STY “Rai” was formed on the surface of the northwestern Pacific Ocean on 12 December 2021, and it traveled westward and gradually strengthened. It entered the SCS at 6:00 on 17 December and intensified into a STY at 6:00 on 18 December. After 6:00 on 19 December, it began to gradually weaken northward and weakened into a tropical depression in the northern part of the SCS at 6:00 on 21 December, and then gradually dissipated (Figure 2c).

Figure 2.
Track and intensity of (a) STS “Conson”, (b) TY “Kompasu”, (c) STY “Rai” in the SCS. MSW: maximum sustained wind speed (m·s−1). The solid circles with different colors represented different MSW. The three black boxes were the study areas of the three tropical cyclones marked in Figure 1. Dates were given as “mm dd, yy”.
2.1.2. Satellite Data
The 6 hourly wind data were obtained from the Cross-Calibrated Multi-Platform (CCMP), at 0.25° × 0.25°spatial resolution. The CCMP gridded surface vector winds were produced using satellite, moored buoy, and model wind data, and as such, were considered to be a Level-3 ocean vector wind analysis product (https://www.remss.com/measurements/wind/, accessed on 26 July 2022). In addition, Ekman Pumping Velocity (EPV) in the study regions A, B and C were investigated to clarify the change of Chl-a, and the possible roles that wind fields play during tropical cyclones.
2.1.3. Reanalysis and Model Data
The Chl-a data were from global ocean analysis and forecast at 0.25° × 0.25° spatial resolution, provided by Copernicus Marine Environment Monitoring Service (CMEMS) (https://resources.marine.copernicus.eu/product-detail/GLOBAL_ANALYSIS_FORECAST_BIO_001_028/, accessed on 19 July 2022). The operational Mercator Ocean biogeochemical global ocean analysis and forecast system, at 0.25° × 0.25° spatial resolution, provided 10 days of 3D global ocean forecasts, updated weekly. This product included daily and monthly mean files of biogeochemical parameters over the global ocean. The global ocean output files were displayed with a 0.25° × 0.25° spatial resolution with regular longitude/latitude equirectangular projection. Fifty vertical levels ranged between 0 and 5700 m. The simulated surface and vertical distribution of Chl-a showed good consistency with the satellite data and the biogeochemical Argo measurement results (http://marine.copernicus.eu/documents/QUID/CMEMS-GLO-QUID-001-028.pdf, accessed on 24 November 2022). In addition, in order to verify the applicability of the global model in the SCS, we used the in situ Chl-a observation data [6] in different water layers (0–200 m) in August 2018 to compare with the CMEMS Chl-a data in the same period in the northern SCS (Figure 3). The spatial average was employed for the region of 1° × 1°, centered on every in situ location, respectively. The results showed that there was a good linear relationship between the in situ Chl-a and the CMEMS Chl-a (R2 = 0.7237, p < 0.01, RMSE = 0.11 mg·m−3) (Figure 3), suggesting that the CMEMS Chl-a was also applicable in the SCS.
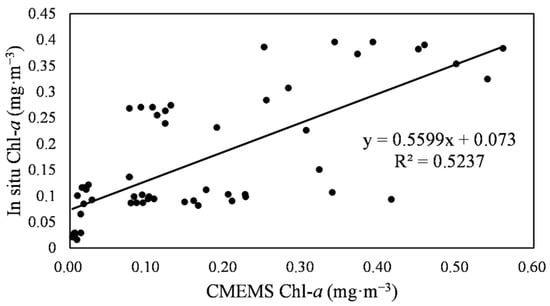
Figure 3.
Scatter diagrams of in situ Chl-a (mg·m−3) and CMEMS Chl-a (mg·m−3).
The temperature and salinity data were from the operational Mercator global ocean analysis and forecast system, at 0.083° × 0.083° spatial resolution (https://resources.marine.copernicus.eu/product-detail/GLOBAL_ANALYSIS_FORECAST_PHY_001_024/, accessed on 22 July 2022). The Operational Mercator global ocean analysis and forecast system, at 0.083° × 0.083° spatial resolution, provided 10 days of 3D global ocean forecasts, updated daily. This product included daily and monthly mean files of temperature, salinity, currents, sea level, mixed layer depth and ice parameters from the top to the bottom over the global ocean. It also included hourly mean surface fields for sea level height, temperature and currents. The global ocean output files were displayed with a 0.083° × 0.083° spatial resolution with regular longitude/latitude equirectangular projection. Fifty vertical levels ranged between 0 and 5500 m.
The mixed layer depth (MLD) data were derived from the Hybrid Coordinate Ocean Model (HYCOM) assimilation product co-operated by the University of Miami modeling group and the Naval Research Lab (https://www.hycom.org/, accessed on 26 July 2022). The time resolution of the data was 3 h, and the spatial resolution was 0.083° × 0.083°.
The World Ocean Atlas 2018 (WOA18) was obtained from the Ocean Climate Laboratory of the National Oceanographic Data Center (https://www.ncei.noaa.gov/access/world-ocean-atlas-2018/bin/, accessed on 22 July 2022). The spatial resolution of monthly nitrate was 1° × 1°.
2.2. Methods
2.2.1. Ekman Pumping Velocity
EPV regulates the intensity of upwelling through wind-driven offshore transport. The EPV is used to evaluate possible vertical transport induced by wind fields, and calculate them using the wind stress vector [28].
where EPV is the Ekman pumping velocity (m·s−1) induced by wind stress curls (); is a Coriolis parameter (); is a unit tangent vector to the local coastline; and are seawater (1.025 × 10³ kg·m−3) and air (1.29 kg·m−3) densities, respectively; is wind speed; and is the drag coefficient.
2.2.2. Depth-Integrated Chl-a
In this study, we took the average of depth-integrated Chl-a of the first two days of the three tropical cyclones and compared them with the average of the depth-integrated Chl-a of the last two days. The depth-integrated Chl-a was calculated as follows:
where Chl-a(int) is the depth-integrated Chl-a in water column (mg·m−2) (here Chl-a(int) is calculated from surface to the 200 m layer), Chl-a(i) is the concentration of Chl-a in the layer (i) (mg·m−3), Di is the depth of layer i (m), n is the number of layers.
3. Results
3.1. The Changes of Phytoplankton Chl-a before and after the Passage of Tropical Cyclones
The Chl-a in study area A (Figure 1) was relatively unaffected by the STS “Conson” (Figure 4), with before (9–10 September 2021) and after (11–12 September 2021) levels approximately the same (mean Chl-a concentrations are 0.14 mg·m−3 and 0.15 mg·m−3, respectively). Similarly, the SCM depth of 40 m remained unchanged as the storm passed. The maximum value of Chl-a (about 1.1 mg·m−3) in the subsurface layer appears at the depth of 40 m before and after the STS (Figure 4b).
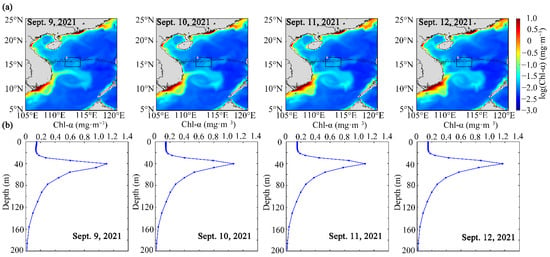
Figure 4.
Chl-a changes before and after the passage of STS “Conson”. (a) Horizontal distribution of surface Chl-a. (b) Vertical profiles of the regional average of Chl-a in the black box of the study area. Before the passing of STS (9–10 September 2021), after the passing of STS (11–12 September 2021). The black hollow circle represented the location of the STS every 6 h, and the black line represented the path of the STS.
The passing of the TY “Kompasu” resulted in an increase in the surface Chl-a concentration in study area B (Figure 1), from 0.12 mg·m−3 to 0.15 mg·m−3 (Figure 5). It also caused a decrease in the depth of the SCM, from 55 m to 47 m. After the TY passed, the depth of the SCM layer decreased by approximately 8 m, and the average Chl-a concentration in the SCM layer decreased by approximately 0.1 mg·m−3 (Figure 5b).
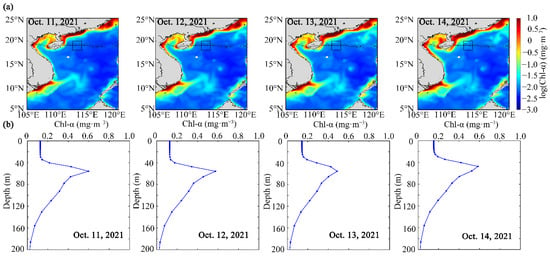
Figure 5.
Chl-a changes before and after the passage of TY “Kompasu”. (a) Horizontal distribution of surface Chl-a. (b) Vertical profiles of the regional average of Chl-a in the black box of the study area. Before the passing of TY (11–12 October 2021), after the passing of TY (13–14 October 2021). The black hollow circle represented the location of the TY every 6 h, and the black line represented the path of the TY.
The passing of STY “Rai” caused a significant increase in the surface Chl-a concentration in the study area (from 0.15 mg·m−3 to 0.37 mg·m−3), see Figure 6. After the STY passed, the depth of the SCM layer decreased by approximately 10 m, and the average Chl-a concentration in the SCM layer decreased by approximately 0.4 mg·m−3 (Figure 6b).
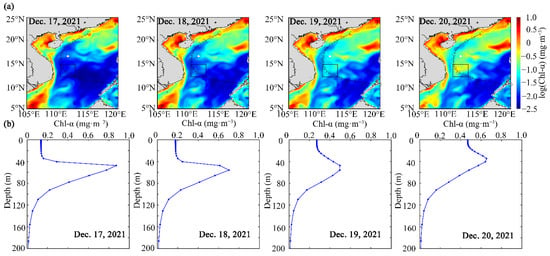
Figure 6.
Chl-a changes before and after the passage of STY “Rai”. (a) Horizontal distribution of surface Chl-a. (b) Vertical profiles of the regional average of Chl-a in the black box of the study area. Before the passing of STY (17–18 December 2021), after the passing of STY (19–20 December 2021). The black hollow circle represented the location of the STY every 6 h, and the black line represented the path of the STY.
Whether the increase in Chl-a in the sea surface was caused by vertical redistribution of phytoplankton and/or by ecological process was a key issue to identify. Therefore, the depth-integrated Chl-a of the three tropical cyclones were calculated in the upper 200 m of the water column before and after their transit in order to further clarify this difference. The depth-integrated Chl-a and the average surface Chl-a concentration of the STS “Conson” did not increase significantly after the passing of the STS (Figure 7). The average Chl-a concentration in the surface layer of the TY “Kompasu” increased after the TY, but the depth-integrated Chl-a did not increase. After the passing of STY “Rai”, the most intense tropical cyclone studied, both the average Chl-a concentration in the surface layer and the depth-integrated Chl-a increased.
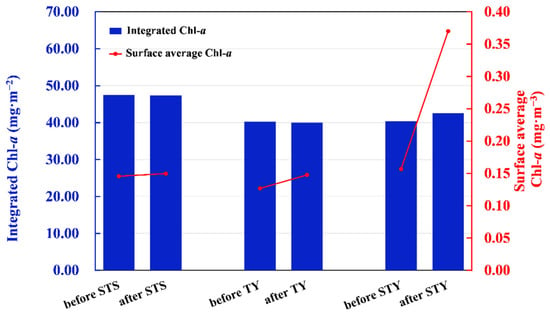
Figure 7.
Chl-a concentration changes before and after the transit of STS, TY and STY. The histogram showed the depth-integrated Chl-a in the black box (Figure 1) of the study areas before and after the tropical cyclones. The red dotted line graph showed the average Chl-a concentration in the surface area of the study area before and after the tropical cyclones.
3.2. Vertical Distribution of Temperature and Salinity before and after the Passage of Tropical Cyclones
Before and after the passage of the STS “Conson”, the average temperature and salinity profiles were obtained along the latitude of the study areas (Figure 8). Under the influence of a weak tropical cyclone, the temperature and salinity in the study area showed basically the same distribution trend before and after the passage of the STS. In the short term (i.e., ~2 days), after the STS passed, the 23.5 °C isotherm and 33.8 isohaline were consistent with the distribution trend before the STS (within 2 days) (Figure 8).
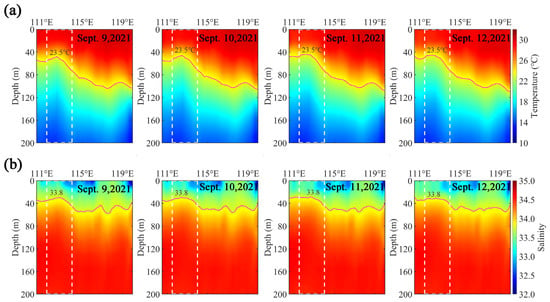
Figure 8.
Vertical profile of (a) temperature and (b) salinity averaged along the latitude before and after the passage of STS “Conson”. Before the passing of STS (9–10 September 2021), after the passing of STS (11–12 September 2021). Vertical profile of the white dotted line box was the black box A in Figure 1. The red lines represent (a) 23.5 °C isotherm and (b) 33.8 isohaline.
The temperature and salinity profiles were also obtained before and after the passage of the TY “Kompasu” (Figure 9). Before the passing of TY, the vertical distribution (white dotted box) of temperature (23.5 °C isotherm) and salinity (33.8 isohaline) in the study area was concave with a thermocline of 70–80 m and a salinity thermocline of 45–50 m (Figure 9). After the passing of TY, the upper boundary of the temperature and salinity thermocline in the study area (white dotted box) appeared to show weak contour uplift to 65–70 m and 40–45 m, respectively (Figure 9).
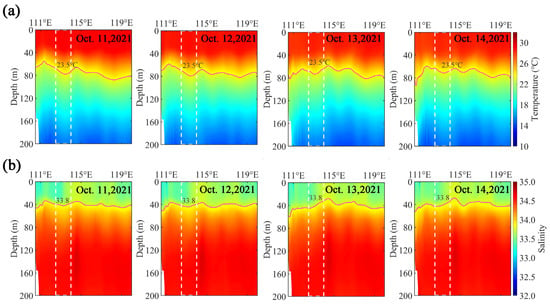
Figure 9.
Vertical profile of (a) temperature and (b) salinity averaged along the latitude before and after the passage of TY “Kompasu”. Before the passing of TY (11–12 October 2021), after the passing of TY (13–14 October 2021). Vertical profile of the white dotted line box was the black box B in Figure 1. The red lines represent (a) 23.5 °C isotherm and (b) 33.8 isohaline.
The average temperature and salinity profiles, obtained before and after the passage of the STY “Rai”, showed more significant contour uplift (Figure 10), with the thermocline shallowing from 55–60 m to 40–50 m and the halocline from 50–55 m to 40–50 m.
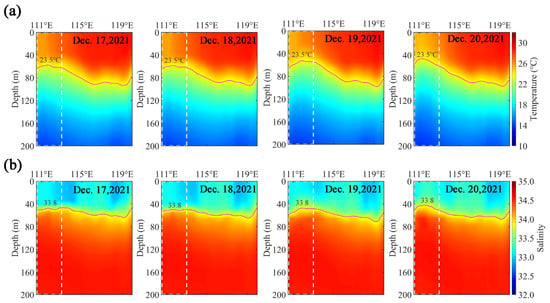
Figure 10.
Vertical profile of (a) temperature and (b) salinity averaged along the latitude before and after the passage of STY “Rai”. Before the passing of STY (17–18 December 2021), after the passing of STY (19–20 December 2021). Vertical profile of the white dotted line box was the black box C in Figure 1. The red lines represent (a) 23.5 °C isotherm and (b) 33.8 isohaline.
3.3. Change of Wind Stress before and after the Passage of Tropical Cyclones
To further explore the impact of marine internal dynamic mechanisms on phytoplankton blooms, we estimated EPV caused by STS, TY and STY (Figure 11). EPV represents the intensity of upwelling (positive EPV) or downwelling (negative EPV). During the transit of STS, TY and STY, the EPV gradually increased in sequence. The average EPV in the three study areas reached more than 10−4 m·s−1, but the EPV caused by STY (6 × 10⁻⁴ m·s−1) was about four times that of TY (1.5 × 10⁻⁴ m·s−1) and STS (1.5 × 10⁻⁴ m·s−1) (Figure 11). After the passing of the three tropical cyclones, the EPV at the three study areas returned to the previous level, and the MLD became shallower (Figure 11 and Figure 12). During the storm, the MLD of STS only deepened from 12–24 m, shallower than the euphotic layer. Under the influence of STY, its EPV caused by the strong wind stress was stronger than TY and STS (Figure 11). However, the MLD deepening/reduction in the study area under the influence of STY and TY was relatively similar, indicating that the degree of ocean mixing in these two areas was relatively consistent after the transit of the tropical cyclones (Figure 12).
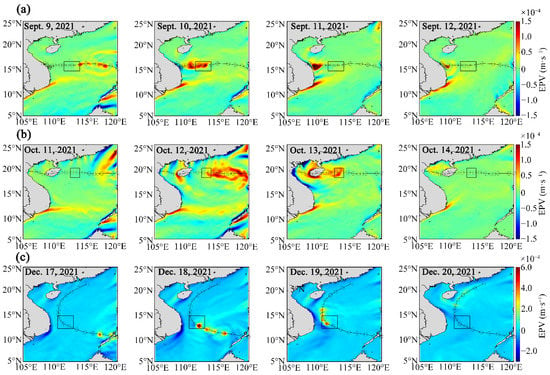
Figure 11.
The EPV before and after the passage of (a) STS “Conson”, (b) TY “Kompasu” and (c) STY “Rai”. Before the passing of STS (9–10 September 2021), after the passing of STS (11–12 September 2021). Before the passing of TY (11–12 October 2021), after the passing of TY (13–14 October 2021). Before the passing of STY (17–18 December 2021), after the passing of STY (19–20 December 2021). The black circle represented the location of the tropical cyclones every 6 h. The black line represented the path of the tropical cyclones. The color bar range of STS and TY is −1.5~1.5 × 10⁻⁴ m·s−1 and STY is −3.0~6.0 × 10⁻⁴ m·s−1.
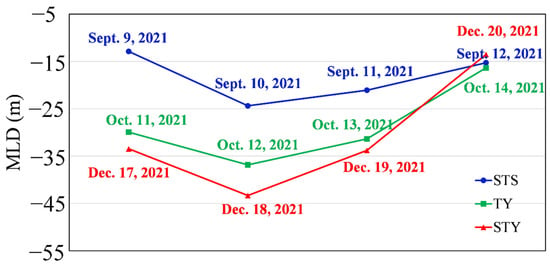
Figure 12.
The MLD before and after the passage of STS “Conson”, TY “Kompasu” and STY “Rai”. Before the passing of STS (9 September 2021), during the STS (10 September 2021), after the passing of STS (11–12 September 2021). Before the passing of TY (11 October 2021), during the TY (12 October 2021), after the passing of TY (13–14 October 2021). Before the passing of STY (17 December 2021), during the STY (18 December 2021), after the passing of STY (19–20 December 2021).
3.4. Spatial Variation of Climatic Background Field
We selected the vertical profiles of climatic temperature, salinity, density and nitrate in the study areas, between 2007 and 2015, to judge whether the study areas we selected could be affected by the background fields (such as upwelling, vortex, etc.). The temperature increased along the longitude direction (from 110.5°E to 120°E) for the same water depth in the area of the STS (Figure 13). The temperature was consistent with the density and nitrate distribution trend. The density and nitrate decreased gradually along the longitude, from 110.5°E to 120°E. The vertical distribution of salinity above 50 m was relatively low, and the distribution below 50 m was relatively uniform (Figure 13). At the same water depth location in the area of the TY, the temperature gradually increased along the longitude direction (from 110.5°E to 120°E) (Figure 13). The salinity was low above 40 m and uniformly distributed below 40 m. The density and nitrate increased with the water depth (Figure 13). The temperature, density and nitrate increased with the water depth as the STY passed. The salinity above 40 m was relatively low, and the distribution below 40 m was relatively uniform (Figure 13).
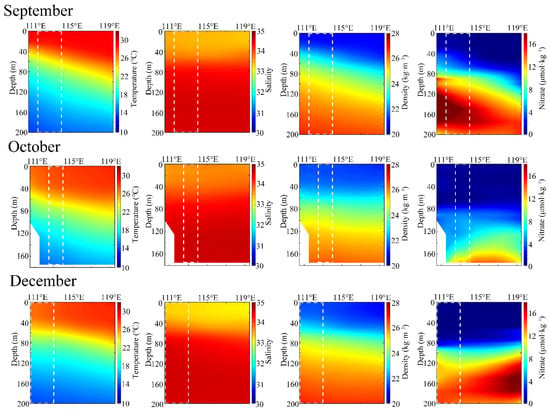
Figure 13.
Vertical distribution of temperature, salinity, density and nitrate in September, October and November of WOA18. Along the latitude average, the white dotted line represents the black box area of Figure 1.
4. Discussion
4.1. Redistribution of Chl-a Caused by Vertical Mixing of Tropical Cyclones
Tropical cyclones affect the upper marine environment by inducing upwelling, vertical mixing and entrainment processes. When tropical cyclones pass over the upper ocean, strong ocean-air interactions occur, resulting in the strong mixing of the upper ocean. Nutrient-rich cold water is carried from the deep layer into the upper ocean mixing layer, deepening the mixing layer and leading to a drop in the sea surface temperature and the growth of phytoplankton [15,29,30,31]. Phytoplankton from the deep layers enter the surface layer through vertical mixing, resulting in a temporary increase in Chl-a in the surface layer. However, the increase in surface Chl-a does not present any contribution to the increase in the vertical integrated Chl-a. This agrees with the work of Walker et al. [25], Pan et al. [23] and Wang et al. [22]. Our analysis confirms that the increase in the surface Chl-a concentration, after the passing of tropical cyclones and below a certain intensity, was only the result of vertical mixing inducing re-distribution of Chl-a in the upper water column.
For STS and TY, although the intensity of the tropical cyclone was different, the EPV caused by the associated strong winds were both approximately 1.5 × 10⁻⁴ m s−1 (Figure 11). During the transit of the tropical cyclones, the MLD of STS and TY were deepened (Figure 12). However, TY caused stronger mixing and deeper MLD, which was more than 10 m deeper than STS (Figure 12), indicating that the water disturbance in the study area was more intense during TY. Before and after the transit of STS and TY, the depth-integrated Chl-a did not increase in the short term (i.e., ~2 days) (Figure 7); however, the surface Chl-a concentration of TY increased (Figure 7), which may be related to the redistribution of Chl-a caused by vertical mixing. We found that the temperature and salinity under the influence of STS were basically unchanged before and after the passage of the storms due to the relatively weak strength of STS, meaning weak mixing (Figure 8). Under the influence of TY, the 23.5 °C isotherm and 33.8 isohaline had a significant small rise after the transit of TY, meaning strong mixing occurred. Similarly, we found that the maximum Chl-a in the SCM layer was decreased and the depth of the SCM layer was decreased after the TY passed (Figure 5b), proving that the increase in Chl-a in the surface layer of TY was the result of the rise of the subsurface Chl-a to the surface layer after mixing. We speculated that the redistribution of Chl-a after tropical cyclones may be related to mixing in the short term (i.e., ~2 days). To exclude the influence of background environmental factors in the study areas of STS and TY, we provided the background field of the study areas of STS and TY (Figure 13). The climate distribution of temperature, salinity, density and nitrate showed that the location of these two regions was not affected by seasonal upwelling. Combined with the influence of STS, it showed that the increase in surface Chl-a caused by TY was the result of mixing.
Previous studies relied on surface remote sensing Chl-a data to study the phytoplankton blooms after tropical cyclones [15,32,33,34,35]. Most of the results showed that the nutrient-rich cold water at the bottom, brought by EPV, promoted the growth of surface phytoplankton in offshore areas. It was undeniable that this phenomenon and result would indeed occur under the long-term influence of tropical cyclones. However, there was a phenomenon often ignored by people; that was, in some cases, the surface Chl-a increased after tropical cyclones as a result of mixed disturbance in the water column, with the maximum Chl-a in the SCM layer mixed to the surface layer, but the depth-integrated Chl-a remaining unchanged.
4.2. Possible Mechanism of Phytoplankton Blooms in Surface Layer after Tropical Cyclones Transit of Different Intensity
The source of the increase in Chl-a concentration in the surface layer after tropical cyclones is divided into two parts [22,23,25]. One part is phytoplankton from deeper layers being brought to the surface layer through vertical mixing for a short time, resulting in a temporary increase in Chl-a in the surface layer, but no change in vertical integrated Chl-a. The second part is that the vertical mixing and upwelling transport the rich nutrients of the deep layer to the surface layer, providing favorable conditions for the growth and reproduction of phytoplankton in the upper ocean. Our research shows that the mixing degree of TY and STY was very similar (Figure 12), and the deepening and shallowing of the MLD were basically synchronous before and after the passing of tropical cyclones (Figure 12). However, the EPV of TY was very different from that of STY (Figure 11). The EPV of STY was four times that of TY. The analysis of depth-integrated Chl-a (Figure 7) showed that the depth-integrated Chl-a did not increase in the short term (i.e., ~2 days), but the Chl-a concentration in surface layer increased. Nevertheless, the depth-integrated Chl-a of STY not only increased in the short term (i.e., ~2 days), but also the Chl-a concentration in the surface layer increased (Figure 7), which may be due to the convection effect under the influence of STY. Similarly, to exclude the influence of the background environmental factors in the study area of STY, we provided the background field in the study area of STY (Figure 13). The climate distribution of temperature, salinity, density and nitrate showed that the location of this region was not affected by seasonal upwelling during this period.
The ocean changes caused by tropical cyclones of different intensity are different [36]. Previous research showed that the upwelling velocity was roughly proportional to the intensity of the tropical cyclone, indicating that the intensity of tropical cyclones had an important impact on the elevation of bottom nutrients and the growth of phytoplankton [21]. Moreover, the increase in Chl-a was highly correlated with the intensity of the tropical cyclones [37]. In our study, the intensity of the tropical cyclones selected was STS, TY, and STY, with different intensities. The results confirmed that with the increase in tropical cyclone intensity, the upper ocean responds differently. The tropical cyclone at the STS level was not enough to cause the growth of phytoplankton in the upper ocean in the short term (i.e., ~2 days). STS also had no sufficient mixing effect on the SCM layer (Figure 4b). The EPV (~1.5 × 10⁻⁴ m·s−1) affected by STS was similar to the TY level (Figure 11a,b). However, with the increase in the wind speed of TY (compared with STS), the mixing effect also increased and the MLD was deepened (Figure 12). The strong mixing effect would bring the higher Chl-a in the SCM layer to the surface layer, causing a thought-provoking phenomenon that, although the surface Chl-a concentration has increased, the depth-integrated Chl-a has not increased before and after the passage of TY. Based on the satellite remote sensing data, most of the previous studies believed that tropical cyclones could promote the growth of phytoplankton, judging from the increase in surface Chl-a concentration [16,38,39,40], and even some tropical cyclones with less intensity (such as tropical storms [41]) had also proved this result. According to our research, we should consider whether the increase in surface Chl-a concentration is just a false phenomenon under the influence of the mixing of tropical cyclones. With the increase in wind speed (compared with STS and TY), the impact of STY cannot be ignored. The mixing effect of STY was similar to that of TY (Figure 12), which was enough to show that the increase in surface Chl-a concentration of STY is partly due to mixing. However, in contrast to TY, the depth-integrated Chl-a of STY was increased (Figure 7), indicating that the depth-integrated Chl-a increased by STY must be driven by another factor (convection effect).
5. Conclusions
Using tropical cyclone data, satellite data, reanalysis and model data, this study systematically studied the response of the upper marine ecosystem in the SCS to different levels of tropical cyclones. The results showed that the surface Chl-a concentration in the sea areas under the influence of STS was not increased, but the surface Chl-a concentration under the influence of TY and STY was increased. In addition to the Chl-a concentration in the surface layer, we also considered the response of the depth-integrated Chl-a in the water column with a depth of 200 m, which was difficult to observe using satellite data. The reanalysis and model data reflected that the depth-integrated Chl-a under the influence of STS and TY was not increased, while the depth-integrated Chl-a under the influence of STY was increased. We considered that the increase in the surface Chl-a concentration after the passing of tropical cyclones below a certain intensity was only the result of vertical mixing in the short term (i.e., ~2 days). In this study, the increase in surface Chl-a of TY and STY was primarily caused by physical processes (e.g., vertical mixing), while the increase in the depth-integrated Chl-a of STY may be primarily affected by a convection effect (i.e., upwelling). As the study area is in the offshore area, the influence of an advection effect is not considered, which should be further studied in the future.
Author Contributions
Conceptualization, H.Z. and G.P.; methodology, Y.C. and H.Z.; software, Y.C.; validation, Y.C. and H.Z.; writing—original draft preparation, Y.C.; writing—review and editing, Y.C., H.Z. and R.M.; visualization, Y.C.; project administration, H.Z.; funding acquisition, H.Z. All authors listed made a substantial, direct and intellectual contribution to the work, and approved it for publication. All authors have read and agreed to the published version of the manuscript.
Funding
The present research is supported by the National Natural Science Foundation of China (No. 42076162) Postgraduate Education Innovation Project of Guangdong Ocean University (202145) and the project was supported by the Innovation Group Project of Southern Marine Science and Engineering Guangdong Laboratory (Zhuhai) (No. 311020004).
Data Availability Statement
Not applicable.
Acknowledgments
We are grateful to Typhoon Online (www.typhoon.org.cn, accessed on 19 July 2022) for providing the tropical storm data, the Remote Sensing System (http://www.remss.com/, accessed on 26 July 2022) for providing the sea surface wind data, the operational Mercator global ocean analysis and forecast system for providing the Chl-a data (https://resources.marine.copernicus.eu/product-detail/GLOBAL_ANALYSIS_FORECAST_BIO_001_028/, accessed on 19 July 2022), temperature and salinity data (https://resources.marine.copernicus.eu/product-detail/ GLOBAL_ANALYSIS_FORECAST_PHY_001_024/, accessed on 22 July 2022), the HYCOM assimilation product cooperated by the University of Miami modeling group and the Naval Research Lab for providing the MLD data (https://www.hycom.org/, accessed on 26 July 2022), The National Ocean Data Center (NODC) for providing the WOA 2018 climatology of nitrate data (https://www.ncei.noaa.gov/access/world-ocean-atlas-2018/bin/, accessed on 22 July 2022).
Conflicts of Interest
The authors declare no conflict of interest.
References
- Zhou, L.; Chen, D.; Lei, X.; Wang, W.; Wang, G.; Han, G. Progress and perspective on interactions between ocean and typhoon. Chin. Sci. Bull. 2018, 64, 60–72. [Google Scholar] [CrossRef]
- GB/T 19201–2006; Chinese National Standard Intensity Category for Tropical Cyclones. China Standard Press: Beijing, China, 2006.
- Smith, V.H. Responses of estuarine and coastal marine phytoplankton to nitrogen and phosphorus enrichment. Limnol. Oceanogr. 2006, 51 (1 Pt 2), 377–384. [Google Scholar] [CrossRef]
- Werdell, P.J.; Bailey, S.W.; Franz, B.A.; Harding, L.W.; Feldman, G.C.; Mcclain, C.R. Regional and seasonal variability of chlorophyll-a in Chesapeake Bay as observed by SeaWiFS and MODIS-Aqua. Remote Sens. Environ. 2009, 113, 1319–1330. [Google Scholar] [CrossRef]
- Zhao, H.; Zhang, S. Review on Spatial-Temporal Variation of China’ Offshore Phytoplankton Chlorophyll and Primary Productivity and Their Variational Mechanism. J. Guangdong Ocean. Univ. 2014, 34, 98–104. [Google Scholar]
- Chen, Y.; Zhao, H. Spatial distribution of the summer subsurface chlorophyll maximum in the North South China Sea. PLoS ONE 2021, 16, e0248715. [Google Scholar] [CrossRef] [PubMed]
- Letelier, R.M.; Karl, D.M.; Abbott, M.R.; Bidigare, R.R. Light driven seasonal patterns of chlorophyll and nitrate in the lower euphotic zone of the North Pacific Subtropical Gyre. Limnol. Oceanogr. 2004, 49, 508–519. [Google Scholar] [CrossRef]
- Takahashi, M.; Hori, T. Abundance of picophytoplankton in the subsurface chlorophyll maximum layer in subtropical and tropical waters. Mar. Biol. 1984, 79, 177–186. [Google Scholar] [CrossRef]
- Siswanto, E.; Ishizaka, J.; Yokouchi, K. Estimating Chlorophyll-a Vertical Profiles from Satellite Data and the Implication for Primary Production in the Kuroshio Front of the East China Sea. J. Oceanogr. 2005, 61, 575–589. [Google Scholar] [CrossRef]
- Brooks, D.A. The Wake of Hurricane Allen in the Western Gulf of Mexico. J. Phys. Oceanogr. 1983, 13, 117–129. [Google Scholar] [CrossRef]
- Black, P.G. Ocean Temperature Changes Induced by Tropical Cyclones; The Pennsylvania State University: State College, PA, USA, 1983. [Google Scholar]
- Brink, K.H. Observations of the Response of Thermocline Currents to a Hurricane. J. Phys. Oceanogr. 1989, 19, 1017–1022. [Google Scholar] [CrossRef]
- Dickey, T.; Frye, D.; Mcneil, J.; Manov, D.; Nelson, N.; Sigurdson, D.; Jannasch, H.; Siegel, D.; Michaels, T.; Johnson, R. Upper-Ocean Temperature Response to Hurricane Felix as Measured by the Bermuda Testbed Mooring. Mon. Weather. Rev. 1998, 126, 1195–1201. [Google Scholar] [CrossRef]
- Fisher, E.L. Hurricanes and the sea-surface temperature field. J. Meteorol. 1958, 15, 328–333. [Google Scholar] [CrossRef]
- Babin, S.M.; Carton, J.A.; Dickey, T.D.; Wiggert, J.D. Satellite evidence of hurricane-induced phytoplankton blooms in an oceanic desert. J. Geophys. Res. Ocean. 2004, 109. [Google Scholar] [CrossRef]
- Zheng, G.; Tang, D. Offshore and nearshore chlorophyll increases induced by typhoon winds and subsequent terrestrial rainwater runoff. Mar. Ecol.-Prog. Ser. 2007, 333, 61–74. [Google Scholar] [CrossRef]
- Sun, L.; Yang, Y.; Tao, X.; Lu, Z.-M.; Fu, Y. Strong enhancement of chlorophyll a concentration by a weak typhoon. Mar. Ecol. Prog. Ser. 2010, 404, 39–50. [Google Scholar] [CrossRef]
- Wang, J.-J.; Tang, D.L. Phytoplankton patchiness during spring intermonsoon in western coast of South China Sea. Deep. Sea Res. Part II Top. Stud. Oceanogr. 2014, 101, 120–128. [Google Scholar] [CrossRef]
- Zhao, H.; Wang, Y. Phytoplankton Increases Induced by Tropical Cyclones in the South China Sea During 1998–2015. J. Geophys. Res. Ocean. 2018, 123, 2903–2920. [Google Scholar] [CrossRef]
- Chen, Y.; Shi, H.; Zhao, H. Summer Phytoplankton Blooms Induced by Upwelling in the Western South China Sea. Front. Mar. Sci. 2021, 8, 740130. [Google Scholar] [CrossRef]
- Zhao, H.; Han, G.; Zhang, S.; Wang, D. Two phytoplankton blooms near Luzon Strait generated by lingering Typhoon Parma. J. Geophys. Res. Biogeosci. 2013, 118, 412–421. [Google Scholar] [CrossRef]
- Wang, T.; Zhang, S.; Chen, F.; Ma, Y.; Chen, J.; Yu, J. Influence of sequential tropical cyclones on phytoplankton blooms in the northwestern South China Sea. Chin. J. Oceanol. Limnol. 2020, 39, 14–25. [Google Scholar] [CrossRef]
- Pan, S.; Shi, J.; Gao, H.; Guo, X.; Yao, X.; Gong, X. Contributions of physical and biogeochemical processes to phytoplankton biomass enhancement in the surface and subsurface layers during the passage of Typhoon Damrey. J. Geophys. Res. Biogeosci. 2017, 122, 212–229. [Google Scholar] [CrossRef]
- Chacko, N. Chlorophyll bloom in response to tropical cyclone Hudhud in the Bay of Bengal: Bio-Argo subsurface observations. Deep. Sea Res. Part I Oceanogr. Res. Pap. 2017, 124, 66–72. [Google Scholar] [CrossRef]
- Walker, N.D.; Leben, R.R.; Balasubramanian, S. Hurricane-forced upwelling and chlorophyll a enhancement within cold-core cyclones in the Gulf of Mexico. Geophys. Res. Lett. 2005, 32, L18610. [Google Scholar] [CrossRef]
- Ying, M.; Zhang, W.; Yu, H.; Lu, X.; Feng, J.; Fan, Y.; Zhu, Y.; Chen, D. An Overview of the China Meteorological Administration Tropical Cyclone Database. J. Atmos. Ocean. Technol. 2014, 31, 287–301. [Google Scholar] [CrossRef]
- Lu, X.; Yu, H.; Ying, M.; Zhao, B.; Zhang, S.; Lin, L.; Bai, L.; Wan, R. Western North Pacific Tropical Cyclone Database Created by the China Meteorological Administration. Adv. Atmos. Sci. 2021, 38, 690–699. [Google Scholar] [CrossRef]
- Halpern, D. Offshore Ekman transport and Ekman pumping off Peru during the 1997–1998 El Niño. Geophys. Res. Lett. 2002, 29, 19-1–19-4. [Google Scholar] [CrossRef]
- Price, J.F. Upper Ocean Response to a Hurricane. J. Phys. Oceanogr. 1981, 11, 153–175. [Google Scholar] [CrossRef]
- Liu, Z.; Xu, J.; Zhu, B.; Sun, Z.; Zhang, L. Upper ocean response to tropical cyclones in northwestern Pacific during 2001-2004 by Argo data. J. Trop. Oceanogr. 2006, 25, 1–8. [Google Scholar]
- Shao, J.; Zhao, H.; Shen, C.; Lv, J. Influence of Typhoon Matsa on Phytoplankton Chlorophyll-a in the Northwest Pacific Ocean Offshore and Alongshore. J. Guangdong Ocean. Univ. 2015, 35, 67–74. [Google Scholar]
- Zhao, H.; Tang, D.; Wang, Y. Comparison of phytoplankton blooms triggered by two typhoons with different intensities and translation speeds in the South China Sea. Mar. Ecol. Prog. Ser. 2008, 365, 57–65. [Google Scholar] [CrossRef]
- Wetz, M.S.; Paerl, H.W. Estuarine Phytoplankton Responses to Hurricanes and Tropical Storms with Different Characteristics (Trajectory, Rainfall, Winds). Estuaries Coasts 2008, 31, 419–429. [Google Scholar] [CrossRef]
- Miller, W.; Harding, L.W. Climate forcing of the spring bloom in Chesapeake Bay. Mar. Ecol. Prog. Ser. 2007, 331, 11–22. [Google Scholar] [CrossRef]
- Chiang, T.-L.; Wu, C.-R.; Oey, L.-Y. Typhoon Kai-Tak: An Ocean’s Perfect Storm. J. Phys. Oceanogr. 2011, 41, 221–233. [Google Scholar] [CrossRef]
- Chen, Y.; Ren, C.; Feng, Y.; Shi, H.; Pan, G.; Cooper, M.; Zhao, H. Different Responses of Chlorophyll a to the Passage of the Tropical Storm Wipha (2019) in the Coastal Waters of the Northern Beibu Gulf. Front. Mar. Sci. 2022, 9, 887240. [Google Scholar] [CrossRef]
- Zhao, H.; Pan, J.; Han, G.; Devlin, A.T.; Zhang, S.; Hou, Y. Effect of a fast-moving tropical storm Washi on phytoplankton in the northwestern South China Sea. J. Geophys. Res. Ocean. 2017, 122, 3404–3416. [Google Scholar] [CrossRef]
- Chen, X.; Pan, D.; He, X.; Bai, Y.; Wang, D. Upper ocean responses to category 5 typhoon Megi in the western north Pacific. Acta Oceanol. Sin. 2012, 31, 51–58. [Google Scholar] [CrossRef]
- Lin, I.I. Typhoon-induced phytoplankton blooms and primary productivity increase in the western North Pacific subtropical ocean. J. Geophys. Res. Ocean. 2012, 117, 3039. [Google Scholar] [CrossRef]
- Chang, J.; Chung, C.-C.; Gong, G.C. Influences of cyclones on chlorophyll a concentration and Synechococcus abundance in a subtropical western Pacific coastal ecosystem. Mar. Ecol. Prog. Ser. 1996, 140, 199–205. [Google Scholar] [CrossRef]
- Zhang, S.; Xie, L.; Hou, Y.; Zhao, H.; Qi, Y.; Yi, X. Tropical storm-induced turbulent mixing and chlorophyll-a enhancement in the continental shelf southeast of Hainan Island. J. Mar. Syst. 2014, 129, 405–414. [Google Scholar] [CrossRef]
Publisher’s Note: MDPI stays neutral with regard to jurisdictional claims in published maps and institutional affiliations. |
© 2022 by the authors. Licensee MDPI, Basel, Switzerland. This article is an open access article distributed under the terms and conditions of the Creative Commons Attribution (CC BY) license (https://creativecommons.org/licenses/by/4.0/).