Article

Use of Landsat 8 and UAV Images to Assess Changes in Temperature and Evapotranspiration by Economic Trees following Foliar Spraying with Light-Reflecting Compounds

by
Fahime Arabi Aliabad
1,
Saeed Shojaei
2,
Morad Mortaz
3,
Carla Sofia Santos Ferreira
4,5,* and
Zahra Kalantari
4,6
1
Department of Arid Lands Management, Faculty of Natural Resources and Desert Studies, Yazd University, Yazd 8915818411, Iran
2
Department of Arid and Mountainous Region Reclamation, Faculty of Natural Resources, University of Tehran, Tehran 1417935840, Iran
3
Department of Plant Sciences, University of California Davis, Davis, CA 95616, USA
4
Department of Physical Geography and Bolin Center for Climate Research, Stockholm University, 10691 Stockholm, Sweden
5
Research Centre for Natural Resources, Environment and Society (CERNAS), Polytechnic Institute of Coimbra, Agrarian School of Coimbra, 3045-601 Coimbra, Portugal
6
Department of Sustainable Development, Environmental Science and Engineering (SEED), KTH Royal Institute of Technology, 11428 Stockholm, Sweden
*
Author to whom correspondence should be addressed.
Remote Sens. 2022, 14(23), 6153; https://doi.org/10.3390/rs14236153
Submission received: 26 September 2022 / Revised: 22 November 2022 / Accepted: 30 November 2022 / Published: 4 December 2022
(This article belongs to the Section Remote Sensing in Agriculture and Vegetation)

Abstract

:
Pistachio is an important economic crop in arid and semi-arid regions of Iran. A major problem leading to a reduction in crop quality and reduced marketability is extreme air temperature in summer, which causes sunburn of pistachio leaves and fruit. A solution proposed to deal with the negative effects of high temperatures and increase water consumption efficiency in pistachio orchards is use of light-reflecting compounds. This study investigated the effect of foliar application of gypsum, sulfur, and NAX-95 (calcium-based suspension coating) to trees in a pistachio orchard (150 ha) in central Iran. The effect of these foliar products is assessed at plot scale, using control plots sprayed with calcium sulfate, based on temperature and evapotranspiration changes analyzed through remote sensing. Landsat 8 sensor images and RGB images collected by UAVs (spatial resolution of 30 m and 20 cm, respectively), on the same dates, before and after foliar spray application, were merged using the PCA method and bilinear interpolation re-sampling. Land surface temperature (LST) was then estimated using the split-window algorithm, and daily evapotranspiration using the surface energy balance algorithm for land (SEBAL) algorithm. A land use map was prepared and used to isolate pistachio trees in the field and assess weed cover, whose effect was not accounted. The results showed that temperature remained constant in the control plot between the spraying dates, indicating no environmental changes. In the main plots, gypsum had the greatest effect in reducing the temperature of pistachio trees. The plots with foliar spraying with gypsum displayed a mean tree temperature (47–48 °C) decrease of 3.3 °C in comparison with the control plots (>49 °C), leading to an average decline in evapotranspiration of 0.18 mm/day. NAX-95 and sulfur reduced tree temperature by on average 1.3 °C and 0.6 °C, respectively. Thus, gypsum is the most suitable foliar-spraying compound to lower the temperature of pistachio trees, reduce the water requirement, and increase crop productivity.

1. Introduction

Economic trees are used worldwide for business, such as pistachio trees. Pistachio (Pistacia vera L.) is cultivated in many arid and semi-arid regions, such as the Mediterranean region and Asia Minor, and is one of the most important horticultural crops in Iran [1]. The desert margins and arid and sub-arid regions of central Iran, with warm dry summers, are the main sites of commercial pistachio production [2]. Pistachio trees show good adaptability to a variety of soil, water, and climate conditions. However, they are strongly affected by the destructive effects of intense optical radiation and high temperatures, leading to declining yields and pistachio quality, and the general weakness of the trees [3,4].
One solution for dealing with the detrimental effects of high temperatures in orchards is to use a tree-top sprinkler irrigation system to cool the trees. However, this system requires modern technology and adequate availability of high-quality water, involves high costs, and contributes to the spread of some diseases [5]. Colored mesh nets have been used to prevent sunburn of apple tree canopies, but also involve very high costs for installation [6,7]. Studies examining the effect of different compounds on surface sunburn in apple trees have shown that kaolin (a white substance of aluminum silicate mineral, AL4Si4O10[OH]8) can reduce the temperature by up to 3 °C [8,9]. In recent years, a new solution based on foliar-spraying a thin layer of light-reflecting fine material on the tree canopy, leading to reflection of much of the incoming light, has shown very promising results in reducing canopy temperature (by 2–6 °C) [10]. Secondary benefits of reduced canopy temperature are decreased drought stress, increased photosynthesis, and increased quantity and quality of the commercial product, as well as reduced water consumption [11]. In previous studies, physiological indices based on net photosynthesis, leaf temperature, and leaf transpiration rate, measured by photosynthesis devices on the ground and at leaf scale, have been used to investigate the effect of foliar spraying on sunburn in trees [9]. The effect of foliar spraying has been investigated for pomegranate [12], almond, and walnut trees [11], with a positive effect of spraying in reducing sunburn observed in all cases. However, those studies investigated the effect of foliar spraying at orchard level, while the effect on individual trees has not been determined with accurate temperature measurements. In addition, the use of photosynthesis devices to measure individual trees is not always available and/or affordable to investigate the effect of foliar spraying in reducing canopy temperature and water losses. Remote sensing may be an alternative method to assess the effect of foliar spraying on reducing sunburn on cropland and preventing the loss of farmers.
In recent years, many studies have examined the use of remote sensing in precision agriculture, for purposes such as estimating evapotranspiration [13,14] assessing soil properties [15], and managing disease and pests [16]. However, the effect of foliar application of various compounds to prevent sunburn in trees has not been investigated previously using remote sensing. Remote sensing reduces human error and can also be efficient in various agricultural programs, reducing costs and time [17] However, most satellites used for remote sensing cannot simultaneously collect images with high spatial, temporal, and spectral resolution, due to technical limitations [18,19]. For example, Landsat has an acceptable spatial resolution (30 m) but only produces images every 16 days, whereas MODIS provides daily images but of low spatial resolution. These technical aspects are considered major limitations in the use of satellite images in precision agriculture [20]. Compared with satellite images, the images obtained from unmanned aerial vehicles (UAVs) usually have the desired temporal resolution (e.g., daily capture) and high spatial resolution (e.g., few centimeters), enabling use of high-resolution images in precision agriculture applications [21]. The use of drones, for instance, is cheaper and easier to access compared to ground-based photography, which covers very small areas and is not suitable for cropland management.
The harsh conditions of arid and semi-arid regions where some pistachio orchards are developed, driven by high air temperature and strong radiation in summer, often exceeding plant tolerance, cause damage to the fruit (e.g., destruction of the tissue cells of the green skin, destruction of the fruit shell, and development of a necrotic black color) [3]. The offspring of most sunburned fruits are aborted, and these fruits appear hollow or are half pith at harvest time [4]. To avoid fruit damages and/or destruction, it is possible to apply foliar sprays over the entire garden pistachio tree in a few days before the heat reaches its peak in the summer. Choosing the optimal method to reduce the sunburn of pistachio trees is of particular importance [8]. However, it is not clear which of the materials has a greater effect on reducing sunburn.
The aim of the present study was to investigate the effect of foliar application of different compounds (sulfur, NAX-95 (calcium-based suspension coating), gypsum) on temperature and evapotranspiration by pistachio orchard. The study is based on remote sensing assessment. Satellite 8 and UAV images were merged to determine tree temperature and evapotranspiration, and related indices. The results were compared to identify the optimal compound for reducing sunburn-related damage and optimize water consumption in arid and semi-arid areas.

2. Materials and Methods

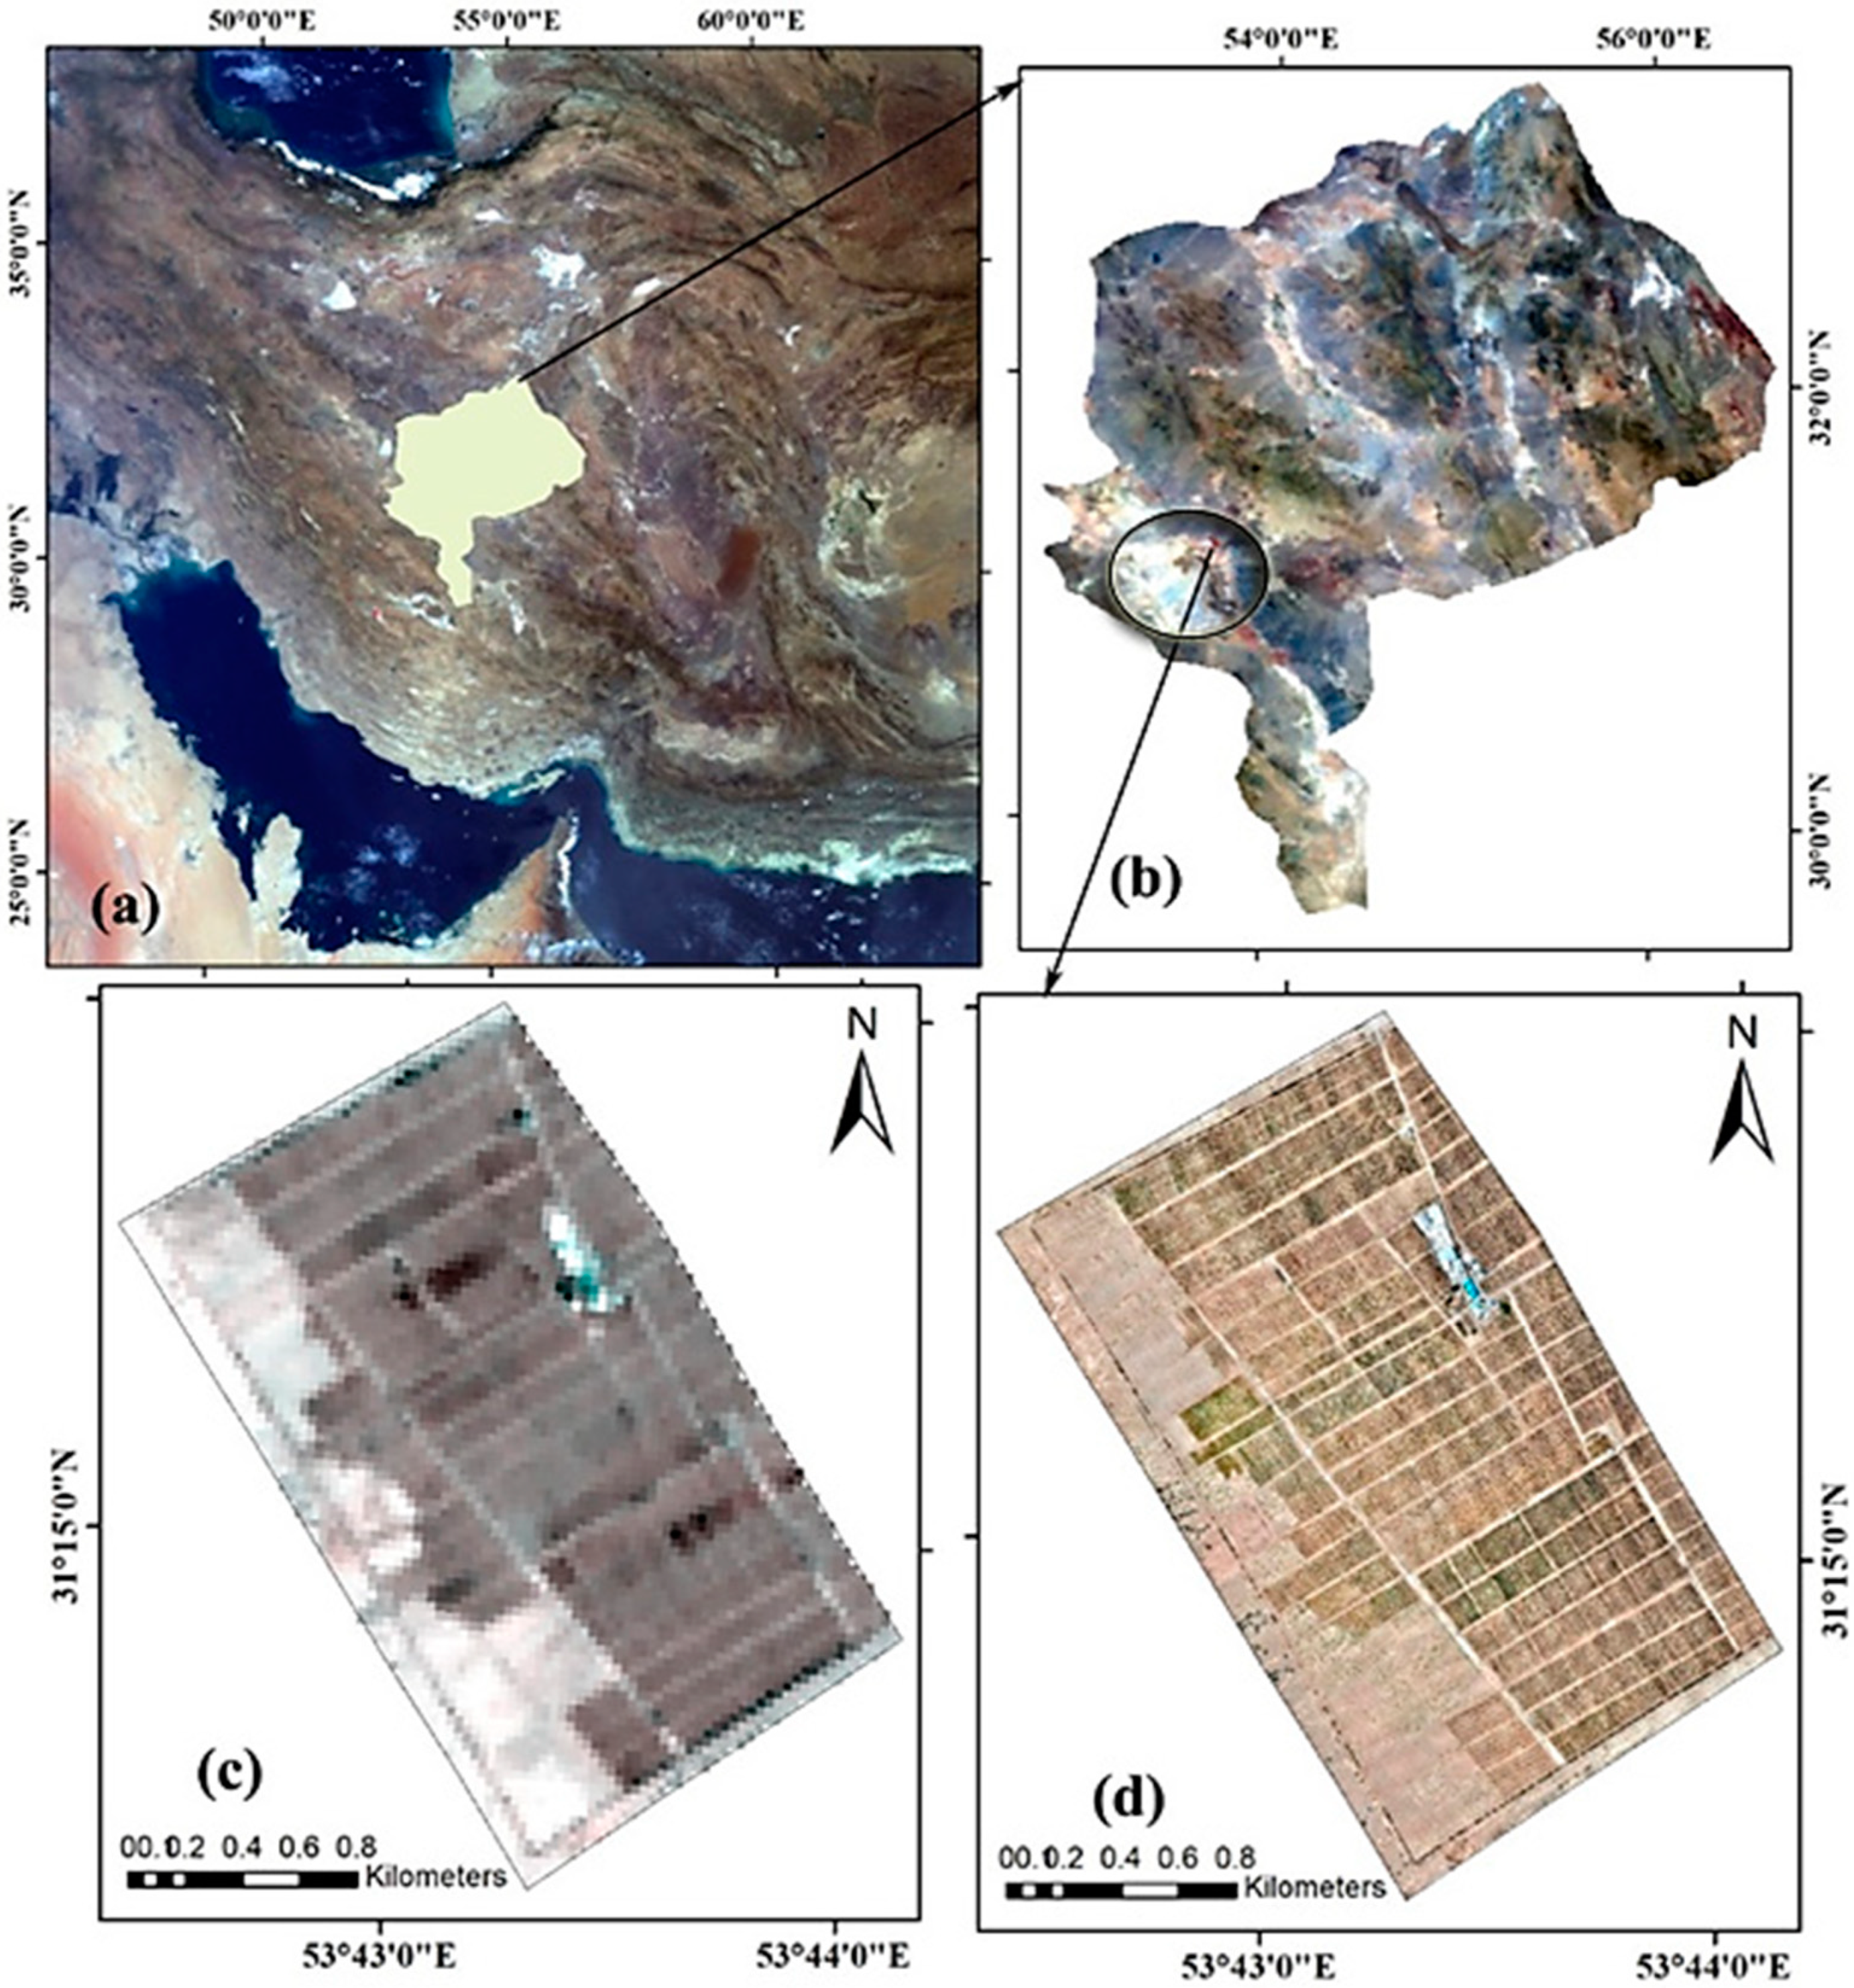
2.1. Study Area and Data Sources

The study region (53°44′00″–53°44′15″N; 31°16′00″–31°14′15″E, area 423 ha) is located in the southwest of Yazd province in central Iran, on the edge of the Abarkooh desert (Figure 1). The climate is generally hot and dry, with a mean annual rainfall of 65 mm and mean annual temperature of 18 °C, but the average maximum temperature in summer is 42 °C. The selected study site was a 150 ha pistachio orchard irrigated using the drip method (Babler) and containing different cultivars of pistachio.
Pistachio orchards are widely cultivated in Yazd province but also highly susceptible to effects of intense sunshine and high temperature during flowering, pollination, primary fruiting, and fruit development stages. Figure 2 shows an example of the impact of sunburn on pistachio fruit.

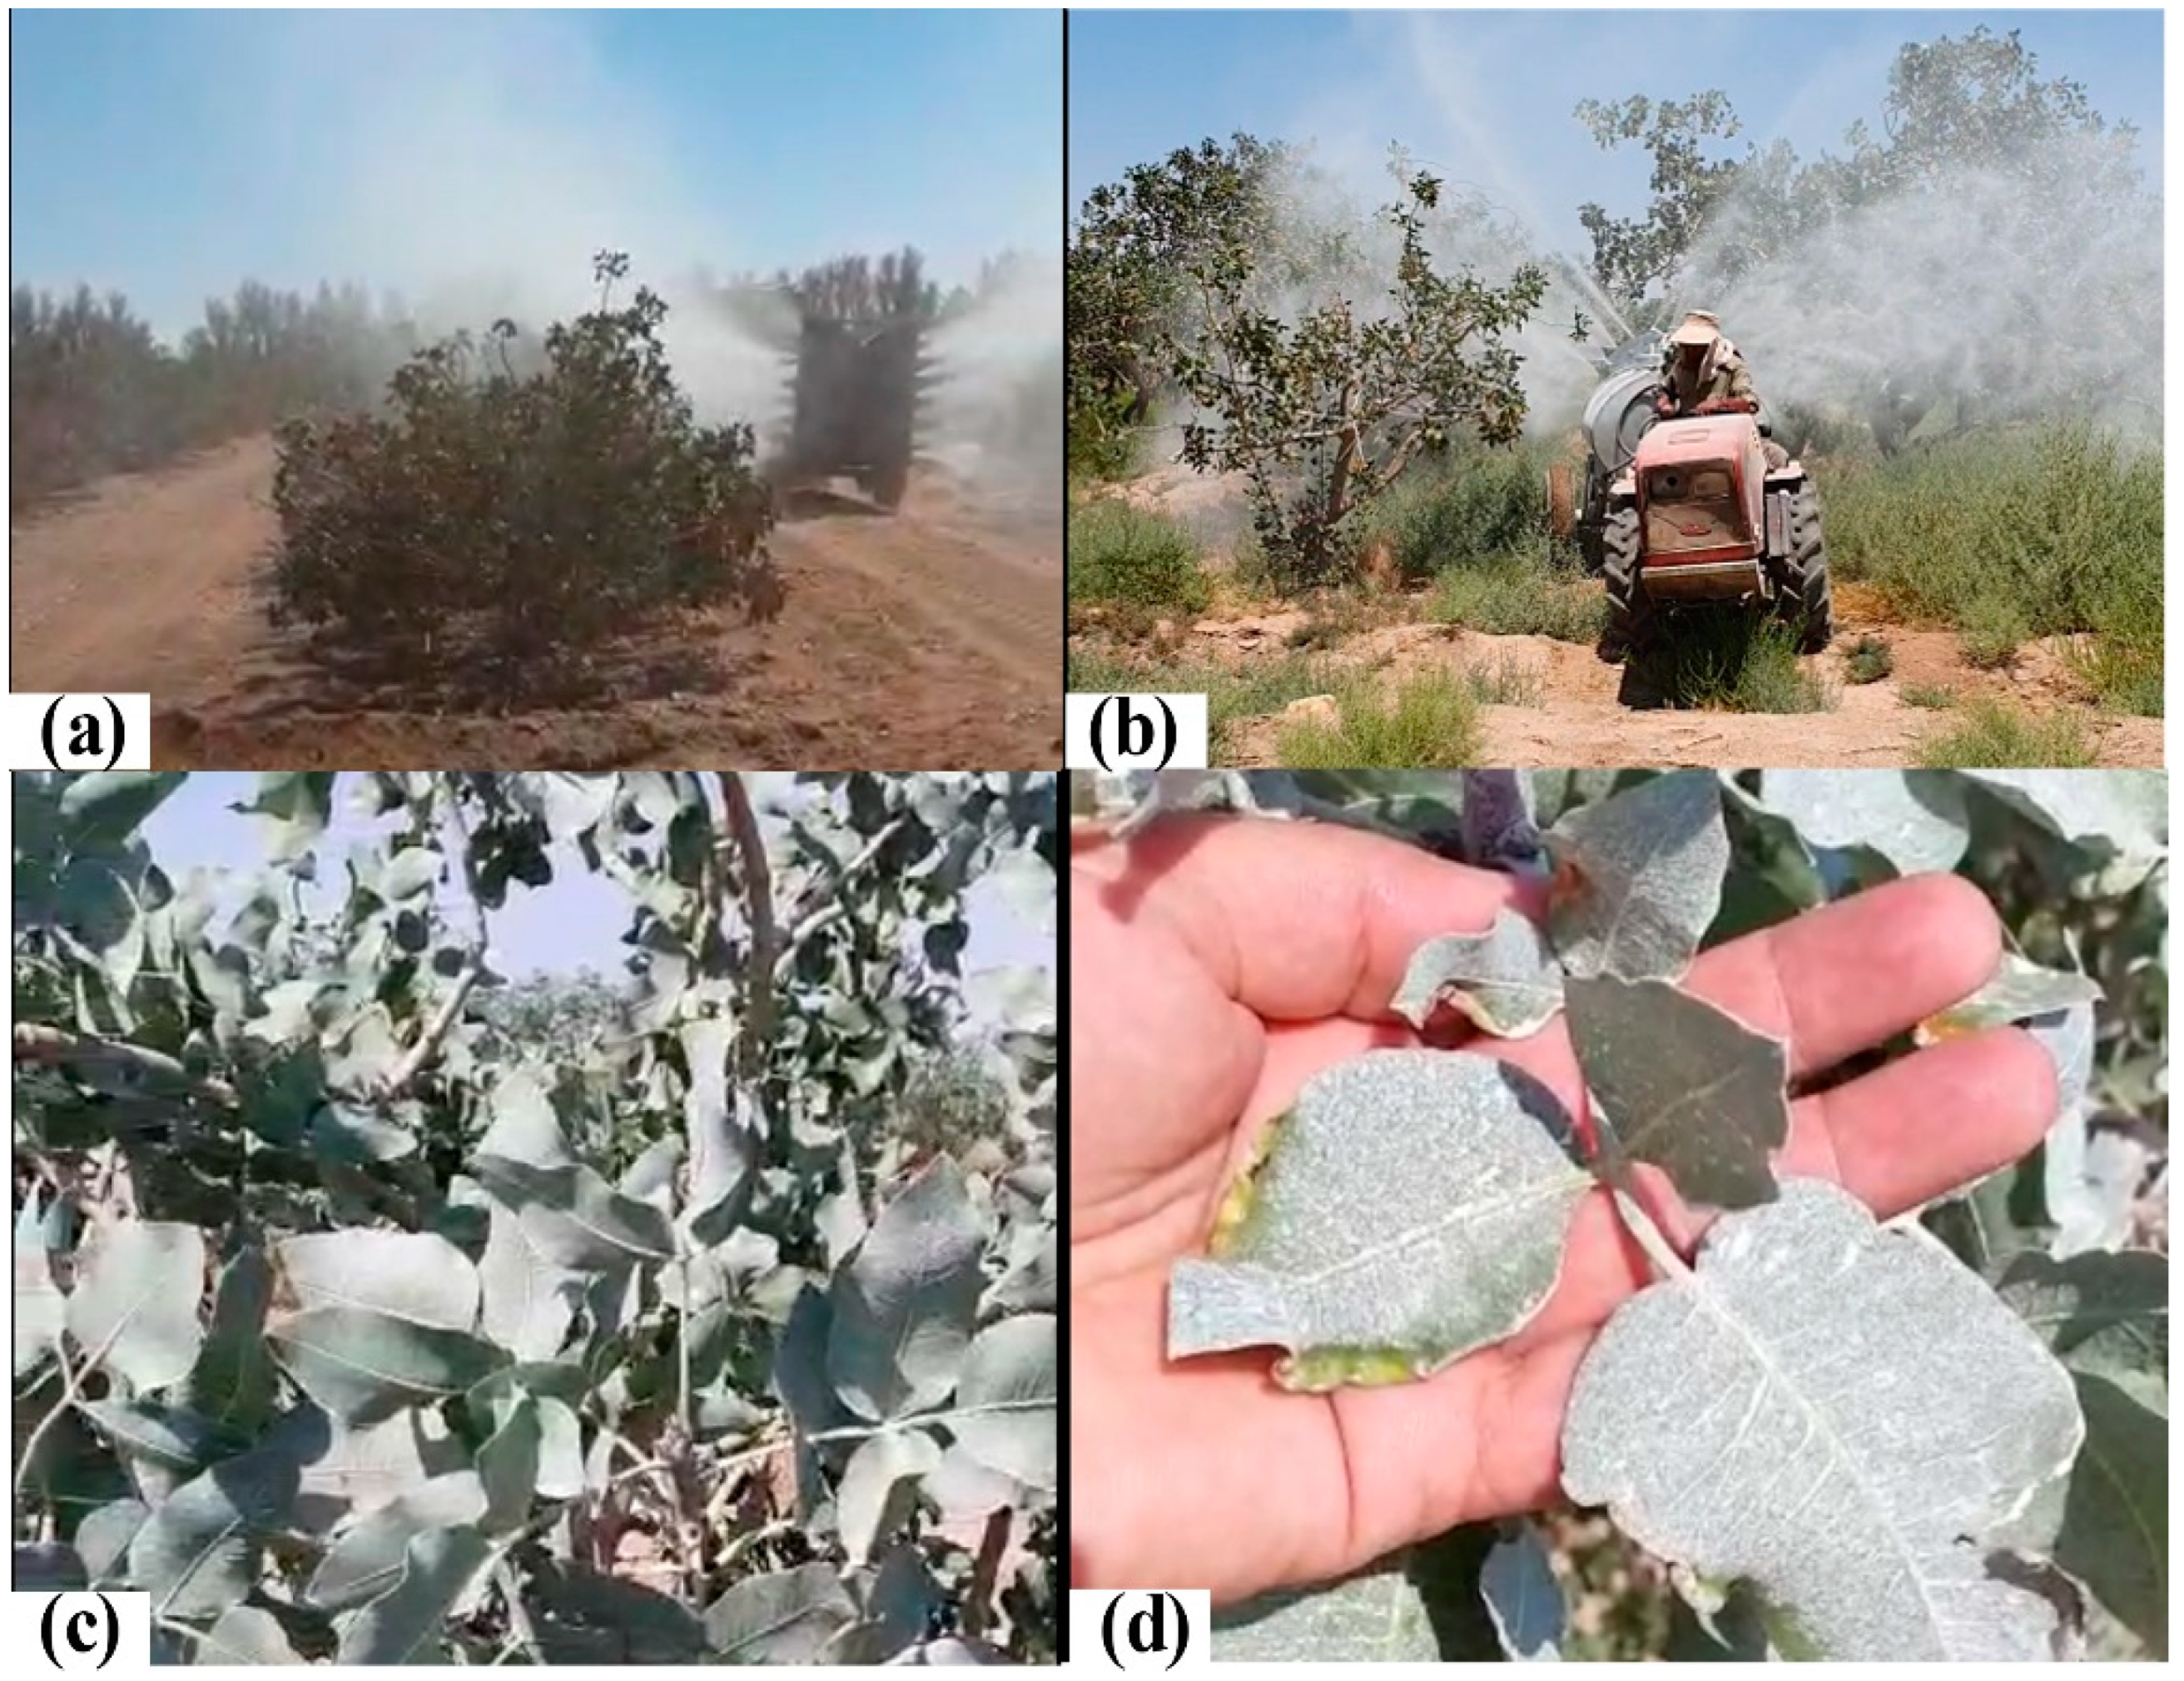
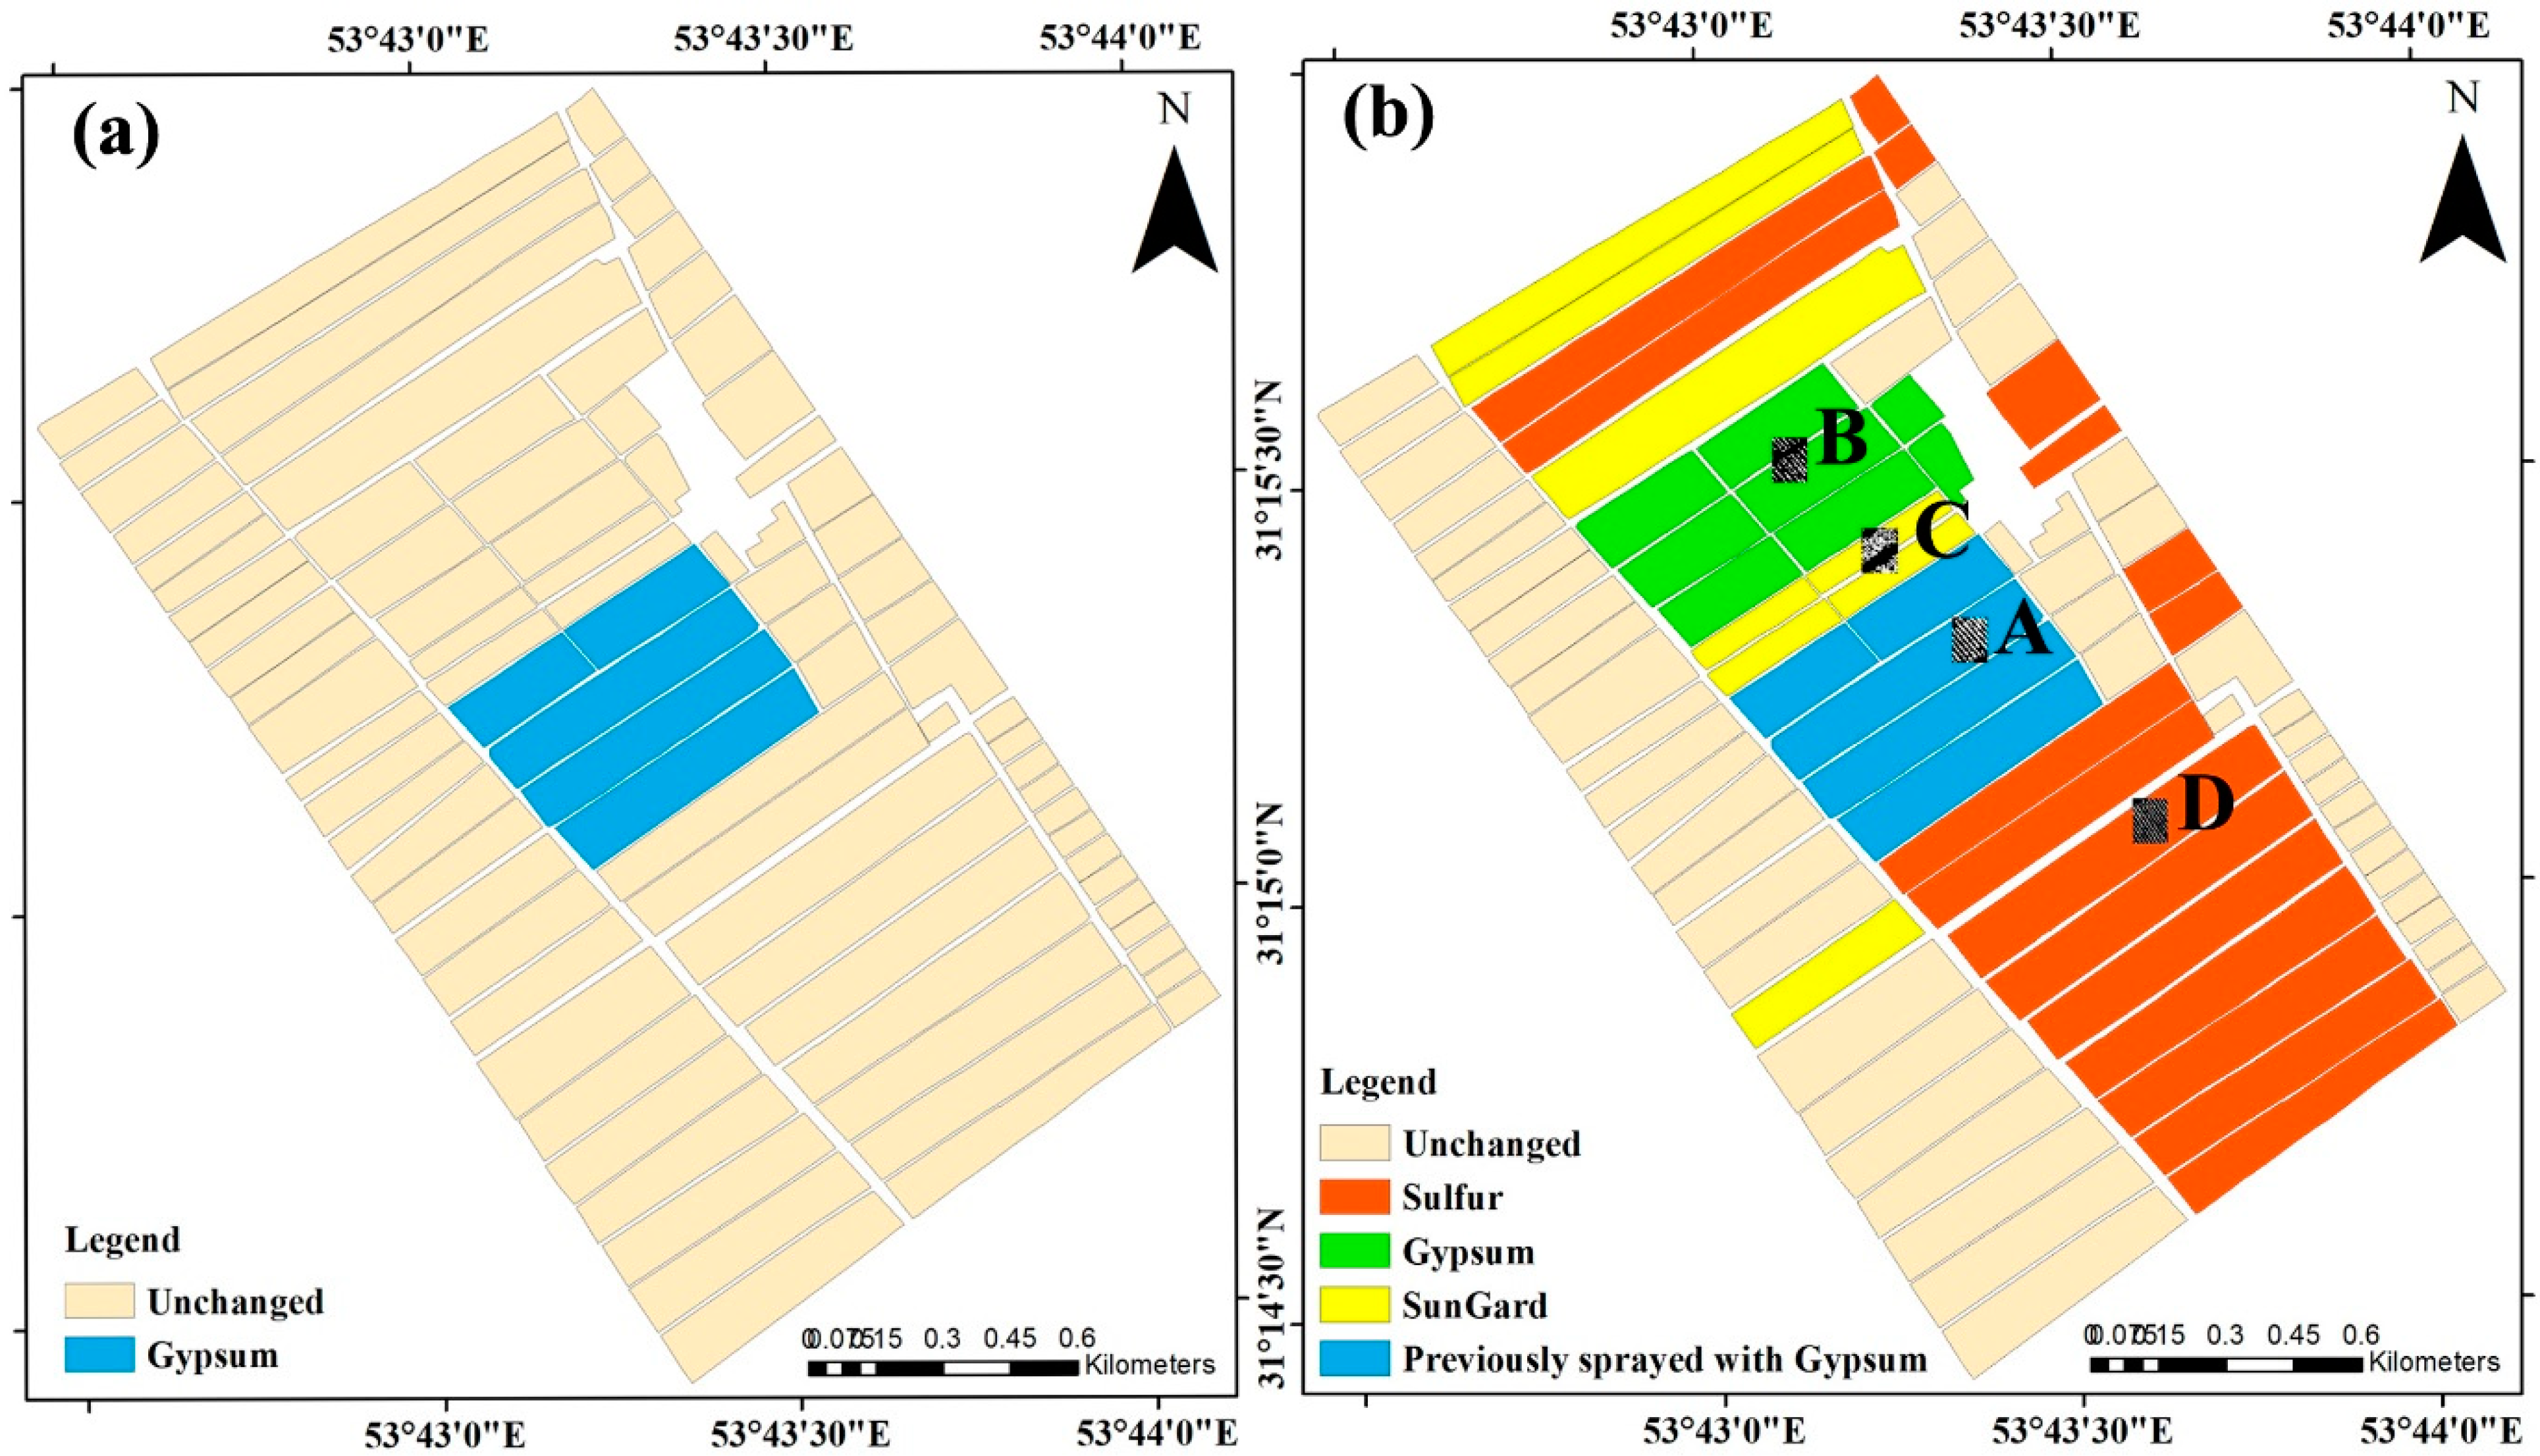
2.2. Experimental Design

Four experimental plots were established within a 3 ha sub-area of the pistachio orchard. In an initial experiment (08/04/2020), several rows of pistachio trees in one of these plots (plot A) were sprayed with amorphous gypsum plaster (calcium sulfate, CaSO4). It is used to act as a control for estimating temperature and evapotranspiration changes under constant conditions (Figure 3). In the main experiment (20/08/2020), the remaining plots were foliar sprayed with gypsum (plot B), sulfur (mineral sulfur, S) (plot C), and NAX-95 (calcium-based suspension coating) (plot D), following the technical recommendations. Each plot had the same density and number of trees. The position of the plots within the orchard is shown in Figure 4. The location of the plots was determined by the existent placement of pistachio varieties (only one variety was used in this study), and the constraints associated with using large agricultural machines for foliar spraying, which do not allow for a randomized plot selection.

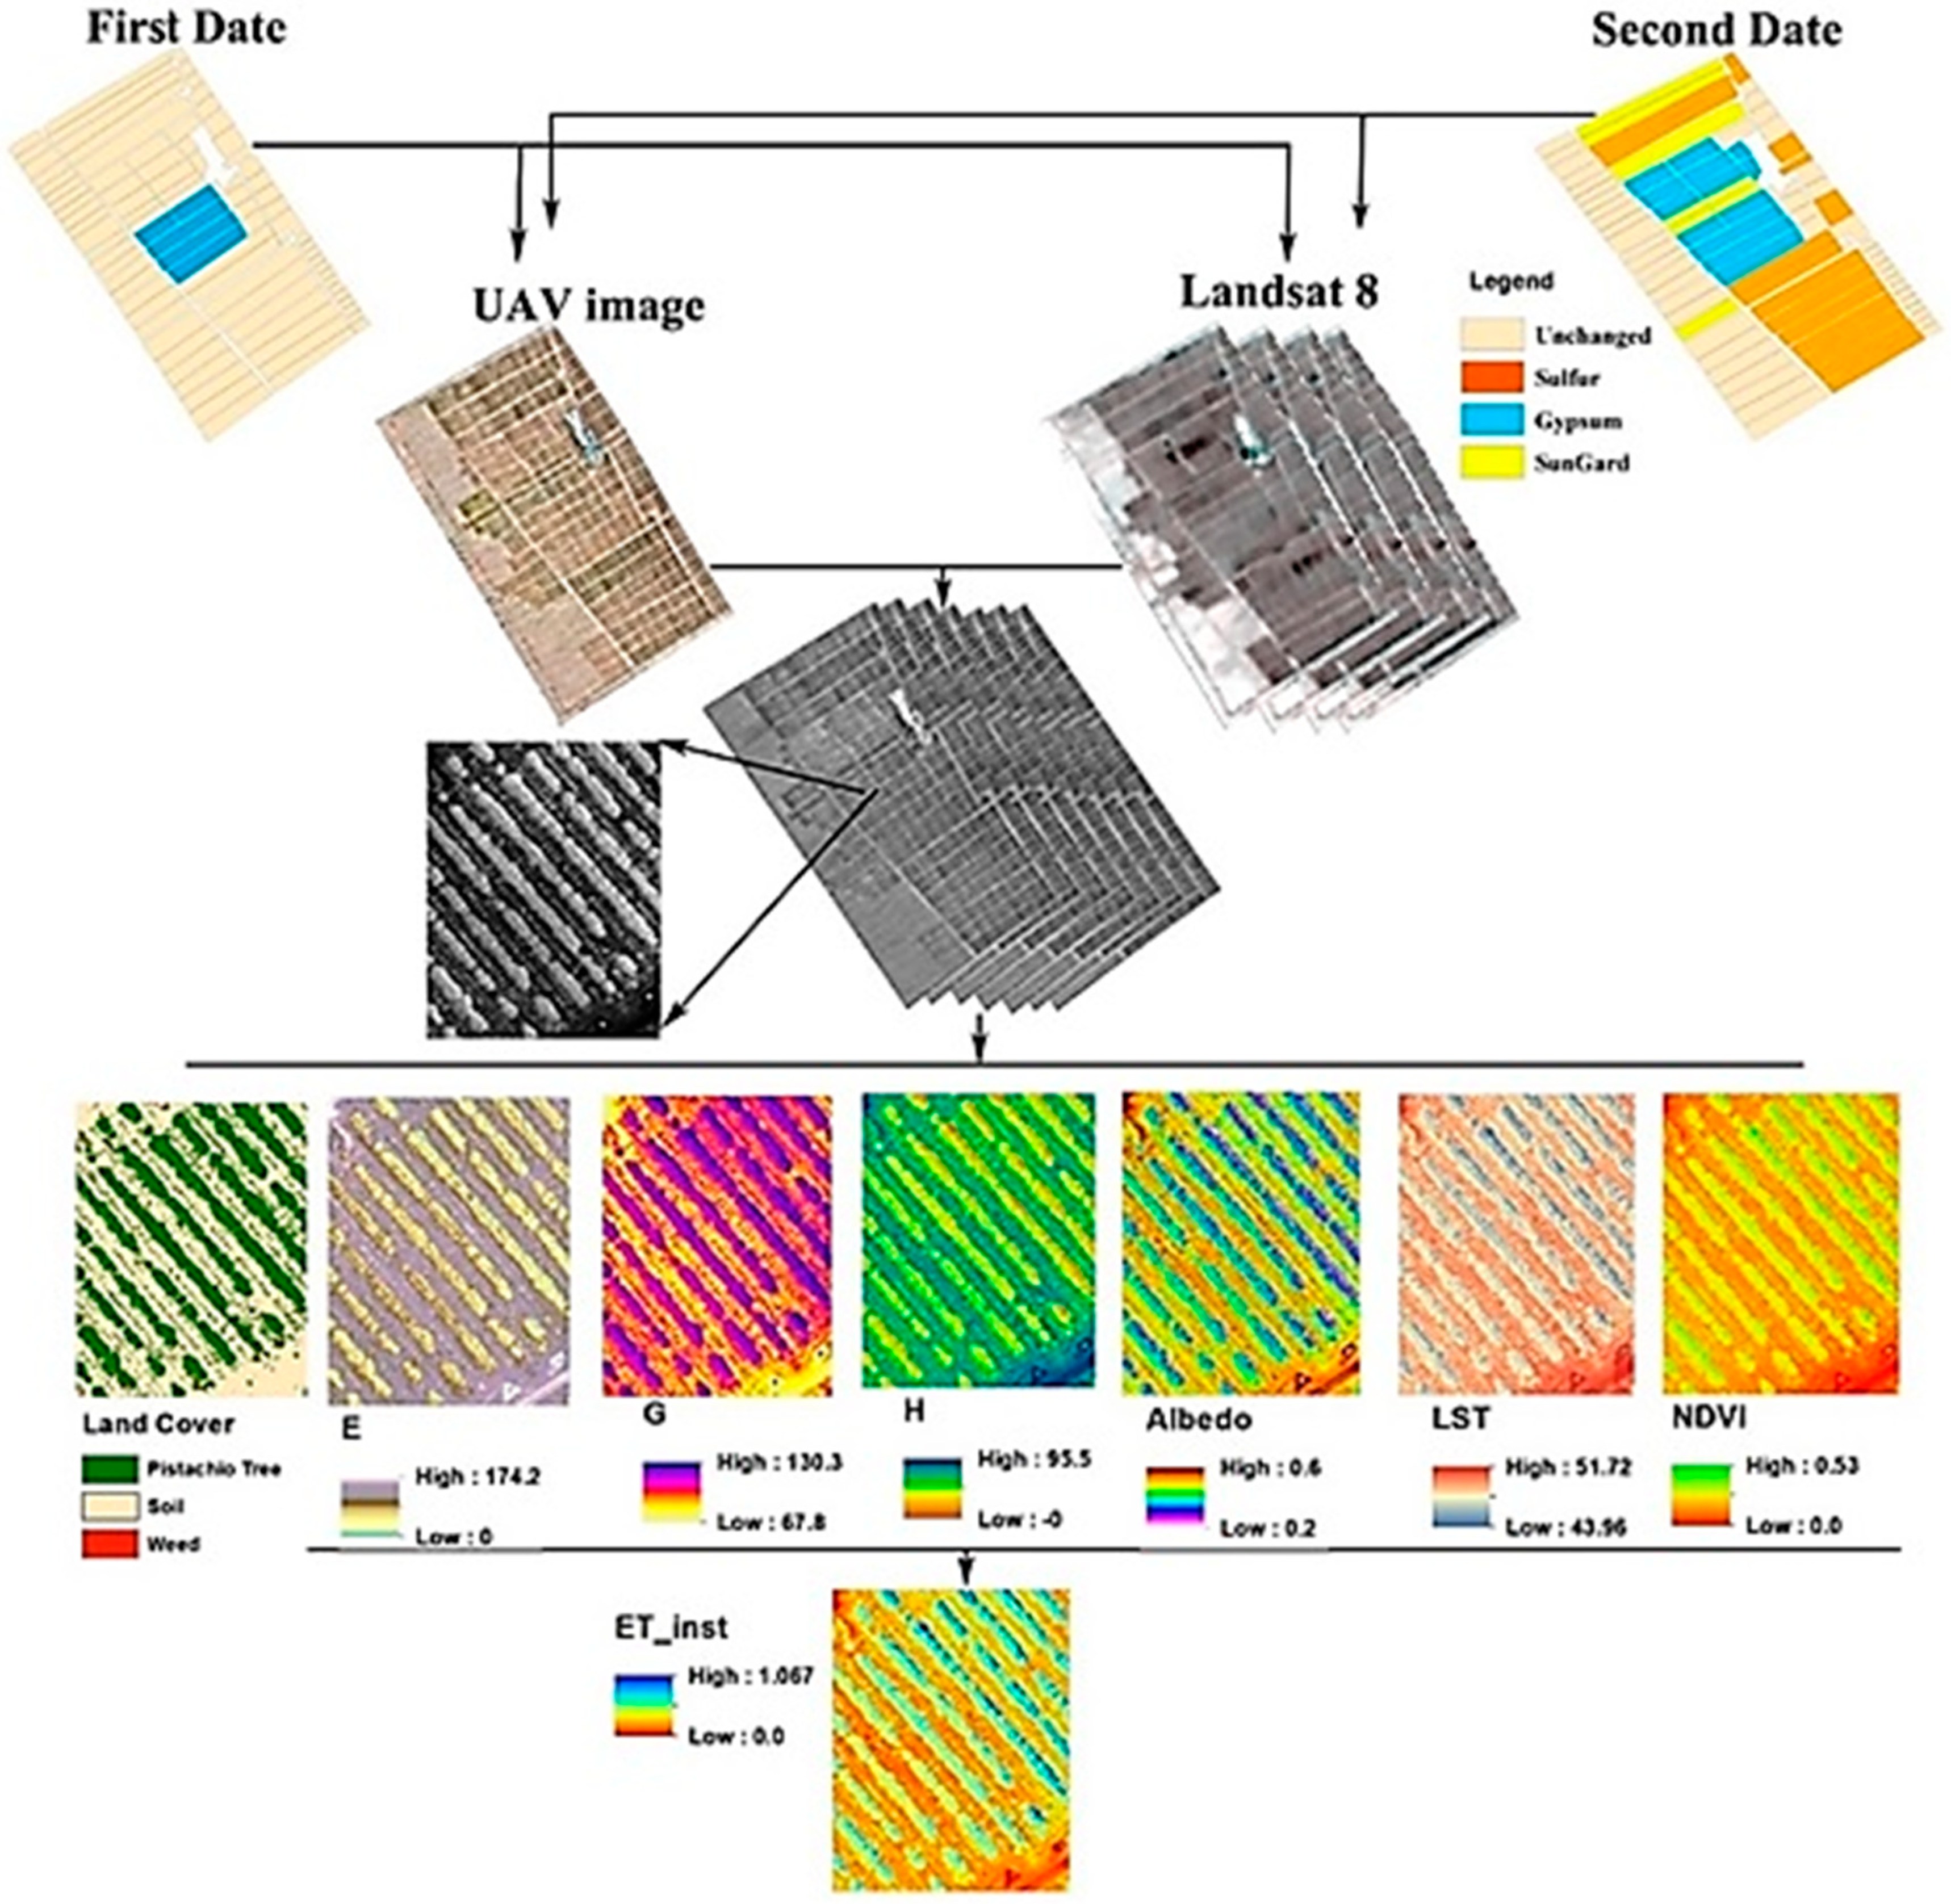
2.3. Compilation of Landsat 8 and UAV Images

The images used were Landsat 8 satellite data and RGB (red, green, blue) images from an UAV, both collected on 08/04/2020 (after the first spraying in plot A) and 20/08/2020 (after spraying different products in all plots). Landsat 8 carries two sensors, called OLI and TIRS. The OLI sensor provides data with spatial resolution of 30 m. It covers eight bands within the visible spectrum, near-infrared, short-wavelength infrared, and a panchromatic band with spatial resolution of 15 m. The TIRS sensor has two spectral ranges, 11.2–10.6 µm and 11.5–12.5 µm, for bands 10 and 11, respectively, and can record thermal infrared radiation with spatial resolution of 100 m [22]. The UAV images, obtained using a drone in the present study, consisted of RGB color images with spatial resolution 20 cm, with the selected shooting dates in early season (plot A) and in summer, at the peak of vegetation greenery (plots A–D). The drone flew over the study site at an altitude of 900 m, with an overlap of 80 × 70. The technological specifications of the drone used in this study are presented in Table 1.
A flow chart of the work is shown in Figure 5.
Due to technological and physical limitations, remote sensing imaging systems cannot capture thermal images with both high spectral resolution and high spatial resolution, and in most cases one of these is prioritized at the expense of the other [16]. To obtain data with high spectral and spatial resolution, and also high accuracy, the technique of compiling images was applied in this study. Compilation of images is an efficient approach to increase the spatial resolution of multispectral images by using two images with different spatial, spectral, and temporal resolution [23]. In early applications, images from different sensors were merged to better identify natural and artificial features [24]. In the present study, the compilation of both Landsat 8 and RGB from UVA images was performed following the methodology by Malamiri et al. [25]. The spatial resolution of Landsat 8 images was increased by merging with RGB images from the UAV. The advantages of each type of images (in terms of spectral and spatial resolution) were thus exploited [26]. Merging was carried out by principal component analysis (PCA) [27], a statistical–numerical method that converts a number of dependent components of a multispectral image into a smaller number of non-correlated linear compounds of variables, called principal components (PC) [28]. This method reduces the number of components by reducing the data dimensions and focusing on the available information in the multispectral data [29]. The bilinear interpolation re-sampling technique was used in PCA in this study. For details of the additional information that can be obtained from compiling Landsat 8 and UAV images, see Namratha and Raghu [30], Dong et al. [31], and Murugan et al. [32]. In the study site, the land surface temperature obtained from the remote sensing data was verified in previous research [33,34].

2.4. Retrieval of Remote Sensing Indices

Merged Landsat 8 and UAV images were used to estimate land surface temperature and evapotranspiration in the control plot (A) and in plots with pistachio trees foliar-sprayed once with sulfur, NAX-95 (calcium-based suspension coating), and gypsum (B–D). To determine the effect of foliar application on tree temperature and evapotranspiration, a land cover map was created by dividing the study site into three types of cover (bare soil, weeds, and pistachio trees). The land cover map was prepared using object-oriented classification of the RGB images collected with the drone. Areas with bare soil and weeds were then subtracted from the map, by using a prepared training sample of weed, trees and bare soil, so that temperature and evapotranspiration calculations were focused only on trees. The evapotranspiration of pistachio trees was investigated based on daily evapotranspiration using the SEBAL algorithm. To further investigate changes in tree temperature and daily evapotranspiration in each plot, images of temperature and daily evapotranspiration taken on the second imaging date were subtracted from images from the first date images from the first date.

2.4.1. Estimation of Land Surface Temperature

Land surface temperature (LST) was estimated using the split-window algorithm, based on absorption difference between two adjacent thermal bands in the range 10.0–12.5 μm and the linear radiation transfer equation in terms of temperature or wavelength. The algorithm estimates the land surface temperature by linear compilation of brightness temperature in two thermal bands [35]. First, necessary corrections were made on Landsat 8 images. Next, to compute the brightness temperature in the present study, the digital value of each pixel was first converted to radiance using given calibration values. The digital value of each pixel was then converted to spectral radiance in the sensor [36] using Equation (1):
L λ = M L × Q c a l + A L
where Lλ is spectral radiance in the sensor (W/m2 str. μm), ML is a multiplicative conversion factor, Qcal is the pixel value, and AL is an aggregation conversion coefficient.
Using the radiance values obtained, the brightness temperature was calculated according to Equation (2) [37]:
B T = K 2 ln [ ( K 1 / L λ ) + 1 ]
where BT is the brightness temperature recorded on the sensor surface in units, and K1 and K2 are fixed values obtained by dividing the reflection constant by the effective wavelength (λ), which varies for different Landsat images. The values of coefficient K1 in band 10 and 11 of Landsat 8 satellite images are 774.89 and 480.89 W/(m2. str. μm), respectively, and the values of K2 are 1321.08 and 1201.14 K, respectively [38].
Emissivity was calculated based on normalized difference vegetation index (NDVI) [39], by thresholding on NDVI and estimating fractional vegetation cover index (FVC) (Equation (3)):
N D V I = ( N I R R E D N I R + R E D )
where NIR and RED are land reflection in the near-infrared and red infrared band, respectively. NDVI values vary between −1 and +1. The NDVI values for areas with dry soil and areas with dense vegetation were calculated for threshold NDVI values of <0.2 (dry soil without vegetation, NDVIS) and >0.2 (dense vegetation, NDVIv), estimated for the Yazd Ardakan plain by Aliabad et al. [33]. FVC was then calculated as (Equation (4)) [40]:
F V C = ( N D V I N D V I S N D V I v N D V I S )
The FVC value obtained was used to calculate land surface emissivity (LSE) (Equation (5)):
L S E = ε S × ( 1 F V C ) + ε v × F V C
where εS is a soil diffusion coefficient constant and εv is a vegetation constant, with values in band 10 of Landsat 8 of 0.971 and 0.977, respectively, and in band 11 of 0.987 and 0.989, respectively [41,42].
After calculating LSE for each of the thermal bands, the mean emissivity (m) and emissivity difference (∆m) of these two bands were calculated as (Equations (6) and (7)):
m = L S E 10 L S E 11 2
Δ m = L S E 10 L S E 11
where LSE10 and LSE11 are land surface emissivity of band 10 and 11, respectively.
Finally, LST was calculated as [42] (Equation (8)):
L S T S W = B T 10 + C 1 ( B T 10 B T 11 ) + C 2 ( B T 10 B T 11 ) 2 + C 0 + ( C 3 + C 4 w ) ( 1 m ) + ( C 5 + C 6 w ) Δ m
where LSTSW is land surface temperature obtained from the split-window algorithm, BT10 is the brightness temperature recorded on the sensor surface (K°), m is mean emissivity, ∆m is the emissivity difference between the bands, C0C6 are coefficients obtained by simulation with different values for atmospheric and surface parameters (see Table 2), and w is the amount of water vapor in the atmosphere (assumed here to be a constant value of 0.013 g/cm2).

2.4.2. Estimation of Evapotranspiration

Evapotranspiration was estimated by the SEBAL algorithm [43], which uses the energy balance equation (Equation (9)) to calculate the instantaneous flux value of the latent heat of vaporization for each pixel [44] (Equation (9)):
λ E T i n s t = R n G H
where λETinst is the latent heat flux of evaporation, Rn is net solar radiation, G is soil heat flux, and H is sensible heat flux, all as Wm2.

2.4.3. Net Solar Radiation (Rn)

The amount of net solar radiation is computed from the balance of four brightness fluxes at the land surface: short input wavelength radiation (RS), short output wavelength reflection (RS), long input wavelength radiation (RL), and long-wavelength radiation emitted from the surface (RL). In the present study, net instantaneous radiation per level unit was calculated as [44] (Equation (10)):
R n = ( 1 α ) R S + R L R L ( 1 ε 0 ) R L
where Rn is net solar radiation in W/m2, α is surface albedo and ε0 is surface emittance.

2.4.4. Soil Heat Flux (G)

Soil heat flux (G) is the rate of heat transfer from soil and vegetation due to molecular conductivity. It is difficult to calculate soil heat flux using satellite imagery, but many studies have demonstrated a relationship between G/Rn ratio and parameters such as NDVI, surface temperature, and albedo. In the present study, G/Rn ratio for half a day was calculated as [43,44] (Equation (11)):
G R n = T S α ( 0.0038 α + 0.0074 α 2 ) ( 1 0.98 N D V I 4 )
where TS is surface temperature in °C, α is surface albedo, and NDVI is normalized difference vegetation index. The value of G was obtained by multiplying by Rn.

2.4.5. Sensible Heat Flux (H)

The amount of sensible heat flux (H) was estimated as [44] (Equation (12)):
H = ρ × C P × d T R a h
where ρ is the density of air (kg/m2), Cp is the specific heat of air (J/kg/k), dT is the difference in air temperature of the near-surface (°K), and Rah is the aerodynamic resistance for heat transfer (s/m). The solution to Equation (12) is rather complicated due to the presence of two unknowns, dT and Rah. To overcome the problem of two unknowns, the first two hot and cold pixels were selected based on SEBAL instructions, and a corrected value of sensible heat flux was obtained in a repetitive process [44].
After correcting the amount of sensible heat flux based on weather conditions, the instantaneous amount of latent heat flux of evaporation was calculated according to Equation (9) for each pixel. Evapotranspiration moment was then calculated according to Equation (13):
E T i n s t = 3600 λ E T i n s t λ
where ETins is instantaneous evapotranspiration (mm/h), λ is latent heat of vaporization (J/kg), and the value 3600 is a time conversion factor from seconds to hours.
Evapotranspiration was calculated based on the energy balance relationship at the moment of satellite transit. The value obtained was converted to daily evapotranspiration based on the evaporation fraction for each pixel of the image:
Λ = λ E T R n G Λ = R n G H R n G
Assuming a constant evaporation fraction Ʌ over 24 h, the 24-h evapotranspiration was calculated as:
E T 24 = 86400 Λ ( R n G 24 ) λ
where the evaporation fraction during the day is assumed to be constant, Rn is net daily radiation (W/m2), λ is latent heat of evaporation (J/kg), and G24 is daily soil heat flux (W/m2).

3. Results

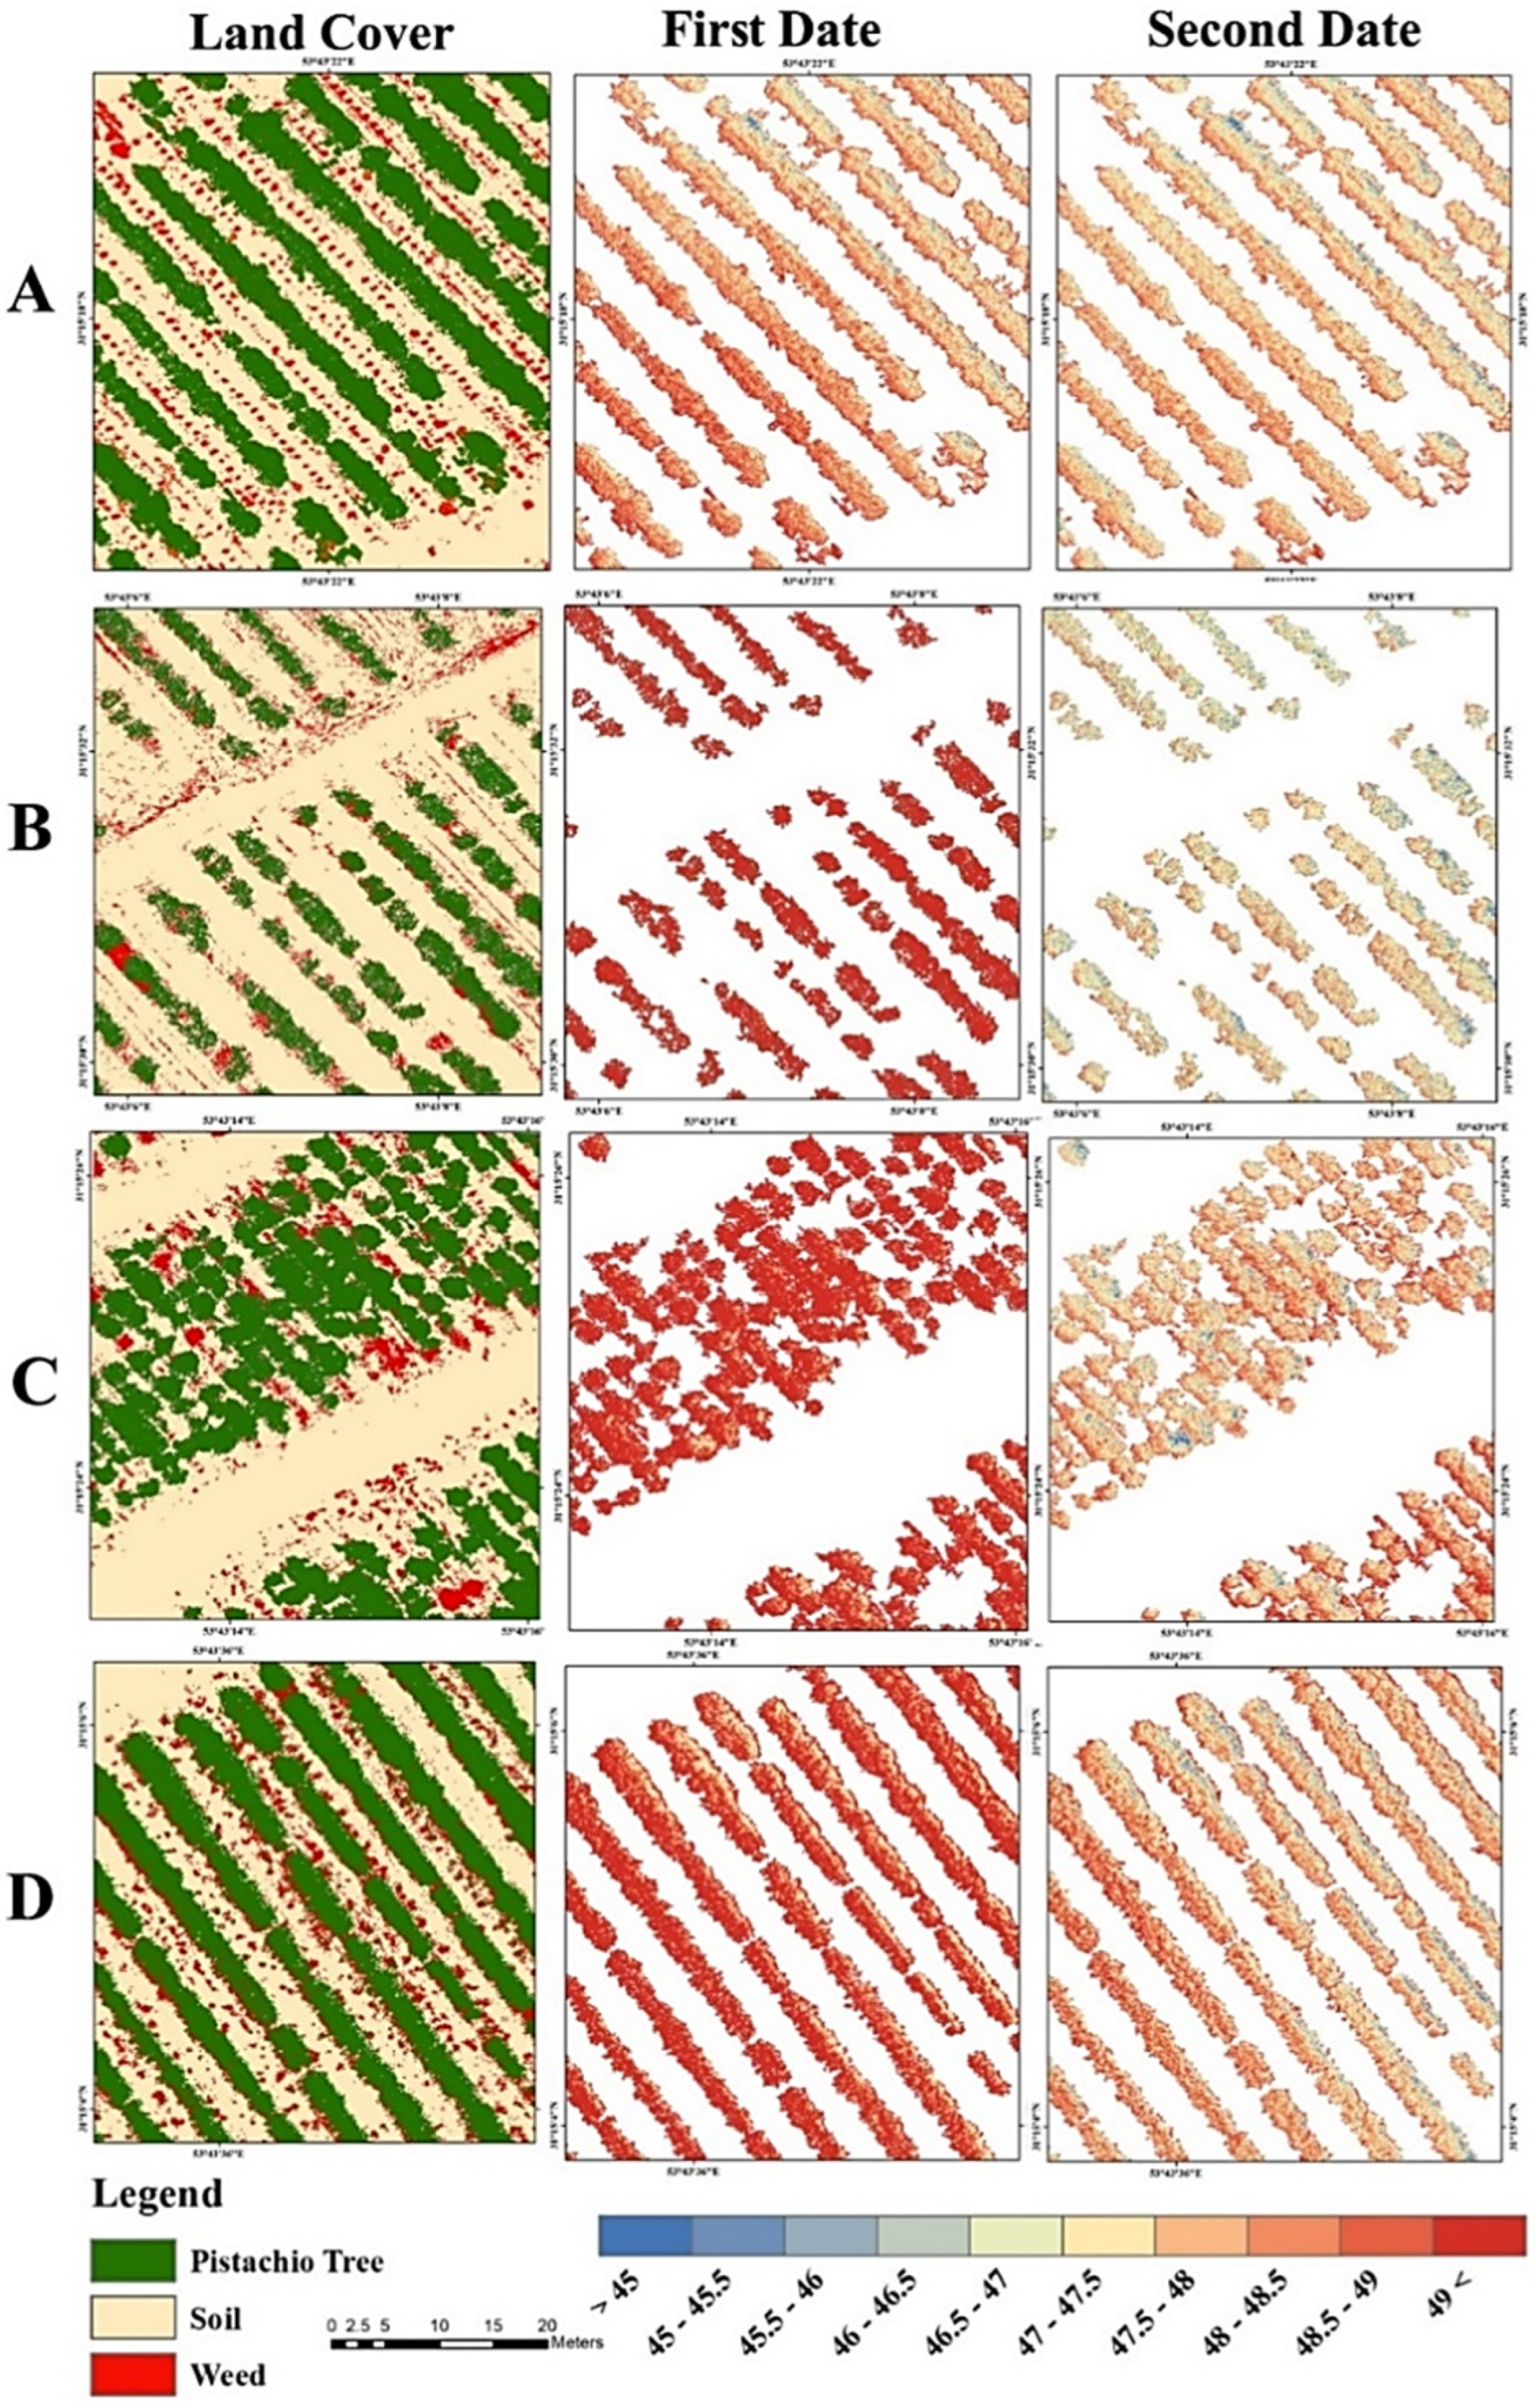
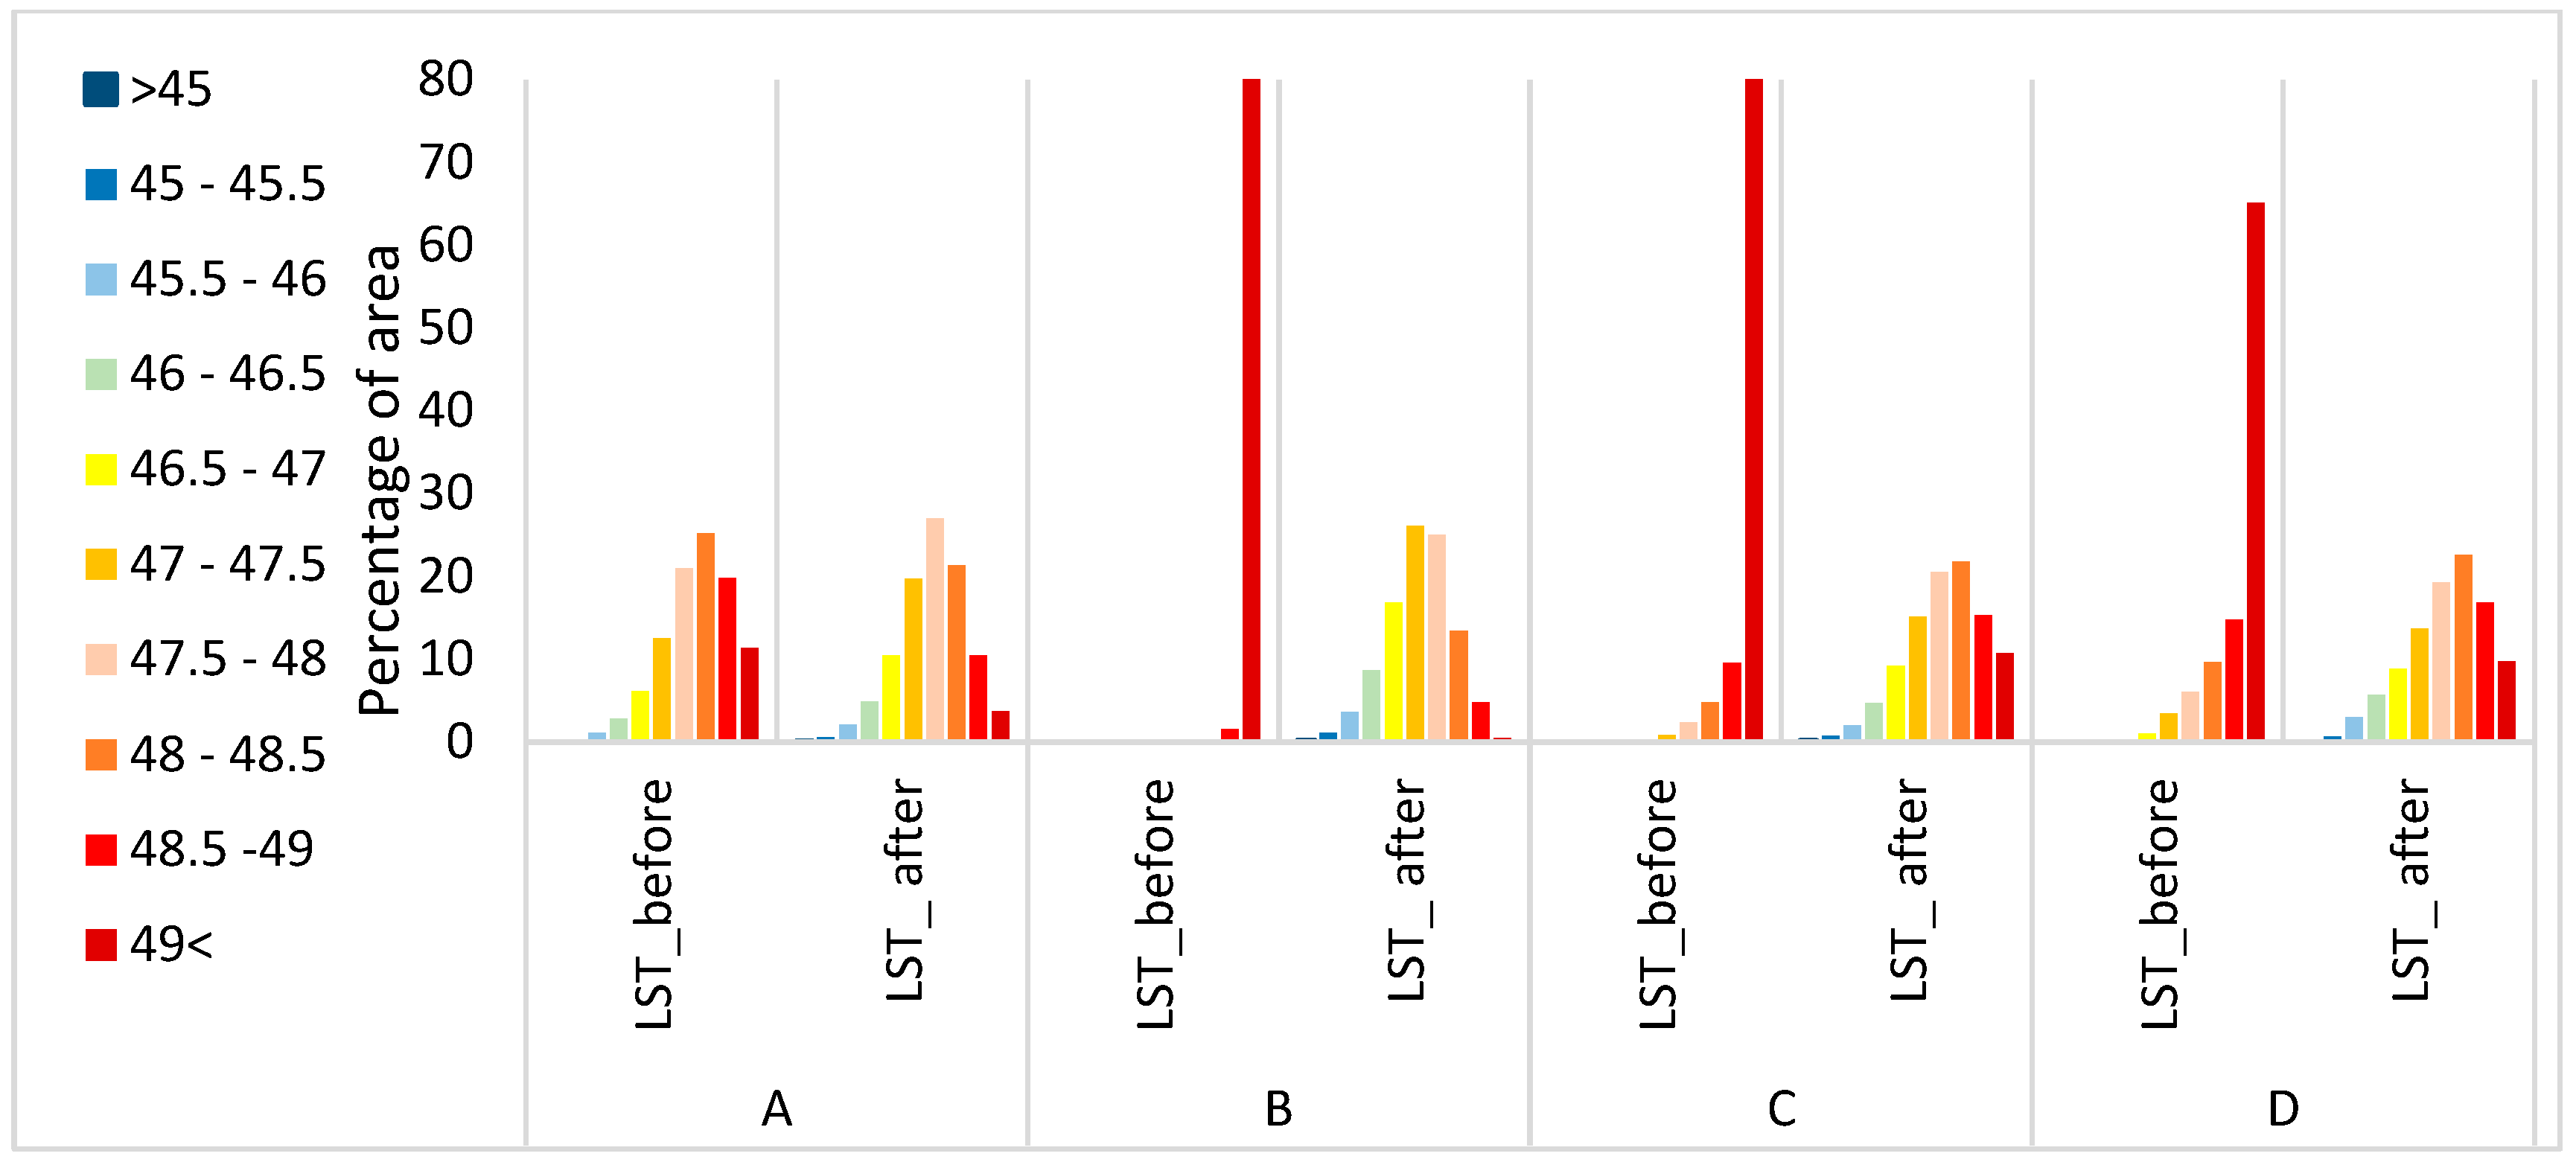
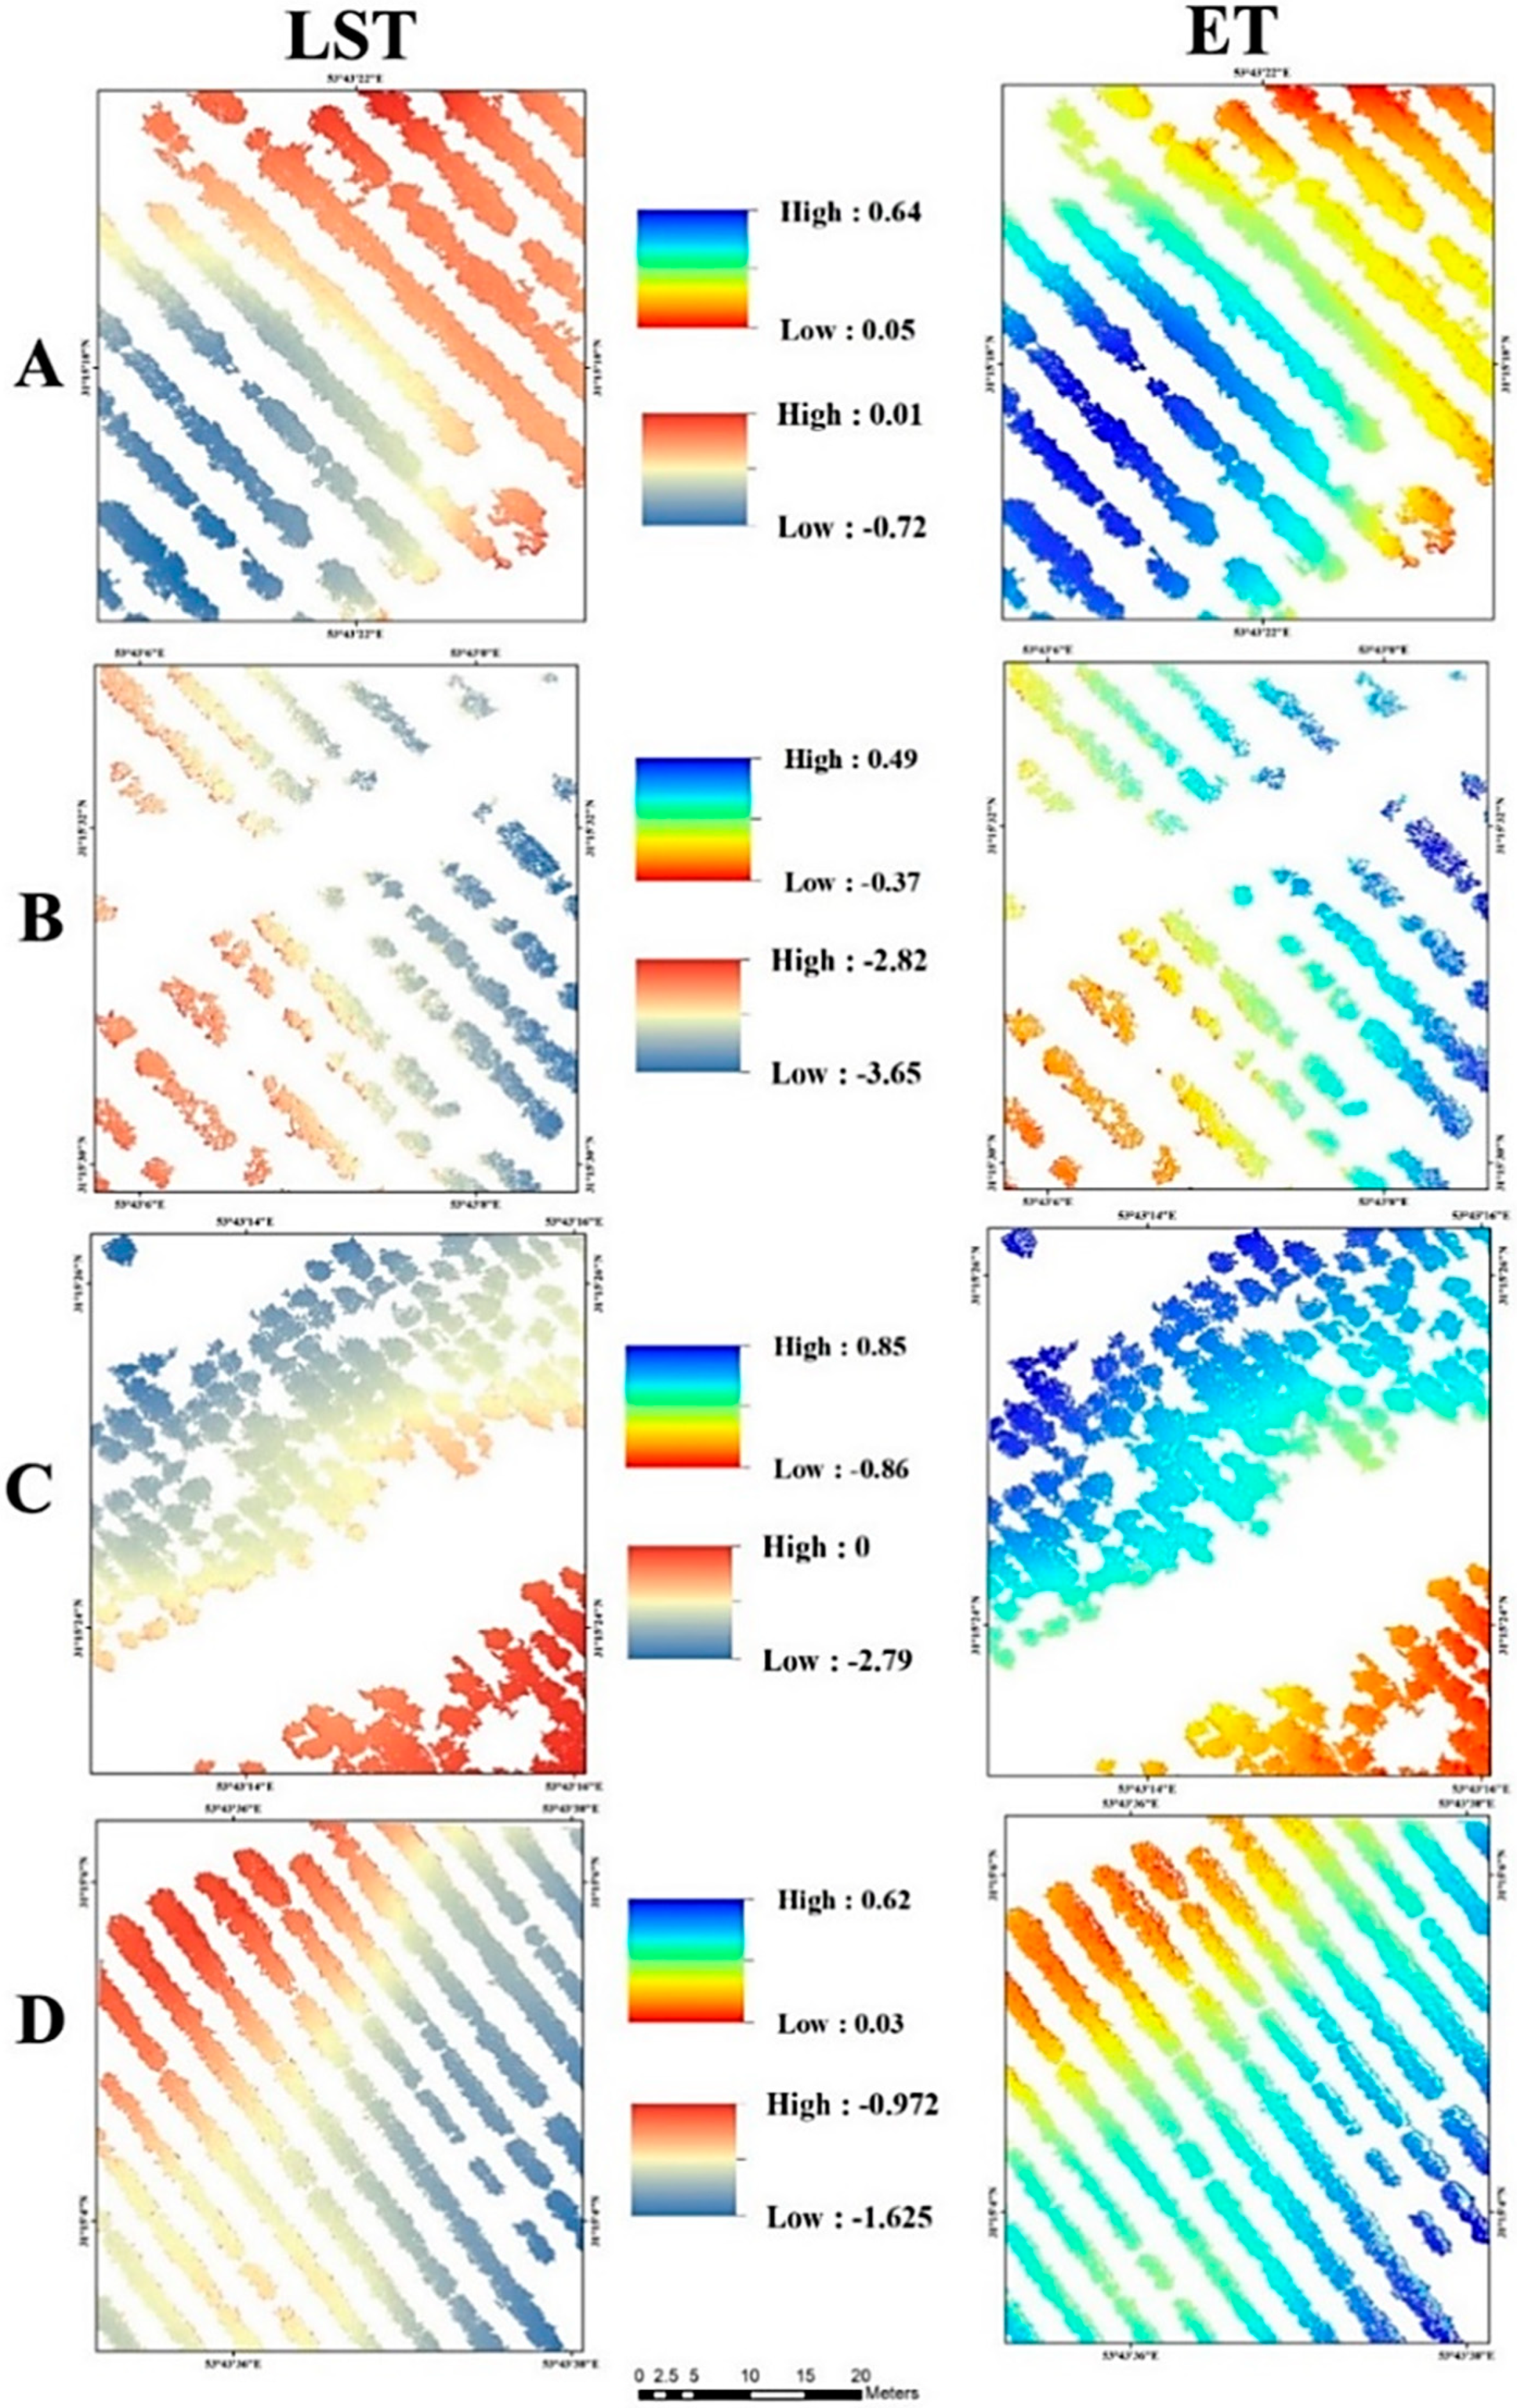
3.1. Impact of Foliar Spraying on Pistachio Tree Temperature

The land cover in each plot and the temperature of pistachio trees in plot A and plots B–D are shown in Figure 6. The temperature of pistachio trees was mapped in categories with 0.5 °C increments, to reveal any changes. The quantitative comparison of the tree temperature in each plot is presented in Figure 7. In plot A (control), which was sprayed with gypsum at the first and second imaging dates, tree temperature remained constant between the two sprayings and the area occupied by the different tree temperature categories did not change. This indicates that the environmental conditions were similar between the two dates and that the temperature change seen in other plots was due solely to the foliar application. Both before and after foliar spraying of gypsum in plot A, more than 45% of pistachio trees in the study area were located in the temperature band 47.5–48.5 °C. Before foliar spraying of gypsum in plot B, more than 90% of trees in that plot were in the temperature category > 49 °C, while after spraying the temperature decreased to 47–48 °C in more than 50% of the area and tree temperature exceeded 49 °C in only 0.5% of the plot area. Before foliar application of NAX-95 (calcium-based suspension coating) in plot C, 80% of tree area had temperature > 49 °C, while after spraying 40% of tree area had temperature 47.5–48.5 °C, and 10% of the area had temperature > 49 °C. Before foliar application of sulfur in plot D, more than 65% of pistachio trees were in the temperature category > 49 °C, while afterwards the temperature was in the range 47.5–48.5 °C for 41% of the tree area, and it was above 49 °C for only 9% of the tree area.
In general, on comparing the percentage area of temperature classes in each of the plots it was apparent that gypsum gave the greatest reduction in tree temperature among the three materials studied (Figure 7).

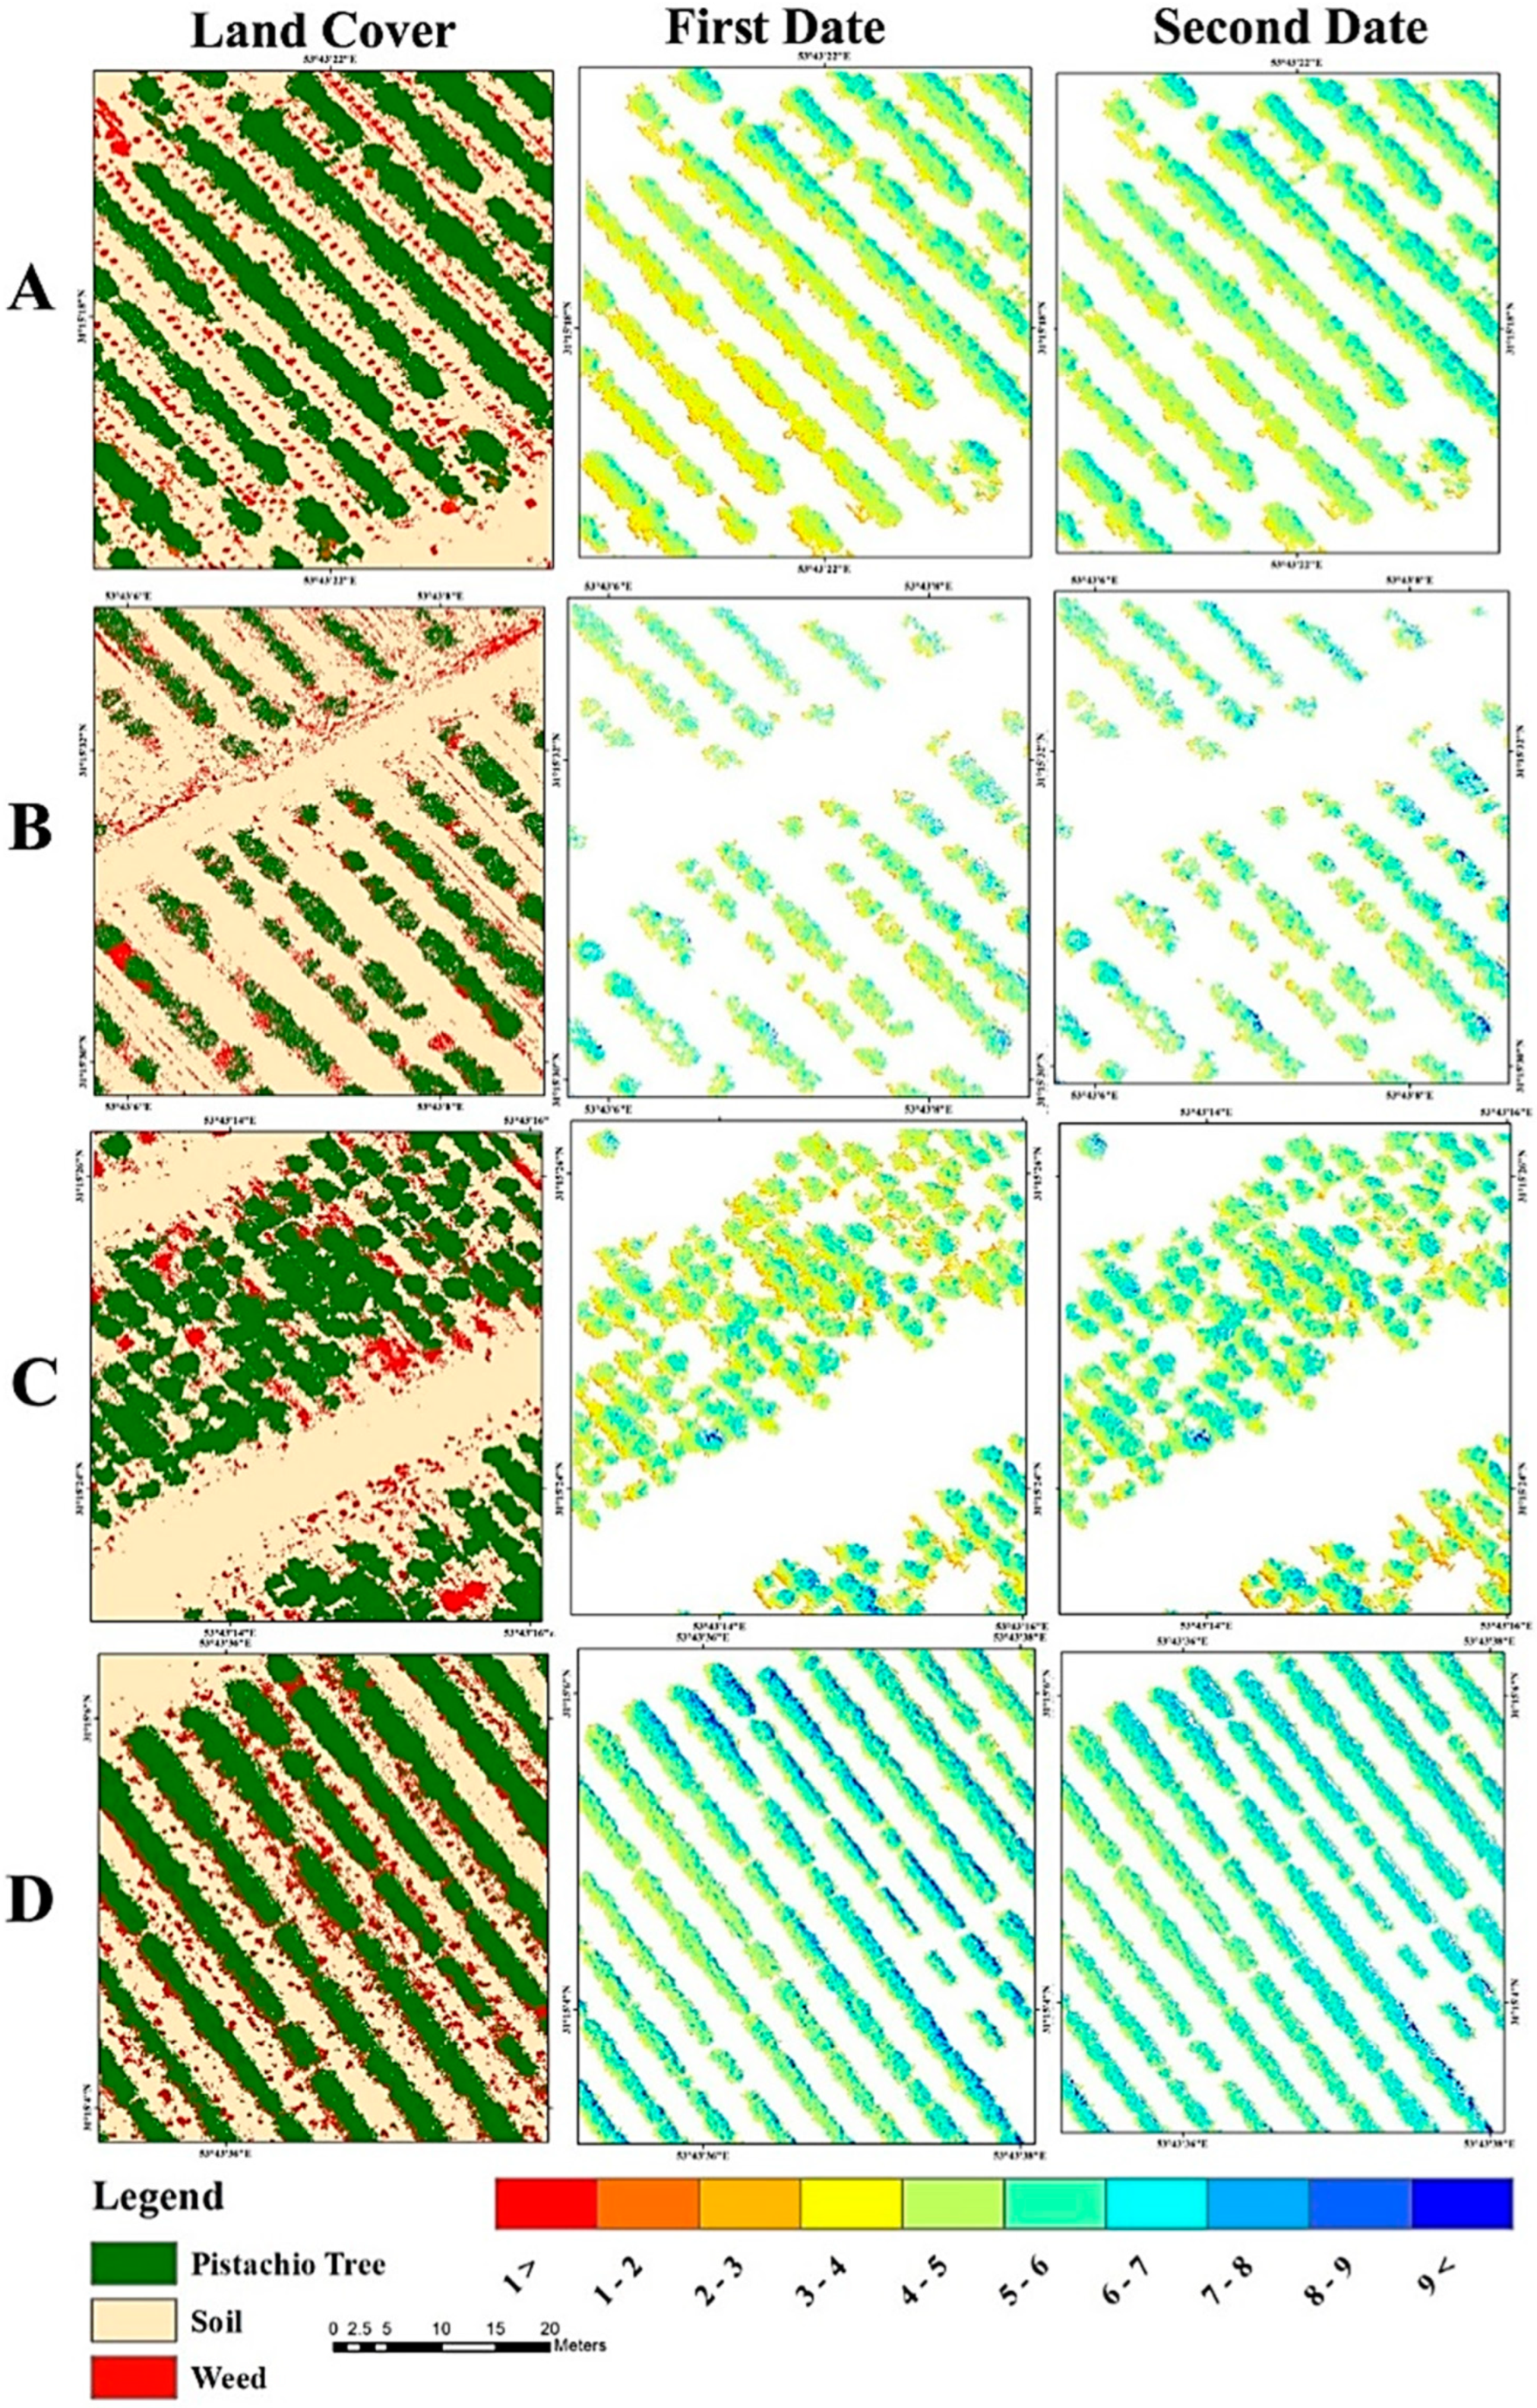
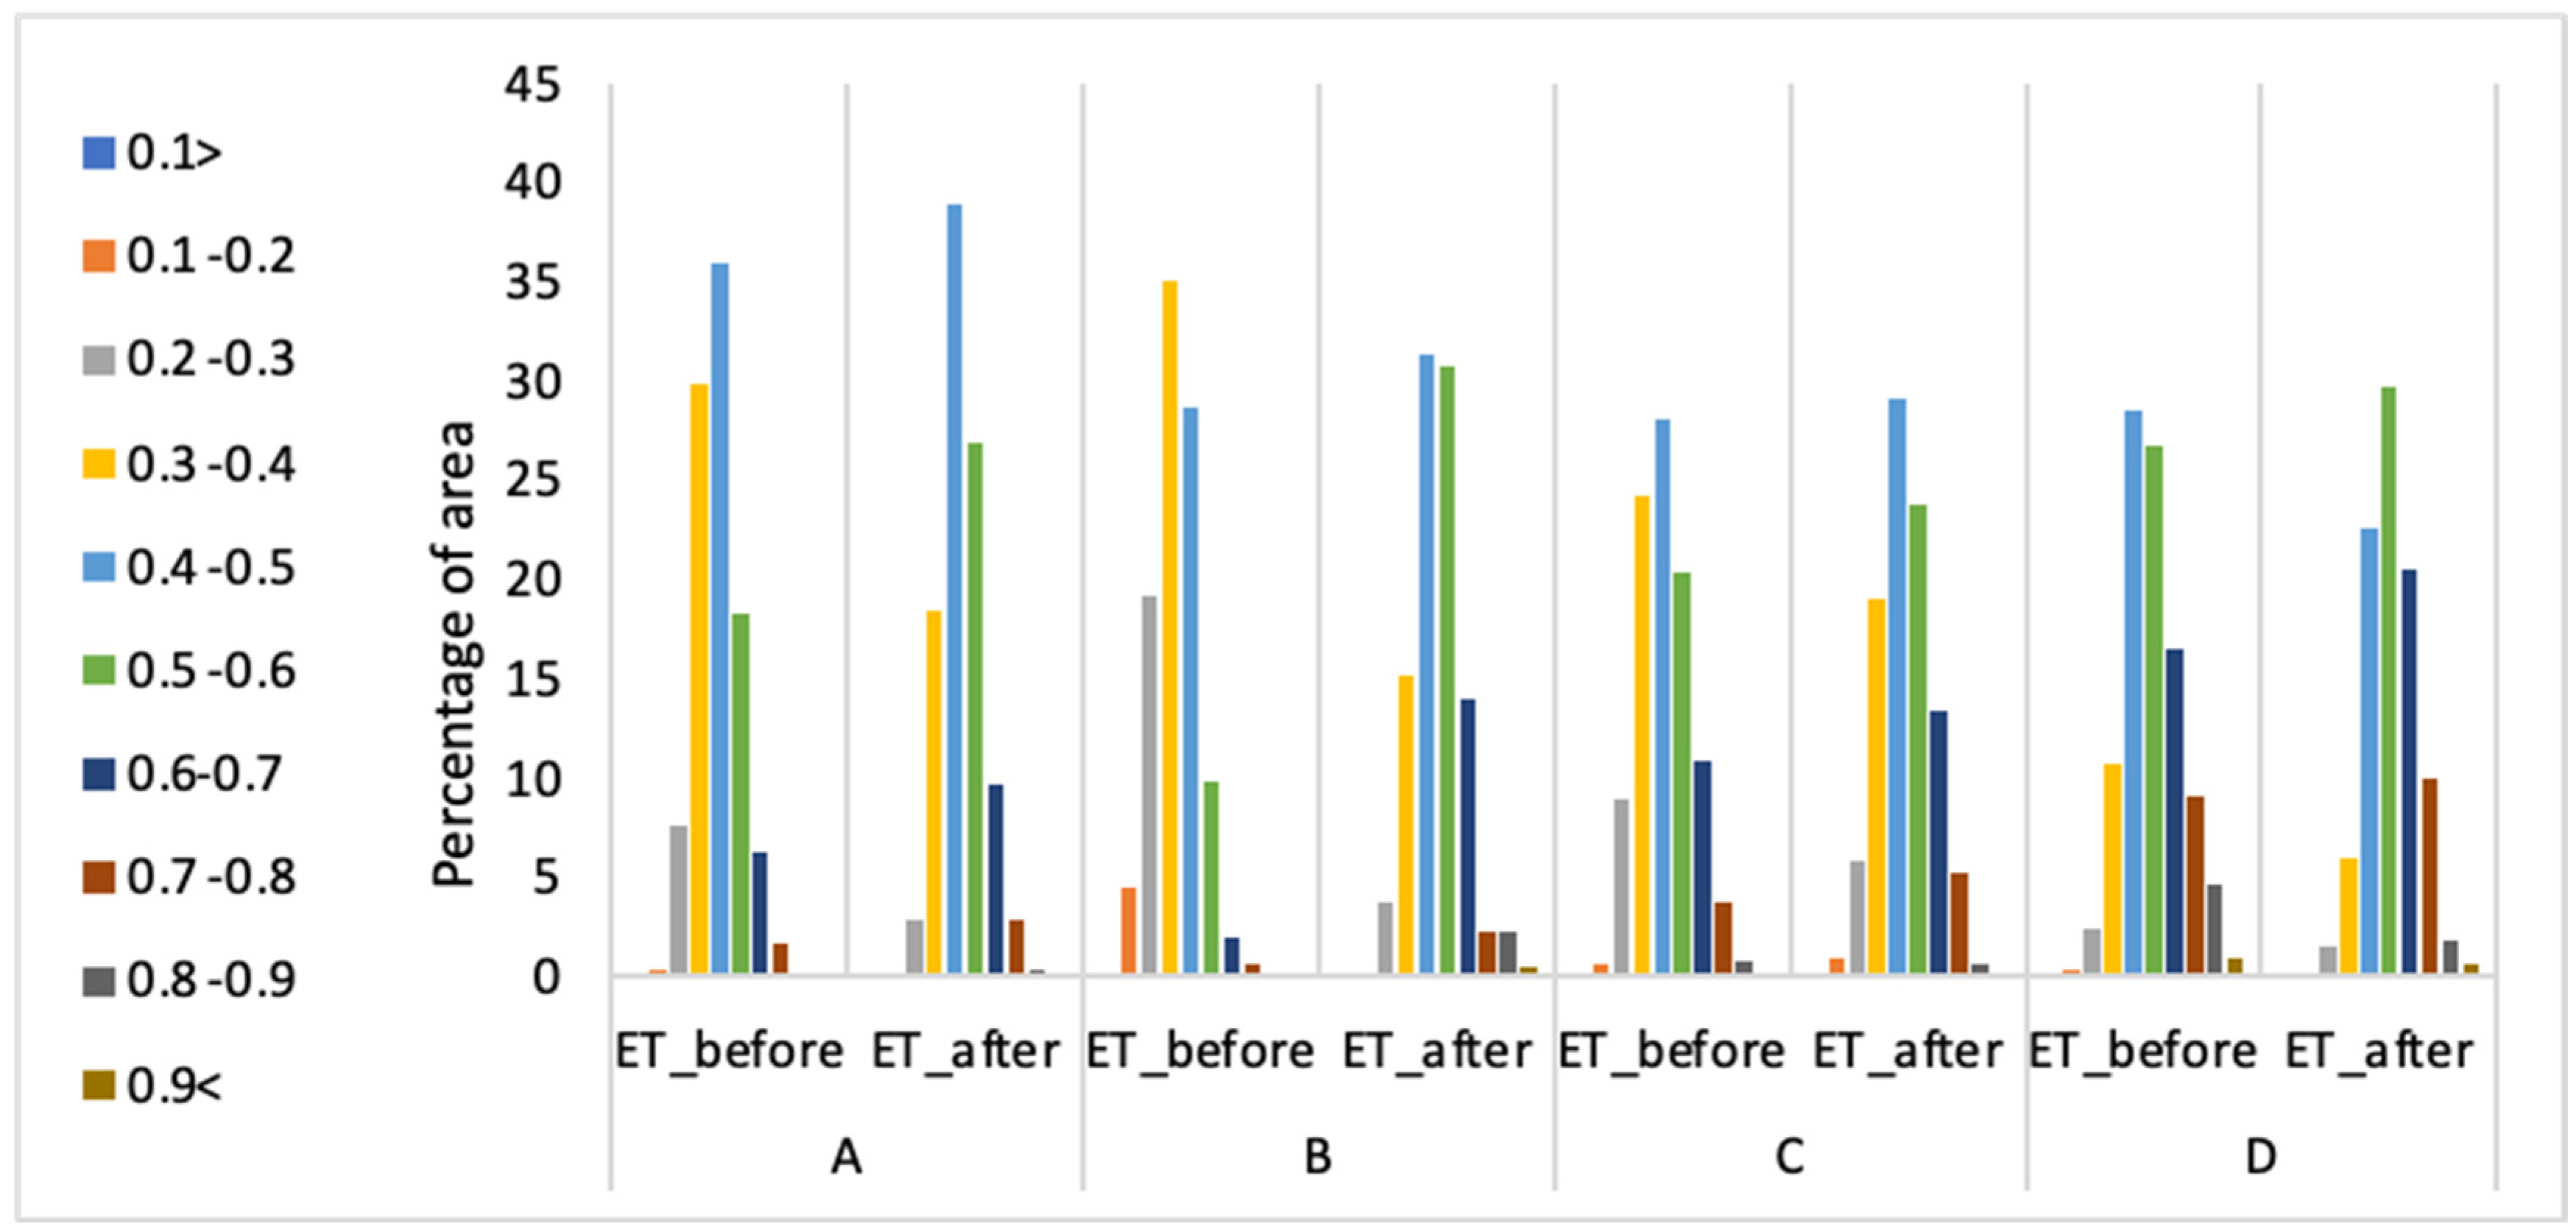
3.2. Impact of Foliar Application on Pistachio Tree Evapotranspiration

Figure 8 presents the land cover maps and daily evapotranspiration by pistachio trees at 1 mm intervals in each of the plots. In plot A, where the trees were foliar-sprayed twice with gypsum, daily evapotranspiration was similar on both dates, as found for temperature. For example, trees with evapotranspiration of 0.4–0.5 mm/day occupied the highest percentage of tree area on the first spraying date (36%), and the second date (38%). In plot B, in which the trees were sprayed once with gypsum, the largest percentage area was occupied by trees with evapotranspiration of 0.3–0.4 mm/day (35%) and 0.4–0.5 mm/day (28%). Trees in the two highest daily evapotranspiration categories (0.4–0.5 and 0.5–0.6 mm/day) occupied 31% and 30% of total tree area, respectively.
Before foliar application of gypsum in plot B, 80% of the tree area showed daily evapotranspiration of <0.5 mm/day, while after application this proportion decreased to 50% of tree area and the remaining tree area showed increased evapotranspiration. Before foliar application of NAX-95 (calcium-based suspension coating) in plot C, 62% of the pistachio tree area showed daily evapotranspiration of <0.5 mm/day, while after application the proportion was 54%. In general, foliar application of NAX-95 (calcium-based suspension coating) led to an increase in evapotranspiration in 0.8% of the tree area, as its temperature reduction effect was less than that of gypsum. Before foliar spraying with sulfur in plot D, trees in the highest daily evapotranspiration categories of 0.4–0.5 and 0.5–0.6 mm/day occupied 28% and 26%, respectively, of the pistachio tree area, while after spraying the corresponding values were 22% and 29%, respectively. In that plot, 42% of the tree area was initially occupied by trees in the daily evapotranspiration category <0.5 mm/day, while after sulfur application evapotranspiration increased in 12% of the tree area (Figure 9). It should be noted that valid data regarding actual amount of evapotranspiration were not available to validate the results of the SEBAL algorithm, although various studies have evaluated the accuracy of the SEBAL algorithm for Iran and have found good accuracy [45,46].
Figure 10 shows the differences in tree temperature and daily evapotranspiration in each plot, by subtracting the second imaging date from images from the first date. In plot A (control), the temperature of pistachio trees showed no significant change from the first to the second date, with the maximum temperature change for pistachio trees being 0.1 °C and the minimum −0.7 °C. Consequently, daily evapotranspiration by trees in this plot increased by a maximum of 0.6 and a minimum of 0.05 mm/day. In plot B, which was foliar sprayed once with gypsum, the temperature of the pistachio trees decreased by 2.8–3.65 °C between the first and second imaging dates, and daily evapotranspiration increased by 0.3–0.49 mm/day. In general, gypsum gave a greater temperature reduction than the other two materials tested. In plot C, foliar spraying with NAX-95 (calcium-based suspension coating) caused the temperature of pistachio trees to decrease by 0–2.79 °C, and also resulted in a decrease in daily evapotranspiration of 0.85–0.86 mm/day. Considering that evapotranspiration is not dependent solely on tree temperature of the trees, and including parts of plots A and C where tree temperature showed no significant change between the imaging dates, evapotranspiration increased by between 0.6 and 0.8 mm/day. Therefore, the maximum increase in evapotranspiration of e.g., 0.49 mm/day in plot B represented a decrease in evapotranspiration compared with the control situation. In plot D, foliar spraying with sulfur decreased tree temperature by 0.9–6 °C, and increased daily evapotranspiration by 0.03–0.6 mm/day.
The maximum, minimum, and mean pistachio tree temperature and daily evapotranspiration difference between the first and second imaging dates are shown in Table 3. Comparison of the mean surface temperature change values showed that the greatest decrease in tree temperature was related to foliar application of gypsum, which caused the mean temperature of the trees to decrease by 3.3 °C. The trees foliar-sprayed with gypsum also showed less daily evapotranspiration change, although mean daily evapotranspiration increased by 0.18 mm/day. Additional benefits of applying gypsum are that it can improve soil structure and help to overcome soil salinity problems [47].
Foliar spraying with sulfur reduced mean tree temperature by 1.3 °C and caused mean evapotranspiration to increase by 0.3 mm/day. Foliar spraying with NAX-95 (calcium-based suspension coating) had very little effect in reducing the temperature of pistachio trees (mean decrease 0.6 °C) and increased mean daily evapotranspiration by 0.22 mm/day.

4. Discussion

High temperatures and drought periods are common in arid regions. In the Yazd province, one of the major difficulties in many pistachio orchards is very high temperatures in summer, particularly in drought years, when the damage to trees and fruit is more severe. Although pistachio trees are extremely resistant to arid conditions and can grow in soil and salt water, the fruit is very sensitive to sunburn during the initial stages of growth. The destructive effects of high temperatures in pistachio orchards are reduced quantity and quality of the commercial product, and the general weakness of the trees [48]. One of the methods to reduce the effect of sunburn on trees is foliar spraying. Various materials are used for foliar spraying [8,9,10]. The present study investigates the effect of three substances, including gypsum, sulfur, and NAX-95 (calcium-based suspension coating) on the reduction of pistachio sunburn. The results revealed that gypsum solution had the greatest effect on the reduction of the temperature of pistachio trees. On average, foliar spraying with gypsum decreased the temperature of pistachio trees by 3.3 °C, whereas foliar spraying with NAX-95 (calcium-based suspension coating) and sulfur reduced the temperature of pistachio trees by 1.3 and 0.6 °C, respectively. These results are consistent with others investigating the impact of foliar spraying on trees and showing a temperature reduction up to 3 °C using kaolin (a white substance of aluminum silicate mineral, AL4Si4O10[OH]8) [8,9]. Light-reflecting colored mulches have been also used and were proven to reduce canopy temperature by 2–6 °C, but they are high in cost [10]. Other methods for reducing tree temperature include tree-top sprinkler irrigation system but their high cost and limited water availability [5] makes it less suitable. However, previous studies have examined the effect of different substances on foliar spraying of different trees such as pomegranate and apple [49,50] and a limited number of studies investigated foliar spraying on the reduction of pistachio tree sunburn [51]. Furthermore, our study shows that trees sprayed using gypsum and sulfur decreased evaporation and transpiration by 0.18 and 0.36 mm per day, respectively, and in the areas sprayed by NAX-95 (calcium-based suspension coating) transpiration evaporation decreased by 0.22 mm per day. Therefore, although the use of gypsum in foliar-spraying pistachio trees reduced the temperature of the trees more than other substances, NAX-95 led to higher decreases in evaporation of transpiration. In farms where water consumption is considered, apart from the temperature reduction, it should be noted that in foliar spraying, the complete coating of the leaves and reduction in the temperature of the pistachio tree increase the seed size, reduce porosity, control sucking pests, and prevent pistachio fall [3,4].
In previous studies, ground measurements were used to investigate the impact of foliar spraying on trees. In our study, however, remote sensing was successfully used to determine the effects of foliar spraying on tree leaf temperature and daily evapotranspiration. The use of remote sensing always involves two criteria: spatial and spectral resolution. The spatial resolution in Landsat 8 satellite images from the thermal band receiver is not sufficient for examining the trees. Therefore, it was not possible to use these images to examine the temperature change of trees and their transpiration evaporation at the field level because the pistachio farm lacks dense coating, and there is soil among the trees, which creates impure pixels. For this reason, the spatial resolution ability of satellite images was enhanced by using drone images. The UAV images have very high spatial resolution but do not include the thermal band, and drones that are capable of providing this band are very expensive [52]. Thus, Landsat 8 satellite images and drone images were integrated so that images with high spectral and spatial power can be created. The temperature and transpiration were estimated using integrated images. Since this study only addressed the temperature of the tree surface and the evaporation of tree transpiration, and the difference in weed density in different rows might cause errors, pistachio farm coatings, weeds, and soil were segregated using the supervised classification. Likewise, some studies have addressed the separation of weeds from trees using drone images, and the ability of drone images to separate these land coatings has been confirmed [53,54]. The surface temperature images were evaluated using the separate window method, which was validated in a previous study by the researchers and could estimate the Earth’s surface temperature with an accuracy of more than 5 °C [33]. Thus, integrating images from satellite and UAVs seems to provide an efficient methodology to improve agricultural management practices and support precision agriculture.

5. Conclusions

Pistachio is a recommended agricultural crop for arid regions of Iran due to its potential for adaptation to adverse environmental conditions, such as soil salinity, water scarcity, and drought. However, sunburn and heatstroke can cause much damage to the pistachio crop and measures to mitigate this problem are needed. Foliar application of different compounds can reduce the temperature of pistachio trees and prevent sunburn, and this method is popular with farmers due to its relatively low cost and perceived lack of impacts of the compounds on soil quality after wash-off by rain. In this study, we merged Landsat 8 and UAV images to obtain images with high spatial and spectral resolution, and used these to estimate tree temperature and evapotranspiration in experimental plots. Therefore, foliar application of gypsum can have beneficial impacts in areas with hot summers which are susceptible to drought periods. However, foliar application of NAX-95 (calcium-based suspension coating) gave lower evapotranspiration, which may be interesting considering the increasing water scarcity problems in the region. Future studies should use the remote sensing approach to examine the effect of foliar application of other compounds, e.g., kaolin, to pistachio trees, and the effect of foliar application of gypsum to other tree species. Combining the high spatial resolution images from UAV with the thermal band data from Landsat 8 provided information relevant for determining the impact of spraying light-reflecting products on tree temperature and evapotranspiration.

Author Contributions

S.S. conceived the original idea. S.S. and F.A.A. helped supervise the project. F.A.A. and M.M. performed the analytical calculations and the numerical simulations. Z.K. and C.S.S.F. supervised the project. C.S.S.F. and Z.K. wrote the manuscript. All authors participated in development of the study and the experiments. All authors have read and agreed to the published version of the manuscript.

Funding

This research received no external funding.

Data Availability Statement

Not applicable.

Acknowledgments

Authors are grateful to the University of Tehran and Stockholm University for their support of this research.

Conflicts of Interest

The authors declare no conflict of interest.

References

  1. Mehdi-Tounsi, H.; Chelli-Chaabouni, A.; Mahjoub-Boujnah, D.; Boukhris, M. Long term field response of pistachio to irrigation water salinity. J. Agric. Water Manag. 2017, 185, 1–12. [Google Scholar] [CrossRef]
  2. Abbaspour, H.; Saeidi-Sar, S.; Afshari, H.; Abdol-Wahhab, M. Tolerance of mycorrhiza infected pistachio (Pistacia vera L.) seedling to drought stress under glasshouse conditions. J. Plant Physiol. 2012, 169, 704–709. [Google Scholar] [CrossRef] [PubMed]
  3. Schrader, L.A.; Zhang, J.; Duplaga, W.K. Two types of sunburn in apple caused by high fruit surface (peel) temperature. Online. Plant Health Prog. 2001, 2, 3. [Google Scholar] [CrossRef]
  4. Hassein, M.M.; Camilia, Y. Mineral Constituents of Fenugreek Varieties Grown Under Water Stress Condition. Aust. J. Basic Appl. Sci. 2011, 5, 2904–2909. [Google Scholar]
  5. Kotzé, W.A.G.; Carreira, J.A.; Beukes, O.; Redelinghuys, A.U. Effect of evaporative cooling on the growth, yield and fruit quality of apples. Deciduous Fruit Grow. 1988, 38, 20–24. [Google Scholar]
  6. Widmar, A. Light intensity and fruit quality under hail protection net. Acta Hortic. 2001, 557, 421–426. [Google Scholar] [CrossRef]
  7. Gindaba, J.; Wand, S.J.E. Comparative effects of evaporative cooling, kaolin particle film and shade net on sunburn and fruit quality in apples. Hortic. Sci. 2005, 40, 592–596. [Google Scholar] [CrossRef]
  8. Wand, S.J.E.; Theron, K.I.; Ackerman, J.; Marais, S.J.S. Harvest and post-harvest apple fruit quality following applications of kaolin particle film in South African orchards. Sci. Hortic. 2006, 107, 271–276. [Google Scholar] [CrossRef]
  9. Gharaghani, A.; Eshghi, S.; Khajenouri, Y.; Rahemi, M. Effect of kaolin on tree physiology, superficial sunburn and fruit quantitative and qualitative characteristics of two commercial apple cultivars. Iran. J. Hortic. Sci. 2015, 46, 475–486. [Google Scholar]
  10. Hossain, M.B.; Jitu, S.; Akter, S.; Islam, M.A. Management of Okra Yellow Vein Mosaic Virus (OYVMV) Through Selected Insecticides and Light Reflecting Colored Mulches. Eur. J. Agric. Food Sci. 2021, 3, 161–165. [Google Scholar] [CrossRef]
  11. Rosati, A.; Metcalf, S.G.; Buchner, R.P.; Fulton, A.E.; Lampinen, B.D. Physiological Effects of Kaolin Applications in Well-irrigated and Water-stressed Walnut and Almond Trees. Ann. Bot. 2006, 98, 267–275. [Google Scholar] [CrossRef] [PubMed] [Green Version]
  12. Melgarejo, P.; Martínez, J.J.; Hernández, F.; Martínez-Font, R.; Barrows, P.; Erez, A. Kaolin treatment to reduce pomegranate sunburn. Sci. Hortic. 2004, 100, 349–353. [Google Scholar] [CrossRef]
  13. Courault, D.; Seguin, B.; Olioso, A. Review on estimation of evapotranspiration from remote sensing data: From empirical to numerical modeling approaches. Irrig. Drain. Syst. 2005, 19, 223–249. [Google Scholar] [CrossRef]
  14. Maes, W.H.; Steppe, K. Estimating evapotranspiration and drought stress with ground-based thermal remote sensing in agriculture: A review. J. Exp. Bot. 2012, 63, 4671–4712. [Google Scholar] [CrossRef] [Green Version]
  15. Ge, Y.; Thomasson, J.A.; Sui, R. Remote sensing of soil properties in precision agriculture: A review. Front. Earth Sci. 2011, 5, 229–238. [Google Scholar] [CrossRef]
  16. Zhang, J.; Huang, Y.; Pu, R.; Gonzalez-Moreno, P.; Yuan, L.; Wu, K.; Huang, W. Monitoring plant diseases and pests through remote sensing technology: A review. Comput. Electron. Agric. 2019, 165, 104943. [Google Scholar] [CrossRef]
  17. Sishodia, R.P.; Ray, R.L.; Singh, S.K. Applications of remote sensing in precision agriculture: A review. Remote Sens. 2020, 12, 3136. [Google Scholar] [CrossRef]
  18. Emelyanova, I.V.; McVicar, T.R.; Van Niel, T.G.; Li, L.T.; Van Dijk, A.I.J.M. Assessing the accuracy of blending Landsat MODIS surface reflectances in two landscapes with contrasting spatial and temporal dynamics: A framework for algorithm selection. Remote Sens. Environ. 2013, 133, 193–209. [Google Scholar] [CrossRef]
  19. Zhao, L.; Shi, Y.; Liu, B.; Hovis, C.; Duan, Y.; Shi, Z. Finer Classification of Crops by Fusing UAV Images and Sentinel-2A Data. Remote Sens. 2019, 11, 3012. [Google Scholar] [CrossRef] [Green Version]
  20. Boursianis, A.D.; Papadopoulou, M.S.; Diamantoulakis, P.; Liopa-Tsakalidi, A.; Barouchas, P.; Salahas, G.; Karagiannidis, G.; Wan, S.; Goudos, S.K. Internet of Things (IoT) and Agricultural Unmanned Aerial Vehicles (UAVs) in smart farming: A comprehensive review. IEEE Internet Things 2020, 18, 100187. [Google Scholar] [CrossRef]
  21. Zhang, C.; Kovacs, J.M. The application of small unmanned aerial systems for precision agriculture: A review. Precis. Agric. 2012, 13, 693–712. [Google Scholar] [CrossRef]
  22. Irons, J.R.; Dwyer, J.L.; Barsi, J.A. The next Landsat satellite: The Landsat data continuity mission. Remote Sens. Environ. 2012, 122, 11–12. [Google Scholar] [CrossRef] [Green Version]
  23. Palsson, F.; Sveinsson, J.R.; Benediktsson, J.A.; Aanæs, H. Image fusion for classification of high-resolution images based on mathematical morphology. In Geoscience and Remote Sensing Symposium (IGARSS); IEEE International: Piscataway, NJ, USA, 2010; pp. 492–495. [Google Scholar]
  24. Lucien, W. Some terms of reference in data fusion. IEEE Trans. Geosci. Remote Sens. 1999, 37, 1190–1193. [Google Scholar]
  25. Malamiri, H.R.G.; Aliabad, F.A.; Shojaei, S.; Morad, M.; Band, S.S. A study on the use of UAV images to improve the separation accuracy of agricultural land areas. Comput. Electron. Agric. 2021, 184, 106079. [Google Scholar] [CrossRef]
  26. Shahdoosti, H.R.; Ghassemian, H. Combining the spectral PCA and spatial PCA fusion methods by an optimal filter. Inf. Fusion 2016, 27, 150–160. [Google Scholar] [CrossRef]
  27. Feng, D.; He, S.; Zhou, Z.; Zhang, Y. A Finger Vein Feature Extraction Method Incorporating Principal Component Analysis and Locality Preserving Projections. Sensors 2022, 22, 3691. [Google Scholar] [CrossRef]
  28. Ha, W.; Gowda, P.H.; Howell, T.A. A review of potential image fusion methods for remote sensing-based irrigation management: Part II. Irrig. Sci. 2013, 31, 851–869. [Google Scholar] [CrossRef]
  29. Jensen, J.R. Introductory Digital Image Processing: A Remote Sensing Perspective, 3rd ed.; Pearson Prentice Hall: Upper Saddle River, NJ, USA, 2005; p. 526. [Google Scholar]
  30. Namratha, H.N.; Raghu, M.T. Remote Sensing Satellite Image Fusion Using Fast Curvelet Transforms. Int. J. Sci. Res. 2013, 14, 1537–1542. [Google Scholar]
  31. Dong, L.; Yang, Q.; Wu, H.; Xiao, H.; Xu, M. High quality multi-spectral and panchromatic image fusion technologies based on Curvelet transform. Neurocomputing 2015, 159, 268–274. [Google Scholar] [CrossRef]
  32. Murugan, D.; Garg, A.; Ahmed, T.; Singh, D. Fusion of drone and satellite data for precision agriculture monitoring. In Proceedings of the 2016 11th International Conference on Industrial and Information Systems (ICIIS), Roorkee, India, 3–4 December 2016; pp. 910–914. [Google Scholar]
  33. Aliabad, A.; Zare, F.; Ghafarian Malamiri, H. A comparative assessment of the accuracies of split-window algorithms for retrieving of land surface temperature using Landsat 8 data. Model. Earth Syst. Environ. 2021, 7, 2267–2281. [Google Scholar] [CrossRef]
  34. Aliabad, F.A.; Zare, M.; Malamiri, H.G. Comparison of the accuracy of daytime land surface temperature retrieval methods using Landsat 8 images in arid regions. Infrared Phys. Technol. 2021, 115, 103692. [Google Scholar] [CrossRef]
  35. Sobrino, J.; Li, Z.; Stoll, M.; Becker, F. Multi-channel and multi-angle algorithms for estimating sea and land surface temperature with ATSR data. Int. J. Remote Sens. 1996, 17, 2089–2114. [Google Scholar] [CrossRef]
  36. Chander, G.; Markham, B.L.; Helder, D.L. Summary of current radiometric calibration coefficients for Landsat MSS, TM, ETM+, and EO-1 ALI sensors. Remote Sens. Environ. 2009, 113, 893–903. [Google Scholar] [CrossRef]
  37. Ding, H.; Shi, W. Land-use/land-cover change and its influence on surface temperature: A case study in Beijing City. Int. J. Remote Sens. 2013, 34, 5503–5517. [Google Scholar] [CrossRef]
  38. Vlassova, L.; Perez-Cabello, F.; Nieto, H.; Martín, P.; Riaño, D.; De La Riva, J. Assessment of methods for land surface temperature retrieval from Landsat-5 TM images applicable to multiscale tree-grass ecosystem modeling. Remote Sens. 2014, 6, 4345–4368. [Google Scholar] [CrossRef]
  39. Sobrino, J.; Raissouni, N. Toward remote sensing methods for land cover dynamic monitoring: Application to Morocco. Int. J. Remote Sens. 2000, 21, 353–366. [Google Scholar] [CrossRef]
  40. Dymond, J.R.; Stephens, P.R.; Newsome, P.F.; Wilde, R.H. Percentage vegetation cover of a degrading rangeland from SPOT. Int. J. Remote Sens. 1992, 13, 1999–2007. [Google Scholar] [CrossRef]
  41. Carlson, T.N.; Ripley, D.A. On the relation between NDVI, fractional vegetation cover, and leaf area index. Remote Sens. Environ. 1997, 62, 241–252. [Google Scholar] [CrossRef]
  42. Jiménez-Muñoz, J.C.; Sobrino, J.A.; Jiménez, D.; Mattar, C.; Cristóbal, J. Land Surface Temperature Retrieval Methods from Landsat-8 Thermal Infrared Sensor Data. IEEE Geosci. Remote Sens. Lett. 2014, 11, 1840–1843. [Google Scholar] [CrossRef]
  43. Bastiaanssen, W.G.; Menenti, M.; Feddes, R.A.; Holtslag, A.A.M. A remote sensing surface energy balance algorithm for land (SEBAL). 1. Formulation. J. Hydrol. 1998, 212, 198–212. [Google Scholar] [CrossRef]
  44. Allen, R.G.; Waters, R.; Tasumi, M.; Trezza, R.; Bastiaanssen, W. SEBAL-Surface energy balance algorithms for land, Idaho Implementation. In Advanced Training and User’s Manual; version 1.0; 2002. Available online: https://www.posmet.ufv.br/wp-content/uploads/2016/09/MET-479-Waters-et-al-SEBAL.pdf (accessed on 29 November 2022).
  45. Menenti, M.; Choudhury, B.J. Parameterization of land surface evapotranspiration using a location dependent potential evapotranspiration and surface temperature range. Exchange processes at the land surface for a range of space and time scales. IAHS Publ. 1993, 212, 561–568. [Google Scholar]
  46. Zamansani, E.; khoorani, A.; Sadeghi-e-lari, A.; Sadidi, J. Evaluation of evapotranspiration of wheat using SEBAL algorithm (Case study: Agricultural Research Station of Haji Abad). Phys. Geogr. Res. Q. 2018, 49, 667–681. [Google Scholar]
  47. Tang, L.; Shao, G. Drone remote sensing for forestry research and practices. J. For. Res. 2015, 26, 791–797. [Google Scholar] [CrossRef]
  48. Gazor, H.R.; Minaei, S. Influence of temperature and air velocity on drying time and quality parameters of pistachio (Pistacia vera L.). Dry. Technol. 2005, 23, 2463–2475. [Google Scholar] [CrossRef]
  49. Al-Saif, A.M.; Mosa, W.F.; Saleh, A.A.; Ali, M.M.; Sas-Paszt, L.; Abada, H.S.; Abdel-Sattar, M. Yield and Fruit Quality Response of Pomegranate (Punica granatum) to Foliar Spray of Potassium, Calcium and Kaolin. Horticulturae 2022, 8, 946. [Google Scholar] [CrossRef]
  50. Attia, S.M. Manipulation of splitting, sunburn and enhancing coloration of “Wonderful” pomegranates by preharvest foliar applications. IJRDO-J. Agric. Res. 2017, 3, 1–9. [Google Scholar]
  51. Norozi, M.; ValizadehKaji, B.; Karimi, R.; Nikoogoftar Sedghi, M. Effects of foliar application of potassium and zinc on pistachio (Pistacia vera L.) fruit yield. Int. J. Hortic. Sci. Technol. 2019, 6, 113–123. [Google Scholar]
  52. Khormizi, H.; Malamiri, H. Estimation of Crop Coefficient and Pistachio Plant’s (Pistacia vera L.) KC-NDVI Relationship Using Remote Sensing (Case study: Pistachio orchards of Abarkuh desert margin, Yazd province). Desert Manag. 2020, 8, 101–120. [Google Scholar]
  53. Garibaldi-Márquez, F.; Flores, G.; Mercado-Ravell, D.A.; Ramírez-Pedraza, A.; Valentín-Coronado, L.M. Weed Classification from Natural Corn Field-Multi-Plant Images Based on Shallow and Deep Learning. Sensors 2022, 22, 3021. [Google Scholar] [CrossRef]
  54. Dadashzadeh, M.; Abbaspour-Gilandeh, Y.; Mesri-Gundoshmian, T.; Sabzi, S.; Hernández-Hernández, J.L.; Hernández-Hernández, M.; Arribas, J.I. Weed classification for site-specific weed management using an automated stereo computer-vision machine-learning system in rice fields. Plants 2020, 9, 559. [Google Scholar] [CrossRef]
Figure 1. Location of the study area in (a) Iran and (b) Abarkooh desert and Yazd province, and images from (c) Landsat 8 and (d) unmanned aerial vehicles (UAVs).
Remotesensing 14 06153 g001
Figure 2. (a) Effect of sunburn on pistachio fruit on necrotic black color, and (b) abortion of pistachio kernels due to sunburn.
Remotesensing 14 06153 g002
Figure 3. (a,b) Foliar spraying of pistachio trees, and (c,d) close-up views of the leaves of after spraying.
Remotesensing 14 06153 g003
Figure 4. (a) Position of the plot (A) foliar-sprayed with gypsum as a control and (b) plots foliar-sprayed with gypsum (A, B), NAX-95 (calcium-based suspension coating) (SunGard) (C), and sulfur (D) in the main experiment.
Remotesensing 14 06153 g004
Figure 5. Outline of the research steps showing the images used and the generated images for estimating transpiration and evaporation, based on SEBAL algorithm.
Remotesensing 14 06153 g005
Figure 6. Comparison of the surface temperature of pistachio trees after foliar application of gypsum on the first imaging date (plot (A) only) and of gypsum again, gypsum, NAX-95 (calcium-based suspension coating), and sulfur in plots (AD), respectively, on the second date.
Remotesensing 14 06153 g006
Figure 7. Percentage area of different pistachio tree temperature (LST, °C) classes before and after foliar application of gypsum (plot (A)) and of gypsum again, gypsum, NAX-95 (calcium-based suspension coating), and sulfur in plots (AD), respectively.
Remotesensing 14 06153 g007
Figure 8. Daily evapotranspiration by pistachio trees after foliar application of gypsum on the first imaging date (plot (A) only) and of gypsum again, gypsum, NAX-95 (calcium-based suspension coating), and sulfur in plots (AD), respectively, on the second date.
Remotesensing 14 06153 g008
Figure 9. Percentage area of different pistachio tree evapotranspiration classes (mm/day) before and after foliar application of gypsum (plot (A)) and of gypsum again, gypsum, NAX-95 (calcium-based suspension coating), and sulfur in plots (AD), respectively.
Remotesensing 14 06153 g009
Figure 10. Changes in pistachio tree temperature (LST, °C) and daily evapotranspiration (ET, mm/day) after foliar application of gypsum in plot (A) and of gypsum again, gypsum, NAX-95 (Calcium-Based Suspension Coating), and sulfur in plots (AD), respectively.
Remotesensing 14 06153 g010
Table 1. General specifications of the camera used in the UAV to collect RGB images in the study site.
Sensor TypeSensor DimensionsAperture RangeFocal LengthMaximum Photo ResolutionEffective Sensor AccuracySensor Accuracy Optical ZoomMinimum Normal Focusing Distance
22.3 × 14.9 mm F3.5–6.3
F22-40
15–45 mm4000 × 600024.7 MP24.2 MP3 times25 cm
Table 2. Numerical values of coefficients C0C6 used in the split-window algorithm.
C6C5C4C3C2C1C0
16.400−123.200−2.23854.3000.1831.378−0.268
Table 3. Maximum, minimum, and mean difference in tree temperature (LST) and evapotranspiration (ET) by pistachio trees between the first (1) and second (2) imaging dates after foliar application of gypsum on the first date (plot A only) and of gypsum again, gypsum, NAX-95 (calcium-based suspension coating), and sulfur in plots A, B, C, and D, respectively, on the second date.
LST2 -LST1 (°C)ET2-ET1 (mm/day)
PlotMaxMinMeanMaxMinMean
A0.01−0.72−0.140.640.050.40
B−2.82−3.65−3.330.49−0.370.18
C0.00−2.79−0.680.85−0.860.22
D−0.97−1.62−1.380.620.030.36
Publisher’s Note: MDPI stays neutral with regard to jurisdictional claims in published maps and institutional affiliations.

