Abstract
Buildings bear much of the damage from natural disasters, and determining the extent of this damage is of great importance to post-disaster emergency relief. The application of deep learning to satellite remote sensing imagery has become more and more mature in monitoring natural disasters, but there are problems such as the small pixel scale of targets and overlapping targets that hinder the effectiveness of the model. Based on the SegFormer semantic segmentation model, this study proposes the SegDetector model for difficult detection of small-scale targets and overlapping targets in target detection tasks. By changing the calculation method of the loss function, the detection of overlapping samples is improved and the time-consuming non-maximum-suppression (NMS) algorithm is discarded, and the horizontal and rotational detection of buildings can be easily and conveniently implemented. In order to verify the effectiveness of the SegDetector model, the xBD dataset, which is a dataset for assessing building damage from satellite imagery, was transformed and tested. The experiment results show that the SegDetector model outperforms the state-of-the-art (SOTA) models such as you-only-look-once (YOLOv3, v4, v5) in the xBD dataset with F1: 0.71, Precision: 0.63, and Recall: 0.81. At the same time, the SegDetector model has a small number of parameters and fast detection capability, making it more practical for deployment.
1. Introduction
Natural disasters pose a great threat to the economy as well as to safety, and it is important to assess damage quickly and accurately in an affected area after a disaster to determine the impact on property and lives. As buildings are the main places where people live and are a concentration of population and property, it is especially important to conduct rapid damage detection of buildings closely related to human life and to identify the hardest-hit areas in post-disaster emergency relief [1,2]. Remote sensing technology has now become one of the most popular tools for extracting damaged building information because it is macroscopic, efficient, and convenient [3]. In particular, with the increasingly high spatial resolution of remote sensing images, imagery plays a growing role in disaster monitoring and assessment, including the extraction of damaged buildings [4]. However, the post-disaster extraction of damaged buildings directly from such images by traditional manual visual interpretation combined with field investigation is dangerous, time-consuming, and laborious. It is challenging to meet the high requirements for timeliness in emergency decision-making. Therefore, rapid and accurate detection of damaged buildings is a great challenge.
The main methods for detecting buildings and their damages based on remote sensing images are physical rule-based methods and deep learning methods [5]. Physical rule-based methods generally perform image segmentation based on edges, thresholds, regions, etc. [6], and they are often effective in practical applications, mainly because the features of buildings are affected by different sensors and factors such as weather and lighting. Image semantic segmentation has entered a new period of development with the rapid advancement of deep learning image processing, and the use of remote sensing images has also made great breakthroughs in natural disaster detection. Ding et al. [7], based on the faster region-based convolutional neural network (Faster R-CNN) algorithm, proposed the use of deformable convolution to improve the adaptation to irregularly shaped collapsed buildings and proposed a new method to estimate the object intersection ratio (IPO) to describe the degree of intersection of bounding boxes for better detection accuracy and recall. Bai et al. [8], based on the Faster R-CNN algorithm, combined the dense residual network and region of interest align to solve the problem of building location mismatch. Liu et al. [9], based on CNN, used a Gaussian pyramid technique to build a generative model with multi-level training samples. The technique was robust to different spatial textures and different types of buildings, and the final building detection was achieved by the proposed network of building regions.
Identifying damaged buildings after a disaster consists of two main steps: locating the building and classifying the building damage. If the information about the location of the building is known, then it is straightforward to achieve disaster classification for buildings in known locations [10]. However, information about the building is not usually known when disaster detection is carried out, so achieving accurate positioning of the building is a very important step. Usually, in target detection algorithms, the localization of the target location is implemented first, and then the classification of the target is performed. For the xBD dataset, buildings are mainly classified into five categories: no-damage, minor-damage, major-damage, destroyed, and un-classified, while the detailed damage levels of buildings are difficult to distinguish due to the small percentage of pixel areas. In this study, we propose a target detection model that can achieve efficient localization of buildings and building damage from two perspectives: the localization problem of buildings after a disaster and the damaged-or-not state of buildings after a disaster.
Deep learning-based target detection algorithms are divided into two main categories: one-stage and two-stage. The two-stage algorithms are mainly represented by Faster R-CNN [11], Mask R-CNN [12], and Cascade R-CNN [13], which usually have strong, robust performance and good detection, but the detection speed is slow and it is difficult to achieve the requirement of real-time detection. The main representative models in one-stage are the YOLO series (YOLOv3 [14], YOLOv4 [15], YOLOv6 [16], YOLOv7 [17], YOLOF [18], YOLOX [19], etc.), SSD series (SSD [20], FSSD [21], etc.), and FCOS [22]. They usually have a fast detection speed and can meet real-time detection requirements. Due to the lower cost and higher significance of one-stage algorithms, there is more research related to one-stage algorithms, and some one-stage models (YOLOX, YOLOv6, YOLOv7, etc.) can outperform even two-stage models in detection effectiveness at present. For building damage detection and related rescue measures, finding the location of the disaster requires high speed; the faster the location of the disaster can be determined, the faster the rescue work can be conducted. Therefore, fast and accurate detection of the location of an affected building is of great significance to post-disaster rescue work. Many state-of-the-art (SOTA) target detection algorithms are optimized and validated mainly for MS COCO [23], PASCAL VOC [24], and other datasets, and there are still many shortcomings in improving the detection of dense, small targets in remote sensing images. The main reasons are as follows. (a) SOTA models such as YOLOv4, YOLOv6, YOLOv7, etc. use three downsamplings to 1/32, 1/16, and 1/8 of the original image resolution for predicting large, medium, and small targets, respectively, causing the target location information to be lost with the network downsamplings. (b) In the process of assigning positive and negative samples in the target detection algorithm, targets that are too small are not easily matched with positive samples, which in turn makes it difficult to optimize the detection of small targets. (c) Usually, the pre-defined anchor scale of an anchor-based detection algorithm is not suited to calibrating small targets. There are more reasons why commonly used target detection models end up with poor detection results for small targets, and conventional target detection algorithms usually use NMS [25], Soft-NMS [26], etc. to process the final prediction results of the model and then get the final detection frame of the model, which will affect the computational speed of the final model for practical applications.
In order to solve the shortcomings of the above commonly used target detection algorithms for small target detection in remote sensing image data, this study proposes a SegDetector target detection model based on the idea of semantic segmentation [27,28]. The main contributions are as follows:
- (1)
- This study proposes a full-resolution semantic segmentation-based target detection model, SegDetector, which has better detection performance for small targets. At the same time, SegDetector avoids the use of NMS and thus increases the speed of detection.
- (2)
- To improve the detection of small or overlapping targets, the SegDetector calculates binary cross-entropy loss for different categories of foreground and background to improve the detection performance of overlapping targets.
- (3)
- The SegDetector model can perform rotation detection of targets for more accurate localization without retraining the model and without increasing the model complexity.
2. Data and Methods
2.1. Data Collection
In order to verify the effectiveness and generalization performance of the method proposed in this study, several methods were tested and the results were compared to the xBD dataset [29]. The xBD dataset is from the xView 2 challenge (https://xview2.org/dataset) (accessed on 10 August 2022). It contains 850,736 annotated buildings and covers 45,362 km2 of satellite imagery. For the training model, there were 9168 pre- or post-disaster 1024 × 1024 high-resolution color images that captured 19 natural disasters of six different types from around the world; these include hurricanes, floods, earthquakes, wildfires, tsunamis, and volcanic eruptions [10]. Based on the joint damage scale (JDS) of EMS-98, each building was assigned a class label of no damage, minor damage, major damage, destroyed, or unclassified in the post-disaster images [30]. This dataset contains neither structural building information nor hazard indicators such as flood levels or peak ground acceleration (PGA) [31]. Figure 1 shows an example of pre- and post-event images of a volcanic eruption.
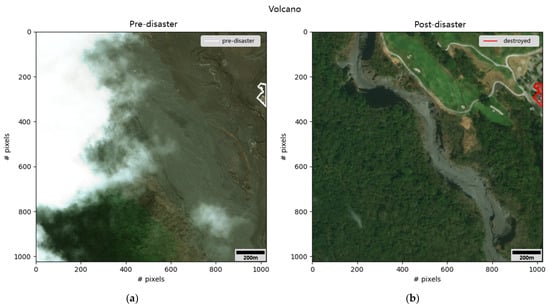
Figure 1.
Example from the xBD dataset showing satellite images before and after a volcanic eruption disaster. (a) shows satellite imagery of buildings before the eruption and (b) shows satellite imagery of buildings destroyed after the eruption.
This study focuses on the difficulty of detecting small, dense buildings in post-disaster remote sensing images to propose a detection model for accurate localization and classification; therefore, the datasets from two time periods were combined to obtain the training set, validation set, and test set data used for segmentation, localization, and classification in the later stage.
2.2. SegFormer Model
The SegFormer semantic segmentation model consists of two main parts: (1) a transformer-based hierarchical encoder [32,33], and (2) a decoder based on the MLP composition. SegFormer uses the encoder to extract features from the input image and fuses high-level semantic information and low-level feature information on the multi-stage output of the encoder, and uses the encoder to achieve pixel-by-pixel classification [34]. Its structure is simple and clear, and has low computational complexity.
2.2.1. Data Processing
In the data enhancement, (1) a ratio of 0.5–2.0 was used to randomly adjust the images, and (2) the images were randomly flipped, including horizontal flipping and vertical flipping, because the dataset used in this study is different from Cityscapes and ADE20K, etc. [35], which mainly contain images from real-life scenes. The xBD dataset consists of remotely sensed images, and the vertically flipped images also conform to regular image patterns. (3) The images were cropped and normalized to a pixel resolution of 640 × 640. Vision transformer (ViT) was used to slice the image into 16 × 16 patches after data enhancement [32], and SegFormer was used to slice the image into 4 × 4 patches, and then encoder was used for image feature extraction.
2.2.2. Encoder
The hierarchical transformer structure is mainly used in the encoder of the SegFormer network, which uses a new, more efficient self-attention layer compared to the original self-attention layer. The self-attention layer uses Q, K, and V as inputs, and their input dimensions are all N × C, where N = H × W, C is the number of channels, and H and W are the length and width of the input feature maps. The original self-attention can be simplified to Equation (1), where , and take the value of C for preventing the inner product of and from being too large.
Softmax is used to normalize according to the second dimension, which is used to perceive the existence of a link between two pixels, introducing global perceptual attention to the overall model, and thus capturing more global attention compared to a fully CNN-based model. To simplify the large amount of computation undertaken by self-attention in the model, SegFormer uses a modified self-attention layer by introducing the spatial reduction calculation [36] to compress the dimensions of and to reduce the computation introduced by self-attention, as shown in Equation (3), where is a dimensional conversion of dimension to , , represents normalization, and represents the number of categories.
The introduction of the scaling factor r reduces the overall time complexity of self-attention from to , and also reduces the overall SegFormer model by a significant amount of computational cost. In particular, the computational speed advantage of the improved self-attention is more obvious when the input scale of the model is large, as shown in Figure 2.
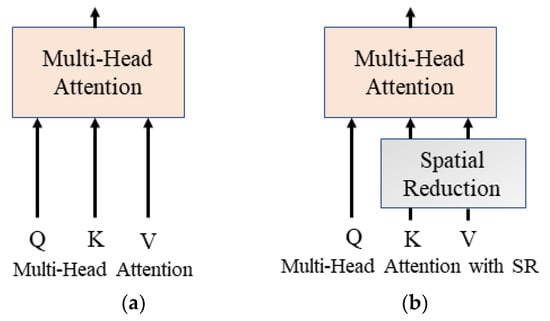
Figure 2.
Structure of attention. ((a) is the multi-head attention of vanilla transformer and (b) is the multi-head attention with spatial reduction of transformer).
2.2.3. Decoder
The SegFormer model was used in the design of the decoder process to avoid introducing a large amount of computation and complex structure. A linear layer was used to consistently adjust the dimensionality of the output at multiple encoder stages, and the input dimension was upsampled to 1/4 through the channel for stitching, so as to ensure that the output of the decoder contains both rich high-level semantic information and low-level feature information. The feature maps of the stitched channels were calculated using a linear layer and the final output was obtained.
2.2.4. Loss
SegFormer does not introduce auxiliary losses or category balancing losses such as focal loss, but uses a simple cross entropy to achieve the final pixel-by-pixel classification task with the following formula, where represents the number of categories, represents the true label, and represents the prediction result after using Softmax.
2.3. SegFormer-Based Detection Model SegDetector
The SegFormer model can achieve a finer classification pixel by pixel compared to commonly used target detection algorithms, so it is largely more capable of perceiving small targets in the input image. In order to use the SegFormer model for target detection, this study made the following improvements.
2.3.1. Enhance Detection of Overlapping Targets
The major objective of this study was to use semantic segmentation to accomplish the target detection task in order to solve the problems of small target scale and difficult detection. It can be observed from Figure 3 that when two different categories of targets overlap, the category judgment of the overlap area will affect the final target frame delineation. Thus, an image having two different classes of targets in it introduces some ambiguity in the overlapping regions in the final predicted results.
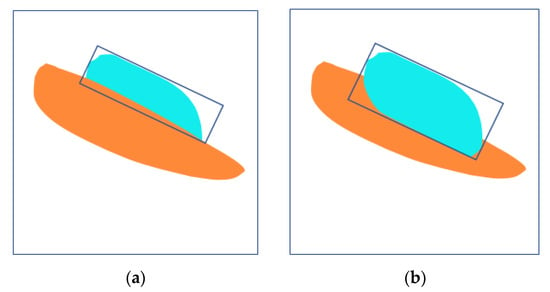
Figure 3.
Change of detection frame in the case of target occlusion and non-occlusion. (a) indicates the blue object is occluded and (b) indicates the blue object is not occluded.
To further achieve efficient detection, a binary cross-entropy loss function is used in the SegDetector model. For overlapping targets, binary cross-entropy loss is run for each category to be detected and for the background. After obtaining the final output of the decoded model, the prediction frame generation for different categories can be performed according to each of its channels. In contrast, the use of a CE loss function does not allow better detection of different classes of targets.
By delineating the target positions of two adjacent targets of different categories in different channels, as illustrated in Figure 4, to some extent, the ambiguity arising from the prediction of overlapping regions is reduced, resulting in better pixel classification.
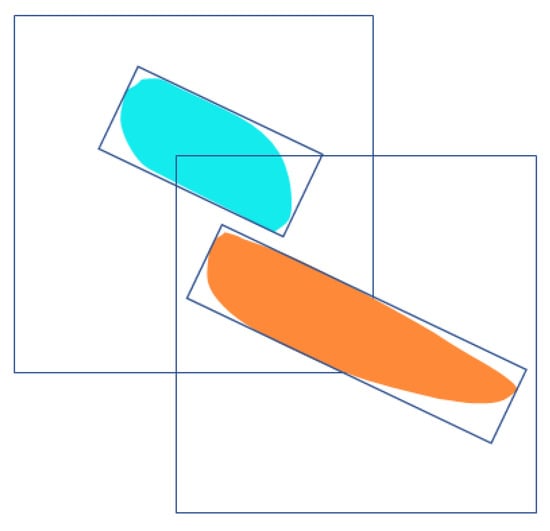
Figure 4.
SegDetector calculates the BCE loss in separate channels and generates the final detection frame in separate channels to reduce the difficulty of detecting obscured targets.
As shown in Figure 5, there is a place where the major-damage and no-damage buildings are close to each other, and the SegFormer model has difficulty correctly predicting the pixel categories at the adjacent locations, which can easily cause misclassification of both major-damage and no-damage categories. The use of the improved BCE loss allows binary prediction in different channels for major-damage and no-damage, respectively, and the background. That is, different classes of pixels at the same position can be judged at different channels, and finally the final target frame is circled according to the binarized image of each channel. Even if there is a slight overlap between the two targets, they can be successfully identified separately.
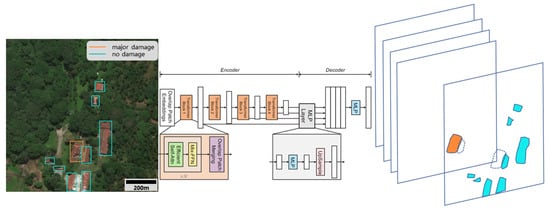
Figure 5.
Overall model structure of SegDetector, which is based on SegFormer, to implement sub-channel target detection.
2.3.2. Implementation of Target Detection Function
To implement target detection based on the semantic segmentation model, the output of the model obtained after Sigmoid calculation was binarized according to each channel. The threshold value µ was set to 1 when the number in each matrix of each channel data was greater than µ, and 0 when the opposite was true. The obtained binarized image with 1 indicates the target pixel, which corresponds to different categories according to different channels. Overall, SegDetector binarizes the equal resolution output obtained from the network prediction to obtain the horizontal detection frame, as shown in Figure 5, which is mainly divided into three steps: (1) calculate the output of the semantic segmentation, where different category targets are detected by different channels due to the BCE loss calculated separately for each category (channel) and background, (2) apply a binarization operation with a threshold of 0.5 for each channel, and (3) use the OpenCV tool to calculate the position of the horizontal detection frame from the binarization results.
In order to implement SegDetector for the target location using rectangular frame delineation, a different conventional target detection algorithm using non-maximum suppression (NMS), Soft NMS, etc. was chosen to eliminate the low-confidence and overlapping target frames. In this study, for each channel output after binarization, we used OpenCV to calculate the positions of the top-left and bottom-left corners of the target region. Because the numbers in each channel of the binarization output were expressed as foreground probabilities, calculating the top-left and bottom-right positions of target boxes based on the channels helped detect different classes of overlapping targets. In this process, a priori knowledge can be introduced. For example, we observed that there were no targets with less than a 20-pixel area in the dataset used in this study, so we considered the targets with pixel area less than 20 as FP rejects after calculating them in order to improve precision.
As shown in Figure 6, the target frame can be delineated by calculating the top-left and bottom-right positions of the target area, and the target detection function is completed based on the semantic segmentation model. Conventional target detection models, such as SOTA models YOLOv3, YOLOv4, and YOLOX, extract features from the input image and downsample them to , , and resolutions, and use three detection heads to detect small, medium, and large targets, respectively. The semantic segmentation models are different from SOTA models such as SegFormer and FCN, whose output is the resolution of the input image. Therefore, compared with conventional target detection algorithms, target detection based on semantic segmentation models has the inherent ability to recognize small targets. In this study, we calculated the BCE loss separately for each detection category and background, and delineated different category target locations based on each channel, which also improved the model’s recognition of dense, overlapping targets to some extent.
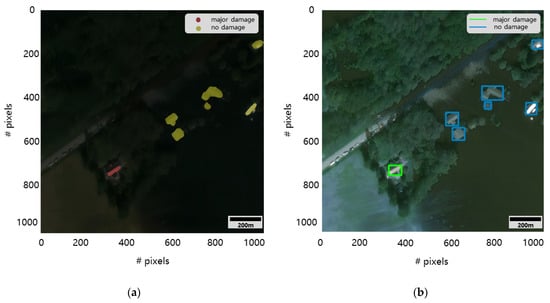
Figure 6.
SegDetector’s horizontal detection implementation. (a) is the pixel-by-pixel result calculated by SegDetector and (b) is the horizontal detection result calculated by SegDetector.
Rotating target detection is now a popular research direction in target detection. It can delineate a more accurate target range compared to horizontal target detection, and is usually implemented by adding the prediction of rotation angle to the conventional target prediction of x, y, w, h. This, however, further deepens the difficulty of model implementation. The SegDetector model proposed in this study can be modified by the way the target frame is delineated, and the rotating target detection function can be implemented quickly and easily. After obtaining the semantic segmentation output, the image is binarized and the smallest outer rectangle is found based on each channel, as shown in Figure 7. Compared to horizontal target detection, it can be observed by comparing the two images in Figure 6 and Figure 7 that rotating target detection can be more accurate in delineating the target position. The complexity of the rotating target detection implementation is comparable to that of the horizontal target detection implementation.
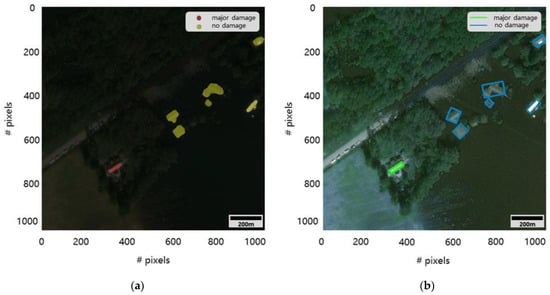
Figure 7.
Rotation detection implementation of SegDetector. (a) shows the pixel-by-pixel result calculated by SegDetector and (b) shows the rotating detection result calculated by SegDetector.
3. Experiments and Results Analysis
3.1. Experimental Parameters
This implementation uses the Ubuntu 18.04 operating system, Python language, and the PyTorch1.71 (Facebook AI Research, New York, NY, USA) deep-learning framework, CUDA version 11.1. The CPU is a 12th Gen Intel(R) Core(TM) i7-12700KF, and the GPU is an NVIDIA GeForce RTX 3090. All training epochs are 100 and divided into two phases. In the first phase, the batch size is 16, the initial learning rate is 0.001, and the learning rate is updated every epoch using a decay rate of 0.92; in the second phase, the batch size is 8, the initial learning rate is 0.0001, and the learning rate is updated every epoch using the same decay rate of 0.92. The detailed hyperparameters are shown in Table 1.

Table 1.
Main hyperparameters used for SegDetector training and testing.
3.2. Experimental Evaluation Indexes
In order to evaluate the effectiveness of building damage detection from a comprehensive perspective, mean pixel accuracy (MPA), mean intersection over union (MIoU), F1, Precision, and Recall were selected as the main evaluation indexes in this study. P is a combination of Precision and Recall to evaluate the effectiveness of the model, and MIoU calculates the accuracy for each pixel point of the output result, category by category.
Accuracy is the proportion of a category being correctly predicted to the number of predicted outcomes in that category, Equation (8). Recall rate is the proportion of a category being correctly predicted to the true number of that category, Equation (9). F1 is the combined evaluation of Precision and Recall, where TP refers to a positive case of correct prediction, FP refers to a positive case of incorrect prediction, and FN refers to a negative case of incorrect prediction.
PA can be used to evaluate the proportion of correctly predicted pixels to the total pixels, Equation (11), is the number of targets of category predicted to be targets of category , and is the number of categories.
MPA is used to measure the proportion of pixels in each category that are correctly predicted on average, Equation (12).
MIOU is a classical measure of semantic segmentation, which is calculated as in Equation (13), where represents the number of categories and can be interpreted as the number of targets of category predicted to be targets of category , Equation (13).
3.3. Evaluation of Experimental Effects
The xBD dataset is mainly applied to building damage detection, and the damaged buildings were located in the imagery by comparing remote sensing images of two different time periods. This study proposes a model for locating and classifying the damaged buildings based on xBD, and proposes a model for locating small targets and overlapping targets in remote sensing images.
The loss part was modified based on SegFormer, modifying the original CE loss to BCE loss. To demonstrate the effectiveness of the modified SegFormer, Table 2 compares and analyzes SegFormer and the modified SegFormer from all categories using five evaluation indexes: MIOU, MPA, Precision, Recall, and F1. Compared with the original SegFormer model, the results of Improved-SegFormer had a small improvement, and the computational speed and model complexity were comparable in the actual testing process. Therefore, the segmentation effect has not been significantly improved, but the main role is reflected in the prediction of the final detection frame of SegDetector.

Table 2.
Relevant evaluation indexes of SegFormer and Improved-SegFormer.
Differentiation between minor damage, major damage, and damage was poor, so minor damage, major damage, destroyed, and unclassified were combined into a single damage class in order to differentiate the damage to buildings after the disaster and to facilitate specific relief work in the future. the relevant evaluation indicators under the three categories of no building, no damage, and damage were calculated, as shown in Table 3.

Table 3.
Relevant evaluation indexes of SegFormer and Improved-SegFormer on building damage.
Referring to the experiment results of Bai et al. [10] and comparing them, the six categories of no building, no damage, minor damage, major damage, destroyed, and unclassified in the dataset were combined to obtain two categories of no building and building. No building indicates a background target and building indicates a foreground target, including no damage, minor damage, major damage, destroyed, and unclassified. The obtained evaluation indexes are shown in Table 4.

Table 4.
The data categories were combined to obtain the relevant evaluation indexes for both No Building and Building categories.
The way that SegDetector generates prediction results is different from the commonly used models such as YOLOv3, YOLOv4, and YOLOX in which the position and size of the target are predicted first before using NMS to screen out redundant frames, so in this study, three indexes, Precision, Recall, and F1, were selected in order to facilitate an objective comparison of the detection effectiveness of SegDetector and YOLOv3, YOLOv4, and YOLOX in a unified manner. It should be noted that Table 2, Table 3 and Table 4 show the Precision, Recall, and F1 of SegFormer for pixel classification, while Table 5 shows the predicted Precision, Recall, and F1 of SegDetector built on SegFormer for the target frame.

Table 5.
Evaluation indexes of models such as SegDetector and YOLOX.
It can be clearly observed that the degree of confidence is 0.5, the proposed SegDetector model outperforms the YOLOv3, YOLOv4, and YOLOX models in all three indexes of Precision, Recall, and F1, and its model has the smallest number of parameters, which is largely more conducive to practical application deployment. Although SegDetector is slightly slower than the YOLOX model, its detection speed is still better than YOLOv3 and YOLOv4, and SegDetector’s detection speed also meets the requirement of real-time detection.
The YOLOX model with the best results among the comparison models and Faster R-CNN were selected for visual comparison with the horizontal and rotational detection generated by SegDetector, as shown in Figure 8. Theoretically benefiting from its high-resolution output results, SegDetector is better at detecting small, overlapping targets compared to the prediction results of models such as YOLOX. It can also be clearly observed that compared to the YOLOX model, SegDetector’s horizontal detection is better for small, visually insignificant targets in the edge region. In practical applications, remote sensing images of the monitored area can be captured by satellite and computer, and real-time detection of damaged buildings can be carried out for follow-up tasks, such as disaster rescue [37,38]. Moreover, SegDetector can easily generate rotation detection frames with higher accuracy.
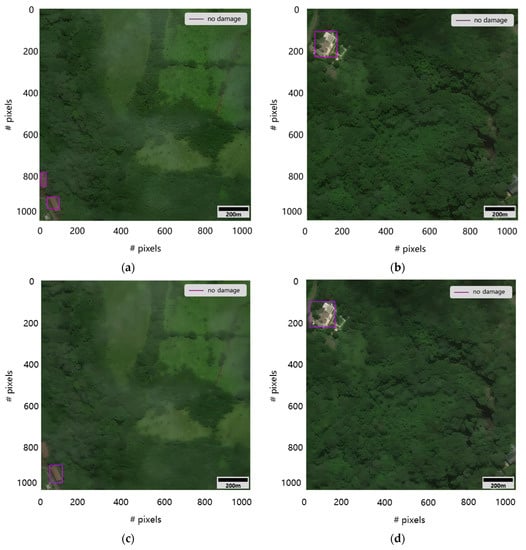
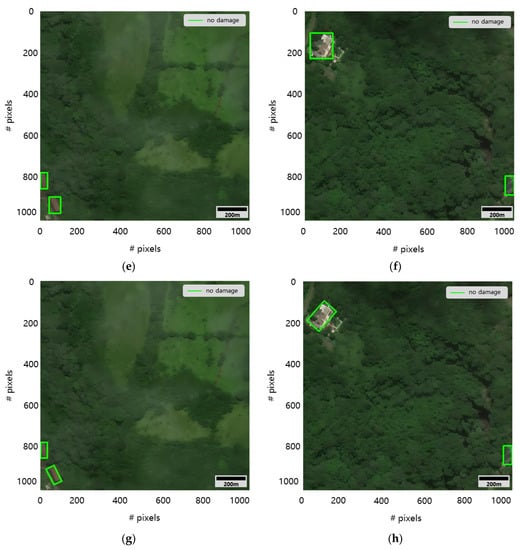
Figure 8.
Randomly calculated test dataset of two images for YOLOX detection results and SegDetector horizontal and rotational detection results. (a,b) are Faster R-CNN detection results, (c,d) are YOLOX detection results, (e,f) are SegDetector-HBB detection results, and (g,h) are SegDetector-OBB detection results.
4. Discussion
Based on semantic segmentation, an important advantage of the target detection function over conventional target detection algorithms is that the location of small targets can be effectively identified [39]. As can be observed in Figure 9, after the original resolution image has been downsampled by 8× or 16×, it is already difficult for the human visual system to observe small targets in the image. Similar problems exist in computer vision [40], but the SegDetector model proposed in this study maintains a consistent resolution between input and output, which facilitates the detection of small targets to a large extent compared to YOLO, SSD, RetinaNet [41], CenterNet [42], etc. In particular, the detection of adjacent small targets of the same category can be easily caused by the use of the NMS algorithm in algorithms such as YOLO, which can lead to missed detection. Similarly, for overlapping target detection, SegDetector can largely solve the impact caused by target overlap by maintaining the same resolution as the input. Therefore, this study proposes the use of a semantic segmentation model to implement the target detection function to a certain extent to solve the problem of difficult detection of small, overlapping targets. At the same time there exist detection models based on semantic segmentation models that still have difficulty achieving the prediction of the obscured part of the target, mainly limited by the fact that the label of the image contains only one category at each pixel point. In this case, however, sub-channeling uses BCE loss and generates the final prediction to solve the misclassification of adjacent pixels from the perspective of a priori knowledge.
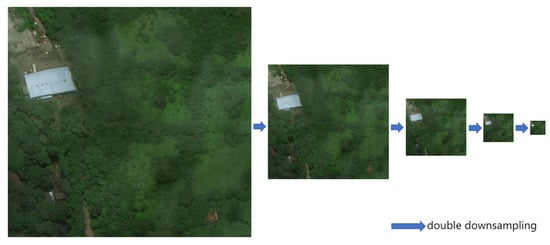
Figure 9.
Downsampling the original resolution images in the xBD dataset.
Commonly used target detection algorithms such as YOLOX are based on the feature map obtained from the final prediction, according to the location of the grid for post-processing to achieve target detection. From the process of downsampling in Figure 9, it can be roughly observed that small targets will be detected as the area corresponding to the network calculation becomes smaller and smaller, resulting in the loss of location information, which in turn leads to poor detection of small targets. In SegDetector, the original image resolution is encoded and decoded, and the result obtained from the network calculation is of equal resolution to the original image, so the original position information of the target is retained to a large extent, and thus better results can be obtained in small target detection. From the test set dataset, one image was selected for prediction using YOLOX and SegDetector, as shown in Figure 10, and it can be clearly observed that SegDetector has better detection for small targets. Since the xBD dataset still contains a large number of small targets, the overall recall of SegDetector is higher compared to commonly used SOTA target detection algorithms such as YOLOX.
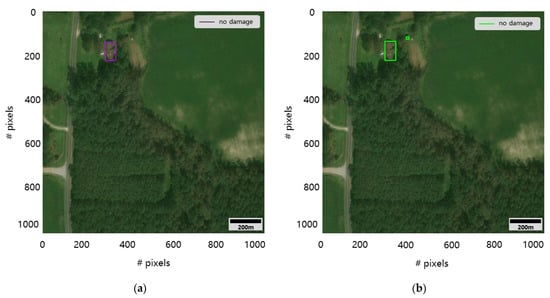
Figure 10.
YOLOX and SegDetector detection results (a) is the YOLOX detection result and (b) is the SegDetector detection result.
Convolutional neural networks are usually understood to have better local information extraction. In comparison, TransFormer-based networks are usually understood to have better global information extraction, and convolutional structures are usually computed for a feature map. In the process, an effective sensory field will be gathered to a certain extent in the middle of the feature map, and convolutional structures will use padding calculation for the edges of the convolutional kernel, resulting in poor results for edge detection. SegDetector mainly uses the structure based on TransFormer, so it can better handle the image edge information, and realize the equal resolution output also to a certain extent to improve the processing ability of the model edge information. From the test dataset, an image was selected for prediction using YOLOX and SegDetector, as shown in Figure 11. It can be observed that the SegDetector detection algorithm, which uses pixel-by-pixel classification to determine the target location, is not only better for detecting small targets in the image, but also for detecting buildings at the edges of the image.
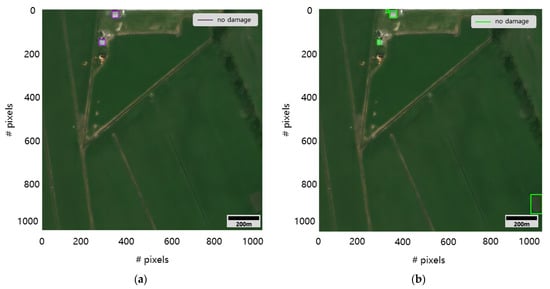
Figure 11.
YOLOX and SegDetector detection results (a) is the YOLOX detection result and (b) is the SegDetector detection result.
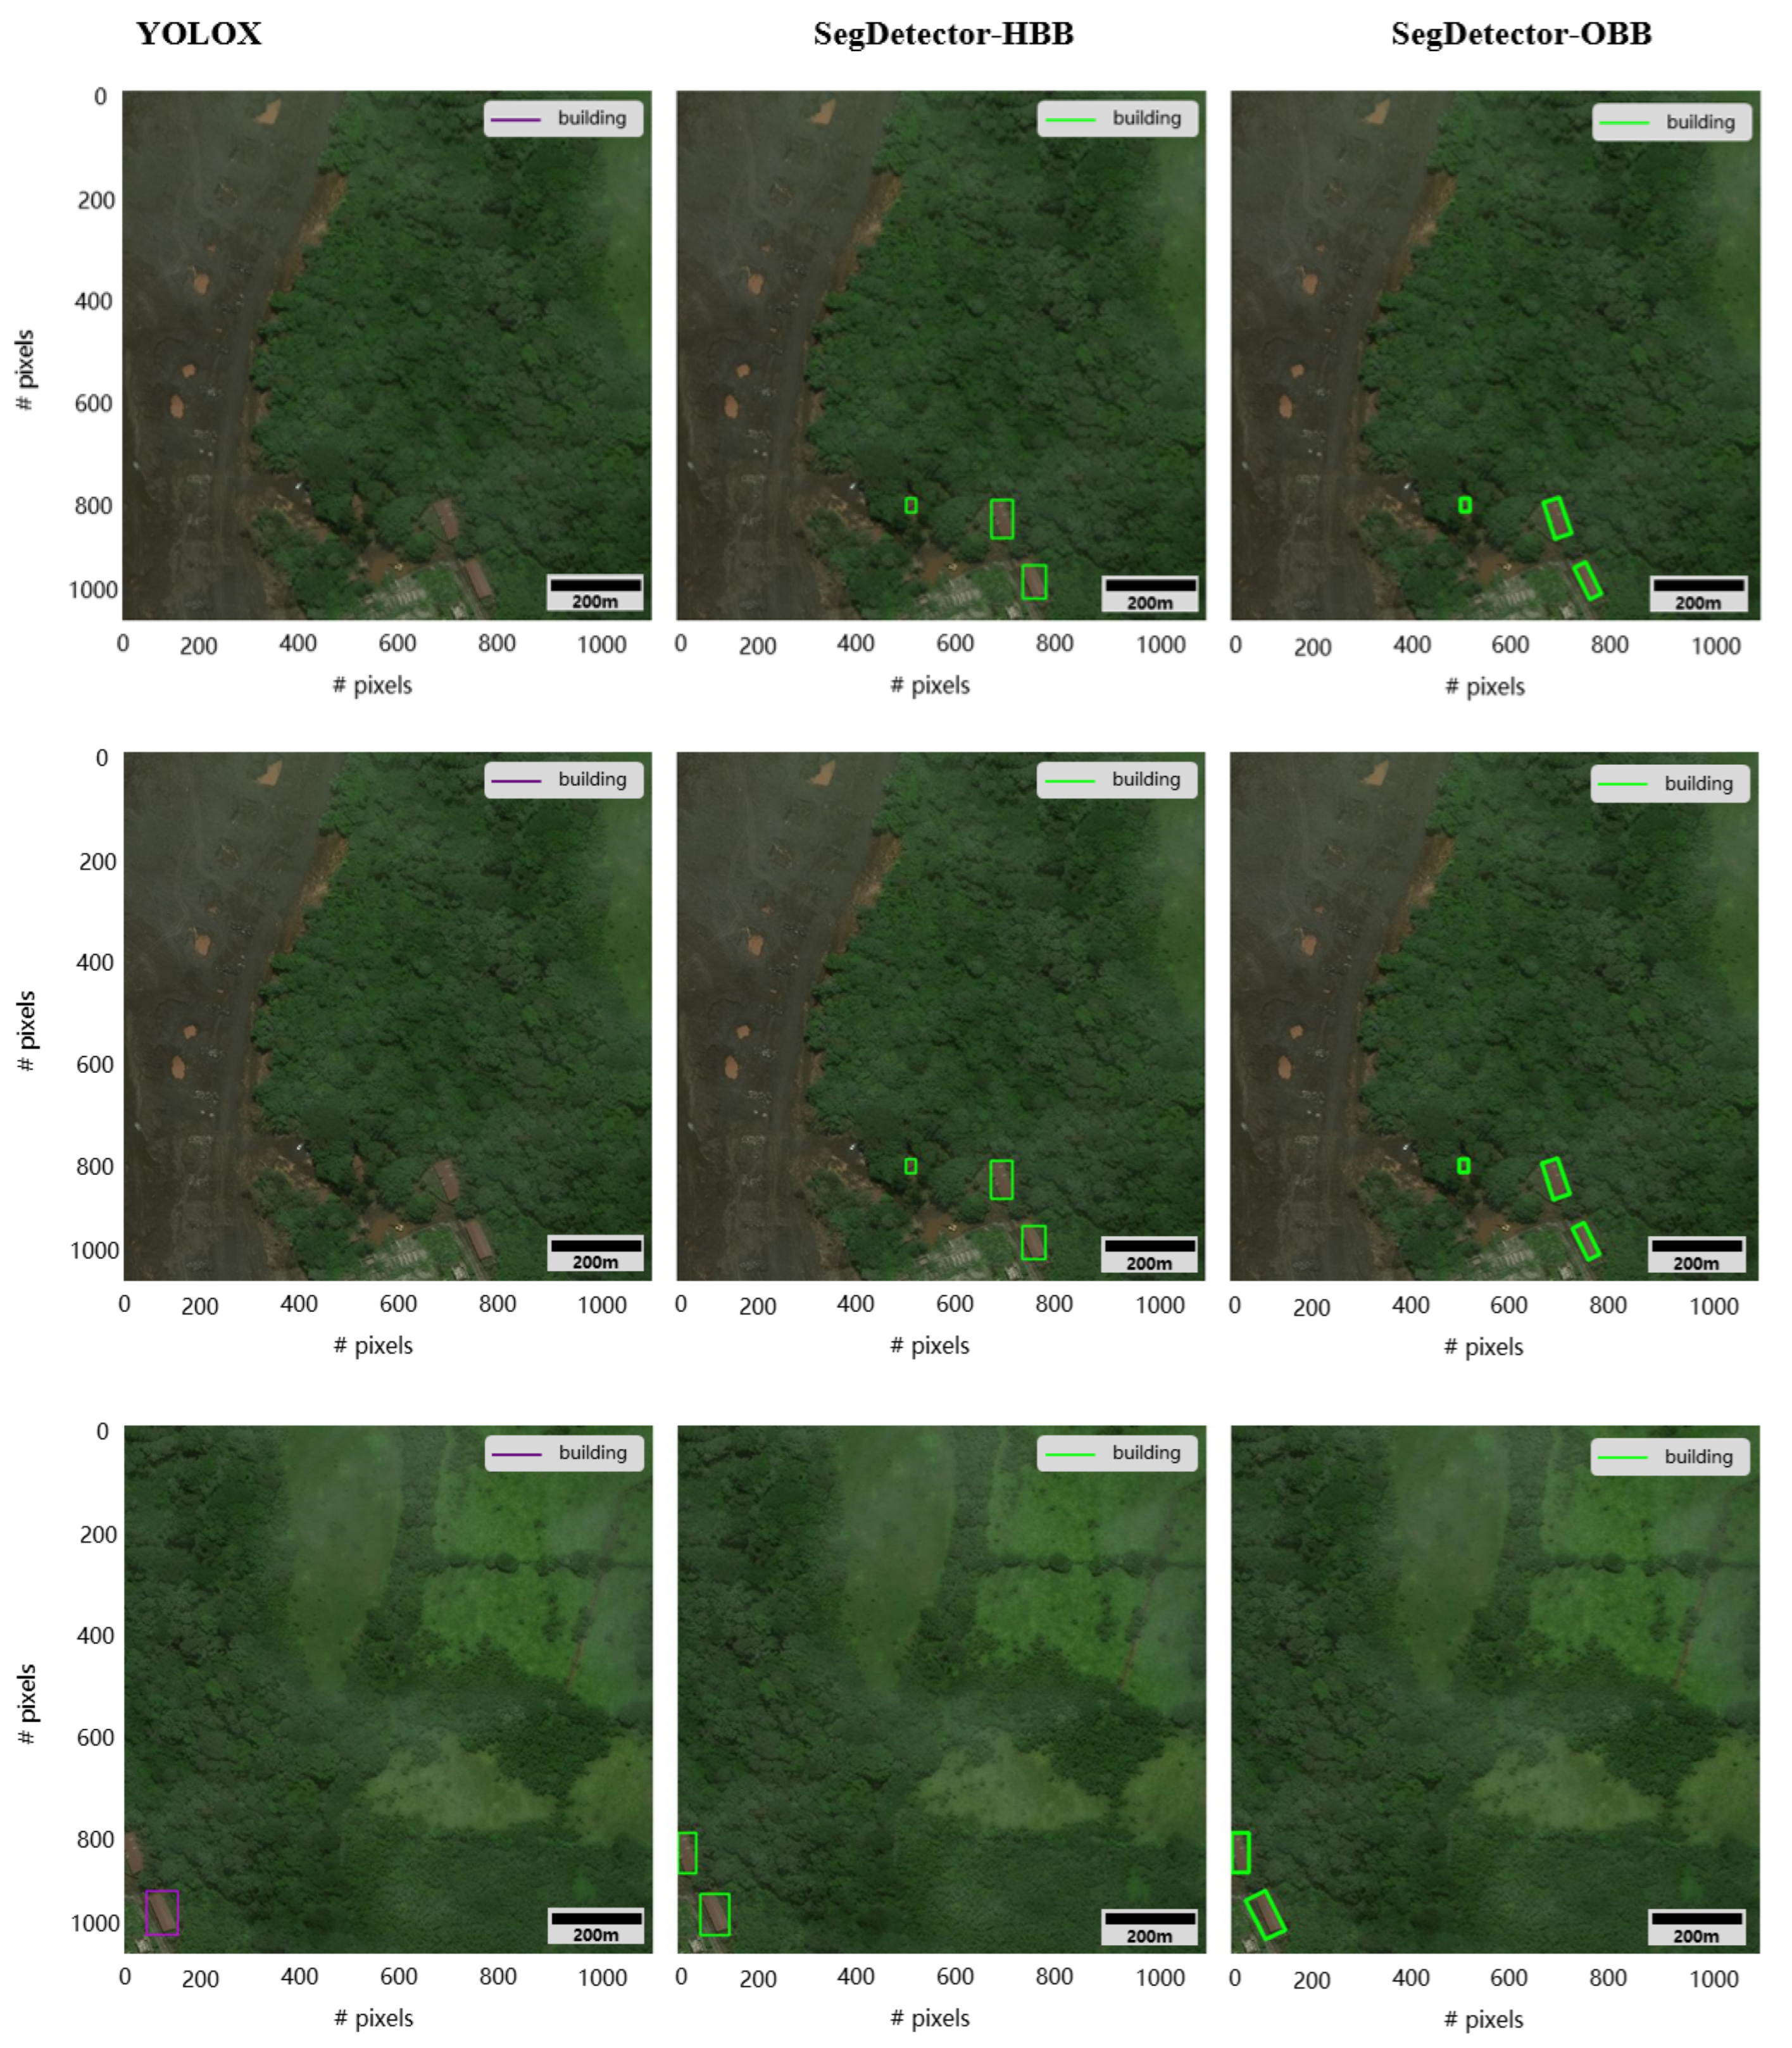
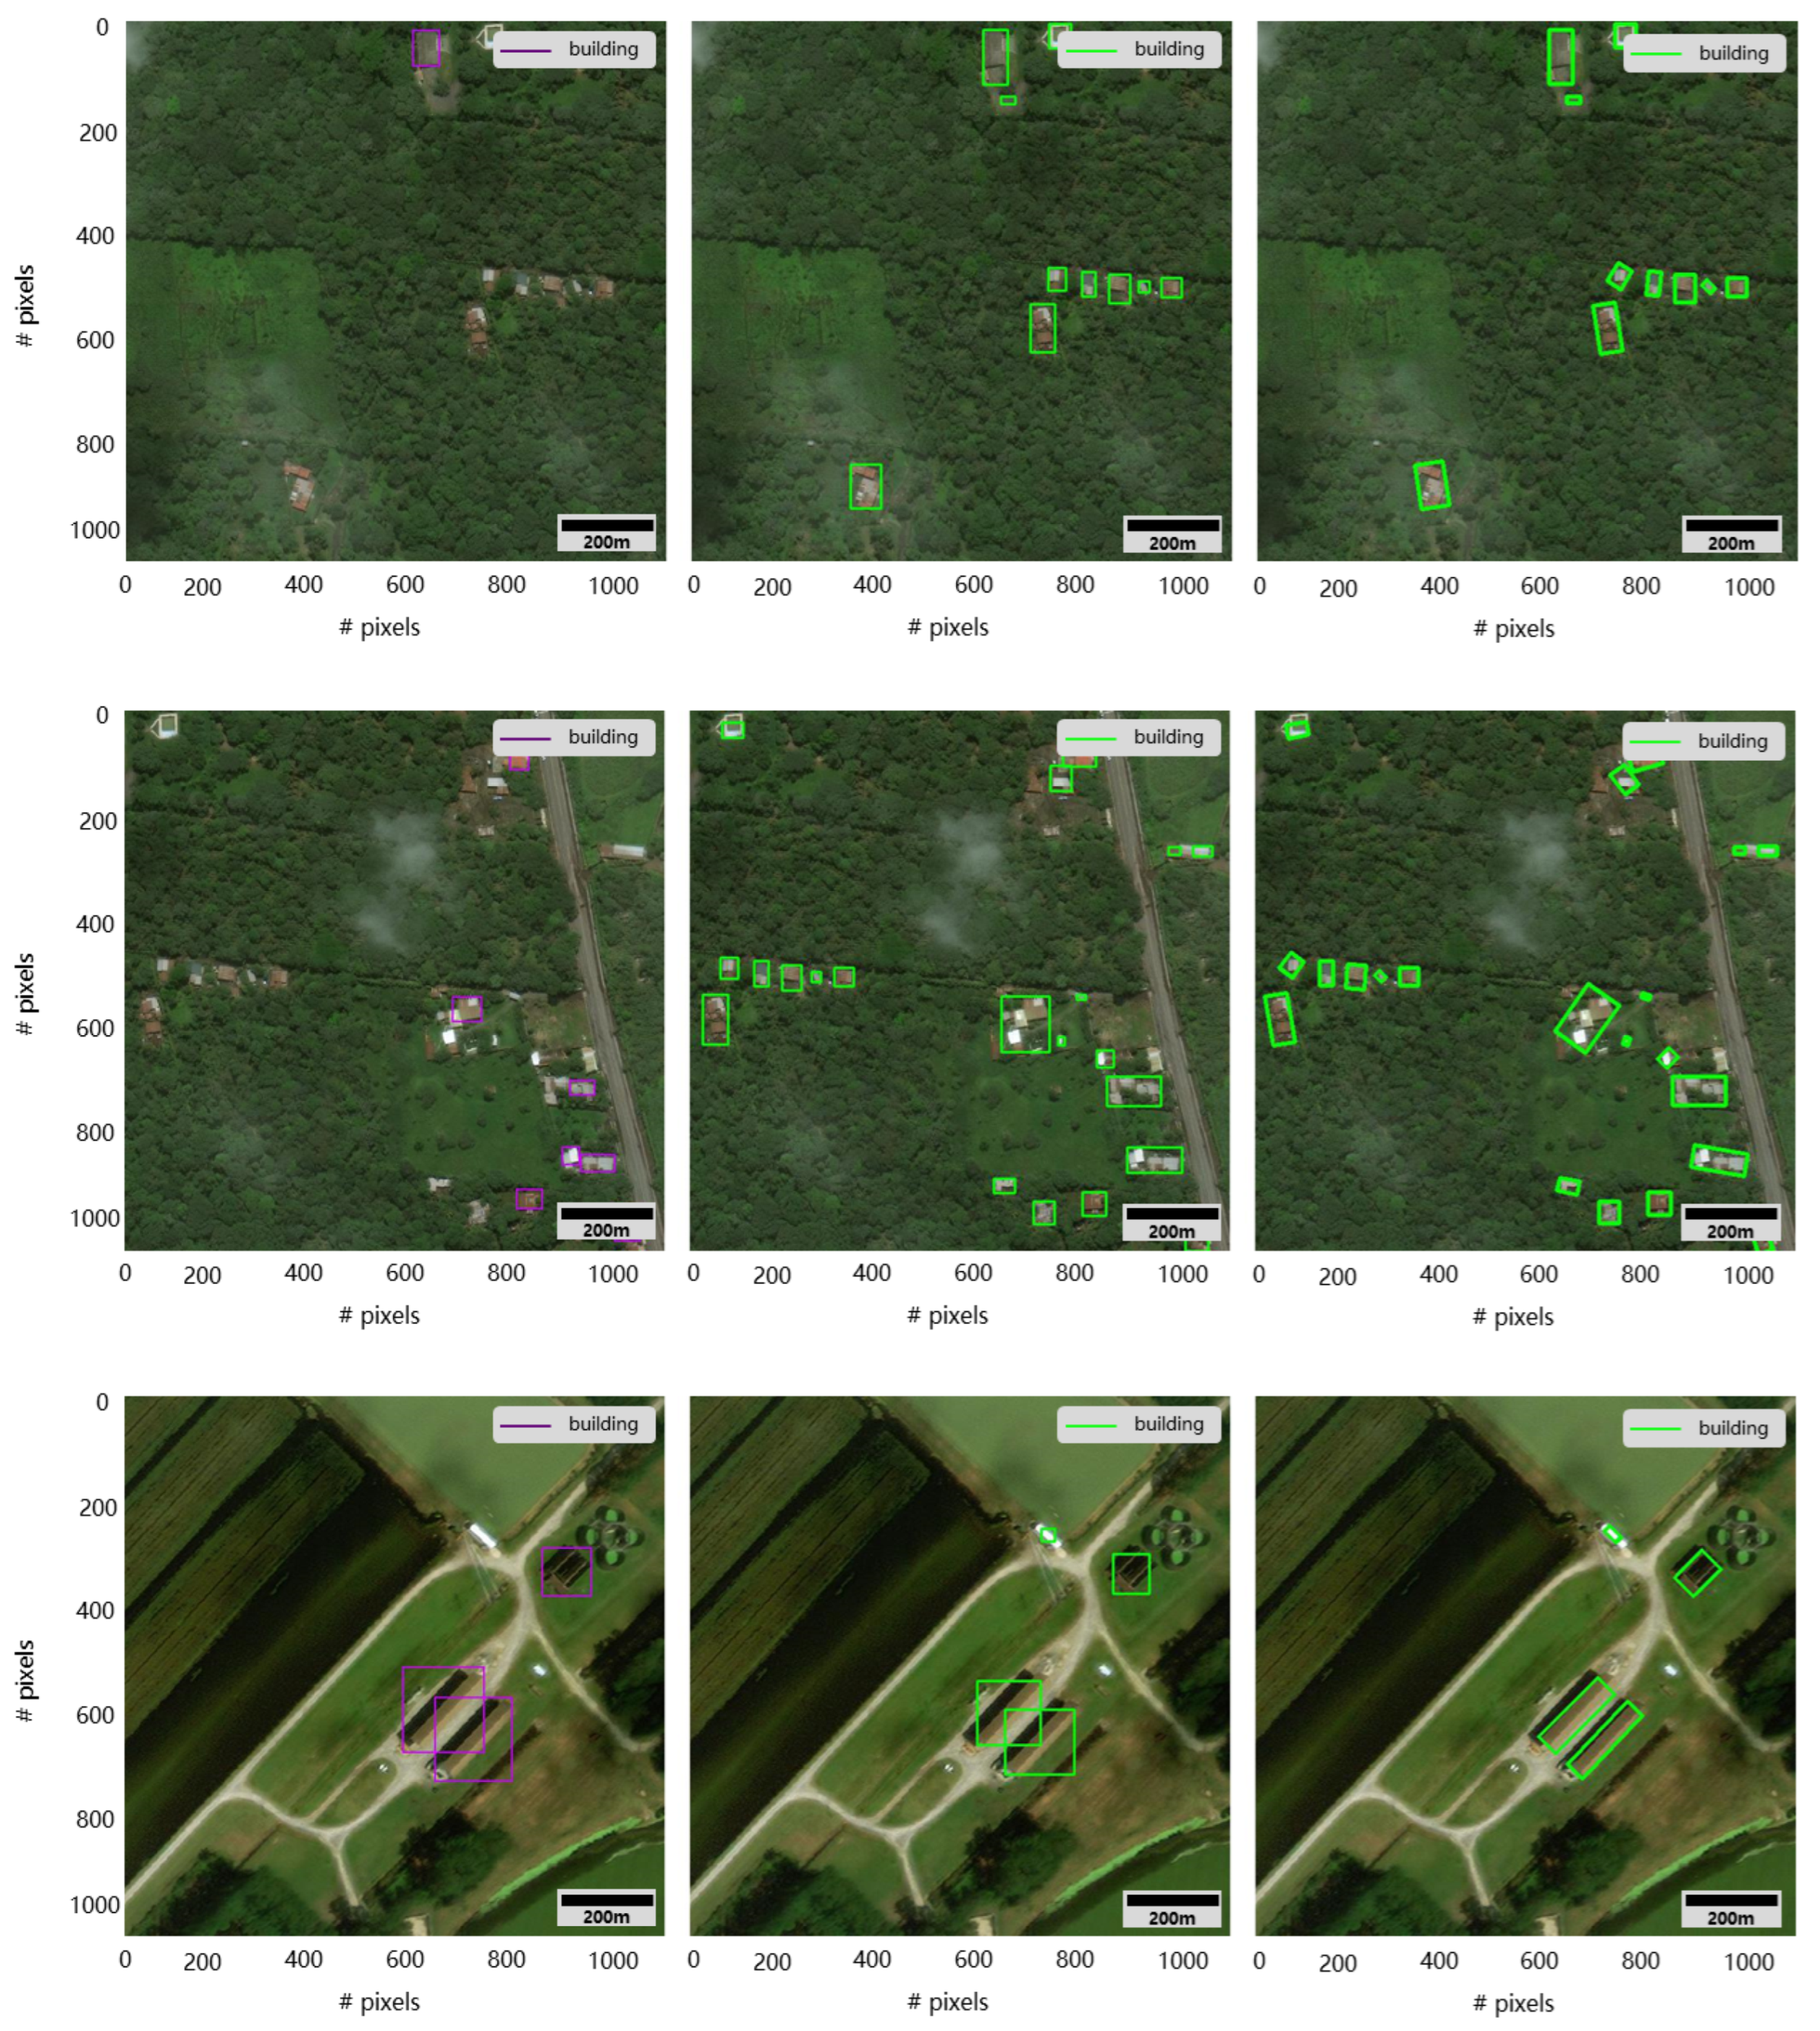
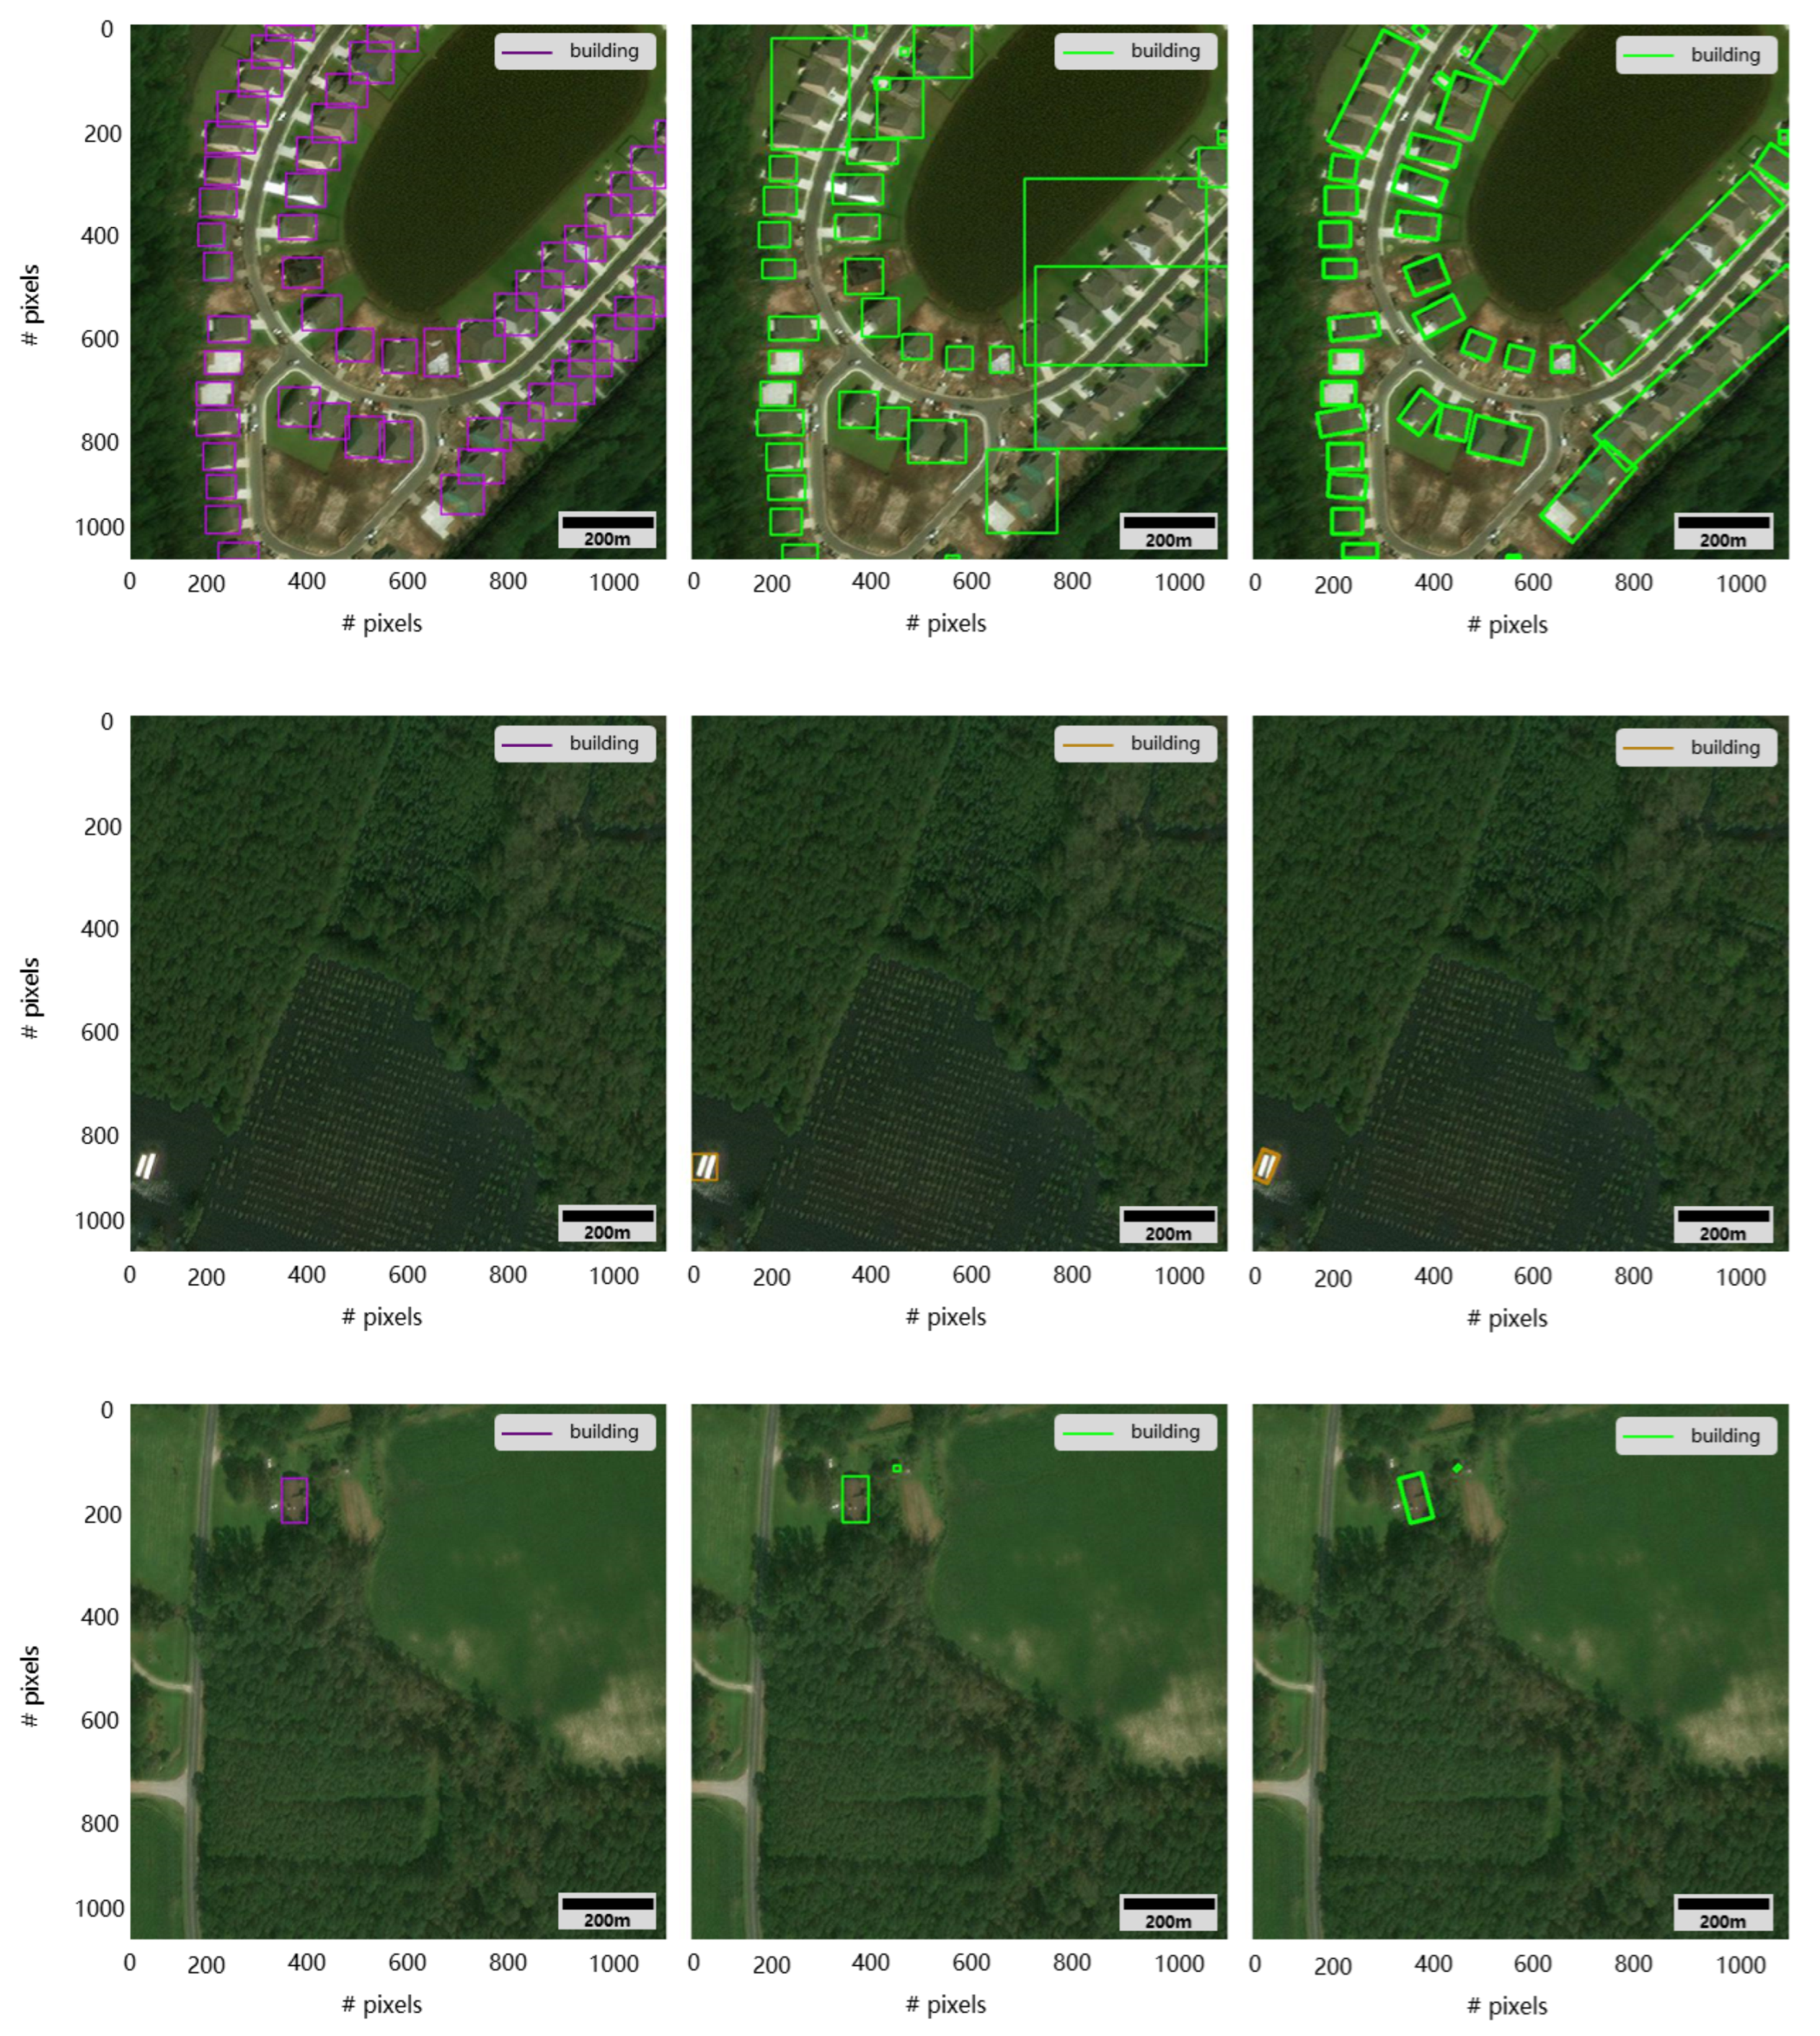
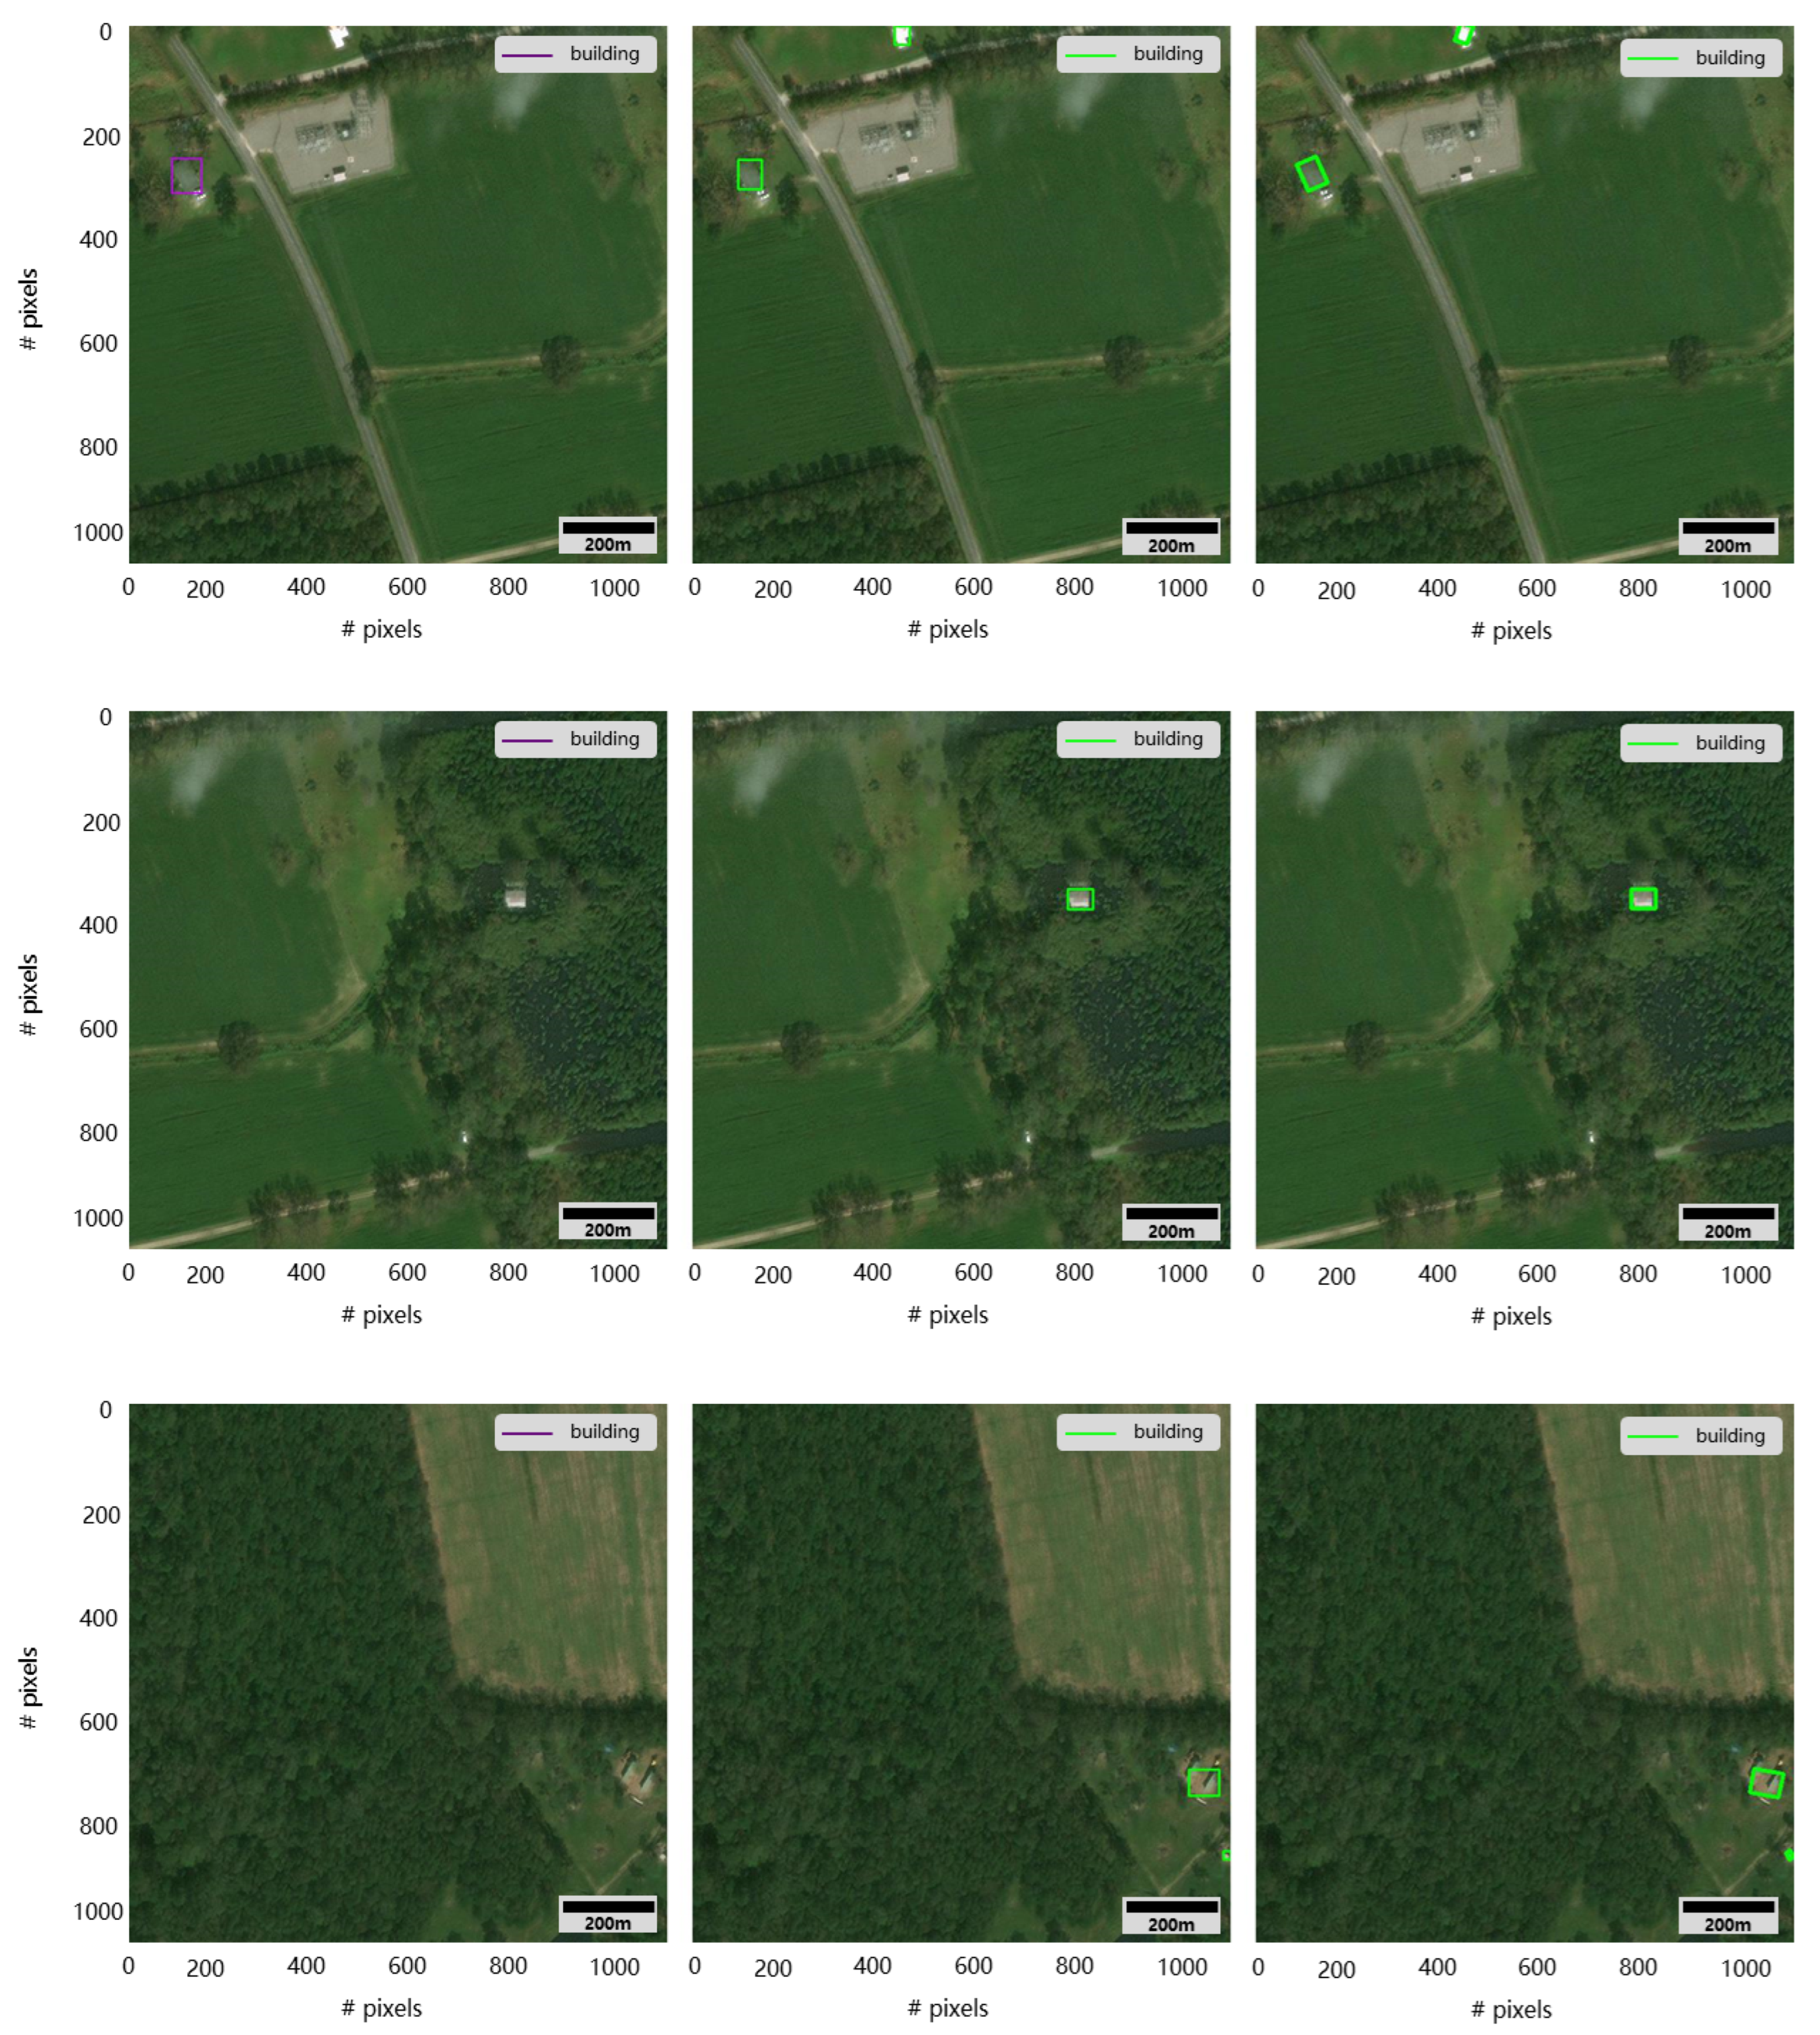
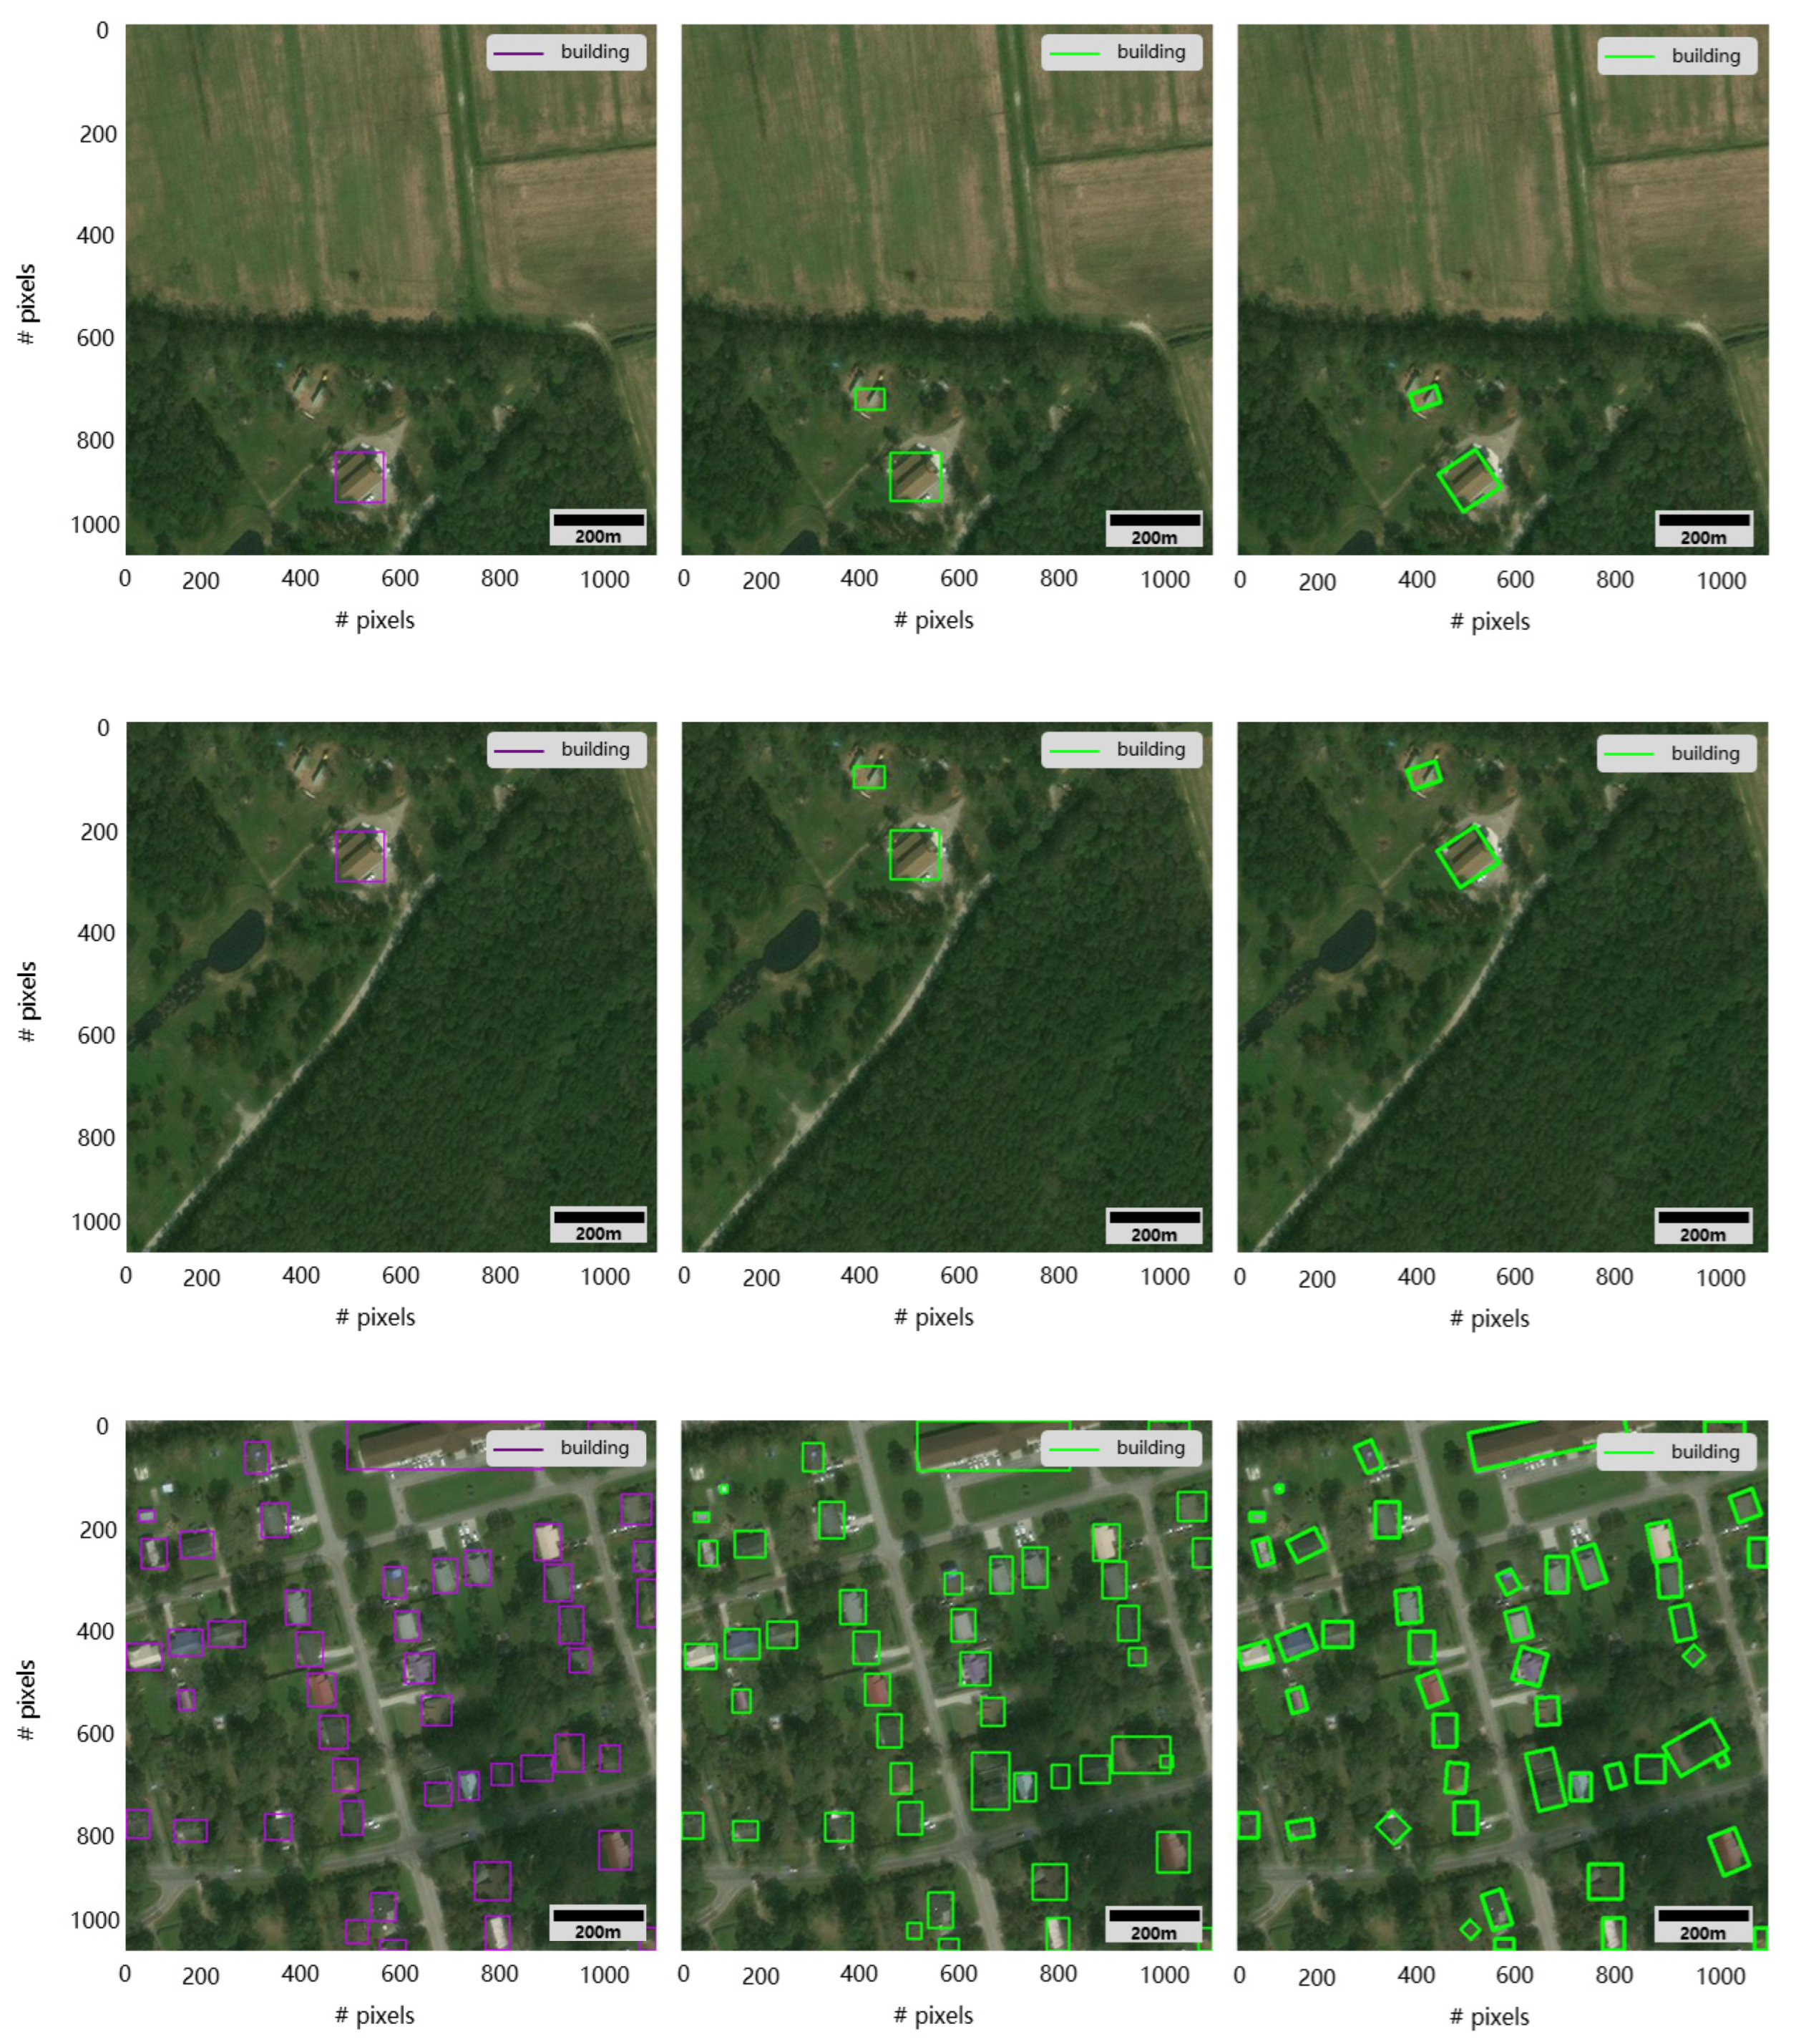
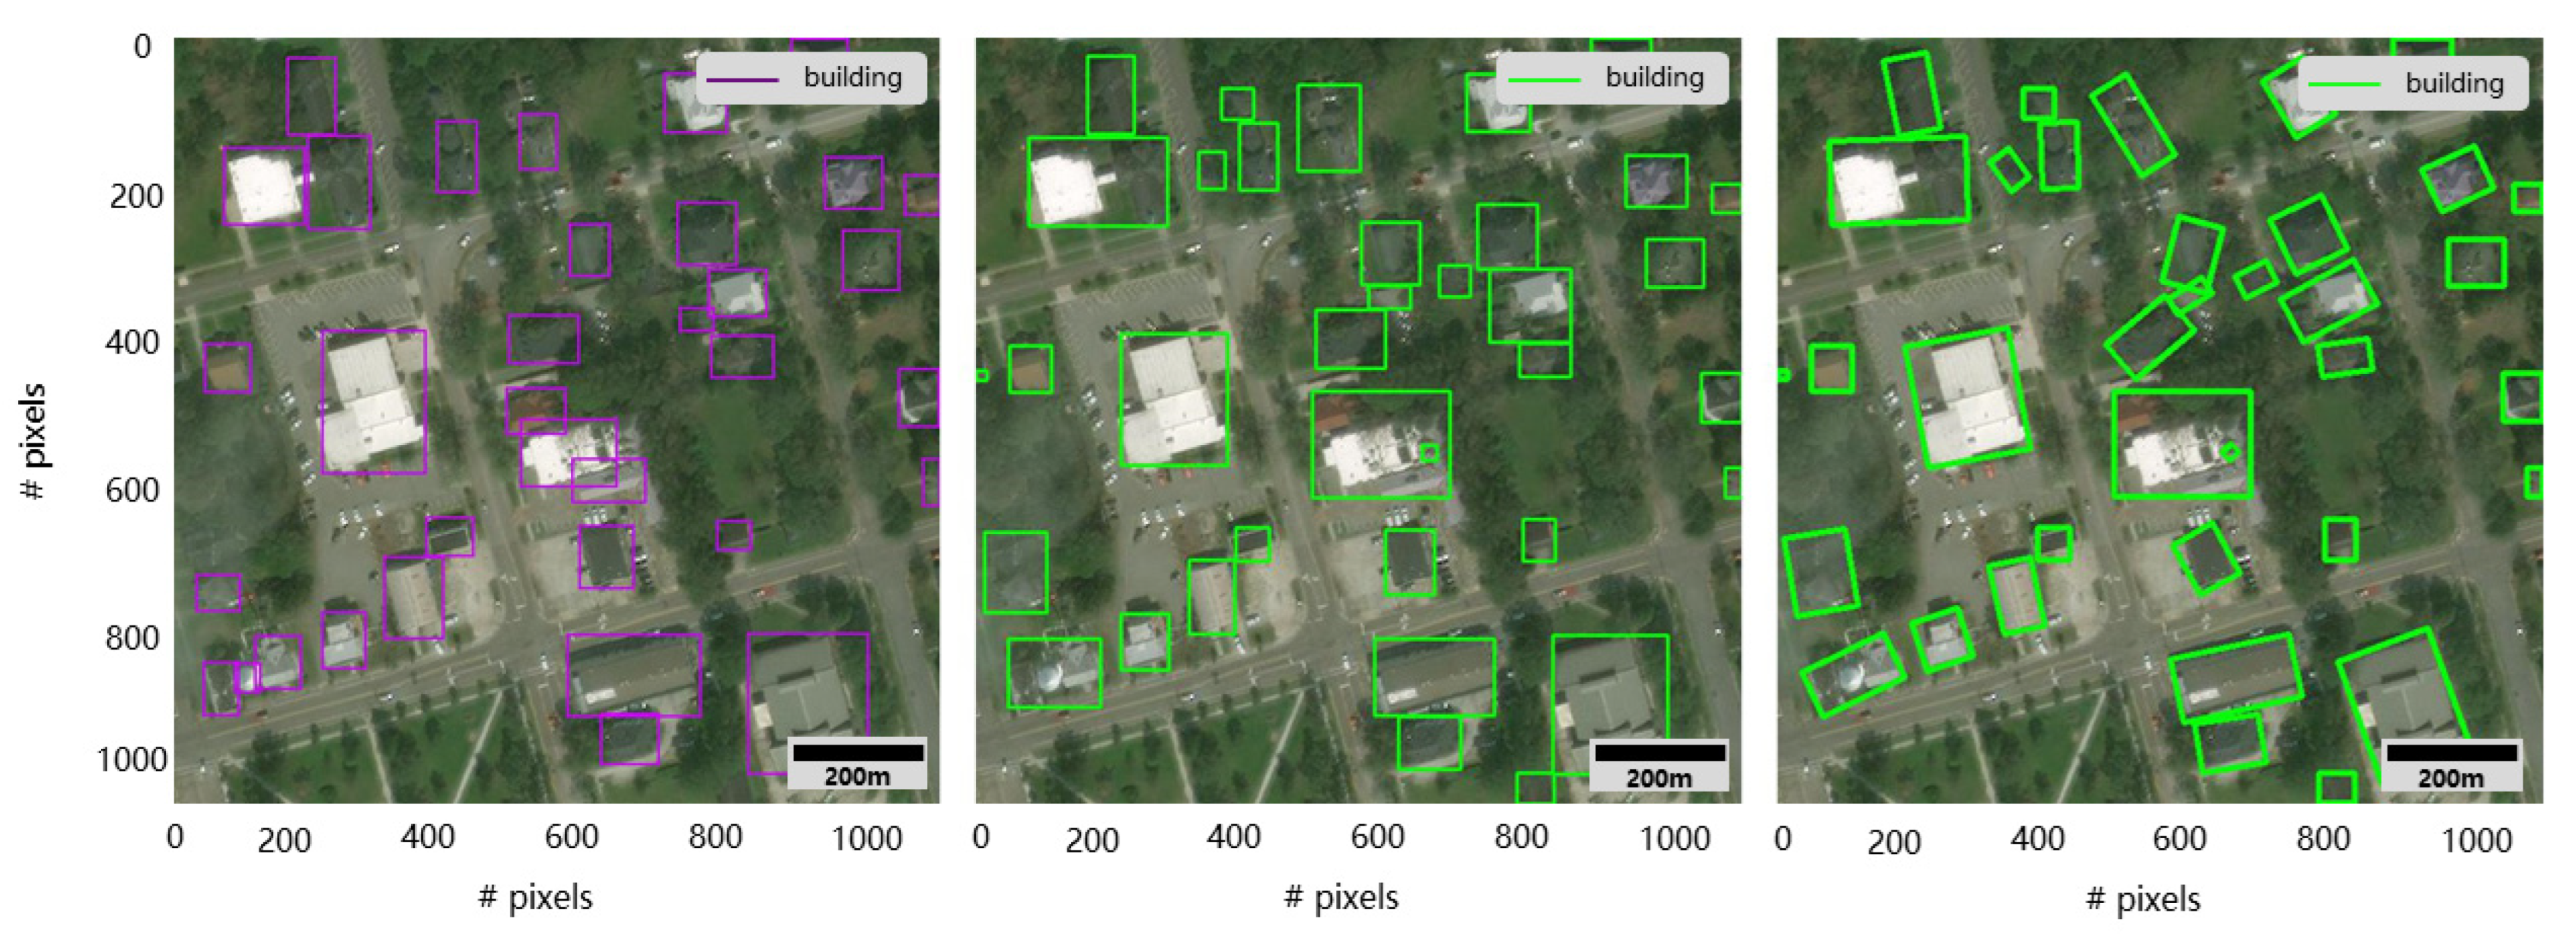
Since SegDetector is mainly based on the semantic segmentation idea, the position of the detection frame is calculated for the output of equal resolution, but the segmentation performance is often poor at the edges. It can be observed from Figure 12 that the SegDetector model is better overall for detecting small targets and edge region targets compared to the YOLOX model, which can successfully detect buildings with small pixel areas in the image, and the SegDetector will result in a dense number of small targets of the same class being identified as one large target. However, usually in the actual application of disaster relief, the rapid and accurate detection of affected buildings is more important, while details of the impact of the disaster are less relevant to immediate disaster relief work. Appendix A is for comparison.
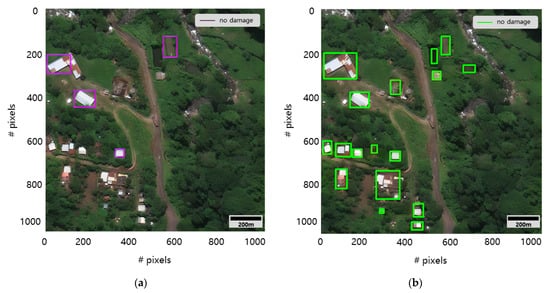
Figure 12.
Plots of YOLOX and SegDetector detection results. ((a) shows YOLOX detection results and (b) shows SegDetector detection results).
5. Conclusions
In order to alleviate the difficulty of detecting small-scale and partially overlapping damaged buildings in remote sensing images, this study proposes a new target detection algorithm, SegDetector, based on the SegFormer semantic segmentation model. SegDetector achieves full-resolution output to improve the detection performance of small-scale targets and enhances the detection performance of overlapping targets by using BCE loss. It was experimentally demonstrated that SegDetector achieves F1: 0.71, Precision: 0.63, and Recall: 0.81 in xBD data, outperforming models such as YOLOX, Faster R-CNN, and CenterNet2. Furthermore, SegDetector can achieve rotation detection of targets without introducing additional parameters and without retraining the model.
SegDetector has 42% of the number of parameters of YOLOX, which is a high-speed and lightweight detection model. At the same time, SegDetector does not require complex NMS calculations, so the detection is faster compared to CenterNet2, YOLOv3, and YOLOv4, making it more meaningful for actual deployment. SegDetector can be used to achieve better performance in the actual detection of damaged buildings and is more valuable for disaster relief tasks because it is better, and computationally faster, at detecting small-scale targets and overlapping targets.
Author Contributions
Methodology, writing—original draft preparation and editing, software, Z.Y.; writing—review and editing, Z.C.; validation, formal analysis, Z.S.; investigation, data curation, H.G.; resources, visualization, B.L.; supervision, project administration, Z.H.; funding acquisition, J.Y. and S.X. All authors have read and agreed to the published version of the manuscript.
Funding
This research was funded by the Key Research and Development Program of Guangxi (GuikeAB22035060), the Innovative Research Program of the International Research Center of Big Data for Sustainable Development Goals (Grant No. CBAS2022IRP04), the National Natural Science Foundation of China (Grant No. 42171291), and the Chengdu University of Technology Postgraduate Innovative Cultivation Program: Tunnel Geothermal Disaster Susceptibility Evaluation in Sichuan-Tibet Railway Based on Deep Learning (CDUT2022BJCX015).
Data Availability Statement
Not applicable.
Acknowledgments
The authors are grateful for helpful comments from many researchers and colleagues.
Conflicts of Interest
The authors declare that they have no known competing financial interest or personal relationships that could have appeared to influence the work reported in this paper.
Appendix A
References
- Koshimura, S.; Moya, L.; Mas, E.; Bai, Y. Tsunami damage detection with remote sensing: A review. Geosciences 2020, 10, 177. [Google Scholar] [CrossRef]
- Sui, H.; Liu, C.; Huang, L. Application of remote sensing technology in earthquake-induced building damage detection. Geomat. Inf. Sci. Wuhan Univ. 2019, 44, 1008–1019. [Google Scholar]
- Li, H.; Huang, C.; Liu, Q.; Liu, G.; He, Y.; Yu, H. Review on dynamic monitoring of mangrove forestry using remote sensing. J. Geo-Inf. Sci. 2018, 20, 1631–1643. [Google Scholar]
- Xie, Y.; Feng, D.; Chen, H.; Liu, Z.; Mao, W.; Zhu, J.; Hu, Y.; Baik, S. Damaged Building Detection from Post-Earthquake Remote Sensing Imagery Considering Heterogeneity Characteristics. IEEE Trans. Geosci. Remote Sens. 2022, 60, 1–17. [Google Scholar] [CrossRef]
- Li, J.; Huang, X.; Tu, L.; Zhang, T.; Wang, L. A review of building detection from very high resolution optical remote sensing images. GISci. Remote Sens. 2022, 59, 1199–1225. [Google Scholar] [CrossRef]
- Xu, H.; Zhu, Y.; Zhen, T.; Ll, Z. Survey of lmage semantic segmentation methods based on deep neural network. J. Front. Comput. Sci. Technol. 2021, 15, 47–59. [Google Scholar]
- Ding, J.; Zhang, J.; Zhan, Z.; Tang, X.; Wang, X. A Precision Efficient Method for Collapsed Building Detection in Post-Earthquake UAV Images Based on the Improved NMS Algorithm and Faster R-CNN. Remote Sens. 2022, 14, 663. [Google Scholar] [CrossRef]
- Bai, T.; Pang, Y.; Wang, J.; Han, K.; Luo, J.; Wang, H.; Lin, J.; Wu, J.; Zhang, H. An optimized faster R-CNN method based on DRNet and RoI align for building detection in remote sensing images. Remote Sens. 2020, 12, 762. [Google Scholar] [CrossRef]
- Liu, Y.; Zhang, Z.; Zhong, R.; Chen, D.; Ke, Y.; Peethambaran, J.; Chen, C.; Sun, L. Multilevel building detection framework in remote sensing images based on convolutional neural networks. IEEE J. Sel. Top. Appl. Earth Observ. Remote Sens. 2018, 11, 3688–3700. [Google Scholar] [CrossRef]
- Bai, Y.; Hu, J.; Su, J.; Liu, X.; Liu, H.; He, X.; Meng, S.; Mas, E.; Koshimura, S. Pyramid pooling module-based semi-siamese network: A benchmark model for assessing building damage from xBD satellite imagery datasets. Remote Sens. 2020, 12, 4055. [Google Scholar] [CrossRef]
- Ren, S.; He, K.; Girshick, R.; Sun, J. Faster r-cnn: Towards real-time object detection with region proposal networks. Adv. Neural Inf. Process. Syst. 2015, 28, 1137–1149. [Google Scholar] [CrossRef] [PubMed]
- He, K.; Gkioxari, G.; Dollár, P.; Girshick, R. Mask r-cnn. In Proceedings of the IEEE International Conference on Computer Vision, Venice, Italy, 22–29 October 2017; pp. 2961–2969. [Google Scholar]
- Cai, Z.; Vasconcelos, N. Cascade r-cnn: Delving into high quality object detection. In Proceedings of the IEEE Conference on Computer Vision and Pattern Recognition, Salt Lake City, UT, USA, 18–23 June 2018; pp. 6154–6162. [Google Scholar]
- Redmon, J.; Farhadi, A. Yolov3: An incremental improvement. arXiv 2018, arXiv:1804.02767. [Google Scholar]
- Bochkovskiy, A.; Wang, C.; Liao, H.M. Yolov4: Optimal speed and accuracy of object detection. arXiv 2020, arXiv:2004.10934. [Google Scholar]
- Li, C.; Li, L.; Jiang, H.; Weng, K.; Geng, Y.; Li, L.; Ke, Z.; Li, Q.; Cheng, M.; Nie, W. YOLOv6: A single-stage object detection framework for industrial applications. arXiv 2022, arXiv:2209.02976. [Google Scholar]
- Wang, C.; Bochkovskiy, A.; Liao, H.M. YOLOv7: Trainable bag-of-freebies sets new state-of-the-art for real-time object detectors. arXiv 2022, arXiv:2207.02696. [Google Scholar]
- Chen, Q.; Wang, Y.; Yang, T.; Zhang, X.; Cheng, J.; Sun, J. You only look one-level feature. In Proceedings of the IEEE/CVF Conference on Computer Vision and Pattern Recognition, Nashville, TN, USA, 20–25 June 2021; pp. 13039–13048. [Google Scholar]
- Ge, Z.; Liu, S.; Wang, F.; Li, Z.; Sun, J. Yolox: Exceeding yolo series in 2021. arXiv 2021, arXiv:2107.08430. [Google Scholar]
- Liu, W.; Anguelov, D.; Erhan, D.; Szegedy, C.; Reed, S.; Fu, C.; Berg, A.C. Ssd: Single shot multibox detector. In European Conference on Computer Vision; Springer: Berlin/Heidelberg, Germany, 2016; pp. 21–37. [Google Scholar]
- Li, Z.; Zhou, F. FSSD: Feature fusion single shot multibox detector. arXiv 2017, arXiv:1712.00960. [Google Scholar]
- Tian, Z.; Shen, C.; Chen, H.; He, T. Fcos: Fully convolutional one-stage object detection. In Proceedings of the IEEE/CVF International Conference on Computer Vision, Seoul, Republic of Korea, 27 October–2 November 2019; pp. 9627–9636. [Google Scholar]
- Lin, T.; Maire, M.; Belongie, S.; Hays, J.; Perona, P.; Ramanan, D.; Dollár, P.; Zitnick, C.L. Microsoft coco: Common objects in context. In European Conference on Computer Vision; Springer: Berlin/Heidelberg, Germany, 2014; pp. 740–755. [Google Scholar]
- Everingham, M.; Van Gool, L.; Williams, C.K.; Winn, J.; Zisserman, A. The pascal visual object classes (voc) challenge. Int. J. Comput. Vis. 2010, 88, 303–338. [Google Scholar] [CrossRef]
- Salscheider, N.O. Featurenms: Non-maximum suppression by learning feature embeddings. In Proceedings of the 2020 25th International Conference on Pattern Recognition (ICPR), Milan, Italy, 10–15 January 2021; pp. 7848–7854. [Google Scholar]
- Bodla, N.; Singh, B.; Chellappa, R.; Davis, L.S. Soft-NMS—Improving object detection with one line of code. In Proceedings of the IEEE International Conference on Computer Vision, Venice, Italy, 22–29 October 2017; pp. 5561–5569. [Google Scholar]
- Xie, E.; Wang, W.; Yu, Z.; Anandkumar, A.; Alvarez, J.M.; Luo, P. SegFormer: Simple and efficient design for semantic segmentation with transformers. Adv. Neural Inf. Process. Syst. 2021, 34, 12077–12090. [Google Scholar]
- Huang, H.; Lin, L.; Tong, R.; Hu, H.; Zhang, Q.; Iwamoto, Y.; Han, X.; Chen, Y.; Wu, J. Unet 3+: A full-scale connected unet for medical image segmentation. In Proceedings of the ICASSP 2020–2020 IEEE International Conference on Acoustics, Speech and Signal Processing (ICASSP), Barcelona, Spain, 4–8 May 2020; pp. 1055–1059. [Google Scholar]
- Gupta, R.; Hosfelt, R.; Sajeev, S.; Patel, N.; Goodman, B.; Doshi, J.; Heim, E.; Choset, H.; Gaston, M. XBD: A dataset for assessing building damage from satellite imagery. arXiv 2019, arXiv:1911.09296v1. [Google Scholar]
- Gupta, R.; Goodman, B.; Patel, N.; Hosfelt, R.; Sajeev, S.; Heim, E.; Doshi, J.; Lucas, K.; Choset, H.; Gaston, M. Creating xBD: A dataset for assessing building damage from satellite imagery. In Proceedings of the IEEEConference on Computer Vision and Pattern Recognition Workshops, Long Beach, CA, USA, 16–20 June 2019; pp. 10–17. [Google Scholar]
- Tilon, S.; Nex, F.; Kerle, N.; Vosselman, G. Post-Disaster Building Damage Detection from Earth Observation Imagery Using Unsupervised and Transferable Anomaly Detecting Generative Adversarial Networks. Remote Sens. 2020, 12, 4193. [Google Scholar] [CrossRef]
- Dosovitskiy, A.; Beyer, L.; Kolesnikov, A.; Weissenborn, D.; Zhai, X.; Unterthiner, T.; Dehghani, M.; Minderer, M.; Heigold, G.; Gelly, S. An image is worth 16 × 16 words: Transformers for image recognition at scale. arXiv 2020, arXiv:2010.11929. [Google Scholar]
- Liu, Z.; Lin, Y.; Cao, Y.; Hu, H.; Wei, Y.; Zhang, Z.; Lin, S.; Guo, B. Swin transformer: Hierarchical vision transformer using shifted windows. In Proceedings of the IEEE/CVF International Conference on Computer Vision, Montreal, QC, Canada, 10–15 October 2021; pp. 10012–10022. [Google Scholar]
- Long, J.; Shelhamer, E.; Darrell, T. Fully convolutional networks for semantic segmentation. In Proceedings of the IEEE Conference on Computer Vision and Pattern Recognition, Boston, MA, USA, 7–12 June 2015; pp. 3431–3440. [Google Scholar]
- Cordts, M.; Omran, M.; Ramos, S.; Rehfeld, T.; Enzweiler, M.; Benenson, R.; Franke, U.; Roth, S.; Schiele, B. The cityscapes dataset for semantic urban scene understanding. In Proceedings of the IEEE Conference on Computer Vision and Pattern Recognition, Las Vegas, NV, USA, 27–30 June 2016; pp. 3213–3223. [Google Scholar]
- Wang, W.; Xie, E.; Li, X.; Fan, D.; Song, K.; Liang, D.; Lu, T.; Luo, P.; Shao, L. Pyramid vision transformer: A versatile backbone for dense prediction without convolutions. In Proceedings of the IEEE/CVF International Conference on Computer Vision, Montreal, QC, Canada, 10–15 October 2021; pp. 568–578. [Google Scholar]
- Chen, Z.; Chang, R.; Guo, H.; Pei, X.; Zhao, W.; Yu, Z.; Zou, L. Prediction of Potential Geothermal Disaster Areas along the Yunnan–Tibet Railway Project. Remote Sens. 2022, 14, 3036. [Google Scholar] [CrossRef]
- Chen, Z.; Chang, R.; Zhao, W.; Li, S.; Guo, H.; Xiao, K.; Wu, L.; Hou, D.; Zou, L. Quantitative Prediction and Evaluation of Geothermal Resource Areas in the Southwest Section of the Mid-Spine Belt of Beautiful China. Int. J. Digit. Earth 2022, 15, 748–769. [Google Scholar] [CrossRef]
- Dong, S.; Chen, Z. A multi-level feature fusion network for remote sensing image segmentation. Sensors 2021, 21, 1267. [Google Scholar] [CrossRef] [PubMed]
- Jian, M.; Wang, J.; Yu, H.; Wang, G.; Meng, X.; Yang, L.; Dong, J.; Yin, Y. Visual saliency detection by integrating spatial position prior of object with background cues. Expert Syst. Appl. 2021, 168, 114219. [Google Scholar] [CrossRef]
- Lin, T.; Goyal, P.; Girshick, R.; He, K.; Dollár, P. Focal loss for dense object detection. In Proceedings of the IEEE International Conference on Computer Vision, Venice, Italy, 22–29 October 2017; pp. 2980–2988. [Google Scholar]
- Duan, K.; Bai, S.; Xie, L.; Qi, H.; Huang, Q.; Tian, Q. Centernet: Keypoint triplets for object detection. In Proceedings of the IEEE/CVF International Conference on Computer Vision, Seoul, Republic of Korea, 27 October–2 November 2019; pp. 6569–6578. [Google Scholar]
Publisher’s Note: MDPI stays neutral with regard to jurisdictional claims in published maps and institutional affiliations. |
© 2022 by the authors. Licensee MDPI, Basel, Switzerland. This article is an open access article distributed under the terms and conditions of the Creative Commons Attribution (CC BY) license (https://creativecommons.org/licenses/by/4.0/).