Article

Parcel-Level Flood and Drought Detection for Insurance Using Sentinel-2A, Sentinel-1 SAR GRD and Mobile Images

1
School of Information, Computer and Communication Technology, Sirindhorn International Institute of Technology, Thammasat University, Pathum Thani 12000, Thailand
2
Advanced Geospatial Technology Research Unit, Sirindhorn International Institute of Technology, Pathum Thani 12000, Thailand
*
Author to whom correspondence should be addressed.
Remote Sens. 2022, 14(23), 6095; https://doi.org/10.3390/rs14236095
Submission received: 23 October 2022 / Revised: 19 November 2022 / Accepted: 28 November 2022 / Published: 1 December 2022

Abstract

:
Floods and droughts cause catastrophic damage in paddy fields, and farmers need to be compensated for their loss. Mobile applications have allowed farmers to claim losses by providing mobile photos and polygons of their land plots drawn on satellite base maps. This paper studies diverse methods to verify those claims at a parcel level by employing (i) Normalized Difference Vegetation Index (NDVI) and (ii) Normalized Difference Water Index (NDWI) on Sentinel-2A images, (iii) Classification and Regression Tree (CART) on Sentinel-1 SAR GRD images, and (iv) a convolutional neural network (CNN) on mobile photos. To address the disturbance from clouds, we study the combination of multi-modal methods—NDVI+CNN and NDWI+CNN—that allow 86.21% and 83.79% accuracy in flood detection and 73.40% and 81.91% in drought detection, respectively. The SAR-based method outperforms the other methods in terms of accuracy in flood (98.77%) and drought (99.44%) detection, data acquisition, parcel coverage, cloud disturbance, and observing the area proportion of disasters in the field. The experiments conclude that the method of CART on SAR images is the most reliable to verify farmers’ claims for compensation. In addition, the CNN-based method’s performance on mobile photos is adequate, providing an alternative for the CART method in the case of data unavailability while using SAR images.

Graphical Abstract

1. Introduction

Thailand ranks sixth among rice/paddy-producing countries from 2017 to 2022 and third in terms of export in 2022 [1]. However, disasters, such as floods and droughts, wreak havoc and can greatly reduce rice production. Predictions of such events often come true and lower the country’s overall ranking in export [2]. The toll hits hard on farmers who claim compensation from the government. The existing system to verify the legitimacy of the farmer’s claims include field visits by authorities, which is ambiguous, expensive, and slow. In this paper, we explore different sensing techniques to build an automated system for precise per-parcel detection of disasters that will assist the decision processes of government and insurance agencies.
Remotely sensed satellite images are a fundamental data source for disseminating flood and drought over large areas. These images are provided in different platforms, such as Copernicus Open Access Hub [3], Google Earth Engine (GEE) [4], United States Geological Survey (USGS) [5], EO Browser [6], etc. GEE is a cloud-based platform that offers a data catalog of multi-petabyte geospatial datasets and satellite images [7]. It comprises Sentinel-1 [8] and Sentinel-2A [9] data for analyzing disasters, such as flood and drought. These images carry multi-spectral bands. For instance, Sentinel-2A acquires 13 spectral bands [10] that allow an effective visualization of flood and drought with empirical indices, such as Normalized Difference Vegetation Index (NDVI) [11] and Normalized Difference Water Index (NDWI) [12], or machine learning (ML) algorithms, which are all available in the GEE code editor. The code editor in GEE provides the functionality to write scripts in a web-based interactive development environment (IDE) to perform geospatial work with speed and less complexity [4].
Sentinel-2 satellites produce images with a spatial resolution ranging from 10 to 60 m with 13 spectral bands. The Sentinel-2A product is an orthorectified, atmospherically corrected surface reflectance image provided by the Sentinel-2 satellite [13]. Out of 13 bands in the Sentinel-2A image, visible bands, namely red and green, and near-infrared (NIR) bands are used to derive indices, such as NDVI and NDWI. These bands have a spatial resolution of 10 m which is relatively high compared to the visible bands and NIR bands provided by Landsat-8 with 30 m. Therefore, Sentinel-2A provides higher-resolution NDVI and NDWI information. Cavallo et al. (2021) [14] used both datasets to monitor continuous floods, combining NDWI, Modification of Normalized Difference Water INDEX (MNDWI), and NDVI for automatic classification, where Sentinel-2 achieved more accuracy (98.5%) than Landsat-8 (96.5%). Astola et al. (2019) [15] compared Sentinel-2 and Landsat-8 images in the northern region to predict forest variables, and Sentinel-2 outperformed Landsat-8 even though the Sentinel-2 data were downsampled with a pixel resolution of 30 m to match Landsat-8 data pixel resolution. However, cloud and cloud shadows present in optical images impact the spectral bands [16] and alter vegetation indices values [17], such as NDVI and NDWI.
In such a case, Synthetic Aperture Radar (SAR) is instrumental in gathering necessary data regardless of cloud cover [18]. SAR penetrates clouds and provides observations of earth features obscured by other sensing systems [19]. Sentinel-1 satellite provides a C-band SAR instrument that collects Ground Range Detected (GRD) scenes and is available in GEE. Sentinel-1 SAR GRD: C-band has a wavelength of 6 cm [18]. The Sentinel-1 images are used to detect disaster by implementing ML algorithms, such as Classification and Regression Trees (CART) [20], Support Vector Machine (SVM) [21], Random Forest (RF) [22], etc.
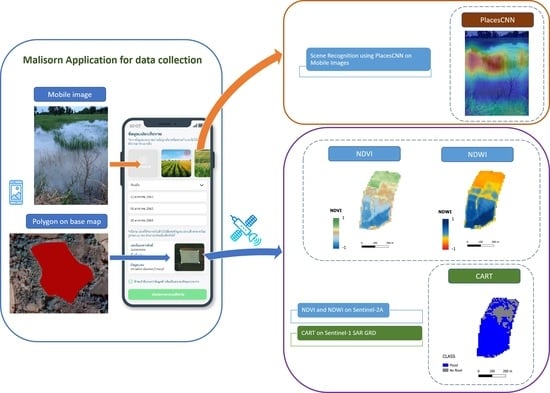
Using mobile images is an alternative way for flood and drought detection under the cloud cover condition. In our previous work [23], we implemented two deep learning (DL) methods to detect flood and drought events based on the mobile photographs submitted by farmers for insurance claims. The two methods include pixel-based semantic segmentation [24] using DeepLabv3+ [25] and object-based scene recognition using PlacesCNN [26]. These two DL networks are widely used for semantic segmentation and image recognition of ground and remotely sensed images [27].
The objective of this paper is to validate farmers’ claims for insurance during disaster events using sensing methods. Remotely sensed optical imagery from Sentinel-2A and SAR imagery from Sentinel-1 are the main priorities in building such methods. NDVI and NDWI are derived from optical imagery, and a ML method is applied to the SAR images. The experiments show that ML on SAR is an effective method for remote sensing images as it is unaffected by clouds. However, SAR images are not always available. Therefore, the methods from optical sensors need efficiency gain during cloud coverage. To increase the efficiency of the optical image-based method during cloud coverage, we use mobile images from land plots. A DL method is developed to detect disaster events from mobile images. The predictions from the mobile images are then combined with the predictions from NDVI and NDWI from Sentinel-2A. The combined method, therefore, provides an alternative to the SAR-based method. The overall method accurately and efficiently evaluates the disaster claims and ensures that no farmers are left behind during the decision processes involved in compensation.

2. Materials

2.1. Dataset

Malisorn is a mobile application (See https://farminsure.infuse.co.th/ (accessed on 5 September 2022)) developed by Infuse Company Limited, in support of Thai General Insurance Association. It provides service to the farmers affected by disaster events that are not in disaster-declared areas. Farmers can collect photographs of the damaged area and report the damage from mobile, which shortens the wait time. The affected farmers submit damage requests with photos showing their farm’s condition along with the polygon of their land plot drawn on the base map provided by the mobile application. The submitted form also includes the disaster date and personal information of land owners [28]. We use the dataset recorded on the Malisorn application for flood and drought detection. A total of 859 claims are received, where 660 are drought claims and 199 are flood claims. From the polygon provided, we access the Sentinel-2A and Sentinel-1 satellite images for each land plot from GEE and forward them as input to our methods. Furthermore, we also use mobile photographs for flood and drought detection using a DL method. For this, we employ an object-based scene recognition model with PlacesCNN. The network uses the ResNet-18 model pre-trained on a Places365-Standard [26] dataset. Places365-Standard covers 365 scenes/classes comprising 1.8 million training images and 36000 validation images, where each class has a maximum of 5000 images.

2.2. Study Area

Depending on the farmer’s claim, the study area is distributed all over Thailand. Specifically, the experiments are carried out on the polygon of land plots provided by farmers during their insurance claims. The experiments are irrespective of disaster/non-disaster declared areas to facilitate all farmers in Thailand. Figure 1 illustrates locations of flood and drought claims made by the farmers using the Malisorn application of their respective farms. Moreover, the different regions provide various practical challenges and limitations due to satellite image properties that improve the scalability and robustness of the designed method.

2.3. Sentinel-2A Images for NDVI and NDWI Computation

Sentinel-2A provides images with a temporal resolution of 5 days, making it the best option to calculate timely NDVI and NDWI for our purpose. The images are collected from GEE. Level-2A products are orthorectified, and the surface reflectance of images is corrected [13]. Sentinel-2A offers 13 bands with three different spatial resolutions [13]. Visible and NIR bands have a resolution of 10 m [29], which is essential to determine NDVI and NDWI.
NDVI [30] is a prominent vegetation indicator [31] used in satellite remote sensing applications. NDVI index ranges from −1 to +1, where a lower value near −1 tends to be water bodies, while higher values close to +1 are interpreted to be dense green vegetation [32,33]. The NDVI range is represented by Equation (1).
NDVI = B 8 B 4 B 8 + B 4
where B8 and B4 represent the NIR and red bands of the Sentinel-2A image product, respectively.
NDWI [34] is a vegetation indicator derived from green and NIR bands to monitor water content and its changes [12]. The NDWI index also ranges from −1 to +1, where positive values indicate water bodies and negative values indicate terrestrial vegetation and soil [35]. The NDWI value is calculated using Equation (2).
NDWI = B 3 B 8 B 3 + B 8
where B3 and B8 represent the green and NIR bands of the Sentinel-2A image product, respectively.
Vegetation indices, such as NDVI and NDWI, collect information using image bands, unlike ML solutions that require multiple training on large datasets. A ML model needs to be trained twice in two different optical satellite images for flood and drought. The next section explores such a ML method not on optical images but on SAR. A SAR-based method provides a better alternative in the case of cloud coverage.

2.4. Sentinel-1 SAR GRD: C-Band Images for CART Classification

The polar-orbiting Sentinel-1 mission can map the Earth in 12 days. Similar to the Sentinel-2 mission, the constellation of two satellites gave the advantage of a revisit time of 6 days till 23 December 2021, after which Sentinel-1B failed to deliver radar data due to an anomaly related to power supply, and only Sentinel-1A revolved with a revisit time of 12 days. Sentinel-1 satellites carry a C-band SAR instrument, which can operate in both daytime and nighttime in any weather conditions [8]. Level-1 Ground Range Detected (GRD) scenes can be acquired in GEE, which is already pre-processed to remove thermal noise, correct radiometric calibration, and terrain correction [36]. The number of polarization bands is dependent on the polarization settings of the instrument, due to which either one or two bands are contained in each scene out of four possible polarization bands. Table 1 illustrates the four polarization bands with pixel size for the Interferometric Wide Swath (IW) mode [37], which is one of the acquisition modes of the Sentinel-1 satellite. IW mode with VV + VH polarization is a primary mode used over land, which provides most services avoiding conflicts and preserving the revisit time of satellites. Other modes, such as Strip Map (SM) mode [38], focus on imaging small islands in an emergency scenario, while the Extra Wide Swath (EW) [39] mode images coastal areas for ship traffic or oil spilling monitoring and polar zones [40].
GEE API supports ML algorithms with the available Earth Engine (EE) API methods in ee.Clusterer, ee.Classifier or ee.Reducer packages used to train and execute tasks within EE [41]. We use a supervised classification technique that uses the ee.Classifier package to operate traditional ML algorithms, such as CART, RF, SVM, etc. [42], whereas unsupervised classification techniques use the ee.Clusterer package [43]. For the flood and drought detection domain, Sentinel-1 SAR images with the implementation of ML algorithms have not been substantially explored. Refs. [44,45] are relevant research works for flood monitoring and analysis obtained from Scopus; one of them uses the CART classification method.
We use CART classification using the ee.Classifier package available in EE API for training and classification. CART is a simple prediction approach for binary recursive partitioning [46] that splits the dataset into a classification tree based on homogeneity. The classification tree is used to find the class for the target variable. The target variables are either fixed or categorical and fall within the classes. The regression tree identifies the target variable, and, therefore, the algorithm is implemented to predict its value [47]. As CART is less complex, it is easy to use with fair speed and relatively high accuracy. GEE allows us to train a CART classifier and obtain anticipated classification results.

2.5. Scene Recognition Using PlacesCNN on Mobile Images

Scene recognition is described as the identification of the place where an object resides. However, we can understand it as a list of the objects present in the picture instead of the term “place” to avoid a long and complex description. A common scene recognition method includes a deep learning-based method, such as PlacesCNN. PlacesCNN [26] is a Convolutional Neural Network (CNN) trained on datasets, such as Places365-Standard, Places205, Places88, etc., designed for image classification and object detection. Places365-dataset consists of 365 scene classes, which is relatively high compared to Places205 with 205 classes and Places88 with 88 classes. Places365-Standard is superior in terms of accuracy [26] when used to train a CNN. Moreover, PlacesCNN with ResNet [48] as the CNN achieves the highest accuracy compared to any other CNNs used. Our previous work [23] compares the object-based scene recognition from PlacesCNN to a state-of-the-art pixel-based semantic segmentation [24] from Deeplabv3+ [49]. The PlacesCNN-based method outperforms Deeplabv3+.
In addition to the remote sensing-based methods of optical and SAR images, we implement PlacesCNN on mobile images from the ground. This method provides one more layer of validation in the case of the cloud-affected area and missing data. We use pre-trained PlacesCNN with the ResNet-18 [48] model on the Places365-Standard dataset for automatic flood and drought detection. As discussed in Section 2.1, the Malisorn application gathers the images from the farmers used in this method.

3. Methodology

We perform our work in GEE Code Editor, which supports training and visualization, and use client libraries in python to fully automate the system. Our proposed methods consist of the following steps: (i) acquisition of Sentinel-2A dataset and cloud masking, (ii) thresholding NDVI and NDWI values in Sentinel-2A, (iii) scene recognition on mobile images, (iv) acquisition of Sentinel-1 GRD dataset and (v) supervised learning with the CART model and classification on Sentinel-1 GRD images. Figure 2 presents the detailed workflow, and the following sections describe the steps in order.

3.1. Acquisition of Sentinel-2A Dataset and Cloud Masking

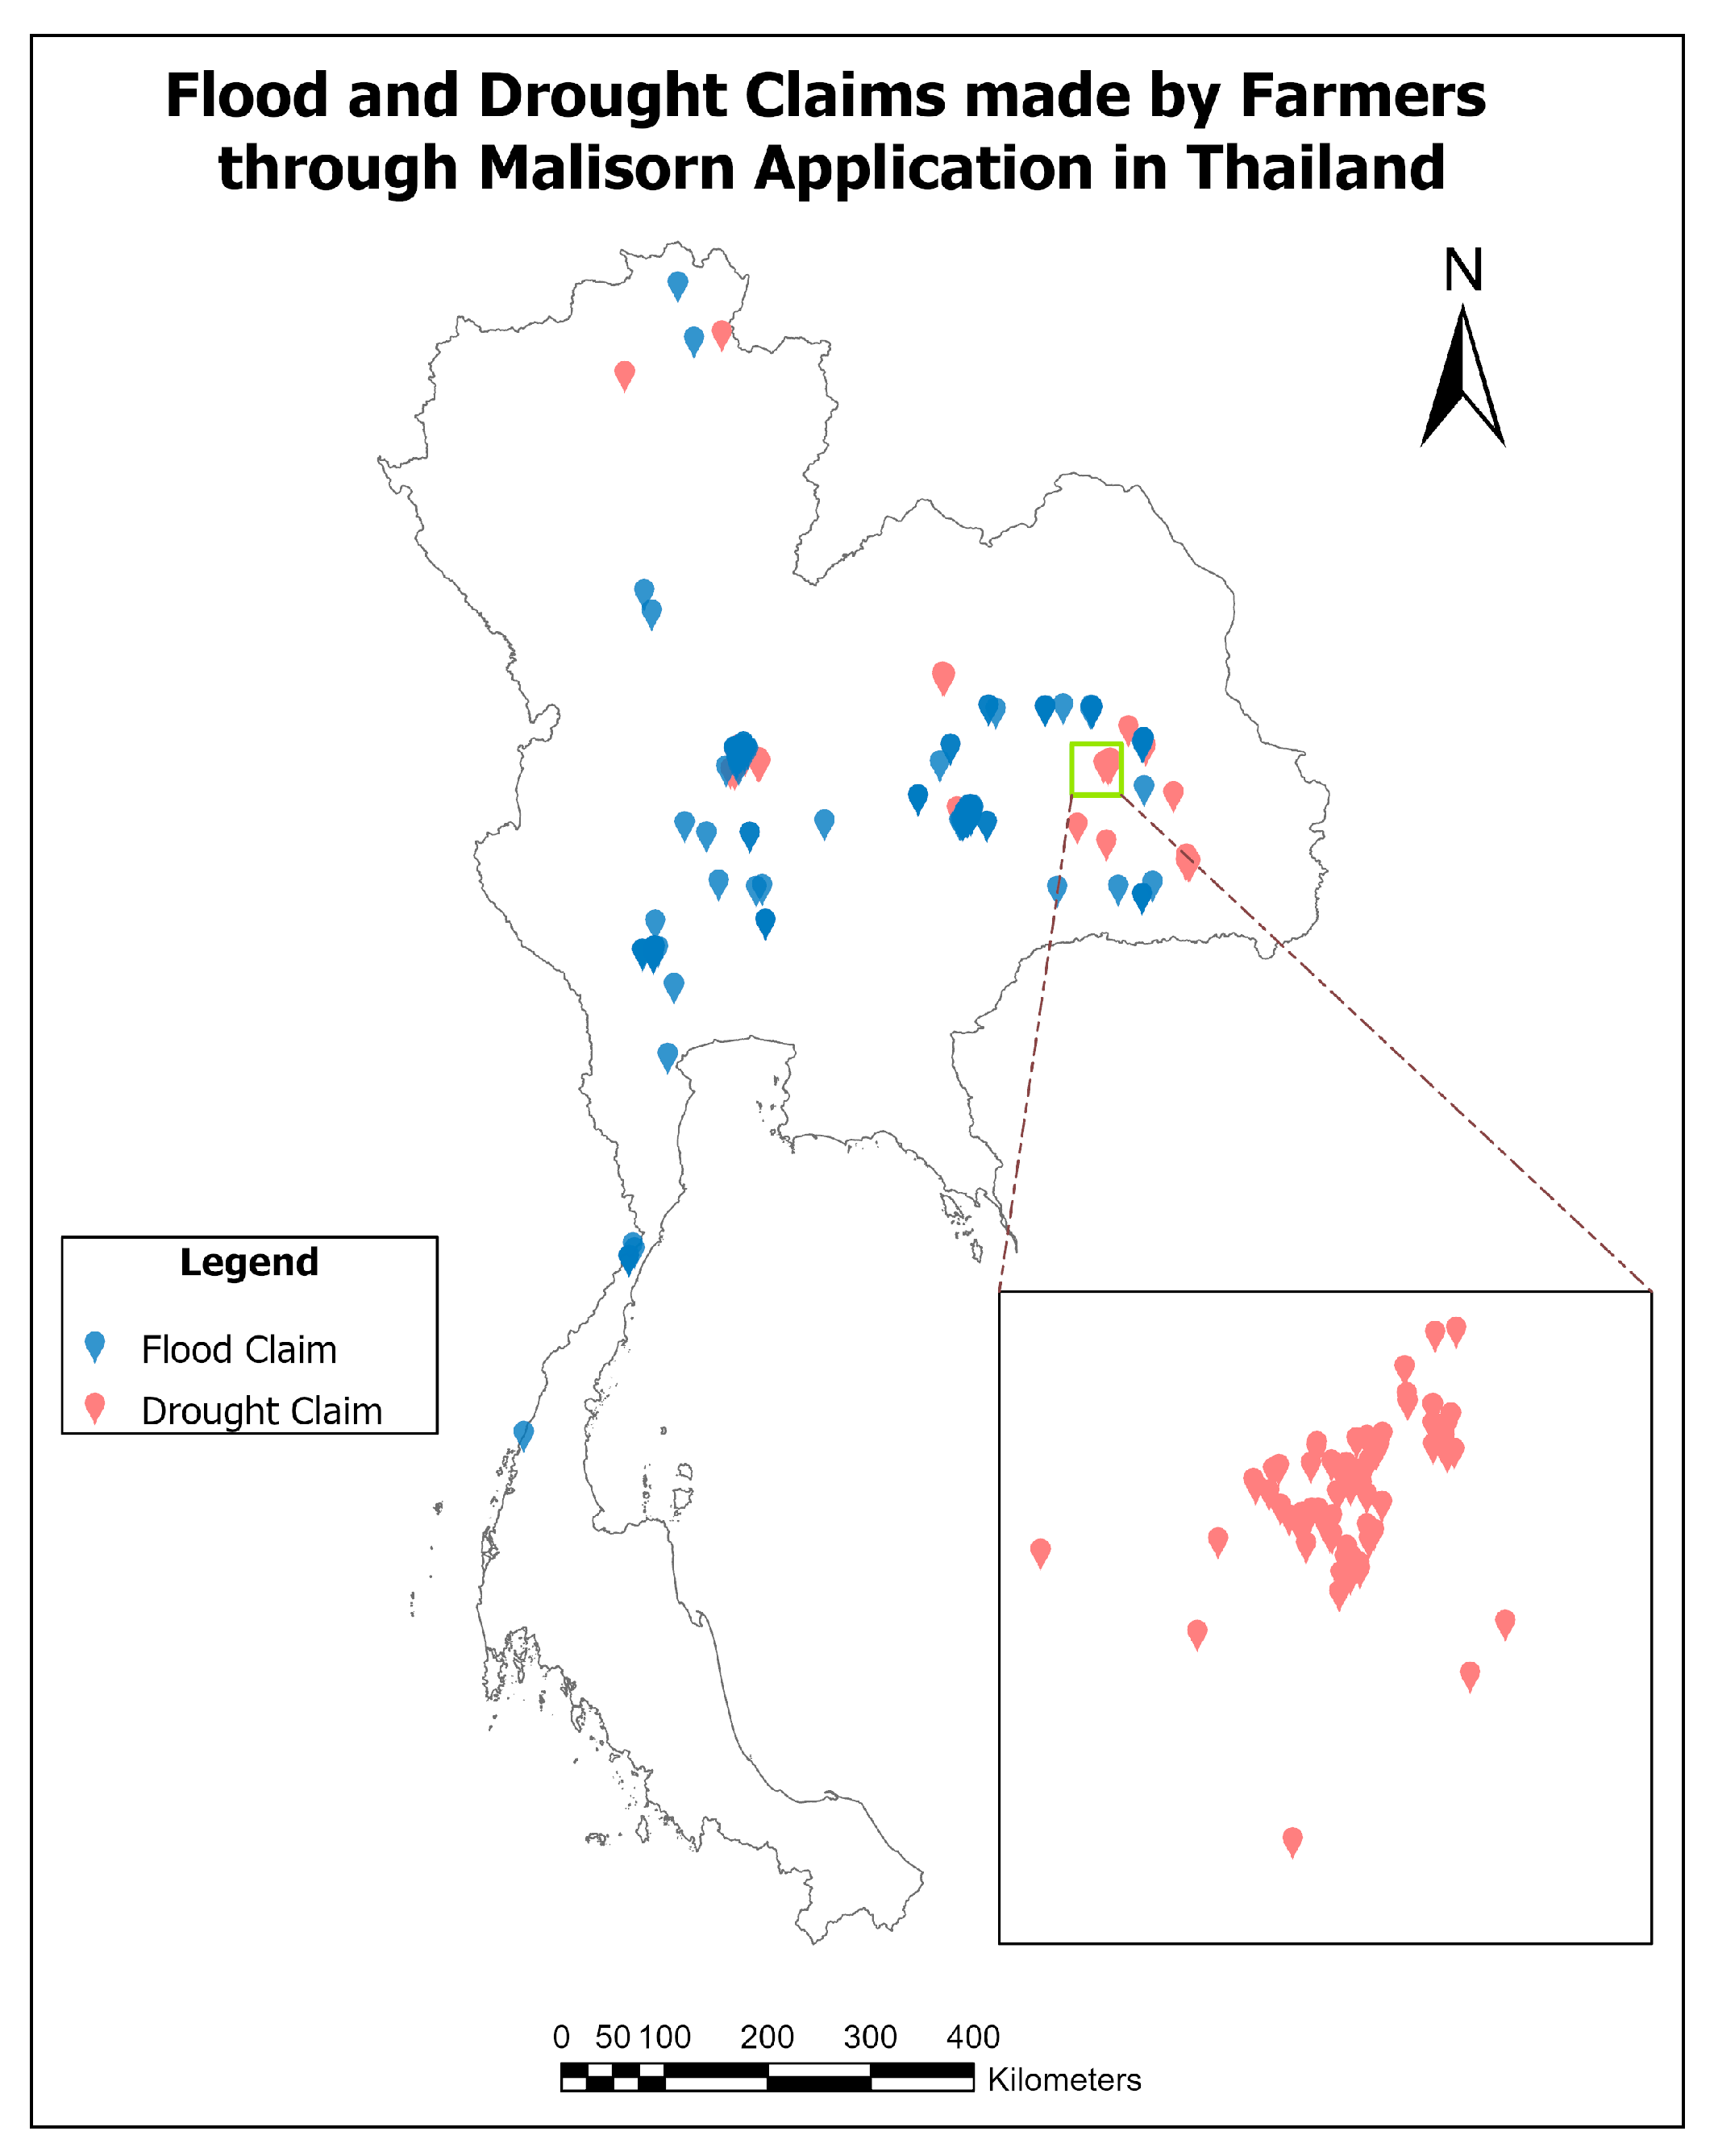
A total of 859 claims are received for flood and drought events together. We access the land plots in Sentinel-2A images from GEE API using the polygons of land plots provided by the farmers during their claims. We select an interval of five days for each report starting from the date of the disaster, either flood or drought, as the revisit time of Sentinel-2 satellites is five days. We filter the least cloudy images from image collections for each satellite image to tackle the cloud cover problem. However, we need to mask the cloud from the satellite images to reduce false detection, as cloud cover affects the band values propagating the error to NDVI and NDWI calculations.
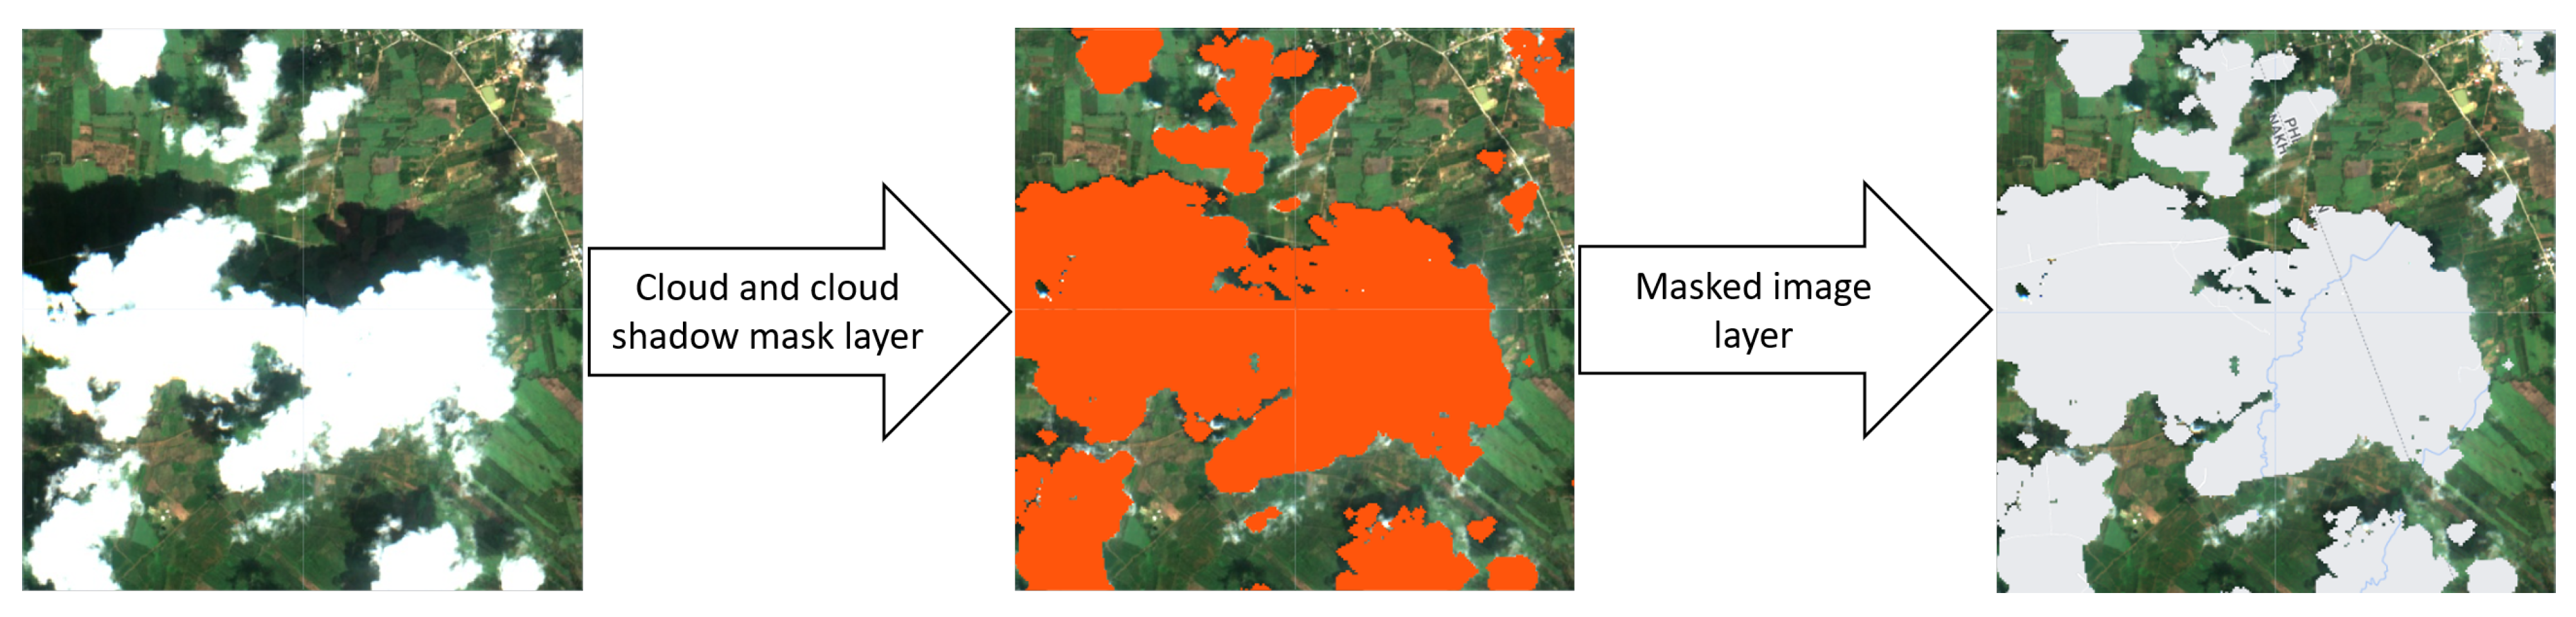
GEE offers cloud masking for Sentinel-2A images with the “Sentinel-2 Cloud Probability” (also known as s2cloudless) [50] dataset. With the same date and region of interest, Sentinel-2 cloud probability image collection is filtered and joined with Sentinel-2A image collection. After adding the cloud probability layer, we derive a cloud mask as a band to a Sentinel-2A image. We also mask the shadow of the cloud by identifying dark pixels. However, all the dark pixels are not cloud pixels, due to which we project cloud shadows from clouds and intersect the projected cloud shadows with the dark pixels to identify shadows. Finally, we mask both clouds and cloud shadows. Figure 3 clarifies how the cloud and cloud shadow layer is implemented and then masked from the Sentinel-2A image in GEE.

3.2. Thresholding NDVI and NDWI Values in Sentinel-2A

The range of NDVI and NDWI values describe the characteristics of the land surface. Based on the previous studies [51,52,53], we divide the range of NDVI values into the following categories: NDVI value less than 0.17 as “flood”; NDVI value between 0.17 and 0.45 as “drought”; and NDVI value greater than 0.45 as “green paddy” category. Using Equation (1), we find the NDVI value of each pixel in a land plot. Then, we compute the area coverage of the three categories for each land plot.
We follow similar steps using per-pixel NDWI values calculated using Equation (2), but with different ranges and categories. Even though the categorization of NDWI values is not abundant in the literature, [35] divides the range into water surface, flooding, moderate drought and high drought. We use these interpretations to categorize NDWI values as NDWI less than 0 in the “drought” category and NDWI more than 0 in the “flood” category. Subsequently, we determine the proportionate area of “flood” and “drought” categories for each land plot to visualize the condition of land plots.

3.3. Scene Recognition using PlacesCNN on Mobile Images

The scene recognition method using PlacesCNN provides one more layer of validation to the farmers’ claim, especially in the case of the presence of a cloud. The PlacesCNN is trained on a Places365-Standard dataset with 365 classes of scenes. The list of classes, however, does not contain a class named flood or drought. As adopted from our previous work [23], we formulate a decision based on existing classes, such as swamp, lagoon, desert, tundra, etc., that carry the properties of flood and drought. The decisions are formed with the following flood and drought categories:
  • Flood categories = [‘swamp’, ‘lagoon’, ‘watering hole’, ‘swimming hole’, ‘pond’, ‘canal/natural’]
  • Drought categories = [‘hayfield’, ‘tundra’, ‘desert road’, ‘desert/vegetation’, ‘archaeological excavation’, ‘trench’]
The pre-trained PlacesCNN model works as a classifier to categorize the mobile images into 365 classes with their probability in a percentage. The cumulative probability of each class in flood and drought categories forms the final decision on whether the scene presents a flood or a drought event. If the probability of flood categories is higher than the probability of drought categories, the prediction from the adopted method is flood and vice versa. If the probability of both categories is zero (with a threshold of 4 decimal points − 0.0000), then we consider the disaster event as neither flood nor drought.

3.4. Acquisition of Sentinel-1 SAR GRD Dataset

We access the Sentinel-1 SAR GRD images of the land plots through GEE API for 660 claims of flood and 199 claims of drought. To filter the images, we select an interval of 6 days (12 days in the case of satellite images obtained after 23 December 2021), which is equal to the revisit time of the Sentinel-1 mission, for each report starting from the date of the disaster. In addition, we also filter by IW mode with VV + VH polarization because of its superiority over the land surface over SM mode and EW mode, as discussed earlier.
Unlike Sentinel-2A images, Sentinel-1 is hardly affected by the clouds, which raises questions related to the necessity for using mobile images. Sentinel-1 provides ortho-corrected and calibrated products. However, the presence of granular noise, such as speckles due to the interference of signals during back-scattering [54], can still obstruct the detection of disaster events. To make the most out of Sentinel-1, we tackle the problem of speckles by filtering them in GEE API with a function (ee.Image.focal_mean) to smooth the image using a kernel. These pre-processed Sentinel-1 images are used to train a classifier to predict flood and drought areas, as explained in the next section.

3.5. Supervised Learning with CART Model and Classification on Sentinel-1 GRD Images

The probability of flood and drought events occurring on a single satellite image (single event) is extremely low. Therefore, we choose two satellite images of two dates, one image consisting of flood and another of drought. We run a supervised classification in both satellite images by collecting training data to train the classifier. We add different layers for feature collection, each having a group of related features. However, identifying and labeling features manually on a SAR image is a puzzle. Thus, we obtain an optical satellite image on the same date as the Sentinel-1 SAR GRD image and collect the features manually. We trace the same exact location in a Sentinel-1 SAR GRD image to collect the same features.
In the case of flood, we collect features from two different layers/classes; either “flood” or “not flood”. We collect 75 points as a feature collection for the “flood” layer and 49 points for the “not flood” layer in a single Sentinel-1 SAR GRD image. The two identified classes are merged into a single collection. Then, we select VV + VH polarization bands to be used to train our data by extracting back-scatter values of VV and VH for each class. Afterward, we train the CART classifier with the training data using the ee.Classifier package and run the classification for image classification. However, we have to run the classification in numerous satellite images of different dates, as the flood claimed by the farmers are at different dates. Thus, we run the classification at several disaster dates having separate satellite images on a farmer’s claimed locations. After running the classification, we clip the land plot of individual farmers according to the polygons sent by respective farmers using a GEE function (ee.Image.clip). Subsequently, we measure the area of flooded and normal regions by counting the pixels belonging to each classified class. The same procedure is followed for drought land plots with classes of “drought”, “green paddy”, and “neither”, each having 43, 28, and 33 training points, respectively. Similar to the method of the flood, the area of drought, green paddy, and other features are measured by counting the pixels. Table 2 simplifies our discussion about the training data of this section.

3.6. Accuracy Assessment

We evaluate the accuracy of all the methods we implement by two-step validation. In the first step, we verify the location-tagged mobile images provided by the farmers with a visual inspection for both flood and drought claims. We accept the images that display the correct disaster for each claim made by the farmers and filter out the junk photographs that farmers unknowingly upload. In total, 660 claims of flood and 199 claims of drought are verified for the experiments. For these verified claims, we determine the accuracy of flood and drought detection using NDVI and NDWI from Sentinel-2A, CART classification on Sentinel-1 SAR GRD, and object-based scene recognition on mobile images. However, imaging gaps in geographical areas may occur due to transition time constraints during the measurement mode switch in Sentinel-1 SAR image [55] or maintenance activity leading to failed image collection. Some of the land plots are likely to reside in these imaging gaps. Due to the unavailability of Sentinel-1 images in such plots; we measure the accuracy using Equation (3).
Accuracy = Number of correct prediction Number of verified mobile images Number of failed image collection × 100
The second step performs field validation of the satellite-based methods of Sentinel-2A and Sentinel-1. We measure the damaged area of disaster-affected land plots by visiting the fields. The high-quality images of land plots are captured from an unmanned aerial vehicle (UAV) on the exact date of the disaster. Afterward, the QGIS [56] tool is used to measure the damaged area of each land plot. The affected area obtained from the UAV image and QGIS is used to validate the area coverage shown by the methods. The rate of difference in the proportion of area from the fields and the methods δ is calculated using Equation (4). The difference δ is subtracted from 100% to get the correctness (Equation (5)) of the methods against the field validation.
δ = Σ | P P 1 | Σ P × 100
Correctness = 100 δ
where P is the proportion of the disaster obtained from field measurements of an individual land plot, and P 1 is the proportion of the disaster obtained from our methods for an individual land plot. Σ | P 1 P 2 | is the sum of the absolute difference between P and P 1 for each land plot, and Σ P indicates the sum of the proportion of disasters from field measurements.

4. Results

The following sections present the results obtained from experiments separately for flood and drought events. We split the results obtained from flood detection and drought detection into three sections: NDVI and NDWI on Sentinel-2A, CART Classification on Sentinel-1 SAR GRD, and Scene Recognition on mobile images.

4.1. Flood Detection

4.1.1. Flood Detection from NDVI and NDWI on Sentinel-2A

Out of 660 verified claims reported for flood, we are able to collect Sentinel-2A images for 167 reports that are not affected by the clouds in the next five consecutive days from the day of the claim. We perform NDVI and NDWI calculations in each pixel of Sentinel-2A images for these 167 claims. Figure 4 shows a sample of a land plot in QGIS. The results are not instantaneous, and the near real-time verification is affected by Sentinel-2A’s revisit time of 5 days. Out of 167 images collected from Sentinel-2A for 167 flood claims, 100 and 84 claims are correctly verified using NDVI and NDWI, respectively. The experiment’s results are shown in Table 3. With less than 60% accuracy in verifying claims obtained from Sentinel-2A-based NDVI and NDWI, we further verify the same claims using Sentinel-1 SAR GRD images, as shown in the next section.

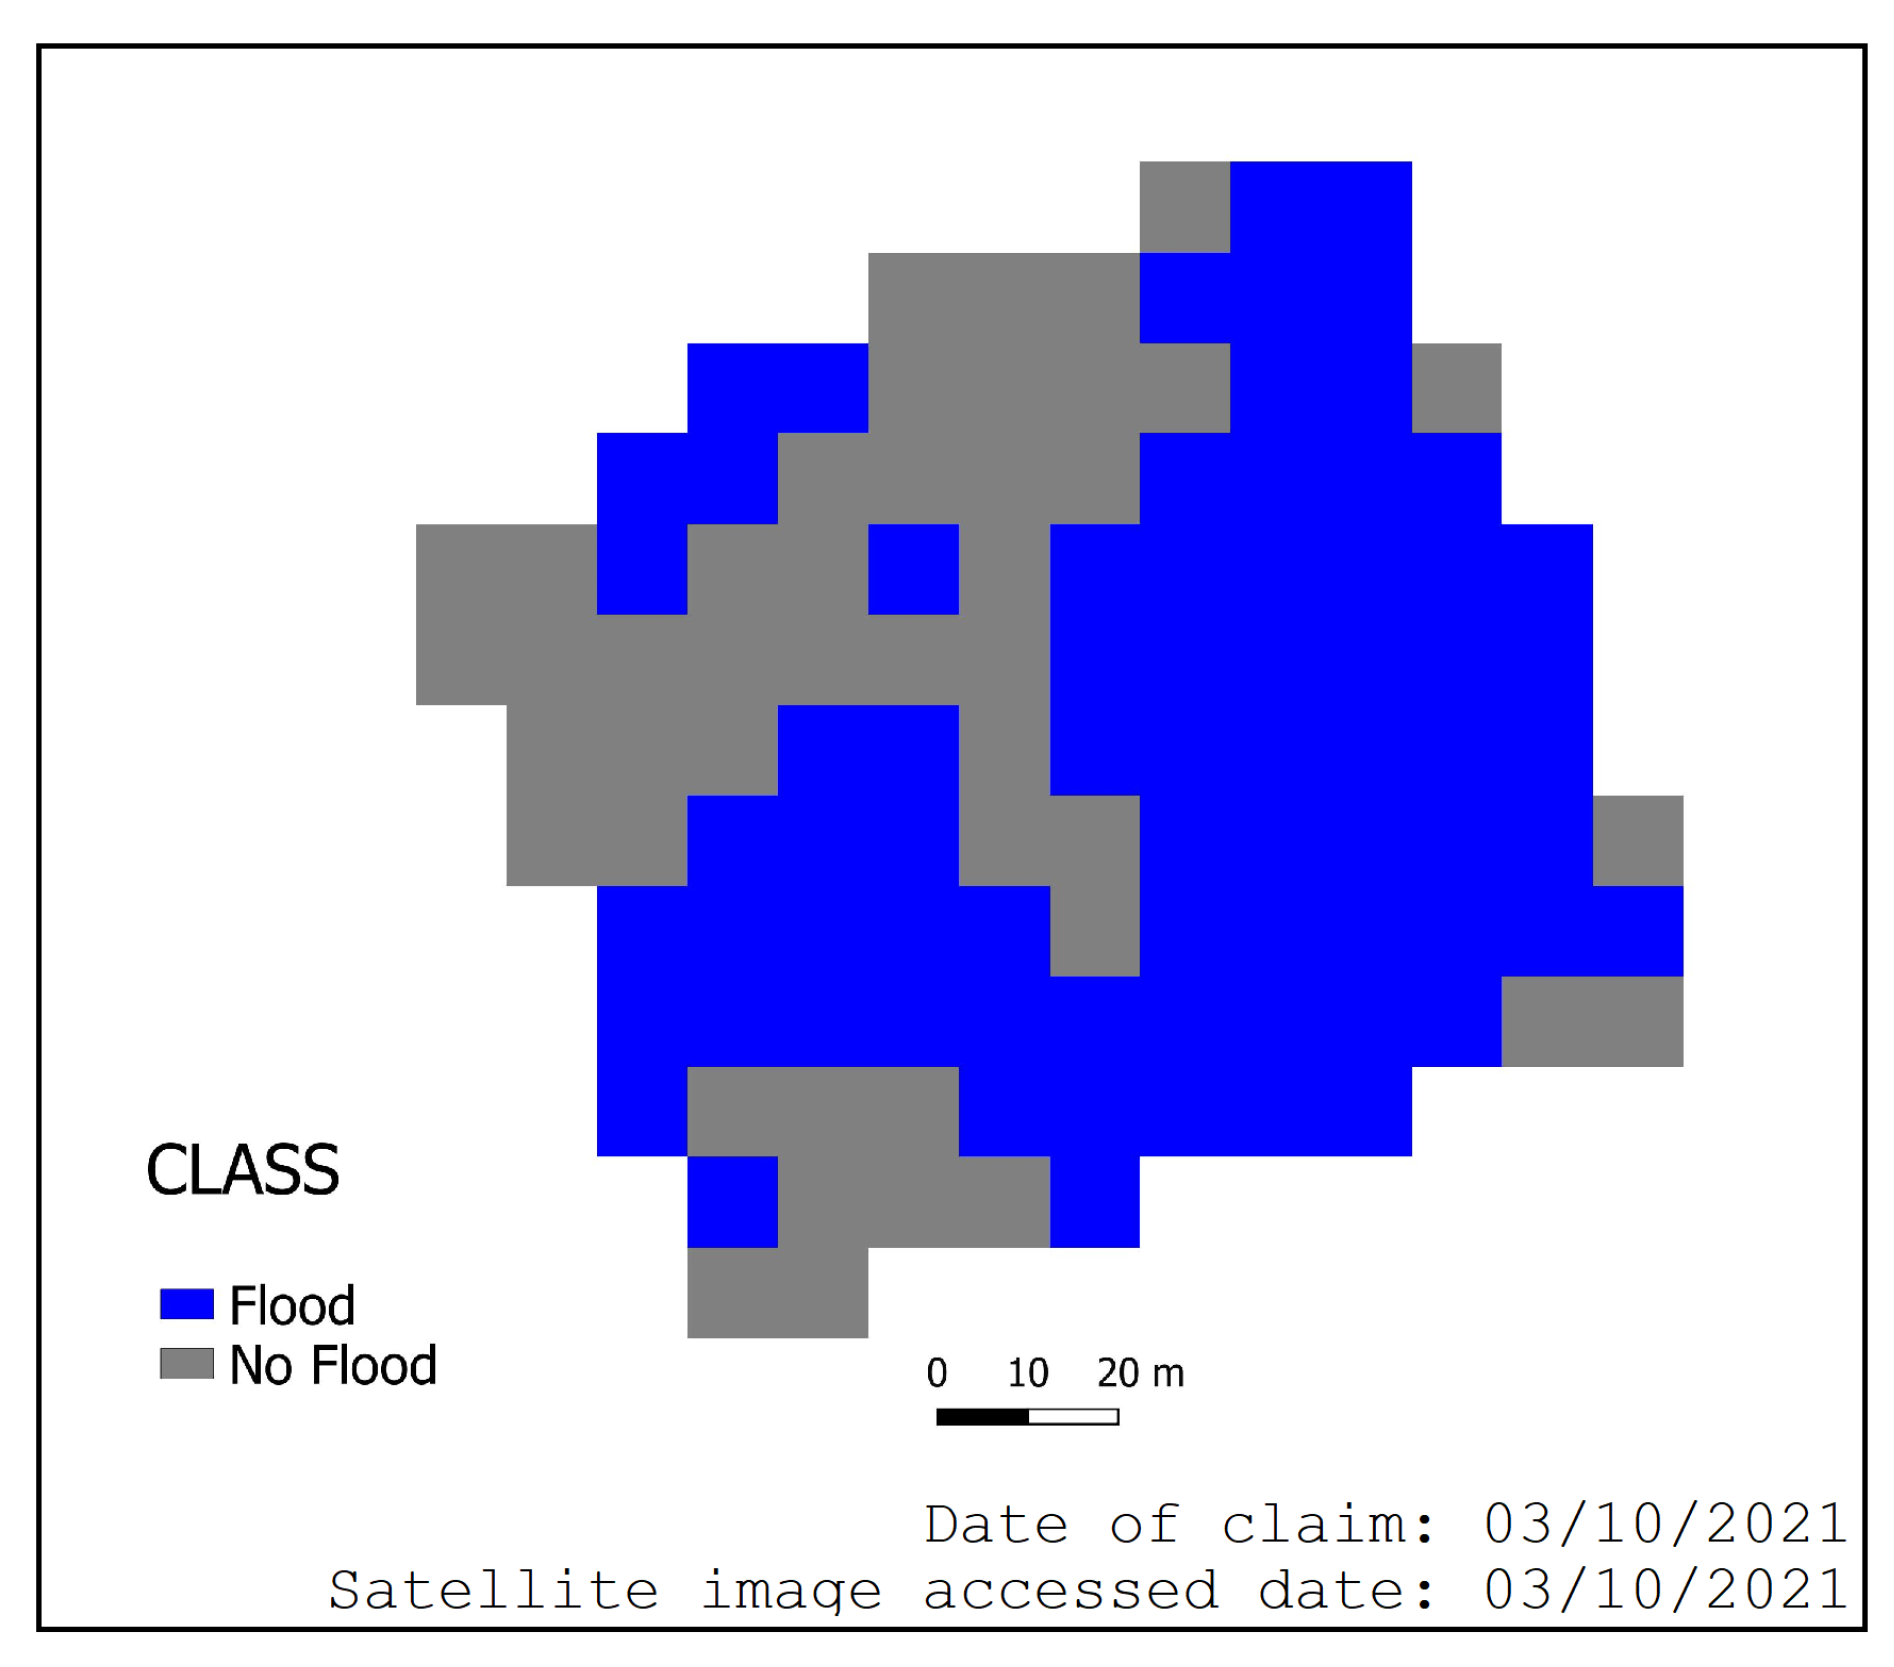
4.1.2. Flood Detection with CART Classification on Sentinel-1 SAR GRD

The same 167 claims from the previous experiment of Sentinel-2A are verified using Sentinel-1 SAR GRD images. Due to the data unavailability from the Sentinel-1B anomaly, we collect the SAR images within six consecutive days for the claims before 23 December 2022 and twelve days for the claims after 23 December 2022. Out of 167 images, our method could not find two images while filtering the images in IW mode with VV + VH polarization, leaving images for 165 claims. From the 165 claims, 164 show the presence of flood using CART. Figure 5 shows a sample plot re-produced in QGIS. With 99.39% detection of the flood, CART classification on Sentinel 1 SAR GRD outperforms the method of NDVI and NDWI on Sentinel 2A, as shown in Table 3.
Table 3. Accuracy assessment using verified mobile images of flood detection obtained from CART, NDVI and NDWI methods for land plots unaffected by cloud in Sentinel-2A images.
MethodsNumber of Flood ClaimsInaccessible Land PlotsCorrectly DetectedAccuracy
CART on Sentinel-1167216499.39%
NDVI on Sentinel-2A167-10059.88%
NDWI on Sentinel-2A167-8450.30%

4.1.3. Flood Detection Using Scene Recognition on Mobile Images

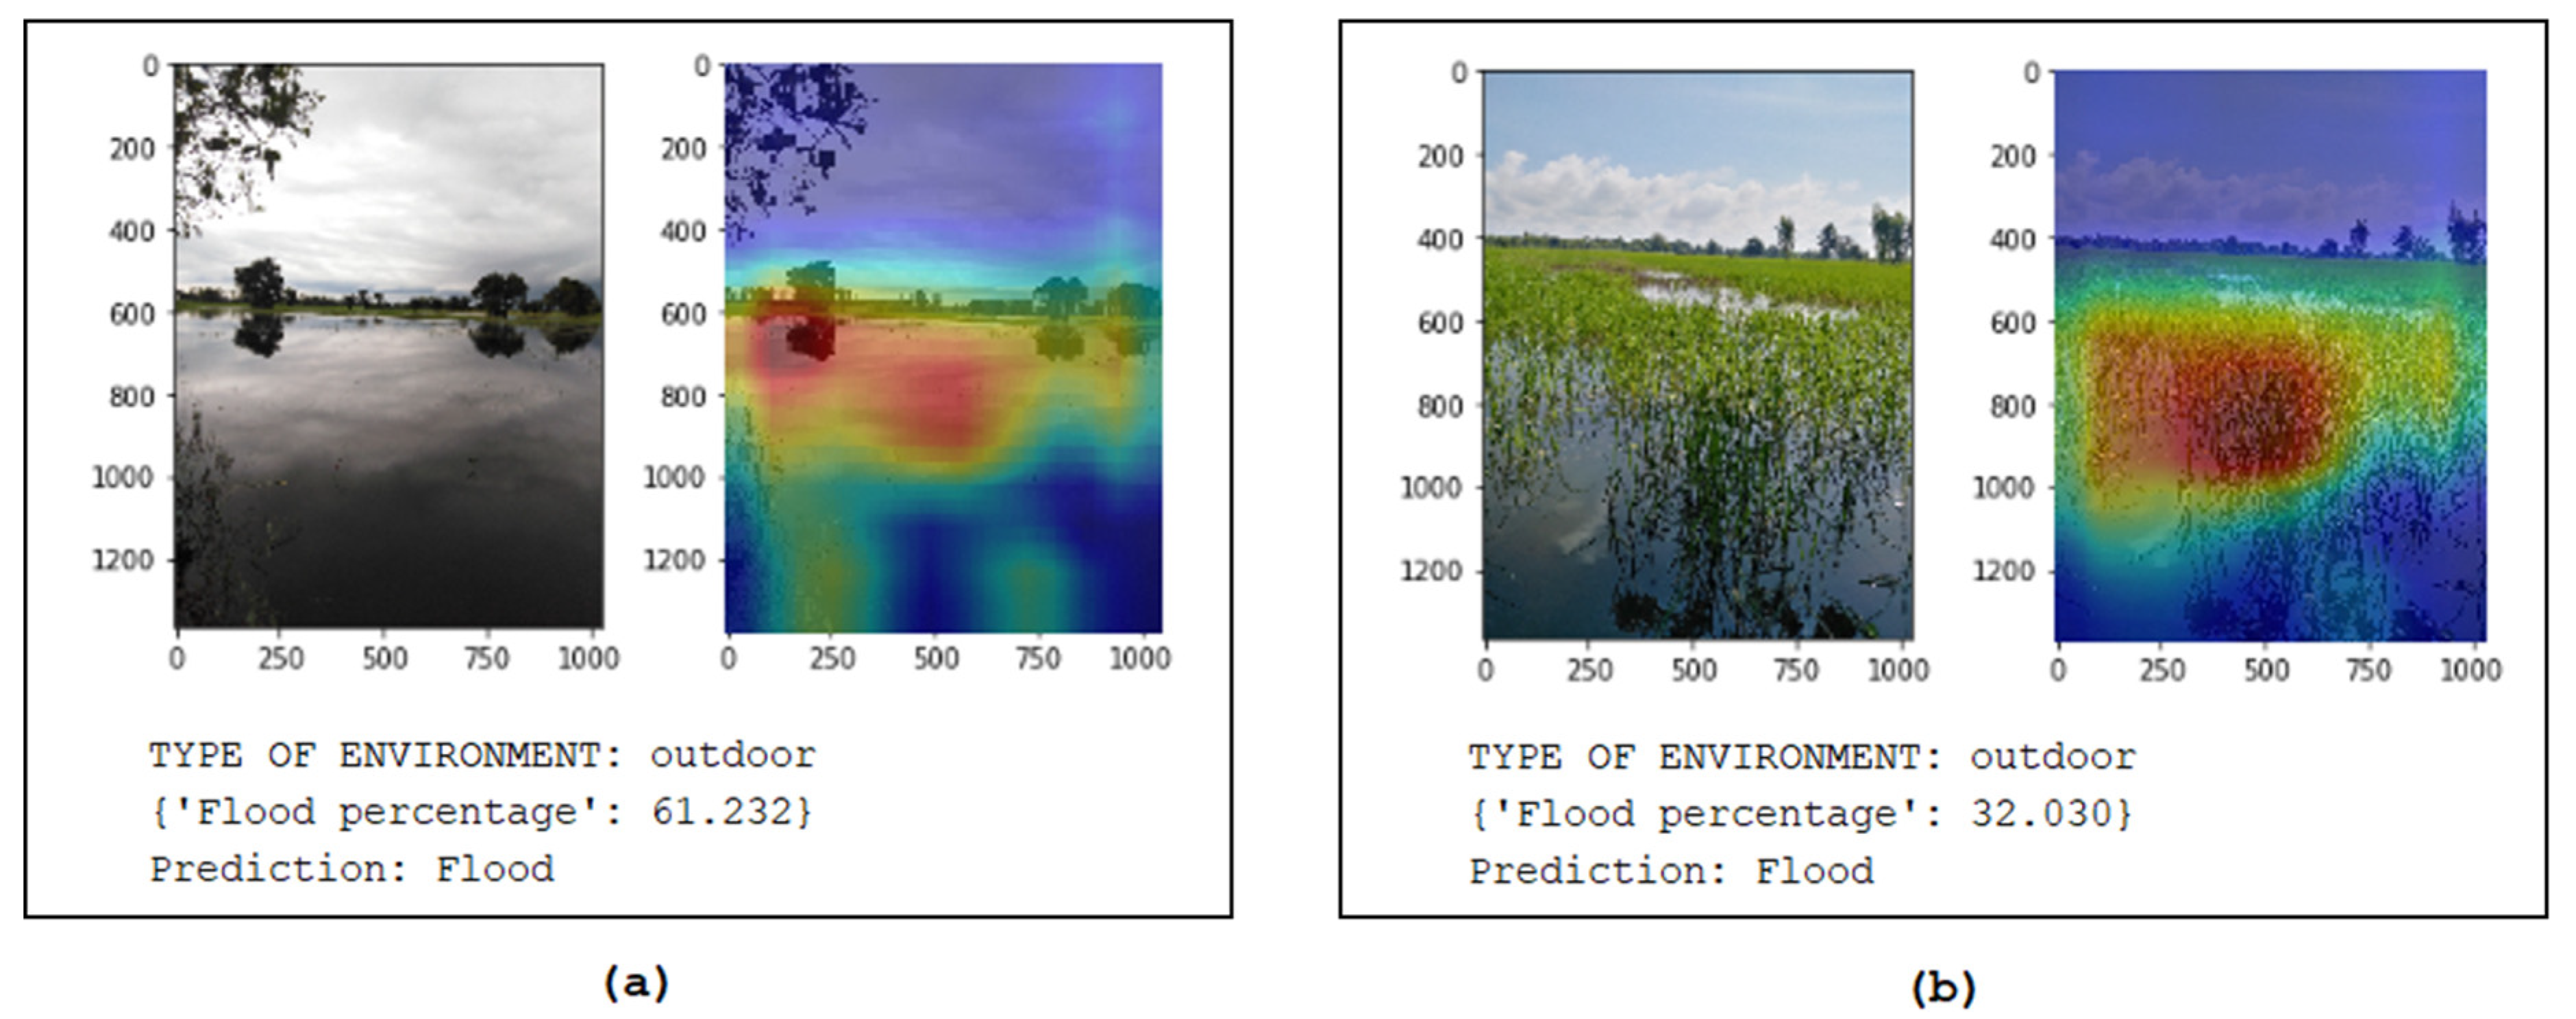
Out of 660 claims for flood, only 167 claims are verified using Sentinel-2A images due to cloud or cloud shadow effect. This gives a solid reason to incorporate the scene recognition method as one of three verification tiers of the claimed disasters. The method with PlacesCNN is used to validate the remaining 493 claims. From the experiments, 469 out of 493 claims are correctly predicted. Figure 6 presents the sample images and the output from the PlacesCNN for flood detection, along with the activation map used by the model to make the prediction. An activation map shows the activation of different parts of the image that are used to make predictions. As PlacesCNN predicts 365 classes, the red part of the map contributes to likely predictions, and the blue contributes to less likely predictions.
Table 4 shows the overall accuracy of flood detection on all land plots using a combination of the DL method on mobile images (for cloud-affected areas) and the method of NDVI and NDWI, and the overall accuracy obtained from the CART method on Sentinel-1 SAR GRD images. This includes a total of 660 flood claims reported by the farmers. Sentinel-1 fails to collect images for seven flood claims.
The inaccuracy of NDVI and NDWI from Sentinel-2A is propagated to their integration with a method of scene recognition on mobile images. Table 5 shows the difference in accuracy between the PlacesCNN method on mobile images and the CART classification on Sentinel-1 SAR GRD images for land plots affected by cloud cover areas without including Sentinel-2A product. In this scenario, the Sentinel-1 satellite lacks images in 5 flood-claimed locations. However, with accuracy, the CART method in Sentinel-1 SAR GRD images shows superiority with respect to PlacesCNN on mobile images. Nevertheless, scene recognition with PlacesCNN has adequate performance.

4.2. Drought Detection

4.2.1. Drought Detection from NDVI and NDWI on Sentinel-2A

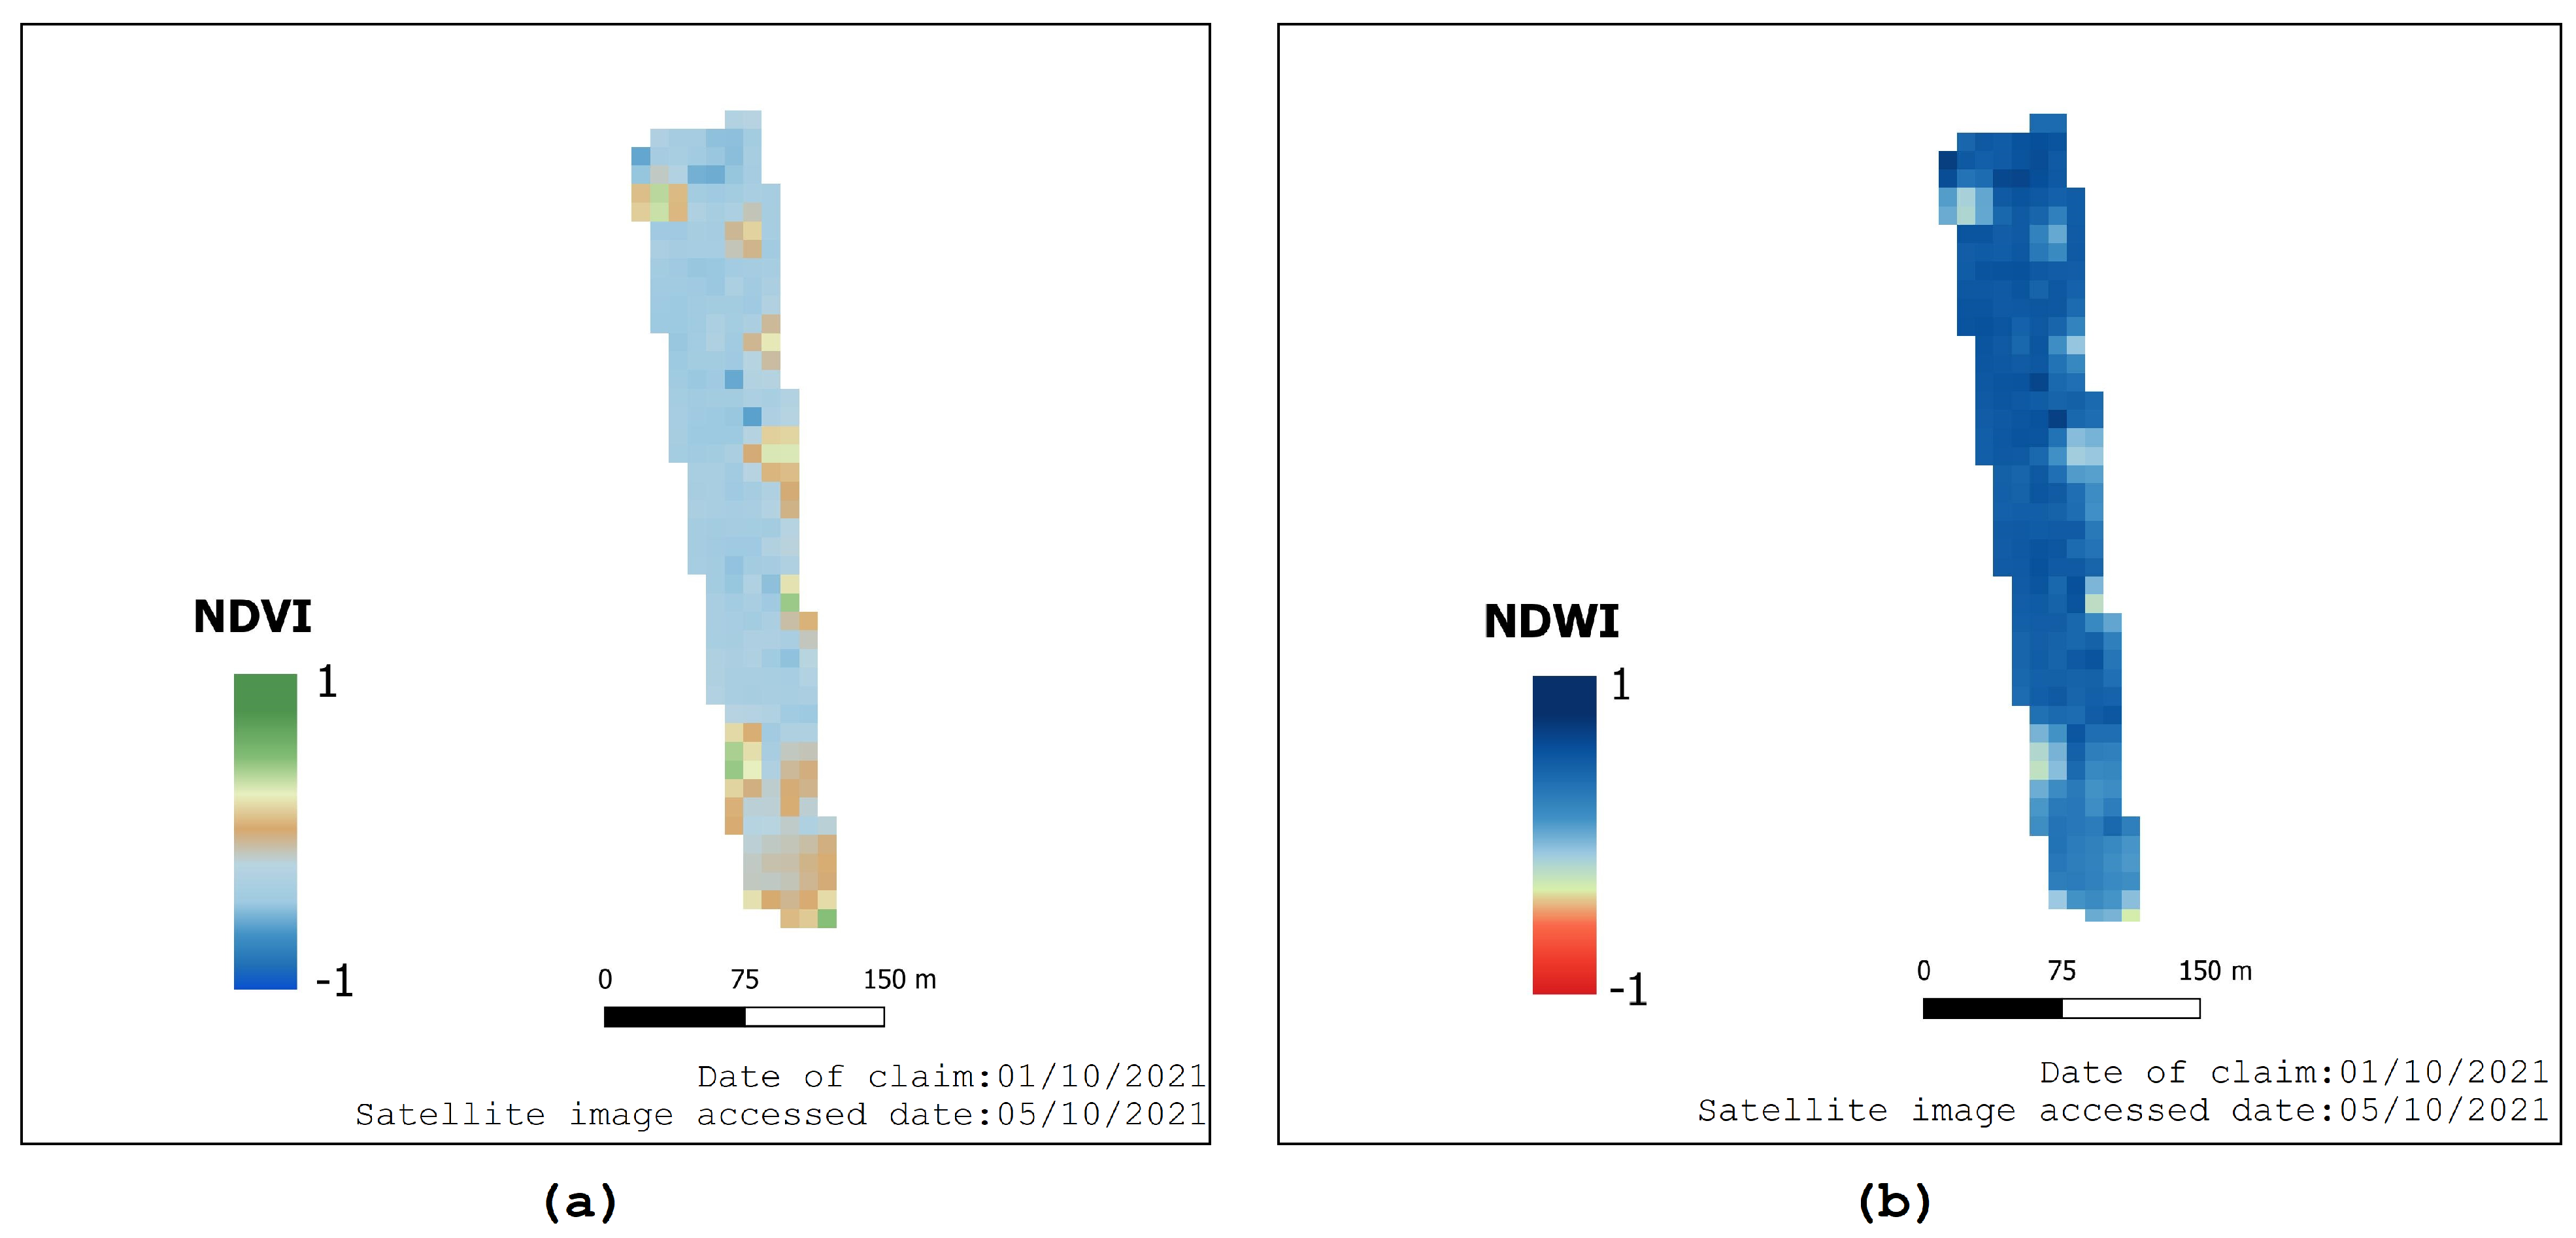
The process of drought detection is the same as flood detection. In a total of 199 verified drought-affected claims by farmers, only 49 are unaffected by cloud cover. Figure 7 presents a sample land plot to detect drought using NDVI and NDWI methods. Table 6 shows the accuracy of NDVI and NDWI on the land plots unaffected by clouds and their shadows. The experiments show 100% accuracy from NDWI and 89.89% accuracy from NDVI.

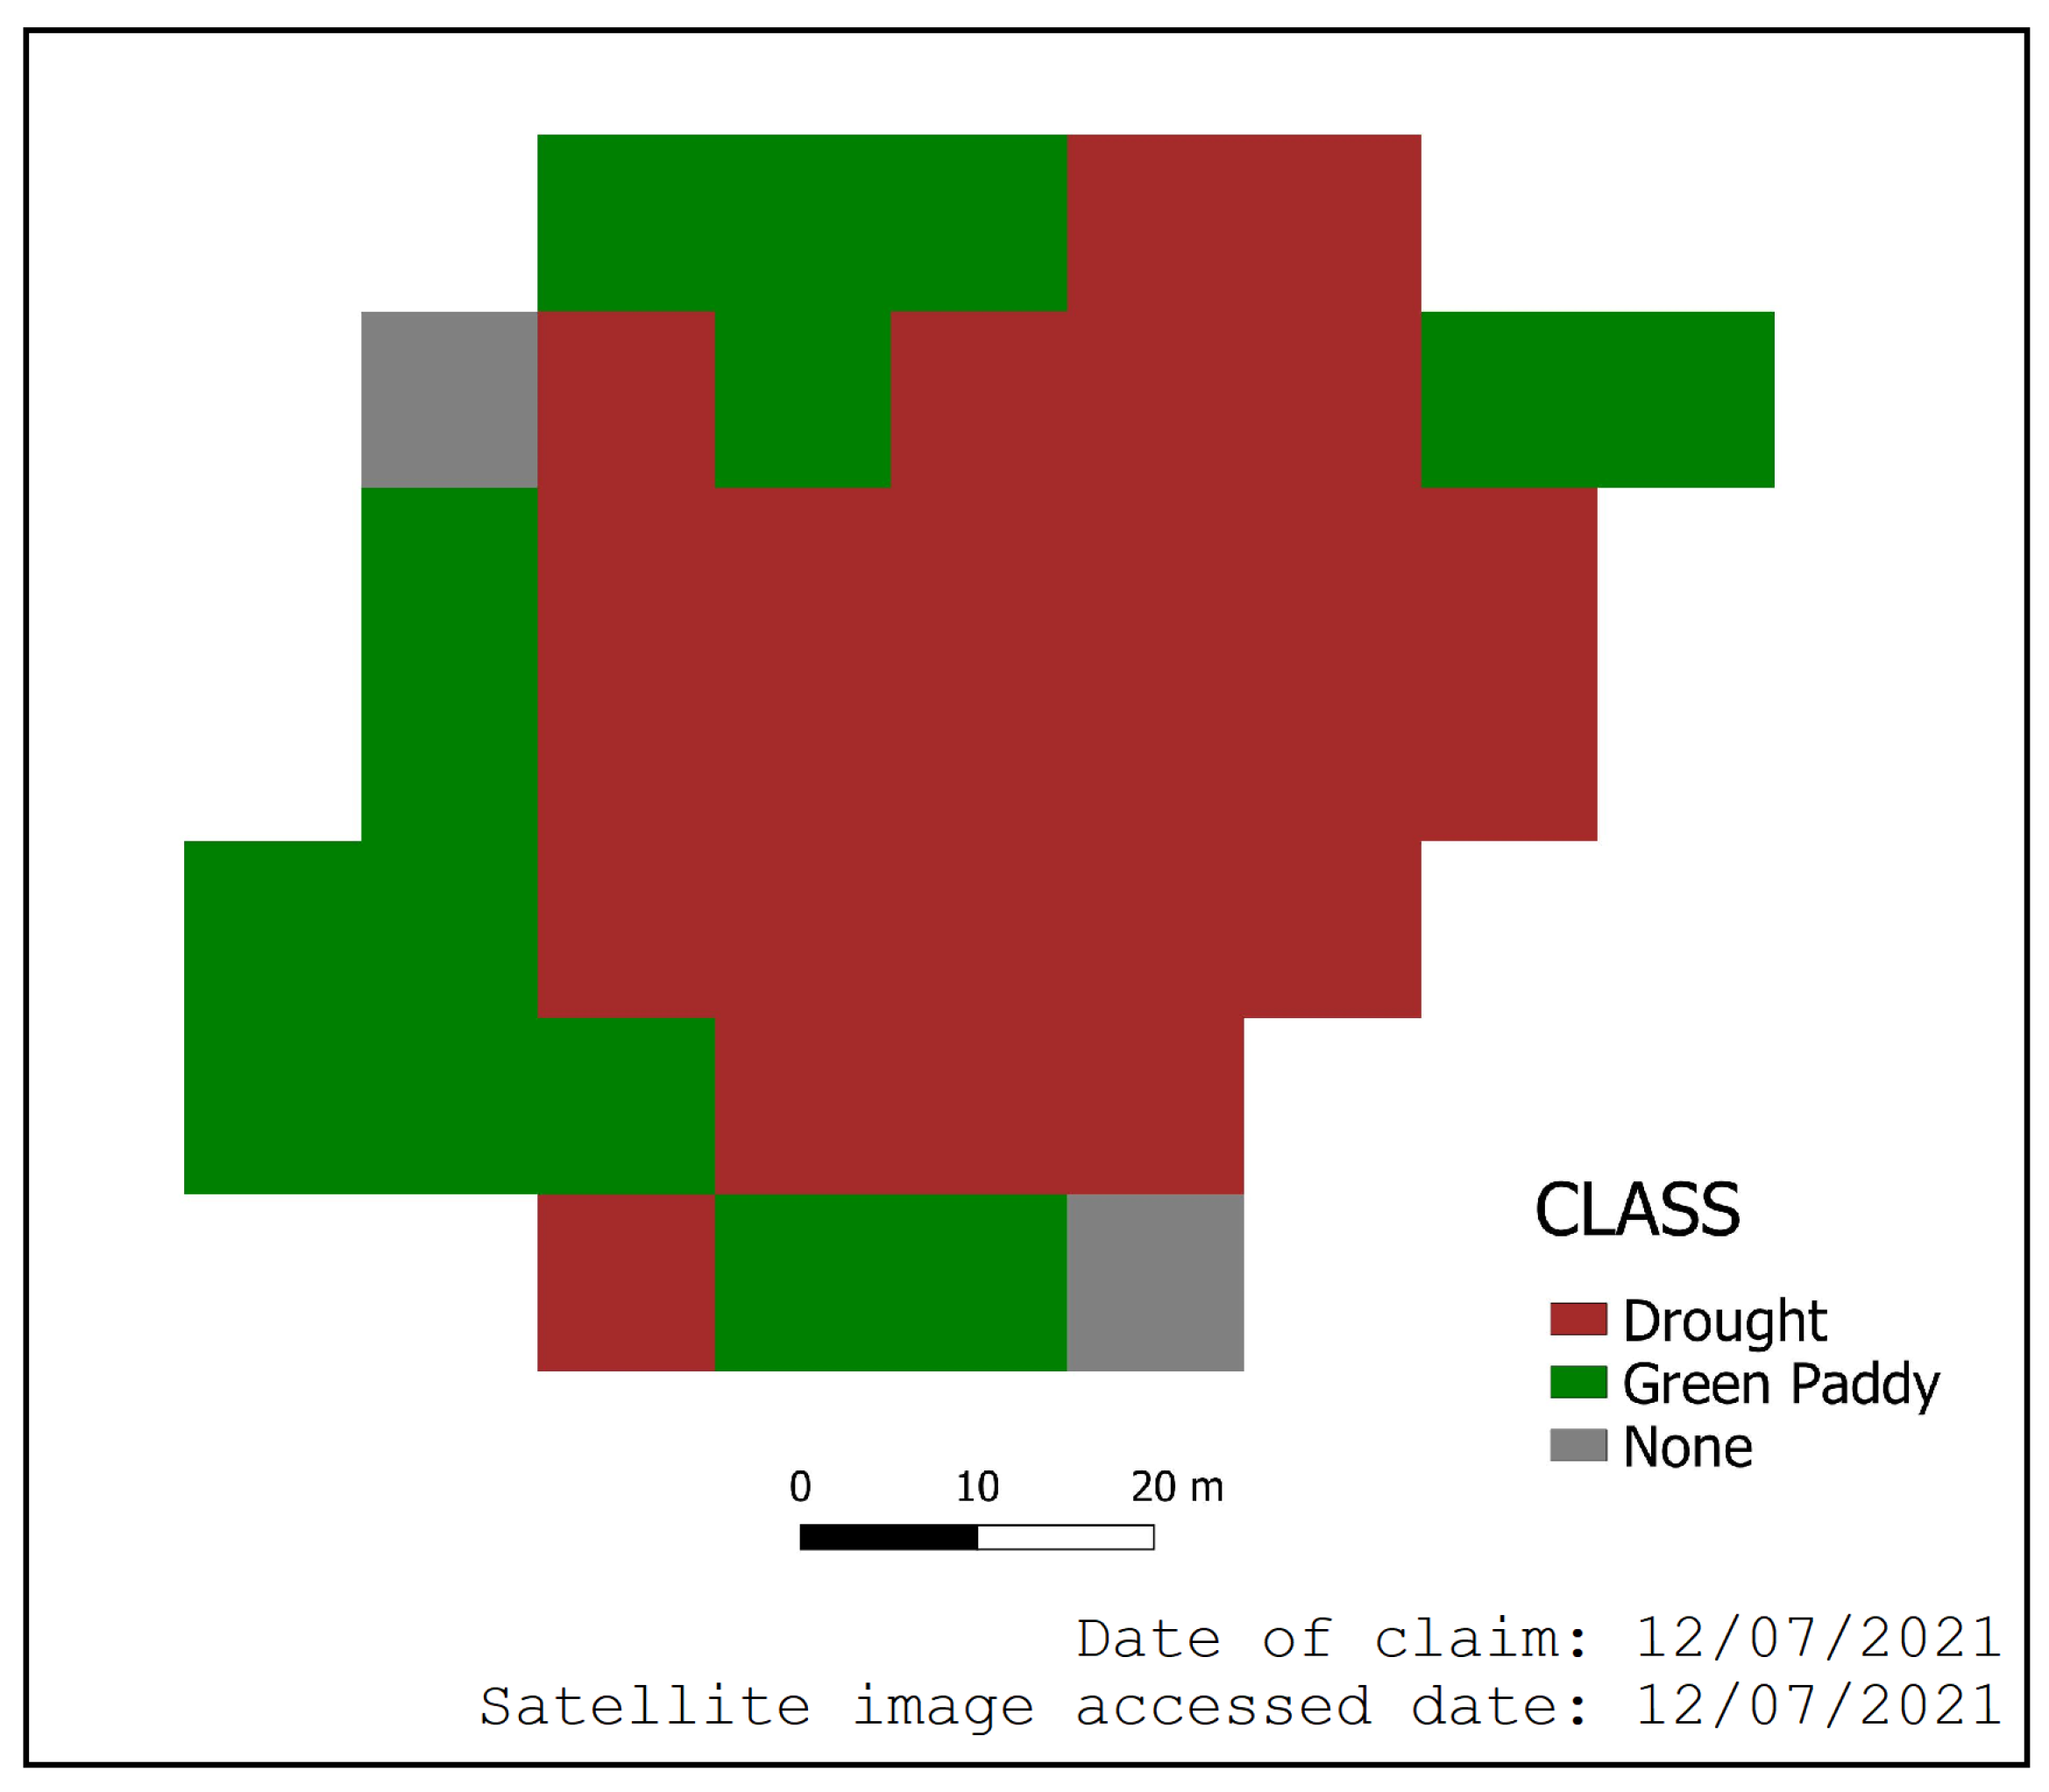
4.2.2. Drought Detection Using CART Classification on Sentinel-1 SAR GRD

The land plots not affected by clouds are experimented on Sentinel-1 SAR GRD images using the CART method under the same conditions used for flood detection. Then, we observe the difference in accuracy between NDVI and NDWI, as tabulated in Table 6. A classified sample plot is presented in Figure 8. Among 49 drought claims, CART classification could not perform for seven claims due to the unavailability of images. For the remaining 42 claims of drought, CART achieves 100% accuracy and stands along with the method of NDWI on Sentinel-2A with similar accuracy.

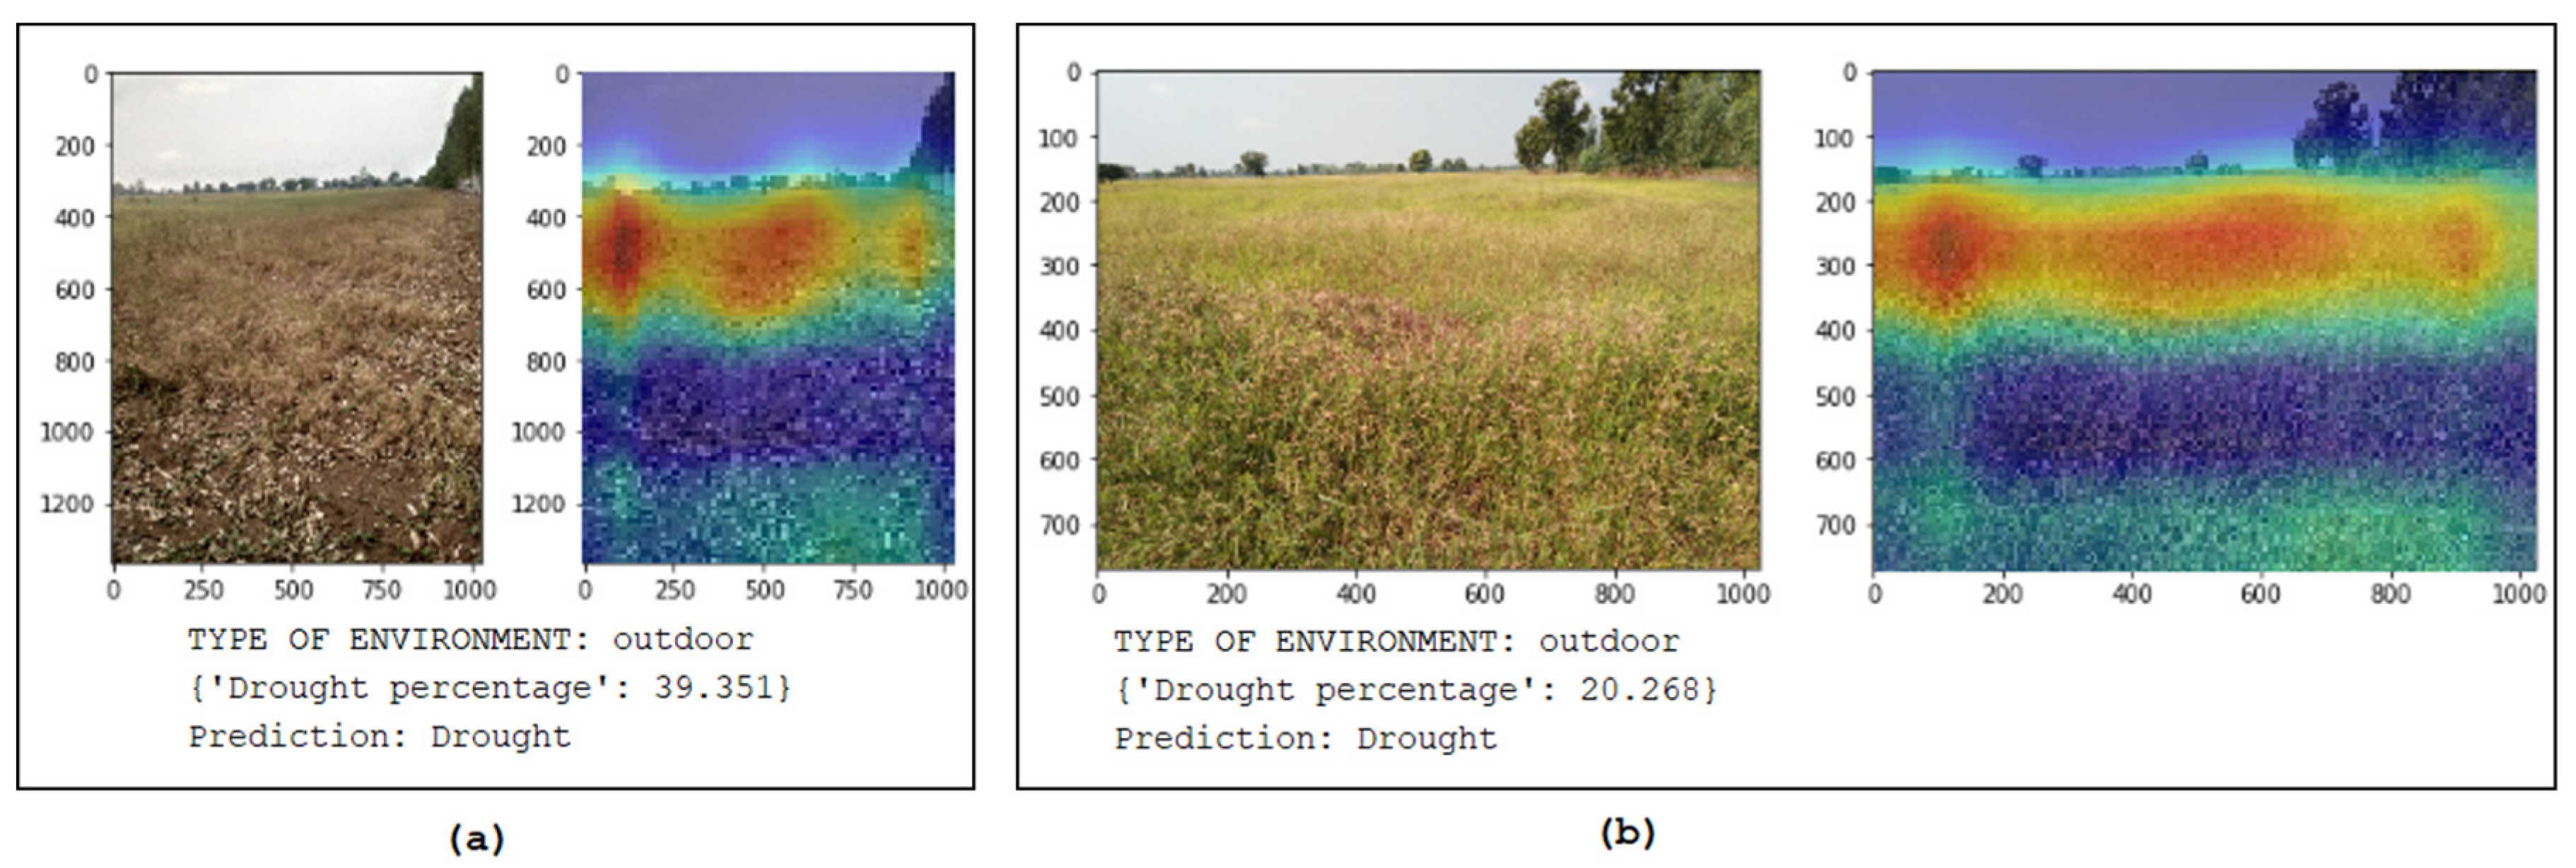
4.2.3. Drought Detection Using Scene Recognition on Mobile Images

We implement the PlacesCNN method on mobile images to predict drought; sample images are shown in Figure 9. Similar to the experiments for flood detection, we integrate the PlacesCNN method with the method of NDVI and NDWI to cover all land plots. Then, we observe the difference in accuracy with the CART method tallied in Table 7. Table 8 exhibits the accuracy of the PlacesCNN method and CART method for the land plots that are cloud affected in Sentinel-2A images. We also observe that some land plots with drought claim data cannot be gathered from Sentinel-1 SAR GRD images.

4.3. Field Verification for Flood and Drought Detection

In the second validation phase, we perform a field visit to validate our satellite-based methods to extract flood-affected areas. As the area of land affected by the disaster event cannot be verified on the mobile-based images, the field validation of area proportion is validated only for satellite-based methods. We validate the flood detection on seven land plots in the Nakhon Sawan province of Thailand. Similarly, we validate the drought area on four land plots in different locations in Thailand with the area proportion provided by the farmers. The number of ground samples is low because of the low occurrence of disaster events during the time of field validation.
Table 9 shows the area percentage of flood obtained from NDVI and NDWI on Sentinel-2A images and CART classification on Sentinel-1 SAR GRD images. NDVI and NDWI methods exhibit nearly accurate data for fully flooded parcels; however, Sentinel-2A images fail to detect flood for some of the land plots because of cloud cover over those land plots. CART classification accurately measures the area percentage for entirely flooded parcels, and the prediction for partially flooded plots is nearly similar in percentage. In the case of field ids 14007 and 14008, the flood event is one day prior to the actual flood event, indicating 0% flood on the day of the visit.
As only two of the plots are not affected by clouds, the correctness of the methods of NDVI, NDWI and CART in these plots is 99.97.%, 96.57%, and 100%, respectively. We compute the correctness for all land plots using the CART method, excluding field ids 14007 and 14008 as the field measurement is prior to the flood and satellite image acquisition day; we achieve the correctness of 90.88% and ( δ = 9.12%).
The validation of drought-affected areas of land plots is performed by collecting the area proportion of the disaster from the farmers themselves because of extremely low drought events and the remoteness of the claim location. The farmers provide the estimated damaged area in local Thai land measurement units (Rai, Ngan and Square Wah) (1 sq. wah = 4 sq. m, 1 ngan = 400 sq. m., 1 Rai = 1600 sq. m.). Four claims reported between 30 August and 19 September of 2022 could be validated for drought, as shown in Table 10. In addition to the challenge, Sentinel-2A could not provide images for validation for the next 15 days, and Sentinel-1 could only provide the images after 12-day intervals because of the unavailability of Sentinel-1B. We relate the correctness obtained from our method to the farmer’s claim for drought area and observe the correctness of 90.63% and ( δ = 9.35%).

5. Discussion

5.1. Predicted Flood and Drought Distribution from Satellite Images

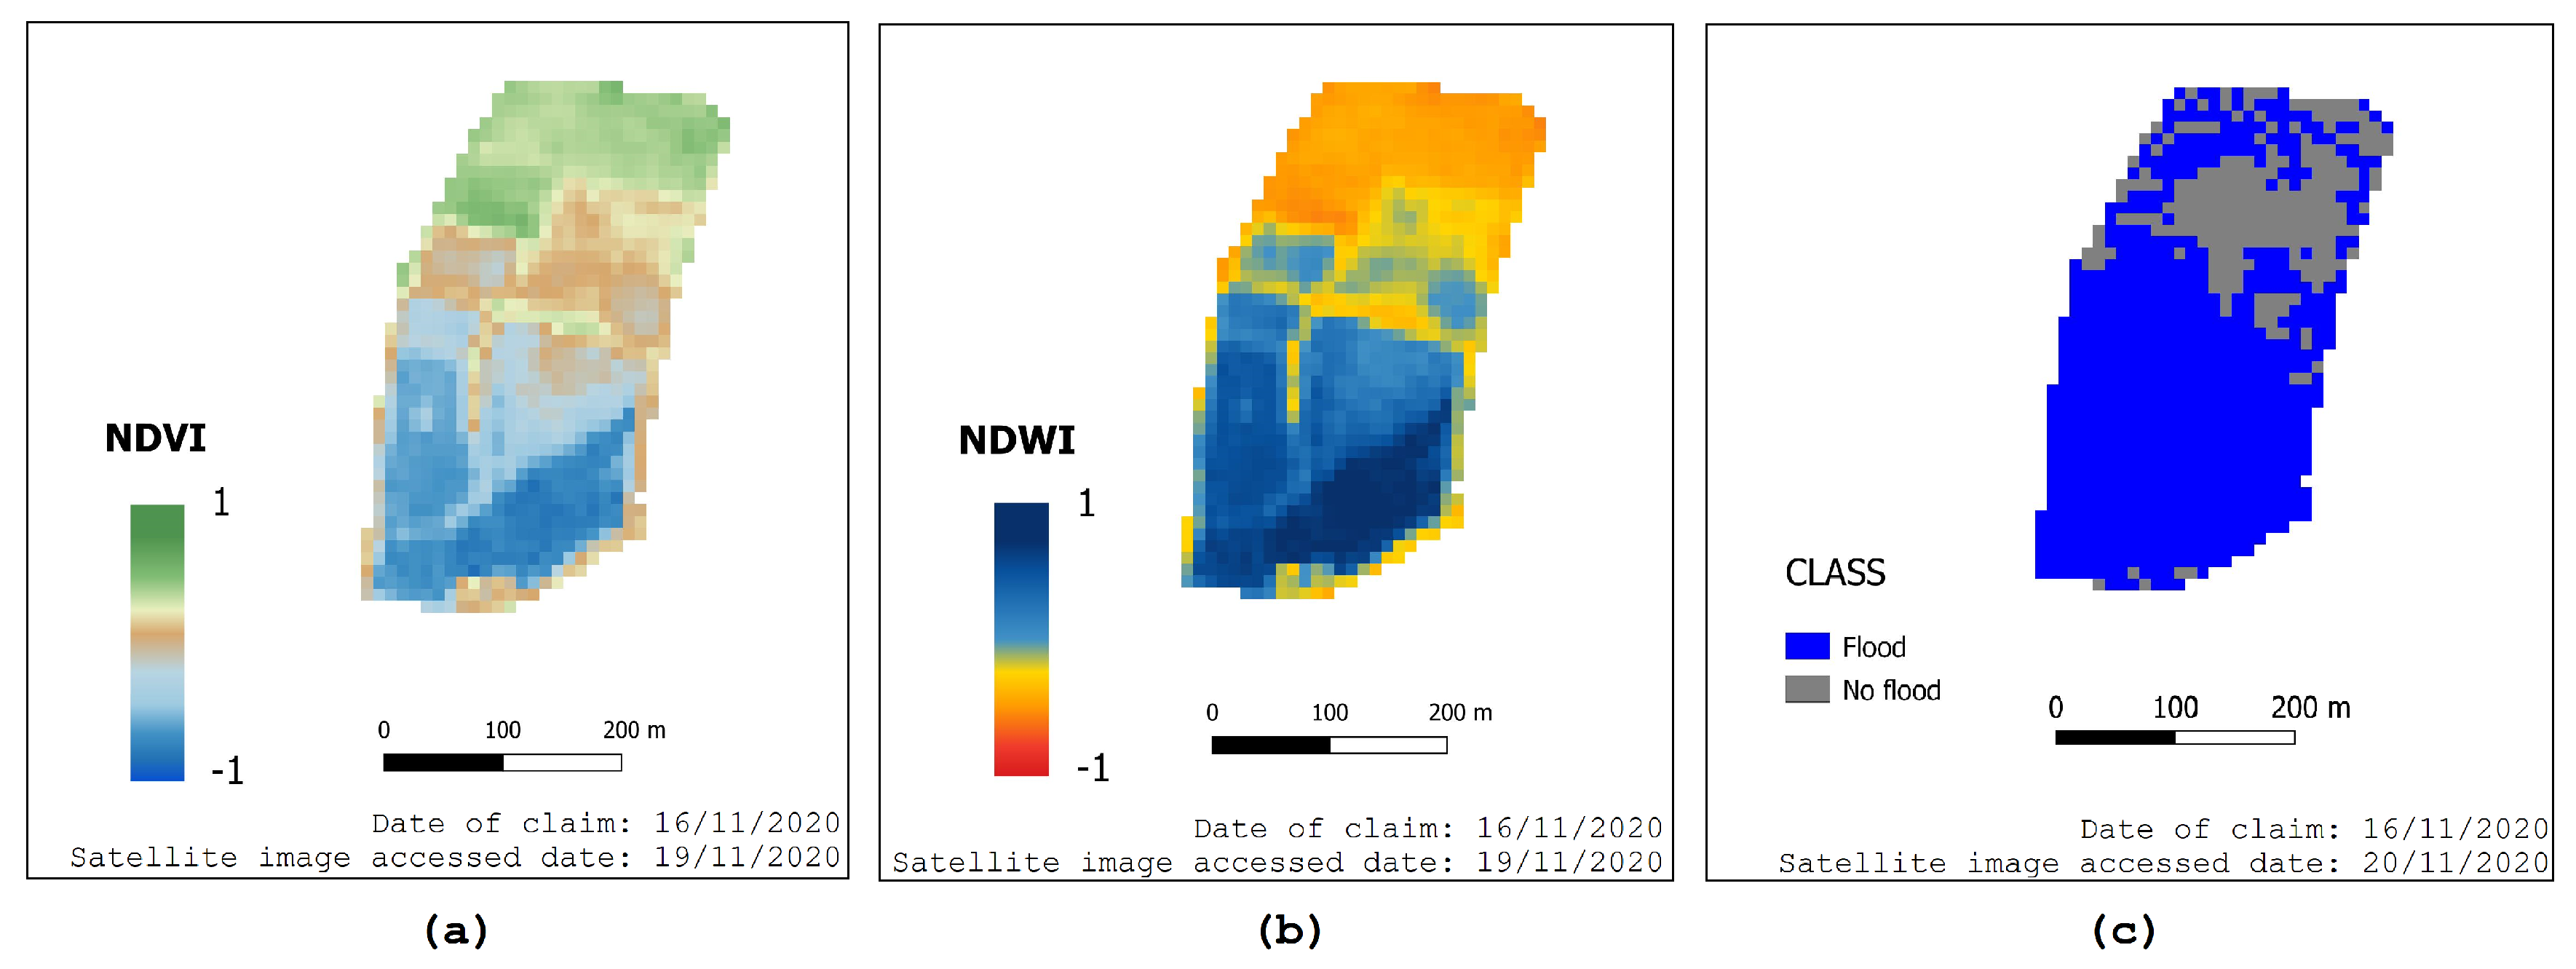
From the two-step validations performed, we comprehend that our methods are suitable for detecting flood and drought as well as measuring the area percentage of land plots affected by the disasters. In this section, we show the distribution of disasters on the land plots as predicted by the three methods based on satellite images. A sample of the three methods—NDVI and NDWI on Sentinel-2A and CART on Sentinel-1 SAR GRD—on a land plot is shown in Figure 10. The flood/water distribution is nearly the same on NDVI and NDWI, as both indices use the same satellite image. CART on Sentinel-1 exhibits a similar distribution as well. A similar property is seen in the case of drought detection, as seen in 
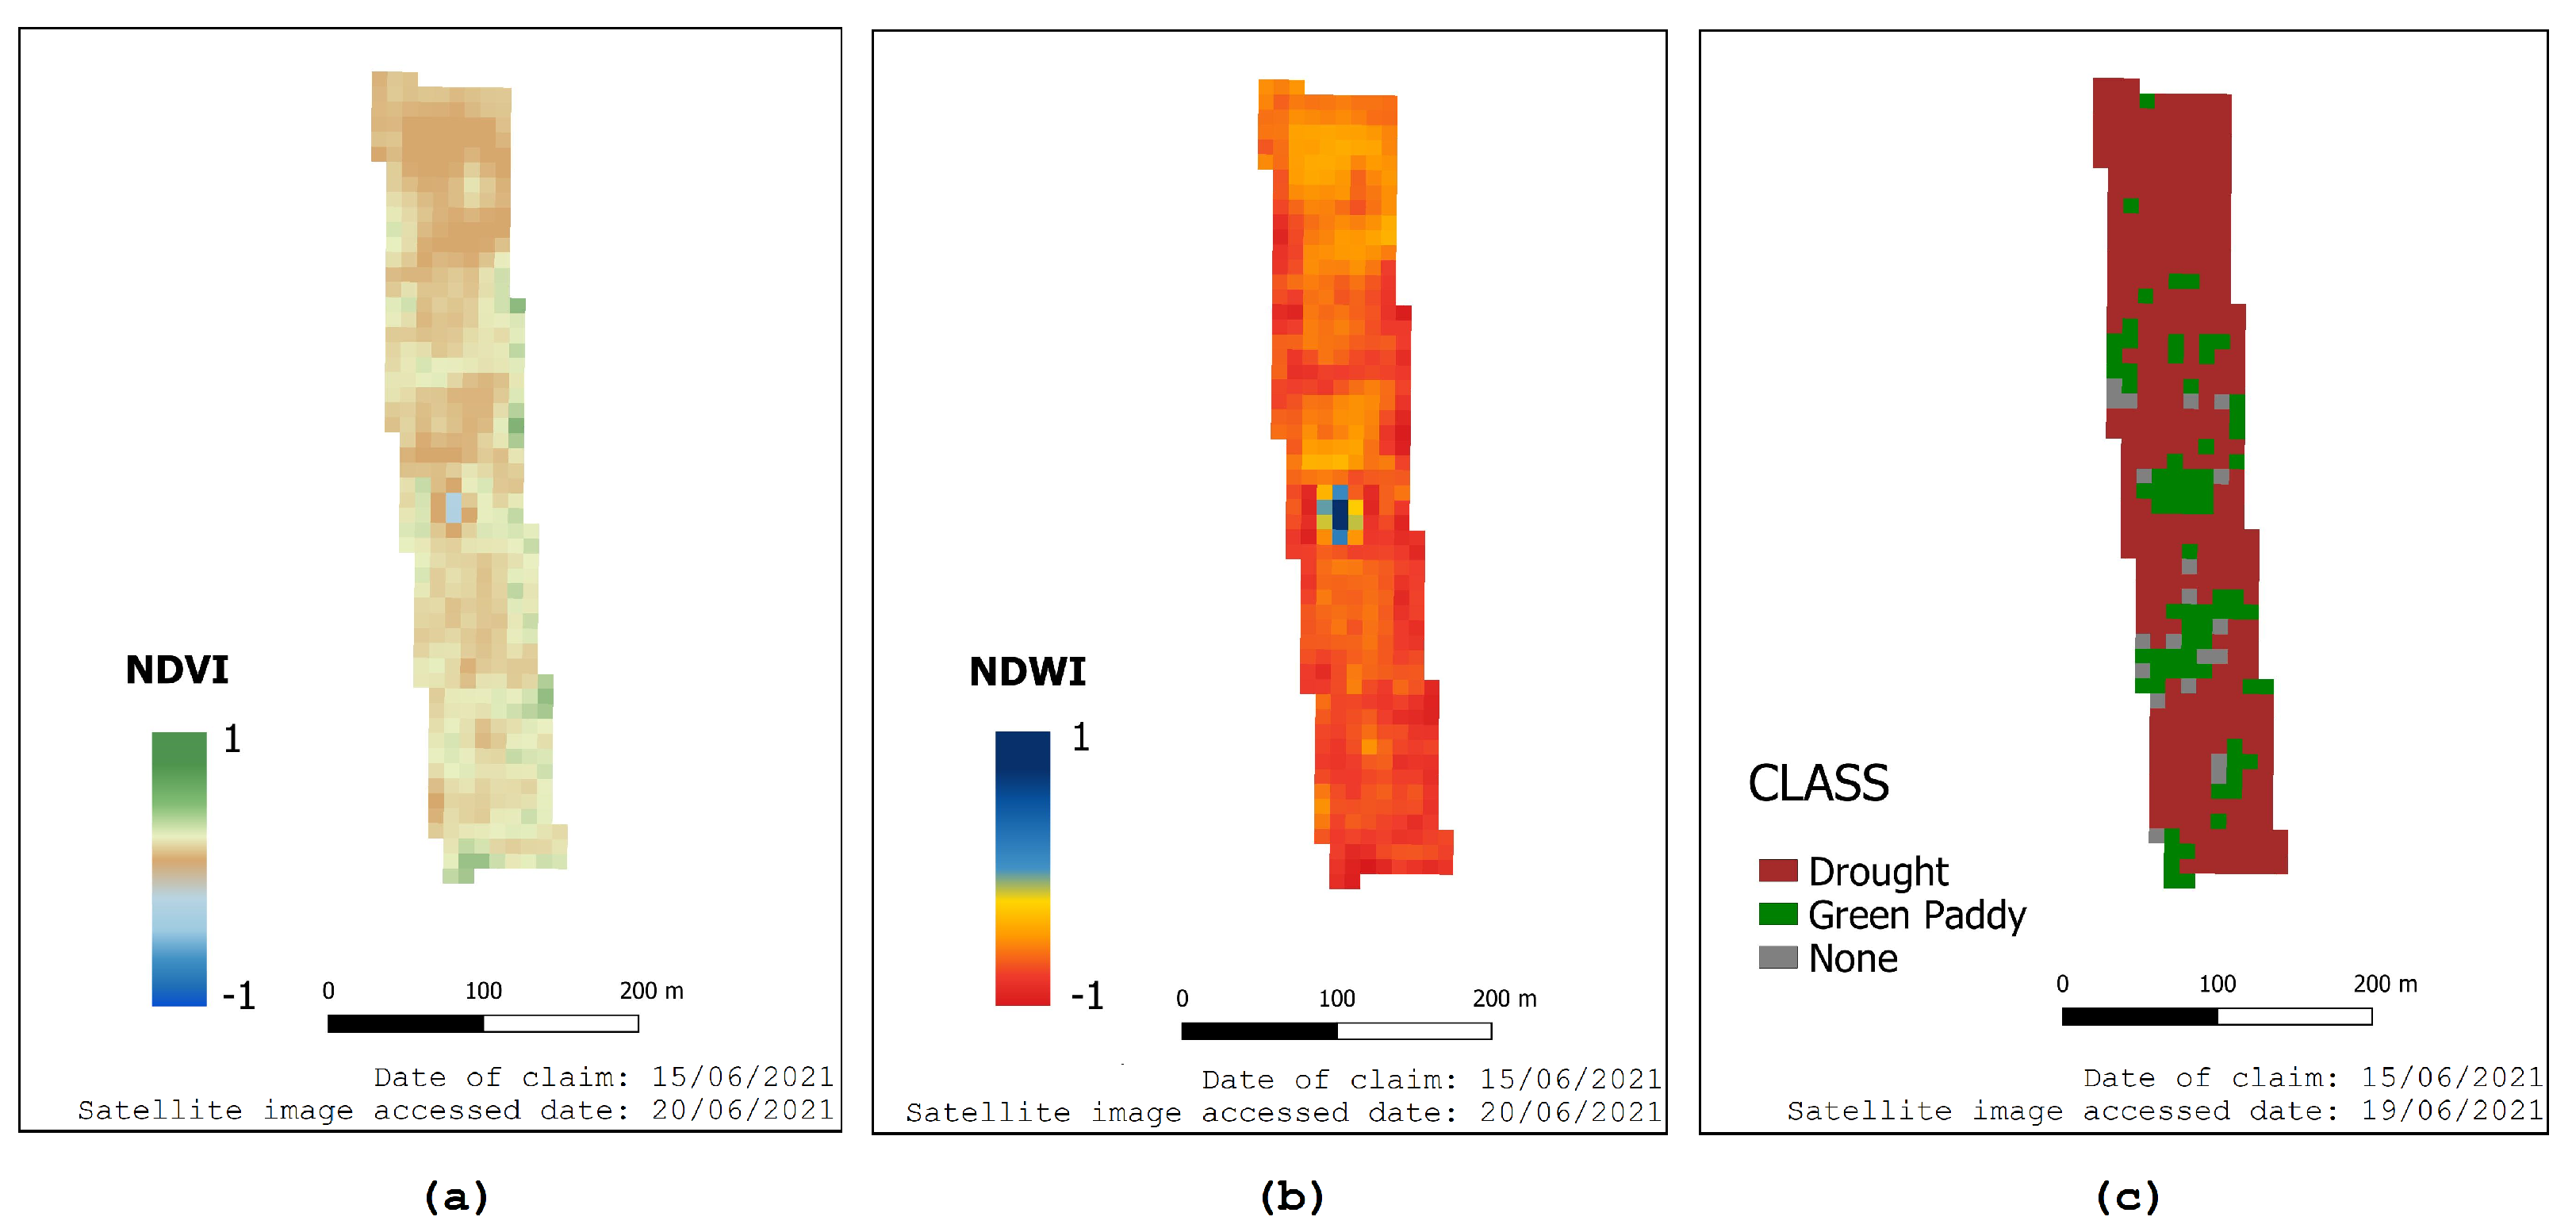
Figure 11. Most of the land plot is affected by drought in the sample according to all three methods. This observation signifies that all three methods are precise in seeing the distribution of flood and drought.
Despite the precision of the methods to visualize the distribution of disasters on the land plots, it is not necessary that all methods always detect disasters. Therefore, in the following sections, we compare the accuracy of all methods and discuss their limitations during real-world implementation in terms of accuracy, data acquisition and coverage area of the plots.

5.2. Findings from the Experiments

This section compares the accuracy of each method we implement from the results obtained in Section 4. For the land plots unaffected by either cloud or cloud shadows in Sentinel-2A images, we carry out NDVI and NDWI methods. Studies [14,57] claim that NIR, and green and red bands derived from spectral indices, such as NDVI and NDWI, are appropriate for wetland detection. These two indices also have a strong relationship with drought conditions [58]. From our experiments, NDVI outperforms NDWI for flood detection (59.88% vs. 50.30% accuracy), but NDWI transcends NDVI for drought detection (100% vs. 89.80% accuracy). Both methods fail in flood detection and perform exceptionally well in drought detection. Such disparity is not seen in CART classification on Sentinel-1 SAR GRD, as the detections are high for both flood (99.39%) and drought (100%).
The DL method of PlaceCNN to detect flood and drought on mobile images is an object-based scene recognition method. The method is more efficient than the state-of-the-art pixel-based semantic segmentation using a DL network called DeepLabv3+ [23]. The use of a pre-trained ResNet-18 as the CNN in PlacesCNN further reduces the computational expense and complexity compared to DeepLabv3+. The comparison of PlacesCNN and DeepLabv3+ is shown in Table 11.
The method of PlacesCNN on mobile images combined with the NDVI method achieves an accuracy of 86.21% for flood detection, while this combination contributes less than 73.40% for drought detection. In the case of the PlacesCNN and NDWI composite, flood detection accuracy is 83.79% and 81.91% for drought detection. In either combination, flood is detected better than drought. However, this composite is inadequate in terms of accuracy compared with the CART method on Sentinel-1 SAR GRD images, which has 98.77% and 99.44% accuracy during flood and drought detection, respectively. Unlike the composite of PlacesCNN with both NDVI and NDWI, the difference in accuracy for the two disaster detections is insignificant. To make the comparison fair, we also compare the PlacesCNN method on mobile images and the CART method on Sentinel-1 SAR GRD images. In both flood and drought detection scenarios, the CART method performs better. However, the difference is narrow (98.57% vs. 95.13%) for flood detection while significant (99.26% vs. 76%) for drought detection. The results indicate the PlacesCNN method lacks during drought detection.
All experiments show that the CART method on Sentinel-1 SAR GRD is superior in terms of accuracy and complexity. However, other ML methods on Sentinel-1 SAR GRD images may not perform up to the standard of the CART method or possibly overperform. Thus, it is necessary to investigate other ML methods.

5.3. Performance of Other ML Methods on Sentinel-1 SAR GRD Images

The exploration of ML on Sentinel-1 SAR images on flood and drought detection is limited to CART, SVM and RF in previous experiments [44,45]. We compare the CART method with SVM and RF in terms of accuracy and correctness, illustrated in Table 12, from the same dataset for flood and drought. Besides RF performing better in flood detection than CART and SVM, CART shows superiority in drought detection and correctness compared to field measurements. Despite CART’s superiority and consistency, the use of Sentinel-1 SAR GRD is not free of limitations. The limitations of our methods are discussed in the next section.

5.4. Limitations

Clouds not being the challenge for the methods of CART on Sentinel-1 SAR GRD images, our experiments are still affected by the unavailability of images. Both polarization of VV and VH are not available for all parts of the Earth. The images of IW mode with VV + VH polarization that we use in our experiments are not available in all locations at all times. Our experiments show that images are missing for 28 out of 851 locations, which is disadvantageous and does hinder the reliability of the method. The method of scene recognition on mobile images has two limitations: (i) the inability of the farmers to upload correct photographs with the required angle of view and (ii) the calculation of the area proportion of land affected by the disaster. The junk photographs, such as personal photographs and indoor images, are filtered using PlacesCNN itself as it can already classify such images. However, the field of view can still affect the prediction of the correct disaster. Despite the limitations, all methods and their combinations could significantly automate the process of validating the claims, reducing the costs. The key strength of our methods and experiments are highlighted in the next section.

5.5. Key Strength of our Experiments

As suggested by our experiments, the performance of NDVI and NDWI on Sentinel-2A’s optical images lacks robustness in terms of accuracy to support the decision processes of government agencies and insurance companies. The inaccuracy is further aggravated by cloud coverage. On the other hand, the CART method is not affected by cloud and performs adequately for flood and drought detection. In addition, the CART method on Sentinel-1 SAR GRD images provides a precise percentage of the disaster-affected region claimed by the farmers at the parcel level. However, the imaging gaps in Sentinel-1 SAR images narrowly affect the information collection from some of the land plots, which cannot be neglected. In the case of the unavailability of images from Sentinel-1 and Sentinel-2 (cloud coverage), the mobile-based method is an alternative. The performance of the CNN-based method on mobile images is significant enough to implement in such cases. To summarize, SAR is the most accurate method to detect disasters and calculate damaged area, but the mobile-based method is the best alternative during the unavailability of images. The overall method is cost-effective and replaces the manual inspection required to validate the claims. The experiments carried out are also robust as the flood and drought claims are distributed all over Thailand.

6. Conclusions

This research investigates several approaches to automate verifying farmers’ claims of their loss from flood and drought disasters. Three remote sensing methods and one mobile sensing method are investigated along with their combinations to solve the prominent problems of remote sensing. The four diverse methods include NDVI and NDWI on Sentinel-2A images, CART classification on Sentinel-1 SAR GRD images and PlacesCNN on mobile photos. The methods of NDVI and NDWI on optical images of Sentinel-2A is highly disturbed by the effects of cloud and their shadows. A combination of remote-sensing and mobile-sensing methods of NDVI+PlaceCNN and NDWI+PlacesCNN overcomes the problem of clouds. NDVI+PlaceCNN and NDWI+PlacesCNN achieve up to 86.21% and 83.79% accuracy in flood detection and 73.40% and 81.91% in drought detection. Unlike the optical sensors of Sentinel-2A, Sentinel-1 SAR images are unaffected by the clouds because of their longer wavelengths. CART classification on the SAR achieves an accuracy of 98.77% and 99.44% for flood and drought detection, respectively. In addition to detecting flood and drought, the area proportion of the affected lands could also be measured from the remote-sensing data. The experiments show similar observations in measuring the area proportions using the three remote-sensing methods. The experiments demonstrate the superiority of the CART method on SAR in terms of accuracy, data acquisition, cloud disturbance and measuring the area proportion of the affected land. Despite the performance, the reliability of the SAR-based method is still affected by the unavailability of data. In the case where the remote-sensing data are disturbed by clouds or unavailable, the mobile-sensing method provides the best alternative to verify and validate the claims while trading off the measurement of the area affected by the disasters.

Author Contributions

Conceptualization, A.T., T.H. and B.N.; methodology, A.T.; software, A.T.; validation, A.T. and T.H.; formal analysis, A.T.; investigation, A.T.; resources, T.H.; data curation, A.T.; writing—original draft preparation, A.T.; writing—review and editing, A.T. and B.N.; visualization, A.T.; supervision, T.H. and B.N.; project administration, T.H.; funding acquisition, T.H. All authors have read and agreed to the published version of the manuscript.

Funding

This research was partially funded by the Thammasat University Research Fund under the TSRI, Contract No. TUFF19/2564 and TUFF24/2565, for the project of “AI Ready City Networking in RUN”, based on the RUN Digital Cluster collaboration scheme.

Institutional Review Board Statement

Not applicable.

Informed Consent Statement

This work did not use any personal information of the farmers on a cloud platform. The information that is used are polygons submitted by the farmers and date of disaster.

Data Availability Statement

Not applicable.

Acknowledgments

The authors would like to thank Infuse Company Limited for providing the dataset and technical support on our research work.

Conflicts of Interest

The authors declare no conflict of interest.

References

  1. Rice Sector at a Glance. Available online: https://www.ers.usda.gov/topics/crops/rice/rice-sector-at-a-glance/ (accessed on 24 September 2022).
  2. Disasters to Hit Rice Output. Available online: https://www.bangkokpost.com/business/1789579/disasters-to-hit-rice-output (accessed on 24 September 2022).
  3. Copernicus Open Access Hub. Available online: https://scihub.copernicus.eu/ (accessed on 23 August 2022).
  4. Google Earth Engine. Available online: https://earthengine.google.com/ (accessed on 23 August 2022).
  5. EarthExplorer. Available online: https://earthexplorer.usgs.gov/ (accessed on 23 August 2022).
  6. EO Browser. Available online: https://apps.sentinel-hub.com/eo-browser/ (accessed on 23 August 2022).
  7. Gorelick, N.; Hancher, M.; Dixon, M.; Ilyushchenko, S.; Thau, D.; Moore, R. Google Earth Engine: Planetary-scale geospatial analysis for everyone. Remote Sens. Environ. 2017, 202, 18–27. [Google Scholar] [CrossRef]
  8. Filipponi, F. Sentinel-1 GRD preprocessing workflow. Multidiscip. Digit. Publ. Inst. Proc. 2019, 18, 11. [Google Scholar]
  9. Gascon, F.; Bouzinac, C.; Thépaut, O.; Jung, M.; Francesconi, B.; Louis, J.; Lonjou, V.; Lafrance, B.; Massera, S.; Gaudel-Vacaresse, A.; et al. Copernicus Sentinel-2A calibration and products validation status. Remote Sens. 2017, 9, 584. [Google Scholar] [CrossRef] [Green Version]
  10. D’Odorico, P.; Gonsamo, A.; Damm, A.; Schaepman, M.E. Experimental evaluation of Sentinel-2 spectral response functions for NDVI time-series continuity. IEEE Trans. Geosci. Remote Sens. 2013, 51, 1336–1348. [Google Scholar] [CrossRef]
  11. Pettorelli, N.; Vik, J.O.; Mysterud, A.; Gaillard, J.M.; Tucker, C.J.; Stenseth, N.C. Using the satellite-derived NDVI to assess ecological responses to environmental change. Trends Ecol. Evol. 2005, 20, 503–510. [Google Scholar] [CrossRef] [PubMed]
  12. McFeeters, S.K. The use of the Normalized Difference Water Index (NDWI) in the delineation of open water features. Int. J. Remote Sens. 1996, 17, 1425–1432. [Google Scholar] [CrossRef]
  13. EESA. Sentinel-2 User Handbook; ESA Standard Document; EESA: Paris, France, 2015; 64p. [Google Scholar]
  14. Cavallo, C.; Papa, M.N.; Gargiulo, M.; Palau-Salvador, G.; Vezza, P.; Ruello, G. Continuous monitoring of the flooding dynamics in the Albufera Wetland (Spain) by Landsat-8 and Sentinel-2 datasets. Remote Sens. 2021, 13, 3525. [Google Scholar] [CrossRef]
  15. Astola, H.; Häme, T.; Sirro, L.; Molinier, M.; Kilpi, J. Comparison of Sentinel-2 and Landsat 8 imagery for forest variable prediction in boreal region. Remote Sens. Environ. 2019, 223, 257–273. [Google Scholar] [CrossRef]
  16. Zhu, Z.; Woodcock, C.E. Object-based cloud and cloud shadow detection in Landsat imagery. Remote Sens. Environ. 2012, 118, 83–94. [Google Scholar] [CrossRef]
  17. Huete, A.; Didan, K.; Miura, T.; Rodriguez, E.P.; Gao, X.; Ferreira, L.G. Overview of the radiometric and biophysical performance of the MODIS vegetation indices. Remote Sens. Environ. 2002, 83, 195–213. [Google Scholar] [CrossRef]
  18. Earth Engine Data Catalog. Available online: https://developers.google.com/earth-engine/datasets/catalog/sentinel/ (accessed on 28 August 2022).
  19. Herndon, K.; Meyer, F.; Flores, A.; Cherrington, E.; Kucera, L. What is Synthetic Aperture Radar. Retrieved January 2020, 27, 2021. [Google Scholar]
  20. Loh, W.Y. Classification and regression trees. Wiley Interdiscip. Rev. Data Min. Knowl. Discov. 2011, 1, 14–23. [Google Scholar] [CrossRef]
  21. Noble, W.S. What is a support vector machine? Nat. Biotechnol. 2006, 24, 1565–1567. [Google Scholar] [CrossRef] [PubMed]
  22. Belgiu, M.; Drăguţ, L. Random forest in remote sensing: A review of applications and future directions. ISPRS J. Photogramm. Remote Sens. 2016, 114, 24–31. [Google Scholar] [CrossRef]
  23. Thapa, A.; Neupane, B.; Horanont, T. Object vs Pixel-based Flood/Drought Detection in Paddy Fields using Deep Learning. In Proceedings of the 2022 12th International Congress on Advanced Applied Informatics (IIAI-AAI), Kanazawa, Japan, 2–7 July 2022; pp. 455–460. [Google Scholar]
  24. Arbeláez, P.; Hariharan, B.; Gu, C.; Gupta, S.; Bourdev, L.; Malik, J. Semantic segmentation using regions and parts. In Proceedings of the 2012 IEEE Conference on Computer Vision and Pattern Recognition, Providence, RI, USA, 16–21 June 2012; pp. 3378–3385. [Google Scholar]
  25. Roy Choudhury, A.; Vanguri, R.; Jambawalikar, S.R.; Kumar, P. Segmentation of brain tumors using DeepLabv3+. In Proceedings of the International MICCAI Brainlesion Workshop, Granada, Spain, 16 September 2018; Springer: Cham, Switzerland, 2018; pp. 154–167. [Google Scholar]
  26. Zhou, B.; Lapedriza, A.; Khosla, A.; Oliva, A.; Torralba, A. Places: A 10 million image database for scene recognition. IEEE Trans. Pattern Anal. Mach. Intell. 2017, 40, 1452–1464. [Google Scholar] [CrossRef] [Green Version]
  27. Neupane, B.; Horanont, T.; Aryal, J. Deep learning-based semantic segmentation of urban features in satellite images: A review and meta-analysis. Remote Sens. 2021, 13, 808. [Google Scholar] [CrossRef]
  28. MaliSorn. Available online: https://farminsure.infuse.co.th/ (accessed on 11 September 2022).
  29. Yang, X.; Zhao, S.; Qin, X.; Zhao, N.; Liang, L. Mapping of urban surface water bodies from Sentinel-2 MSI imagery at 10 m resolution via NDWI-based image sharpening. Remote Sens. 2017, 9, 596. [Google Scholar] [CrossRef] [Green Version]
  30. Bannari, A.; Morin, D.; Bonn, F.; Huete, A. A review of vegetation indices. Remote Sens. Rev. 1995, 13, 95–120. [Google Scholar] [CrossRef]
  31. Aryal, J.; Sitaula, C.; Aryal, S. NDVI Threshold-Based Urban Green Space Mapping from Sentinel-2A at the Local Governmental Area (LGA) Level of Victoria, Australia. Land 2022, 11, 351. [Google Scholar] [CrossRef]
  32. Gessesse, A.A.; Melesse, A.M. Temporal relationships between time series CHIRPS-rainfall estimation and eMODIS-NDVI satellite images in Amhara Region, Ethiopia. In Extreme Hydrology and Climate Variability; Elsevier: Amsterdam, The Netherlands, 2019; pp. 81–92. [Google Scholar]
  33. Gupta, V.D.; Areendran, G.; Raj, K.; Ghosh, S.; Dutta, S.; Sahana, M. Assessing habitat suitability of leopards (Panthera pardus) in unprotected scrublands of Bera, Rajasthan, India. In Forest Resources Resilience and Conflicts; Elsevier: Amsterdam, The Netherlands, 2021; pp. 329–342. [Google Scholar]
  34. Gao, B.C. NDWI—A normalized difference water index for remote sensing of vegetation liquid water from space. Remote Sens. Environ. 1996, 58, 257–266. [Google Scholar] [CrossRef]
  35. NDWI: Normalized Difference Water Index. Available online: https://eos.com/make-an-analysis/ndwi/ (accessed on 11 September 2022).
  36. Sentinel-1 SAR GRD: C-Band Synthetic Aperture Radar Ground Range. Available online: https://developers.google.com/earth-engine/datasets/catalog/COPERNICUS_S1_GRD (accessed on 11 September 2022).
  37. Interferometric Wide Swath. Available online: https://sentinels.copernicus.eu/web/sentinel/user-guides/sentinel-1-sar/acquisition-modes/interferometric-wide-swath (accessed on 11 September 2022).
  38. Stripmap. Available online: https://sentinels.copernicus.eu/web/sentinel/user-guides/sentinel-1-sar/acquisition-modes/stripmap (accessed on 11 September 2022).
  39. Extra Wide Swath. Available online: https://sentinels.copernicus.eu/web/sentinel/user-guides/sentinel-1-sar/acquisition-modes/extra-wide-swath (accessed on 11 September 2022).
  40. Acquisition Modes. Available online: https://sentinels.copernicus.eu/web/sentinel/user-guides/sentinel-1-sar/acquisition-modes (accessed on 11 September 2022).
  41. Machine Learning in Earth Engine. Available online: https://developers.google.com/earth-engine/guides/machine-learning (accessed on 11 September 2022).
  42. Supervised Classification. Available online: https://developers.google.com/earth-engine/guides/classification (accessed on 11 September 2022).
  43. Unsupervised Classification (Clustering). Available online: https://developers.google.com/earth-engine/guides/clustering (accessed on 11 September 2022).
  44. Hardy, A.; Ettritch, G.; Cross, D.E.; Bunting, P.; Liywalii, F.; Sakala, J.; Silumesii, A.; Singini, D.; Smith, M.; Willis, T.; et al. Automatic detection of open and vegetated water bodies using Sentinel 1 to map African malaria vector mosquito breeding habitats. Remote Sens. 2019, 11, 593. [Google Scholar] [CrossRef] [Green Version]
  45. Luan, Y.; Guo, J.; Gao, Y.; Liu, X. Remote sensing monitoring of flood and disaster analysis in Shouguang in 2018 from Sentinel - IB SAR data. J. Nat. Disasters 2021, 30, 168–175. [Google Scholar]
  46. Breiman, L.; Friedman, J.H.; Olshen, R.A.; Stone, C.J. Classification and Regression Trees; Routledge: London, UK, 2017. [Google Scholar]
  47. Verma, A.K.; Pal, S.; Kumar, S. Classification of skin disease using ensemble data mining techniques. Asian Pac. J. Cancer Prev. 2019, 20, 1887. [Google Scholar] [CrossRef]
  48. Ou, X.; Yan, P.; Zhang, Y.; Tu, B.; Zhang, G.; Wu, J.; Li, W. Moving object detection method via ResNet-18 with encoder–decoder structure in complex scenes. IEEE Access 2019, 7, 108152–108160. [Google Scholar] [CrossRef]
  49. Chen, L.C.; Zhu, Y.; Papandreou, G.; Schroff, F.; Adam, H. Encoder-decoder with atrous separable convolution for semantic image segmentation. In Proceedings of the European Conference on Computer Vision (ECCV), Munich, Germany, 8–14 September 2018; pp. 801–818. [Google Scholar]
  50. Sentinel-2 Cloud Masking with s2cloudless. Available online: https://developers.google.com/earth-engine/tutorials/community/sentinel-2-s2cloudless (accessed on 11 September 2022).
  51. Khoirunnisa, F.; Wibowo, A. Using NDVI algorithm in Sentinel-2A imagery for rice productivity estimation (Case study: Compreng sub-district, Subang Regency, West Java). In IOP Conference Series: Earth and Environmental Science; IOP Publishing: Bristol, UK, 2020; Volume 481, p. 012064. [Google Scholar]
  52. Al-Doski, J.; Mansor, S.B.; Shafri, H.Z.M. NDVI differencing and post-classification to detect vegetation changes in Halabja City, Iraq. IOSR J. Appl. Geol. Geophys. 2013, 1, 1–10. [Google Scholar] [CrossRef]
  53. Simonetti, E.; Simonetti, D.; Preatoni, D. Phenology-Based Land Cover Classification Using Landsat 8 Time Series; European Commission Joint Research Center: Ispra, Italy, 2014. [Google Scholar]
  54. Lee, J.S.; Jurkevich, L.; Dewaele, P.; Wambacq, P.; Oosterlinck, A. Speckle filtering of synthetic aperture radar images: A review. Remote Sens. Rev. 1994, 8, 313–340. [Google Scholar] [CrossRef]
  55. ESA. Sentinel High Level Operations Plan (HLOP). In ESA Unclassified; ESA: Paris, France, 2021; p. 91. [Google Scholar]
  56. QGIS Development Team. QGIS Geographic Information System, Open Source Geospatial Foundation; QGIS Development Team: 2009. Available online: https://qgis.org/en/site/ (accessed on 29 November 2022).
  57. Davranche, A.; Poulin, B.; Lefebvre, G. Mapping flooding regimes in Camargue wetlands using seasonal multispectral data. Remote Sens. Environ. 2013, 138, 165–171. [Google Scholar] [CrossRef] [Green Version]
  58. Gu, Y.; Brown, J.F.; Verdin, J.P.; Wardlow, B. A five-year analysis of MODIS NDVI and NDWI for grassland drought assessment over the central Great Plains of the United States. Geophys. Res. Lett. 2007, 34, L06407. [Google Scholar] [CrossRef]
Figure 1. Flood and drought claims made by the farmers from the disaster locations in Thailand.
Remotesensing 14 06095 g001
Figure 2. Workflow of our proposed method for flood and drought detection.
Remotesensing 14 06095 g002
Figure 3. Process of cloud and cloud shadow masking on Sentinel-2A image. The image used is a subset of a satellite image with midpoint coordinates (100.810481341, 15.77135789630) obtained on Friday, 8 October 2021, 10:53:57.445 AM Indochina Time.
Remotesensing 14 06095 g003
Figure 4. A sample plot with (a) NDVI and (b) NDWI calculation to detect flood in each pixel obtained from a Sentinel-2A image.
Remotesensing 14 06095 g004
Figure 5. A sample of CART classification on Sentinel-1 SAR GRD image to verify the claim of the flood.
Remotesensing 14 06095 g005
Figure 6. Samples of mobile photos, activation maps and predictions made from our decision-based method for flood detection. The heat map shown is an activation map used by the final layer of ResNet-18 of PlacesCNN to make its prediction. (a) Sample from the severely flooded region. (b) Sample from the moderately flooded region.
Remotesensing 14 06095 g006
Figure 7. A sample plot with (a) NDVI and (b) NDWI calculation to detect drought in each pixel obtained from a Sentinel-2A image.
Remotesensing 14 06095 g007
Figure 8. A drought-claimed sample plot obtained using CART classification on Sentinel-1 SAR GRD image.
Remotesensing 14 06095 g008
Figure 9. Samples of mobile photos, activation map used by PlacesCNN with ResNet-18 to make its predictions and prediction made from our decision-based method for drought detection. (a) Sample from severe drought region. (b) Sample from moderate drought region.
Remotesensing 14 06095 g009
Figure 10. Predicted flood distribution in a sample flooded land plot using (a) the NDVI method on Sentinel-2A, (b) the NDWI method on Sentinel-2A and (c) the CART method on Sentinel-1 SAR GRD.
Remotesensing 14 06095 g010
Figure 11. Predicted drought distribution in a sample flooded land plot using (a) the NDVI method on Sentinel-2A, (b) the NDWI method on Sentinel-2A and (c) the CART method on Sentinel-1 SAR GRD.
Remotesensing 14 06095 g011
Table 1. Description of possible polarization bands with respective pixel size in Sentinel-1 SAR GRD: C-band image.
NamePixel Size (m)Description
HH10Horizontal Transmit/Horizontal Receive
HV10Horizontal Transmit/Vertical Receive
VV10Vertical Transmit/Vertical Receive
VH10Vertical Transmit/Horizontal Receive
Table 2. Training classes and the number of training data used to classify flood and drought using CART classification on Sentinel-1 SAR GRD images.
Disaster TypeObtained Sentinel-1 Image Date for TrainingClassesNumber of Training Data
Flood9 September 2020Flood75
Non-flood49
Drought14 August 2020Drought43
Green Paddy28
Neither33
Table 4. Accuracy assessment using verified mobile images for flood detection with the integration of mobile images with Sentinel-2A images in cloud cover areas and overall accuracy of the CART method on Sentinel-1 SAR GRD images.
MethodsNumber of Flood ClaimsInaccessible Land PlotsCorrectly DetectedAccuracy
NDVI on Sentinel-2A167-10086.21%
PlacesCNN for cloud-affected area493-469
NDWI on Sentinel-2A167-8483.79%
PlacesCNN for cloud-affected area493-469
CART on Sentinel-1660764598.77%
Table 5. Accuracy assessment using verified mobile images for flood detection with PlacesCNN on mobile images and the CART method on Sentinel-1 SAR GRD images for cloud-affected land plots in Sentinel-2A images.
MethodsNumber of Flood ClaimsInaccessible Land PlotsCorrectly DetectedAccuracy
PlacesCNN on mobile images493-46995.13%
CART on Sentinel-1493548198.57%
Table 6. Accuracy assessment using verified mobile images of drought detection obtained from CART, NDVI and NDWI for land plots unaffected by cloud on Sentinel-2A images.
MethodsNumber of Drought ClaimsInaccessible Land PlotsCorrectly DetectedAccuracy
CART on Sentinel-149742100%
NDVI on Sentinel-2A49-4489.80%
NDWI on Sentinel-2A49-49100%
Table 7. Accuracy assessment using verified mobile images for drought detection with the integration of mobile images with Sentinel-2A images in cloud cover areas and overall accuracy of the CART method on Sentinel-1 SAR GRD images.
MethodsNumber of Drought ClaimsInaccessible Land PlotsCorrectly DetectedAccuracy
NDVI on Sentinel-2A49-4473.40%
PlacesCNN for cloud-affected area150-114
NDWI on Sentinel-2A49-4981.91%
PlacesCNN for cloud-affected area150-114
CART on Sentinel-11992117799.44%
Table 8. Accuracy assessment using verified mobile images for drought detection with PlacesCNN on mobile images and the CART method on Sentinel-1 SAR GRD images for cloud-affected land plots in Sentinel-2A images.
MethodsNumber of Drought ClaimsInaccessible Land PlotsCorrectly DetectedAccuracy
PlacesCNN on mobile images150-11476%
CART method on Sentinel-11501413599.26%
Table 9. Percentage of the flooded area obtained from field verification as well as our proposed method used in satellite images.
Field IdField Visit DatePercentage Using Field MeasurementDetails From Field VisitPercentage Obtained from NDVI on Sentinel-2APercentage Obtained from NDWI on Sentinel-2ASentinel-2 Visit DatePercentage Obtained from CART Method on Sentinel-1Sentinel-1 Visit Date
1401028 September 2022100%Flooded entirely99.93%96.18%28 September 2022100%29 September 2022
1400928 September 2022100%Flooded entirely100%96.96%28 September 2022100%29 September 2022
1400728 September 20220%Flooding started- *--28.76%29 September 2022
1400828 September 20220%Flooding started---18.50%29 September 2022
1401228 September 202237%Partial flooding---32.01%29 September 2022
1399828 September 202275%Partial flooding---58.46%29 September 2022
1399728 September 202275%Partial flooding---61.22%29 September 2022
* Hyphen represents data unavailability because of cloud effect.
Table 10. Percentage of drought area obtained from farmer’s claims as well as our proposed methods used in satellite images.
Field IdFarmer’s Claim DateFarmer’s Claimed Drought PercentagePercentage Obtained from NDVI on Sentinel-2APercentage Obtained from NDWI on Sentinel-2ASentinel-2 Visit DatePercentage Obtained from CART Method on Sentinel-1Sentinel-1 Visit Date
1396030 August 202282.60%- *--81.19%10 September 2022
1398319 September 202240.31%---40.66%29 September 2022
1398419 September 202228.15%---40.45%29 September 2022
1398519 September 202231.52%---34.57%29 September 2022
* Hyphen represents data unavailability because of cloud effect.
Table 11. Accuracy of DeepLabv3+ and PlacesCNN for test images. “Reprinted with permission from Ref. [23]. 2022, IEEE”.
MethodsNumber of Test ImagesCorrectly PredictedAccuracy
DeepLabv3+1109889.09%
PlacesCNN with ResNet-1811010393.64%
Table 12. Comparison of CART with SVM and RF on Sentinel-1 SAR GRD images.
MethodsFlood ClaimDrought Claim
AccuracyCorrectnessAccuracyCorrectness
CART98.77%90.88%99.44%90.63%
SVM94.95%89.65%97.75%49.21%
RF99.85%88.59%98.77%86.34%
Publisher’s Note: MDPI stays neutral with regard to jurisdictional claims in published maps and institutional affiliations.

