Article

Study on Retrievals of Ocean Wave Spectrum by Spaceborne SAR in Ice-Covered Areas

1
Key Laboratory of Digital Earth Science, Aerospace Information Research Institute, Chinese Academy of Sciences, Beijing 100094, China
2
International Research Center of Big Data for Sustainable Development Goals, Beijing 100094, China
3
University of Chinese Academy of Sciences, Beijing 100094, China
*
Author to whom correspondence should be addressed.
Remote Sens. 2022, 14(23), 6086; https://doi.org/10.3390/rs14236086
Submission received: 2 November 2022 / Revised: 24 November 2022 / Accepted: 28 November 2022 / Published: 30 November 2022

Abstract

:
The sea ice in the Arctic is retreating rapidly and ocean waves may accelerate the process by interacting with sea ice. Though Synthetic Aperture Radar (SAR) has shown great capability of imaging waves in ice, there are few attempts to retrieve the ocean wave spectrum (OWS) by SAR in ice-covered areas. In this study, based on the previously developed nonlinear inversion scheme, i.e., the Max Planck Institute (MPI) scheme, and the Sentinel-1 SAR data acquired in the Barents Sea, ocean wave spectra were retrieved by using the different combinations of modulation transfer functions (MTFs) in the MPI scheme: (1) using the same MTFs as those used in open water; (2) by neglecting both the hydrodynamic and tilt modulations; (3) by neglecting the hydrodynamic modulation but involving a newly fitted tilt modulation over ice for HH-polarized SAR data. We compared the simulated SAR image spectra based on the retrievals with the observational SAR image spectra to quantify their respective performances. The comparisons suggest that neglecting hydrodynamic modulation can significantly improve the retrievals. The remaining tilt modulation can further improve the retrievals, particularly for range-travelling waves. This study enhances the understanding of the principles of SAR imaging waves in ice and provides basics for retrievals of ocean wave spectra by SAR data in ice-covered areas.

1. Introduction

The Arctic is heating up nearly four times as fast as the global average [1], even more than the previous findings [2,3,4]. This phenomenon is known as the Arctic amplification, in which the diminishing of sea ice plays a central role [2]. The Arctic amplification’s main mechanism is the ‘temperature-albedo feedback’, which has been studied in recent decades [2,3]. However, the observation from remote sensors has revealed that sea ice is retreating faster than the model prediction [5], indicating that contributions of other processes might be overlooked in the models, such as the interaction between the sea ice and ocean waves [6,7]. The waves break sea ice when propagating into an ice-covered area, and on the other hand, wave energy is also attenuated by sea ice. With sea ice retreating, the ocean fetches extend and consequently provide broader space for growing waves [6,7,8]. In addition, evidence from remote sensing data shows that there are increasing trends in wind speed in the Arctic Ocean [9], which could also promote the growth of ocean waves. When the enhanced ocean waves penetrate the sea ice, the stronger waves break the ice easier and change the kinematic and thermodynamic properties of sea ice, making ice vulnerable to melting [10]. Eventually, the fetches extend with sea ice retreating, and then positive feedback forms [7,11,12]. Observations are highly desired to have a thorough understanding of the process. The wave energy attenuation rate can be derived from the measurements of ocean waves in ice, which is essential to predict ice break-up in the coupled models [6]. Moreover, sea ice parameters, such as sea ice thickness, could also be derived from changing wave parameters in ice [13]. However, observations of ocean waves in ice are lacking.
Microwave sensors such as the Radar Altimeter (RA) and Synthetic Aperture Radar (SAR) have been widely used to observe ocean waves in the open sea. In the past decades, dozens of spaceborne RAs have been launched, providing a long-term series of ocean wave measurements over the global oceans [14,15]. Another active microwave sensor, SAR, has the capability of imaging ocean waves in two dimensions. Two-dimensional ocean wave spectrum (OWS), which presents the wave energy distribution in different frequencies and directions, can be retrieved using SAR images. The integral wave parameters, such as significant wave height (SWH), wave period and wavelength, can be calculated via the OWS. However, the imaging process of ocean waves by SAR is quite complicated, and the consequent retrieval is not straightforward. With the three dominant imaging mechanisms having been revealed, i.e., tilt modulation, hydrodynamic modulation and velocity bunching [16,17,18], the modulation transfer functions (MTFs) from the OWS to SAR image spectrum were introduced [19]. Subsequently, the nonlinear inversion scheme (called MPI (i.e., Max Planck Institute) scheme hereafter) was developed to retrieve the OWS by spaceborne SAR data [19]. The Surface Wave Investigation and Monitoring instrument (SWIM) carried by China France Oceanography SATellite (CFOSAT) is another instrument that can obtain the OWS, while each measurement is available in a broad spatial coverage of 70 by 90 km [20]. Remote sensing is an effective technique to measure ocean waves in open water. However, in ice-covered areas, while both RAs and SWIM hardly observe interactions between ice and waves, SAR still can acquire clear images of waves in ice with both high spatial resolution and broad coverage, which has been observed since early airborne and spaceborne SAR [21].
SAR’s imaging mechanism of waves in sea ice has been studied since the 1970s [21,22,23,24]. The generally acceptable viewpoints are listed as follows. In ice-covered areas, the Bragg waves are damped by sea ice, and then the hydrodynamic modulation caused by the convergence and divergence of Bragg waves could be neglected [22,25]. Thus, tilt modulation is dominant for range-travelling waves [22]. However, it has secondary importance for non-range-travelling waves compared with velocity bunching, and the latter is the primary mechanism that makes waves visible by SAR in ice-covered areas [24,25]. Based on the preliminary understanding of the imaging process, several studies were carried out to analyze waves in ice through SAR data. Some of them are briefly introduced below.
The SAR image spectra contrast is used to derive the wave energy attenuation rate in propagations in sea ice [26,27,28], supposing a linear condition when the wave has a small amplitude and long wavelength. However, the nonlinear features are common in ice-covered areas, and therefore, the mapping from the wave amplitude to SAR image contrast is complicated [8]. This nonlinearity makes the analysis by SAR image spectra more difficult. When waves propagate in ice-covered areas, the short waves with random motions are damped by sea ice rapidly. Thus, the broadening and smearing effects of SAR imaging ocean waves in the open sea are reduced correspondingly, enhancing the waves’ visibility in SAR images and providing a good opportunity to observe the velocity bunching effect. The velocity bunching effect can induce periodic displacement, and the magnitude of displacement is related to the wave orbit velocity. By estimating the displacement, the orbit velocity of waves can be derived, and the SWH is further determined based on the wave dispersion relationship [23]. However, this idea was more suitable for monochromatic swell. This method was recently extended and adapted to Sentinel-1 (S1) SAR data to retrieve SWH in ice-covered areas [8,29].
The early attempt to retrieve the OWS in ice-covered areas based on the MPI scheme was implemented by Schulz-Stellenfleth [30,31] in the marginal ice zone (MIZ). The hydrodynamic modulation was neglected in their study, unlike the retrieval in open water using the MPI scheme. Because waves are attenuated by sea ice, the numerical wave model spectra in front of the ice boundary were modified by using the Butterworth filter, and then they were used as the first-guess spectra in the inversion. The best-fit OWS in ice was consequently derived, showing a good agreement between the simulated and observed SAR image spectra.
We can find the gap is that although nonlinear inversion of the OWS by SAR has been studied for a long time, fewer attempts have been proposed to retrieve the two-dimensional OWS by SAR in ice-covered areas. This is particularly important because one needs to know how ocean waves propagate in the ice, in terms of changes in wave direction, wavelength and height.
The key is still the MTFs of imaging ocean waves by SAR in the ice-covered area. It is clear that velocity bunching is the primary imaging mechanism for waves in ice. Hydrodynamic modulation has a minor contribution to the imaging process and can be neglected. However, tilt modulation remains debated. Vachon et al. (1993) put forth an expression of tilt modulation for waves propagating in sea ice based on the airborne SAR data acquired in VV polarization, with the incidence angle ranging from 40° to 75°. The expression of tilt modulation mentioned in [32] was derived based on the ERS-2 SAR data (also in VV polarization). The expression was derived in a small piece of a scene, with the incidence angle between 20.5° and 23.5°. However, there were opinions that tilt modulation’s contribution could also be neglected in ice-covered areas [29].
With the development of ocean wave models, the parametrical expression of the attenuation of waves by sea ice has been involved [33]. Therefore, the ocean wave spectra in ice-covered areas are available through an operational wave model, which partially solves the difficulty of using the MPI scheme to retrieve the OWS by SAR, needing a priori in the inversion process. On the other hand, spaceborne SAR data, e.g., S1 SAR, have been extensively acquired in the polar regions, providing abundant observation data to retrieve the OWS in ice-covered areas to support studies on the interaction between ocean waves and sea ice. However, for the convenience of ice monitoring, most of the S1 images are acquired in HH and HV polarization, while previous studies on tilt modulation of ice are available for VV polarization.
In summary, this study aims to discuss the feasibility of using the MPI scheme to retrieve the OWS in ice-covered areas by S1 SAR data, mainly focusing on investigating MTFs’ performance in the retrievals. Discussing different MTF schemes can also help further understand the SAR imaging process for waves in ice.
The paper is arranged as follows. Following the introduction, the used materials and the applied MPI scheme are presented in Section 2. The study area is in the Barents Sea, near Svalbard, presenting significant interaction between ocean waves and sea ice, which is also introduced in the section. In Section 3, we detailed analyzed experiments on utilizing different MTFs in the MPI scheme to retrieve the OWS by S1 data. Discussion and conclusions are given in Section 4.

2. Materials and Methods

2.1. Data

2.1.1. SAR Data

The Sentinel-1 (S1) is an earth observation mission of the Copernicus joint initiative of the European Commission (EC) and the European Space Agency (ESA). The S1 is composed of two satellites. The Sentinel-1A (S1A) was launched in 2014. Sentinel-1B (S1B) joined the orbit in 2016 and constituted a twin-satellite observation network with S1A. The twin satellites have provided extensive observations in the Arctic area, which could cover the whole Arctic area within three days. Unfortunately, the S1B ended its mission in December of 2021, but the good news is that the Sentinel-1C will be launched at the end of March 2023.
There are two frequently used imaging modes of S1 in the Arctic, i.e., the Interferometric Wide Swath (IW) and the Extra-Wide Swath (EW) mode. The Ground Range Detected (GRD) georeferenced product is used in this study. There are two kinds of GRD products with different spatial resolutions. The GRD High-Resolution (GRDH) product is acquired by IW mode, with a pixel spacing of 10 m and a swath width of 250 km. The GRD Medium-Resolution (GRDM) product is acquired in EW mode, with a medium spatial resolution of 40 m but a wider swath width of 400 km [34]. Both acquisition modes work in dual polarizations (selectable between HH+HV and VV+VH). For more effective monitoring of sea ice, most S1 images acquired in ice-covered areas are a polarization combination of HH and HV. All the data are accessed from the Sentinel data portal (https://scihub.copernicus.eu (accessed on 2 November 2022)).
The S1 IW data were radiometrically calibrated according to ESA’s handbook [34] before being used in the retrieval.
σ 0 = DN 2 n k s 2
where σ 0 is the normalized radar cross section (NRCS), DN is the digital number of the SAR data and n and k s are the noise vectors and the calibrate constant provided in the S1 product, respectively.
After calibration, sub-images with the size of 512 × 512 pixels (about 5.12 × 5.12 km) are extracted for retrieval. The SAR image spectrum is calculated and coded using the same method as the one to produce the ERS UWA product [35]. The UWA product is a SAR image product designed by ESA during the ERS period and has been used as the input of the MPI retrieval method [36,37]. The re-coded spectra are stored in 12 × 12 wavenumber and direction grids, with wavelength ranging from 90 to 1110 m and directions from 0° to 180°.

2.1.2. WW3 Data

The predicted OWS as the priori in the MPI inversion used in the study is provided by National Marine Environmental Forecasting Center, China (NMEFC), by running the third-generation global wave model Wave Watch III (WW3). These ocean wave spectra are provided in 48 × 25 direction-frequency bins. The initial frequency is 0.041772 Hz with a multiplicative increment of 1.1. The direction ranges from 0° to 352.5°, with an increment of 7.5°. The spectra are provided hourly in the Barents Sea and the Greenland Sea, with a space interval of 0.5°. In the NMEFC WW3 model, the source term of sea–ice interaction is used to describe the damping of wave energy by sea ice, based on the papers by Liu and Mollo-Christensen [38] and Liu et al. [27]. More details about the scheme can be found in the introduction of IC2 in the WW3 manual [33]. With the involving of the ice–wave interaction source term in the model, the predicted model spectra are available in ice-covered areas, which are used as priori in inversion. Liu et al. [39] designed the hindcast experiment in the Barents Sea and compared the performance of different ice–wave interaction modules with in situ measurements. The model using the IC2 module yields the Normalized Mean Square Error (NRMSE) of Power Spectral Density (PSD) of 3.02 and the attenuation rate of 0.71. The simulated attenuation rate is slightly smaller than in situ measurements in the main frequency domain.

2.2. Study Area

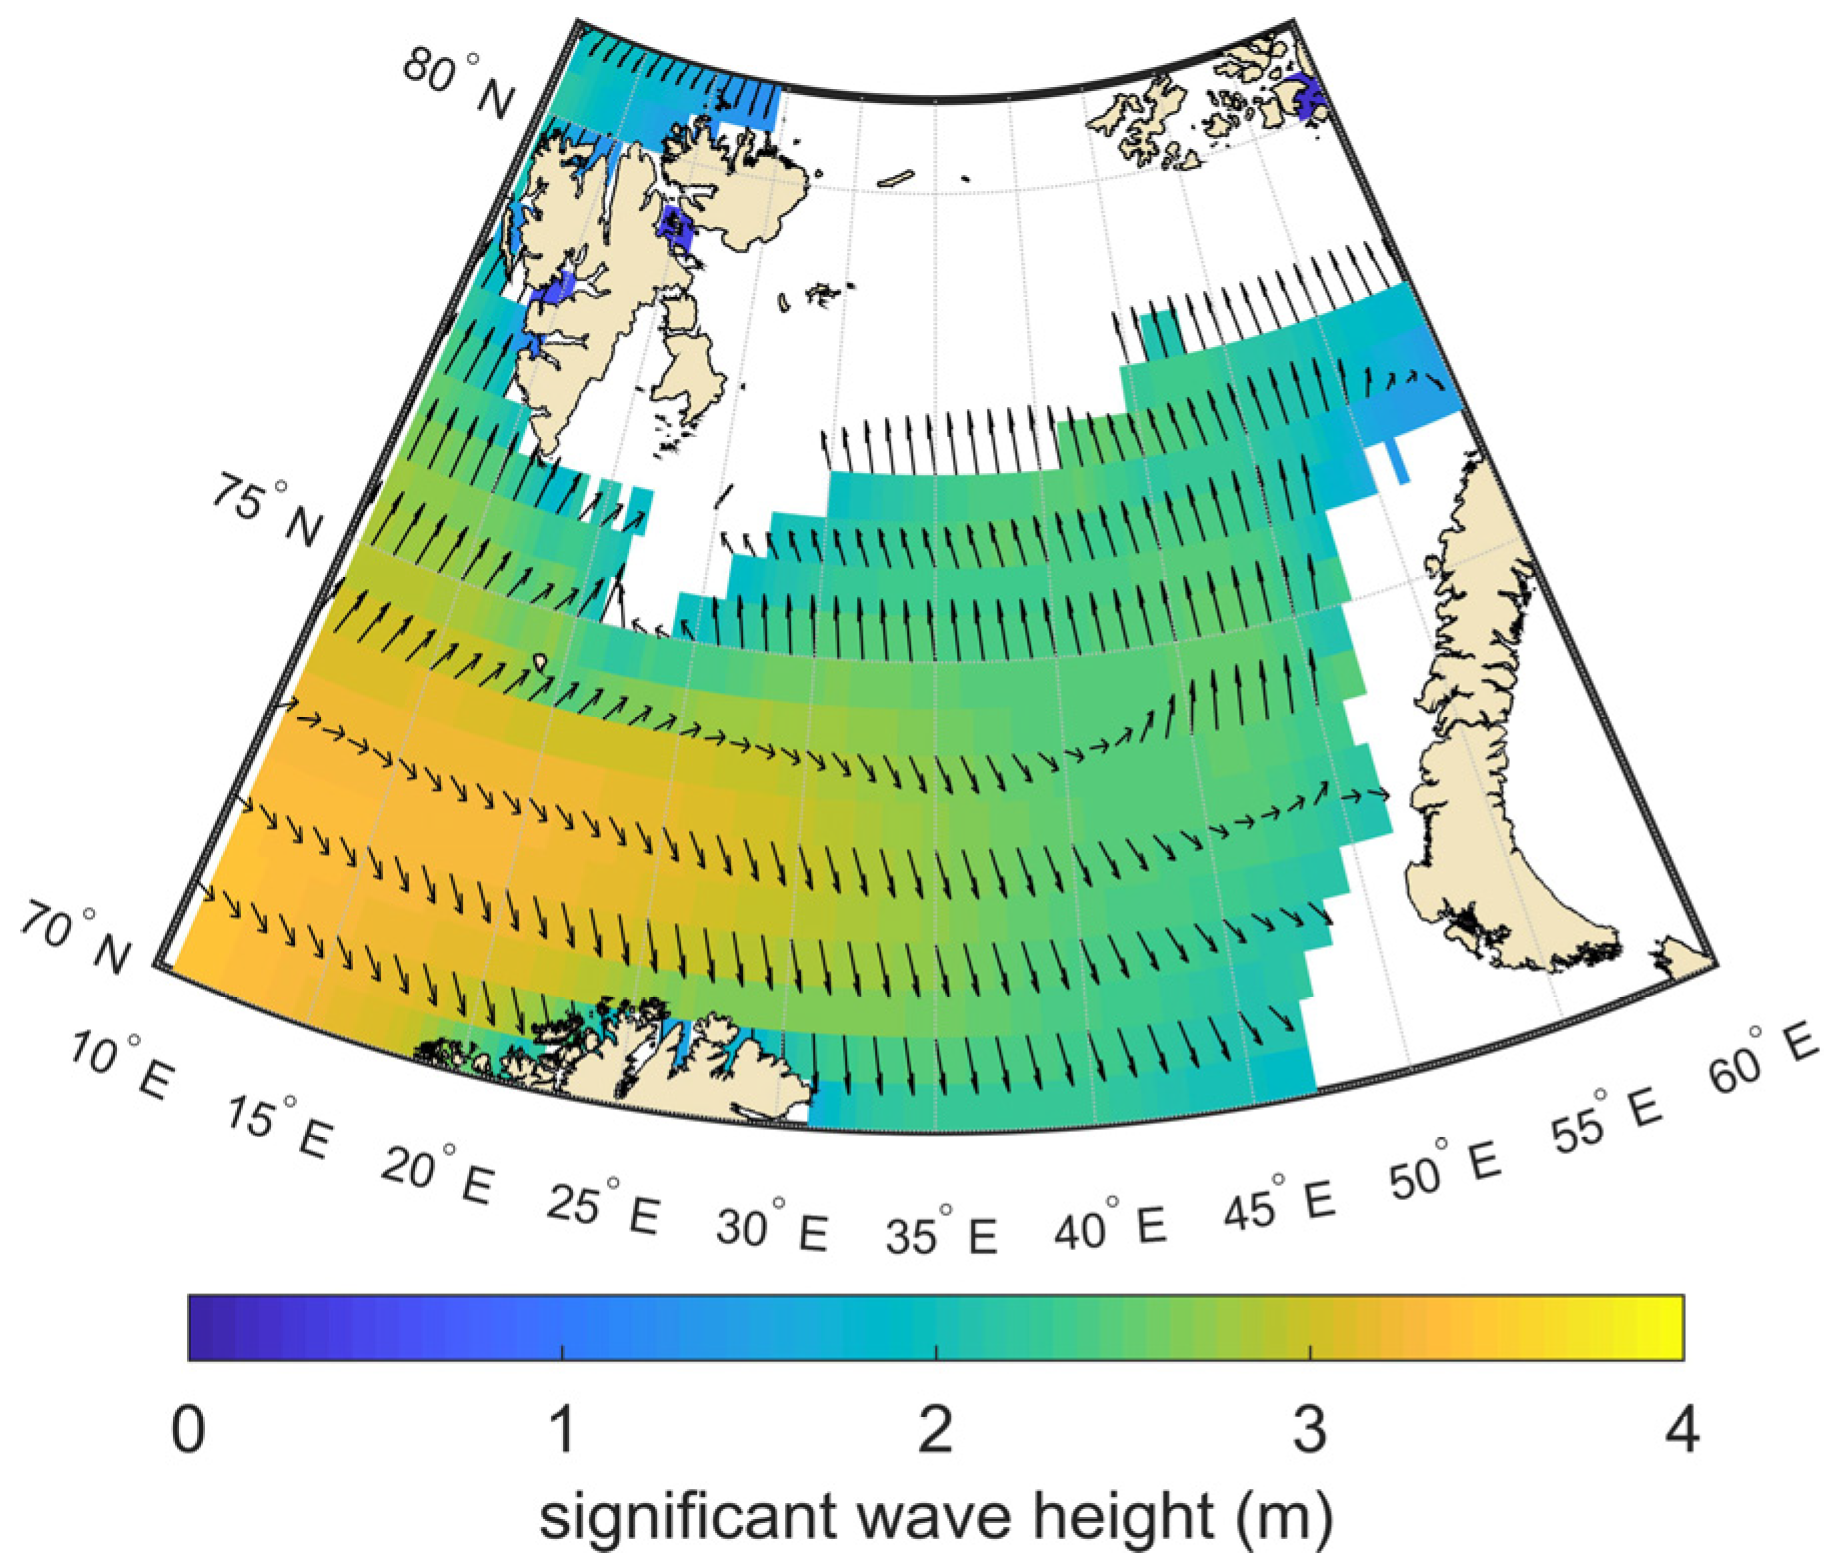
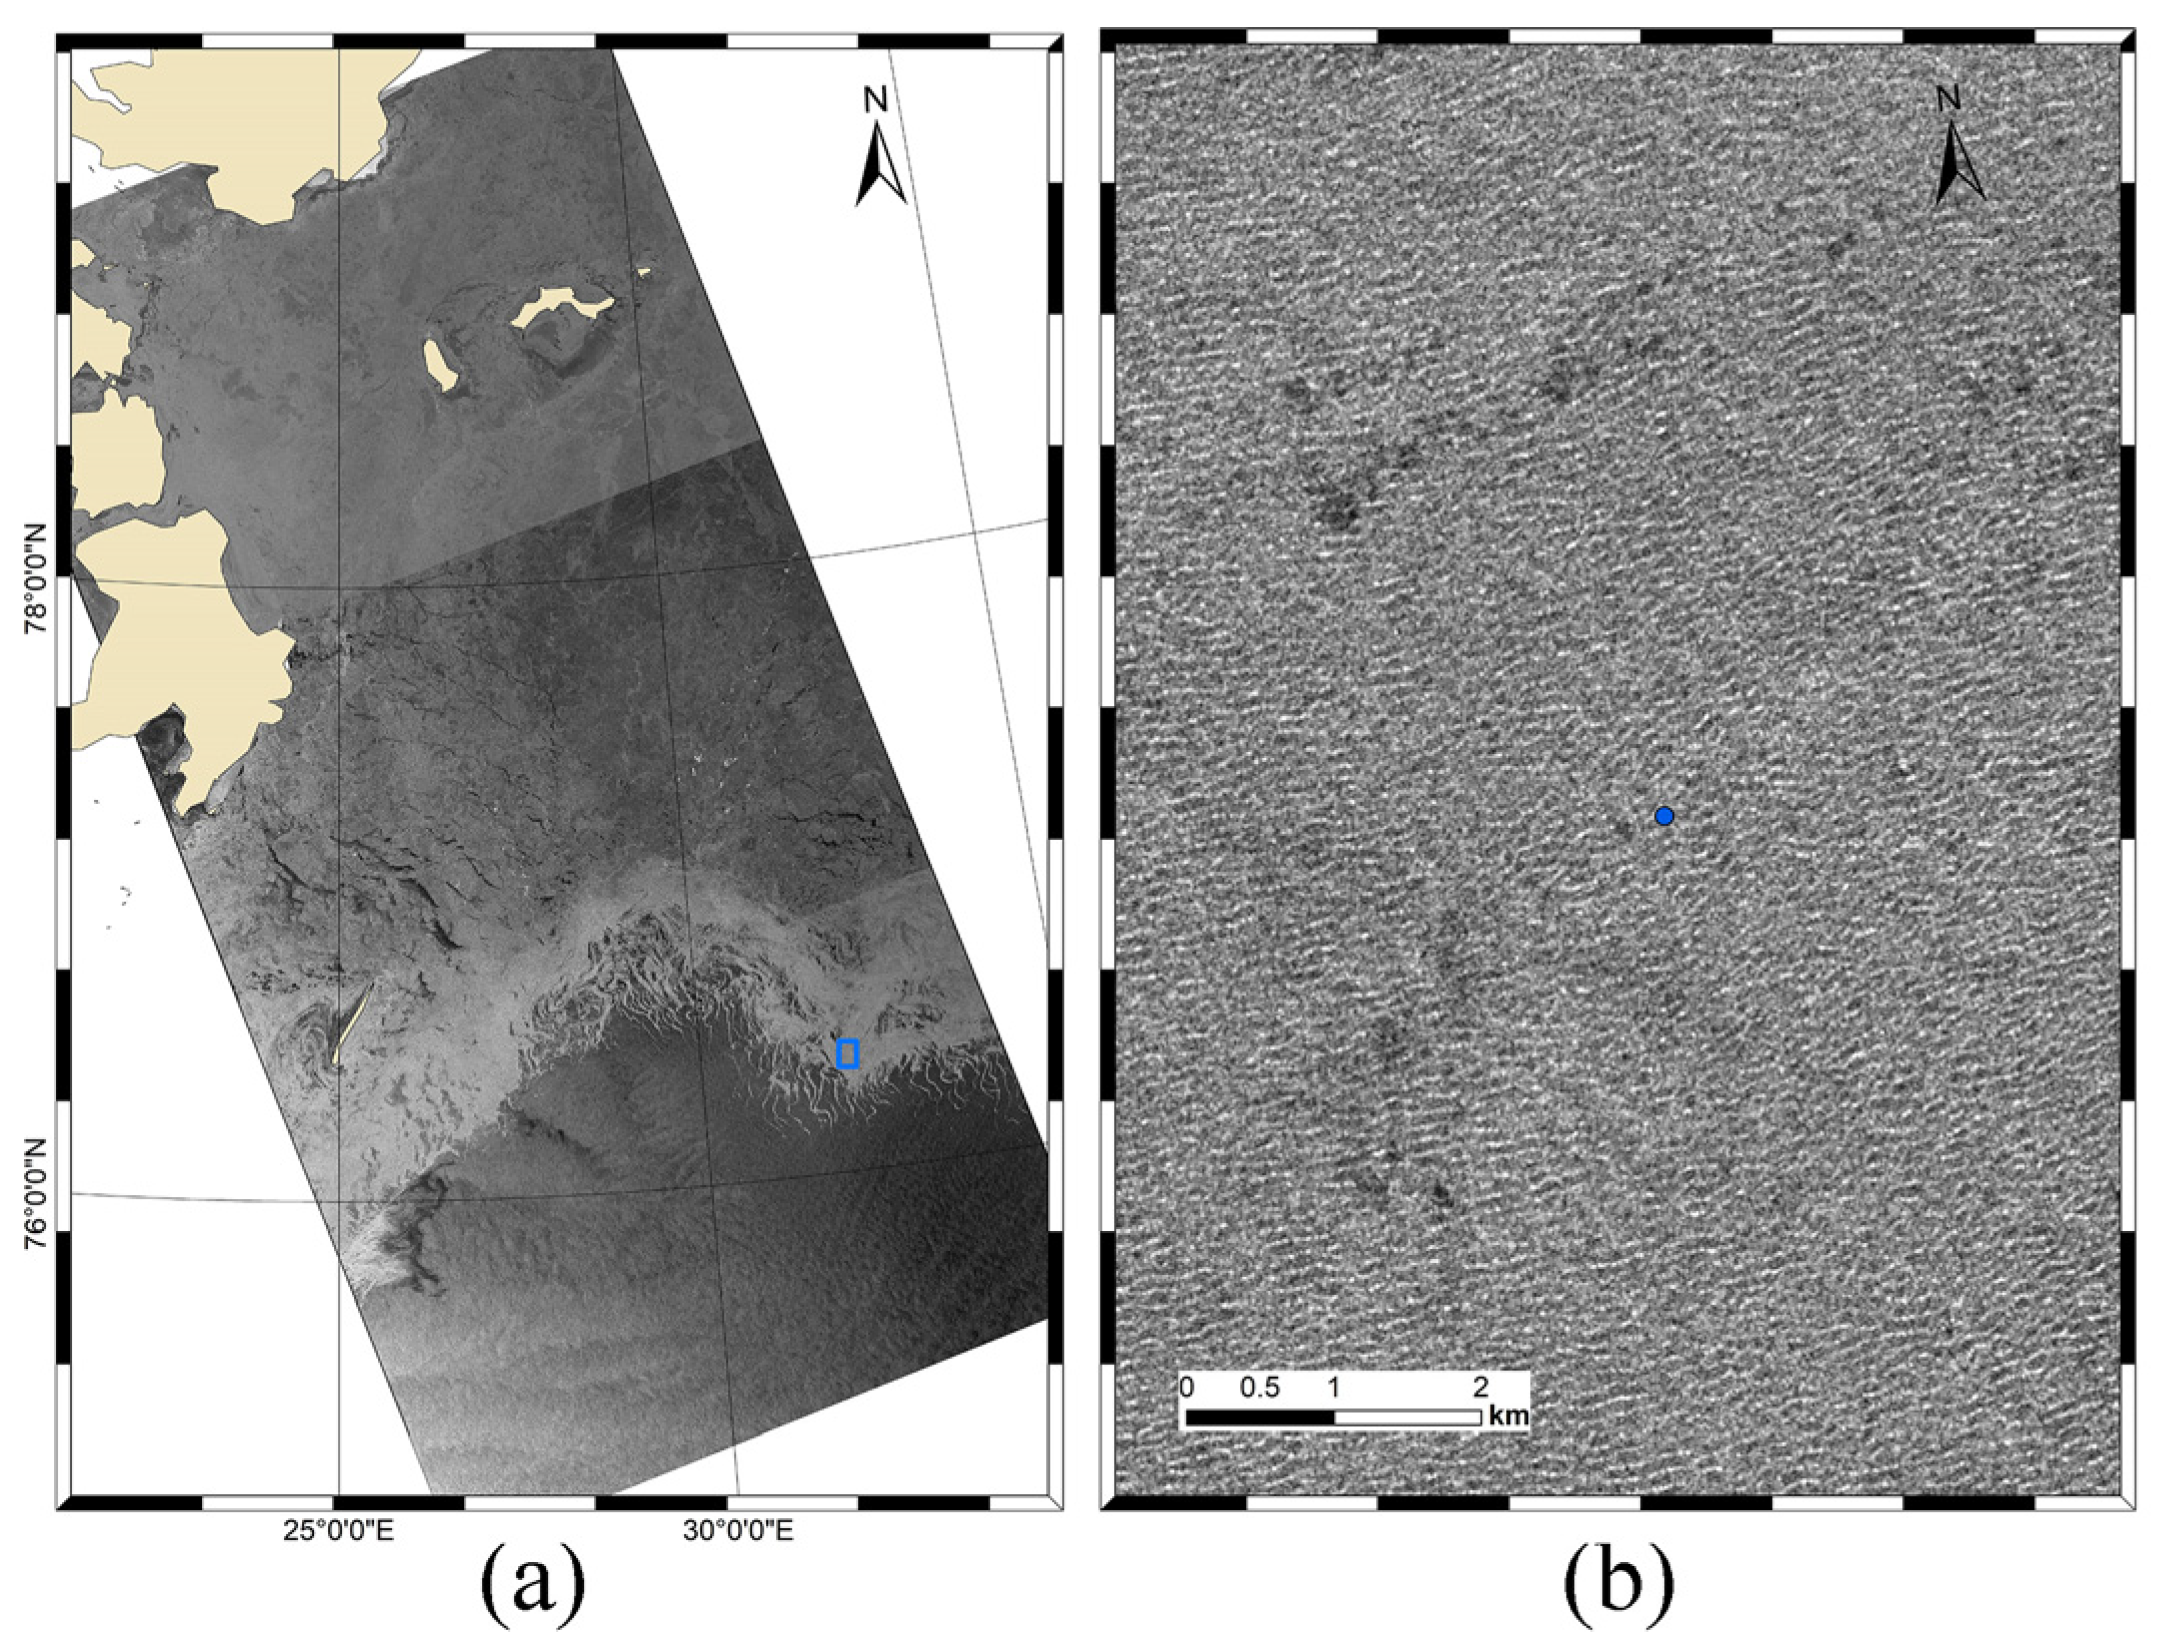
The study was carried out in the MIZ in the Barents Sea. Energetic waves generated by storms in the Atlantic Ocean are frequently observed penetrating sea ice in this area [9]. Thus, this area is ideal for studying the interaction between sea ice and ocean waves. The sea ice extent changes seasonally and generally reaches the maximum at the end of March in the Arctic. The monthly averaged wave field by the fifth generation ECMWF reanalysis (ERA5) data [40] in March 2021 is shown in Figure 1. A strong northward wave system existed in this area, with an SWH of about 2.5 m near the ice edge. In Figure 2, we show an S1 IW image acquired near Svalbard on 14 March. Ice covered the northern part of the image, and the bright bands in the middle of the image are caused by the accumulation of ice floes near the ice edge. The enlarged view in Figure 2b shows waves propagating in the zone of ice floes.

2.3. Brief Description of the MPI Inversion Scheme

The MTFs used in the MPI scheme consist of three prominent modulations, i.e., tilt modulation (denoted as T k t ), hydrodynamic modulation ( T k h ) and velocity bunching ( T k v b ), which are given in Equations (2)–(5), respectively. In these equations, k is the wavenumber, ω is the circular frequency, k x and k y represent the azimuth and range wavenumber components, respectively, θ is the incidence angle, μ in Equation (4) is the damping factor, R in Equation (5) is the slant range distance from the satellite to the target and U is the platform’s velocity. In addition, the range bunching effect, which is a purely geometric effect ( T k r b in Equation (6)), is also included in the imaging process [41]. The sum of the tilt modulation, hydrodynamic modulation and range bunching modulation is known as the MTF of RAR, which is a linear process.
T o w   V V t = i k y 4 c o t θ 1 + s i n θ 2
T o w   H H t = i k y 4 c o t θ 1 s i n θ 2
T h = 4.5 k y 2 k ω i μ ω 2 + μ 2
T k v b = β k x ω c o s θ i k y k s i n θ ,   β = R U
T k r b = i k y c o s θ s i n θ
The sea surface is not frozen when imaged by SAR, and the velocity of the sea surface induces the shift of the scatter element in the SAR image plane. The effect is known as velocity bunching, a nonlinear process in SAR imaging of ocean waves. The waves with wavelengths less than the displacement would be smeared, known as the high-frequency cut-off effect.
Based on the MTFs described above, the MPI scheme was proposed, which has been implemented to retrieve the OWS in open water [19,36,37,42]. The first-guess spectrum used in the MPI inversion scheme compensates for the lost high-frequency information and solves the 180° ambiguity of wave propagation direction. The principle of the MPI method is to find an optimal solution iteratively, yielding the smallest difference between the simulated and observed SAR spectrum. A cost function J is used to control the adjustment of OWS and decide when to terminate the iteration.
J = P k P ^ k 2 P ^ k d k + μ F k F ^ k 2 B + m i n F k , F ^ k 2 d k + η α λ cl 2 λ ^ cl 2 2 m a x λ cl 4 , λ ^ cl 4
The cost function J consists of three terms. The first one is the difference between the observed SAR image spectrum P ^ k and the simulated spectrum P k . The former is calculated from the SAR image using FFT, and the latter is a forward mapping from the retrieved OWS based on the MTF. The second term represents the difference between the first-guess spectrum F ^ k and the retrieved OWS F k ; μ denotes the influence factor and is set to 0.0005   P ^ m a x . The small constant B is added to avoid the denominator from being 0, which is set to 0.0001   F ^ m a x . The last term indicates the difference between the observed cut-off wavelength λ ^ c and the simulated one λ c l ; η is the weight and is set to 5   ×   10 4 P ^ ,   and α is the energy scale factor and is adjusted during the iteration. The OWS is adjusted to minimize the cost function. When the cost function achieves the minimum, the simulated SAR spectrum is closest to the observed spectrum, and the retrieved OWS is close to the first-guess spectrum simultaneously. In this way, the best fit spectrum, i.e., the retrieved spectrum, is determined. The retrieved OWS is given in a wavenumber-wavenumber form (513 × 513) in this study, with the wavenumber ranging from −0.3142 to 0.3142 rad/m.
The convergence index (abbreviated as C.I.) is used to justify the retrieved results in open water, which is the ratio of the cost function value in the last and its value in the first iteration loop. The smaller the C.I. is, the better the performance of the inversion achieved. Usually, the results with C.I. less than 0.5 could be acceptable in retrievals in open water [43]. However, in ice-covered areas, the prior spectra may have more bias from the truth. Thus, the higher C.I. could be induced by an enlarged discrepancy between the retrieval and the priori. As we lack in situ measurements of ocean waves in ice-covered areas, it is hard to validate the finally retrieved spectra. SAR observations provide the real references for validation. Therefore, two parameters are used additionally to describe the similarity between the simulated and observed SAR spectrum, i.e., the correlation coefficient (abbreviated as Cor.) and the squared error (abbreviated as Err.) [36,43]. The Cor. is close to 1 and the squared error is close to 0 if the simulated SAR spectrum is close to the observed SAR spectrum.
C o r = P k P ^ k d k P 2 k d k P ^ 2 k d k
E r r = P k P ^ k 2 d k P 2 k d k P ^ 2 k d k
An example of retrieval of the OWS based on the MPI scheme in an ice-covered area is shown in Figure 3. Figure 3a is the SAR sub-image (5.12 × 5.12 km), and its central location is represented by the blue dot in Figure 2b. Figure 3b is the corresponding image spectrum calculated from the sub-image. Figure 3c,d are the first-guess spectrum provided by the NMEFC WW3 model and the retrieved spectrum by the MPI scheme, respectively. The SAR sub-image and image spectrum show that two wave systems propagate in different directions in the ice-covered area. One was propagating northwest and the other was propagating northeast, with the wavelength of approximately 100 m and 300 m, respectively. The first-guess spectrum suggests that the model predicted only the wave system propagating to the northeast. The retrieved OWS shows that the propagation direction of the northeastward wave is about 30° (clockwise from the true north, same for the elsewhere) and the wavelength is about 347 m. The northwestward wave, not predicted by the NMEFC WW3 model, is resolved in the retrieval, with a wavelength of about 101 m and propagation direction of 336°.

2.4. Different Combinations of MTFs in the MPI Scheme

In this study, we used three different combinations of MTFs in the MPI inversion scheme. One involves all three prominent modulations, i.e., the tilt modulation, the hydrodynamic modulation and the velocity bunching in the MPI scheme. Previous studies point out that the hydrodynamic modulation is neglectable in ice-covered areas, but the debate on tilt modulation exists. Therefore, the second and third combinations neglect the hydrodynamic modulation but have different tilt modulations. For the convenience of description, NT and NH are used as the abbreviations for None-Tilt and None-Hydrodynamic modulations; T i c e t denotes the tilt modulation in ice. The schemes are named according to the combination of MTFs, and the details are described as follows:
  • MPI scheme
All three dominant modulations in open water are involved in this scheme. The scheme is used to compare the improvements achieved by changes in MTFs.
  • MPI-NTNH scheme
In the MPI-NTNH scheme, both the hydrodynamic and tilt modulations are neglected. The velocity bunching remains.
  • MPI- T i c e t NH scheme
We neglected the hydrodynamic modulation in this scheme but maintained the tilt modulation. However, as it is pointed out that tilt MTF in ice for HH-polarized SAR data is not available, we derived one based on the collected S1 data acquired in the study area.
Tilt MTF is expressed in Equation (10) [17], which describes the modulation of the radar cross-section caused by the surface slope.
T t = i k y 1 σ 0 δ σ 0 δ θ
Using the second-order polynomial, the relationship between the radar cross-section and incidence angles can be established in ice-covered areas. As shown in Equation (11), A, B and C are the polynomial coefficients and θ d e g is the incidence angle in degrees.
10 l g σ 0 = A θ d e g 2 + B θ d e g + C
Substituting Equation (11) into (10), the expression of tilt MTF in ice can be derived correspondingly:
T i c e t = i k y 180 l o g 10 10 π 2 A θ d e g + B
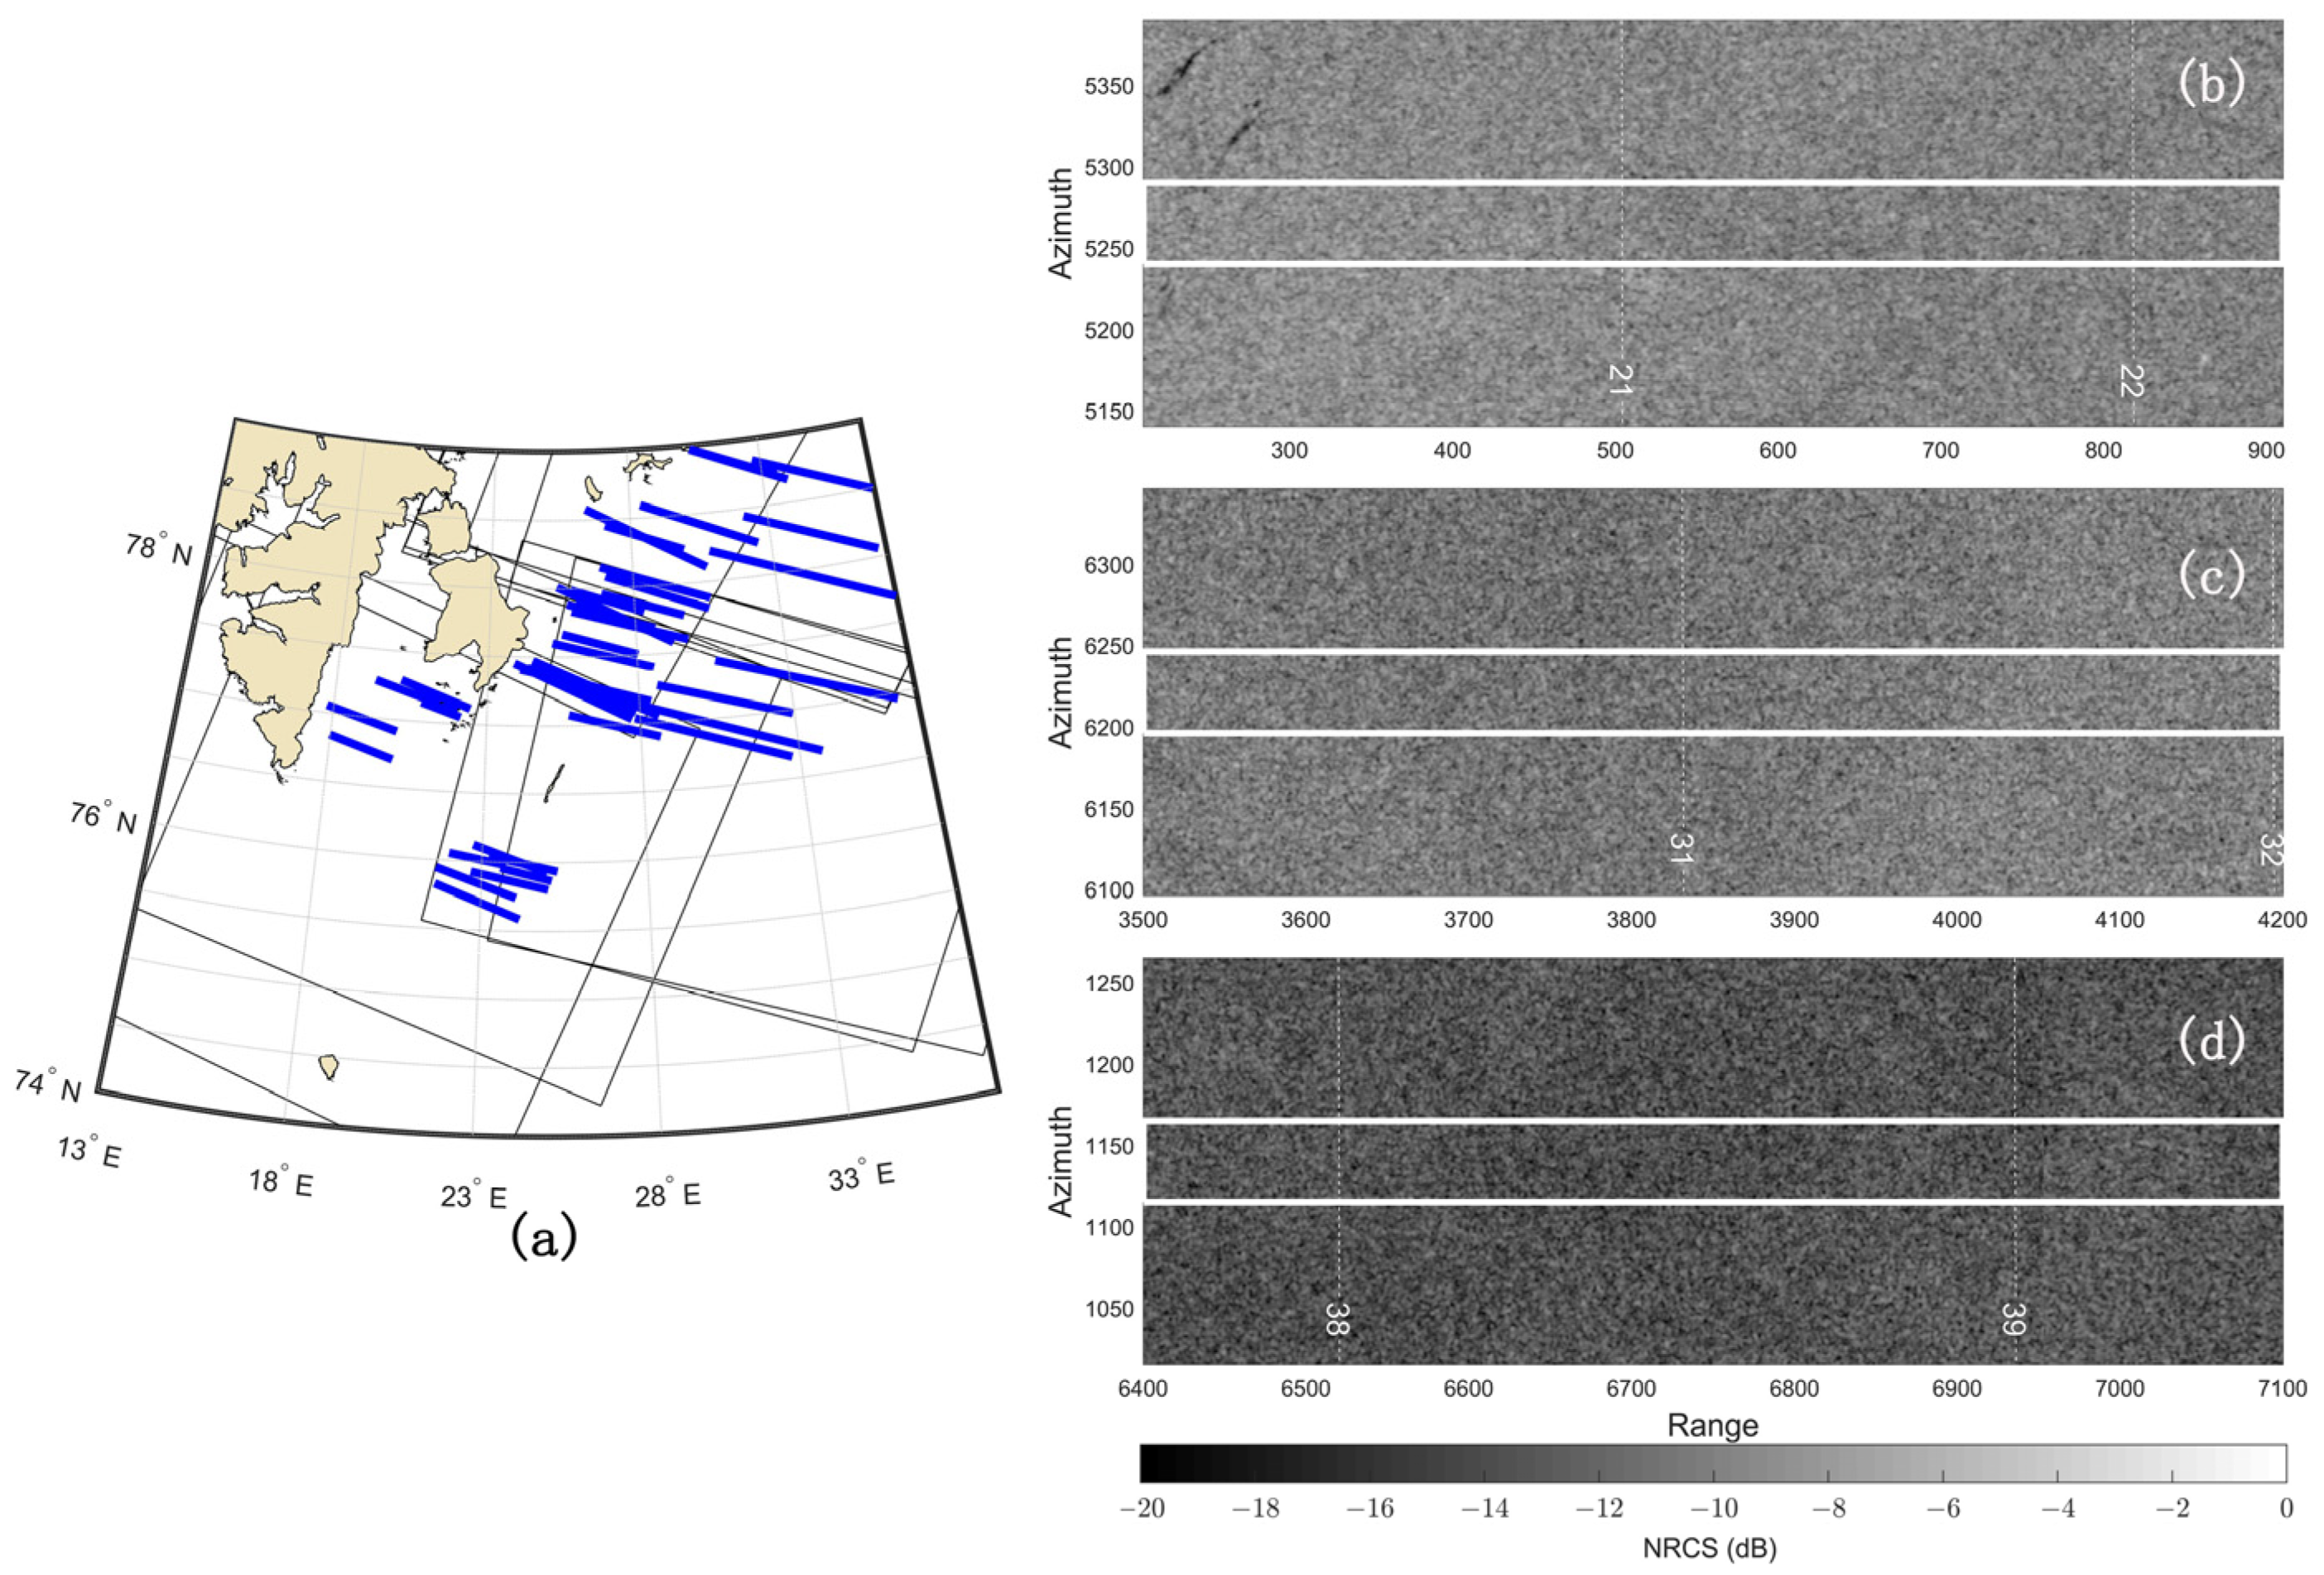
The tilt MTF in ice was derived firstly by Vachon et al. [24], based on the airborne SAR image acquired in VV polarization. The composition of the sea ice during the observation area is continual small ice floes with diameters smaller than 20 m. The selected scene was unperturbed by waves. The derived polynomial coefficients A and B are 0.022 and −0.56, respectively. However, the expression was derived based on the VV-polarized SAR data, with a large incidence angle ranging from 40° to 75°. As the S1 IW data used in this study for retrieval were acquired in HH polarization with medium incidence angles between 30° to 45°, we derived a new tilt modulation for these data. Eleven S1 EW images acquired near Svalbard in March 2021 were collected, with incidence angles ranging from 19° to 47°. Figure 4a shows the locations of the eleven EW images. A total of 58 transects (blue stripes in Figure 4a) presenting relatively homogeneous ice surfaces were selected from the images to derive the tilt MTF. The size of the transects in the azimuth direction is 50 pixels. Figure 4b–d show the sub-images that contain the transects (white rectangles) acquired in various incidence angles.
Based on the visual interpretation and U.S. National Ice Data Center Arctic and Antarctic sea ice charts (https://nsidc.org/data/g10013/versions/1 (accessed on 2 November 2022)), the sea ice in this area is mainly young ice and thin first-year ice. According to the ICESat-2 monthly gridded ice thickness product (https://n5eil01u.ecs.nsidc.org/ICESAT2PO/IS2SITMOGR4.002/ (accessed on 2 November 2022)), the averaged ice thickness along the selected transects is approximately 0.70 m. The transects were unperturbed by waves.
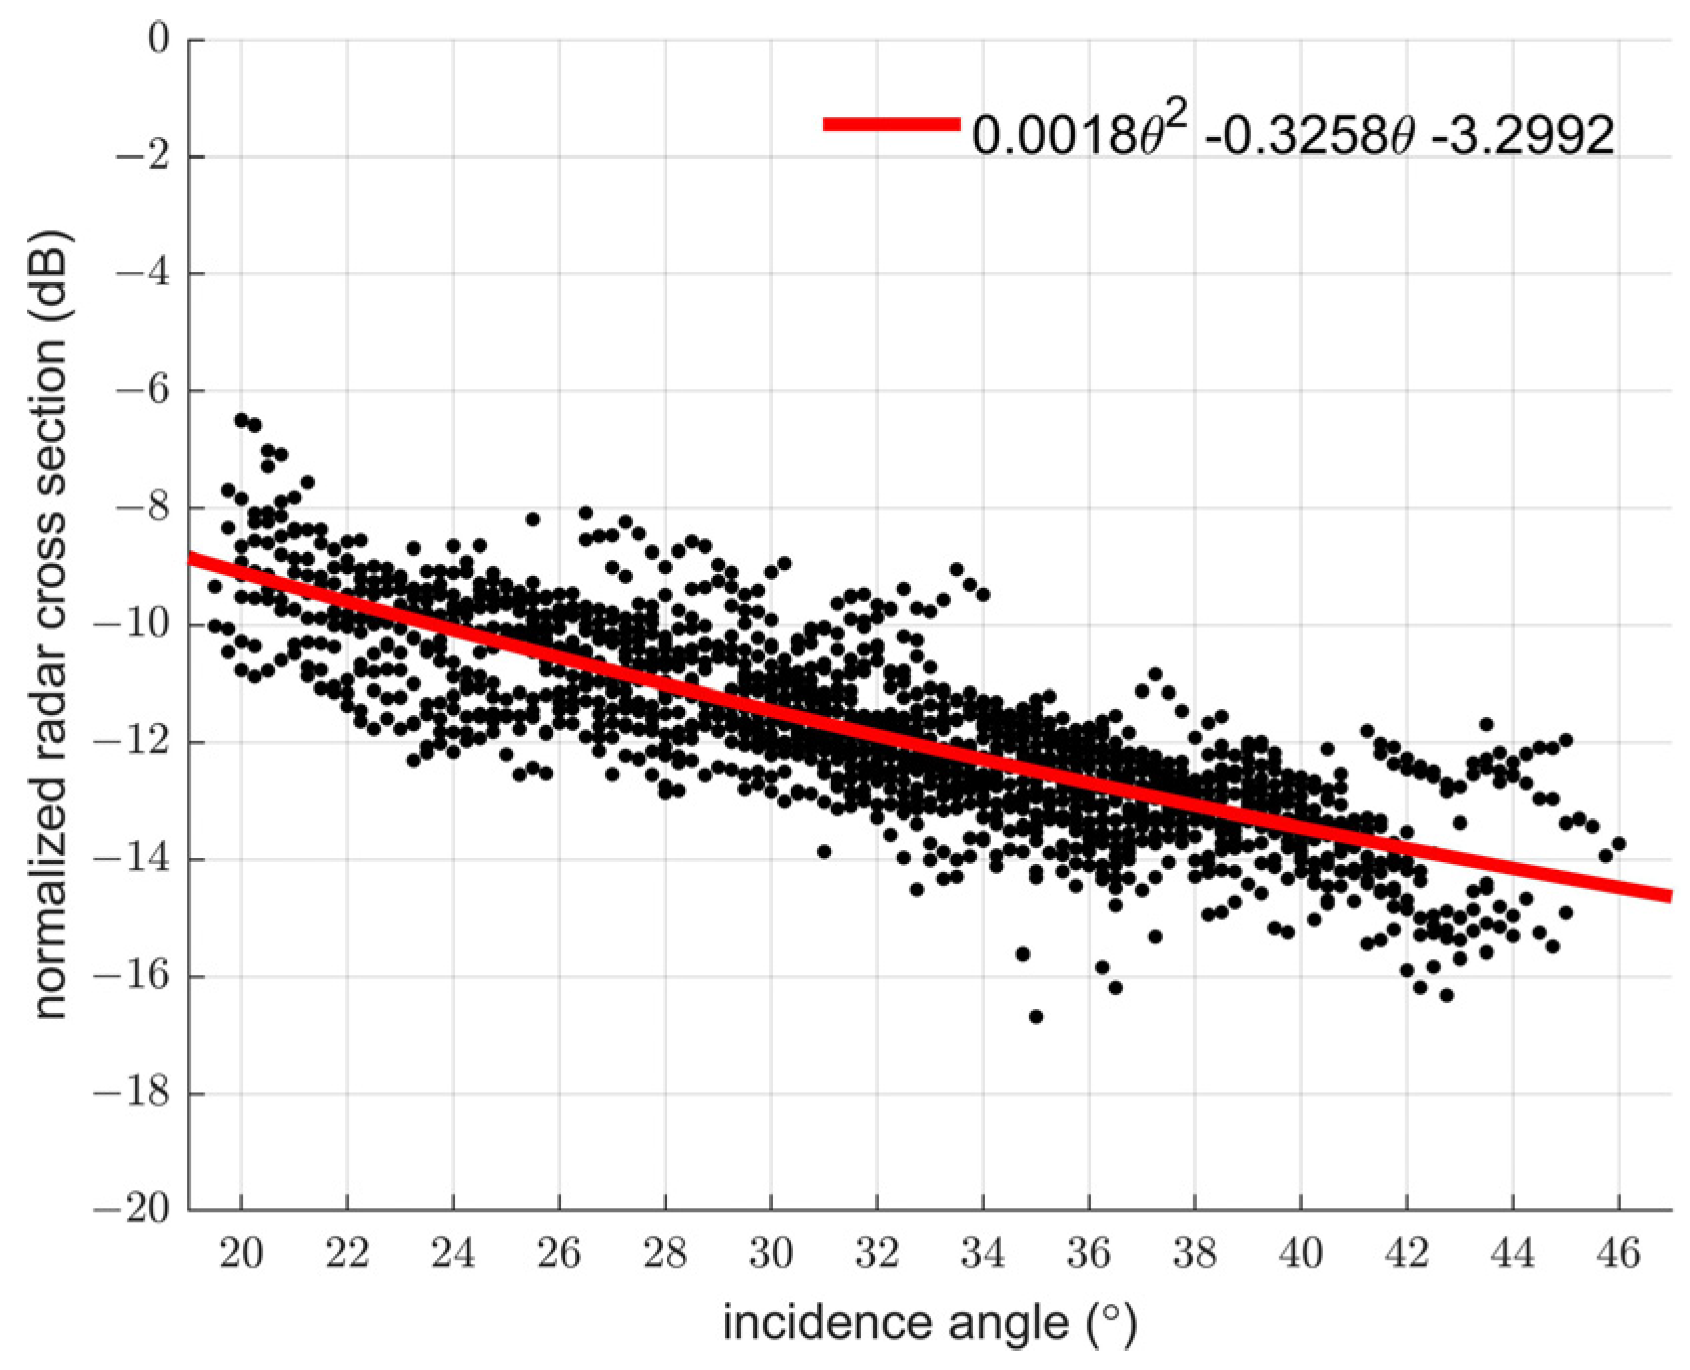
The transects were first averaged along the azimuth direction, then averaged in each incidence angle bin, with a size of 0.25°. In this way, the NRCS over sea ice along the incidence angles is obtained, as shown in Figure 5. The red line is the quadratic fitting of these data. The coefficients A and B are 0.0018 and −0.3258, respectively. Substituting the two coefficients in Equation (12), we obtained the tilt modulation in ice (denoted T i c e t hereafter) for the HH-polarized SAR data. It was consequently used in the inversion scheme, named the MPI- T i c e t NH scheme.
T i c e t = i k y 180 l o g 10 10 π 0.0036 θ 0.3258

3. Results

In this section, we present experiments on retrieving the OWS by different schemes described in Section 2.4 and an analysis of their performances in different scenarios.
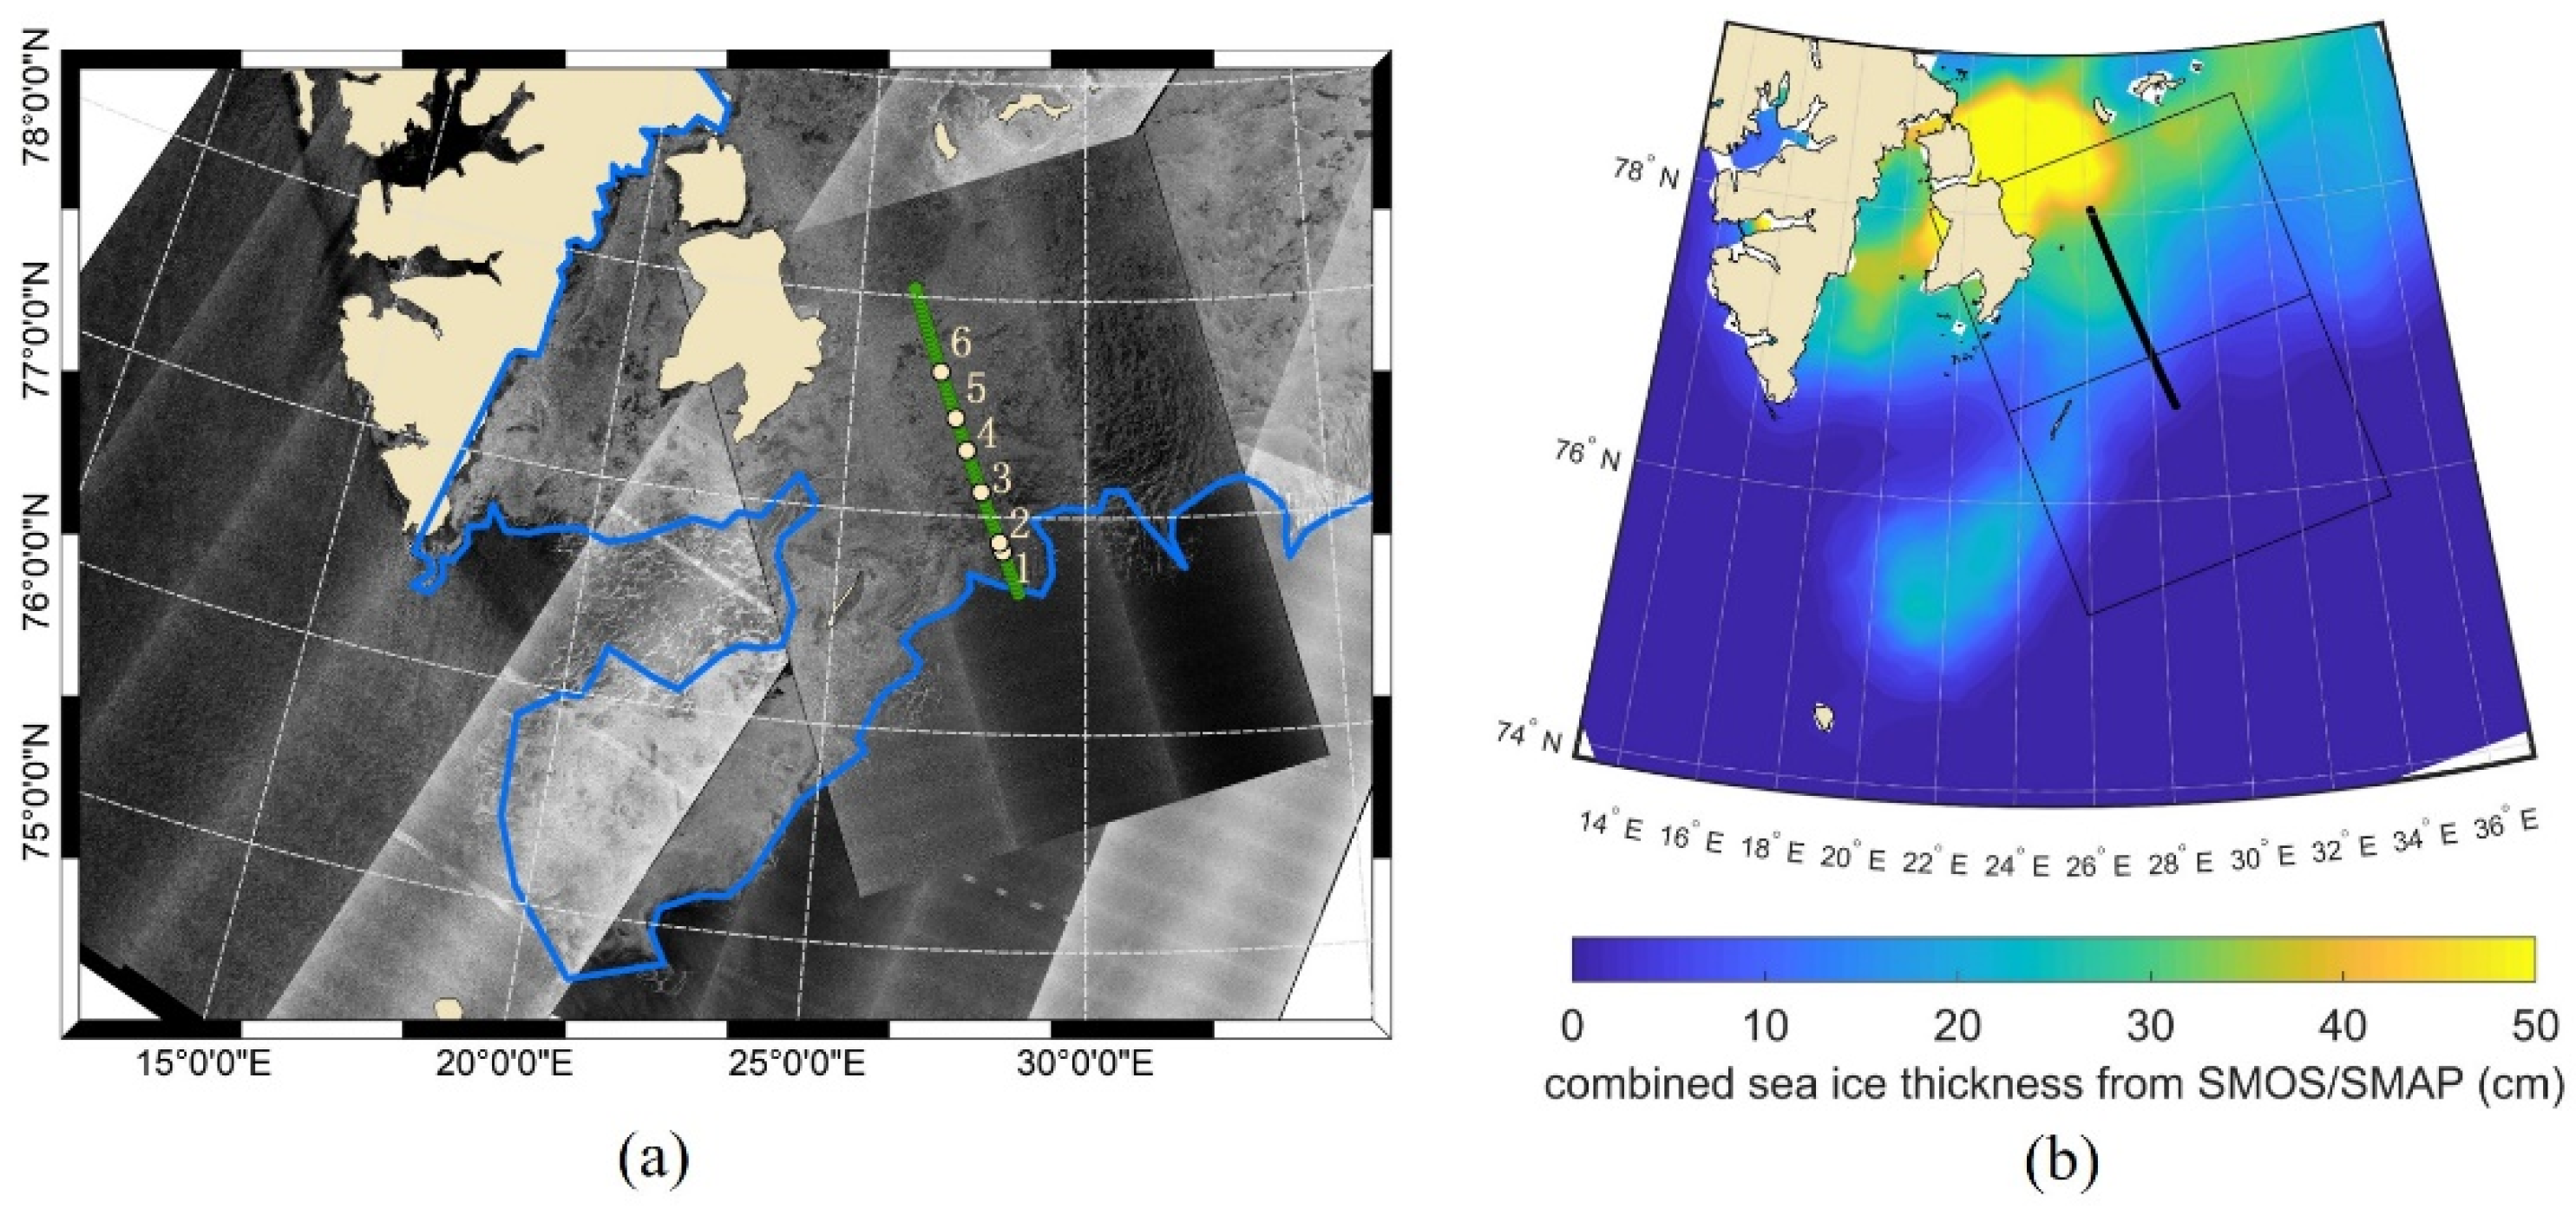
Figure 6a shows a mosaic map, including four EW images and two IW images acquired on 20 March around Svalbard. The blue curve in the map roughly outlines the edge of the sea ice. From the ice edge to where the wave pattern vanished, a relatively homogeneous transect was chosen (green line), stretching a distance of about 130 km with an incidence angle of approximately 38°. Sub-images were extracted with space intervals of about 2.5 km along the transect. Figure 6b shows the combined thickness of thin sea ice (ice thickness less than 50 cm) retrieved from L-band sensor Soil Moisture and Ocean Salinity (SMOS) and Soil Moisture Active Passive (SMAP) (https://seaice.unibremen.de/data/smos_smap/ (accessed on 2 November 2022)). The rectangle in Figure 6b shows the coverage of the IW data used for retrieval and the solid line represents the transect chosen. The sea ice thickness along the transect is less than 40 cm.
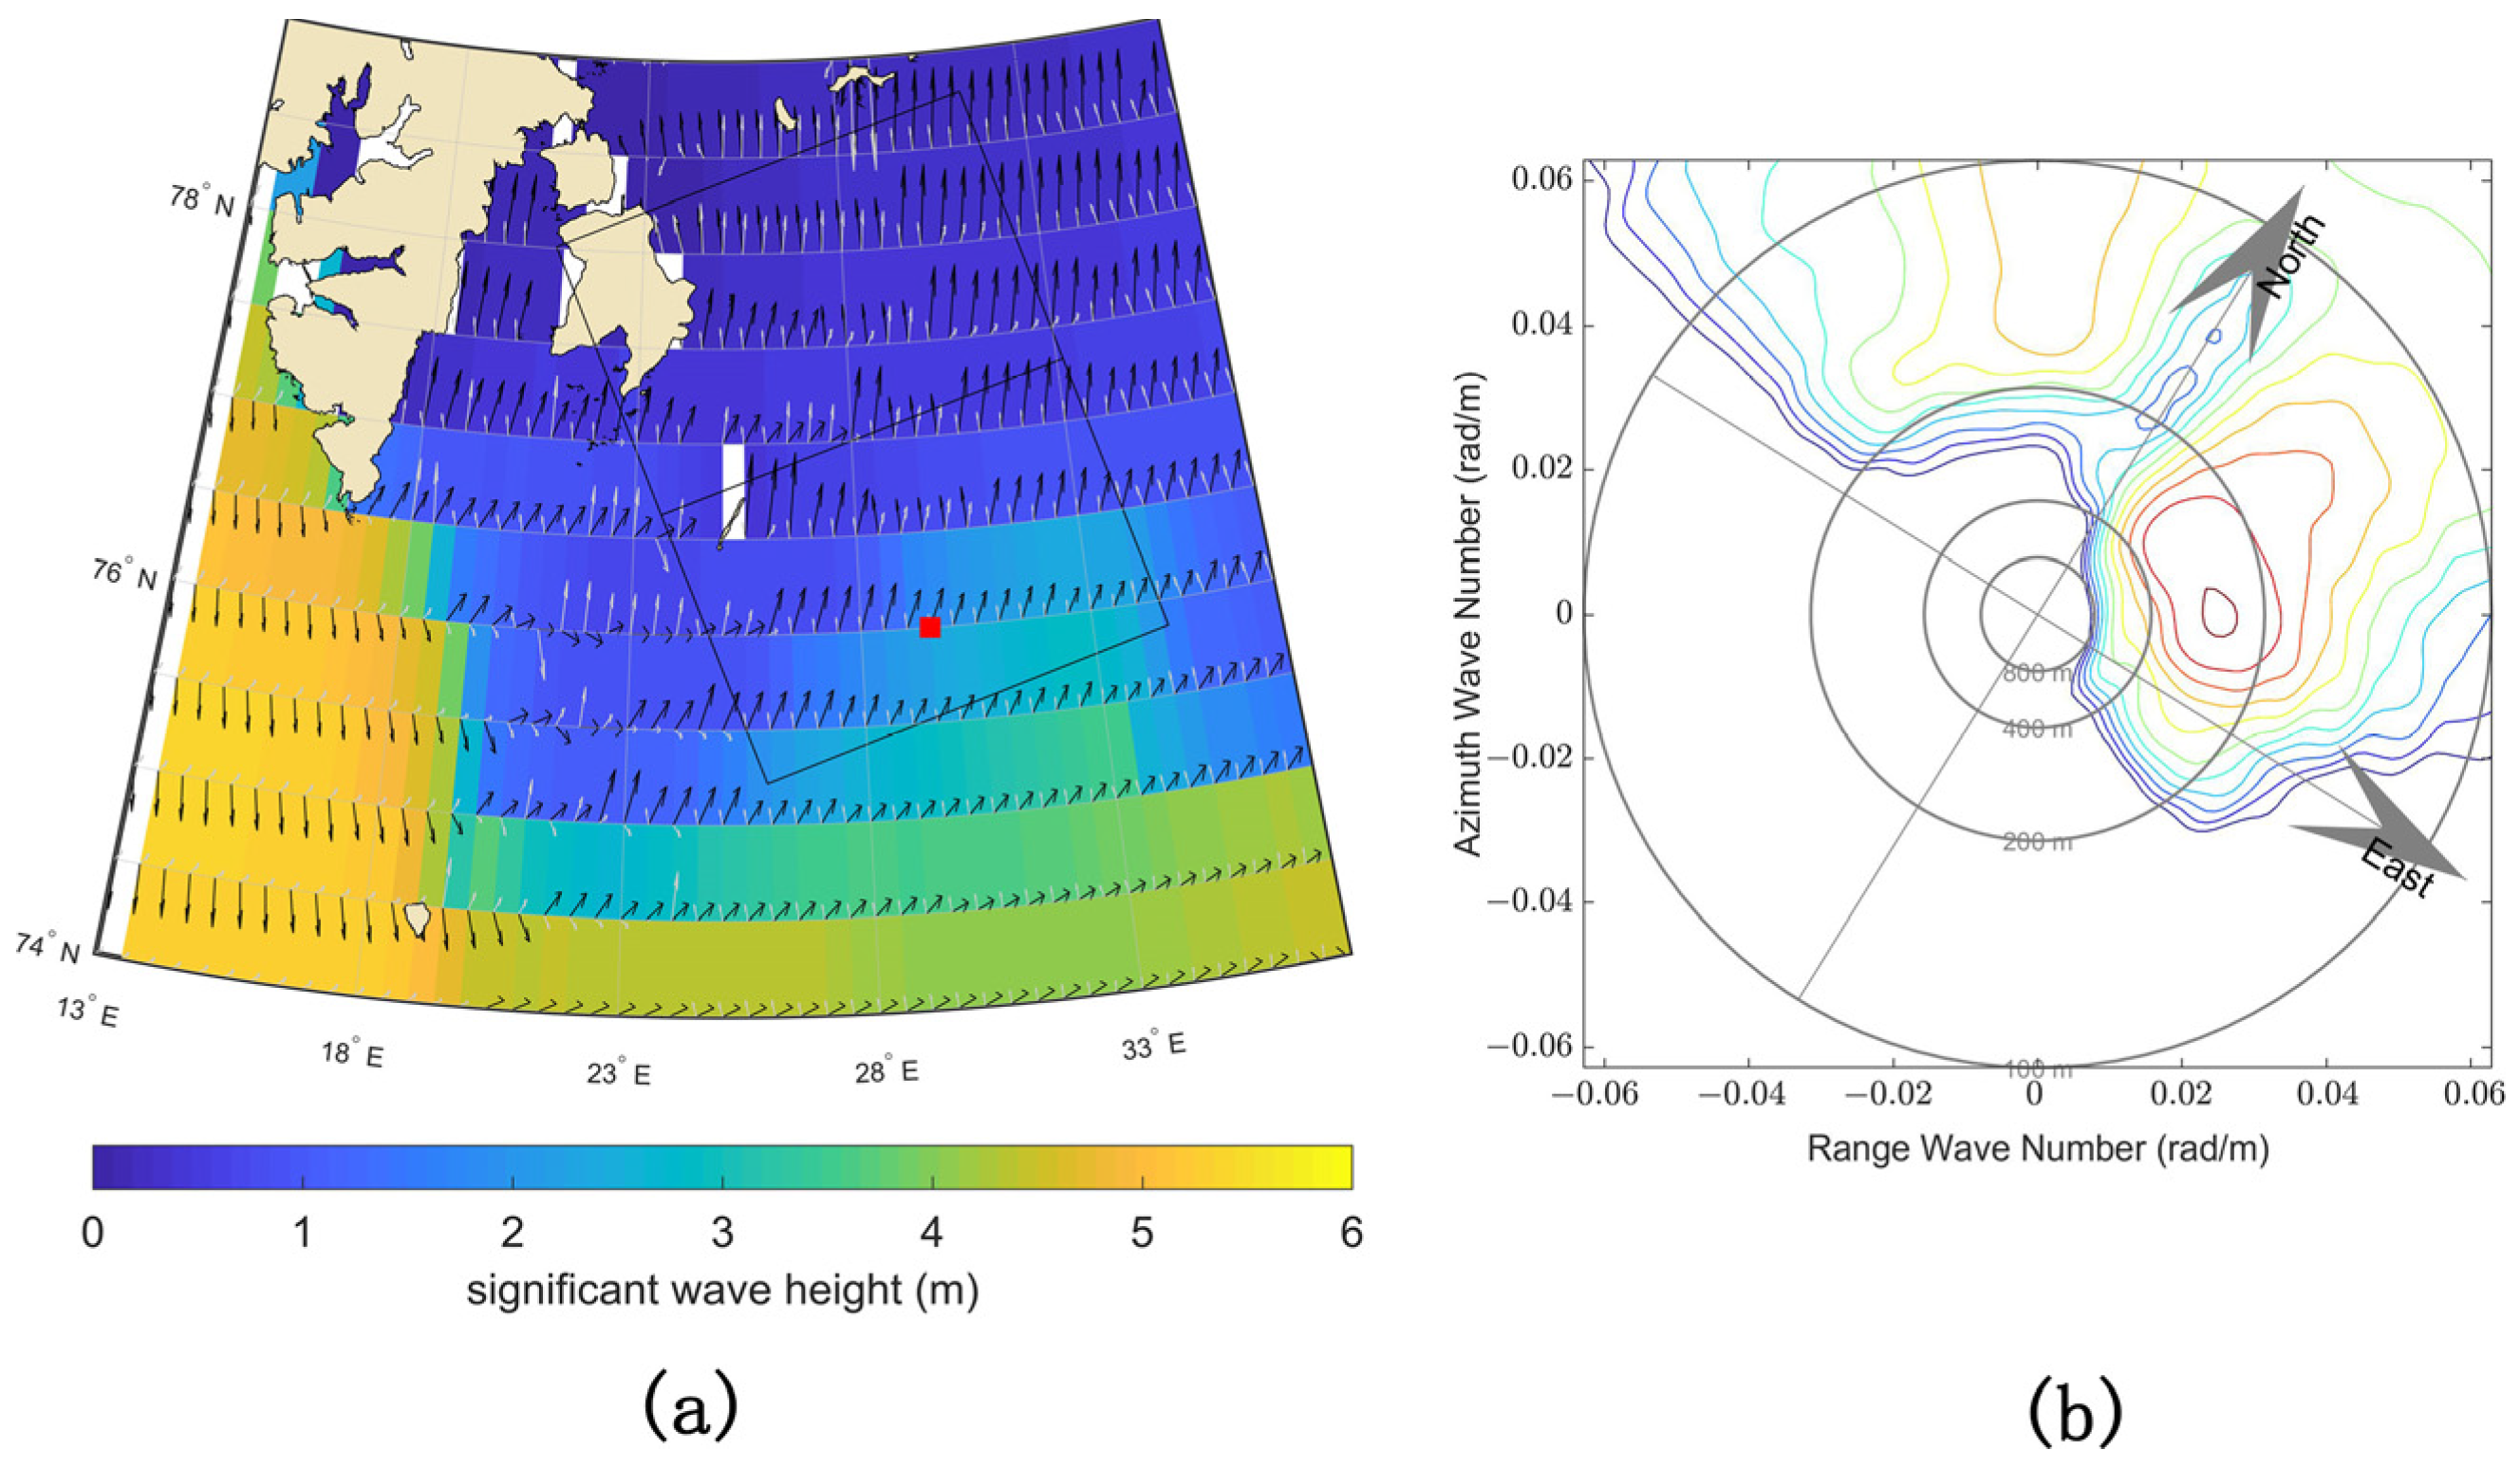
Figure 7a shows the wave field predicted by the NMEFC WW3 at 15 UTC on 20 March. The color in the background represents SWH, and the overlaid black and white arrows show the dominant and secondary wave directions, respectively. The red square in Figure 7a is the last grid of the WW3 model in open water, and after this grid, the model-predicted wave state in the ice-covered area. The grid size of the model is 0.5°, which is not precisely consistent with the ice edge observed in the SAR image. The WW3 OWS at the grid is shown in Figure 7b. Two wave systems are visible in the spectrum. One was propagating to the northeast with a wavelength of approximately 240 m. The other was propagating to the northwest with a wavelength of approximately 90 m. The predicted SWH at the location is 1.86 m.

3.1. Retrieved Results Based on the MPI Scheme

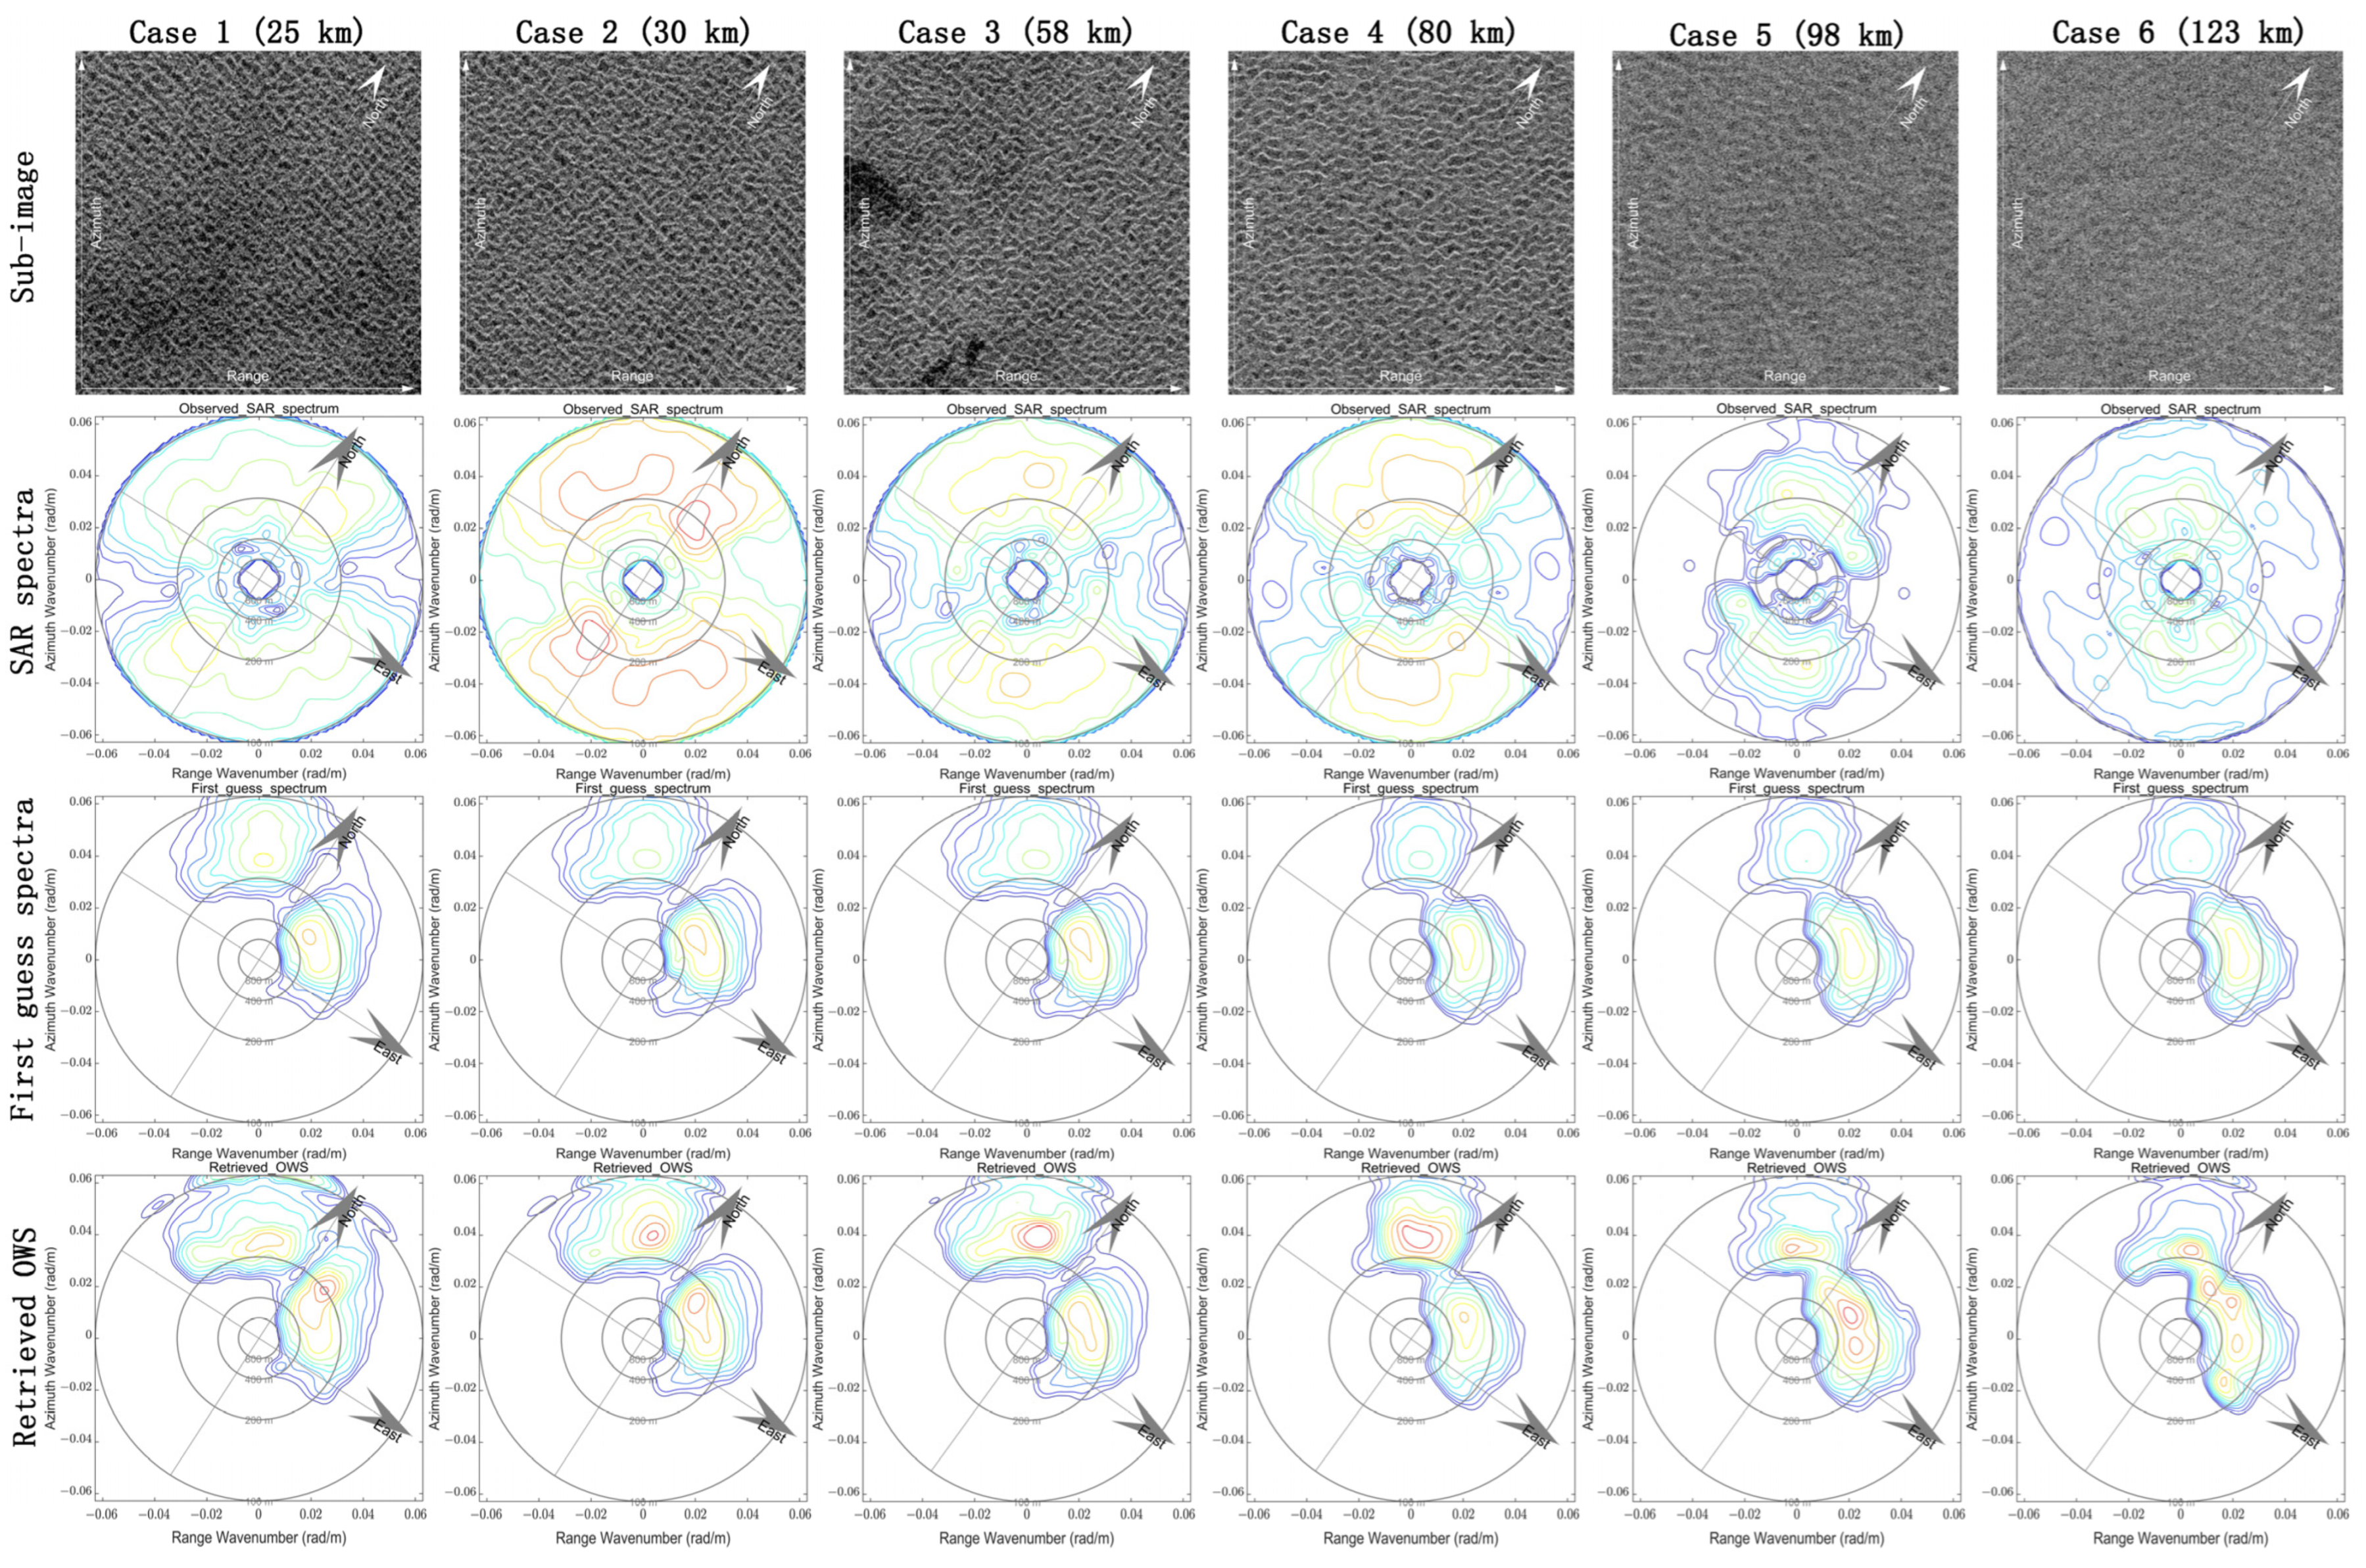
The MPI scheme was applied to six cases along the transect (white dots in the green line in Figure 6a) to retrieve the OWS and the results are shown in Figure 8. Their distances from the ice edge were 25, 30, 58, 80, 98 and 123 km. The first and second rows in Figure 8 show the sub-images and the corresponding derived image spectrum of each case. The WW3 model spectra and the retrieved spectra are presented in the third and last row of Figure 8, respectively. For convenience, the observed SAR spectra in cases 1–6 were unified, as well as the first-guess spectra and retrieved ocean wave spectra. The relative energy is represented in different colors. Dark red represents the highest energy level, while blue indicates the lowest.
We found two wave systems in the SAR images and their image spectra in these cases. One was propagating towards the northeast, and the other was propagating towards the northwest, closing to the flight direction. The two wave systems have comparable intensity in the first two cases, though the northeastward wave is slightly stronger. Starting from case 3, the northeastward wave became relatively weak. The strong contrast between the two wave systems in the SAR spectra emerged but was reduced again in cases 5 and 6. However, no such change was shown in their corresponding first-guess spectra. The prior spectra always show that the northeastward wave dominates.
The last row of Figure 8 shows that the retrieved ocean wave spectra differ from the prior spectra. In cases 2 to 4, the northwestward wave system had stronger energy, while the northwestward component dominated the rest of the cases. The influence of ice distribution might explain these changes. As shown in Figure 6a, there is a piece of tongue-like ice in the southwest of Svalbard. The northeastward wave propagated a longer distance in sea ice when it reached cases 2 to 4 than the other wave system, so the energy attenuated significantly and left the northwestward component dominating. In cases 5 and 6, an open water area appeared in the west. The propagating distance in ice for the northeastward wave is shorter than that in cases 2 to 4, and then the northeastward wave dominates again.
Moreover, we notice that there are differences in spectrum structure. In cases 1 and 2, the predicted spectra show that the northeastward component has a wavelength of about 300 m, whereas the retrieved wavelength is about 200 m. In cases 5 and 6, the predicted wave direction of the northeastward wave is about 60°, but the retrieved spectra show that the wave was propagating along 30°.
Though the retrievals based on the MPI scheme show more plausible results than the model prediction, we found that the retrieval process is hard to converge, with an averaged C.I. of 0.83, which means the values of the cost function were hardly reduced. Noticeable differences still exist between the simulated and observed SAR spectra, which account for 67.61% of the cost function. The poor parameters indicate that the MTF scheme used in open water is not well suited for waves in ice.

3.2. OWS Retrieval Based on the Modified MTFs

In this section, the modified MTF schemes, i.e., the MPI-NTNH and MPI- T i c e t NH schemes, were used to retrieve the OWS in ice-covered areas along the selected transect. The comparisons among the retrievals by different MTFs are presented, and we further discuss the improvements achieved by modified MTFs.
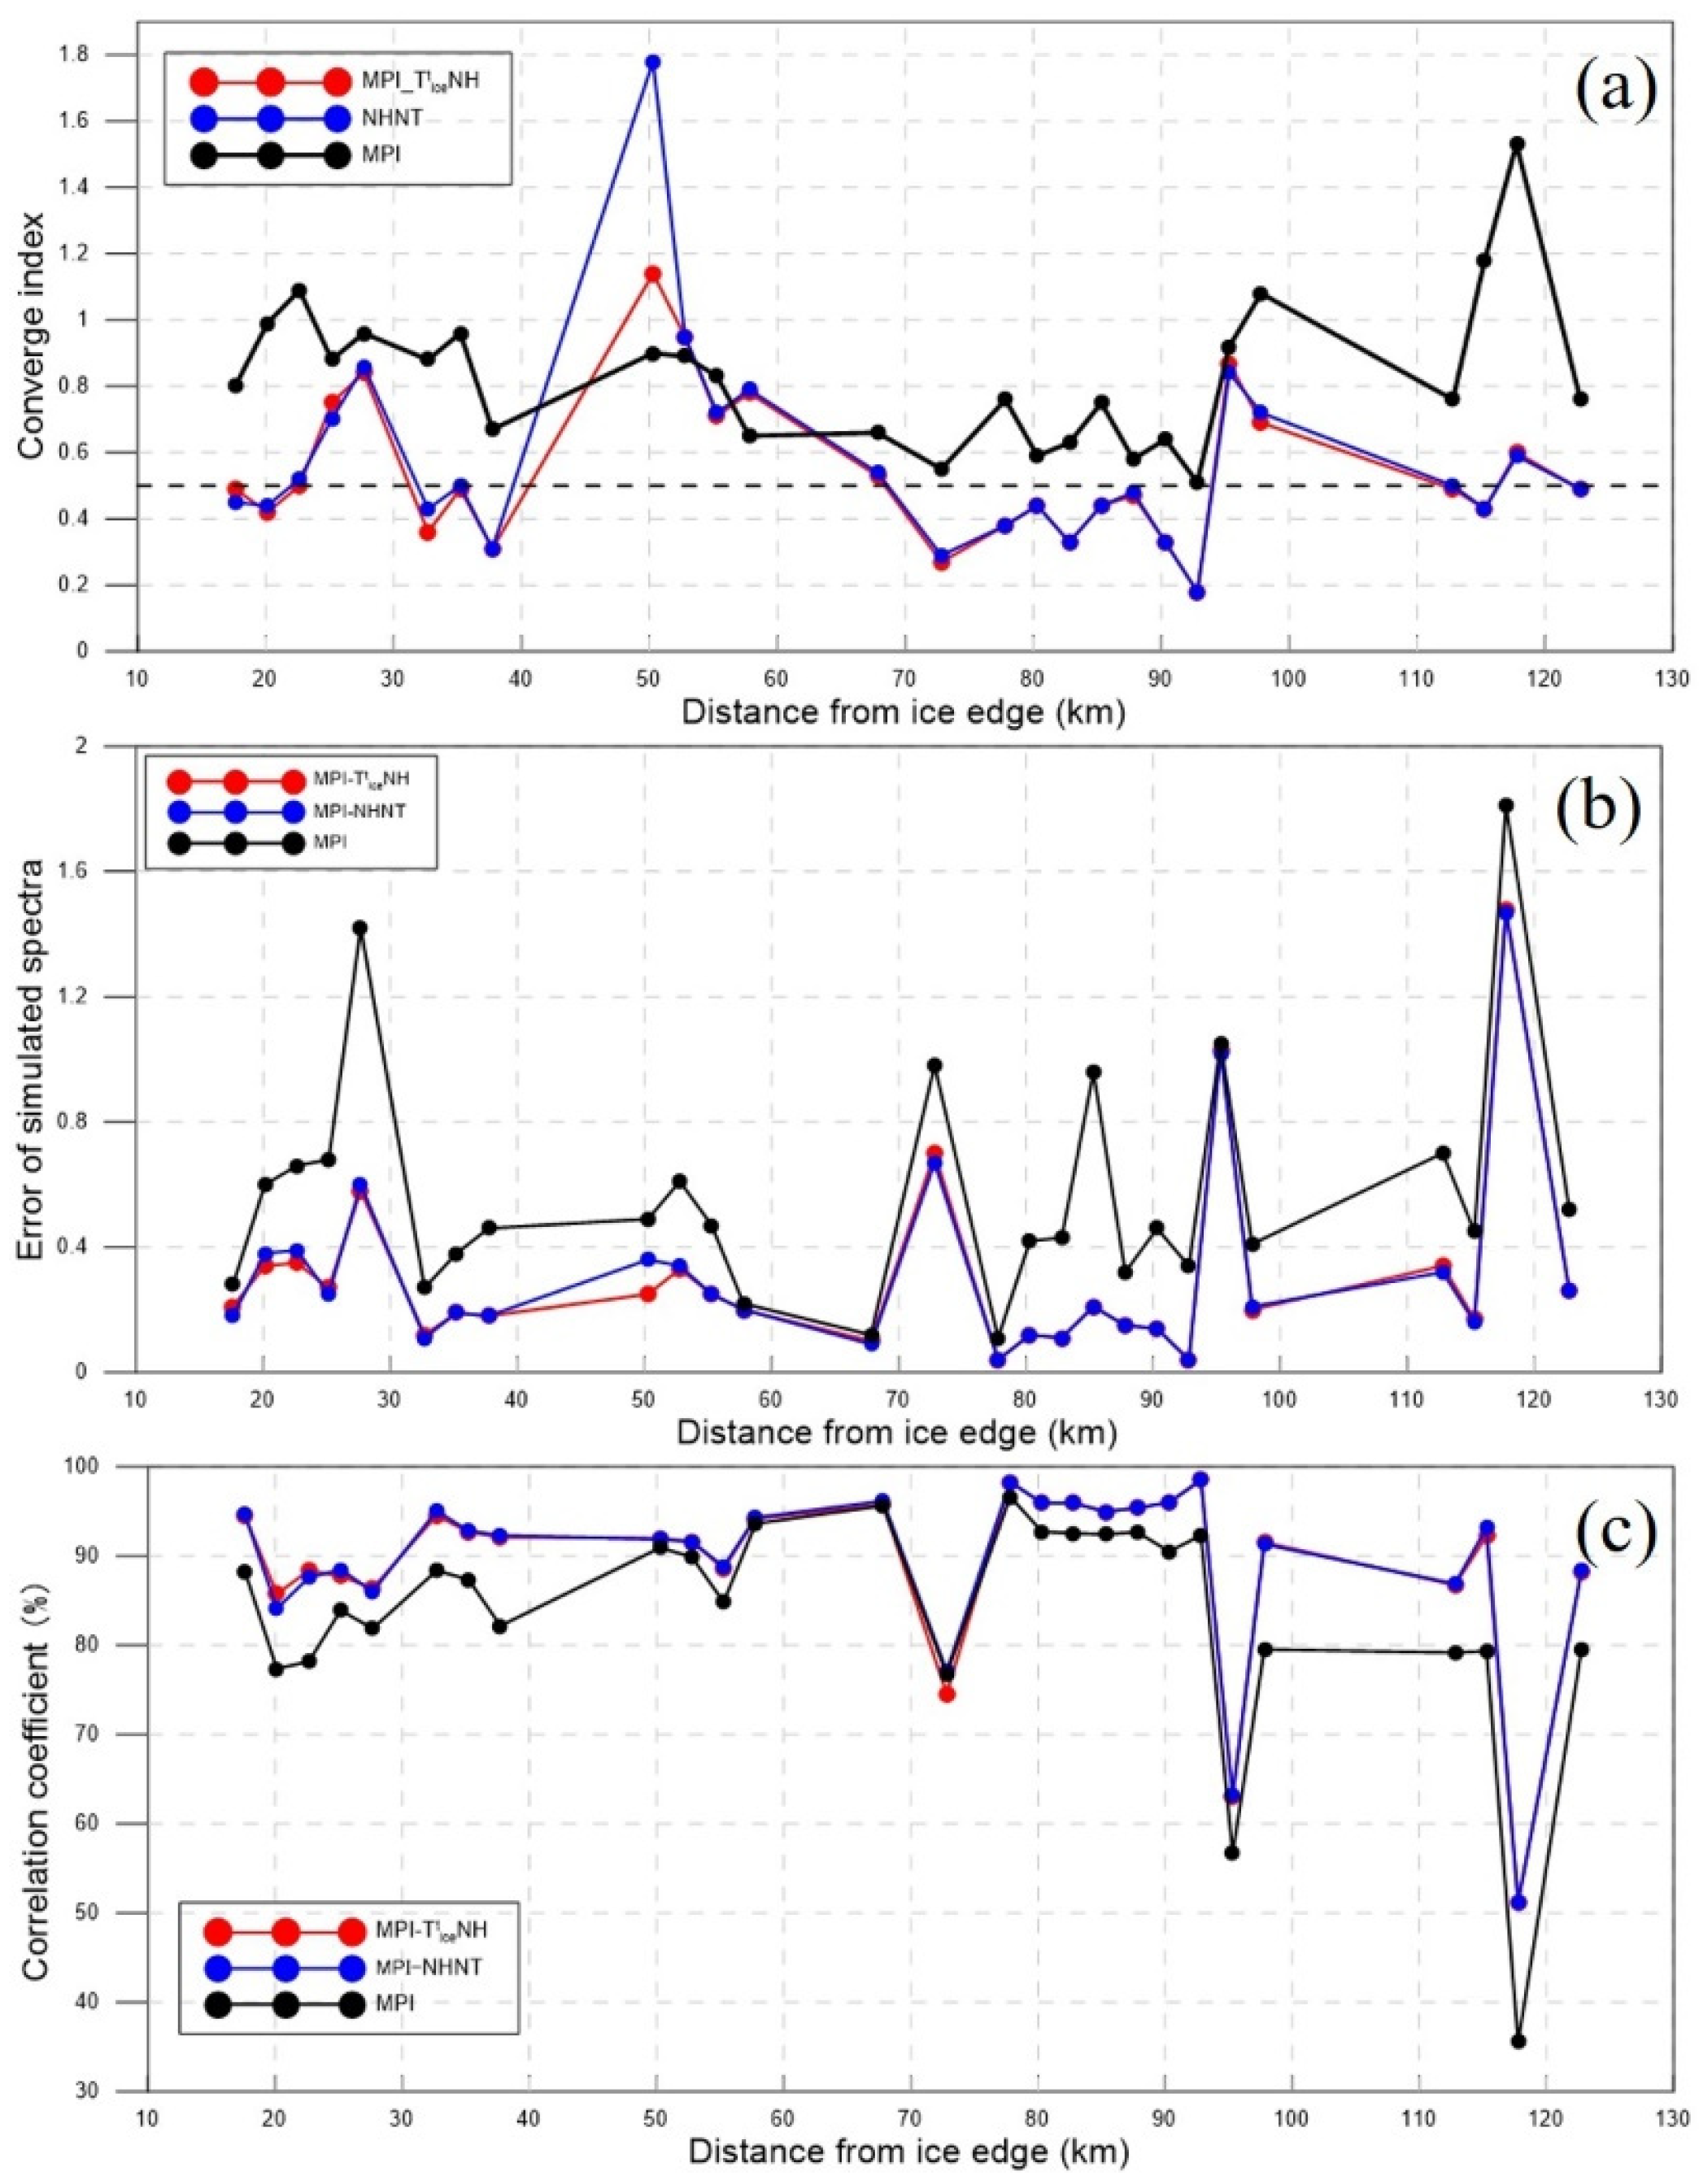
As the SAR images may contain a mixture of sea ice and open water which then influences the retrieval, scenes with heavy mixtures were excluded from comparisons. Eventually, 27 sub-images along the transect (Figure 6) were used for retrievals. The comparisons of their retrieval statistical parameters, i.e., C.I., Err. and Cor., based on the different MTFs are shown in Figure 9. In these plots, the black, blue and red lines represent the statistical parameters achieved by the MPI, the MPI-NTNH and the MPI- T i c e t NH schemes, respectively. The mean values of the statistical parameters of the 27 cases are listed in Table 1. From Figure 9 and Table 1, we can find that both the MPI-NTNH and MPI- T i c e t NH scheme achieve improvements in these statistical parameters.
Using the MPI-NTNH scheme, the C.I. was reduced in nearly all the cases, from 0.83 (MPI scheme) to 0.57 on average. The smaller C.I. indicates that the cost function was reduced effectively, and the inversion is easier to converge. The first term in the cost function, i.e., the weighted squared error of simulated SAR spectra, reduced by 34.18% on average compared with the results of the MPI scheme. It suggests that the simulated spectra by the MPI-NHNT scheme are closer to the observation than those by the MPI scheme. The improvements in the similarity between the simulated and observed SAR spectra were also shown in the changes of Err. and Cor. The Err. of the simulated SAR spectra reduced from 0.58 (MPI scheme) to 0.31, with an average reduction of nearly 50%. The Cor. improved from 83.66% to 89.26%. Improvements in the statistical parameters suggest that neglecting the tilt and hydrodynamic modulations can yield better retrievals than the full MTFs used.
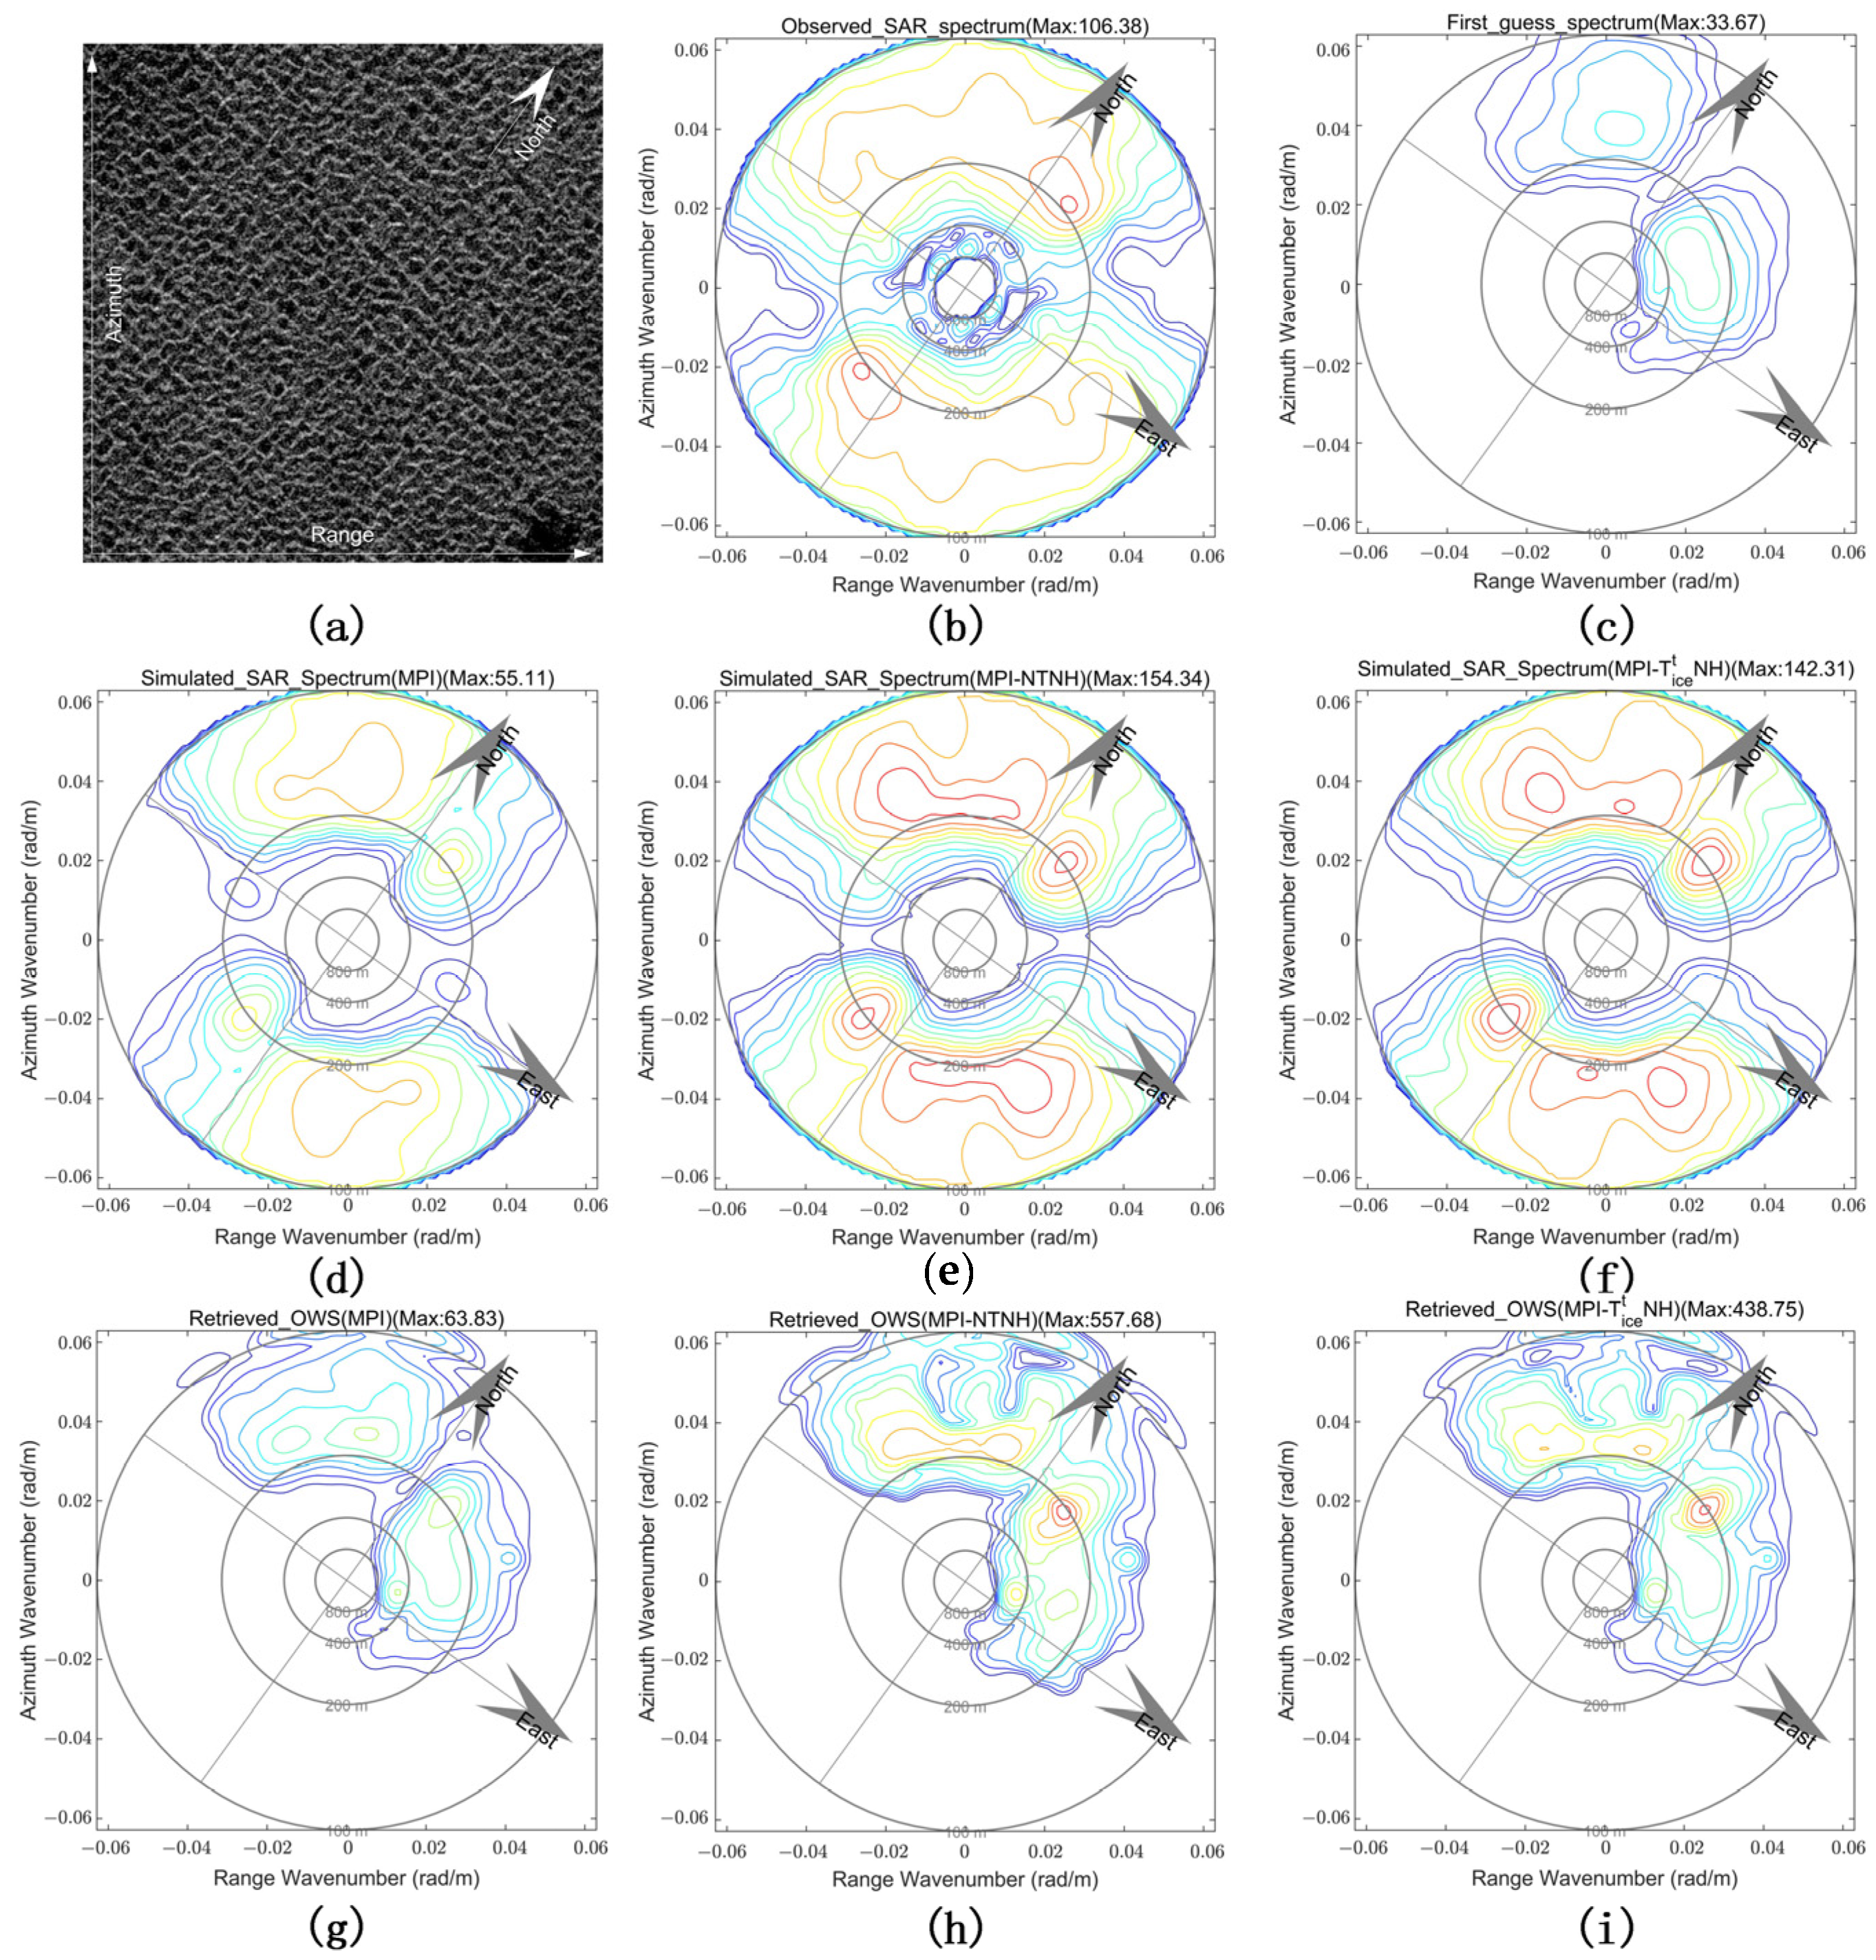
Similar to the performances achieved by the MPI-NTNH scheme, the MPI- T i c e t NH scheme also shows better performance than the MPI scheme. The C.I. reduced from 0.83 to 0.54, and the first term of the cost function reduced by 36.13% on average. The Err. reduced from 0.58 to 0.31, and the Cor. improved from 83.66% to 89.14%. Both the MPI-NTNH and MPI- T i c e t NH schemes show better performance than the MPI scheme, however, with a few exceptions, such as the case located 50 km into the ice edge. The case is referred to as case 7 hereafter, and the corresponding retrieval by different schemes is shown in Figure 10. Figure 10a,b show the extracted sub-image and the corresponding image spectrum, respectively. Clear wave patterns are observed in the sub-image. The simulated SAR spectra by the MPI, MPI-NTNH and MPI- T i c e t NH schemes are shown in Figure 10d–f, and the corresponding retrieved OWS are shown in Figure 10g–i. It can be found that the underestimation of the simulated SAR spectrum is obvious in the MPI scheme, with the maximum energy of the simulated and observed SAR spectra of 55.11 versus 106.38. The improvements were achieved by both the MPI-NTNH (154.34) and MPI- T i c e t NH (142.31) schemes, though with some overestimations. The Err. of the simulated SAR spectrum reduced from 0.49 (MPI scheme) to 0.36 (MPI-NTNH) and to 0.25 (MPI- T i c e t NH). However, the C.I. achieved by the latter two schemes increased significantly. The increase in C.I. was mainly caused by the first-guess spectrum, which may differ significantly from reality. As shown in Figure 10g–i, the retrieved spectra have stronger wave energy than the priori. The retrieved SWH is 0.78, 1.46 and 1.14 m by the MPI, MPI-NTNH and MPI- T i c e t NH schemes, respectively, while the predicted SWH is only 0.52 m. However, the clear wave patterns and image contrast presented in the SAR images indicate that the sea state should not be so low. Thus, we suppose there might be an underestimation in the first-guess spectrum. In addition, significant differences were shown between the retrieved and the first-guess spectra, especially for the northeastward wave component. The predicted wavelength was approximately 300 m, and the propagation direction was about 30°. The retrieved wavelengths and propagation directions by different schemes are close, with values of approximately 200 m and 20°, respectively. The retrieved wavelengths are much shorter than the prediction. Thus, the enlarged discrepancies between the retrieved and prior OWS induced the high value of C.I.
When comparing the statistical parameters achieved by the MPI-NTNH and MPI- T i c e t NH schemes, we found that the MPI- T i c e t NH scheme shows better performance in C.I. with an average of 0.54 versus 0.57 compared to the MPI-NTNH scheme. However, no significant differences are shown in the comparisons of Err. and Cor. The statistical parameters were the average of 27 cases, and the parameters of each case were also averaged in all the wavenumber-wavenumber bins. The differences might vanish during the averaging. On the other hand, the two modified MTF schemes only have a difference in tilt modulation, which concerns more the range-travelling waves. In the selected profile, fewer cases contained near-range wave components. Thus, slight differences were shown in their statistical parameters. However, we find some differences in the simulated spectra derived by the two schemes when the wave propagation direction had a small angle with the radar range direction. An example is shown in Figure 11, which is numbered case 8.
Two wave systems are present in the SAR image spectrum (Figure 11a) and the first-guess spectrum (Figure 11b). One was propagating to the northwest, closing to the flight direction of the satellite, and the other was propagating to the northeast, about 8° by the range direction. The simulated SAR spectra by the MPI, MPI-NTNH and MPI- T i c e t NH schemes are shown in Figure 11c–e. There is an underestimation of the northeastward (close to range direction) wave component by the MPI scheme. The MPI-NTNH and MPI- T i c e t NH schemes better reproduce this wave system, especially the latter one, as one can see clearly that the peak contour is comparable with that in the SAR spectrum. The simulated spectral peak density and wavelength of the northeastward wave component by the MPI- T i c e t NH scheme are 27.85 and 273 m, closer to the SAR observations of 31.88 and 279 m than those (24.42 and 288 m) achieved by the MPI-NTNH scheme.
This subsection presents the analysis of performances of retrieving the OWS in ice-covered areas by SAR based on different schemes. The comparisons suggest that neglecting hydrodynamic modulation can yield better retrievals than the full MTFs applied in the retrieval. Although overall statistical parameters achieved in the retrievals suggest that neglecting tilt modulation or not yields similar results, a case with a range-travelling wave does show their differences. Therefore, in the following subsection, we focus on the impact of tilt modulation on retrievals.

3.3. Retrieval of a Case with Range-Travelling Waves

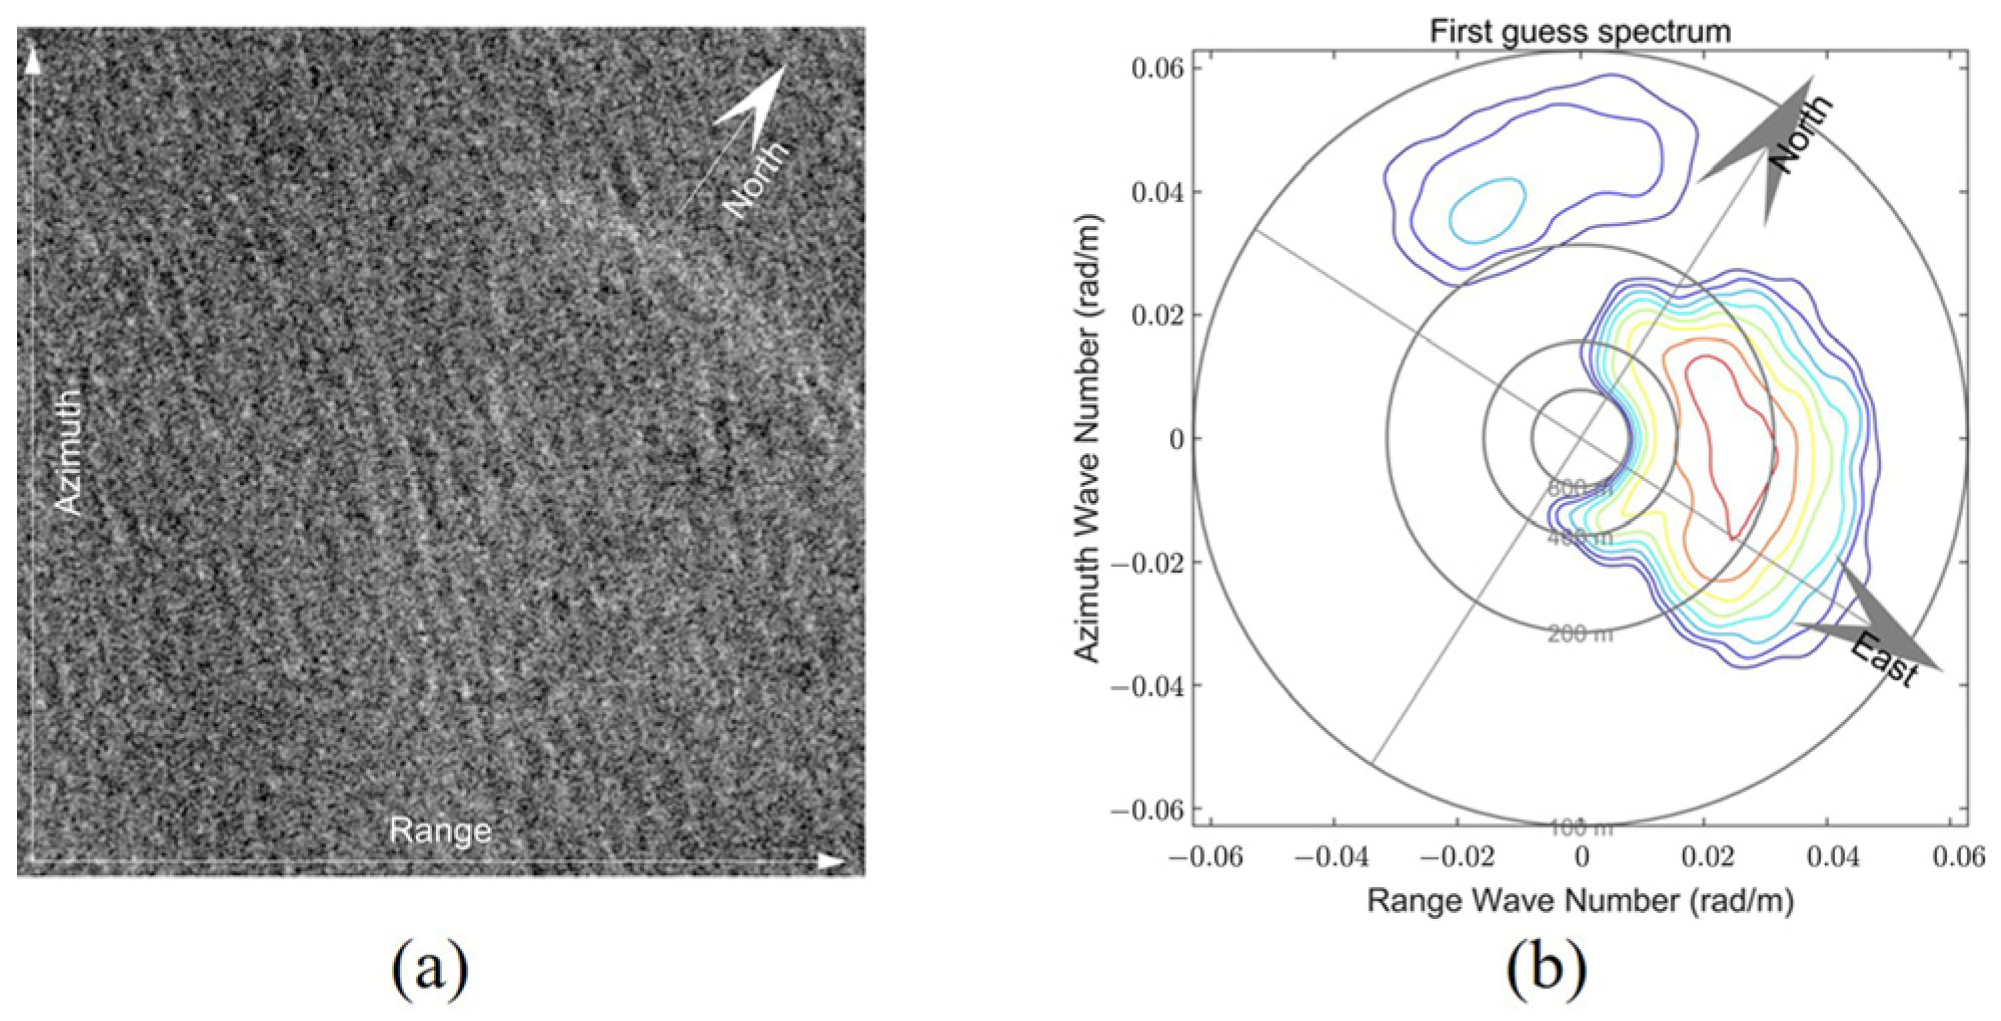
As the tilt modulation concerns more the range-travelling waves, case 9 with the dominant range-travelling wave was selected to make a further comparison between the MPI-NTNH and MPI- T i c e t NH schemes. The case is located at 76.74°N, 24.09°E in an ice-covered area. The sub-image of the case is shown in Figure 12a, with an incidence angle of 31.36°. Figure 12b shows the collocated first-guess spectrum, presenting a sea state with range-travelling waves.
The statistical parameters, i.e., the C.I., Err. and Cor. achieved by MPI, MPI-NTNH and MPI- T i c e t NH schemes, are listed in Table 2. Significant improvements were achieved by both the MPI-NTNH and MPI- T i c e t NH schemes, with the C.I. reducing from 0.62 (MPI scheme) to 0.32 (MPI-NTNH) and to 0.22 (MPI- T i c e t NH). The Err. reduced from 0.92 to 0.51 and 0.33, respectively. The Cor. improved to 77.96% (MPI-NTNH scheme) and 85.48% (MPI- T i c e t NH) from 59.93% in the MPI scheme.
The parameters show that the performance of the MPI- T i c e t NH is better than the MPI-NTNH scheme, as the range-travelling component dominates in this case. The C.I. is 0.22 versus 0.32 (MPI-NTNH scheme), which means the MPI- T i c e t NH scheme more easily finds the optimal solution than the MPI-NTNH scheme. The smaller Err. (0.22) and higher Cor. (85.48%) also suggest that the simulated SAR spectrum is much closer to the observed spectrum than the MPI-NTNH scheme, which has an Err. and Cor. of 0.32 and 77.96%.
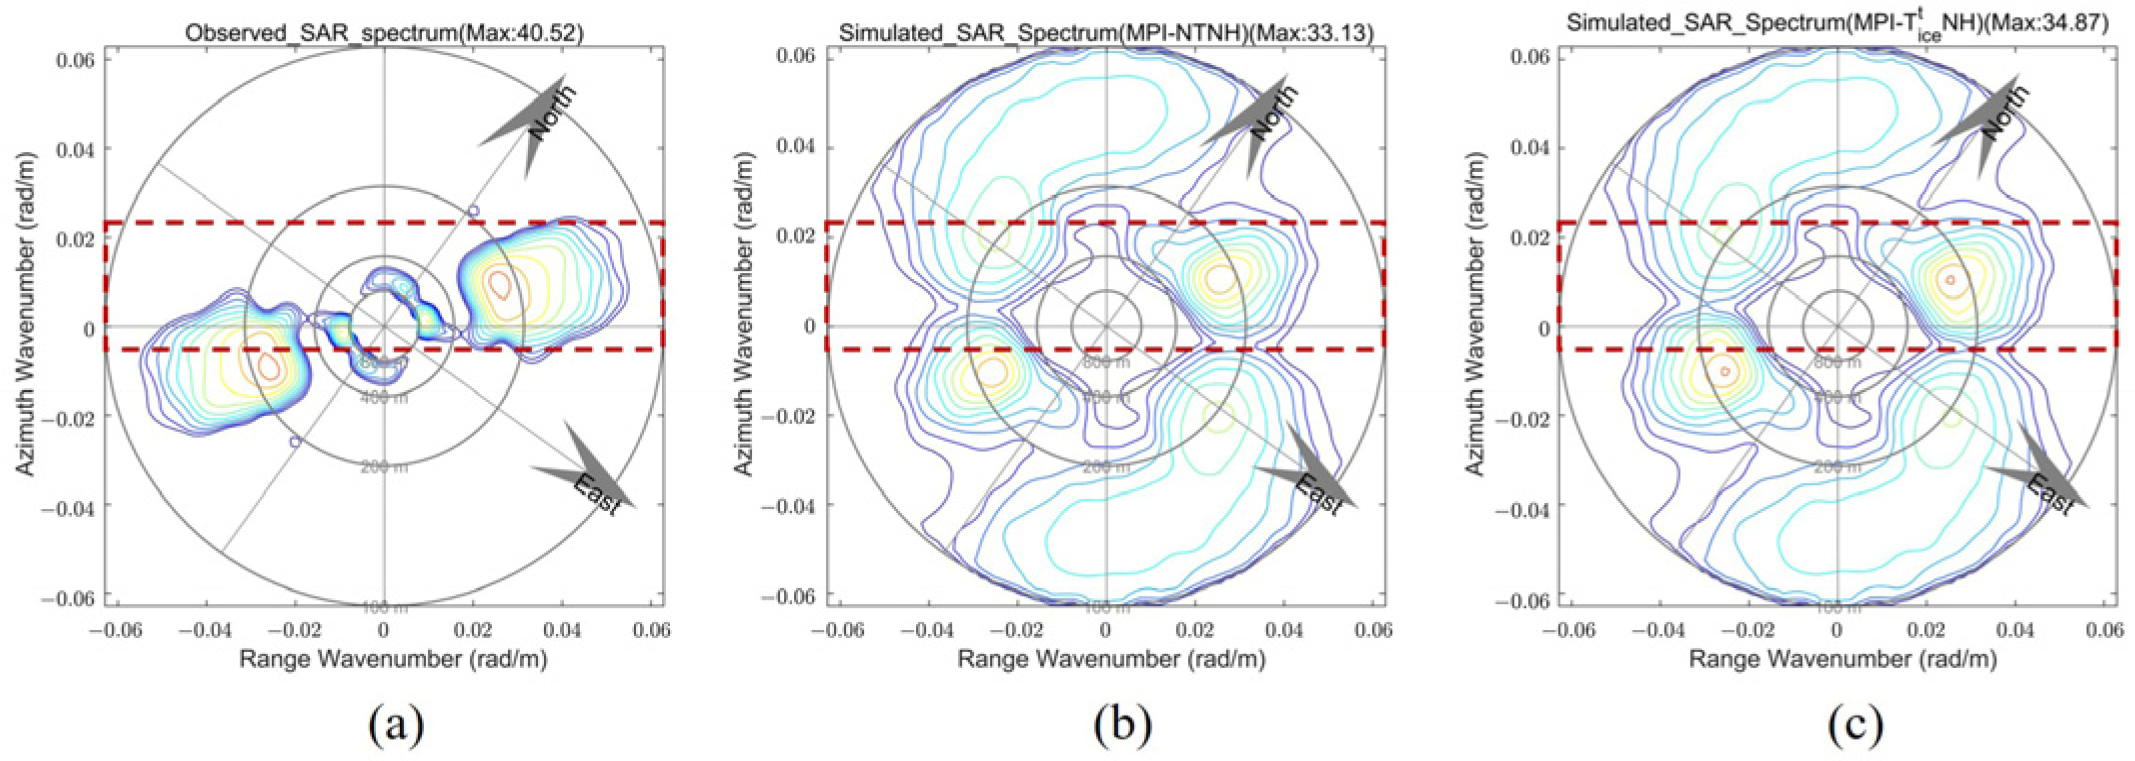
Further comparison was made on the simulated SAR spectra between the MPI-NTNH and MPI- T i c e t NH schemes. Shown in Figure 13a is the observed SAR spectrum. Figure 13b,c show the simulated SAR spectra by MPI-NTNH and MPI- T i c e t NH schemes, respectively. The spectra have been unified, and the color indicates the relative energy. Focusing on the dominant wave component (red rectangle area), we can see that both the MPI-NTNH and MPI- T i c e t NH schemes can yield the simulations that are close to the SAR observation. The simulated peak wavelength and wave direction are identical to the SAR observation, with values of 33.4° and 228 m. However, the energy of the simulated spectra was slightly underestimated. The maximum energy of the observed SAR spectrum is 40.52. The underestimation of peak energy is slightly worse by the MPI-NHNT scheme than by the MPI- T i c e t NH scheme, with maximum energy of 33.13 versus 34.84. From Figure 13b,c, we can see that the spectrum derived by the MPI-NTNH scheme has a narrower shape than that by the MPI- T i c e t NH scheme, especially near the range direction. It means more underestimations for wave energy near the range direction caused by the small modulation in the MPI-NTNH scheme for range-travelling waves. The simulated SAR spectrum by the MPI- T i c e t NH scheme is closer to observation than the MPI-NTNH scheme. There is an additional eastward component in the simulated SAR spectra by both schemes, which is not visible in the observed SAR spectrum. This difference is induced by the first-guess spectrum (Figure 12b), which provides a northeastward wave component with a wavelength of about 161 m. Moreover, the first-guess spectrum predicts a relatively strong energy level eastward. Therefore, the eastward component was forward mapped to the simulated SAR spectrum and was reserved during the inversion.
Both this case of the range-travelling wave dominating and the one in the previous section highlight the necessity of involving the tilt modulation in accurately retrieving the two-dimensional wave spectra in ice-covered areas by SAR.

4. Conclusions

Lacking observation data is a significant obstacle to studying the interaction between sea ice and ocean waves. Deploying in situ wave buoys in the MIZ, particularly in the ice-covered area, is even more complicated than in the open water. Remote sensing should play an important role in such a study. As an imaging radar, SAR can yield observations of waves travelling in ice-covered areas in high spatial resolution and broad coverage. It has competitive advantages in studying this interesting phenomenon emerging in the MIZ of polar regions. With the SAR-derived OWS, one can achieve variations not only in SWH but also in the wavelength and direction of ocean waves travelling in ice-covered areas, which are keys to understanding the mechanisms of the interaction and can contribute significantly to wave–ice coupling modelling in the polar regions.
In the early 1990s, K. Hasselmann and S. Hasselmann [19] proposed the nonlinear retrieval scheme, i.e., the MPI scheme, to retrieve ocean wave spectra by spaceborne SAR data [36,37]. This method is still currently in use [42]. The MPI scheme is proposed based on the MTFs from the OWS to SAR image spectrum, which are generally accepted for waves in open water. However, in ice-covered area, the MTFs remain to be further investigated, and therefore the classical MPI scheme is less applied.
In this study, we attempted to retrieve the OWS for waves in ice by spaceborne SAR based on different combinations of MTFs to verify which applies to the scenario of ocean waves travelling in ice. One scheme (MPI scheme) involves all three dominant modulations, i.e., hydrodynamic modulation, tilt modulation and velocity bunching. The second scheme neglects the hydrodynamic and tilt modulations (MPI-NTNH scheme). The third one also neglects the hydrodynamic modulation but remains the tilt modulation (MPI- T i c e t NH scheme). As no tilt modulation is available for HH-polarized SAR data over sea ice, we derived one based on the collected S1 data in this study.
Experiments on retrieving the OWS with the different combinations of MTFs were conducted for S1 IW data acquired in the MIZ in the Barents Sea in March 2021. In this case, swells generated by remote storms in the Atlantic propagated in the MIZ as far as 130 km from the ice edge.
Although the experiment based on the same MTFs as those used for retrieving the OWS by spaceborne SAR in open water can yield retrievals in sea ice, the convergence index is quite large, indicating that the retrievals are hard to converge. This means the MTFs in the MPI inversion scheme are not fully applicable for retrievals in ice-covered areas. The statistical parameters diagnosing retrievals achieved in the experiments of MPI-NTNH and MPI- T i c e t NH show significant improvements compared with those in the experiment by applying the MTFs in water. The C.I. reduces from 0.83 (MPI scheme) to 0.57 (MPI-NTNH scheme) and 0.54 (MPI- T i c e t NH scheme), indicating the inversion is easier to converge with the MPI-NTNH and MPI- T i c e t NH schemes. The Err. reduces by nearly 50% and the Cor. improves from 83.66% to approximately 89%, which suggests that the simulated SAR spectrum is closer to the observed SAR spectrum. This result further proves that velocity bunching is the main modulation of SAR imaging ocean waves in ice and hydrodynamic modulation is neglectable, as previous studies have found. However, no significant difference in the three statistical parameters appears in the retrievals based on the MPI-NTNH and MPI- T i c e t NH schemes. It needs to be pointed out that the statistical parameters were averaged in the whole spectral domain and all cases.
We further presented a case in which the range-travelling wave was dominating. The MPI- T i c e t NH scheme performs better than the MPI-NTNH scheme, and the C.I. is 0.22 versus 0.32. The MPI- T i c e t NH scheme achieved smaller Err. and higher Cor. with values of 0.33 and 85.48%, compared with those of 0.51 and 77.86% achieved by the MPI-NHNT scheme. The results indicate that though the tilt modulation has a minor contribution to the imaging process for waves in ice, more accurate results can be achieved using the suitable tilt MTF.
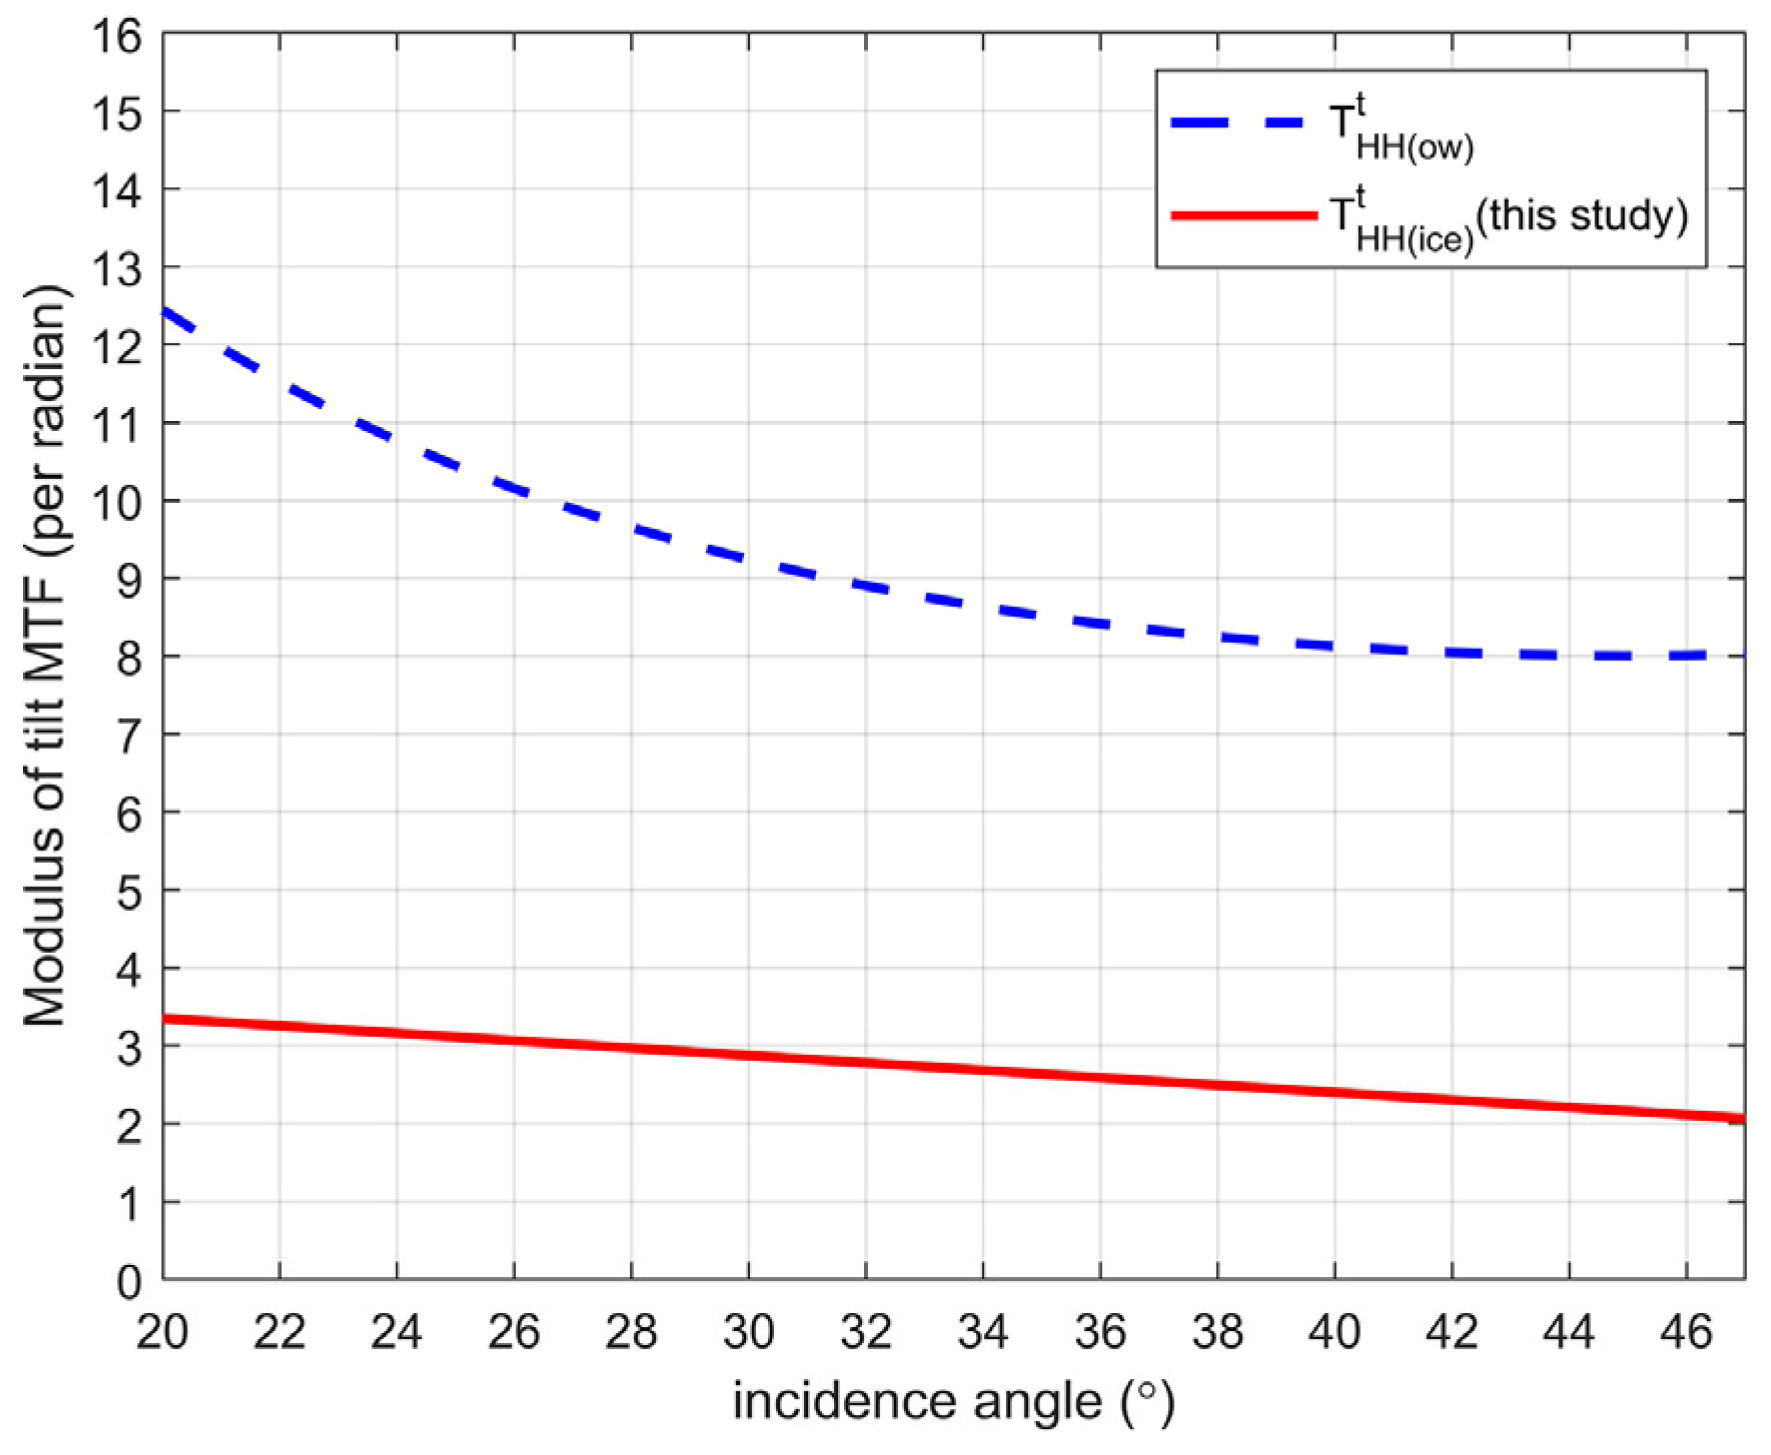
In this study, the derived tilt modulation for HH-polarized SAR data in ice is based on 11 S1 EW data points, which have incidence angles between 19° to 47°. Moreover, the mean ice thickness along the selected transects was approximately 0.69 m, and the sea ice was mainly composed of young ice and thin first-year ice. We compared the magnitude of the derived tilt modulation with that in open water [19] (both for HH polarization), as shown in Figure 14. It was found that the latter is over three times more than the former when the incidence angle is in the range of 19° to 47°. According to the theoretical analysis [44], the level of radar backscatter for the HH-polarized microwave drops faster when the dielectric constant increases. As seawater generally has a higher dielectric constant than ice, the backscatter coefficients of seawater drop faster than ice, along with the incidence angle increasing. The definition of tilt modulation (Equation (10)) indeed reflects the change in radar backscatter along with incidence angle, i.e., the smaller the change is, the smaller the tilt modulation is.
The radar backscatter of sea ice is complicated, and surface scattering and volume scattering can have joint contributions to the radar backscatter [44]. The level of backscatter can be changed with the stage of sea ice development and sea ice forms. The characteristics of sea ice, such as salinity, wetness, temperature and snow cover, can also influence the radar backscatter. As the ice condition may change along the wave propagation, the relationship between the NRCS and incidence angle may change accordingly. Consequently, the derived tilt modulation can have different magnitudes and contributions to the imaging process of waves in ice by SAR.
Nevertheless, this study analyzed in detail the feasibility of retrieving two-dimensional spectra for ocean waves travelling in sea ice by spaceborne SAR. We derived a tilt MTF for the HH-polarized SAR data based on the S1 data. The comparisons of retrievals based on different schemes suggest the following: (i) the hydrodynamic modulation is negligible in the nonlinear retrieval; (ii) the tilt modulation has a secondary contribution to the imaging process of waves in ice by SAR compared to the velocity bunching. To achieve more accurate retrievals, it is suggested to involve suitable tilt modulation in the MTFs, especially when the range-travelling waves dominate. In the MIZ of the Arctic, just like the Barents Sea, which is adjacent to the Atlantic, strong swells and crossing seas are often observed. Remote storms generate these waves in the Atlantic at different moments; therefore, excluding cases without range-travelling components is challenging. We are collecting more cases to verify impacts of tilt modulation on the retrievals in different scenarios. Moreover, based on the retrieval of two-dimensional wave spectra, the changing of wave energy, wavelength and propagation direction of different components can be qualified, which are essential for understanding the interaction between sea ice and waves.
Author Contributions

Conceptualization, X.L.; formal analysis, B.H. and X.L.; writing—original draft preparation, B.H.; writing—review and editing, X.L.; visualization, B.H.; supervision, X.L.; funding acquisition, X.L. All authors have read and agreed to the published version of the manuscript.

Funding

The study was funded by the National Science Fund for Distinguished Young Scholars (42025605) and by the National Key Research and Development Project (2018YFC1407100) China.

Data Availability Statement

The S1 SAR data used in the study are available at https://scihub.copernicus.eu/dhus/#/home (accessed on 2 November 2022). The ERA5 reanalysis data are available at https://cds.climate.copernicus.eu/cdsapp#!/dataset/reanalysis-era5-single-levels-monthly-means?tab=form (accessed on 2 November 2022). The SMOS and SMAP combined thickness of thin ice were downloaded from https://seaice.uni-bremen.de/data/smos_smap/ (accessed on 2 November 2022). The ICESAT-2 monthly gridded ice thickness data were downloaded from https://n5eil01u.ecs.nsidc.org/ICESAT2_PO/IS2SITMOGR4.002/. The U.S. National Ice Center Arctic and Antarctic Sea Ice Charts were downloaded from https://nsidc.org/data/g10013/versions/1 (accessed on 2 November 2022).

Acknowledgments

We thank the European Space Agency for providing the Sentinel-1 data and the National Marine Environment Forecasting Center for providing the WW3 model data.

Conflicts of Interest

The authors declare no conflict of interest.

References

  1. Rantanen, M.; Karpechko, A.; Lipponen, A.; Nording, K.; Hyvärinen, O.; Ruosteenoja, K.; Vihma, T.; Laaksonen, A. The Arctic has warmed four times faster than the globe since 1979. Commun. Earth Environ. 2022, 168, 1–10. [Google Scholar] [CrossRef]
  2. Screen, J.A.; Simmonds, I. The central role of diminishing sea ice in recent Arctic temperature amplification. Nature 2010, 464, 1334–1337. [Google Scholar] [CrossRef] [Green Version]
  3. Serreze, M.C.; Francis, J.A. The Arctic amplification debate. Clim. Change 2006, 76, 241–264. [Google Scholar] [CrossRef]
  4. Solomon, S.; Qin, D.; Manning, M.; Chen, Z.; Marquis, M.; Avery, K.; Tignor, M.; Miller, H.L. Contribution of Working Group I to the fourth assessment report of the Intergovernmental Panel on Climate Change Fourth Assessment Report. In Climate Change 2007: The Physical Science Basis; Cambridge University Press: Cambridge, UK; New York, NY, USA, 2007. [Google Scholar]
  5. Jeffries, M.O.; Overland, J.E.; Perovich, D.K. The Arctic shifts to a new normal. Phys. Today 2013, 66, 35. [Google Scholar] [CrossRef] [Green Version]
  6. Kohout, A.L.; Williams, M.J.M.; Dean, S.M.; Meylan, M.H. Storm-induced sea-ice breakup and the implications for ice extent. Nature 2014, 509, 604–607. [Google Scholar] [CrossRef]
  7. Thomson, J.; Rogers, W.E. Swell and sea in the emerging Arctic Ocean. Geophys. Res. Lett. 2014, 41, 3136–3140. [Google Scholar] [CrossRef]
  8. Ardhuin, F.; Stopa, J.; Chapron, B.; Collard, F.; Smith, M.; Thomson, J.; Doble, M.; Blomquist, B.; Persson, O.; Collins, C.O.; et al. Measuring ocean waves in sea ice using SAR imagery: A quasi-deterministic approach evaluated with Sentinel-1 and in situ data. Remote Sens. Environ. 2017, 189, 211–222. [Google Scholar] [CrossRef] [Green Version]
  9. Liu, Q.; Babanin, A.V.; Zieger, S.; Young, I.R.; Guan, C. Wind and wave climate in the Arctic Ocean as observed by altimeters. J. Clim. 2016, 29, 7957–7975. [Google Scholar] [CrossRef]
  10. Dumont, D.; Kohout, A.; Bertino, L. A wave-based model for the marginal ice zone including a floe breaking parameterization. J. Geophys. Res. Oceans 2011, 116, 1–10. [Google Scholar] [CrossRef] [Green Version]
  11. Rolph, R.J.; Feltham, D.L.; Schröder, D. Changes of the Arctic marginal ice zone during the satellite era. Cryosphere 2020, 14, 1971–1984. [Google Scholar] [CrossRef]
  12. Strong, C.; Rigor, I.G. Arctic marginal ice zone trending wider in summer and narrower in winter. Geophys. Res. Lett. 2013, 40, 4864–4868. [Google Scholar] [CrossRef]
  13. Wadhams, P.; Parmiggiani, F.F.; De Carolis, G.; Desiderio, D.; Doble, M.J. SAR imaging of wave dispersion in Antarctic pancake ice and its use in measuring ice thickness. Geophys. Res. Lett. 2004, 31, 305–316. [Google Scholar] [CrossRef]
  14. Young, I.R.; Zieger, S.; Babanin, A. Development and Application of a Global Satellite Database of Wind and Wave Conditions. In Proceedings of the ASME 2015 34th International Conference on Ocean, Offshore and Arctic Engineering, St. John’s, Newfoundland, Canada, 31 May–5 June 2015. [Google Scholar] [CrossRef]
  15. Young, I.R.; Ribal, A. Multiplatform evaluation of global trends in wind speed and wave height. Science 2019, 364, 548–552. [Google Scholar] [CrossRef]
  16. Alpers, W.; Rufenach, C.L. The effect of orbital motions on synthetic aperture radar imagery of ocean waves. IEEE Trans. Antennas Propag. 1979, 27, 685–690. [Google Scholar] [CrossRef]
  17. Alpers, W.; Ross, D.B.; Rufenach, C.L. On the detectability of ocean surface waves by real and synthetic aperture radar. J. Geophys. Res. 1981, 86, 6481–6489. [Google Scholar] [CrossRef]
  18. Hasselmann, K.; Raney, R.K.; Plant, W.J.; Alpers, W.; Shuchman, R.A.; Lyzenga, D.R.; Rufenach, C.L.; Tucker, M.J. Theory of synthetic aperture radar ocean imaging: A MARSEN view. J. Geophys. Res. Oceans 1985, 90, 4659–4686. [Google Scholar] [CrossRef]
  19. Hasselmann, K.; Hasselmann, S. On the nonlinear mapping of an ocean wave spectrum into a synthetic aperture radar image spectrum and its inversion. J. Geophys. Res. Oceans 1991, 96, 10713–10729. [Google Scholar] [CrossRef]
  20. Hauser, D.; Tourain, C.; Hermozo, L.; Alraddaw, D.; Aouf, F.; Chapron, B.; Dalphinet, A.; Delaye, L.; Dalila, M.; Dormy, E.; et al. New Observations from the SWIM Radar on-board CFOSAT: Instrument validation and ocean Wave Measurement Assessment. IEEE Trans. Geosci. Remote Sens. 2020, 59, 5–26. [Google Scholar] [CrossRef]
  21. Dawe, B.; Parashar, S. SAR Imaging of waves in ice. In Proceedings of the Oceans ’78, IEEE/MTS, Washington, DC, USA, 6–8 September 1978. [Google Scholar] [CrossRef]
  22. Lyden, J.; Schuchman, R.; Zago, C.; Rottier, R.; Wadhams, P.; Jahannessen, O. SAR imaging of ocean waves in the Marginal Ice Zone. In Proceedings of the IEEE Geoscience and Remote Sensing Symposium, Edinburgh, UK, 12–16 September 1988. [Google Scholar] [CrossRef]
  23. Lyzenga, D.R.; Shuchman, R.A.; Lyden, J.D. SAR imaging of waves in water and ice: Evidence for velocity bunching. J. Geophys. Res. Oceans 1985, 90, 1031–1036. [Google Scholar] [CrossRef]
  24. Vachon, P.W.; Olsen, R.; Krogstad, H.E.; Liu, A.K. Airborne synthetic aperture radar observations and simulations for waves in ice. J. Geophys. Res. 1993, 98, 16411–16425. [Google Scholar] [CrossRef]
  25. Vachon, P.W.; Olsen, B.R.; Livingstone, E.C.; Bhogal, A.S. Airborne SAR imagery of ocean surface waves obtained during LEWEX: Some initial results. IEEE Trans. Geosci. Remote Sens. 1988, 26, 548–561. [Google Scholar] [CrossRef]
  26. Raney, R.K.; Vachon, P.W.; De Abreuet, R.A.; Bhogal, A.S. Airborne SAR observations of ocean surface waves penetrating floating ice. IEEE Trans. Geosci. Remote Sens. 1989, 27, 492–500. [Google Scholar] [CrossRef]
  27. Liu, A.K.; Holt, B.; Vachon, P.W. Wave propagation in the marginal ice zone: Model predictions and comparisons with buoy and synthetic aperture radar data. J. Geophys. Res. Oceans 1991, 96, 4605–4621. [Google Scholar] [CrossRef]
  28. Shen, H.; Perroe, W.; Hu, Y.C.; He, Y.J. Remote sensing of waves propagating in the Marginal Ice Zone by SAR. J. Geophys. Res. Oceans 2017, 123, 189–200. [Google Scholar] [CrossRef]
  29. Ardhuin, F.; Collard, F.; Chapron, B.; Girard-Ardhuin, F.; Guitton, G.; Mouche, A.; Stopa, J.E. Estimates of ocean wave heights and attenuation in sea ice using the SAR wave mode on Sentinel-1A. Geophys. Res. Lett. 2015, 42, 2317–2325. [Google Scholar] [CrossRef] [Green Version]
  30. Schulz-Stellenfleth, J.; Lehner, S. A new SAR inversion scheme for ocean wave travelling into sea ice. In Proceedings of IEEE 1999 International Geoscience and Remote Sensing Symposium; Hamburg, Germany, 28 June–2 July 1999. [CrossRef]
  31. Schulz-Stellenfleth, J.; Lehner, S. Spaceborne synthetic aperture radar observations of ocean waves traveling into sea ice. J. Geophys. Res. Oceans 2002, 107, 20-1–20-19. [Google Scholar] [CrossRef]
  32. De Carolis, G. SAR observations of waves in ice. In Proceedings of the International Symposium on Remote Sensing, Crete, Greece, 23–27 September 2002. [Google Scholar]
  33. The WAVEWATCH III Development Group (WW3DG). User Manual and System Documentation of WAVEWATCH III Version 6.07 (Tech. Note 333); NOAA/NWS/NCEP/MMAB: College Park, MD, USA, 2019. [Google Scholar]
  34. Sentinel-1 User Handbook; ESA. 2013. Available online: https://sentinel.esa.int/web/sentinel/user-guides/sentinel-1-sar (accessed on 2 November 2022).
  35. Brooker, G. UWA Processing Algorithm Specification Version 2.0; ESTEC, ESA: Noordwijk, The Netherlands, 1995. [Google Scholar]
  36. Bruening, C.; Hasselmann, S.; Hasselmann, K.; Lehner, S.; Gerling, T. A first evaluation of ERS-1 synthetic aperture radar wave mode data. Glob. Atmos. Ocean Syst. 1994, 2, 61–98. [Google Scholar]
  37. Heimbach, P.; Hasselmann, S.; Bruning, C.; Hasselmann, K. Application of Wave Spectral retrievals from WES-1 SAR Wave Mode data for improved wind and wave field analyses. In Proceedings of the Second ERS Applications Workshowp, ESA, London, UK, 6–8 December 1995. [Google Scholar]
  38. Liu, A.K.; Mollo-Christensen, E. Wave propagation in a solid ice pack. J. Phys. Oceanogr. 1988, 18, 1702–1712. [Google Scholar]
  39. Liu, D.; Tsarau, A.; Guan, C.; Shen, H. Comparison of ice and wind-wave modules in WAVEWATCH III in the Barents Sea. Cold Reg. Sci. Technol. 2020, 172, 103008.1–103008.9. [Google Scholar]
  40. Hersbach, H.; Bell, B.; Berrisford, P.; Biavati, G.; Horányi, A.; Muñoz Sabater, J.; Nicolas, J.; Peubey, C.; Radu, R.; Rozum, I.; et al. ERA5 Hourly Data on Single Levels from 1959 to Present. Copernicus Climate Change Service (C3S) Climate Data Store (CDS). 2018. Available online: https://doi.org/10.24381/cds.adbb2d47 (accessed on 2 November 2022).
  41. Gower, J.F.R. “Layover” in Satellite Radar Images of Ocean Waves Grower. J. Geophys. Res. 1983, 88, 7719–7720. [Google Scholar] [CrossRef]
  42. Li, X.-M.; Zhang, T.; Huang, B.; Jia, T. Capabilities of Chinese Gaofen-3 synthetic aperture radar in selected topics for coastal and ocean observations. Remote Sens. 2018, 10, 1929. [Google Scholar] [CrossRef] [Green Version]
  43. Hasselmann, S.; Heimbach, P.; Bennefeld, C. The WASAR Algorithm for Retrieving Ocean Wave Spectra from SAR Image Spectra; World Data Center for Climate (WDCC) at DKRZ: Hamburg, Germany, 1998. [Google Scholar] [CrossRef]
  44. Fung, A.K. Microwave Scattering and Emission Models and Their Applications; Artech House: Norwood, MA, USA, 1994. [Google Scholar]
Figure 1. ERA 5 monthly averaged wave filed in March 2021 in the Barents Sea. The color indicates the SWH, and the arrows represent the propagating direction of waves.
Remotesensing 14 06086 g001
Figure 2. S1 IW images acquired around Svalbard on 14 March 2021. (b) The enlarged view of waves in ice in the blue rectangle in (a). The blue dot in (b) is the central location of a sub-image used to retrieve OWS in the following subsection.
Remotesensing 14 06086 g002
Figure 3. An example of OWS retrieval in an ice-covered area by S1 data using the MPI scheme. (a) S1 sub-image acquired in the ice-covered area, the location of which is marked by the blue dot in Figure 2b. (b) The corresponding SAR image spectrum. (c) The first-guess spectrum provided by the NMEFC WW3 model. (d) The retrieved ocean wave spectra by the MPI scheme. The four circles from outside to inside represent wavelengths of 100, 200, 400 and 800 m. The same for the rest of the plots. For convenient comparison, the energies of these spectra are relatively normalized. The color indicates the relative energy of spectra. The same is true for the left comparisons of spectra in this study.
Remotesensing 14 06086 g003
Figure 4. (a) Locations of eleven S1 EW images used to derive tilt modulation in ice. The blue stripes are the selected transects. (bd) Examples showing the transects (white box), acquired in different incidence angles of approximately 21, 31 and 39 degrees, respectively.
Remotesensing 14 06086 g004
Figure 5. Variation in NRCS derived from the 58 transects with incidence angles in sea ice. The red line is the quadratic fitting of the data.
Remotesensing 14 06086 g005
Figure 6. Overview of the study case. (a) S1 images acquired around Svalbard on 20 March 2021. The blue curve outlines the edge of sea ice interpreted from the SAR images. The green line indicates the selected transect. (b) The combined sea ice thickness from the SMOS and SMAP data. The black boxes show coverages of the two consecutively acquired IW images from 15:03:09 UTC to 15:03:59 UTC on 20 March. The solid black line in the ice thickness map represents the selected transect.
Remotesensing 14 06086 g006
Figure 7. (a) The wave field predicted by the NMEFC WW3 model at 15 UTC on 20 March 2021. The color in the background represents SWH, and black and white arrows show the propagation direction of the dominant and secondary swells. (b) The NMEFC WW3 predicted OWS at the location marked by the red square in (a), before waves propagating into the sea ice.
Remotesensing 14 06086 g007
Figure 8. The first row: SAR sub-images. The second row: image spectra of the sub-images. The third row: NWEFC WW3 ocean wave spectra at the grid near the cases. The fourth row: retrieved ocean wave spectra using the MPI scheme.
Remotesensing 14 06086 g008
Figure 9. Comparisons of the statistical parameters of C.I. (a), Err. (b) and Cor. (c) of retrievals by different schemes. The black, blue and red lines represent the results by MPI, MPI-NTNH and MPI- T i c e t NH schemes.
Remotesensing 14 06086 g009
Figure 10. Retrievals of OWS for case 7 (77.05°N, 27.949°E) based on the different schemes: (a,b) are the extracted SAR sub-image and the corresponding image spectrum, respectively; (c) is the first-guess spectrum used in the inversion; (df) is the simulated SAR spectra obtained by the MPI, MPI-NTNH and MPI- T i c e t NH schemes, and the retrieved OWS are shown in (gi) correspondingly.
Remotesensing 14 06086 g010
Figure 11. Comparisons of the simulated SAR spectra using different schemes for case 8: (a) the observed SAR spectra; (b) the first-guess spectrum used in retrieval; (ce) the simulated results derived by MPI, MPI-NTNH and MPI- T i c e t NH schemes, respectively.
Remotesensing 14 06086 g011
Figure 12. (a) Case 9 sub-image shows near-range-travelling waves at 76.74°N/24.09°E in the ice-covered area. (b) The collocated NMEFC WW3 spectrum.
Remotesensing 14 06086 g012
Figure 13. Comparison of the observed SAR spectrum and the simulated SAR for case 9 with range-travelling wave dominating: (a) observed SAR spectrum; (b,c) simulated SAR spectra by MPI-NTNH and MPI- T i c e t NH schemes, respectively.
Remotesensing 14 06086 g013
Figure 14. Modulus of tilt modulation in open water (blue dashed line) and ice (red solid line) for HH polarization.
Remotesensing 14 06086 g014
Table 1. Averaged statistical parameters of the retrievals based on three different schemes.
C.I.Reduction in the First Term of the Cost
Function
Err.Cor. (%)
MPI0.83/0.5883.66
MPI-NTNH0.5734.18%0.3189.26
MPI- T i c e t NH0.5436.13%0.3189.14
Table 2. Statistical parameters of the retrievals based on different MTF schemes for the case are shown in Figure 12.
C.I.Err.Cor. (%)
MPI0.620.9259.93
MPI-NTNH0.320.5177.96
MPI- T i c e t NH0.220.3385.48
Publisher’s Note: MDPI stays neutral with regard to jurisdictional claims in published maps and institutional affiliations.