Article

Performance of Seven Gridded Precipitation Products over Arid Central Asia and Subregions

Xinjiang Key Laboratory of Oasis Ecology, College of Geography and Remote Sensing Sciences, Xinjiang University, Urumqi 830017, China
*
Author to whom correspondence should be addressed.
Remote Sens. 2022, 14(23), 6039; https://doi.org/10.3390/rs14236039
Submission received: 9 October 2022 / Revised: 23 November 2022 / Accepted: 25 November 2022 / Published: 29 November 2022

Abstract

:
The evaluation of gridded precipitation products is important for the region where meteorological stations are scarce. To find out the applicable gridded precipitation products in arid Central Asia (ACA) for better follow-up research, this paper evaluated the accuracy of five long-term gridded precipitation products (GPCC, CRU, MERRA-2, ERA5-Land, and PREC/L) and two short-term products (PERSIANN-CDR and GPM IMERG) on different time scales for the whole ACA and two subregions, Central Asia (CA) and Xinjiang of China (XJ). Seven evaluation indices were used to evaluate the consistency between the seven gridded precipitation products and observations at 328 meteorological stations for 40 years from 1980 to 2019. The main findings were as follows: (1) Each product can correctly reflect the trend of decreasing annual precipitation in CA and increasing annual precipitation in XJ, except for ERA5-Land. (2) GPCC captured extreme events by 75.9% for heavy rainfall and 67.9% for drought events, and GPM IMERG outperformed PERSIANN-CDR with a capture probability of 61% for heavy rainfall and 50% for drought events. (3) Annually, except for GPCC and CRU without significant deviations (BIAS < 2%), ERA5-Land, GPM IMERG, and PERSIANN-CDR generally overestimated precipitation (20% < BIAS < 60%). MERRA-2 and PREC/L underestimated precipitation, with approximately −5% for PREC/L and −20% for MERRA-2. (4) Seasonally, GPCC outperformed the other four long-term products in all seasons with the lowest BIAS (<0.93%), and GPM IMERG (BIAS < 30.88%) outperformed PERSIANN-CDR. (5) Monthly, the areas with large deviations (BIAS > 60%) for the seven products were near the Tianshan Mountains; comparatively, they performed better in CA than in XJ, with BIAS approximately 20% for CA and 40% for XJ. Despite regional differences, GPCC performed the best across the five long-term products overall, followed by CRU, MERRA-2, PREC/L, and ERA5-Land. For the two short-term products, GPM IMERG outperformed PERSIANN-CDR.

Graphical Abstract

1. Introduction

The Intergovernmental Panel on Climate Change Working Group II report states that the global precipitation pattern has changed, which has a profound impact on human health, agricultural production, and biodiversity [1]. Reliable precipitation data are the basis for correctly reflecting the spatio-temporal distribution and the variation pattern of precipitation, which is also of great significance for water resources management, precipitation prediction, and drought monitoring [2,3]. Rain-gauge data are considered the ground truth but obtaining rain-gauge data is limited in two ways. First, rain gauges are unevenly distributed spatially, especially in developing countries, mountains, and deserts, where they are very scarce. Second, the data in some areas are difficult to access due to their high confidentiality and high prices [4]. Fortunately, international efforts to gridded precipitation products began in the 1980s [5], and freely available gridded precipitation products have been widely used in meteorological and hydrological research for their temporal and spatial continuity [6,7].
Gridded precipitation products can be broadly classified into three categories based on sources and gridding methods, namely gauge-based products, reanalysis products, and satellite-based products. Gridded precipitation products based on long-term rain gauge observations mainly include the Climate Research Unit (CRU) [8], the Global Precipitation Climatology Center (GPCC) [9], the Asian Precipitation-Highly-Resolved Observational Data Integration Towards Evaluation of Water Resources (APHRODITE) [10], and others. Rain-gauge data quality control criteria, the interpolation method, and the number of rain gauges used for interpolation have significant impacts on the accuracy of such products [11]. The gridded precipitation products based on satellite remote sensing mainly include the Global Precipitation Climatology Project (GPCP) [12], the Global Precipitation Measurement (GPM) [13], the Precipitation Estimation from Remotely Sensed Information using Artificial Neural Networks-Climate Data Record (PERSIANN-CDR) [14], and so on. The precipitation data of these products are mainly derived from satellite remote sensing information and are susceptible to changes in accuracy due to the influence of the satellite’s internal characteristics (e.g., inversion algorithms) and topography [15]. The reanalysis products based on data assimilation technology and numerical prediction models mainly include the ECMWF-Re-Analysis (ERA) [16], the Modern-Era Retrospective analysis for Research and Applications (MERRA) [17], the NOAA’s Gridded Precipitation Reconstruction over Land (PREC/L) [18], etc. Atmospheric reanalysis products are the fusion of numerical forecast products and observational data. The errors in forecast products, observational data, and assimilation methods will affect the quality of reanalysis products [19]. Therefore, although many types of gridded precipitation products have been developed, the accuracy of the products remains to be tested due to the interference of various factors. Many scholars have done a lot of research on the accurate evaluation of gridded precipitation products globally [20,21,22,23]. Numerous studies have indicated that the accuracy of gridded precipitation products varies from region to region and that the results obtained can vary greatly in the same region with different criteria for evaluation [24,25]. Therefore, before using these products, their reliability should be evaluated in as many dimensions as possible.
Arid Central Asia (ACA) is one of the largest arid regions in the middle latitudes [26], and water resource scarcity directly affects the economy, ecosystem, and sustainable development. Precipitation is one of the main water sources in ACA, and changes in precipitation will have an important impact on water resources [27]. Thus, research on precipitation changes is necessary for ACA. However, due to the collapse of the Soviet Union, most meteorological stations in ACA have stopped working since the 1990s, resulting in a lack of rain-gauge data [28]. The precipitation change in ACA cannot be fully understood with the limited available rain-gauge data, so it is necessary to select proper gridded precipitation products with good applicability in this region. Dilinuer et al. [29] evaluated GPCC, APHRODITE, and CPC in Central Asia from 1985 to 2005, and concluded that APHRODITE and GPCC performed better. Hu et al. [30] analyzed the applicability of CFSR, ERA-Interim, and MERRA in Central Asia from 1979 to 2011. The results showed that the three products all overestimated precipitation, and MERRA was the better one. Lai et al. [31] demonstrated the availability of APHRODITE to characterize extreme events in ACA during 1961–1991. Guo et al. [32] found that the four satellite-based products (TMPA, CMORPH, GSMaP, and PERSIANN) showed significant overestimation compared to APHRODITE over Central Asia. Hu et al. [33] compared five gridded precipitation products of three types in Central Asia and found that gauge-based and satellite-based products had better performance than reanalysis products. However, there are some other latest products (i.e., ERA5-Land, MERRA-2, GPM IMERG, PERSIANN-CDR) in ACA whose simulation accuracy in ACA is not fully understood. The so-called suitable products are not necessarily the best product. In addition, most previous studies have often evaluated gridded precipitation products over a 30-year or shorter period before 2010, which is a relatively short period, and fewer studies have covered the latest decade [34]. Satellite-based precipitation products have been verified in some basins of ACA [4,35], but a systematic comparison of the suitability and performance ranking of various products in the whole ACA and its subregions has seldom been conducted. In this study, a total of seven gridded precipitation products of three types were evaluated based on precipitation data from 328 meteorological stations in ACA from 1980 to 2019. The study can help properly select the gridded precipitation products applicable to ACA and improve the accuracy of climate change research of this area.

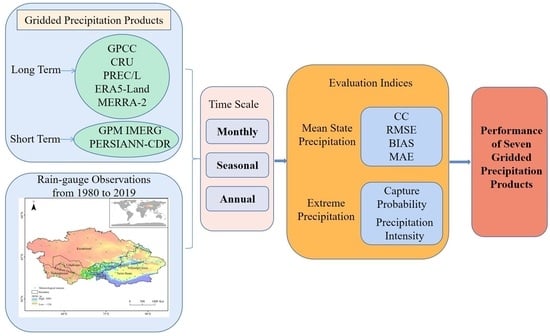
2. Materials and Methods

2.1. Study Area

In this study, ACA (Figure 1) includes five Central Asian countries (Kazakhstan, Kyrgyzstan, Tajikistan, Uzbekistan, and Turkmenistan), and Xinjiang of China. This region extends from 34°22′N to 55°43′N and from 46°49′E to 96°23′E, with an area of about 569.29 × 10⁴ km2, accounting for 1/3 of the global arid land. The topography is characterized by a mountain-basin structure. It is very sensitive to climate change [36]. From the perspective of atmospheric circulation, ACA belongs to the “core zone of westerlies-dominated climate regime” [37]. However, due to the complex topography, the regional variability in precipitation is significant. Precipitation in the five Central Asian countries is concentrated in winter and spring in the form of snow, with the highest in the southeastern mountains and the lowest in the vast basins [29,30,34]. In contrast, precipitation in Xinjiang of China mostly occurs in summer, mainly in the three mountain ranges, i.e., the Tianshan Mountains, Kunlun Mountains, and Altai Mountains [38]. Therefore, we classified ACA into two subregions, i.e., the five Central Asian countries (CA) and Xinjiang of China (XJ).

2.2. Observations

The precipitation observations in this study were provided by four rain-gauge observation datasets: Global Surface Summary of the Day (GSOD, https://www.ncei.noaa.gov/maps/daily/ (accessed on 21 December 2021)), Global Surface Summary of the Month (GSOM, https://www.ncei.noaa.gov/maps/monthly/ (accessed on 21 December 2021)), Central Asia Temperature and Precipitation Data (1879–2003, Version 1, https://nsidc.org/data/G02174/versions/1 (accessed on 27 December 2021)), and the Chinese Surface Daily Climate Dataset, Version 3.0 (https://data.cma.cn/en/ (accessed on 20 December 2021)).
All meteorological stations have undergone strict quality control. First, stations with 5% missing data and stations with more than three consecutive months of missing data were excluded. Second, the missing values of the selected stations were replaced by the average values of the two preceding and following years. Third, considering the seasonality and consistency of precipitation, we replaced the missing value of a certain month with the average value of the month in two preceding and two following years of the same station. If the four datasets had the same stations, the stations with fewer missing values were chosen. Finally, the precipitation records from 328 meteorological stations (81 daily and 247 monthly stations), including 272 stations in CA and 56 in XJ, from 1980 to 2019, were obtained for evaluation, with precipitation records for more than ten years for each station. Figure 2 shows the change in station numbers over the last 40 years.
The seasons were defined as spring (March, April, and May), summer (June, July, and August), autumn (September, October, and November), and winter (December, January, and February).

2.3. Gridded Precipitation Products

In this study, seven precipitation products were evaluated, including two gauge-based precipitation products (GPCC, CRU), three reanalysis precipitation products (ERA5-Land, MERRA-2, PREC/L), and two satellite-based precipitation products (GPM IMERG, PERSIANN-CDR). The information of the seven products is summarized in Table 1.
CRU TS is produced by the UK’s National Centre for Atmospheric Science (NCAS) at the University of East Anglia’s Climatic Research Unit (CRU). It is one of the most widely used observed climate datasets. CRU TS V4.05 was used in this study.
The Global Precipitation Climatology Centre (GPCC) was established in 1989. GPCC’s new global precipitation climatology V2020, based on data from 84,800 stations, was used.
ERA5-Land is a reanalysis dataset providing a consistent view of the evolution of land variables over several decades at a higher resolution than ERA5. ERA5-Land was generated by replaying the terrestrial component of the ECMWF ERA5 climate reanalysis, providing an accurate description of climate of the past.
NOAA’s Gridded Precipitation Reconstruction over Land (PREC/L) consists of three files containing monthly-averaged precipitation totals. Gauge observations are from over 17,000 stations. Precipitation is available at three spatial resolutions. 1° × 1° was used in this study.
MERRA-2 is the latest version of global atmospheric reanalysis for the satellite era produced by NASA Global Modeling and Assimilation Office (GMAO) using the Goddard Earth Observing System Model (GEOS) version 5.12.4. The dataset covers the period of 1980–present, with a latency of ~3 weeks after the end of a month. The variable ‘bias corrected precipitation’ was used.
The Integrated Multi-satellite Retrievals for GPM (IMERG) was developed as a successor of the TRMM mission. GPM (IMERG) includes three products with different latencies: the near-real-time Early, the near-real-time Late, and the post-real-time Final. The last one was used in this study.
PERSIANN-CDR (Precipitation Estimation from Remotely Sensed Information using Artificial Neural Networks—Climate Data Record) was developed by the Center for Hydrometeorology and Remote Sensing (CHRS) at the University of California. PERSIANN-CDR is generated from the PERSIANN algorithm using GridSat-B1 infrared data and is a pre-bias-corrected product with a satellite-based precipitation product of GPCP [39,40,41].
To facilitate evaluation, the spatial resolution of all products was unified to 0.25° × 0.25° using bilinear interpolation. To find out the product that has better applicability over a long or short period, which could provide a reference to the climatology and meteorology related research, five long-term products and two short-term products were compared separately. The time range of CRU, GPCC, PRCE/L, ERA5-Land, and MERRA-2 was unified to 1980–2019, and the time range of GPM IMERG and PERSIANN-CDR was unified to 2001–2019 (although the PERSIANN-CDR data records began in 1983, there was a mass of missing data in CA during 1983–1999). The five long-term products and the two short-term products were compared based on the observations from 328 stations (OBS) and 123 stations (OBS2), separately.

2.4. Methods

2.4.1. Evaluation Indices for Mean State Precipitation

Due to the scarcity of meteorological stations and the discontinuity in recording sequences in ACA, this study evaluated the gridded precipitation products at the station scale by extracting the corresponding values of gridded precipitation products according to the latitude and longitude information of the stations. Four evaluation indices were used for comparative analysis, including the correlation coefficient (CC), root mean square error (RMSE), relative bias (BIAS), and mean absolute error (MAE). CC represents the consistency degree between the observations and the gridded values. RMSE quantifies the degree of dispersion between observations and the gridded values, which can reflect the overall error level and accuracy. MAE evaluates the magnitude of the average difference between observations and the gridded values. BIAS reflects the deviation of gridded values from the observation values. The calculation formulas are as follows.
CC = ( x i x ¯ ) ( y i y ¯ ) ( x i x ¯ ) 2 ( y i y ¯ ) 2
RMSE = i = 1 n ( x i y i ) 2 n
BIAS = i = 1 n ( y i x i ) i = 1 n x i × 100 %  
MAE = i n | x i y i | n
where n is the number of samples, y i is the precipitation value of gridded precipitation products, y ¯ is the average value of precipitation of gridded precipitation products, x i is the precipitation value of observations, and x ¯ is the average of precipitation observations. The optimal values of the four evaluation indices, namely, CC, BIAS, RMSE, and MAE, are 1, 0%, 0, and 0, respectively.

2.4.2. Evaluation Indices for Extreme Precipitation

(a) Capture Probability
We used Hu’s monthly extreme precipitation indices to compare the accuracy of each product in describing extreme precipitation events [42]. The calculation method is as follows: Using January of a station as an example, we extracted the precipitation values of this station in January of each year and arranged them in ascending order; the highest 10% of the data were defined as heavy rainfall events, and the lowest 10% were defined as drought events. We extracted and ranked the values of gridded precipitation products with the same procedure at the corresponding station. If the year in which the heavy rainfall event occurred at the station is the same as the year in which the gridded precipitation products monitored the occurrence of the heavy rainfall event, it is recorded as one correct capture of a heavy rainfall event. The probability of gridded precipitation products successfully capturing heavy rainfall events in January is the ratio of the number of gridded precipitation products successfully capturing heavy rainfall events at all stations to the number of heavy rainfall events occurring at all stations. We repeated the procedure to get the probability of successfully capturing drought events of gridded precipitation products. The calculation formula is as follows:
P = N S a = S b F n × 100 %  
where P is the capture probability, S a is the year of extreme events in gridded precipitation products, S b is the year of extreme events at stations, N S a = S b is the number of extreme events successfully captured by gridded precipitation products, and F n is the total number of extreme events at each station.
(b) Precipitation Intensity
Referring to the method of calculating Rx1day (Maximum 1-day precipitation) by Expert Team on Climate Change Detection and Indices (ETCCDI, http://etccdi.pacificclimate.org/indices.shtml (accessed on 23 May 2022)), the maximum monthly precipitation index Rx1month is calculated. Specifically, let RRij be the precipitation of month i in year j. The maximum 1-month value for year j is Rx1month j, i.e., max (RRij). Rx1month was used to reflect the precipitation intensity and evaluated by the Taylor graph method.

3. Results

3.1. Accuracy in Describing the Temporal Change in Precipitation

3.1.1. Annual and Seasonal Variations in Precipitation

Figure 3 shows the variations in annual (Figure 3a–c) and monthly (Figure 3d,e) precipitation for each product compared with OBS or OBS2 in ACA and the two subregions. In Figure 3a–c, each product showed a fluctuating decreasing trend of annual precipitation in ACA and CA, but an increasing trend in XJ, except for ERA5-Land, which was consistent with OBS and OBS2. That is, almost all products can well-represent the overall annual precipitation trend. In terms of magnitude, ERA5-Land and MERRA-2 had the largest difference from OBS before 2000, which severely overestimated and underestimated precipitation, respectively. After 2000, the consistency between the two products and OBS improved greatly.
There were significant regional differences in seasonal precipitation displayed in Figure 3d–f. Most precipitation of ACA occurred in spring (average 85.82 mm), followed by winter (62.56 mm), summer (50.89 mm), and autumn (45.07 mm), and so did CA. In contrast, the seasonal distribution precipitation in XJ was quite different, with the peak precipitation occurring in summer (64.23 mm), followed by spring (34.08 mm), autumn (28.66 mm), and winter (only 14.6 mm). All products well-represented the seasonal precipitation variations in each region. Similar to the annual precipitation, ERA5-Land grossly overestimated precipitation for each season.
In summary, each product could correctly reflect the overall trend and distribution of annual and seasonal precipitation, but there was a certain overestimation or underestimation, and large regional differences existed.

3.1.2. Comprehensive Performance by Evaluation Indices

Annually (Table 2), ERA5-Land deviated the most from OBS in the three regions, with the largest being RMSE (127.604–167.179 mm) and MAE (125.449–147.527 mm). The three reanalysis products deviated more severely than the two gauge-based products, and GPM IMERG outperformed PERSIANN-CDR. CRU, ERA5-Land, and the two satellite-based products overestimated annual precipitation in all regions, while MERRA-2 behaved the opposite. GPCC and PREC/L both underestimated annual precipitation of ACA and CA but overestimated it of XJ. GPCC, MERRA-2, and GPM IMERG performed better in XJ than in CA. In contrast, the other four products performed better in CA, especially CRU and ERA5-Land.
Seasonally (Figure 4), the seven products showed high correlations with OBS or OBS2 over ACA, with CC ranging from 0.678 to 0.999, except for PERSIANN-CDR, which showed a lower correlation in winter of Xinjiang (0.56). GPCC outperformed the other products, with CC values ranging from 0.967 to 0.999. In terms of RMSE and MAE, the high values for the seven products occurred in spring of CA and summer of XJ, which was consistent with the seasonal precipitation. ERA5-Land had much larger RMSE and MAE values than the other products. CRU underestimated the precipitation of ACA in summer, and PREC/L and MERRA-2 underestimated the precipitation of CA and ACA in all seasons, respectively. Generally, each product exhibited an overestimated seasonal precipitation, except for GPCC which had no obvious bias. For the degree of deviation, ERA5-Land had the worst case, followed by MERRA-2. The average BIAS values of GPM IMERG and PERSIANN-CDR were 20.48% and 34.05%, respectively, and they both overestimated winter precipitation the most. This might be because PERSIANN-CDR and GPM IMERG performed poorly in snow-dominated mountain areas [41]. The poor performance of the two products in winter was consistent with previous studies and was a challenge for the current satellite-based precipitation products [4].
Considering the four evaluation indices, GPCC performed best among the five long-term products, followed by CRU, PREC/L, MERRA-2, and ERA5-Land. Of the two short-term products, GPM IMERG performed better than PERSIANN-CDR.

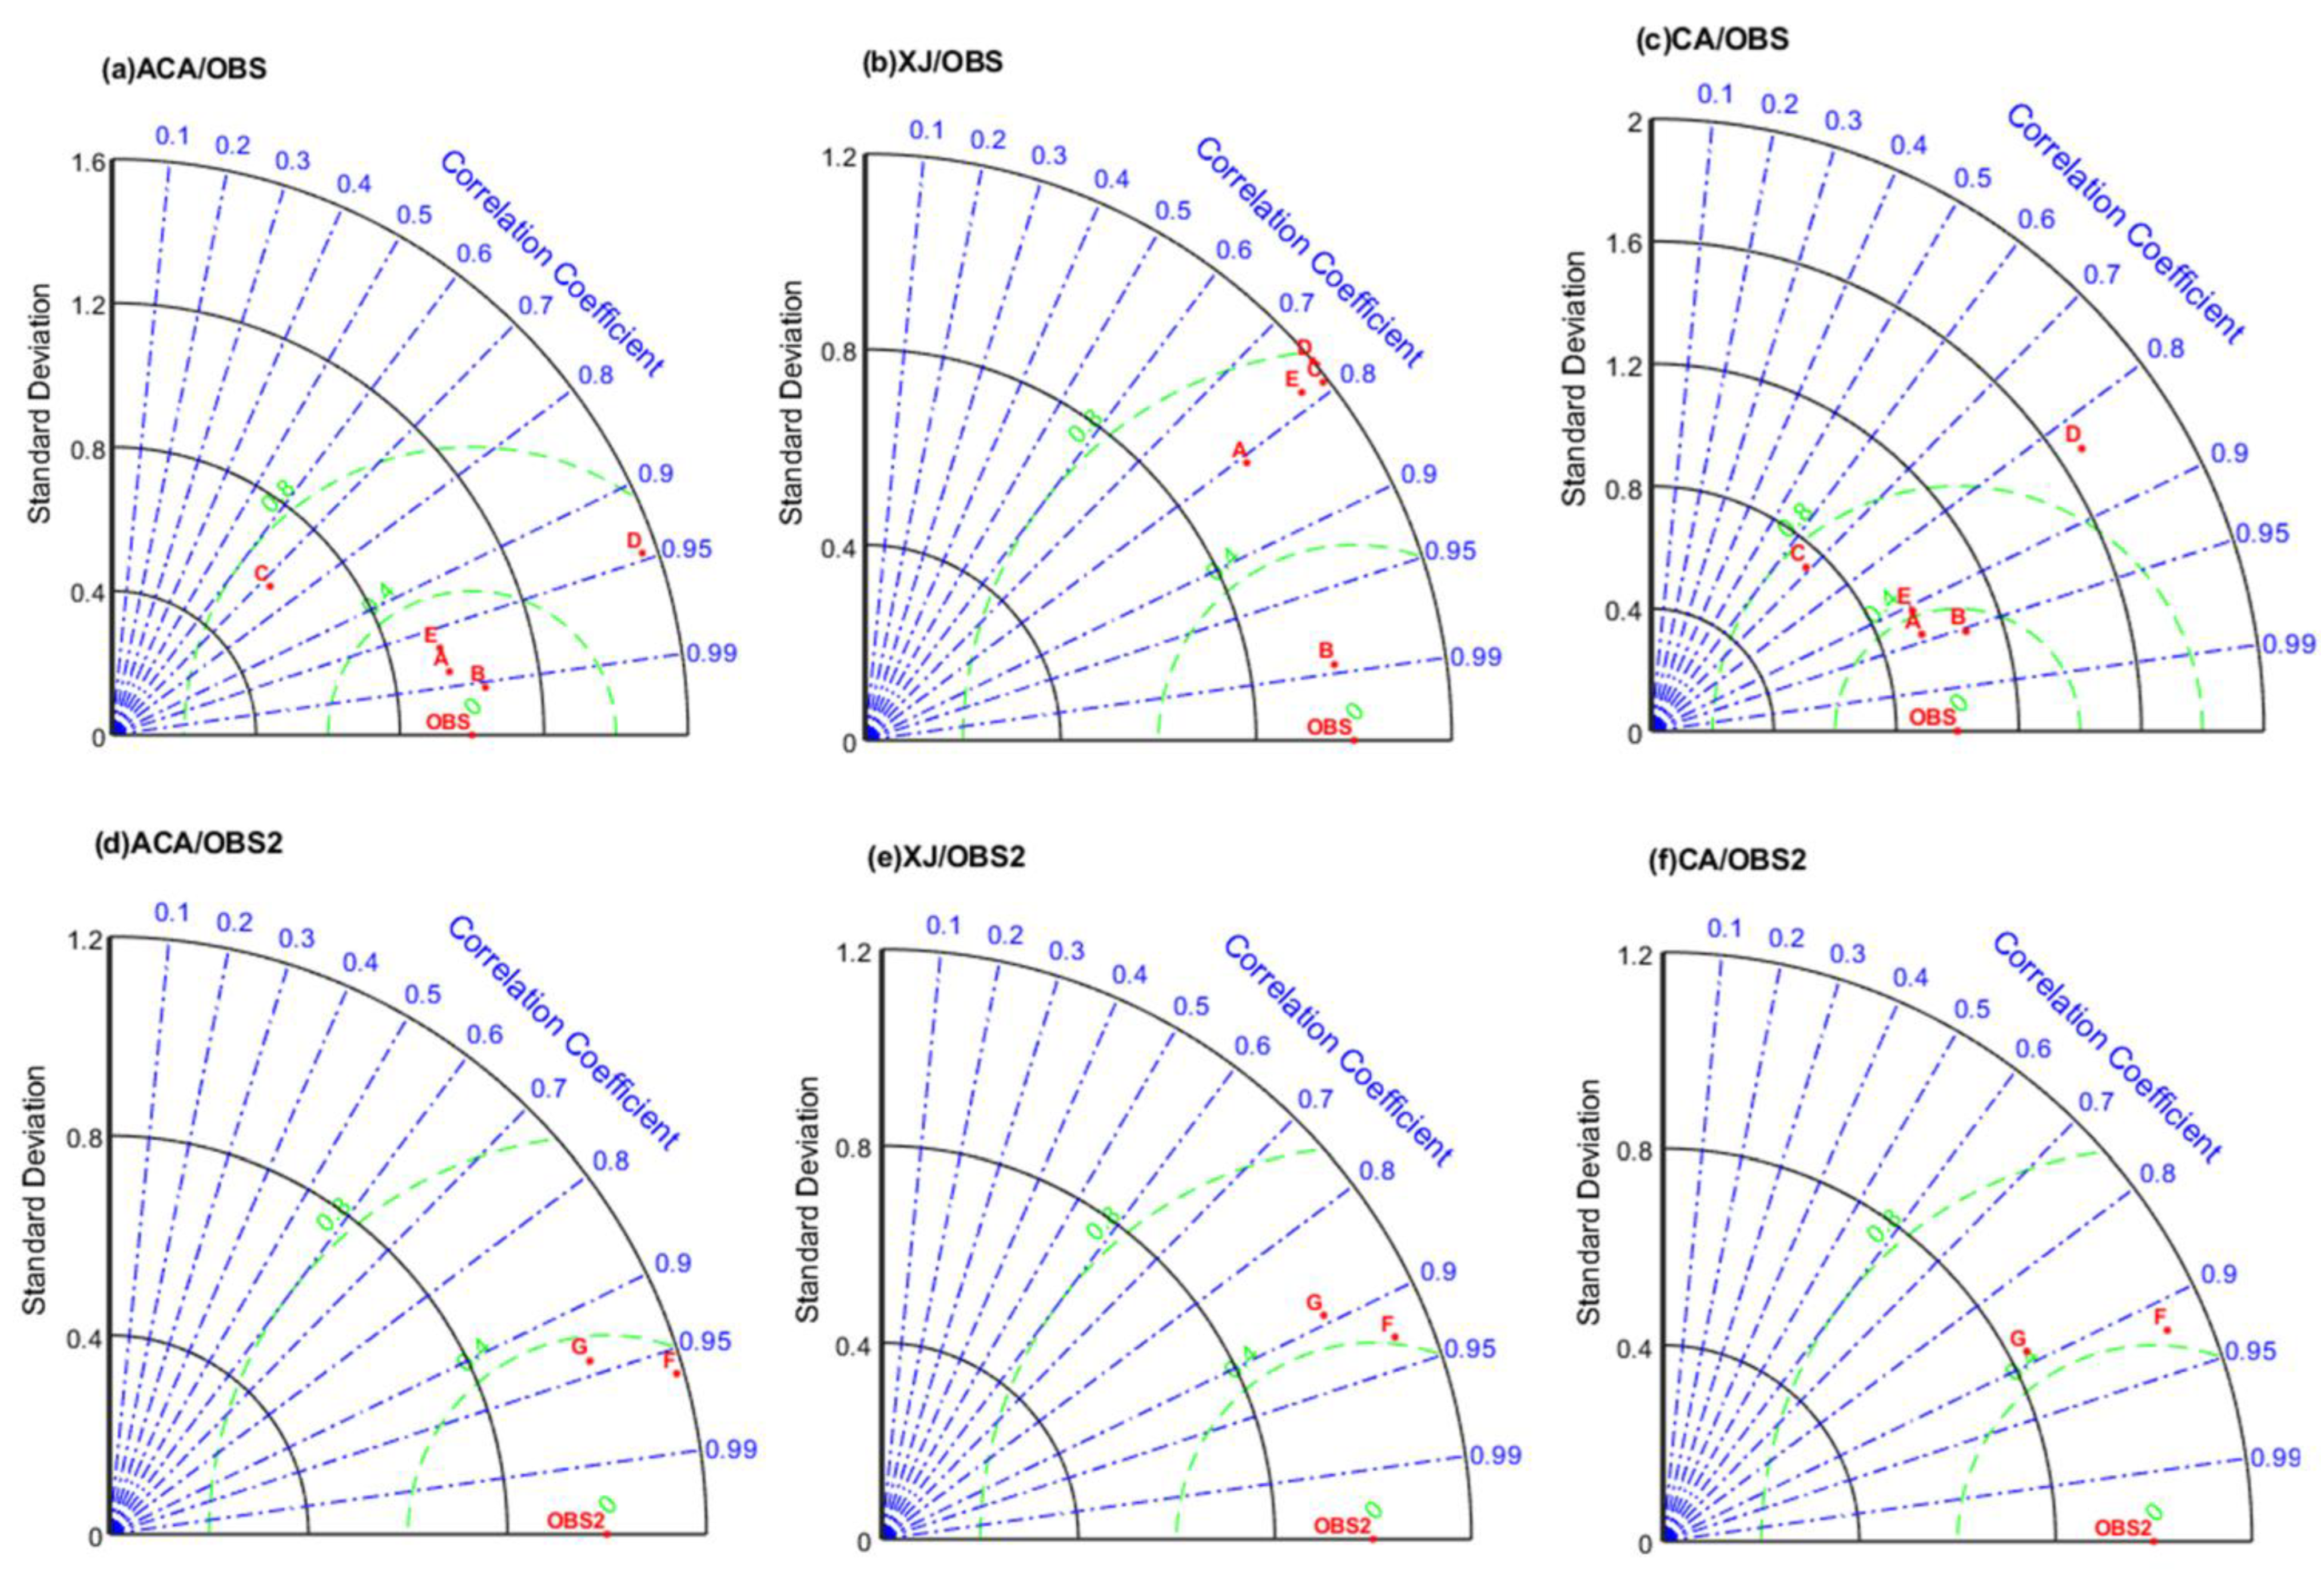
3.2. Accuracy in Describing the Spatial Distribution of Precipitation

3.2.1. Spatial Distribution and Trend of Annual Precipitation

The OBS map shows that the stations with higher precipitation in ACA were mainly in Tajikistan, Kyrgyzstan, and the eastern part of Uzbekistan (Figure 5), where the Tianshan Mountains and the Pamir Plateau stood. The annual precipitation there was approximately 600 mm, and several stations even had up to 1000 mm. The stations with lower annual precipitation (below 50 mm) were in southern XJ, mainly at the edge of the Tarim Basin. All seven products can correctly reflect the spatial distribution pattern of annual precipitation in ACA. CRU and GPCC performed best, with the closest values to OBS. ERA5-Land significantly overestimated OBS, especially in the Tianshan Mountains, where precipitation at 42 stations was above 1000 mm. PREC/L underestimated precipitation in the high precipitation region and overestimated it in the low precipitation region. MERRA-2 underestimated precipitation throughout ACA, while GPM IMERG and PERSIANN-CDR overestimated precipitation throughout ACA.
Figure 6 shows the spatial distribution of annual precipitation trends. In the OBS map, 62.5% of stations showed increasing trends, and 37.5% of stations with decreasing trends were almost all in CA. The trends were less than 2 mm/a at 82.14% of the stations in XJ, of which 44.64% were less than 1 mm/a. Precipitation in CA, with 63.97% of the stations showing trends larger than 2 mm/a or −2 mm/a, had more significant increasing or decreasing trends than those in XJ. ERA5-Land and PREC/L showed the opposite trends to OBS at most stations in XJ and Kazakhstan. MERRA-2 showed opposite trends near Tianshan Mountains and Pamir Plateau. CRU and GPCC almost correctly reflected the spatial distribution of annual precipitation trends of OBS, and the stations showed increasing trends for annual precipitation of 65.9% for CRU and 68.9% for GPCC. The OBS2 map shows that the precipitation mainly showed a decreasing trend in CA and an increasing trend (<3 mm/a) in XJ. For the former, it could be better reflected by the two short-term products; for the latter, however, PERSIANN-CDR overestimated the trends at all stations with rates exceeding 4 mm/a. GPM IMERG was relatively closer to OBS2 than PERSIANN-CDR.

3.2.2. Comprehensive Performance by Evaluation Indices

From the spatial distribution of the four evaluation indices based on monthly precipitation (Figure 7), poorly performing areas of BIAS, RMSE, and MAE of the seven products were almost consistent with the high-value areas of annual precipitation, while CC performed worst in XJ, except for GPCC.
GPCC had the best CC, BIAS, RMSE, and MAE overall, with average values of 0.93, 9.71 mm, 5.08%, and 5.74 mm, respectively, and there were fewer outliers in the box plots (Figure 8), indicating that GPCC performed well at most stations. The CC values for the other four long-term products averaged between 0.77 ± 0.01, but they were higher in CA than in XJ, especially for CRU, which was consistent with Figure 7. CRU, MERRA-2, and PREC/L performed similarly in RMSE and MAE, with an average RMSE of 19 ± 0.1 mm and MAE of 13 ± 0.3 mm. The average RMSE and MAE of ERA5-Land were 29.6 mm and 22.3 mm, respectively. For BIAS, ERA5-Land overestimated precipitation at 92.68% of the stations, 23.17% of which overestimated more than 100%. MERRA-2 underestimated precipitation at 70.03% of stations. CRU and PREC/L performed better.
For the two short-term products, GPM IMERG outperformed PERSIANN-CDR with larger CC and smaller BIAS, RMSE, and MAE. However, they both overestimated precipitation at 82.5% of stations in ACA.

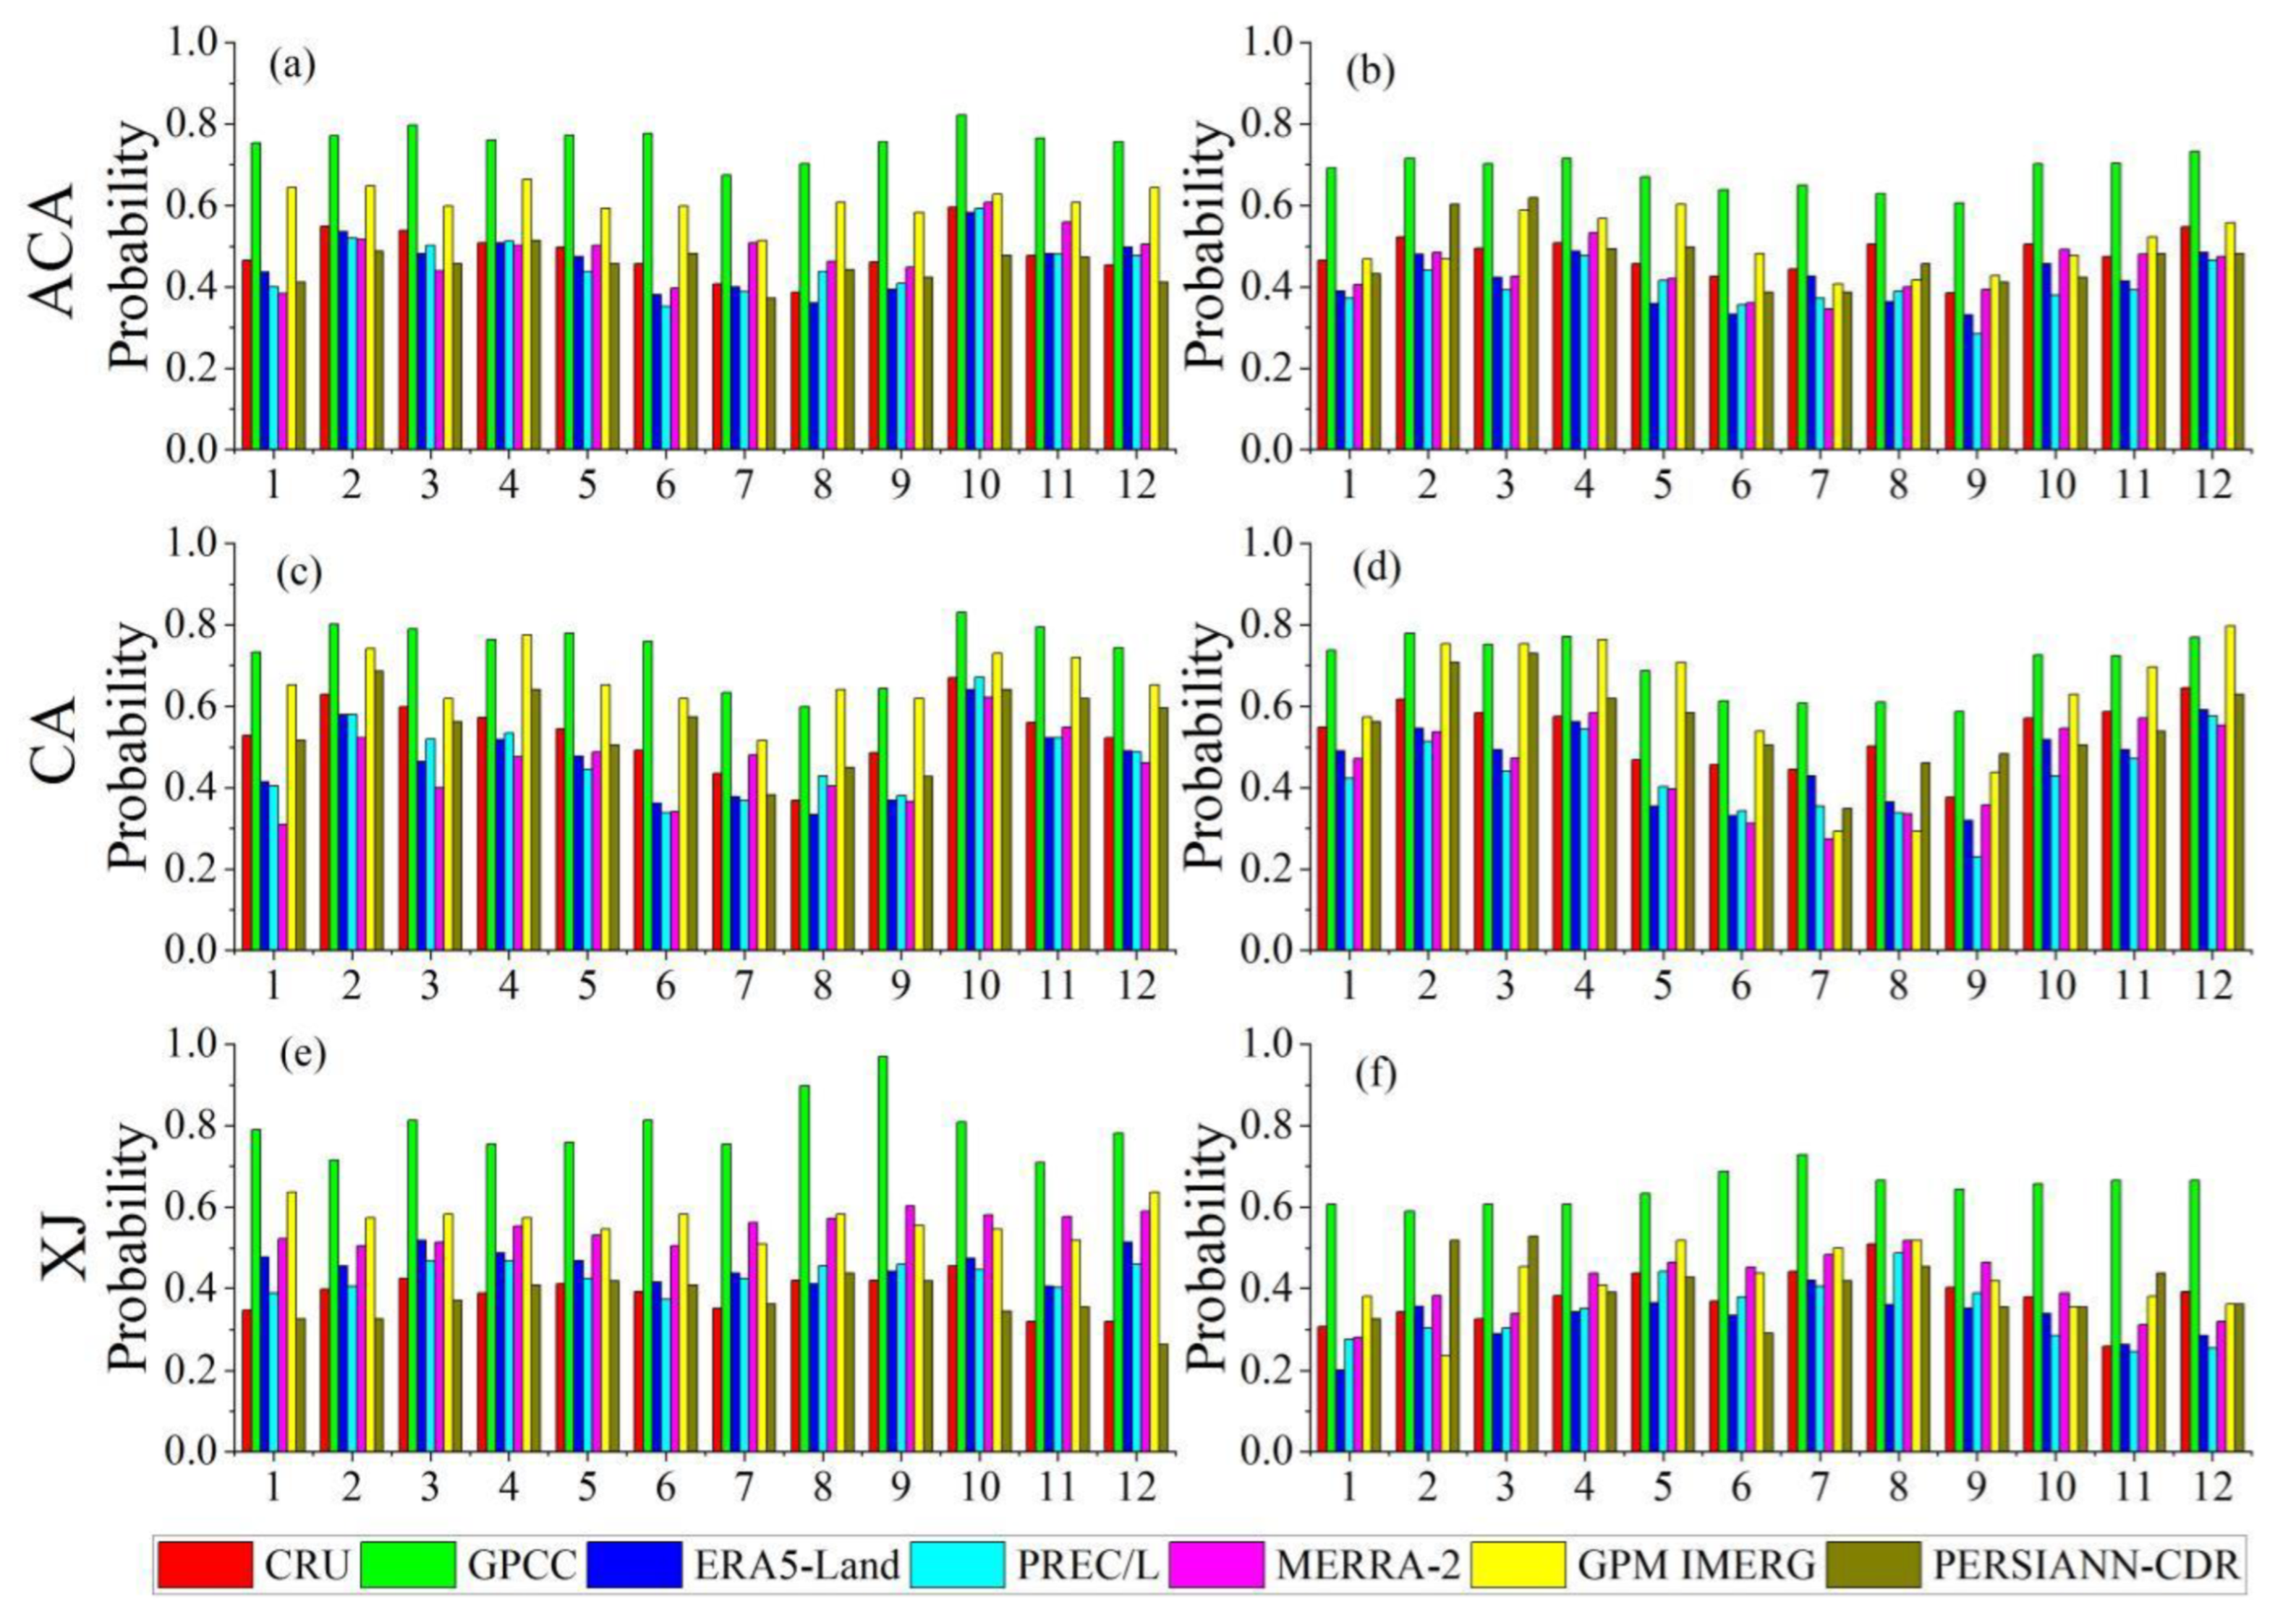
3.3. Accuracy in Describing Extreme Precipitation Events

3.3.1. Capture Probability

Figure 9 shows the probability of capturing heavy rainfall and drought events for the seven products. For the heavy rainfall events, GPCC outperformed the other products in the three regions, with an average capture probability of 75.9% for ACA, 73.9% for CA, and 79.69% for XJ. There was little difference in the performance of the other four long-term products, but regional CRU, PREC/L, and ERA5-Land performed better in CA, while MERRA-2 performed better in XJ (55.1%) than in CA (45.13%). For the two short-term products, GPM IMERG (61.06% for ACA, 66.1% for CA, and 56.97% for XJ) captured heavy rainfall events much better than PERSIANN-CDR in the three regions.
In terms of describing drought events, the performance of all precipitation products was generally worse than that of describing heavy rainfall events. The best-performing product was still GPCC (67.93% for ACA, 69.68% for CA, and 64.62 for XJ), which was different from the results by Hu et al. [42]. Hu’s study showed that CRU captured drought events better than GPCC, which could be attributed to the inconsistency of selected stations and the conditions of station quality control. CRU ranked second in ACA (47.76%) and CA (53.09%), but in XJ, MERRA-2 (40.37%) outperformed CRU (37.91%). ERA5-Land and PREC/L were the worst overall. GPM IMERG slightly outperformed PERSIANN-CDR.
Overall, the performance of the seven products varied across months and regions. However, whether capturing heavy rainfall events or drought events, they performed worst in the summer of CA and the winter of XJ.

3.3.2. Precipitation Intensity

Figure 10 shows the Taylor plot of Rx1month between the seven products and OBS or OBS2. In ACA and CA, GPCC, CRU, and PREC/L performed similarly and well, with standard deviations (SD) of approximately 1, the CC above 0.9, and the RMSE below 0.4. This result indicated that these three products were better at simulating extreme precipitation intensity. ERA5-Land and MERRA-2 had weaker performance against the other long-term products, and their SD and RMSE were similar, but the CC of ERA5-Land was greater than that of MERRA-2. In XJ, the GPCC performed similarly to that in ACA and CA, but the other four long-term products performed weaker, with the CC between 0.7 and 0.8, the SD about 1.2, and the RMSE between 0.6 and 0.8. For the two short-term products, the SD of PERSIANN-CDR was closer to 1, while the CC of GPM _IMERG was slightly larger than PERSIANN-CDR. Overall, GPM IMERG and PERSIANN-CDR performed similarly in the three regions.

4. Discussion

This paper evaluated seven gridded precipitation products in ACA using seven evaluation indices during 1980–2019. Our results showed that GPCC was the most applicable product among the five long-term products, the gauge-based products were overall more accurate than the reanalysis products, and that GPM IMERG was the better product between the two short-term satellite-based products (GPM IMERG and PERSIANN-CDR). The results can provide a reference for the selection of gridded precipitation products in areas like ACA, with complex topography and few meteorological stations. GPCC has been confirmed to be the closest gridded precipitation product to the ground truth in many regions of the world, such as in Africa [21], China [43], and Iran [44]. GPCC was derived directly from the station observations using a large number of stations (more than 85,000) for the interpolation [9], which might be the main reason for its high accuracy. CRU has been used extensively in the meteorological studies of ACA [37,45,46], and in this paper, it was characterized by good performance in reproducing regional mean precipitation. However, it performed less than satisfactorily at the station scale. Thus, GPCC is recommended for future study. ERA5-Land has the highest spatial resolution among the three reanalysis products, but performed worst among them, characterized by a significant overestimation of precipitation at almost all stations, particularly in the mountainous areas. Many studies have shown that ERA5-Land grossly overestimated precipitation [47,48]. It is not surprising that MERRA-2 underestimated precipitation across the study area (by about 20%) and outperformed CRU in XJ, with similar findings in a previous study [49]. A study has demonstrated its usability in mountainous regions of Asia [50], but in this study, PREC/L performed mediocrely. Differences between their input data, topography, spatial resolution, and parameterization schemes may lead to differences in the reanalysis data [30,49]. Satellite-based precipitation products have been widely used in meteorological and hydrological studies worldwide due to their high spatial and temporal resolutions [25,51,52,53]. However, currently, they are used less in ACA. A previous study [4] compared the accuracy of seven satellite-based precipitation products in the Bosten Lake Basin (within ACA) and found that GPM IMERG and PERSIANN-CDR were relatively better products. In this study, we further compared the two products in the whole ACA and found that the accuracy of GPM IMERG was much better than that of PERSIANN_CDR, which can provide a reference for the application of satellite-based precipitation products in ACA. Compared to the precipitation information of PERSIANN-CDR which is mainly derived from infrared, GPM IMERG has a broader source, including microwave-based precipitation estimates, microwave-calibrated infrared-based observations, and infrared-based observations [25,48]. The findings demonstrated the benefits of algorithms that combine multiple sensors.
All seven products performed better in CA than in XJ, which may be related to the climatic conditions of the two regions. The average annual precipitation in CA was about 300 mm, while in XJ it was only about 150 mm, showing that the seven gridded precipitation products had better accuracy in wetter areas. Similar conclusions can be drawn from extreme events, with most of the seven products capturing heavy rainfall events better than drought events. For precipitation intensity, the gauge-based products performed better than the reanalysis products, and the two satellite-based products performed similarly. It is worth noting that the areas with large deviations for the seven products were near the Tianshan Mountains and the Pamir Plateau (Figure 7), indicating that the accuracy of gridded precipitation products was significantly affected by topography. It is found that almost all gridded precipitation products were less accurate in mountainous areas than in plains [29,30,31,32,33,34,35]. On the one hand, due to the strong topographic dependence of moisture convergence and local convective precipitation, the precipitation products are less accurate in such complex topography [34,50]. On the other hand, the limited gauges used in their approaches are also an important reason [42]. In general, our study showed that GPCC performed better than the other products in mountainous areas at the monthly scale, which was consistent with previous studies [42]. Similar results were also found in other regions [43,54]. The impact of topography on the accuracy of gridded precipitation products should be quantified for more terrain-based subregions in our follow-up research. A decrease in the number of stations throughout the years might result in overly optimistic evaluation results for the same stations, which might be used for not only the evaluation of gridded products but also creating the products [55]. The sparse and decreased stations also challenged our ability to identify long-term precipitation changes in ACA.

5. Conclusions

In this study, the applicability of seven gridded precipitation products in ACA was evaluated from several aspects. The main conclusions were as follows.
(1) In describing the temporal change in regional precipitation, the seven products captured the annual precipitation trends well (except for ERA5-Land, which had a reversed trend in XJ). For seasonal precipitation, all products showed the seasonal distribution pattern correctly, i.e., most precipitation occurred in the summer of XJ and the spring and winter of CA. The evaluation indices showed that GPCC performed best among the five long-term products. ERA5-Land and MERRA-2 grossly overestimated and underestimated annual and seasonal precipitation, respectively. GPM IMERG and PERSIANN-CDR both overestimated precipitations, especially in winter. Overall, the seven products performed better in CA than in XJ, with GPCC and GPM IMERG being irreplaceable in XJ.
(2) In describing the spatial distribution pattern of precipitation, GPCC was better than the other products, in that it better reflected the spatial distribution and trend of annual precipitation. The spatial distribution of the four indices also showed that GPCC was closest to OBS, with a mean CC above 0.9 and RMSE, MAE, and BIAS closer to zero. Unlike the performance at the regional scale, the four indices showed that MERRA-2 ranked second at the station scale, followed by PREC/L, CRU, and ERA5-Land. GPM IMERG outperformed PERSIANN-CDR.
(3) In describing extreme precipitation events, GPCC was still the best product, with an average probability for capturing heavy rainfall events of over 70% and between 40% and 70% for the other products; the average probability for capturing drought events was above 60% on average for GPCC and between 30% and 50% for the other products. CRU ranks second in CA, and the other three long-term products performed comparably in CA, while MERRA-2 outperformed CRU in XJ and ACA. GPM IMERG outperformed PERSIANN-CDR. The Taylor plot of the maximum monthly precipitation index also showed that GPCC was the optimal product, especially in XJ. There was little difference between the two short-term products.
(4) Overall, the ranking of the seven precipitation products is GPCC > CRU > MERRA-2 > PREC/L > ERA5-Land and GPM IMERG > PERSIANN-CDR in CA; GPCC > MERRA-2 > CRU > PREC/L > ERA5-Land and GPM IMERG > PERSIANN-CDR in XJ.

Author Contributions

Conceptualization, C.X.; Data curation, L.S.; Formal analysis, L.S. and C.X.; Methodology, L.S., X.L. and N.S.; Project administration, C.X.; Software, L.S., Y.L. and L.C.; Supervision, X.L., N.S. and L.C.; Visualization, L.S. and X.L.; Writing—original draft, L.S.; Writing—review & editing, L.S. and C.X. All authors have read and agreed to the published version of the manuscript.

Funding

This work was supported by the National Natural Science Foundation of China (No. 42067062). The funder is Changchun Xu and the funding number is 42067062.

Data Availability Statement

Precipitation products used in this study are freely available and can be accessed from Table 1.

Acknowledgments

We acknowledge all the institutes for developing the freely available precipitation products.

Conflicts of Interest

The authors declare no conflict of interest.

References

  1. Pörtner, H.-O.; Roberts, D.C.; Tignor, M.; Poloczanska, E.S.; Mintenbeck, K.; Alegría, A.; Craig, M.; Langsdorf, S.; Löschke, S.; Möller, V.; et al. IPCC, 2022: Climate Change 2022: Impacts, Adaptation, and Vulnerability. Contribution of Working Group II to the Sixth Assessment Report of the Intergovernmental Panel on Climate Change; Cambridge University Press: Cambridge, UK; New York, NY, USA, 2022; p. 3056. [Google Scholar] [CrossRef]
  2. Yang, S.; Xu, W.H.; Xu, Y.; Li, Q.X. Development of a Global Historic Monthly Mean Precipitation Dataset. J. Meteorol. Res. 2016, 30, 457. [Google Scholar] [CrossRef]
  3. Tian, W.; Liu, X.; Wang, K.; Bai, P.; Liang, K.; Liu, C. Evaluation of Six Precipitation Products in the Mekong River Basin. Atmos. Res. 2021, 255, 105539. [Google Scholar] [CrossRef]
  4. Peng, J.; Liu, T.; Huang, Y.; Ling, Y.; Li, Z.; Bao, A.; Chen, X.; Kurban, A.; De Maeyer, P. Satellite-Based Precipitation Datasets Evaluation Using Gauge Observation and Hydrological Modeling in a Typical Arid Land Watershed of Central Asia. Remote Sens. 2021, 13, 221. [Google Scholar] [CrossRef]
  5. Shen, Y.; Feng, M.; Zhang, H.; Gao, F. Interpolation Methods of China Daily Precipitation Data. J. Appl. Meteorol. Sci. 2010, 21, 279–286. [Google Scholar] [CrossRef]
  6. Fang, X.; Guo, X.L.; Zhang, C.; Shao, H.; Zhu, S.H.; Li, Z.Q.; Feng, X.W.; He, B. Contributions of Climate Change to the Terrestrial Carbon Stock of the Arid Region of China: A Multi-Dataset Analysis. Sci. Total Environ. 2019, 668, 631–644. [Google Scholar] [CrossRef]
  7. Ahmed, K.; Shahid, S.; Chung, E.S.; Wang, X.J.; Bin Harun, S. Climate Change Uncertainties in Seasonal Drought Severity-Area-Frequency Curves: Case of Arid Region of Pakistan. J. Hydrol. 2019, 570, 473–485. [Google Scholar] [CrossRef]
  8. Harris, I.; Osborn, T.J.; Jones, P.; Lister, D. Version 4 of the CRU TS Monthly High-Resolution Gridded Multivariate Climate Dataset. Sci. Data 2020, 7, 1–18. [Google Scholar] [CrossRef] [Green Version]
  9. Schneider, U.; Becker, A.; Finger, P.; Rustemeier, E.; Ziese, M. GPCC Full Data Monthly Product Version 2020 at 0.25°: Monthly Land-Surface Precipitation FromRain-Gauges Built on GTS-Based and Historical Data; Global Precipitation Climatology Centre (GPCC) at Deutscher Wetterdienst: Offenbach, Germany, 2020. [Google Scholar] [CrossRef]
  10. Yatagai, A.; Kamiguchi, K.; Arakawa, O.; Hamada, A.; Yasutomi, N.; Kitoh, A. APHRODITE: Constracting a Long-Term Daukt Gridded Precipitation Dataset for Asia Based on a Dense Network of Rain Gauges. BAMS 2012, 93, 1401–1415. [Google Scholar] [CrossRef]
  11. Jiang, G.; Sun, X. Application of Grid Precipitation Datasets in Summer Precipitation Variability over East China. J. Meteorol. Sci. 2016, 36, 448–456. [Google Scholar] [CrossRef]
  12. Adler, R.F.; Sapiano, M.R.P.; Huffman, G.J.; Wang, J.J.; Gu, G.; Bolvin, D.; Chiu, L.; Schneider, U.; Becker, A.; Nelkin, E.; et al. The Global Precipitation Climatology Project (GPCP) Monthly Analysis (New Version 2.3) and a Review of 2017 Global Precipitation. Atmosphere (Basel) 2018, 9, 138. [Google Scholar] [CrossRef] [PubMed] [Green Version]
  13. Huffman, G.J.; Stocker, E.F.; Bolvin, D.T.; Nelkin, E.J. GPM IMERG Final Precipitation L3 1 Month 0.1 Degree x 0.1 Degree V06; Goddard Earth Sciences Data and Information Services Center (GES DISC): Greenbelt, MD, USA, 2019. [CrossRef]
  14. Nguyen, P.; Shearer, E.J.; Tran, H.; Ombadi, M.; Hayatbini, N.; Palacios, T.; Huynh, P.; Updegraff, G.; Hsu, K.; Kuligowski, B.; et al. The CHRS Data Portal, an Easily Accessible Public Repository for PERSIANN Global Satellite Precipitation Data. Nat. Sci. Data 2019, 6, 180296. [Google Scholar] [CrossRef] [PubMed] [Green Version]
  15. Kim, J.; Han, H. Evaluation of the CMORPH High-Resolution Precipitation Product for Hydrological Applications over South Korea. Atmos. Res. 2021, 258, 105650. [Google Scholar] [CrossRef]
  16. Muñoz Sabater, J. ERA5-Land-Land Monthly Averaged Data from 1950 to 1980; Copernicus Climate Change Service (C3S) Climate Data Store (CDS): Luxembourg, 2021. [Google Scholar] [CrossRef]
  17. Randles, C.A.; da Silva, A.M.; Buchard, V.; Colarco, P.R.; Darmenov, A.; Govindaraju, R.; Smirnov, A.; Holben, B.; Ferrare, R.; Hair, J.; et al. The MERRA-2 Aerosol Reanalysis, 1980 Onward. Part I: System Description and Data Assimilation Evaluation. J. Clim. 2017, 30, 6823–6850. [Google Scholar] [CrossRef]
  18. Chen, M.; Xie, P.; Janowiak, J.E. Global Land Precipitation: A 50-Yr Monthly Analysis Based on Gauge Observations. J. Hydrometeorol. 2002, 3, 249–266. [Google Scholar] [CrossRef]
  19. Cheng, X.; Wang, Y.; Li, G.; Li, Q. Evaluation of Three Reanalysis Precipitation Datasets in China. Progress. Inquisitiones Mutat. Clim. 2013, 9, 258–265. [Google Scholar] [CrossRef]
  20. Shi, H.; Li, T.; Wei, J. Evaluation of the Gridded CRU TS Precipitation Dataset with the Point Raingauge Records over the Three-River Headwaters Region. J. Hydrol. 2017, 548, 322–332. [Google Scholar] [CrossRef]
  21. Basheer, M.; Elagib, N.A. Performance of Satellite-Based and GPCC 7.0 Rainfall Products in an Extremely Data-Scarce Country in the Nile Basin. Atmos. Res. 2019, 215, 128–140. [Google Scholar] [CrossRef]
  22. Faiz, M.A.; Liu, D.; Fu, Q.; Sun, Q.H.; Li, M.; Baig, F.; Li, T.X.; Cui, S. How Accurate Are the Performances of Gridded Precipitation Data Products over Northeast China? Atmos. Res. 2018, 211, 12–20. [Google Scholar] [CrossRef]
  23. Moazami, S.; Najafi, M.R. A Comprehensive Evaluation of GPM-IMERG V06 and MRMS with Hourly Ground-Based Precipitation Observations across Canada. J. Hydrol. 2021, 594, 125929. [Google Scholar] [CrossRef]
  24. Mahmoud, M.T.; Mohammed, S.A.; Hamouda, M.A.; Mohamed, M.M. Impact of Topography and Rainfall Intensity on the Accuracy of IMERG Precipitation Estimates in an Arid Region. Remote Sens. 2020, 13, 13. [Google Scholar] [CrossRef]
  25. Hinge, G.; Hamouda, M.A.; Long, D.; Mohamed, M.M. Hydrologic utility of satellite precipitation products in flood prediction: A meta-data analysis and lessons learnt. J. Hydrol. 2022, 612, 128103. [Google Scholar] [CrossRef]
  26. Chen, F.H.; Huang, W.; Jin, L.Y.; Chen, J.H.; Wang, J.S. Spatiotemporal Precipitation Variations in the Arid Central Asia in the Context of Global Warming. Sci. China-Earth Sci. 2011, 54, 1812–1821. [Google Scholar] [CrossRef]
  27. Yao, J.; Chen, Y.; Chen, J.; Zhao, Y.; Tuoliewubieke, D.; Li, J.; Yang, L.; Mao, W. Intensification of Extreme Precipitation in Arid Central Asia. J. Hydrol. 2021, 598, 125760. [Google Scholar] [CrossRef]
  28. Schiemann, R.; Luthi, D.; Vidale, P.L.; Schar, C. The Precipitation Climate of Central Asia—Intercomparison of Observational and Numerical Data Sources in a Remote Semiarid Region. Int. J. Climatol. 2008, 28, 295–314. [Google Scholar] [CrossRef]
  29. Dilinuer, T.; Yao, J.; Chen, J.; Zhao, Y.; Mao, W.; Li, J.; Yang, L. Systematical Evaluation of Three Gridded Daily Precipitation Products Against Rain Gauge Observations Over Central Asia. Front. Earth Sci. 2021, 9, 1–17. [Google Scholar] [CrossRef]
  30. Hu, Z.; Ni, Y.; Shao, H.; Yin, G.; Yan, Y.; Jia, C. Applicability Study of CFSR, ERA-Interim and MERRA Precipitation Estimates in Central Asia. Arid Land Geogr. 2013, 36, 700–708. [Google Scholar] [CrossRef]
  31. Lai, S.; Xie, Z.; Bueh, C.; Gong, Y. Fidelity of the APHRODITE Dataset in Representing Extreme Precipitation over Central Asia. Adv. Atmos. Sci. 2020, 37, 1405–1416. [Google Scholar] [CrossRef]
  32. Guo, H.; Chen, S.; Bao, A.; Hu, J.; Gebregiorgis, A.; Xue, X.; Zhang, X. Inter-Comparison of High-Resolution Satellite Precipitation Products over Central Asia. Remote Sens. 2015, 7, 7181–7211. [Google Scholar] [CrossRef] [Green Version]
  33. Hu, Z.; Hu, Q.; Zhang, C.; Chen, X.; Li, Q. Evaluation of reanalysis, spatially interpolated and satellite remotely sensed precipitation data sets in central Asia. J. Geophys. Res. Atmos. 2016, 121, 5648–5663. [Google Scholar] [CrossRef] [Green Version]
  34. Peña-Guerrero, M.D.; Umirbekov, A.; Tarasova, L.; Müller, D. Comparing the performance of high-resolution global precipitation products across topographic and climatic gradients of Central Asia. Int. J. Climatol. 2022, 42, 5554–5569. [Google Scholar] [CrossRef]
  35. Zhang, C.; Chen, X.; Shao, H.; Chen, S.; Liu, T.; Chen, C.; Ding, Q.; Du, H. Evaluation and Intercomparison of High-Resolution Satellite Precipitation Estimates-GPM, TRMM, and CMORPH in the Tianshan Mountain Area. Remote Sens. 2018, 10, 1543. [Google Scholar] [CrossRef] [Green Version]
  36. Chen, F.; Dong, G.; Chen, J.; Gao, Y.; Huang, W.; Wang, T.; Chen, S.; Hou, J. Climate Change and Silk Road Civilization Evolution in Arid Central Asia:Progress and Issues. Adv. Earth Sci. 2019, 34, 561–572. [Google Scholar] [CrossRef]
  37. Huang, W.; Chen, J.; Zhang, X.; Feng, S.; Chen, F. Definition of the core zone of the “westerlies-dominated climatic regime”, and its controlling factors during the instrumental period. Sci. China Earth Sci. 2015, 58, 676–684. [Google Scholar] [CrossRef]
  38. Li, X.; Jiang, F.; Li, L.; Wang, G. Spatial and temporal variability of precipitation concentration index, concentration degree and concentration period in Xinjiang, China. Int. J. Climatol. 2010, 31, 1679–1693. [Google Scholar] [CrossRef]
  39. Salehi, H.; Sadeghi, M.; Golian, S.; Nguyen, P.; Murphy, C.; Sorooshian, S. The Application of PERSIANN Family Datasets for Hydrological Modeling. Remote Sens. 2022, 14, 3675. [Google Scholar] [CrossRef]
  40. Uysal, G. Product- and Hydro-Validation of Satellite-Based Precipitation Data Sets for a Poorly Gauged Snow-Fed Basin in Turkey. Water 2022, 14, 2758. [Google Scholar] [CrossRef]
  41. Uysal, G.; Şorman, A.Ü. Evaluation of PERSIANN family remote sensing precipitation products for snowmelt runoff estimation in a mountainous basin. Hydrol. Sci. J. 2021, 66, 1790–1807. [Google Scholar] [CrossRef]
  42. Hu, Z.; Zhou, Q.; Chen, X.; Li, J.; Li, Q.; Chen, D.; Liu, W.; Yin, G. Evaluation of Three Global Gridded Precipitation Data Sets in Central Asia Based on Rain Gauge Observations. Int. J. Climatol. 2018, 38, 3475–3493. [Google Scholar] [CrossRef]
  43. Wang, D.; Wang, A. Applicability Assessment of GPCC and CRU Precipitation Products in China during 1901 to 2013. Clim. Environ. Res. 2017, 22, 446–462. [Google Scholar] [CrossRef]
  44. Salman, S.A.; Shahid, S.; Ismail, T.; Al-Abadi, A.M.; Wang, X.; Chung, E.S. Selection of Gridded Precipitation Data for Iraq Using Compromise Programming. Meas. J. Int. Meas. Confed. 2019, 132, 87–98. [Google Scholar] [CrossRef]
  45. Zhang, L.; Wang, Y.; Chen, Y. Spatial and Temporal Distribution Characteristics of Drought in Central Asia Based on SPEI Index. Arid. Zone Res. 2020, 37, 331–340. [Google Scholar] [CrossRef]
  46. Yan, X.Y.; Zhang, Q.; Ren, X.Y.; Wang, X.Y.; Yan, X.M.; Li, X.Q.; Wang, L.; Bao, L.L. Climatic Change Characteristics towards the “Warming-Wetting” Trend in the Pan-Central-Asia Arid Region. Atmosphere 2022, 13, 467. [Google Scholar] [CrossRef]
  47. Li, Y.; Qin, X.; Liu, Y.; Jin, Z.; Liu, J.; Wang, L.; Chen, J. Evaluation of Long-Term and High-Resolution Gridded Precipitation and Temperature Products in the Qilian Mountains, Qinghai–Tibet Plateau. Front. Environ. Sci. 2022, 10, 609. [Google Scholar] [CrossRef]
  48. Hong, T.; Li, H.; Chen, M. Comprehensive Evaluations on the Error Characteristics of the State-of-the-Art Gridded Precipitation Products Over Jiangxi Province in 2019. Earth Space Sci. 2021, 8, e2021EA001787. [Google Scholar] [CrossRef]
  49. Yao, J.; Chen, Y.; Yu, X.; Zhao, Y.; Guan, X.; Yang, L. Evaluation of Multiple Gridded Precipitation Datasets for the Arid Region of Northwestern China. Atmos. Res. 2020, 236, 104818. [Google Scholar] [CrossRef]
  50. Song, C.; Huang, B.; Ke, L.; Ye, Q. Precipitation Variability in High Mountain Asia from Multiple Datasets and Implication for Water Balance Analysis in Large Lake Basins. Glob. Planet. Chang. 2016, 145, 20–29. [Google Scholar] [CrossRef]
  51. Kim, D.; Shin, D.B.; Kim, J.; Kang, M.J.; Lee, H.K.; Chun, H.Y. Differences in Satellite-Based Latent Heating Profiles Between the 2015/2016 Disruption and Westerly Phase of the Quasi-Biennial Oscillation. J. Geophys. Res. Atmos. 2022, 127, e2021JD036254. [Google Scholar] [CrossRef]
  52. Prakash, A.J.; Kumar, S. Impact of extreme weather events on cropland inundation over Indian subcontinent. Environ. Monit. Assess. 2022, 195, 1–15. [Google Scholar] [CrossRef]
  53. Bhattacharya, B.; Mazzoleni, M.; Ugay, R. Flood Inundation Mapping of the Sparsely Gauged Large-Scale Brahmaputra Basin Using Remote Sensing Products. Remote Sens. 2019, 11, 501. [Google Scholar] [CrossRef] [Green Version]
  54. Wei, L.; Jiang, S.; Ren, L.; Yuan, F.; Zhang, L. Performance of Two Long-Term Satellite-Based and GPCC 8.0 Precipitation Products for Drought Monitoring over the Yellow River Basin in China. Sustainability 2019, 11, 4969. [Google Scholar] [CrossRef] [Green Version]
  55. Zandler, H.; Haag, I.; Samimi, C. Evaluation needs and temporal performance differences of gridded precipitation products in peripheral mountain regions. Sci. Rep. 2019, 9, 1–15. [Google Scholar] [CrossRef] [PubMed]
Figure 1. Distribution map of meteorological stations across arid Central Asia.
Remotesensing 14 06039 g001
Figure 2. Changes in the number of meteorological stations in each region during 1980–2019.
Remotesensing 14 06039 g002
Figure 3. Variations in annual precipitation (left, ac) and monthly precipitation (right, df) during 1980–2019 in arid Central Asia (ACA), Central Asia (CA), and Xinjiang of China (XJ).
Remotesensing 14 06039 g003
Figure 4. Performance of the seven precipitation products evaluated by the indices of CC (a), RMSE (b), BIAS (c), and MAE (d) at the seasonal scale. The first acronym represents regions and the second represents seasons. MAM for spring; JJA for summer; SON for autumn; DJF for winter.
Remotesensing 14 06039 g004
Figure 5. Spatial distribution pattern of average annual precipitation for OBS, OBS2, five OBS-based gridded products, and two OBS2-based gridded products in ACA.
Remotesensing 14 06039 g005
Figure 6. Spatial distribution of the annual precipitation trend (mm/a) for OBS, OBS2, and seven gridded products in ACA (the black dots indicate the trends passing the 95% confidence level test).
Remotesensing 14 06039 g006
Figure 7. CC, RMSE, BIAS, and MAE between the seven monthly gridded precipitation products and OBS and OBS2 at stations in ACA during 1980–2019.
Remotesensing 14 06039 g007
Figure 8. Performance of monthly precipitation evaluated by the four indices (points represent the outliers. For the whiskers, the upper and lower boundaries represent the maximum value and minimum value, respectively. For the color boxes, the top, middle, and bottom black lines represent the first quartile value, the median value, and the third quartile value, respectively).
Remotesensing 14 06039 g008
Figure 9. Monthly probability of heavy rainfall events (a,c,e) and drought events (b,d,f) captured by the seven products.
Remotesensing 14 06039 g009
Figure 10. Taylor diagram of Rx1month between the seven products and observations (OBS and OBS2) in ACA (a,d), XJ (b,e), and CA (c,f). The capital letters in the diagram represent the seven precipitation products, A (CRU), B (GPCC), C (MERRA-2), D (ERA5-Land), E (PREC/L), F (GPM IMERG), and G (PERSIANN-CDR).
Remotesensing 14 06039 g010
Table 1. Information about the seven gridded precipitation products used in this study.
NameTime RangeTime
Resolution
Spatial ResolutionData Sources
Gauge-based productsCRU1901–2020Monthly0.5° × 0.5°https://crudata.uea.ac.uk/cru/data/hrg/ (accessed on 6 November 2021)
GPCC1891–2019Monthly0.25° × 0.25°https://www.dwd.de/EN/ourservices/gpcc/gpcc.html (accessed on 6 November 2021)
Reanalysis productsERA5-Land1950–2022Monthly0.1° × 0.1°https://cds.climate.copernicus.eu/(accessed on 10 December 2021)
PREC/L1948–2022Monthly1° × 1°https://psl.noaa.gov/data/gridded/data.precl.html (accessed on 6 November 2021)
MERRA-21980–2022Monthly0.5° × 0.625°https://gmao.gsfc.nasa.gov/reanalysis/MERRA-2/ (accessed on 10 December 2021)
Satellite-
based
Products
GPM IMERG2001–2021Monthly0.1° × 0.1°https://gpm.nasa.gov/data/directory (accessed on 5 December 2021)
PERSIA
NN-CDR
1983–2022Daily0.25° × 0.25°http://chrsdata.eng.uci.edu/ (accessed on 21 November 2021)
Table 2. Performance of the seven precipitation products based on four indices at an annual scale.
ProductsCRUGPCCERA5
-Land
PREC/LMERRA-2GPM IMERGPERSI
ANN-CDR
IndicesRegion
CCACA0.9930.9970.9680.9860.7700.9710.919
CA0.9870.9920.9380.9690.7340.9650.938
XJ0.9240.9940.7370.7670.7440.9050.833
RMSE
(mm)
ACA10.4626.420161.58118.36773.06839.89260.998
CA13.54812.379167.17938.09091.88957.98661.869
XJ17.6013.019127.60429.11124.69727.78660.105
BIAS
(%)
ACA1.985−0.27560.138−5.593−22.87620.35831.457
CA0.404−1.32247.051−10.898−24.76923.23824.484
XJ10.5530.94588.71515.356−8.99417.27537.971
MAE
(mm)
ACA7.9244.585147.52714.85657.41337.64258.163
CA10.4438.662139.50332.78374.52054.62857.557
XJ15.5362.244125.49924.68119.44825.56056.184
Publisher’s Note: MDPI stays neutral with regard to jurisdictional claims in published maps and institutional affiliations.

