Article

An Integrated Method for River Water Level Recognition from Surveillance Images Using Convolution Neural Networks

1
School of Telecommunication Engineering, Xidian University, Xi’an 710071, China
2
State Grid Jilin Province Electric Power Company Limited Information Communication Company, Changchun 130021, China
3
School of Electronics and Information Engineering, Beihang University, Beijing 100191, China
*
Author to whom correspondence should be addressed.
Remote Sens. 2022, 14(23), 6023; https://doi.org/10.3390/rs14236023
Submission received: 20 October 2022 / Revised: 18 November 2022 / Accepted: 21 November 2022 / Published: 28 November 2022
(This article belongs to the Special Issue Remote Sensing of Watershed)

Abstract

:
Water conservancy personnel usually need to know the water level by water gauge images in real-time and with an expected accuracy. However, accurately recognizing the water level from water gauge images is still a complex problem. This article proposes a composite method applied in the Wuyuan City, Jiangxi Province, in China. This method can detect water gauge areas and number areas from complex and changeable scenes, accurately detect the water level line from various water gauges, and finally, obtain the accurate water level value. Firstly, FCOS is improved by fusing a contextual adjustment module to meet the requirements of edge computing and ensure considerable detection accuracy. Secondly, to deal with scenes with indistinct water level features, we also apply the contextual adjustment module for Deeplabv3+ to segment the water gauge area above the water surface. Then, the area can be used to obtain the position of the water level line. Finally, the results of the previous two steps are combined to calculate the water level value. Detailed experiments prove that this method solves the problem of water level recognition in complex hydrological scenes. Furthermore, the recognition error of the water level by this method is less than 1 cm, proving it is capable of being applied in real river scenes.

1. Introduction

Hydrological monitoring is a very important research area for many countries, especially where there are many river regions. Rivers play a critical role in human life and are also the source of floods [1]. Floods occur more frequently during the rainy season, causing substantial economic losses and disaster-induced diseases. Consequently, it is urgent and necessary to cope with flood disasters quickly. River level detection is the fundamental task of flood monitoring and needs to be accurate and fast [2].
Detecting river levels is not a trivial task [3]. With the development of surveillance cameras and modern 6G communication technologies [4], more and more hydrological stations use surveillance cameras to track water levels. Various measurement sensors are also used for automatic monitoring of water level; these are usually divided into contact or non-contact types according to their measurement methods [5]. Methods based on physical equipment include float gauge devices, pressure gauge devices, ultrasonic gauge devices, laser gauge devices, etc. [6]. However, these methods have the problem of complicated installation, great influence by environmental factors, difficult maintenance, or huge cost. In general, the most widely used measurement method is to observe a water gauge, which is an iron sheet approximately 1 meter high and 15 cm wide [7]. A water gauge is always installed in a suitable place near the monitored river, but reading of water gauges still needs to be completed manually. In remote work, water conservancy personnel read the images taken by the camera or remotely monitor the gauge [8]. In this way, water level measuring has been recognized as an important detection, classification, and tracking process. To reach closer to the real water level value, the accurate water level line position also needs to be detected. Furthermore, the existence of multiple water gauges and composite water gauges leads to negative effects on the performance of the measurement system.
For the purpose of avoiding laborious manual observation and subjective error, it is necessary to apply computer vision technology. The traditional water level detection method has three steps. The first is to locate the area containing the water gauge in the image. A typical method is to use edge segmentation to get an easier image for edge detection then get an appropriate area containing the water gauge [9]. This method is easy to implement, but the application scenarios are limited. It can only be used in scenes where the gauge is very simple to distinguish from the environment. The other locating method is to use the combination of HOG and SVM [10,11]. HOG is a classical feature extraction method, and SVM is a classical feature classification method. Usually, the sliding window method is used to generate an imprecise region as a candidate region, then, HOG is used to extract the features of the candidates, and finally, SVM is used to judge whether the region contains a water gauge. Although this combined method is partially effective, the biggest disadvantage of the method is that the feature extractor is artificially designed. Although the production standard of the water gauge is fixed, the background of the water gauge is variable. Environmental influence can also lead to situations such as defacement and obscuration of the water gauge, resulting in a human-designed feature extractor not characterizing the water gauge features well. After locating the water gauge area, the next step is to determine the number on the gauge that lies above the water surface. The area of single detection is reduced to only the area of the water gauge instead of the whole image. Water gauge numbers can be recognized using a combination of HOG and SVM methods, but due to the special features of printed numbers, optical characters are often used for identification. OCR is effective in recognizing purely digital areas of the water gauge [12], but recognition performance is often affected by many factors, such as digital distortion, water gauge defacement, and low clarity. In real hydrological scenarios, there are often many disturbances that cause the water gauge to be in a non-standard format [13], which can make the identification task very difficult. The final step is detecting the water level line. Since the water level line of the water gauge is not a straight-line feature in the conventional sense, similar shoreline detection and other types of straight-line detection methods cannot solve the problem. There is no specific solution for the water level line of the gauge scale in the current literature. However, determination of the water level line almost determines the accuracy of the water level value, so solving this problem is crucial.
Object detection is the first and most essential step in the field of computer vision [14,15,16] and brings a leap to many other fields, such as autonomous driving in smart transportation, intelligent security, and remote sensing [17,18,19,20,21,22,23]. The combined approach of HOG and SVM has poor results in object detection due to the shortcomings of the feature extractor. Deep learning has changed the situation, especially convolutional neural networks (CNNs) [24]. CNNs have exacting feature extraction capabilities and do not require human-designed feature extractors [25]. In the ImageNet 2010 challenge [26], Alex’s deep convolutional neural network AlexNet achieved first place and was 10 percent ahead of the second place method in the top-five rating [27]. The superior results of AlexNet demonstrate the superiority of CNN for computer vision tasks. Since then, more and more researchers have applied CNN to target detection, semantic segmentation, and pose detection, as well as other vision tasks [28]. In the target detection task, CNN has been optimized and adjusted. YOLO [29], R-CNN [30], and SSD [31] are effective models that continuously improve the accuracy of object detection. A key step in water level recognition is the detection of the gauge and the printed numbers on the guage [32]. Therefore, it is crucial to apply such target detection models to help solve the shortcomings of traditional water level recognition methods. Another key step in the work is how to find the water level line. Conventional linear-type detection methods cannot recognize water level lines with good performance in some complex river situations [33]. The actual water gauge image has the feature that the water level line represents the split line of the water surface and the rest of the environment. Therefore, if it is possible to divide the part above the water surface, then the lower boundary of the segmented area is the water level line. Segmenting a specific region from an image belongs to the task of semantic segmentation. Similarly, CNN also has an ideal positive effect on segmentation jobs. Since the fully convolutional network (FCN) was proposed by Jonathan Long for semantic segmentation [34], CNNs have gradually become the mainstream approach. Therefore, using a semantic segmentation model to obtain the portion of the gauge above the water and calculating the water level line from the segmented polygon area is a feasible solution.
The challenge of water level recognition from water gauge images has two parts: gauge area detection and water level line detection. Existing methods focus on water gauge area detection in a single or fixed scene. They use some prior information to assist in locating the water gauge area. Therefore, they are not suitable for complex scenarios. To solve these problems efficiently, this paper introduces convolution neural networks to detect the water gauge and the printed numbers. Then, since this water level line is different from the general Riparian lines, traditional methods cannot solve this problem [35]. The semantic segmentation model is applied to segment the water gauge above the water surface to obtain the exact water level line.
Here is a summary of our work to solve the problems above. First, the fully convolutional one-stage (FCOS) object detection model was employed [36]. To efficiently detect small objects with a smaller model, FCOS was improved by fusing the context fusion model to determine the area of the gauge and the numbers above the water surface. After getting these, the rough water level value can be determined. Then, the semantic segmentation model named DeepLabv3+ was applied to segment the water gauge above the water surface [37]. After that, the water level can be determined from the result of segmentation. The above-water part and the underwater part of the water level gauge have similar image features. River water with different levels of clarity will make the underwater gauge look different. However, the clearer the water is, the more the water gauge underwater looks the same as the water gauge above the water. This phenomenon causes the model to have difficultly distinguishing between the two parts of the water gauge. We find an innovative way to solve this problem by proposing a contextual semantic fusion module for the DeepLab model. The main contributions of this paper include the following:
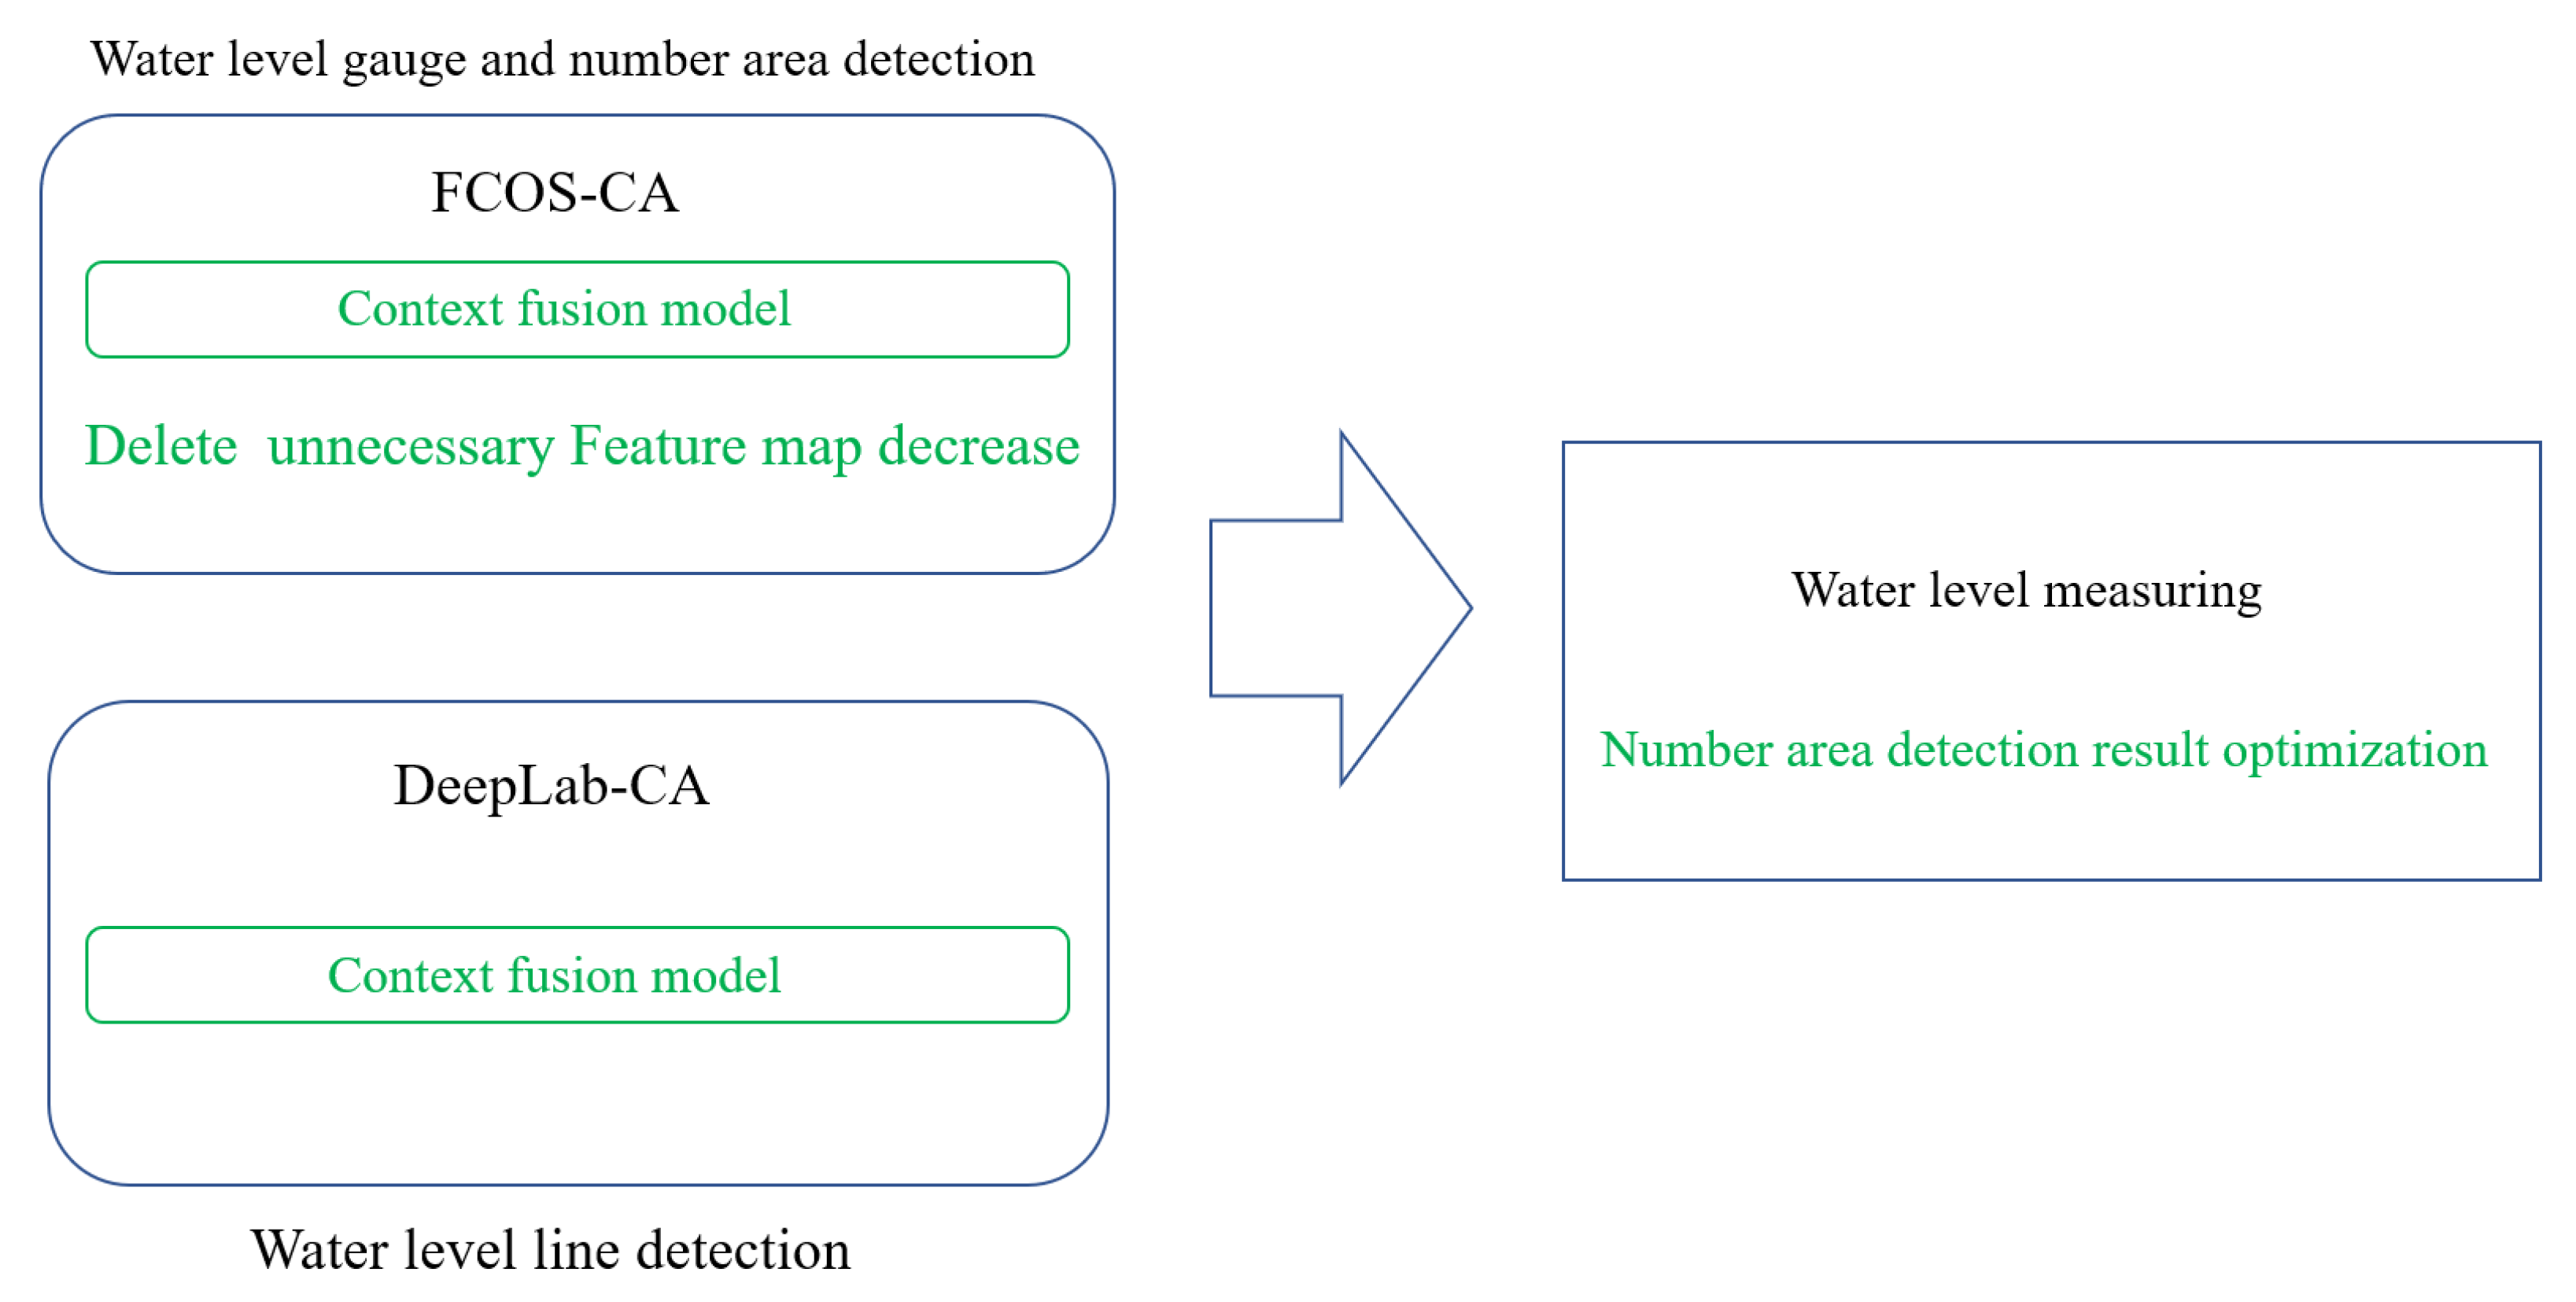
  • In order to measure the water level in water gauge images in complex scenes, this article proposes a composite method that can accurately obtain the water level.
  • In order to get the position of the water level line, this paper proposes an innovative module that divides features into different levels. This module first obtains high-level segmentation results and then gradually fuses them downward.
  • Water gauge images of actual scenes and seven special scenes are used to evaluate the method proposed in this article.

2. Related Work

2.1. Physical Equipment for Water Level Recognition

Around the world, disasters caused by floods cause huge losses every year [38,39,40]. Detecting rising river levels is essential for flood warnings. Different physical sensor devices have been designed to apply to different environments to solve the problem by recognizing the water level. These automated water level detection devices are categorized into two types according to the measurement method: contact and non-contact. Contact devices use sensors to convert water level information into actual water level values by setting up auxiliary equipment in the water or on the shore. Non-contact devices, on the other hand, do not require fixed facilities and are usually hand-held devices that can be easily moved to multiple locations for testing. Contact-based water level measurement equipment mainly includes float-type water level meters and pressure-type water level meters, and non-contact water level measurement equipment mainly includes ultrasonic water level meters, radar-type water level meters, and laser-type water level meters. Float-type water level meters usually use floats to sense the change to the water level up or down and records the transmission record directly by mechanical means. The entirety of the equipment usually consists of floats, balance hammers, and suspension ropes, which need to be used in conjunction with water level wells. Although float-type water level meters have high measurement accuracy and a large measurement range, they have high equipment installation and maintenance difficulty and are susceptible to floods. Pressure-type water level meters [41] use underwater measurement points as the water depth and water pressure reference points; changes to the water surface height bring changes to the pressure value. According to the relationship equation between underwater pressure and water depth, the change of water surface height is calculated. Pressure-type water level meters need to be used in calm water bodies and are less stable in the field, and it is difficult to guarantee measurement accuracy. Ultrasonic-type water level meters [42] use the principle of ultrasonic reflection to measure the water level; the sensor emits ultrasonic signals to the surface of the river, the ultrasonic waves encounter the water surface and reflect to the receiving sensor, and the receiver calculates the distance by propagation time, thus calculating the water level. Ultrasonic water level meters have better performance in terms measurement accuracy, and the installation is easier in complex environments, but they are vulnerable to environmental impact. A radar-type water level meter is a special kind of water level measurement equipment; it is not affected by weather, environment, installation conditions, or other factors. The measurement principle is to use the reflection of electromagnetic waves to send a radar pulse from the radar antenna sensor to the water surface. After the pulse is reflected from the water surface, the antenna receives the reflected signal and records the time, processes the received pulse signal, and finally calculates the river level. Laser-type water level meter is a kind of water level measuring instrument using laser distance measurement. It uses the advantage of light beam propagation; the transmitter emits a high-speed laser pulse, then, the laser pulse meets the water surface and reflects, and the laser receiver receives and calculates the propagation time, thus calculating the water level height. The characteristics of these methods are shown in Table 1.

2.2. Image-Based Water Level Recognition

In recent years, most horological stations have been equipped with monitoring systems, especially video surveillance systems connected with networks [43]. More and more automatic water line recognition methods and measurements have been proposed to deal with flood-related disasters [44]. Image processing is an essential part of image-based methods in detecting water level and almost completely determines the performance of the detecting system. There are mainly two kinds of methods in image processing, which are as follows.
The first approach mimics the human vision mechanism, in which the water level is first measured by positioning the water gauge and then identifying the numbers [45,46]. Bruinink improved the segmentation method of the water gauge using a two-class random forest classifier based on a feature vector of textons [47]. Then, a Gaussian mixture model segmentation is applied to the gauge bar and numbers for reading the water gauge. However, the algorithm is relatively sensitive to the environment where the gauge is located. If the gauge itself is dirty, damaged, or lacking light, and the water surface is polluted, the performance of the algorithm is greatly affected.
The idea of the second method is from machine vision. Like the above method, the position of the water level meter is first determined. The difference is that this method converts the coordinate relationship of the water meter into a pixel histogram relation and then determines the water level [48,49,50]. In the recognition of two-color water gauges, the horizontal projection method is better and more popular. The projection method can be used for horizontal projection according to grayscale images [51], binary images [52], edge images [53], etc. In this method, the water level is determined by looking for points in the horizontally projected curve where the change is steep. Further, the environment can cause some noise in the desired curve. For example, refraction of the water surface affects the distribution of gray values, thereby affecting the horizontal projection curve, and the final measurement result will be discounted.

2.3. Object Detection and Semantic Segmentation

Object detection is a very basic but essential task in computer vision work, and there is a research history of nearly two decades in the academic field. Traditional object detection methods, such as HOG and DPM, rely heavily on feature extractors designed by human experts. Moreover, there is no definite paradigm to design feature extractors, which leads to the failure of traditional methods to achieve excellent results. With the development of computers, deep learning has opened up a broader path for object detection, and more and more studies have begun to explore neural networks to achieve better detection results. There are mainly two kinds of target detection algorithms: anchor-based and anchor-free. The difference is the anchor’s function. In an anchor-based algorithm, such as SSD and YOLO, an anchor is used to extract candidate target frames, and preset anchors are used to obtain candidate areas and to perform predictions on these proposals. However, designing a suitable ratio is a difficult task that requires strong prior knowledge. Anchor-based methods also generate lots of redundant candidate areas, resulting in the detection effect of positive and negative samples being very different. Anchor-free methods, such as CornerNet and FCOS [54], get rid of the restriction of anchors and directly predict key points for detection and classification.
Semantic segmentation is a concept similar to target detection, but it is relatively complex. The task of image classification is to classify an image into a certain category, and semantic segmentation is a further classification for each pixel: pixels are classified into different classes based on certain rules [55]. The FCN model applies end-to-end full convolutional networks to semantic segmentation. The deconvolution layer of FCN performs upsampling interpolation operations by learning, instead of simple bilinear interpolation. The encoder–decoder structure of the Unet model effectively improves the effectiveness of training with a small number of data [56,57]. In terms of feature fusion, Unet connects the semantic information at the level of the macro information of the network with the fine-grained features at the level with more detailed information in the channel dimension. Fisher proposed dilated convolution [58]. Dilated convolution increases the corresponding perceptual field size without reducing the spatial dimensionality, which facilitates the network to obtain multi-scale contextual features. DeepLab [59] proposes atrous spatial pyramidal pooling in spatial dimensions to enhance the segmentation of multi-scale targets.

3. Methodology and Raw Data

3.1. Key Steps for Water Level Recognition

The most critical step of water level recognition based on a gauge image is focused on water gauge processing. When using the human eye observation method, it is necessary to first find the area where the water gauge exists in the image. After roughly locating the water gauge area, the individual must carefully observe the scale on the water gauge that still remains above the water surface. This is a critical step when the water is particularly clear. Then, the water level is calculated using the numbers, gauge, and position of the level. The whole process of human eye observation can be summarized in three steps: water scale area and gauge number area detection, water level line detection, and water level value calculation. The method in this paper takes a technique from deep learning to recognize the water level and also follows the above process. The first step is to detect the water gauge and the gauge numbers. This is a target detection task, and this article uses the model of target detection to detect the key targets in the water gauge images, including the numbers on the water gauges and the gauge bodies. Since there are multiple water gauges in the actual hydrological scenario, each water gauge needs to be distinguished. The water level value is calculated from the numbers present on the gauge, so the numbers on the gauge body that are above the water surface need to be detected. The second step is to perform water level line segmentation. This article uses the semantic segmentation method of deep learning to segment the part of the water gauge image that lies above the water surface, and the lower boundary of this part is the actual water level line, which needs to be extracted from the segmented region.

3.2. Water Gauge and Gauge Number Detection

The water gauge detection network in this article is modified from the FCOS network. FCOS is an excellent one-stage network that has both detection speed and detection accuracy. FCOS is a pixel-by-pixel FCN-based object detection model. This network contains three parts of backbone, feature pyramid network, and heads, which are applied for classification and regression. The model is mainly deployed with the idea of edge computing [60,61]. Edge computing is a proposed solution to solve the hydrological monitoring of a river area. In an edge computing network, many facilities involving data processing and storage can be placed closer to the data source. In this way, the preprocessing of data can ensure the real-time requirements of the application, and the security of information can also be better protected. For edge deployment, the network needs to be as small as possible while ensuring accuracy. FCOS needs improvement to detect small objects. Based on FCOS, a convolutional network for water gauge detection was proposed with the basic network ResNet-54. FCOS uses five feature maps of different scales for further detection. Since the task is single-target detection, these feature maps of different scales are not necessary, so we kept just three feature maps in this module. The heads for regression and classification are also reduced to three. After adopting the above modifications, the complexity of the model and the monitoring accuracy are taken into account at the same time. The effect of multi-scale fusion was improved based on feature pyramids [62]. The information contained in the feature maps of different levels is different. The high-level features more easily give people an intuitive feeling and contain relatively macro information, while the lower levels hide more details. Level features and underlying level feature fusion are the core of the model [63,64,65]. For feature maps of different levels, minimization of the loss of the original semantic information in the fusion is the focus of research. A context fusion module is used to solve this problem. This module is dedicated to discovering correlations between contexts. Contextual adjustment produces dense pixel-level contextual information while improving the efficiency of feature encoding in long connection paths. The structure diagram of the improved FCOS model is shown in Figure 1. Yellow squares indicate the CA module: each CA has a high-level feature map input, a low-level feature map input, and outputs a feature map fused with contextual information.

3.3. Water Gauge Area Segmentation

Semantic segmentation based on CNN has reached a very impressive level [66,67,68]. From FPN to DeepLab series models [59,69,70,71], the performance of semantic segmentation is continuously improving. DeepLabv3+ employs an atrous pyramid pooling and encoder–decoder architecture to encode multi-level contextual information by processing incoming features through void convolution with multiple expansion coefficients and sensory fields for pooling operations, while the decoder network can get more informative object edges by reverting to spatial information step-by-step. DeepLabv3+ achieves state-of-the-art results on the VOC2012 dataset. However, this model still has some limitations that lead to the inability to apply the model directly to the water gauge level recognition task. The model for water level recognition needs to be run on an edge device rather than a computer in the future, so there is a limit to the size of the model [72]. Thus, ResNet-54 is the backbone network for DeepLab [73]. The reduction to the backbone network leads to a reduction in performance. To alleviate this problem, taking into consideration the segment accuracy of whether the water gauge is under the water or not, the method of feature mixing was improved by employing the contextual fusion module, which is shown in Figure 2. As a comparison, the improved DeepLab is shown in Figure 3.

3.4. Water Level Recognition

From the above analysis of water gauge recognition, we identify the problem that must be solved in the practical application and support for our proposed CA-GAN model. In this section, the CA-GAN model is created to remove the above obstacle.

3.4.1. Water Level Line Extraction

The result of DeepLab segmentation is a polygonal area. The water level line needs to be calculated from its polygon. Firstly, this method calculates the maximum enclosing rectangle of the area. For convenience, only the vertical rectangular box is calculated. The key of the rectangular box is to calculate two coordinates: the upper left point and the lower right point. Since the segmentation result image is a black-and-white image with only two pixel values, 0 and 255, the “scan line” method can be used to get the coordinates. The water level is at the bottom of the rectangular box. The water level line extraction schematic is shown in Figure 4.

3.4.2. Water Level Measurement

The result of FCOS object detection shows the pixel coordinates of each number, and the distance between each number can be calculated. The segmentation result of the water level line shows its pixel height, and it is then used to calculate its distance to the nearest number. The detection results of the FCOS model are rectangular boxes; ideally, a rectangular box can be given for each figure. Due to the complex background of the actual water gauges, the detection accuracy of the FCOS model cannot reach 100 percent, resulting in the existence of missed or false detection. It is necessary to use the distribution of numbers on the gauge as prior information. The numbers 0 to 9 are evenly spaced from bottom to top on the water gauge, and the detection results are processed to remove the wrong detection results.
A detection rectangle represents a region of digits, and the coordinates of the upper left point and lower right point of the rectangle are known information. The coordinates of the center of the digit rectangle are denoted as h x , where x denotes the digit number, while the distance between two adjacent detection digits is denoted using d x y . Since each digit is equally spaced, the actual distance d ¯ between two adjacent digits can be expressed by Equation (1).
d ¯ = 1 / n d x y
The value of n is determined by the actual numbering distance between the digits. If the model detects only two numbers, “8” and “2”, the value of n is 6. The actual height of any one number, i.e., the physical distance, is 5 cm, and the actual physical distance between two adjacent numbers is 10 cm, i.e., the actual physical distance per unit pixel height. The actual physical distance per unit pixel height is expressed by (2).
d = d ¯ / 10
The height of the center coordinate of the detected minimum number x is h m i n , and the height of the detected level line is h l i n e ; then, the actual water level value can be calculated by Equation (3).
f ( x ) = x ( h l i n e h m i n ) / d ¯ , h l i n e h m i n x + ( h m i n h l i n e ) / d ¯ , h l i n e < h m i n
The method’s flowchart is shown in Figure 5: the green part shows the method’s innovation.

3.5. Dataset

At present, there are no effective relevant datasets, so the source data of the dataset were obtained by contacting the Wuyuan City Hydrological Bureau. A total of 600 basic hydrological images were collected. The source data covers 20 sites, including different environments such as water pollution, low light, etc., to meet our complex environmental needs. In addition, some pictures in the dataset that were similar to the actual shooting are from the Internet. Data augmentation was performed on the source data for a richer dataset and included annotating dials and numerals with 12 classes. Finally, the images were processed to a size suitable for the model. There are two sizes: 5.6 kb, and 0.6 kb. Samples from the dataset are shown in Figure 6.

4. Experiments and Results

4.1. Evaluation Metrics

Different evaluation metrics are used for the three tasks described in this paper. For the water gauge and gauge number detection task, which is essentially an object detection problem, the more commonly used metrics were chosen, including precision, recall, and mean average accuracy. For the water gauge region segmentation task, the evaluation metrics included pixel accuracy and mean cross-merge ratio. For the water level recognition task, the metrics included relative error and absolute error.
  • Precision and Recall. These two indicators consist of four base indicators, namely TP, TN, FP, and FN. ‘T’ means true, ‘F’ means false, and the second character means the predicted result: ‘P’ and ‘N’, respectively, are positive and negative. For example, TP represents a positive sample predicted as a positive sample. Precision and recall are calculated as in the equations below. Meanwhile, in order to consider the evaluation of these two metrics together, these two metrics can be used in order to draw a PR curve. The vertical coordinate is the accuracy of detection, and the horizontal coordinate is the recall; then, the area enclosed by the PR curve and the coordinate axis can be used as a new measurement. For a single target, this metric is called the average accuracy. For multiple targets, the average of the AP of each category is represented as mAP.
    P r e c i s i o n = T P T P + F P
    R e c a l l = T P T P + F N
  • Per-pixel acc. is used to indicate the accuracy of the prediction, expressed by the ratio of the count of pixels segmented correctly to all the pixels counted. For different pixel types (represented by i), T P i means the count of accurate predictions of i-type pixels, and F P i means the i-type pixels predicted as categories. It is easy to obtain the expression of the overall accuracy as follows:
    p e r p i x e l A c c = i = 0 n T P i i = 0 n ( T P i + F P i )

4.2. Experiment and Analysis

4.2.1. Water Gauge Detection Experiment

The experiment used the homemade Water Gauge Dataset to train improved FCOS and test its performance; we then selected the SSD and YOLOv3 target detection models for comparison. The results of the models are shown in Table 2. The improved model in this paper is represented as FCOS-CA.
From the results in Table 1, it can be seen that the FCOS-CA model is 16%, 15%, and 2% higher than SSD, YOLOv3, and FCOS, respectively, in terms of precision. For recall, compared with SSD, YOLOv3, and FCOS, FCOS-CA is increased by 14%, 12%, and 1%, respectively. Compared with SSD, YOLOv3, and FCOS, FCOS-CA increased by 14%, 12%, and 2%, respectively, in terms of mAP. The good results of FCOS-CA in the three indicators show that the model in this paper can be competent for the task of water gauge detection.
At the same time, we also tested seven difficult scenes in water level value recognition of water gauges: reflection, wind and waves, backlight, water transparency, night fill light, dirty, and sun shadow. The test results are shown in Figure 7, Figure 8, Figure 9 and Figure 10.

4.2.2. Water Gauge Segmentation Experiment

In this section, the self-made Water Gauge Dataset is used to train the improved DeepLabv3+ semantic segmentation model (represented as DeepLab-CA), and then its performance is tested. The FCN and Unet segmentation models are also selected as the comparison models. The test results of the models above are listed in Table 3. In the experimental results of water gauge region segmentation, the segmentation results are represented as light green regions and are superimposed on top of the original image while reducing the brightness of the original water gauge image to obtain more considerable visualization test results. The visualization segmentation results of DeepLab-CA on the actual water gauge image are shown in Figure 11.
It can be seen from the table above, in terms of processing time, although the model in this paper is slightly slower (0.02 s and 0.04 s slower than UNET and DeepLabv3+, respectively), it is improved to varying degrees in pixel ACC and mIOU. Specifically, pixel ACC was increased by 21%, 8%, and 2%, respectively, and mIOU was increased by 10%, 7%, and 3%, respectively. The good results of DeepLab-CA on the three indicators show that the model in this paper can be competent for the task of water gauge segmentation.
From the segmentation results in Figure 11, the model in this paper shows excellent performance by accurately segmenting the part above the water surface while ignoring the submerged part of the water gauge. The segmentation effect of the model meets the needs of water level value recognition and can be applied to water gauge water level line segmentation. At the same time, this article also tested seven difficult scenes in water level value recognition of water gauges: reflection, wind and waves, backlight, water body transparency, night fill light, dirty, and sun shadow. Some segmentation results are shown in Figure 12 and Figure 13.
For the tilted water gauge in the left image above, the model in this paper accurately distinguishes the two parts of the water gauge area above and under the water. In Experiment 1, the detection model of the water gauge and its body detects a number “4” on the image, which is a false detection result, and the region segmentation result of the image can be used as a mask to remove the false detection of “4”. In the vertical water gauge image on the right, although it is visually difficult to distinguish whether the submerged water gauge area around the number “4” is above or under the water, the model still accurately segments the above-water portion. It can be seen that the water gauge region segmentation model in this paper is capable of segmenting the water gauge region in the reflection scene.
In terms of the segmentation index of the water gauge region, the model in this paper achieves 92 percent pixel segmentation accuracy. From the segmentation results shown above, the model in this paper not only has a significant segmentation effect in the actual complex scenes but also achieves a significant segmentation effect for the seven special scenes in the actual scenes.

4.2.3. Water Level Measurement Experiment

To verify the effectiveness of recognition in this model, the evaluation index used in this paper is the absolute difference value from the vertical height of the water level line observed by human eyes compared to that identified by the algorithm. The height here is the number on the gauge body. The schematic diagram of the water gauge reading is shown in Figure 14. The physical distance between each letter E and the flip E is 5 cm, and the physical width of each “cross” of the letter E is 1 cm. The center of each number corresponds to the position of a “cross” center in the middle of the letter E. There are 10 “crosses” between the centers of two adjacent numbers. The reading of the water level value in the chart is 5.0 or 50.0 cm, without units, which means the distance of the mark relative to the bottom of the gauge, and with units, which means the physical distance relative to the bottom of the gauge. The actual hydrological scenario of the water level value also needs to be calculated using the elevation information of the water gauge installation location, and only the relative marking distance of the gauge is used as the water level value for discussion in this paper. The water level value in the graph is 5.0.
First of all, we selected the test set of the water gauge dataset in this experiment of water level value identification; the results are listed in Table 4, the identification results are divided into several ranges according to the absolute error, and the proportion of the sample results of each range to all samples is counted. From Table 4, it can be seen that the proportion of test samples with a difference less than 0.5 cm is 35 percent, the proportion of test samples with a difference between 0.5 cm and 1 cm is 28 percent, the proportion of test samples with errors between 1 cm and 2 cm is 27 percent, and the proportion of test samples with errors greater than 2 cm is only 10 percent. This statistical result shows that the water level identification algorithm in this paper achieves better results.
Then, six groups of locations with different degrees of background disturbance in different artificial lakes on campus were selected for testing; the test results are listed in Table 5. The manual readings were taken in seven places with human-eye observation readings, which were confirmed by water conservancy personnel to be the standard water level values. For each set of monitoring point water gauge images of the seven groups of water level value data, the minimum one and the maximum one were removed to reduce the error introduced by individual deviation, and the average was taken as the final water value of the gauge image. The experimental value is the water level value identified by the algorithm in this paper.
From the experiments at the actual monitoring points of the artificial campus lakes, it can be seen that the recognition accuracy of the model has excellent performance just with a tiny difference from the results of manual observation, and the absolute error is kept within 1 cm, which meets the requirements of the observation level standard. At the same time, this paper measured the recognition of the level of water gauges in seven special complex scenarios. The measurement results are shown in Table 6.

5. Discussion

Water gauge detection and water level segmentation have been fully tested and compared with some classic models, such as YOLOv3, as well as the basic models used for this method, FCOS, and DeepLabv3+. The method proposed in this paper achieved better performance. Most images of the dataset come from Wuyuan City, Jiangxi Province, which consists of low mountain and hilly areas and is suitable for many natural river scenes. It also shows good results in local artificial lakes and has the ability to be applied to actual scenes. For this point, we should thanks to the National Key Research and Development Program of China (2020YFB1807500) and the National Natural Science Foundation of China(62072360) for the support of funding and abundant training dataset.

6. Conclusions

To solve the problem that water conservancy personnel always meet in real hydrological scenarios—detecting water levels—this article proposes a combined method for water level recognition. This combined method is CNN-based and includes a water gauge digital detection model, a water gauge area segmentation model, and a water level line extraction algorithm. The results from the campus lake experiment on our gauge dataset prove that the method effectively solves the problem of water level recognition with cameras watching water gauges. However, the model still has shortcomings in that it cannot be applied to embedded AI devices yet, and in foggy and stormy environments, the method has slightly worse performance than that of the experiment in this paper. In the future, we will conduct more experiments, enrich datasets, and improve the model to solve the problems above and expand the scope of the application.

Author Contributions

Conceptualization, C.C.; methodology, C.C., Q.P. and R.F.; software, R.F. and X.A.; validation, X.A., C.H. and J.J.; formal analysis, L.C.; investigation, X.L.; resources, X.A. and R.F.; writing—original draft preparation, X.A.; writing—review and editing, C.C. and R.F. All authors have read and agreed to the published version of the manuscript.

Funding

This work was supported by the 2022 science and technology project (2022-33) of State Grid Jilin Electric Power Company.

Data Availability Statement

Not applicable.

Acknowledgments

The authors would like to thank the Xi’an Key Laboratory of Mobile Edge Computing and Security and the Ministry of Water Resources of China for data acquisition and computation machine support.

Conflicts of Interest

The authors declare no conflict of interest.

References

  1. Wu, W.; Emerton, R.; Duan, Q.; Wood, A.W.; Wetterhall, F.; Robertson, D.E. Ensemble flood forecasting: Current status and future opportunities. Wiley Interdiscip. Rev. Water 2020, 7, e1432. [Google Scholar] [CrossRef]
  2. Sunkpho, J.; Ootamakorn, C. Real-time flood monitoring and warning system. Songklanakarin J. Sci. Technol. 2011, 33, 227–235. [Google Scholar]
  3. Sulistyowati, R.; Sujono, H.A.; Musthofa, A.K. Design and field test equipment of river water level detection based on ultrasonic sensor and SMS gateway as flood early warning. AIP Conf. Proc. 2017, 1855, 50003. [Google Scholar]
  4. Zhao, M.; Chen, C.; Liu, L.; Lan, D.; Wan, S. Orbital collaborative learning in 6G space-air-ground integrated networks. Neurocomputing 2022, 497, 94–109. [Google Scholar] [CrossRef]
  5. Taylor, C.J. Ground-Water-Level Monitoring and the Importance of Long-Term Water-Level Data; US Geological Survey: Denver, CO, USA, 2001. [Google Scholar]
  6. Hernández-Nolasco, J.A.; Ovando, M.A.W.; Acosta, F.D.; Pancardo, P. Water level meter for alerting population about floods. In Proceedings of the 2016 IEEE 30th International Conference on Advanced Information Networking and Applications (AINA), Crans-Montana, Switzerland, 23–25 March 2016; pp. 879–884. [Google Scholar]
  7. Ministry of Water Resources of People’s Republic of China. Standard Stage Observation; Ministry of Water Resources of People’s Republic of China: Beijing, China, 2010. [Google Scholar]
  8. Chen, C.; Ma, H.; Yao, G.; Lv, N.; Yang, H.; Li, C.; Wan, S. Remote sensing image augmentation based on text description for waterside change detection. Remote Sens. 2021, 13, 1894. [Google Scholar] [CrossRef]
  9. Zhong, Z. Method of water level data capturing based on video image recognition. Foreign Electron. Meas. Technol. 2017, 1, 48–51. [Google Scholar]
  10. Dalal, N.; Triggs, B. Histograms of Oriented Gradients for Human Detection. In Proceedings of the IEEE Computer Society Conference on Computer Vision & Pattern Recognition, San Diego, CA, USA, 20–25 June 2005. [Google Scholar]
  11. Jakkula, V. Tutorial on support vector machine (svm). Sch. Eecs, Wash. State Univ. 2006, 37, 3. [Google Scholar]
  12. Mori, S.; Suen, C.Y.; Yamamoto, K. Historical Review of OCR Research and Development; IEEE Computer Society Press: Washington, DC, USA, 1995. [Google Scholar]
  13. Sabbatini, L.; Palma, L.; Belli, A.; Sini, F.; Pierleoni, P. A Computer Vision System for Staff Gauge in River Flood Monitoring. Inventions 2021, 6, 79. [Google Scholar] [CrossRef]
  14. Viola, P.; Jones, M.J. Robust Real-time Object Detection. Int. J. Comput. Vis. 2001, 57, 87. [Google Scholar]
  15. Felzenszwalb, P.F.; Girshick, R.S.; McAllester, D.; Ramanan, D. Object Detection with Discriminatively Trained Part-Based Models. IEEE Trans. Pattern Anal. Mach. Intell. 2010, 32, 1627–1645. [Google Scholar] [CrossRef] [Green Version]
  16. Lin, T.Y.; Goyal, P.; Girshick, R.; He, K.; Dollár, P. Focal Loss for Dense Object Detection. IEEE Trans. Pattern Anal. Mach. Intell. 2017, 1, 2999–3007. [Google Scholar]
  17. Bojarski, M.; Del Testa, D.; Dworakowski, D.; Firner, B.; Flepp, B.; Goyal, P.; Jackel, L.D.; Monfort, M.; Muller, U.; Zhang, J.; et al. End to end learning for self-driving cars. arXiv 2016, arXiv:1604.07316. [Google Scholar]
  18. Xu, Z.; Sun, Y.; Liu, M. iCurb: Imitation Learning-based Detection of Road Curbs using Aerial Images for Autonomous Driving. IEEE Robot. Autom. Lett. 2021, 6, 1097–1104. [Google Scholar] [CrossRef]
  19. Wu, Y.; Feng, S.; Huang, X.; Wu, Z. L4Net: An anchor-free generic object detector with attention mechanism for autonomous driving. IET Comput. Vis. 2021, 15, 36–46. [Google Scholar] [CrossRef]
  20. Schroff, F.; Kalenichenko, D.; Philbin, J. Facenet: A unified embedding for face recognition and clustering. In Proceedings of the IEEE Conference on Computer Vision and Pattern Recognition, Boston, MA, USA, 7–12 June 2015; pp. 815–823. [Google Scholar]
  21. Jung, J.; Lee, S.; Oh, H.S.; Park, Y.; Park, J.; Son, S. Unified Negative Pair Generation toward Well-discriminative Feature Space for Face Recognition. arXiv 2022, arXiv:2203.11593. [Google Scholar]
  22. Ying, L. Design of attendance system based on face recognition. Electron. Test 2020, 1, 117–121. [Google Scholar]
  23. Camps-Valls, G.; Tuia, D.; Zhu, X.X.; Reichstein, M. Deep Learning for the Earth Sciences: A Comprehensive Approach to Remote Sensing, Climate Science and Geosciences; John Wiley & Sons: Hoboken, NJ, USA, 2021. [Google Scholar]
  24. Albawi, S.; Mohammed, T.A.; Al-Zawi, S. Understanding of a convolutional neural network. In Proceedings of the 2017 International Conference on Engineering and Technology (ICET), Antalya, Turkey, 21–23 August 2017; pp. 1–6. [Google Scholar]
  25. Yu, Y.; Samali, B.; Rashidi, M.; Mohammadi, M.; Nguyen, T.N.; Zhang, G. Vision-based concrete crack detection using a hybrid framework considering noise effect. J. Build. Eng. 2022, 61, 105246. [Google Scholar] [CrossRef]
  26. Krizhevsky, A.; Sutskever, I.; Hinton, G. ImageNet Classification with Deep Convolutional Neural Networks. In Advances in Neural Information Processing Systems 25; Curran Associates Inc.: Red Hook, NY, USA, 2012. [Google Scholar]
  27. Krizhevsky, A.; Sutskever, I.; Hinton, G.E. Imagenet classification with deep convolutional neural networks. Commun. ACM 2017, 60, 84–90. [Google Scholar] [CrossRef] [Green Version]
  28. Chauhan, R.; Ghanshala, K.K.; Joshi, R. Convolutional neural network (CNN) for image detection and recognition. In Proceedings of the 2018 First International Conference on Secure Cyber Computing and Communication (ICSCCC), Jalandhar, India, 15–17 December 2018; pp. 278–282. [Google Scholar]
  29. Redmon, J.; Divvala, S.; Girshick, R.; Farhadi, A. You Only Look Once: Unified, Real-Time Object Detection. In Proceedings of the IEEE Conference on Computer Vision and Pattern Recognition (CVPR), Las Vegas, NV, USA, 27–30 June 2016; pp. 779–788. [Google Scholar]
  30. Girshick, R.; Donahue, J.; Darrell, T.; Malik, J. Rich Feature Hierarchies for Accurate Object Detection and Semantic Segmentation. arXiv 2013, arXiv:1311.2524. [Google Scholar]
  31. Liu, W.; Anguelov, D.; Erhan, D.; Szegedy, C.; Reed, S.; Fu, C.Y.; Berg, A.C. SSD: Single Shot MultiBox Detector; Springer: Cham, Switzerland, 2016. [Google Scholar]
  32. Xu, Z.; Feng, J.; Zhang, Z.; Duan, C. Water level estimation based on image of staff gauge in smart city. In Proceedings of the 2018 IEEE SmartWorld, Ubiquitous Intelligence & Computing, Advanced & Trusted Computing, Scalable Computing & Communications, Cloud & Big Data Computing, Internet of People and Smart City Innovation (SmartWorld/SCALCOM/UIC/ATC/CBDCom/IOP/SCI), Guangzhou, China, 8–12 October 2018; pp. 1341–1345. [Google Scholar]
  33. Dou, G.; Chen, R.; Han, C.; Liu, Z.; Liu, J. Research on water-level recognition method based on image processing and convolutional neural networks. Water 2022, 14, 1890. [Google Scholar] [CrossRef]
  34. Long, J.; Shelhamer, E.; Darrell, T. Fully Convolutional Networks for Semantic Segmentation. IEEE Trans. Pattern Anal. Mach. Intell. 2015, 39, 640–651. [Google Scholar]
  35. Liu, Y.; Xie, Z.; Liu, H. LB-LSD: A length-based line segment detector for real-time applications. Pattern Recognit. Lett. 2019, 128. [Google Scholar] [CrossRef]
  36. Tian, Z.; Shen, C.; Chen, H.; He, T. FCOS: Fully Convolutional One-Stage Object Detection. In Proceedings of the 2019 IEEE/CVF International Conference on Computer Vision (ICCV), Seoul, Republic of Korea, 27 October–2 November 2019. [Google Scholar]
  37. Chen, L.C.; Zhu, Y.; Papandreou, G.; Schroff, F.; Adam, H. Encoder-Decoder with Atrous Separable Convolution for Semantic Image Segmentation; Springer: Cham, Switzerland, 2018. [Google Scholar]
  38. Karamouz, M.; Zahmatkesh, Z.; Saad, T. Cloud Computing in Urban Flood Disaster Management. In Proceedings of the World Environmental & Water Resources Congress, Cincinnati, OH, USA, 19–23 May 2013; pp. 2747–2757. [Google Scholar]
  39. Fan, Y.; He, H.; Bo, L.; Ming, L. Research on Flood Disaster Extent Dynamics Monitoring Using HJ-1 CCD—A Case Study in Fuyuan of Heilongjiang Province, Northestern China. Remote Sens. Technol. Appl. 2016, 31, 102–108. [Google Scholar]
  40. Shafiai, S. Flood Disaster Management in Malaysia: A Review of Issues of Flood Disaster Relief during and Post-Disaster. In Proceedings of the ISSC 2016 International Conference on Soft Science, Kedah, Malaysia, 11–13 April 2016. [Google Scholar]
  41. Abe, K. Frequency response of pressure type water level meter. Bull. Nippon. Dent. Univ. Gen. Educ. 2001, 30, 49–56. [Google Scholar]
  42. Tang, X.; Liu, Y.; Shang, X. The Research On Low Power and High Accuracy Ultrasonic Water Level Meter. Hydropower Autom. Dam Monit. 2014, 1, 1. [Google Scholar]
  43. Zhen, Z.; Yang, Z.; Yuchou, L.; Youjie, Y.; Xurui, L. IP camera-based LSPIV system for on-line monitoring of river flow. In Proceedings of the 2017 13th IEEE International Conference on Electronic Measurement & Instruments (ICEMI), Yangzhou, China, 20–22 October 2017; pp. 357–363. [Google Scholar]
  44. Lin, Y.T.; Lin, Y.C.; Han, J.Y. Automatic water-level detection using single-camera images with varied poses. Measurement 2018, 127, 167–174. [Google Scholar] [CrossRef]
  45. Huang, Z.; Xiong, H.; Zhu, M.; Cai, H. Embedded Measurement System and Interpretation Algorithm for Water Gauge Image. Opto-Electron. Eng. 2013, 40, 1–7. [Google Scholar]
  46. Lin, R.F.; Hai, X.U. Automatic measurement method for canals water level based on imaging sensor. Transducer Microsyst. Technol. 2013, 32, 53–55. [Google Scholar]
  47. Bruinink, M.; Chandarr, A.; Rudinac, M.; Overloop, P.; Jonker, P. Portable, automatic water level estimation using mobile phone cameras. In Proceedings of the 2015 14th IAPR International Conference on Machine Vision Applications (MVA), Tokyo, Japan, 18–22 May 2015. [Google Scholar]
  48. Leduc, P.; Ashmore, P.; Sjogren, D. Technical note: Stage and water width measurement of a mountain stream using a simple time-lapse camera. Hydrol. Earth Syst. Sci. Discuss. 2018, 22, 1–11. [Google Scholar] [CrossRef] [Green Version]
  49. Liu, Q.; Chu, B.; Peng, J.; Tang, S. A Visual Measurement of Water Content of Crude Oil Based on Image Grayscale Accumulated Value Difference. Sensors 2019, 19, 2963. [Google Scholar] [CrossRef] [Green Version]
  50. Gilmore, T.E.; Birgand, F.; Chapman, K.W. Source and magnitude of error in an inexpensive image-based water level measurement system. J. Hydrol. 2013, 496, 178–186. [Google Scholar] [CrossRef] [Green Version]
  51. Young, D.S.; Hart, J.K.; Martinez, K. Image analysis techniques to estimate river discharge using time-lapse cameras in remote locations. Comput. Geosci. 2015, 76, 1–10. [Google Scholar] [CrossRef] [Green Version]
  52. Zhang, Z.; Zhou, Y.; Wang, H.; Gao, H.; Liu, H. Image-based water level measurement with standard bicolor staff gauge. Yi Qi Yi Biao Xue Bao/Chin. J. Sci. Instrum. 2018, 39, 236–245. [Google Scholar]
  53. Jiang, X.Y.; Hua, Z.J. Water-Level auto reading based on image processing. Electron. Des. Eng. 2011, 19, 23–25. [Google Scholar]
  54. Law, H.; Deng, J. Cornernet: Detecting objects as paired keypoints. In Proceedings of the European conference on computer vision (ECCV), Munich, Germany, 8–14 September 2018; pp. 734–750. [Google Scholar]
  55. Lv, N.; Han, Z.; Chen, C.; Feng, Y.; Su, T.; Goudos, S.; Wan, S. Encoding Spectral-Spatial Features for Hyperspectral Image Classification in the Satellite Internet of Things System. Remote Sens. 2021, 13, 3561. [Google Scholar] [CrossRef]
  56. Ronneberger, O.; Fischer, P.; Brox, T. U-Net: Convolutional Networks for Biomedical Image Segmentation. In Medical Image Computing and Computer-Assisted Intervention—MICCAI 2015; Springer International Publishing: Cham, Switzerland, 2015. [Google Scholar]
  57. Lv, N.; Ma, H.; Chen, C.; Pei, Q.; Zhou, Y.; Xiao, F.; Li, J. Remote sensing data augmentation through adversarial training. IEEE J. Sel. Top. Appl. Earth Obs. Remote. Sens. 2021, 14, 9318–9333. [Google Scholar] [CrossRef]
  58. Yu, F.; Koltun, V. Multi-scale context aggregation by dilated convolutions. arXiv 2015, arXiv:1511.07122. [Google Scholar]
  59. Chen, L.C.; Papandreou, G.; Kokkinos, I.; Murphy, K.; Yuille, A.L. DeepLab: Semantic Image Segmentation with Deep Convolutional Nets, Atrous Convolution, and Fully Connected CRFs. IEEE Trans. Pattern Anal. Mach. Intell. 2018, 40, 834–848. [Google Scholar] [CrossRef] [Green Version]
  60. Hu, J.; Chen, C.; Cai, L.; Khosravi, M.R.; Pei, Q.; Wan, S. UAV-assisted vehicular edge computing for the 6G internet of vehicles: Architecture, intelligence, and challenges. IEEE Commun. Stand. Mag. 2021, 5, 12–18. [Google Scholar] [CrossRef]
  61. Chen, C.; Zeng, Y.; Li, H.; Liu, Y.; Wan, S. A Multi-hop Task Offloading Decision Model in MEC-enabled Internet of Vehicles. IEEE Internet Things J. 2022. [Google Scholar] [CrossRef]
  62. Ma, X.; Li, X.; Tang, X.; Zhang, B.; Yao, R.; Lu, J. Deconvolution Feature Fusion for traffic signs detection in 5G driven unmanned vehicle. Phys. Commun. 2021, 47, 101375. [Google Scholar] [CrossRef]
  63. Isola, P.; Zhu, J.Y.; Zhou, T.; Efros, A.A. Image-to-Image Translation with Conditional Adversarial Networks. In Proceedings of the IEEE Conference on Computer Vision & Pattern Recognition, Las Vegas, NV, USA, 27–30 June 2016. [Google Scholar]
  64. Park, T.; Liu, M.Y.; Wang, T.C.; Zhu, J.Y. Semantic Image Synthesis With Spatially-Adaptive Normalization. In Proceedings of the 2019 IEEE/CVF Conference on Computer Vision and Pattern Recognition (CVPR), Long Beach, CA, USA, 15–20 June 2019. [Google Scholar]
  65. Yu, J.; Lin, Z.; Yang, J.; Shen, X.; Lu, X.; Huang, T.S. Generative Image Inpainting with Contextual Attention. In Proceedings of the 2018 IEEE/CVF Conference on Computer Vision and Pattern Recognition, Salt Lake City, UT, USA, 18–23 June 2018. [Google Scholar]
  66. Badrinarayanan, V.; Kendall, A.; Cipolla, R. SegNet: A Deep Convolutional Encoder-Decoder Architecture for Image Segmentation. IEEE Trans. Pattern Anal. Mach. Intell. 2017, 39, 2481–2495. [Google Scholar] [CrossRef]
  67. Zhao, H.; Shi, J.; Qi, X.; Wang, X.; Jia, J. Pyramid Scene Parsing Network. arXiv 2016, arXiv:1612.01105. [Google Scholar]
  68. Lin, G.; Milan, A.; Shen, C.; Reid, I. RefineNet: Multi-path Refinement Networks for High-Resolution Semantic Segmentation. In Proceedings of the 2017 IEEE Conference on Computer Vision and Pattern Recognition (CVPR), Honolulu, HI, USA, 21–26 July 2017. [Google Scholar]
  69. Lin, T.Y.; Dollar, P.; Girshick, R.; He, K.; Hariharan, B.; Belongie, S. Feature Pyramid Networks for Object Detection. In Proceedings of the 2017 IEEE Conference on Computer Vision and Pattern Recognition (CVPR), Honolulu, HI, USA, 21–26 July 2017. [Google Scholar]
  70. Chen, L.C.; Papandreou, G.; Kokkinos, I.; Murphy, K.; Yuille, A.L. Semantic image segmentation with deep convolutional nets and fully connected crfs. arXiv 2014, arXiv:1412.7062. [Google Scholar]
  71. Chen, L.C.; Papandreou, G.; Schroff, F.; Adam, H. Rethinking atrous convolution for semantic image segmentation. arXiv 2017, arXiv:1706.05587. [Google Scholar]
  72. Chen, C.; Jiang, J.; Zhou, Y.; Lv, N.; Liang, X.; Wan, S. An edge intelligence empowered flooding process prediction using Internet of things in smart city. J. Parallel Distrib. Comput. 2022, 165, 66–78. [Google Scholar] [CrossRef]
  73. He, K.; Zhang, X.; Ren, S.; Sun, J. Deep Residual Learning for Image Recognition. In Proceedings of the 2016 IEEE Conference on Computer Vision and Pattern Recognition (CVPR), Las Vegas, NV, USA, 27–30 June 2016. [Google Scholar]
Figure 1. Structure of improved FCOS model.
Remotesensing 14 06023 g001
Figure 2. Contextual adjustment module.
Remotesensing 14 06023 g002
Figure 3. Structure of improved DeepLab model.
Remotesensing 14 06023 g003
Figure 4. Water level line detection schematic.
Remotesensing 14 06023 g004
Figure 5. Flowcharts of the methods.
Remotesensing 14 06023 g005
Figure 6. Samples of the gauge dataset.
Remotesensing 14 06023 g006
Figure 7. Inverted water gauge image detection results.
Remotesensing 14 06023 g007
Figure 8. Wind and wave and backlight water gauge image detection results.
Remotesensing 14 06023 g008
Figure 9. Nighttime fill light water gauge image detection results.
Remotesensing 14 06023 g009
Figure 10. Dirty water gauge image inspection results.
Remotesensing 14 06023 g010
Figure 11. Water gauge image segmentation results.
Remotesensing 14 06023 g011
Figure 12. Reflection water gauge image segmentation results.
Remotesensing 14 06023 g012
Figure 13. Wind–wave and backlight segmentation results.
Remotesensing 14 06023 g013
Figure 14. Water level on water gauge reading diagram.
Remotesensing 14 06023 g014
Table 1. Characteristics of different water level detection methods.
Water Level TypeAdvantageDisadvantage
Float-typeHigh measurement accuracy and large measurement rangeInstallation difficulty and bad flood performance
Pressure-typeEasy installationCan only be used in calm water bodies
Ultrasonic-typeEasy installation, good performance in complex environmentsAccuracy is impacted by environment
Radar-typeGood performance in complex environmentsHigh cost
Laser-typeHigh accuracy and stabilityHigh cost and installation difficulty
Table 2. Detection score for different methods.
ModelPrecision (%)Recall (%)mAP (%)
SSD77%72%75%
YOLOv378%74%77%
FCOS91%85%87%
FCOS-CA93%86%89%
Table 3. Segmentation score for different methods.
ModelPixel Acc (%)mIOU (%)Inference Time (s)
FCN72%75%0.23
Unet++85%78%0.15
DeepLabv3+91%82%0.13
DeepLab-CA93%85%0.17
Table 4. Statistical results of water level value recognition of water gauge test dataset.
Error RangeX < 0.50.5 < X < 11 < X < 2X > 2
Sample proportion35%28%27%10%
Table 5. Water level measurement results of actual monitoring points.
Error RangeABCDEFH
Manual recognition (cm)11.8030.5035.0036.9065.3078.8058.90
Algorithm recognition (cm)11.2131.7734.5338.5365.8778.5858.38
Error (cm)0.611.270.471.630.570.220.52
Table 6. Water level recognition results in 7 special scenarios.
Error RangeManual (cm)Algorithm (cm)Error (cm)
Reversed reflection34.5034.460.04
Backlighting47.0046.730.27
Nighttime fill light32.5032.070.43
Wind and waves30.5029.800.70
Soiling27.0026.001.00
Water transparency77.0075.901.11
Sun shadow5.004.700.30
Publisher’s Note: MDPI stays neutral with regard to jurisdictional claims in published maps and institutional affiliations.

