
Fusion of Remote Sensing, Magnetometric, and Geological Data to Identify Polymetallic Mineral Potential Zones in Chakchak Region, Yazd, Iran


 ,
,  ,
,  ,
,  and
and
Abstract
1. Introduction
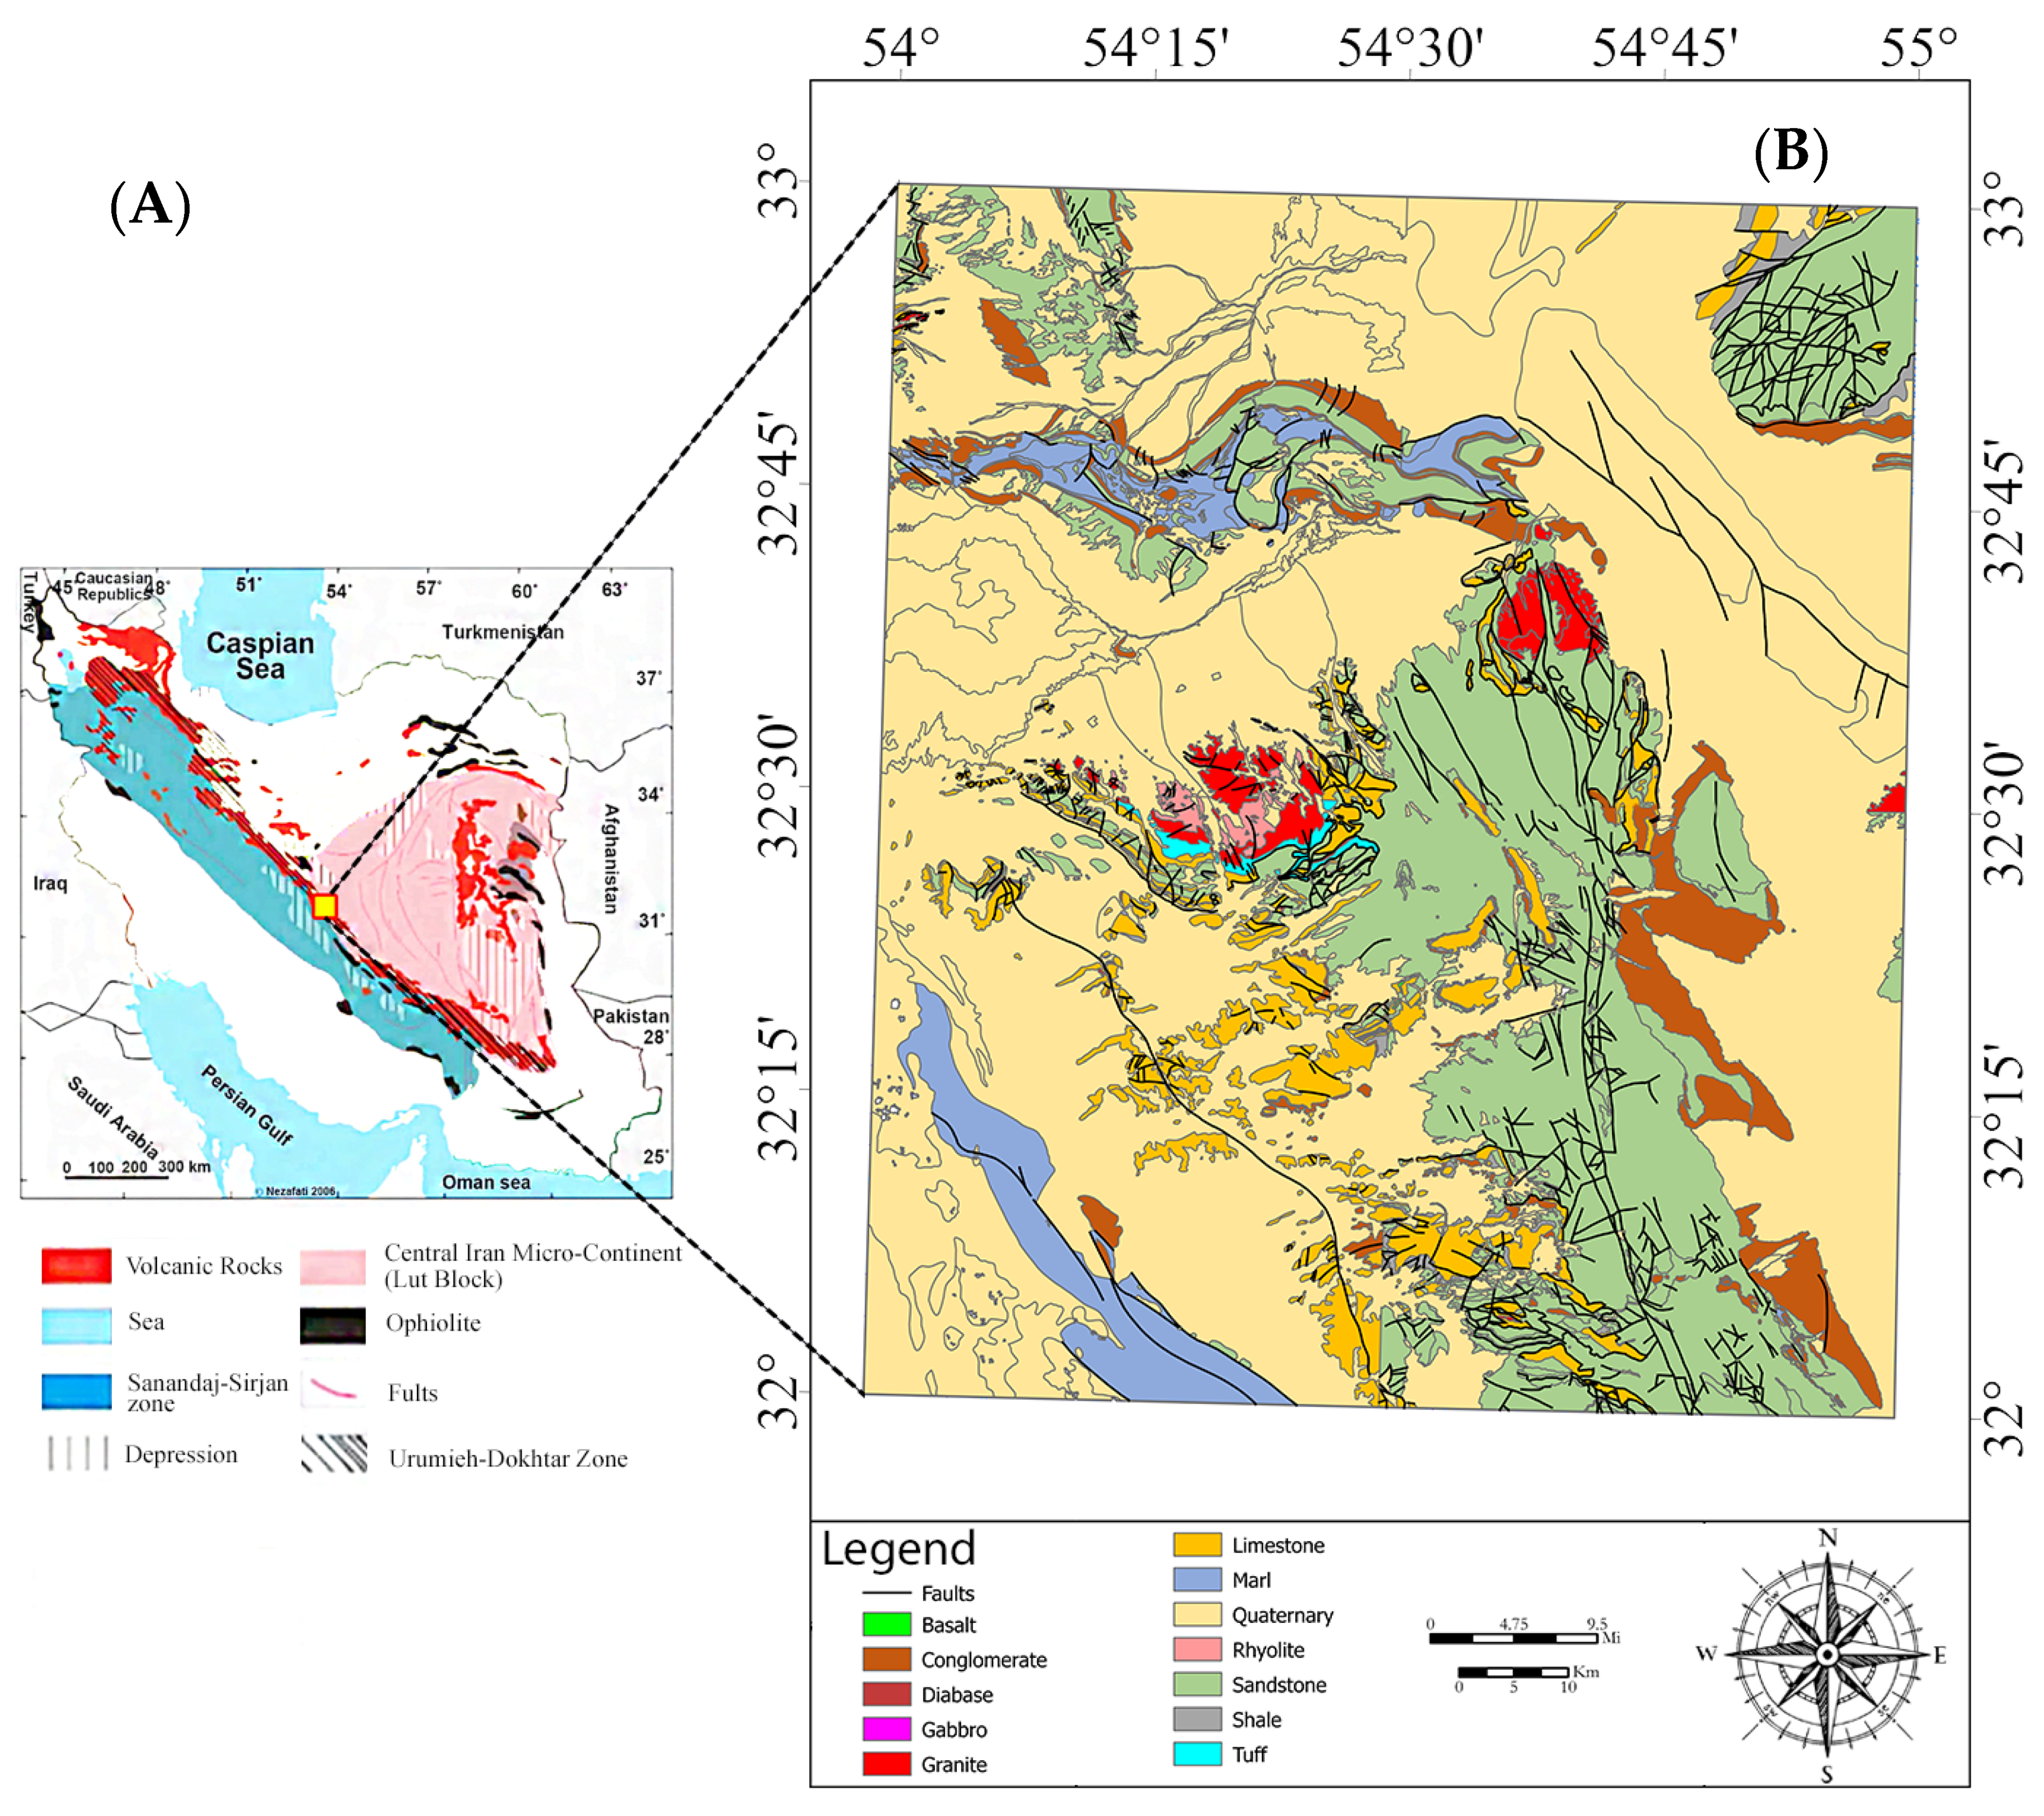
2. Geological Setting of the Study Area
3. Materials and Methods
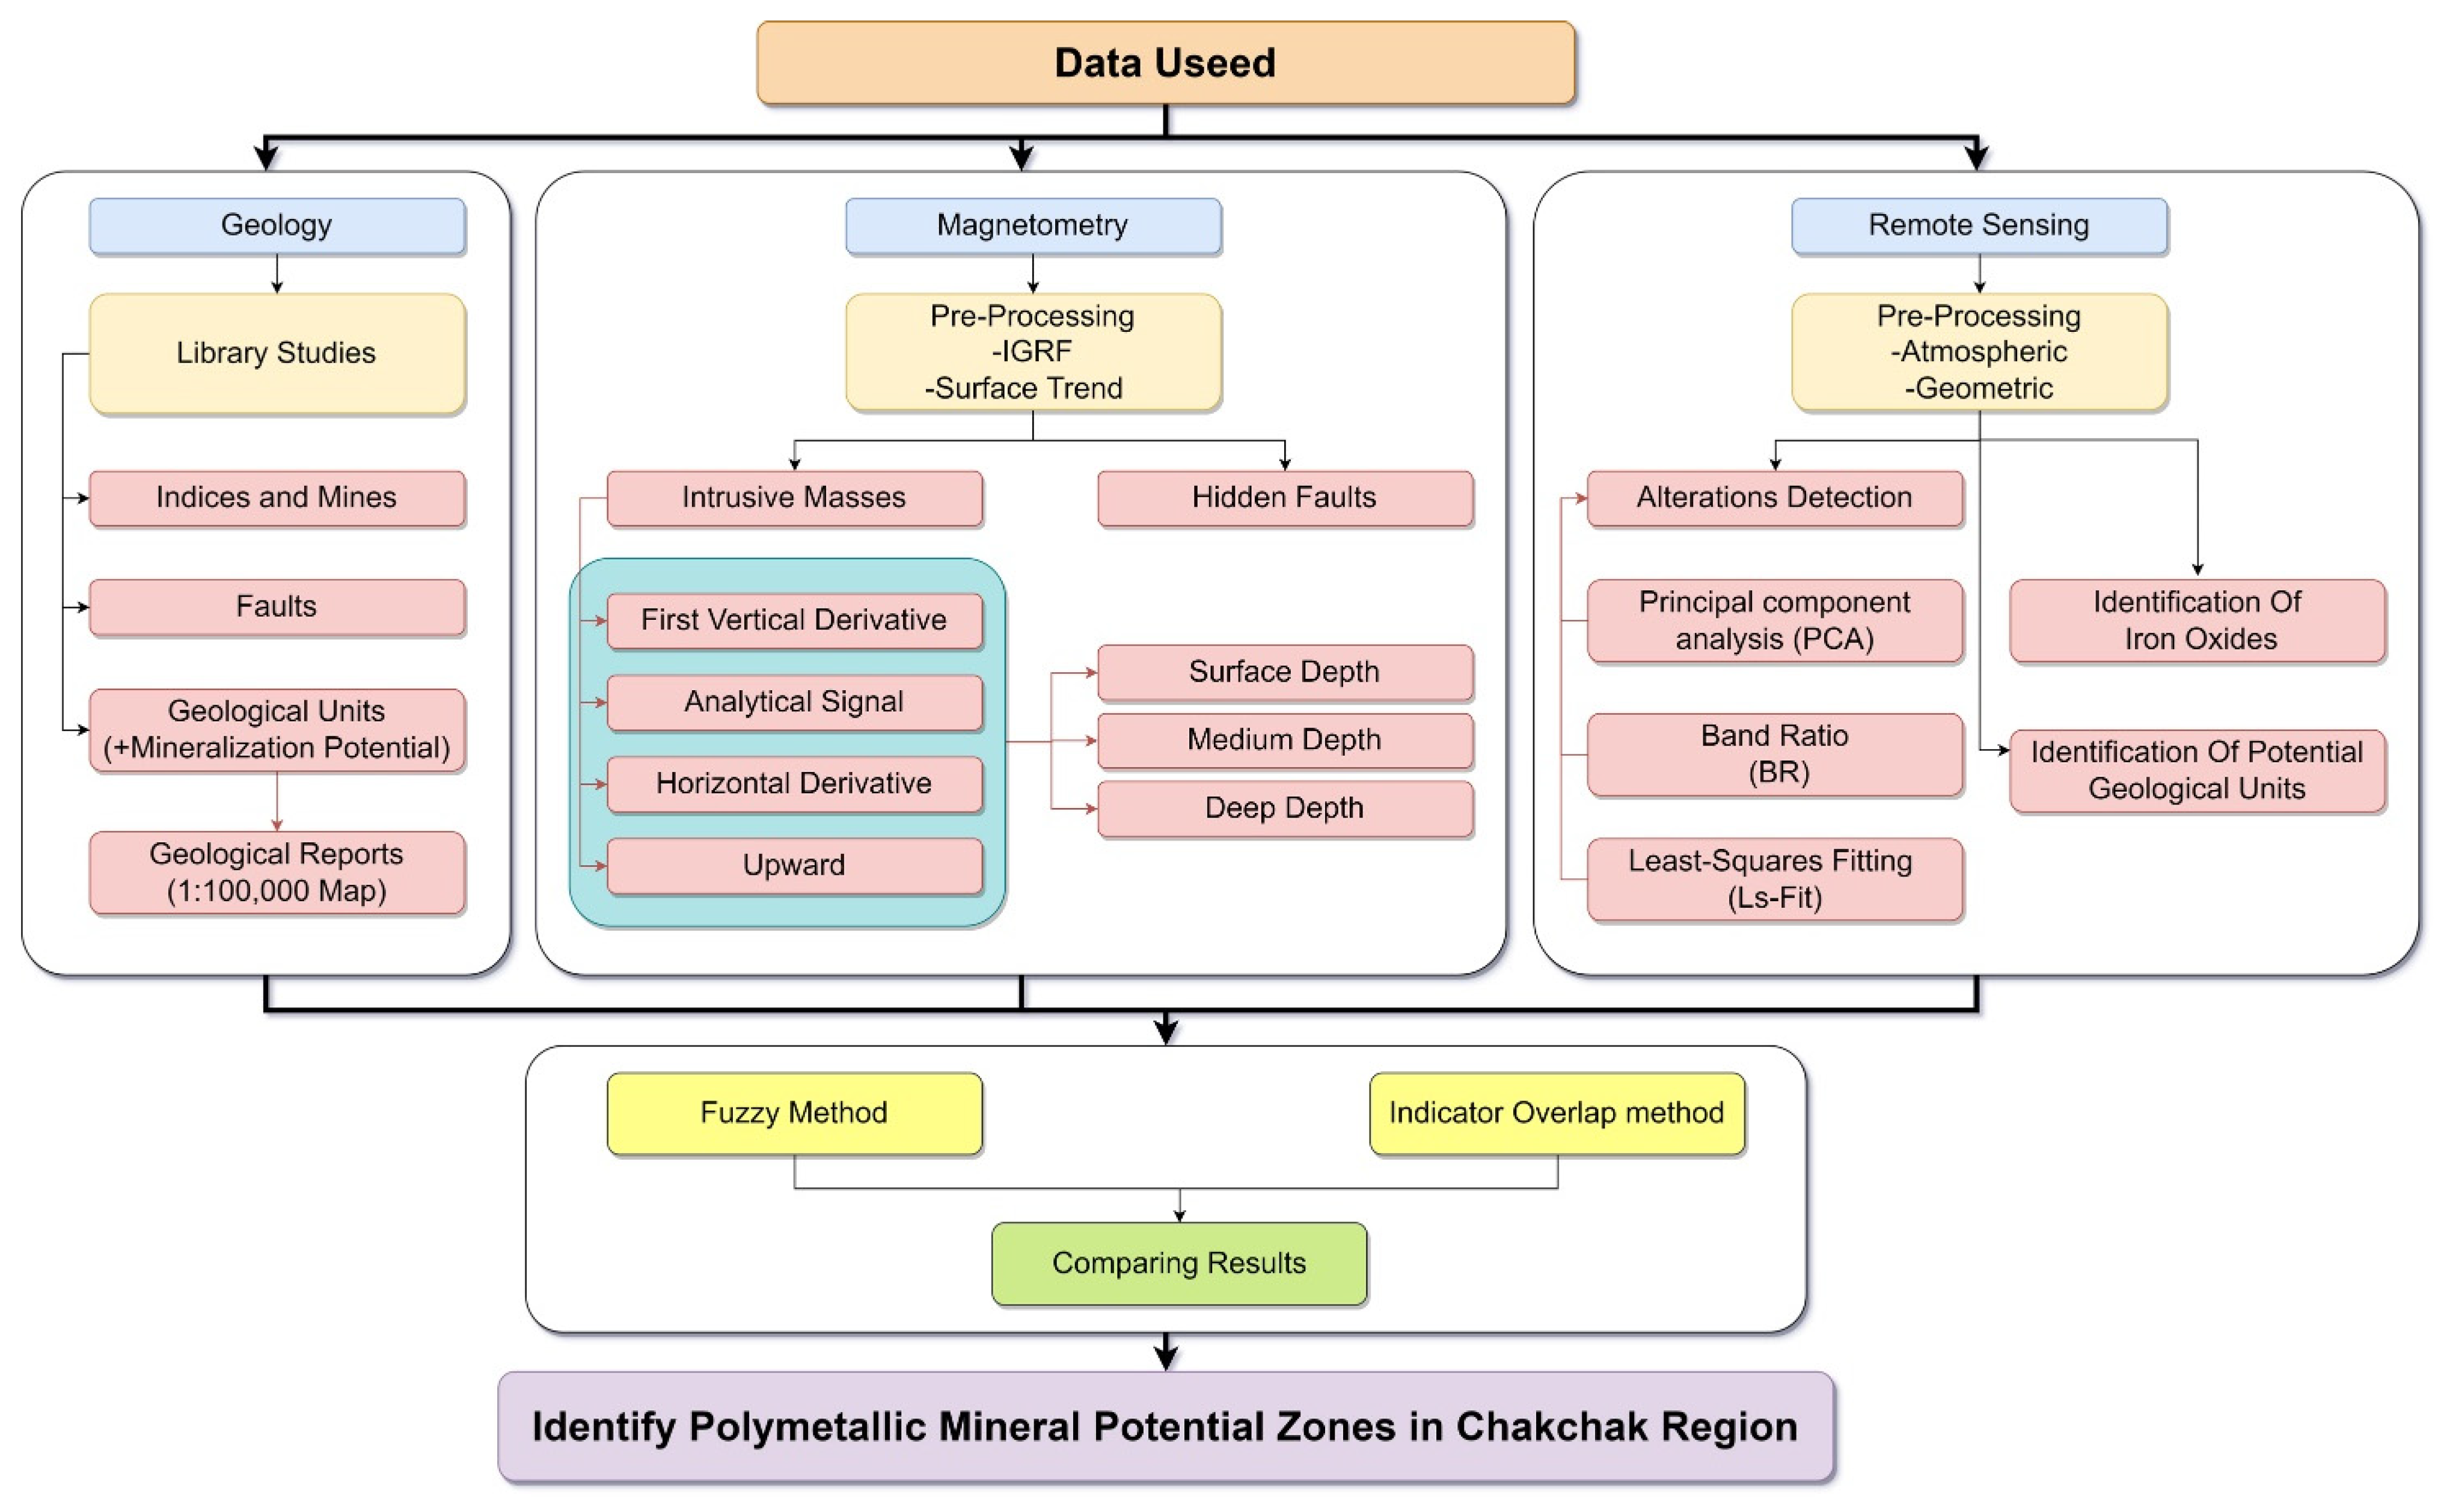
3.1. Data Used
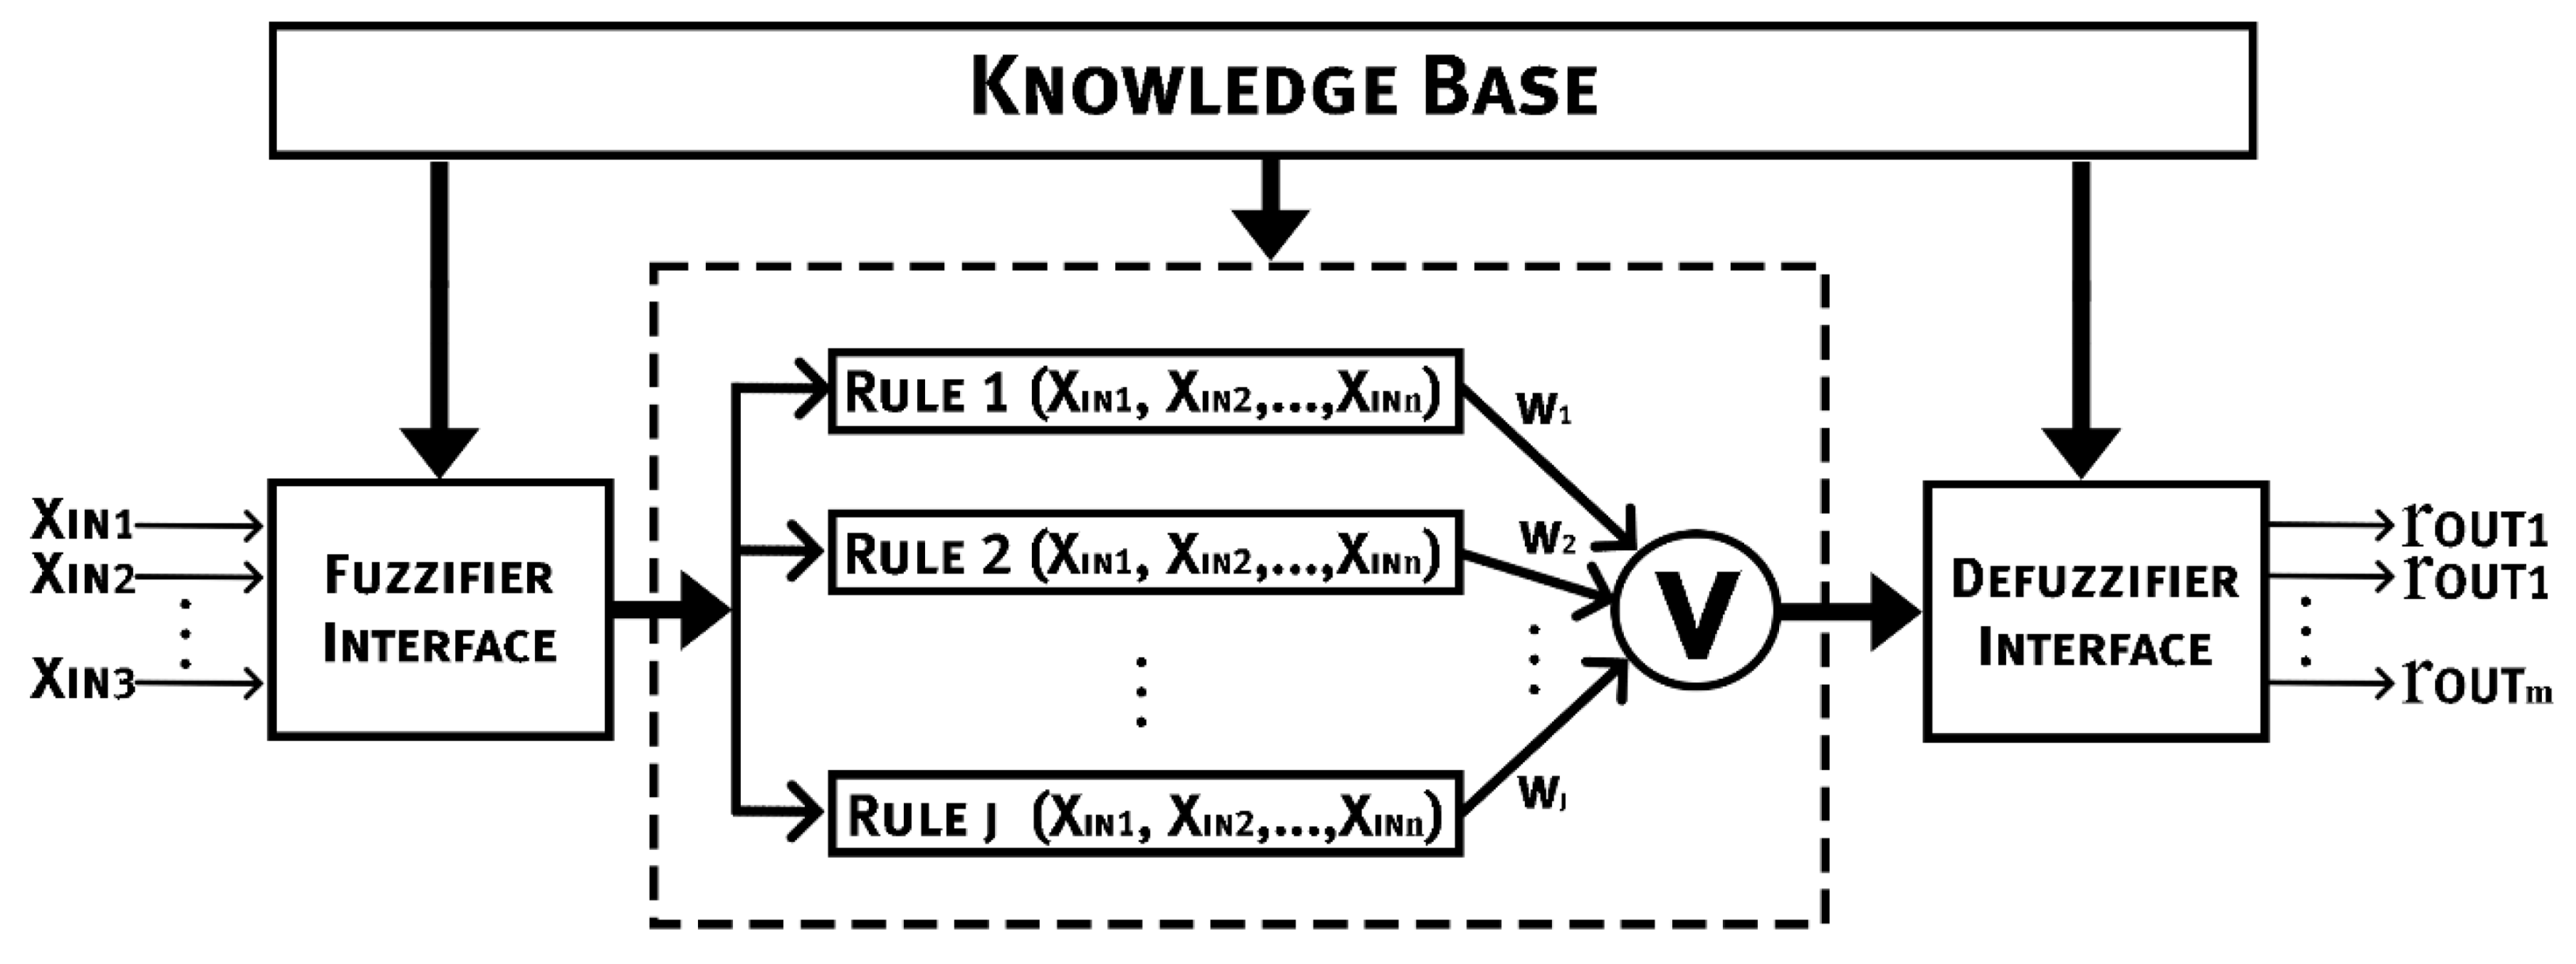
3.2. Methodology
3.2.1. Preprocessing
3.2.2. Processing Techniques
3.2.3. Fusion of the Datasets
4. Results
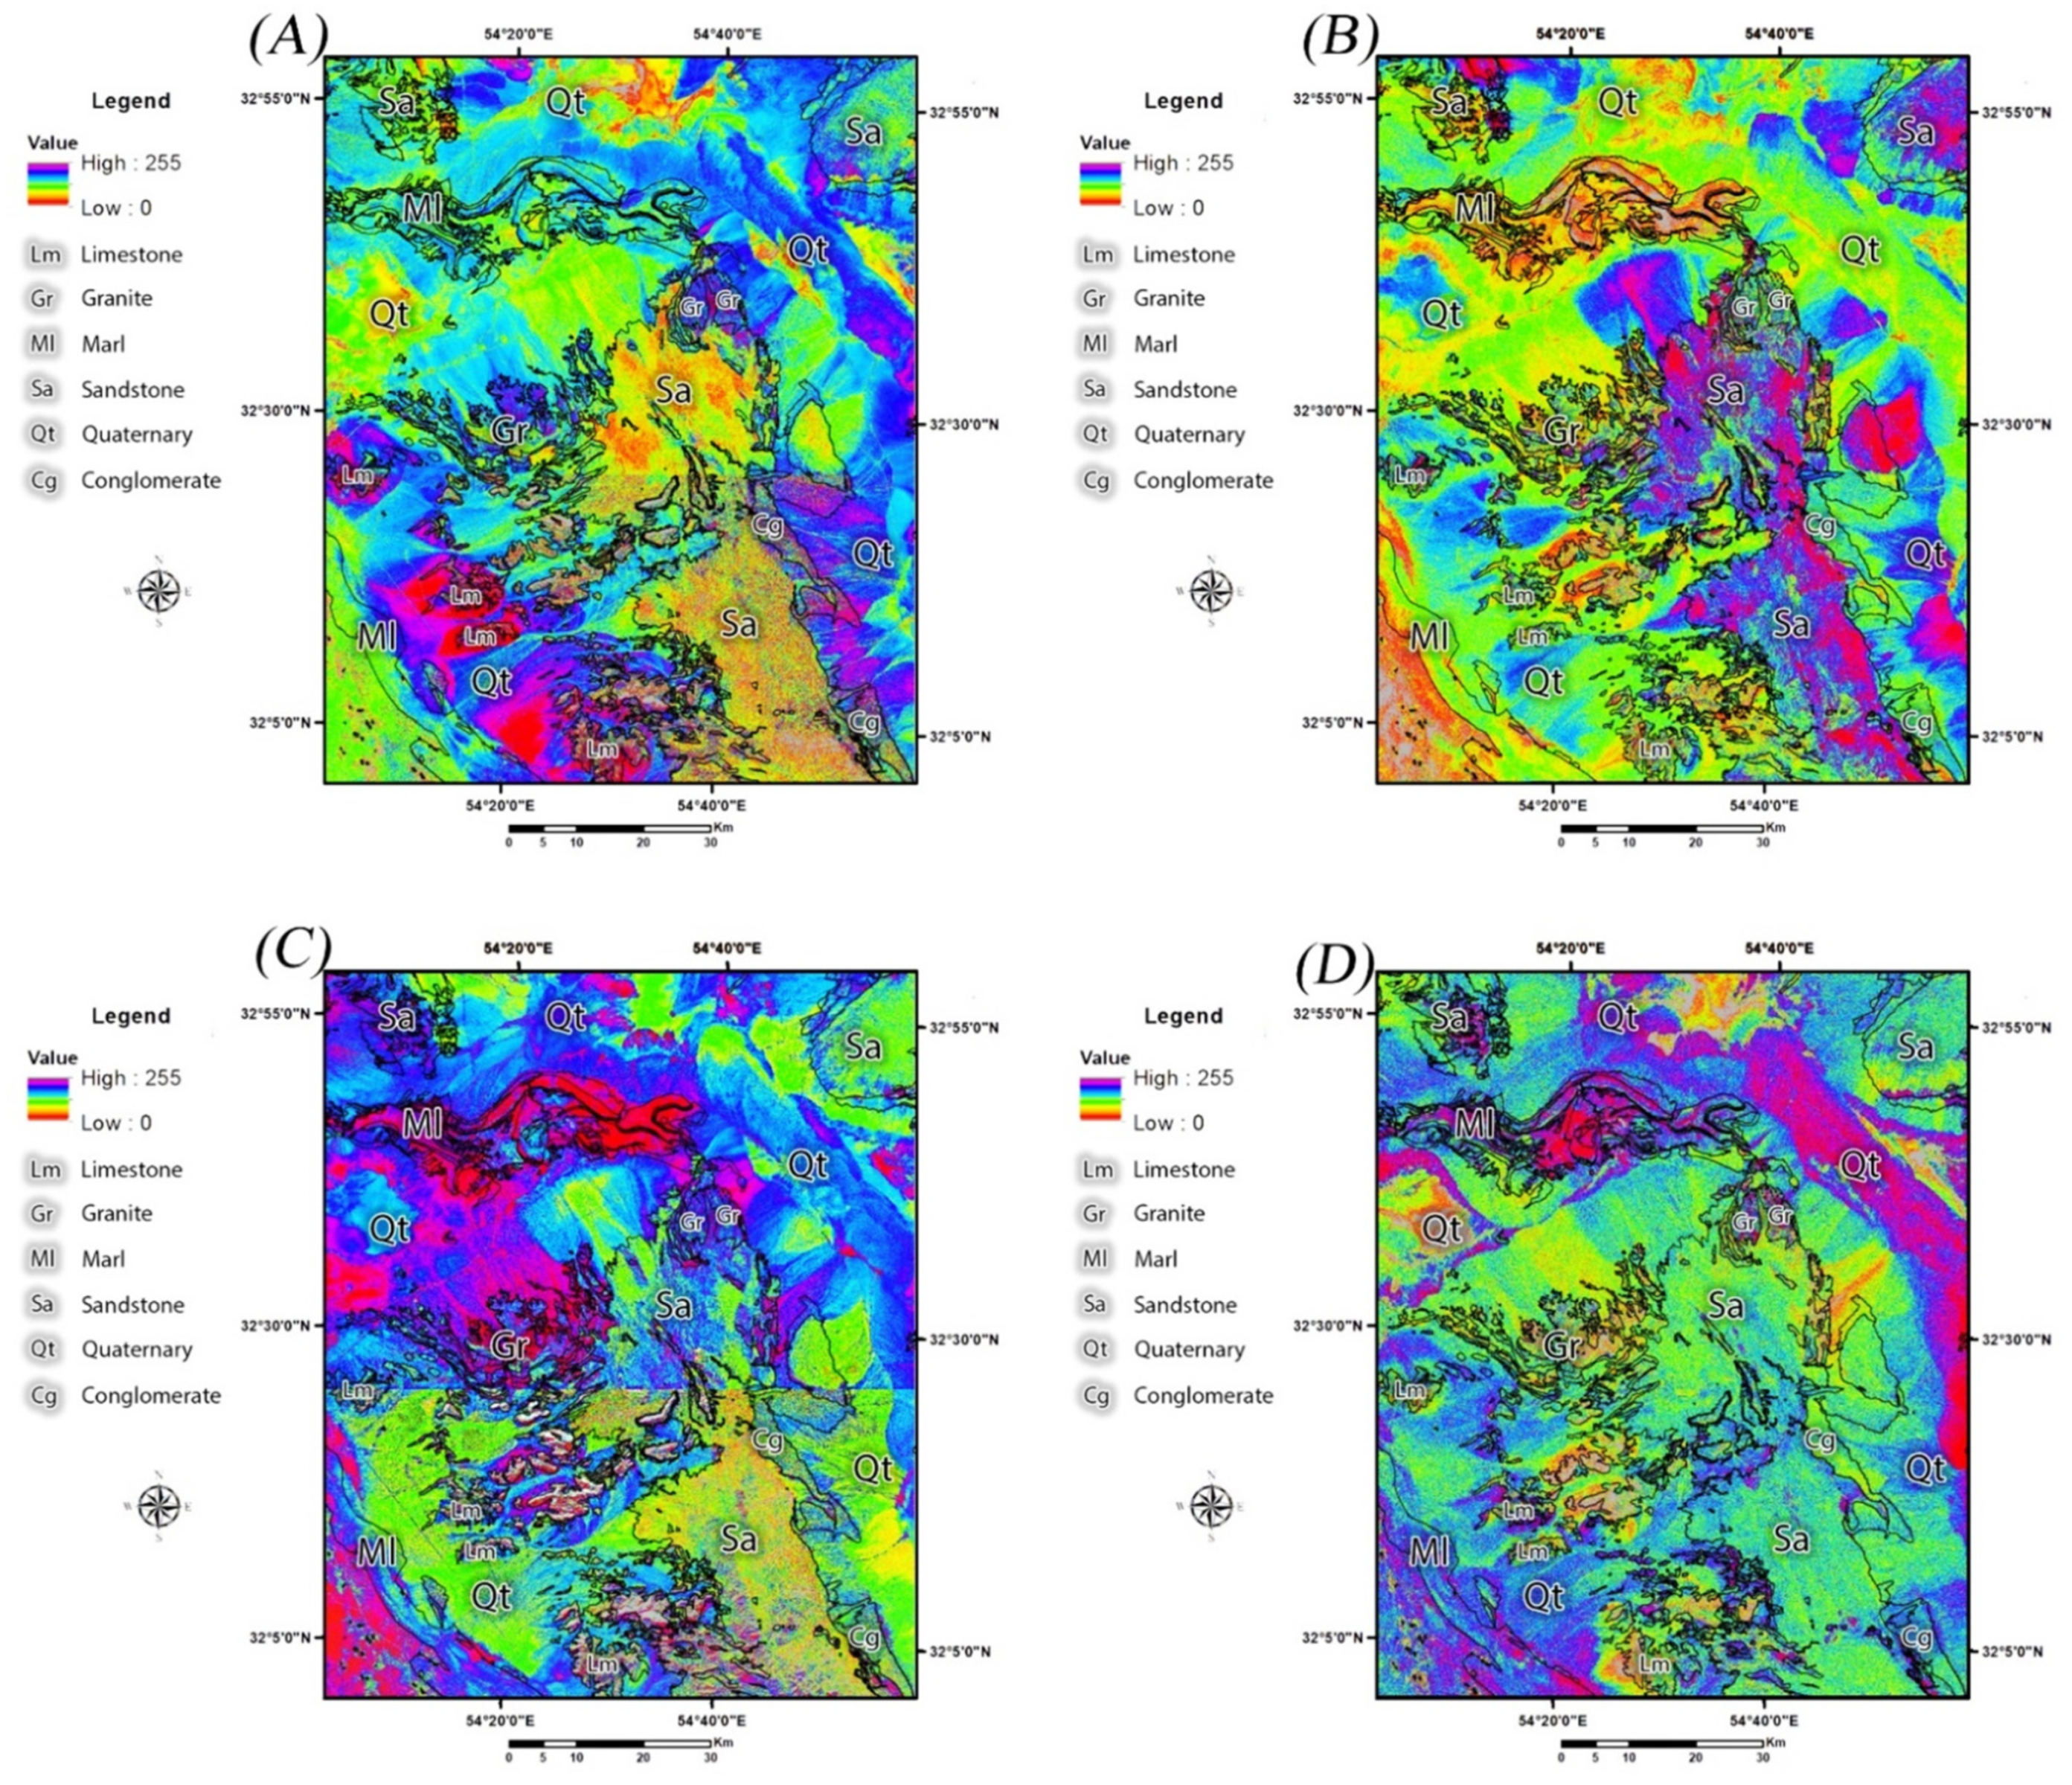
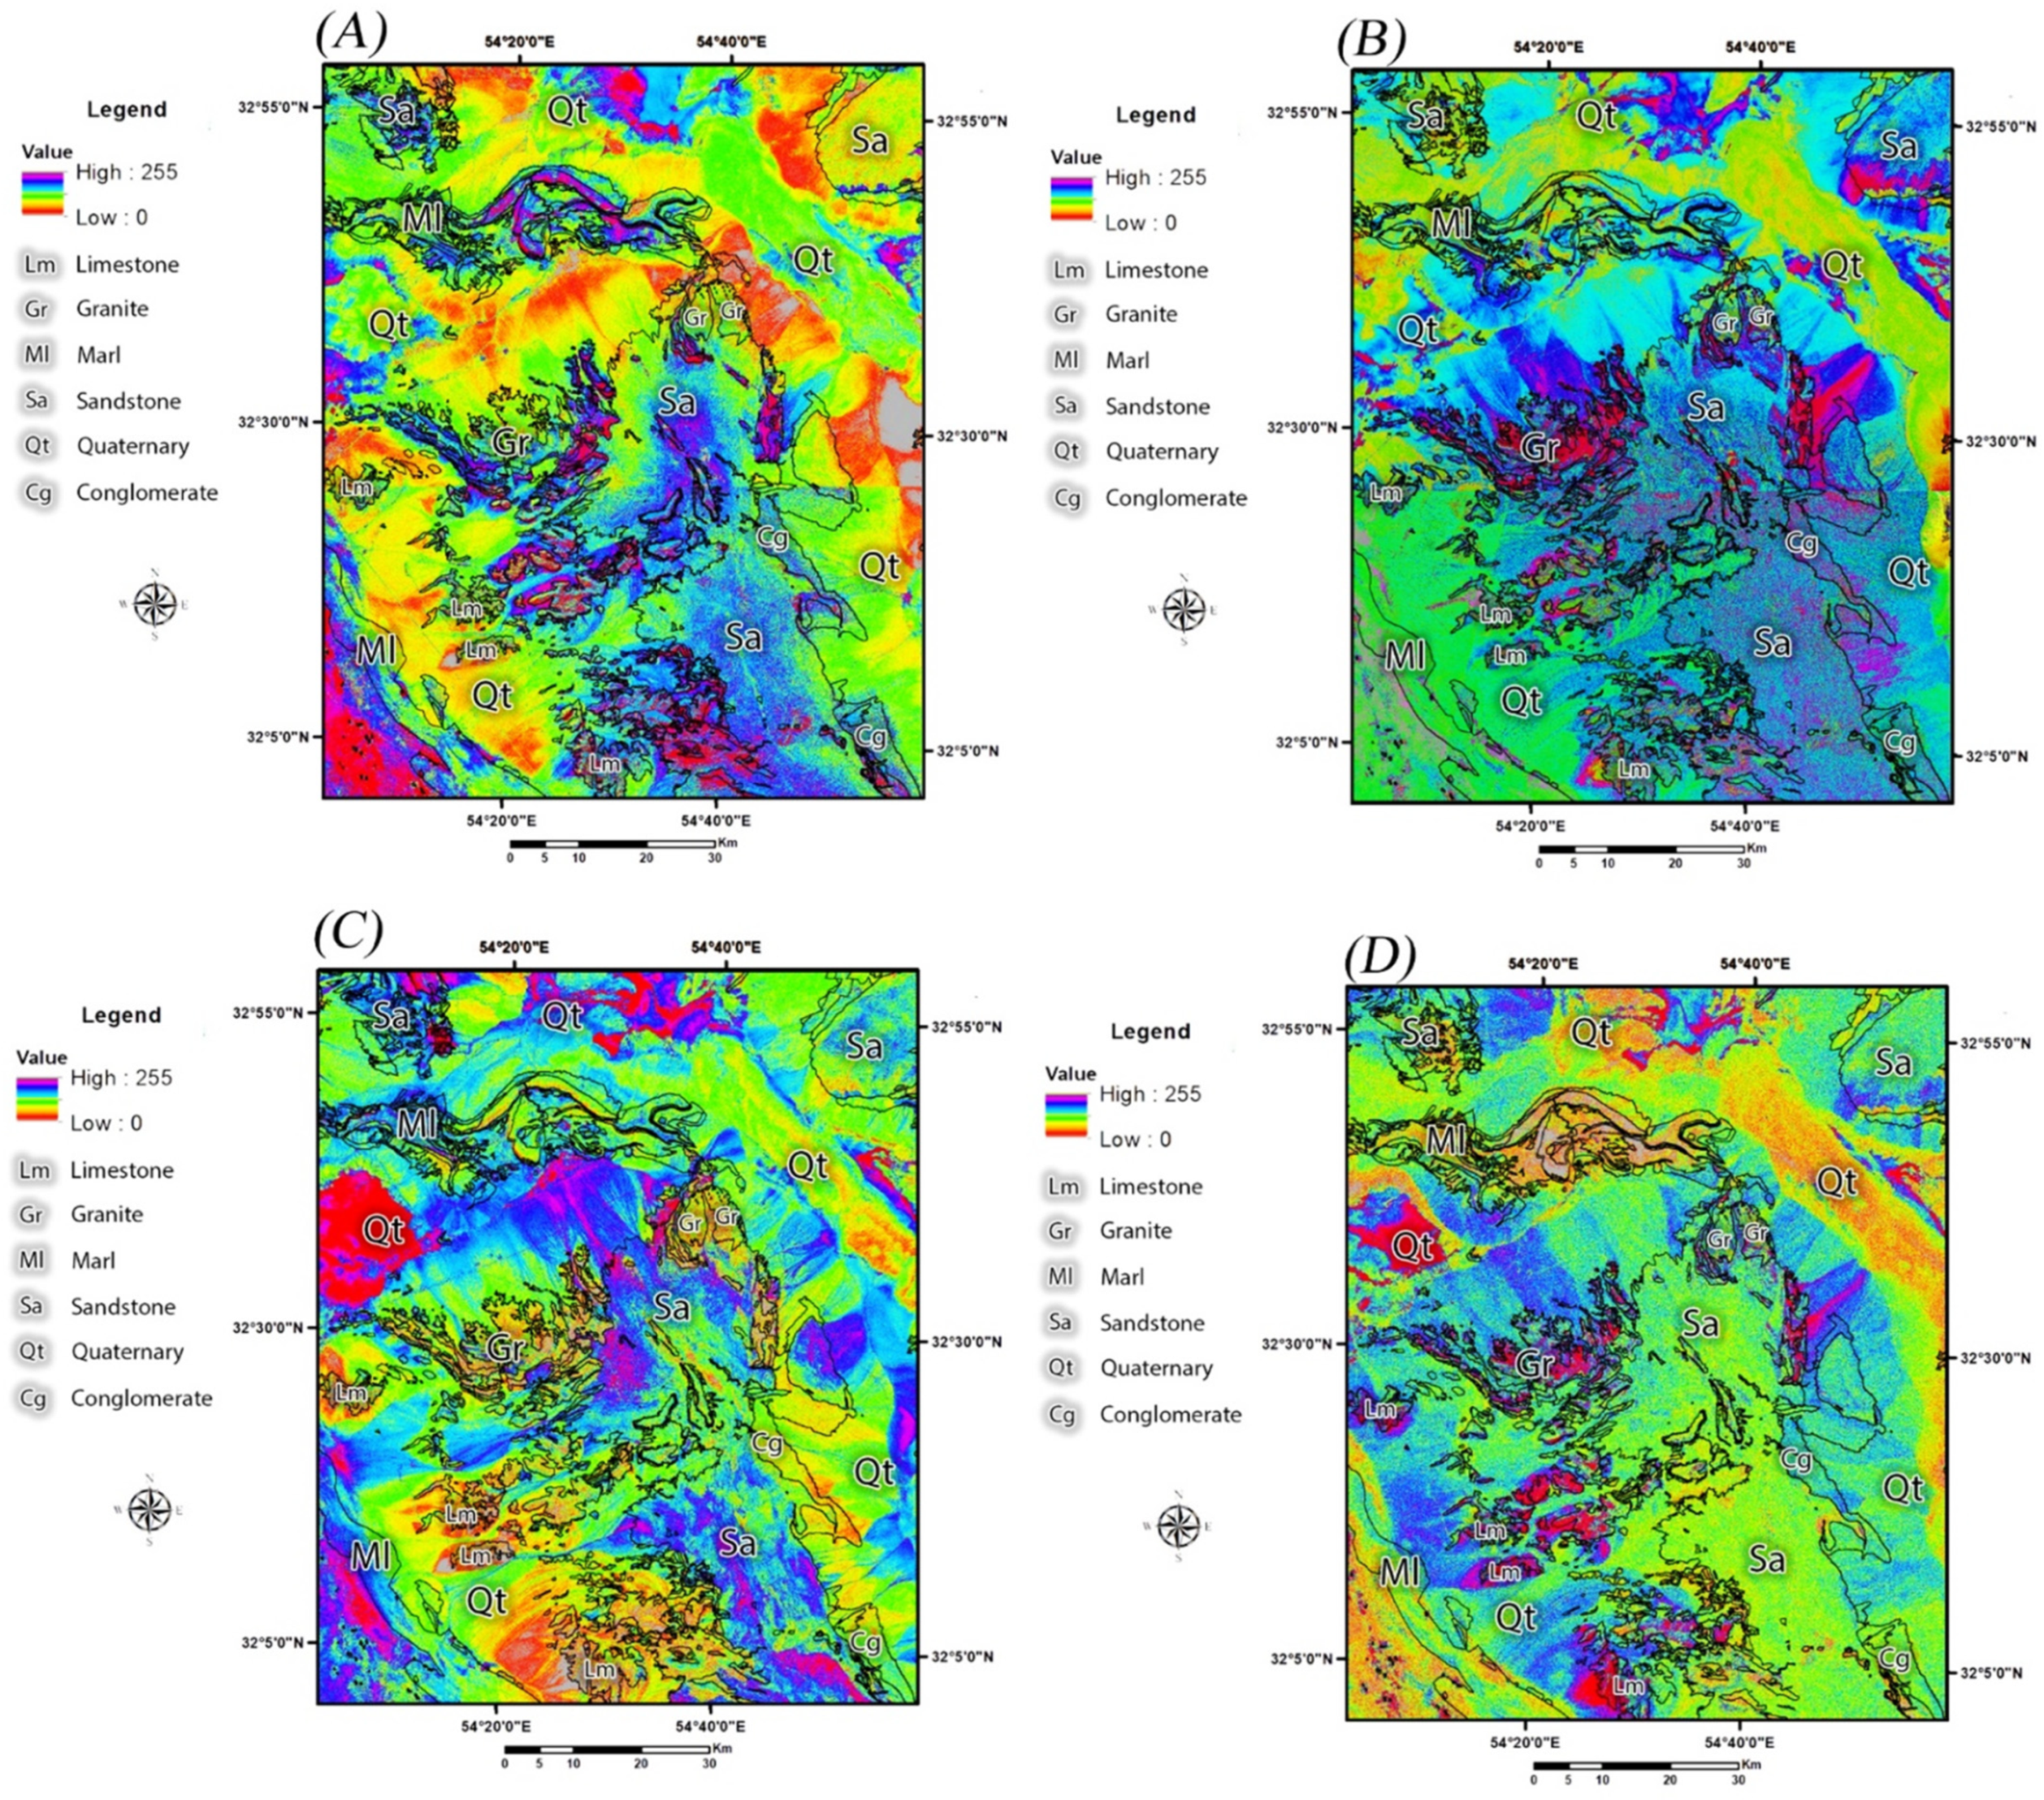
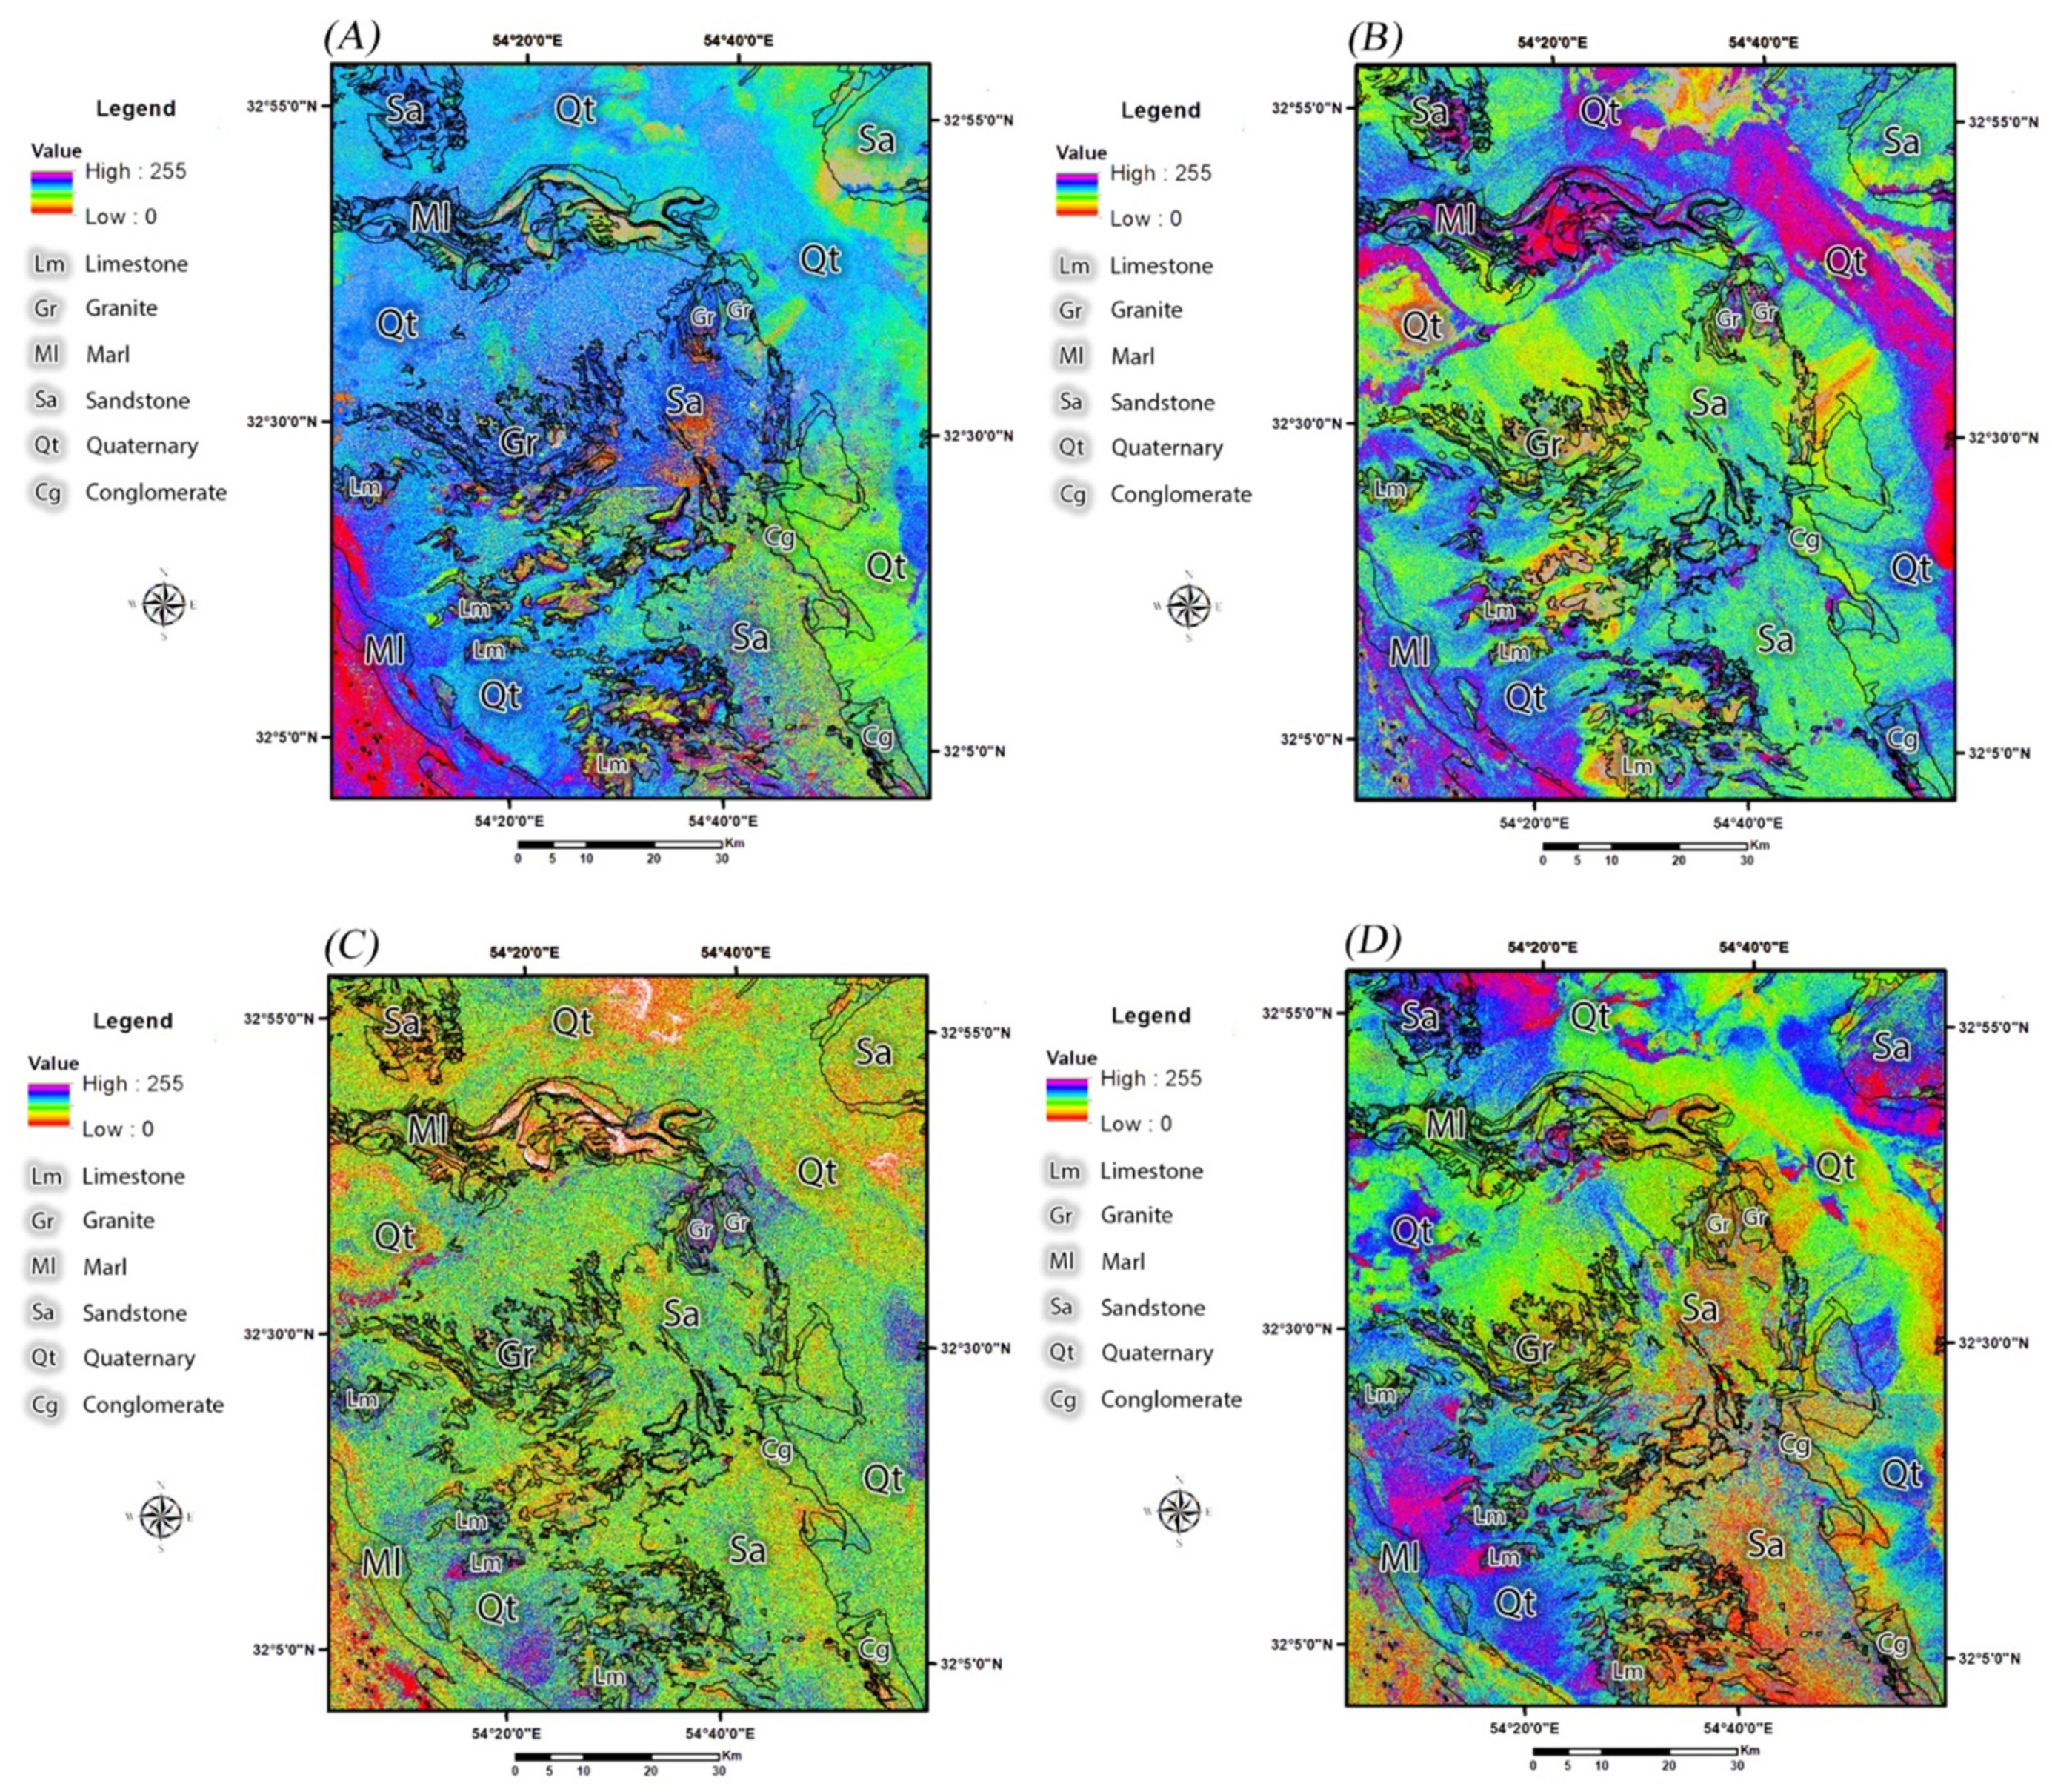
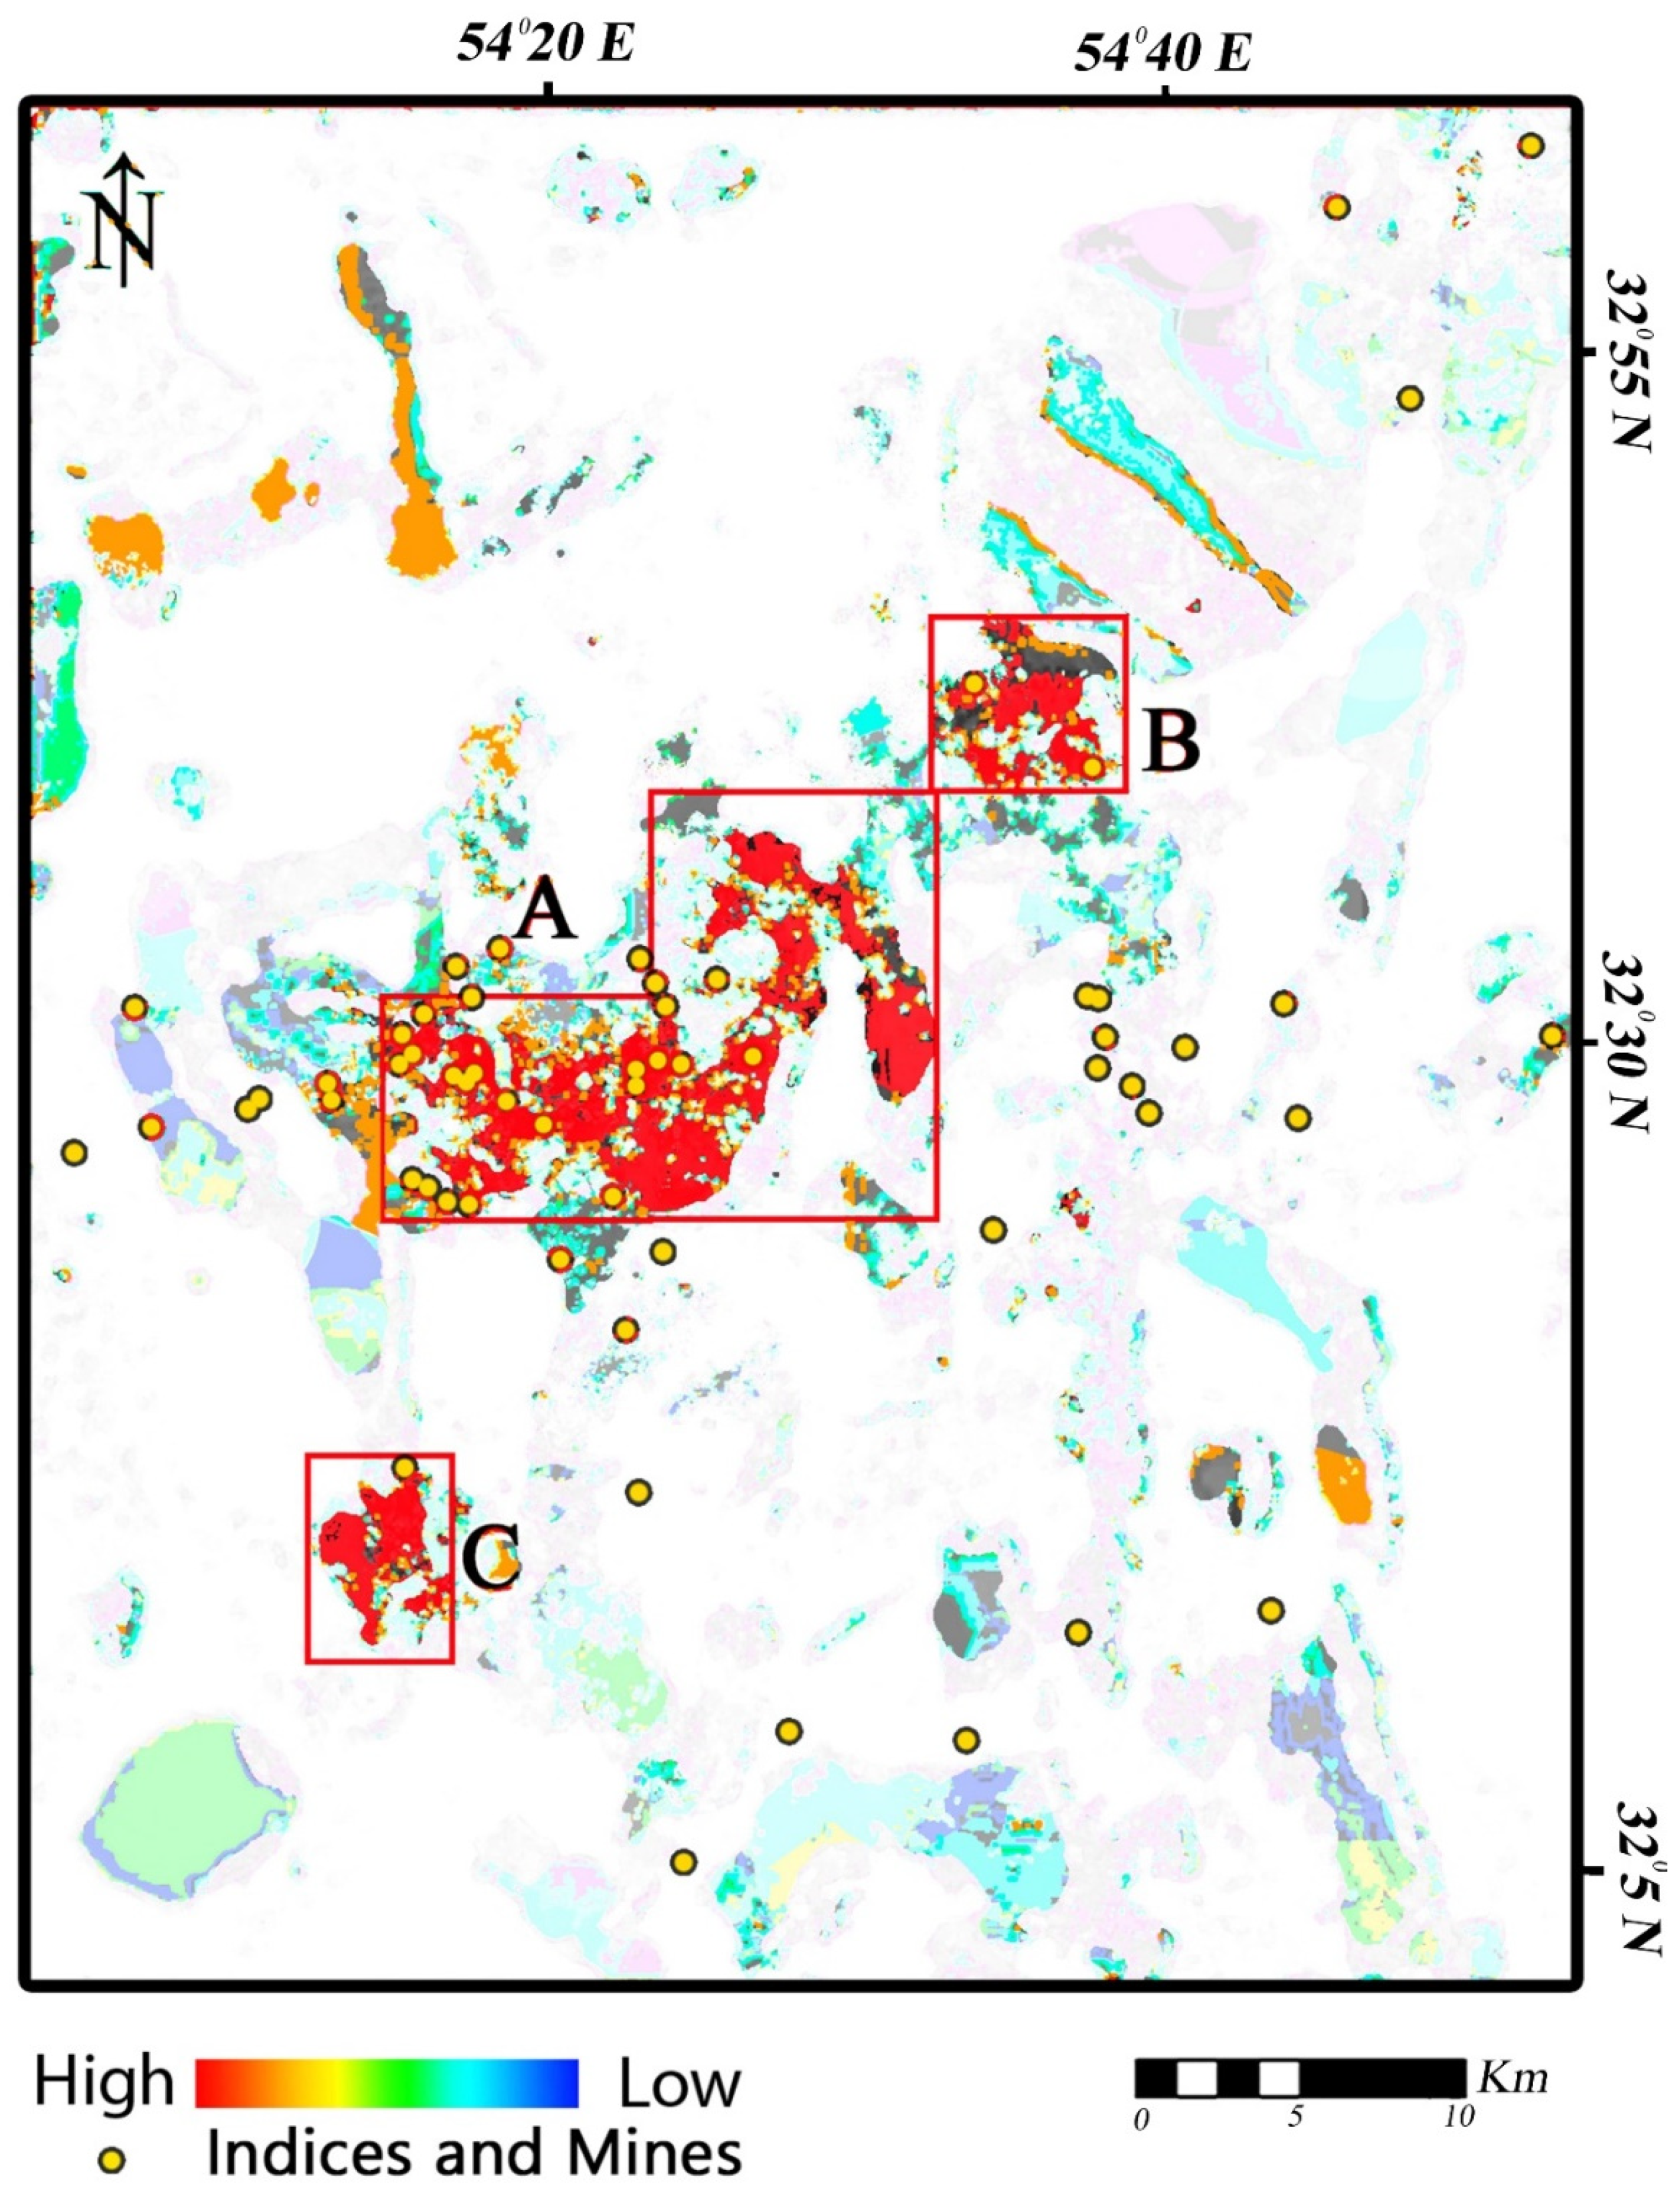
4.1. Remote Sensing Results
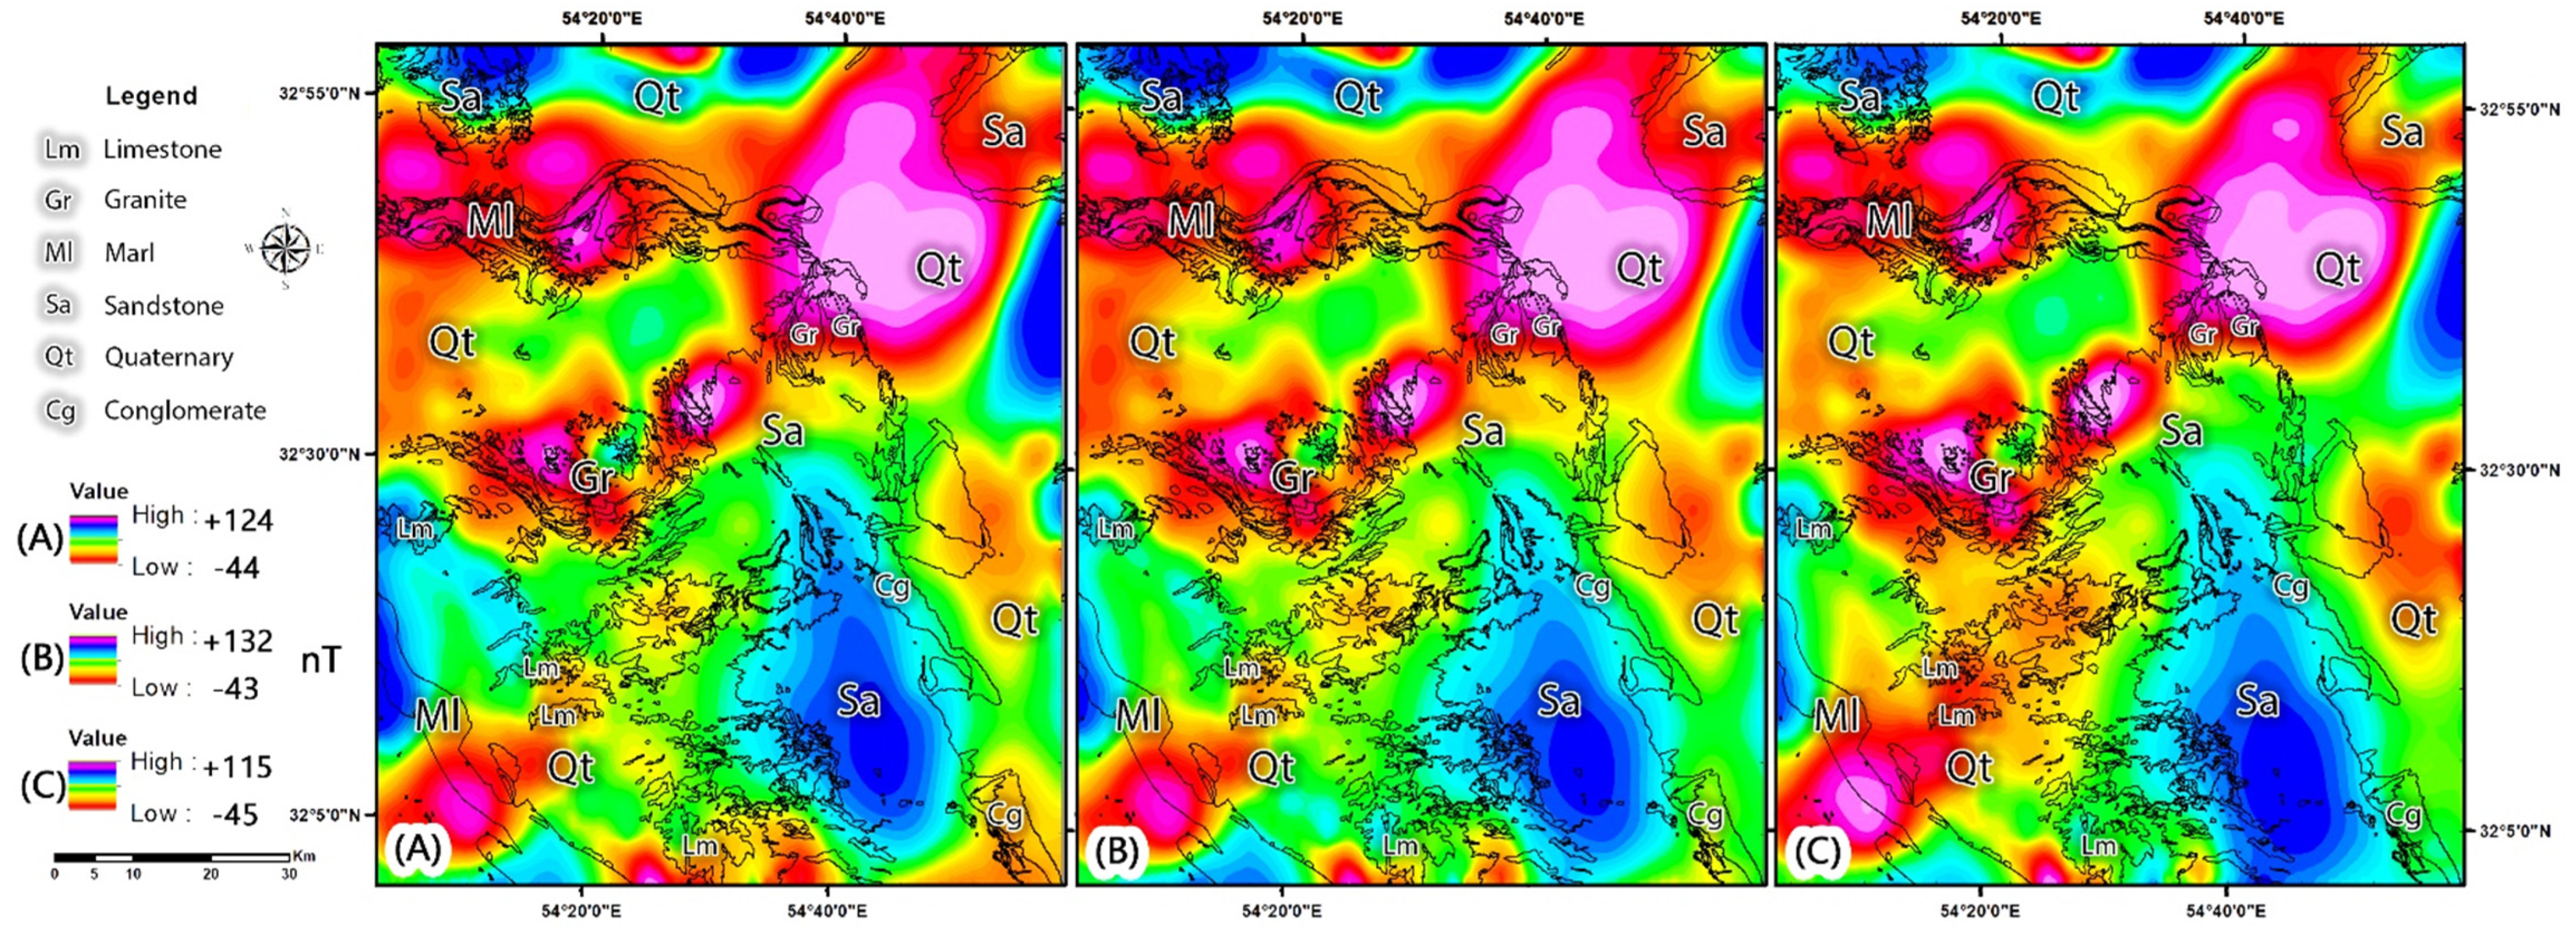
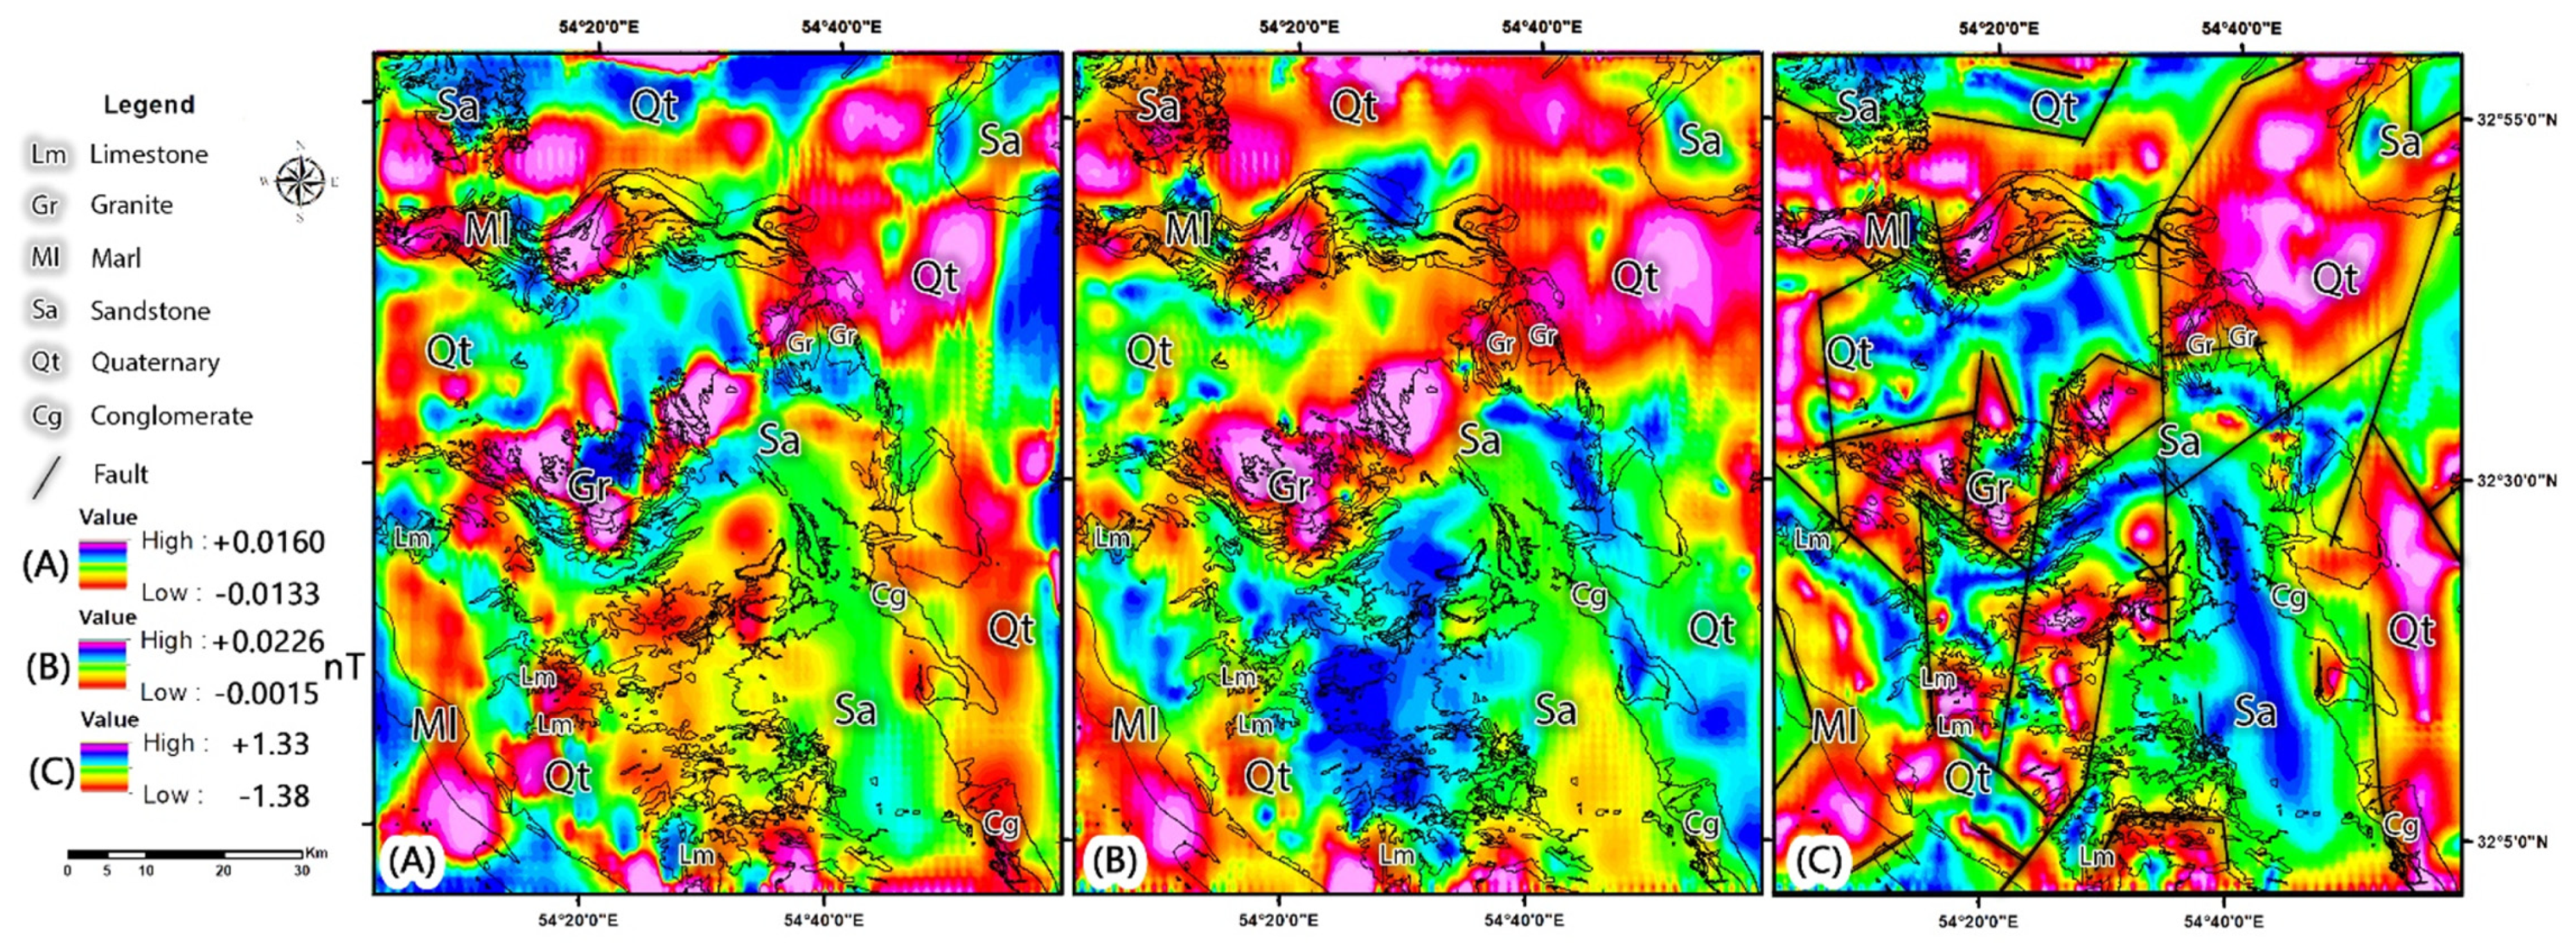
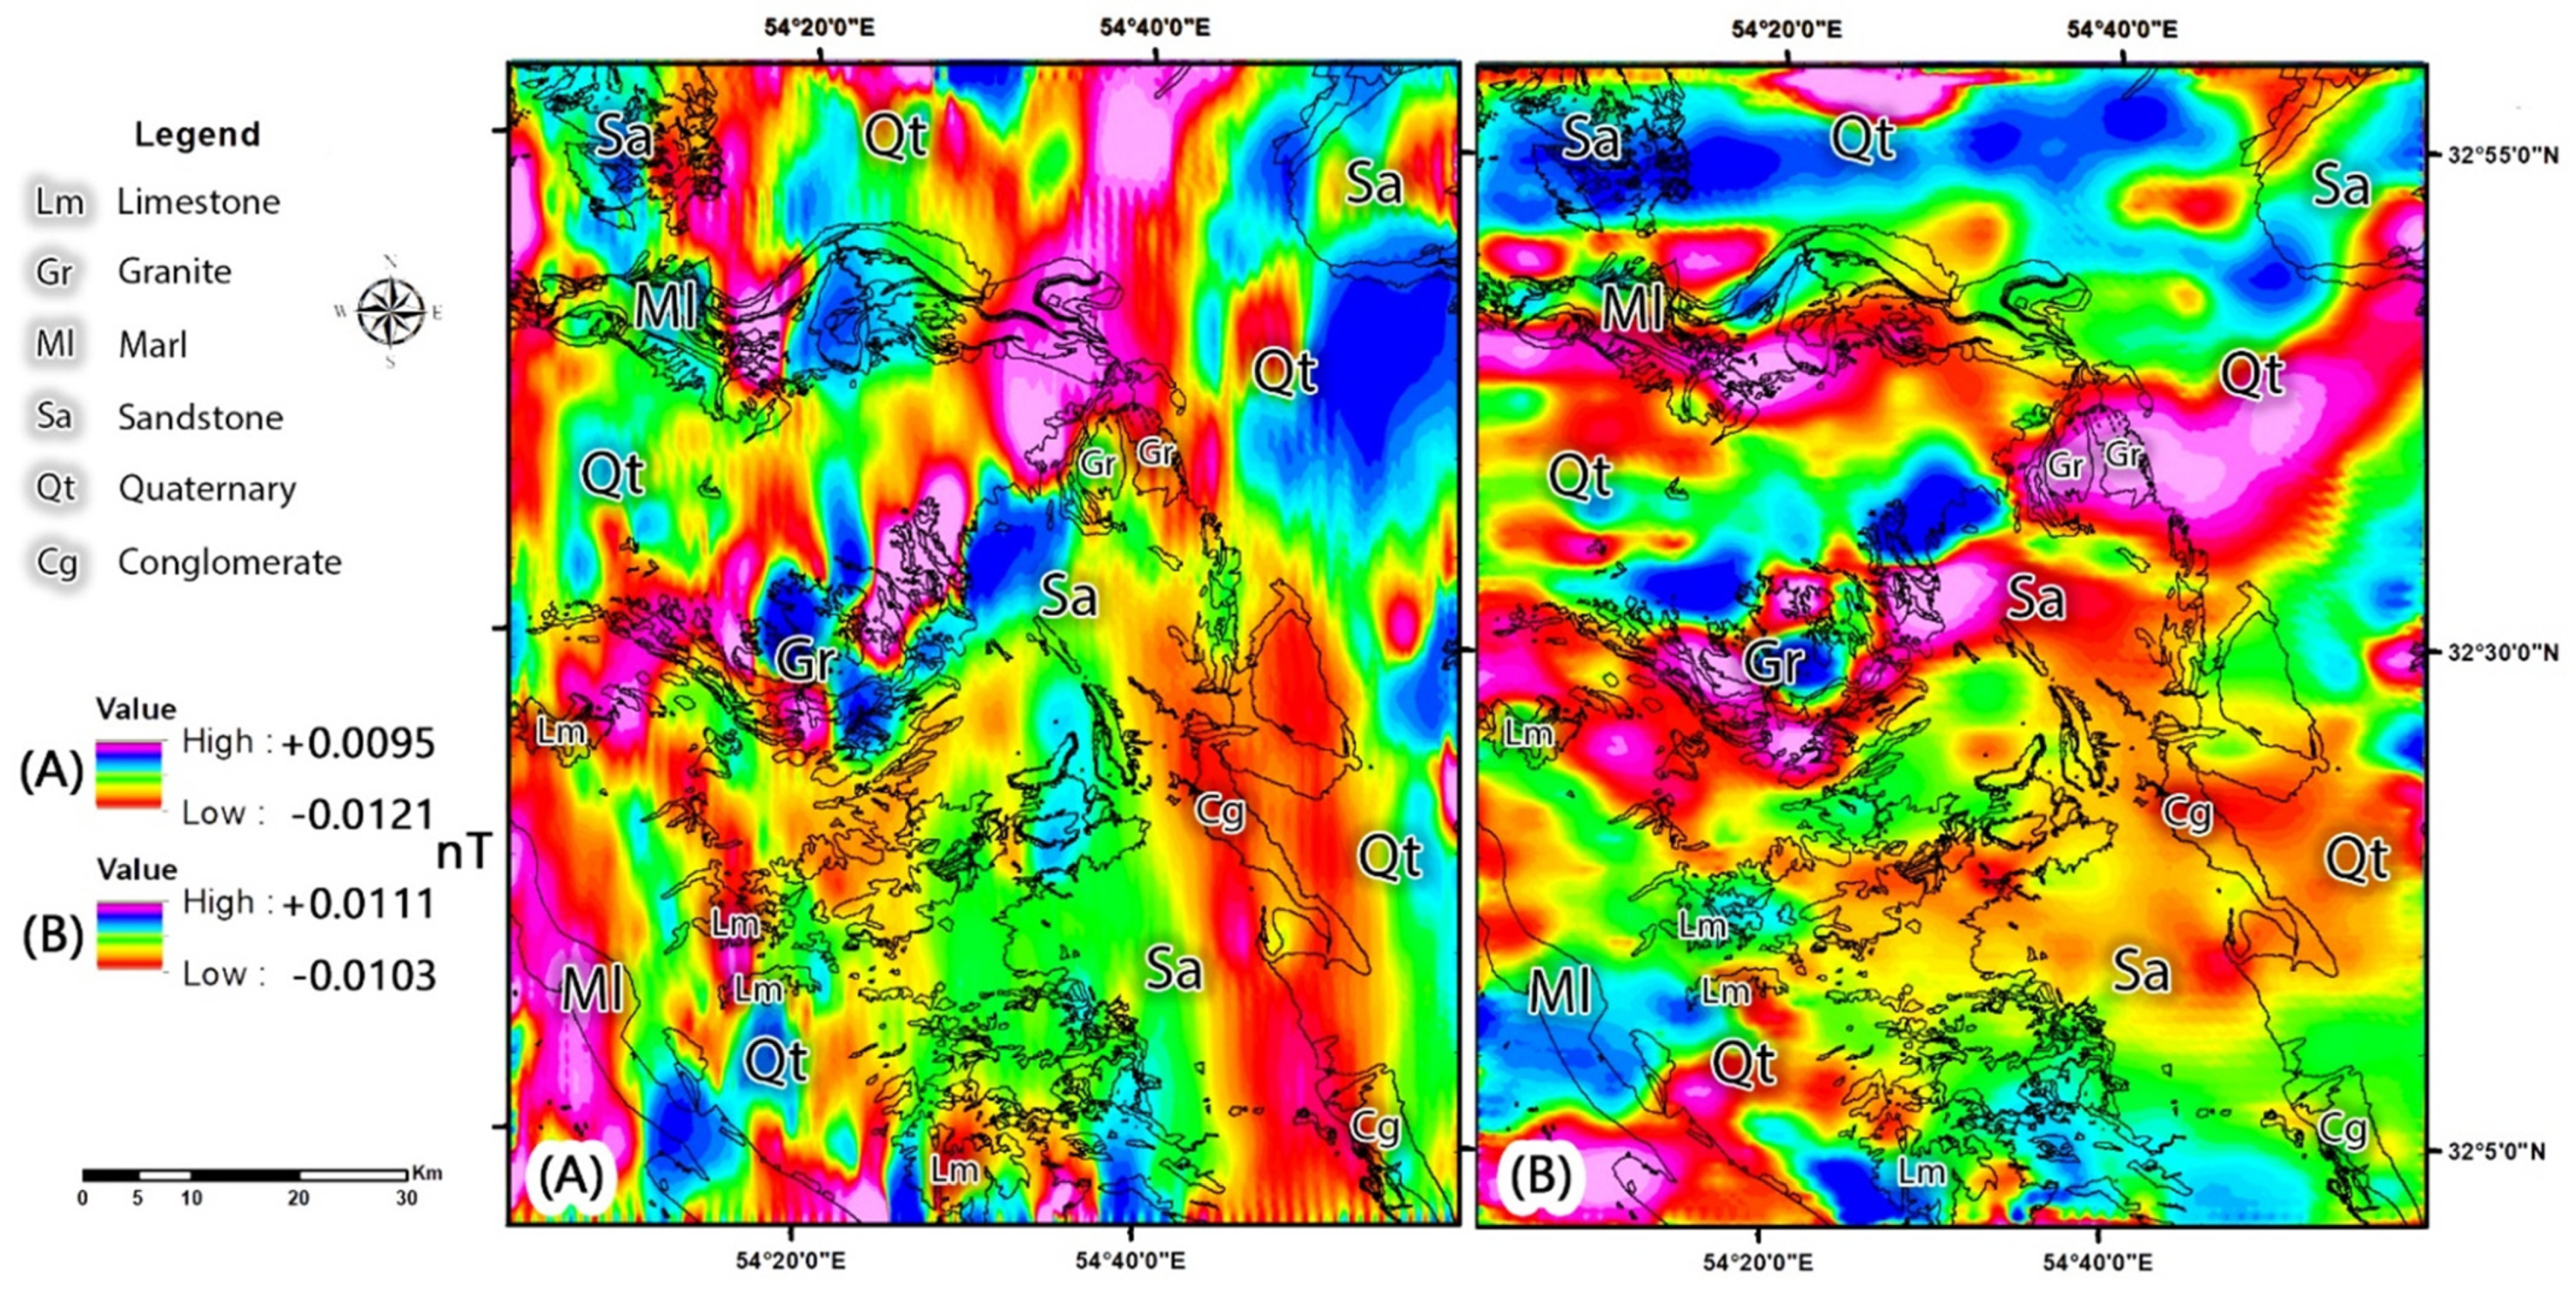
4.2. Aerial Magnetometry Results
4.3. Fusion of Exploratory/Information Layers
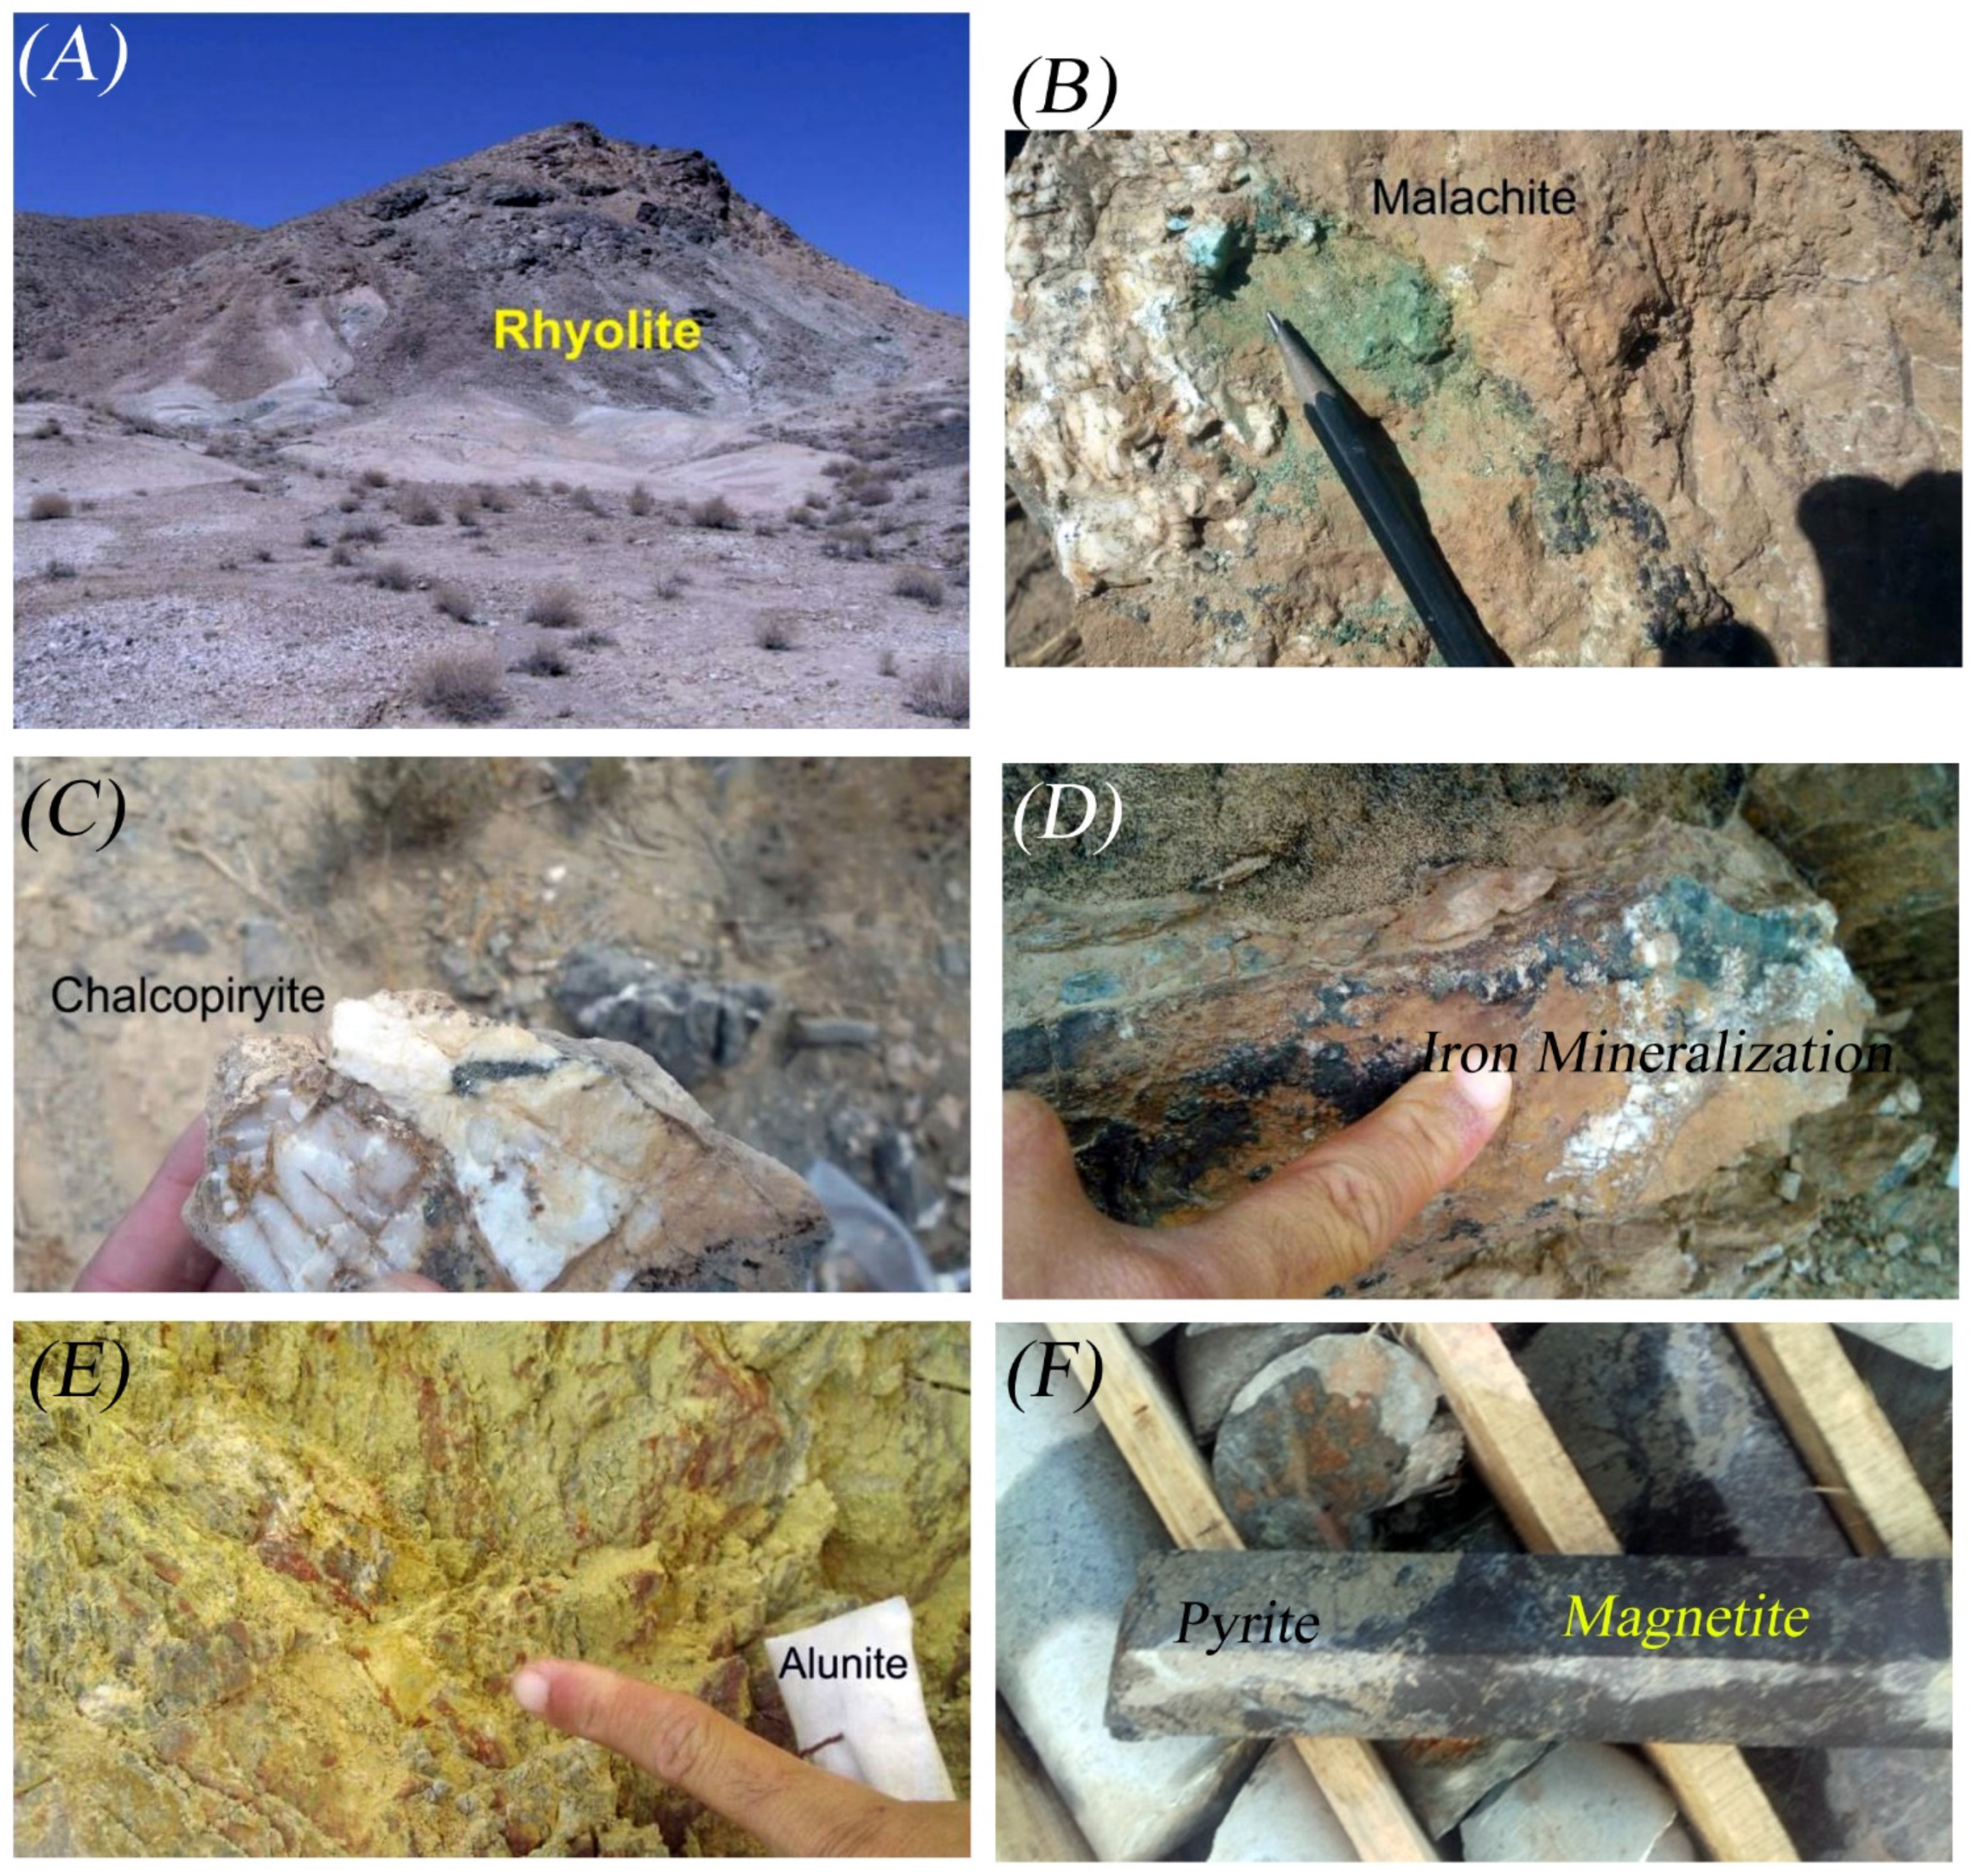
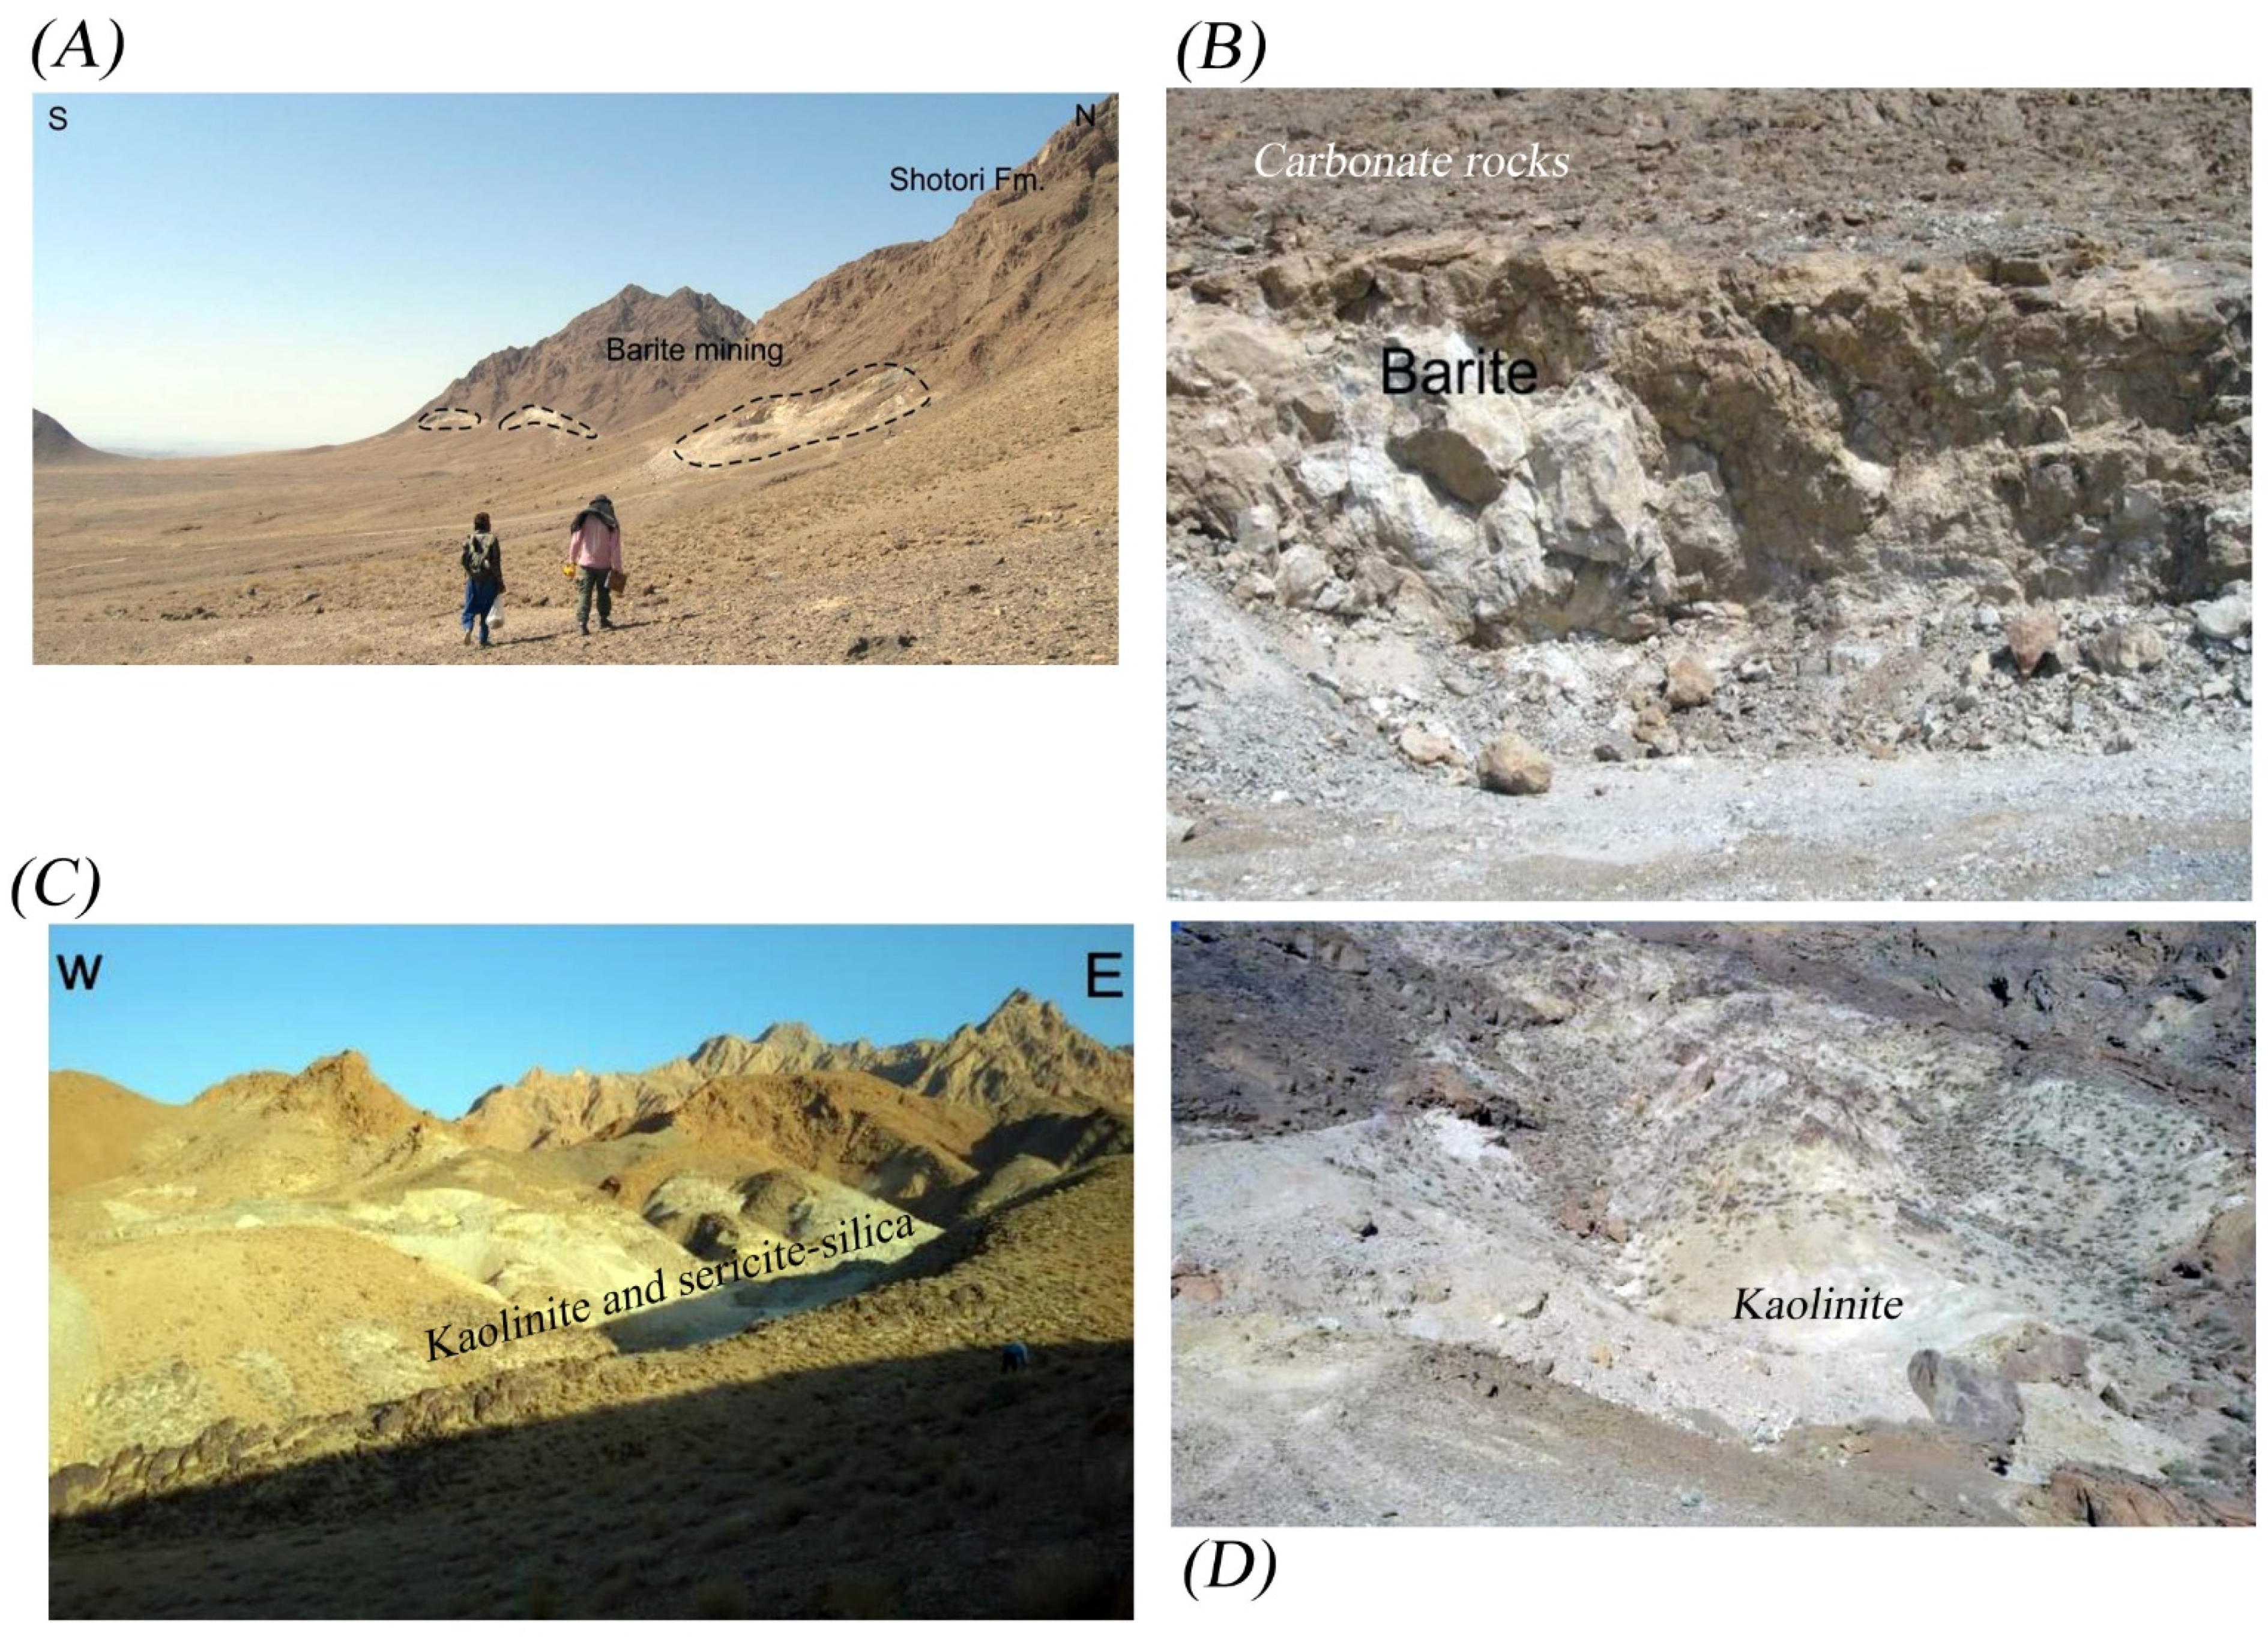
4.4. Geology and Fieldwork Results
5. Discussion
6. Conclusions
Author Contributions
Funding
Data Availability Statement
Acknowledgments
Conflicts of Interest
References
- Carranza, E.J.M. Geochemical Anomaly and Mineral Prospectivity Mapping in GIS; Elsevier: Amsterdam, The Netherlands, 2008. [Google Scholar]
- Zuo, R. Geodata science-based mineral prospectivity mapping: A review. Nat. Resour. Res. 2020, 29, 3415–3424. [Google Scholar] [CrossRef]
- Shirazy, A.; Ziaii, M.; Hezarkhani, A. Geochemical Behavior Investigation Based on K-means and Artificial Neural Network Prediction for Copper, in Kivi region, Ardabil province, IRAN. Iran. J. Min. Eng. 2020, 14, 96–112. [Google Scholar]
- Malczewski, J. GIS and Multicriteria Decision Analysis; John Wiley & Sons: Hoboken, NJ, USA, 1999. [Google Scholar]
- Lü, G.; Batty, M.; Strobl, J.; Lin, H.; Zhu, A.-X.; Chen, M. Reflections and speculations on the progress in Geographic Information Systems (GIS): A geographic perspective. Int. J. Geogr. Inf. Sci. 2019, 33, 346–367. [Google Scholar] [CrossRef]
- Khosravi, V.; Shirazi, A.; Shirazy, A.; Hezarkhani, A.; Pour, A.B. Hybrid Fuzzy-Analytic Hierarchy Process (AHP) Model for Porphyry Copper Prospecting in Simorgh Area, Eastern Lut Block of Iran. Mining 2022, 2, 1–12. [Google Scholar] [CrossRef]
- Bonham-Carter, G.F. Geographic information systems for geoscientists-modeling with GIS. Comput. Methods Geosci. 1994, 13, 398. [Google Scholar]
- Shirazy, A.; Hezarkhani, A.; Timkin, T.; Shirazi, A. Investigation of Magneto-/Radio-Metric Behavior in Order to Identify an Estimator Model Using K-Means Clustering and Artificial Neural Network (ANN) (Iron Ore Deposit, Yazd, IRAN). Minerals 2021, 11, 1304. [Google Scholar] [CrossRef]
- Shirazi, A.; Hezarkhani, A.; Shirazy, A. Remote Sensing Studies for Mapping of Iron Oxide Regions, South of Kerman, IRAN. Int. J. Sci. Eng. Appl. (IJSEA) 2018, 7, 45–51. [Google Scholar] [CrossRef]
- Gautneb, H.; Tveten, E. The geology, exploration and characterisation of graphite deposits in the Jennestad area, Vesterålen, northern Norway. Nor. Geol. Undersøkelse Bull. 2000, 436, 67–74. [Google Scholar]
- Sun, L.; Xu, C.-P.; Xiao, K.; Zhu, Y.-S.; Yan, L.-Y. Geological characteristics, metallogenic regularities and the exploration of graphite deposits in China. China Geol. 2018, 1, 425–434. [Google Scholar] [CrossRef]
- Rokos, D.; Argialas, D.; Mavrantza, R.; Seymour, K.; Vamvoukakis, C.; Kouli, M.; Lamera, S.; Paraskevas, H.; Karfakis, I.; Denes, G. Structural analysis for gold mineralization using remote sensing and geochemical techniques in a GIS environment: Island of Lesvos, Hellas. Nat. Resour. Res. 2000, 9, 277–293. [Google Scholar] [CrossRef]
- El-Wahed, M.A.; Zoheir, B.; Pour, A.B.; Kamh, S. Shear-related gold ores in the Wadi Hodein Shear Belt, South Eastern Desert of Egypt: Analysis of remote sensing, field and structural data. Minerals 2021, 11, 474. [Google Scholar] [CrossRef]
- Saadat, S. Geology, geochemistry and ground magnetic survey on Kalateh Naser iron ore deposit, Khorasan Jonoubi province. J. Econ. Geol. 2017, 8, 593–607. [Google Scholar]
- Barak, S.; Bahroudi, A.; Jozanikohan, G. Exploration of Kahang porphyry copper deposit using advanced integration of geological, remote sensing, geochemical, and magnetics data. J. Min. Environ. 2018, 9, 19–39. [Google Scholar]
- Maleki, M.; Niroomand, S.; Rajabpour, S.; Pour, A.B.; Ebrahimpour, S. Targeting local orogenic gold mineralization zones using data-driven evidential belief functions: The Godarsorkh area, Central Iran. All Earth 2022, 34, 259–278. [Google Scholar] [CrossRef]
- Aali, A.A.; Shirazi, A.; Shirazy, A.; Khakmardan, S.; Maghsoudi, A.; Hezarkhani, A. Geophysical Study to Identify Iron Mineralization Anomalies Using Terrestrial Magnetometry in the Chak-Chak Exploration Area, Iran. Türkiye Jeol. Bülteni 2022, 65, 159–170. [Google Scholar]
- Stöcklin, J. Structural history and tectonics of Iran: A review: Bulltein of the American Association of Petroleum. Geologists 1968, 52, 1229–1258. [Google Scholar]
- Davoudzadeh, M.; Lensch, G.; Weber-Diefenbach, K. Contribution to the paleogeography, stratigraphy and tectonics of the Infracambrian and lower Paleozoic of Iran: Neues Jahrbuch für Geologie und Paläontologie. Abhandlungen 1986, 172, 245–269. [Google Scholar]
- Pieschke, R. US Geological Survey Distribution of European Space Agency’s Sentinel-2 Data; No. 2017-3026; US Geological Survey: Reston, VA, USA, 2017. [Google Scholar]
- Sekandari, M.; Masoumi, I.; Pour, A.B.; Muslim, A.M.; Rahmani, O.; Hashim, M.; Zoheir, B.; Pradhan, B.; Misra, A.; Aminpour, S.M. Application of Landsat-8, Sentinel-2, ASTER and WorldView-3 spectral imagery for exploration of carbonate-hosted Pb-Zn deposits in the Central Iranian Terrane (CIT). Remote Sens. 2020, 12, 1239. [Google Scholar] [CrossRef]
- Shirazi, A.; Hezarkhani, A.; Pour, A.B. Fusion of Lineament Factor (LF) Map Analysis and Multifractal Technique for Massive Sulfide Copper Exploration: The Sahlabad Area, East Iran. Minerals 2022, 12, 549. [Google Scholar] [CrossRef]
- Ben-Dor, E.; Kruse, F.A. The relationship between the size of spatial subsets of GER 63 channel scanner data and the quality of the Internal Average Relative Reflectance (IARR) atmospheric correction technique. Remote Sens. 1994, 15, 683–690. [Google Scholar] [CrossRef]
- Tangestani, M.H.; Mazhari, N.; Ager, B.; Moore, F. Evaluating Advanced Spaceborne Thermal Emission and Reflection Radiometer (ASTER) data for alteration zone enhancement in a semi-arid area, northern Shahr-e-Babak, SE Iran. Int. J. Remote Sens. 2008, 29, 2833–2850. [Google Scholar] [CrossRef]
- Inzana, J.; Kusky, T.; Higgs, G.; Tucker, R. Supervised classifications of Landsat TM band ratio images and Landsat TM band ratio image with radar for geological interpretations of central Madagascar. J. Afr. Earth Sci. 2003, 37, 59–72. [Google Scholar] [CrossRef]
- Crosta, A.P.; Souza Filho, C.R.; Azevedo, F.; Brodie, C. Targeting key alteration minerals in epithermal deposits in Patagonia, Argentina, using ASTER imagery and principal component analysis. Int. J. Remote Sens. 2003, 24, 4233–4240. [Google Scholar] [CrossRef]
- Eldosouky, A.M.; Sehsah, H.; Elkhateeb, S.O.; Pour, A.B. Integrating aeromagnetic data and Landsat-8 imagery for detection of post-accretionary shear zones controlling hydrothermal alterations: The Allaqi-Heiani Suture zone, South Eastern Desert, Egypt. Adv. Space Res. 2020, 65, 1008–1024. [Google Scholar] [CrossRef]
- Eldosouky, A.M.; El-Qassas, R.A.Y.; Pour, A.B.; Mohamed, H.; Sekandari, M. Integration of ASTER satellite imagery and 3D inversion of aeromagnetic data for deep mineral exploration. Adv. Space Res. 2021, 68, 3641–3662. [Google Scholar] [CrossRef]
- Blakely, R.J. Potential Theory in Gravity and Magnetic Applications; Cambridge University Press: New York, NY, USA, 1996. [Google Scholar]
- Zadeh, L.A. Fuzzy sets. Inf. Control 1965, 8, 338–353. [Google Scholar] [CrossRef]
- Novák, V.; Perfilieva, I. Evaluating Linguistic Expressions and Functional Fuzzy Theories in Fuzzy Logic, in Computing with Words in Information/Intelligent Systems 1; Springer: Berlin/Heidelberg, Germany, 1999; pp. 383–406. [Google Scholar]
- Porwal, A.; Carranza, E.J.M.; Hale, M. Knowledge-driven and datadriven fuzzy models for predictive mineral potential mapping. Nat. Resour. Res. 2003, 12, 1–24. [Google Scholar] [CrossRef]
- Lovejoy, S. Encyclopedia of Mathematical Geosciences. In Encyclopedia of Earth Sciences Series; Sagar, B.S.D., Cheng, Q., McKinley, J., Agterberg, F., Eds.; Springer: Cham, Switzerland, 2022. [Google Scholar] [CrossRef]
- Abu-Siada, A.; Hmood, S. A new fuzzy logic approach to identify power transformer criticality using dissolved gas-in-oil analysis. Int. J. Electr. Power Energy Syst. 2015, 67, 401–408. [Google Scholar] [CrossRef]
- Alejo, R.; Valdovinos, R.M.; García, V.; Pacheco-Sanchez, J.H. A hybrid method to face class overlap and class imbalance on neural networks and multi-class scenarios. Pattern Recognit. Lett. 2013, 34, 380–388. [Google Scholar] [CrossRef]
- Riahi, S.; Bahroudi, A.; Abedi, M.; Aslani, S.; Elyasi, G.R. Integration of airborne geophysics and satellite imagery data for exploration targeting in porphyry Cu systems: Chahargonbad district, Iran. Geophys. Prospect. 2021, 69, 1116–1137. [Google Scholar] [CrossRef]
- Aparicio, T.; Villanúa, I. Selection Criteria for Overlapping Binary Models—A Simulation Study. Mathematics 2022, 10, 478. [Google Scholar] [CrossRef]
- Christmann, A.; Rousseeuw, P.J. Measuring overlap in binary regression. Comput. Stat. Data Anal. 2001, 37, 65–75. [Google Scholar] [CrossRef]
- Zou, T.; Pan, T.; Taylor, M.; Stern, H. Recognition of overlapping elliptical objects in a binary image. Pattern Anal. Appl. 2021, 24, 1193–1206. [Google Scholar] [CrossRef]
- Bonham-Carter, G.F. Geographic Information Systems for Geoscientists: Modelling with GIS; Pergamon: Oxford, UK; Elsevier: New York, NY, USA, 1994; pp. 276–300. [Google Scholar]
- Yousefi, M.; Carranza, E.J.M. Prediction-area (P-A) plot and C-A fractal analysis to classify and evaluate evidential maps for mineral prospectivity modeling. Comput. Geosci. 2015, 79, 69–81. [Google Scholar] [CrossRef]
- Hunt, G.R. Spectral signatures of particulate minerals in the visible and near infrared. Geophysics 1977, 42, 501–513. [Google Scholar] [CrossRef]
- Clark, R.N.; King, T.V.V.; Klejwa, M.; Swayze, G.A. High spectral resolution reflectance spectroscopy of minerals. J. Geophys. Res. 1990, 95, 12653–12680. [Google Scholar] [CrossRef]
- Hunt, G.R.; Ashley, R.P. Spectra of altered rocks in the visible and near infrared. Econ. Geol. 1979, 74, 1613–1629. [Google Scholar] [CrossRef]
- Shirazi, A.; Hezarkhani, A.; Beiranvand Pour, A.; Shirazy, A.; Hashim, M. Neuro-Fuzzy-AHP (NFAHP) Technique for Copper Exploration Using Advanced Spaceborne Thermal Emission and Reflection Radiometer (ASTER) and Geological Datasets in the Sahlabad Mining Area, East Iran. Remote Sens. 2022, 14, 5562. [Google Scholar] [CrossRef]
- Story, M.; Congalton, R. Accuracy assessment: A user’s perspective. Photogramm. Eng. Remote Sens. 1986, 52, 397–399. [Google Scholar]
- Congalton, R.G. A review of assessing the accuracy of classification of remotely sensed data. Remote Sens. Environ. 1991, 37, 35–46. [Google Scholar] [CrossRef]
- Lillesand, T.; Kiefer, R. Remote Sensing and Image Interpretation; John Wiley & Sons, Inc.: New York, NY, USA, 1994; Chapter 7. [Google Scholar]
- Yang, L. Editorial for Special Issue “Polymetallic Metallogenic System”. Minerals 2019, 9, 435. [Google Scholar] [CrossRef]
- Martins, T.F.; Seoane, J.C.S.; Tavares, F.M. Cu–Au exploration target generation in the eastern Carajás Mineral Province using random forest and multi-class index overlay mapping. J. S. Am. Earth Sci. 2022, 116, 103790. [Google Scholar] [CrossRef]
- Shirazy, A.; Ziaii, M.; Hezarkhani, A.; Timkin, T. Geostatistical and Remote Sensing Studies to Identify High Metallogenic Potential Regions in the Kivi Area of Iran. Minerals 2020, 10, 869. [Google Scholar] [CrossRef]
- Rajan Girija, R.; Mayappan, S. Mapping of mineral resources and lithological units: A review of remote sensing techniques. Int. J. Image Data Fusion 2019, 10, 79–106. [Google Scholar] [CrossRef]
- Noori, L.; Pour, A.B.; Askari, G.; Taghipour, N.; Pradhan, B.; Lee, C.-W.; Honarmand, M. Comparison of Different Algorithms to Map Hydrothermal Alteration Zones Using ASTER Remote Sensing Data for Polymetallic Vein-Type Ore Exploration: Toroud–Chahshirin Magmatic Belt (TCMB), North Iran. Remote Sens. 2019, 11, 495. [Google Scholar] [CrossRef]
- Mars, J.C.; Rowan, L.C. Regional mapping of phyllic-and argillic-altered rocks in the Zagros magmatic arc, Iran, using Advanced Spaceborne Thermal Emission and Reflection Radiometer (ASTER) data and logical operator algorithms. Geosphere 2006, 2, 161–186. [Google Scholar] [CrossRef]
- Malekian, M.; Momayez, M.; Bellett, P.; Mancino, S.; Carrea, F. Stability Investigation of Open-Pit Slopes During Blasting Activities. Int. J. Eng. Res. Technol. 2022, 11, 32–37. [Google Scholar] [CrossRef]


| (A) Eigenvector | Band 1 | Band 2 | Band 3 | Band 4 | Band 11 | Band 12 |
| PC1 | −0.50 | −0.56 | −0.44 | −0.38 | −0.26 | −0.19 |
| PC 2 | −0.50 | −0.41 | 0.32 | 0.44 | 0.41 | 0.34 |
| PC 3 | −0.23 | 0.04 | 0.73 | −0.025 | −0.39 | −0.51 |
| PC 4 | −0.65 | 0.72 | −0.21 | 0.03 | 0.78 | −0.61 |
| PC 5 | 0.08 | −0.09 | −0.36 | 0.75 | −0.07 | −0.53 |
| PC6 | 0.05 | −0.05 | 0.03 | −0.30 | 0.77 | −0.55 |
| (B) Eigenvector | Band 1 | Band 2 | Band 3 | Band 4 | Band 5 | Band 7 |
| PC 1 | 0.23 | 0.31 | 0.47 | 0.37 | 0.51 | 0.47 |
| PC 2 | −0.40 | −0.40 | −0.41 | −0.20 | 0.47 | 0.50 |
| PC 3 | 0.58 | 0.24 | −0.65 | −0.16 | −0.12 | 0.37 |
| PC 4 | 0.36 | 0.08 | −0.35 | 0.01 | 0.64 | −0.56 |
| PC 5 | 0.27 | 0.050 | −0.61 | 0.62 | −0.27 | 0.26 |
| PC 6 | 0.50 | −0.82 | 0.25 | 0.083 | −0.02 | 0.04 |
| Raster | Column | Class | Weight |
|---|---|---|---|
| Intrusive Mass | No data | 1 | 0 |
| Superficial | 2 | 1 | |
| Medium | 3 | 0.6 | |
| Deep | 4 | 0.3 | |
| Fault and line density | No data | 1 | 0 |
| 0–0.12 | 2 | 0.2 | |
| 0.12–0.34 | 3 | 0.4 | |
| 0.34–0.66 | 4 | 0.6 | |
| 0.66–1.13 | 5 | 0.8 | |
| 1.13–2.17 | 6 | 1 | |
| Geological layer | PCr1 | 1 | 1 |
| Gr | 1 | 1 | |
| D | 2 | 0.8 | |
| PCr2 | 3 | 0.6 | |
| C1 | 4 | 0.4 | |
| iCs | 4 | 0.4 | |
| Dc | 4 | 0.4 | |
| Tsh | 5 | 0.2 | |
| K1 | 5 | 0.2 | |
| J | 6 | 0.1 | |
| No data | 7 | 0 |
| Point | Intrusive Mass |
|---|---|
| 0 | No Data |
| 2 | 0–0.128 |
| 4 | 0.128–0.340 |
| 6 | 0.340–0.664 |
| 8 | 0.064–1.132 |
| 10 | 1.132–2.170 |
| Intrusive Mass | Deep | Medium | Superficial | No Data |
|---|---|---|---|---|
| Point | 3 | 6 | 10 | 0 |
| Point | Legend | Lithology |
|---|---|---|
| 10 | PCr1 | Rhyolite |
| 10 | gr | Granite |
| 8 | d | Diabase |
| 6 | PCr2 | Volcanoclastic and silicate clastic |
| 4 | C1 | Top quartz |
| 4 | iCs | Dolomite-Chert |
| 4 | Dc | Quartz and dolomite |
| 2 | Tsh | Limestone-dolomite (marmorzite) |
| 2 | K1 | Limestone |
| 1 | J | Shale and sandstone |
| Classes | Field Check Points | ||||
|---|---|---|---|---|---|
| High Potential | Moderate Potential | Low Potential | Totals | User’s Accuracy | |
| High Potential | 16 | 6 | 1 | 24 | 66% |
| Moderate Potential | 3 | 13 | 4 | 20 | 65% |
| Low potential | 1 | 1 | 15 | 16 | 93% |
| Totals | 20 | 20 | 20 | 60 | |
| Producer’s Accuracy | 80% | 65% | 75% | ||
| Overall accuracy = 0.73% | Kappa Coefficient = 0.60 | ||||
Publisher’s Note: MDPI stays neutral with regard to jurisdictional claims in published maps and institutional affiliations. |
© 2022 by the authors. Licensee MDPI, Basel, Switzerland. This article is an open access article distributed under the terms and conditions of the Creative Commons Attribution (CC BY) license (https://creativecommons.org/licenses/by/4.0/).
Share and Cite
Aali, A.A.; Shirazy, A.; Shirazi, A.; Pour, A.B.; Hezarkhani, A.; Maghsoudi, A.; Hashim, M.; Khakmardan, S. Fusion of Remote Sensing, Magnetometric, and Geological Data to Identify Polymetallic Mineral Potential Zones in Chakchak Region, Yazd, Iran. Remote Sens. 2022, 14, 6018. https://doi.org/10.3390/rs14236018
Aali AA, Shirazy A, Shirazi A, Pour AB, Hezarkhani A, Maghsoudi A, Hashim M, Khakmardan S. Fusion of Remote Sensing, Magnetometric, and Geological Data to Identify Polymetallic Mineral Potential Zones in Chakchak Region, Yazd, Iran. Remote Sensing. 2022; 14(23):6018. https://doi.org/10.3390/rs14236018
Chicago/Turabian StyleAali, Ali Akbar, Adel Shirazy, Aref Shirazi, Amin Beiranvand Pour, Ardeshir Hezarkhani, Abbas Maghsoudi, Mazlan Hashim, and Shayan Khakmardan. 2022. "Fusion of Remote Sensing, Magnetometric, and Geological Data to Identify Polymetallic Mineral Potential Zones in Chakchak Region, Yazd, Iran" Remote Sensing 14, no. 23: 6018. https://doi.org/10.3390/rs14236018
APA StyleAali, A. A., Shirazy, A., Shirazi, A., Pour, A. B., Hezarkhani, A., Maghsoudi, A., Hashim, M., & Khakmardan, S. (2022). Fusion of Remote Sensing, Magnetometric, and Geological Data to Identify Polymetallic Mineral Potential Zones in Chakchak Region, Yazd, Iran. Remote Sensing, 14(23), 6018. https://doi.org/10.3390/rs14236018