Article

Hyperspectral Video Target Tracking Based on Deep Features with Spectral Matching Reduction and Adaptive Scale 3D Hog Features

1
School of Physics, Xidian University, Xi’an 710071, China
2
School of Electronics and Information Engineering, Wuxi University, Wuxi 214105, China
3
School of Electronics and Information Engineering, Nanjing University of Information Science and Technology, Nanjing 210044, China
4
Computer Science and Engineering Group, Indian Institute of Information Technology, Sri City 441108, India
5
School of Artificial Intelligence and Computer, Jiangnan University, Wuxi 214122, China
*
Author to whom correspondence should be addressed.
Remote Sens. 2022, 14(23), 5958; https://doi.org/10.3390/rs14235958
Submission received: 8 October 2022 / Revised: 20 November 2022 / Accepted: 22 November 2022 / Published: 24 November 2022
(This article belongs to the Special Issue Hyperspectral Object Tracking)

Abstract

:
Hyperspectral video target tracking is generally challenging when the scale of the target varies. In this paper, a novel algorithm is proposed to address the challenges prevalent in the existing hyperspectral video target tracking approaches. The proposed approach employs deep features along with spectral matching reduction and adaptive-scale 3D hog features to track the objects even when the scale is varying. Spectral matching reduction is adopted to estimate the spectral curve of the selected target region using a weighted combination of the global and local spectral curves. In addition to the deep features, adaptive-scale 3D hog features are extracted using cube-level features at three different scales. The four weak response maps thus obtained are then combined using adaptive weights to yield a strong response map. Finally, the region proposal module is utilized to estimate the target box. The proposed strategies make the approach robust against scale variations of the target. A comparative study on different hyperspectral video sequences illustrate the superior performance of the proposed algorithm as compared to the state-of-the-art approaches.

Graphical Abstract

1. Introduction

Target tracking is widely explored in the field of computer vision for many applications including passive reconnaissance, security monitoring, and autonomous driving [1,2,3,4]. Generally, the purpose of target tracking is to manually select the target determined by groundtruth in the first frame and then successively track it in each subsequent frame, where the groundtruth is a rectangle area in space which is marked in advance to determine the tracking target and the target is an object that we are interested in. Most of the existing tracking algorithms, developed for grayscale or RGB videos, are not able to distinguish the targets and backgrounds having similar color features [5]. Additionally, the non-directional movement of a target changes its scale, which makes the tracking task more difficult [6].
Hyperspectral Images (HSIs) [7], defined as images with hundreds or thousands of narrower bands (10–20 nm), have rich spectral information while maintaining the spatial features, which facilitates the discrimination of even the objects having similar RGB or gray scale color features. HSIs have two dimensions to index the spatial location and the third dimension to index the spectral band. In this regard, HSIs are being widely used in the field of remote sensing [8] and computer vision [9]. However, the difficulty in obtaining HSI videos using traditional devices have limited the applicability of HSI video-based target tracking. Recent advances in the hyperspectral imaging technology have enabled the capturing of hyperspectral videos (HSV) at a high frame rate. Therefore, HSI data are beginning to be used to improve tracking performance due to its rich spectral information. The Histogram of Gradient (HOG) features, widely used for Kernelized Correlation Filters (KCF), do not give acceptable results for the targets with scale variations. In addition, the huge data volume of HSIs increases the computational complexity of the video trackers.
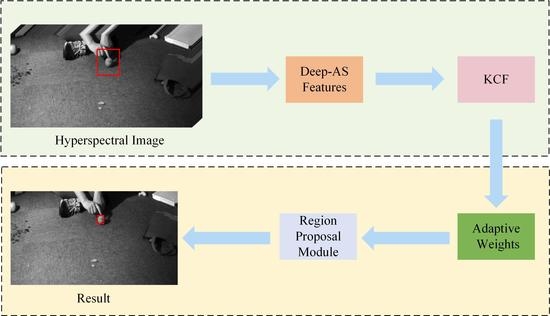
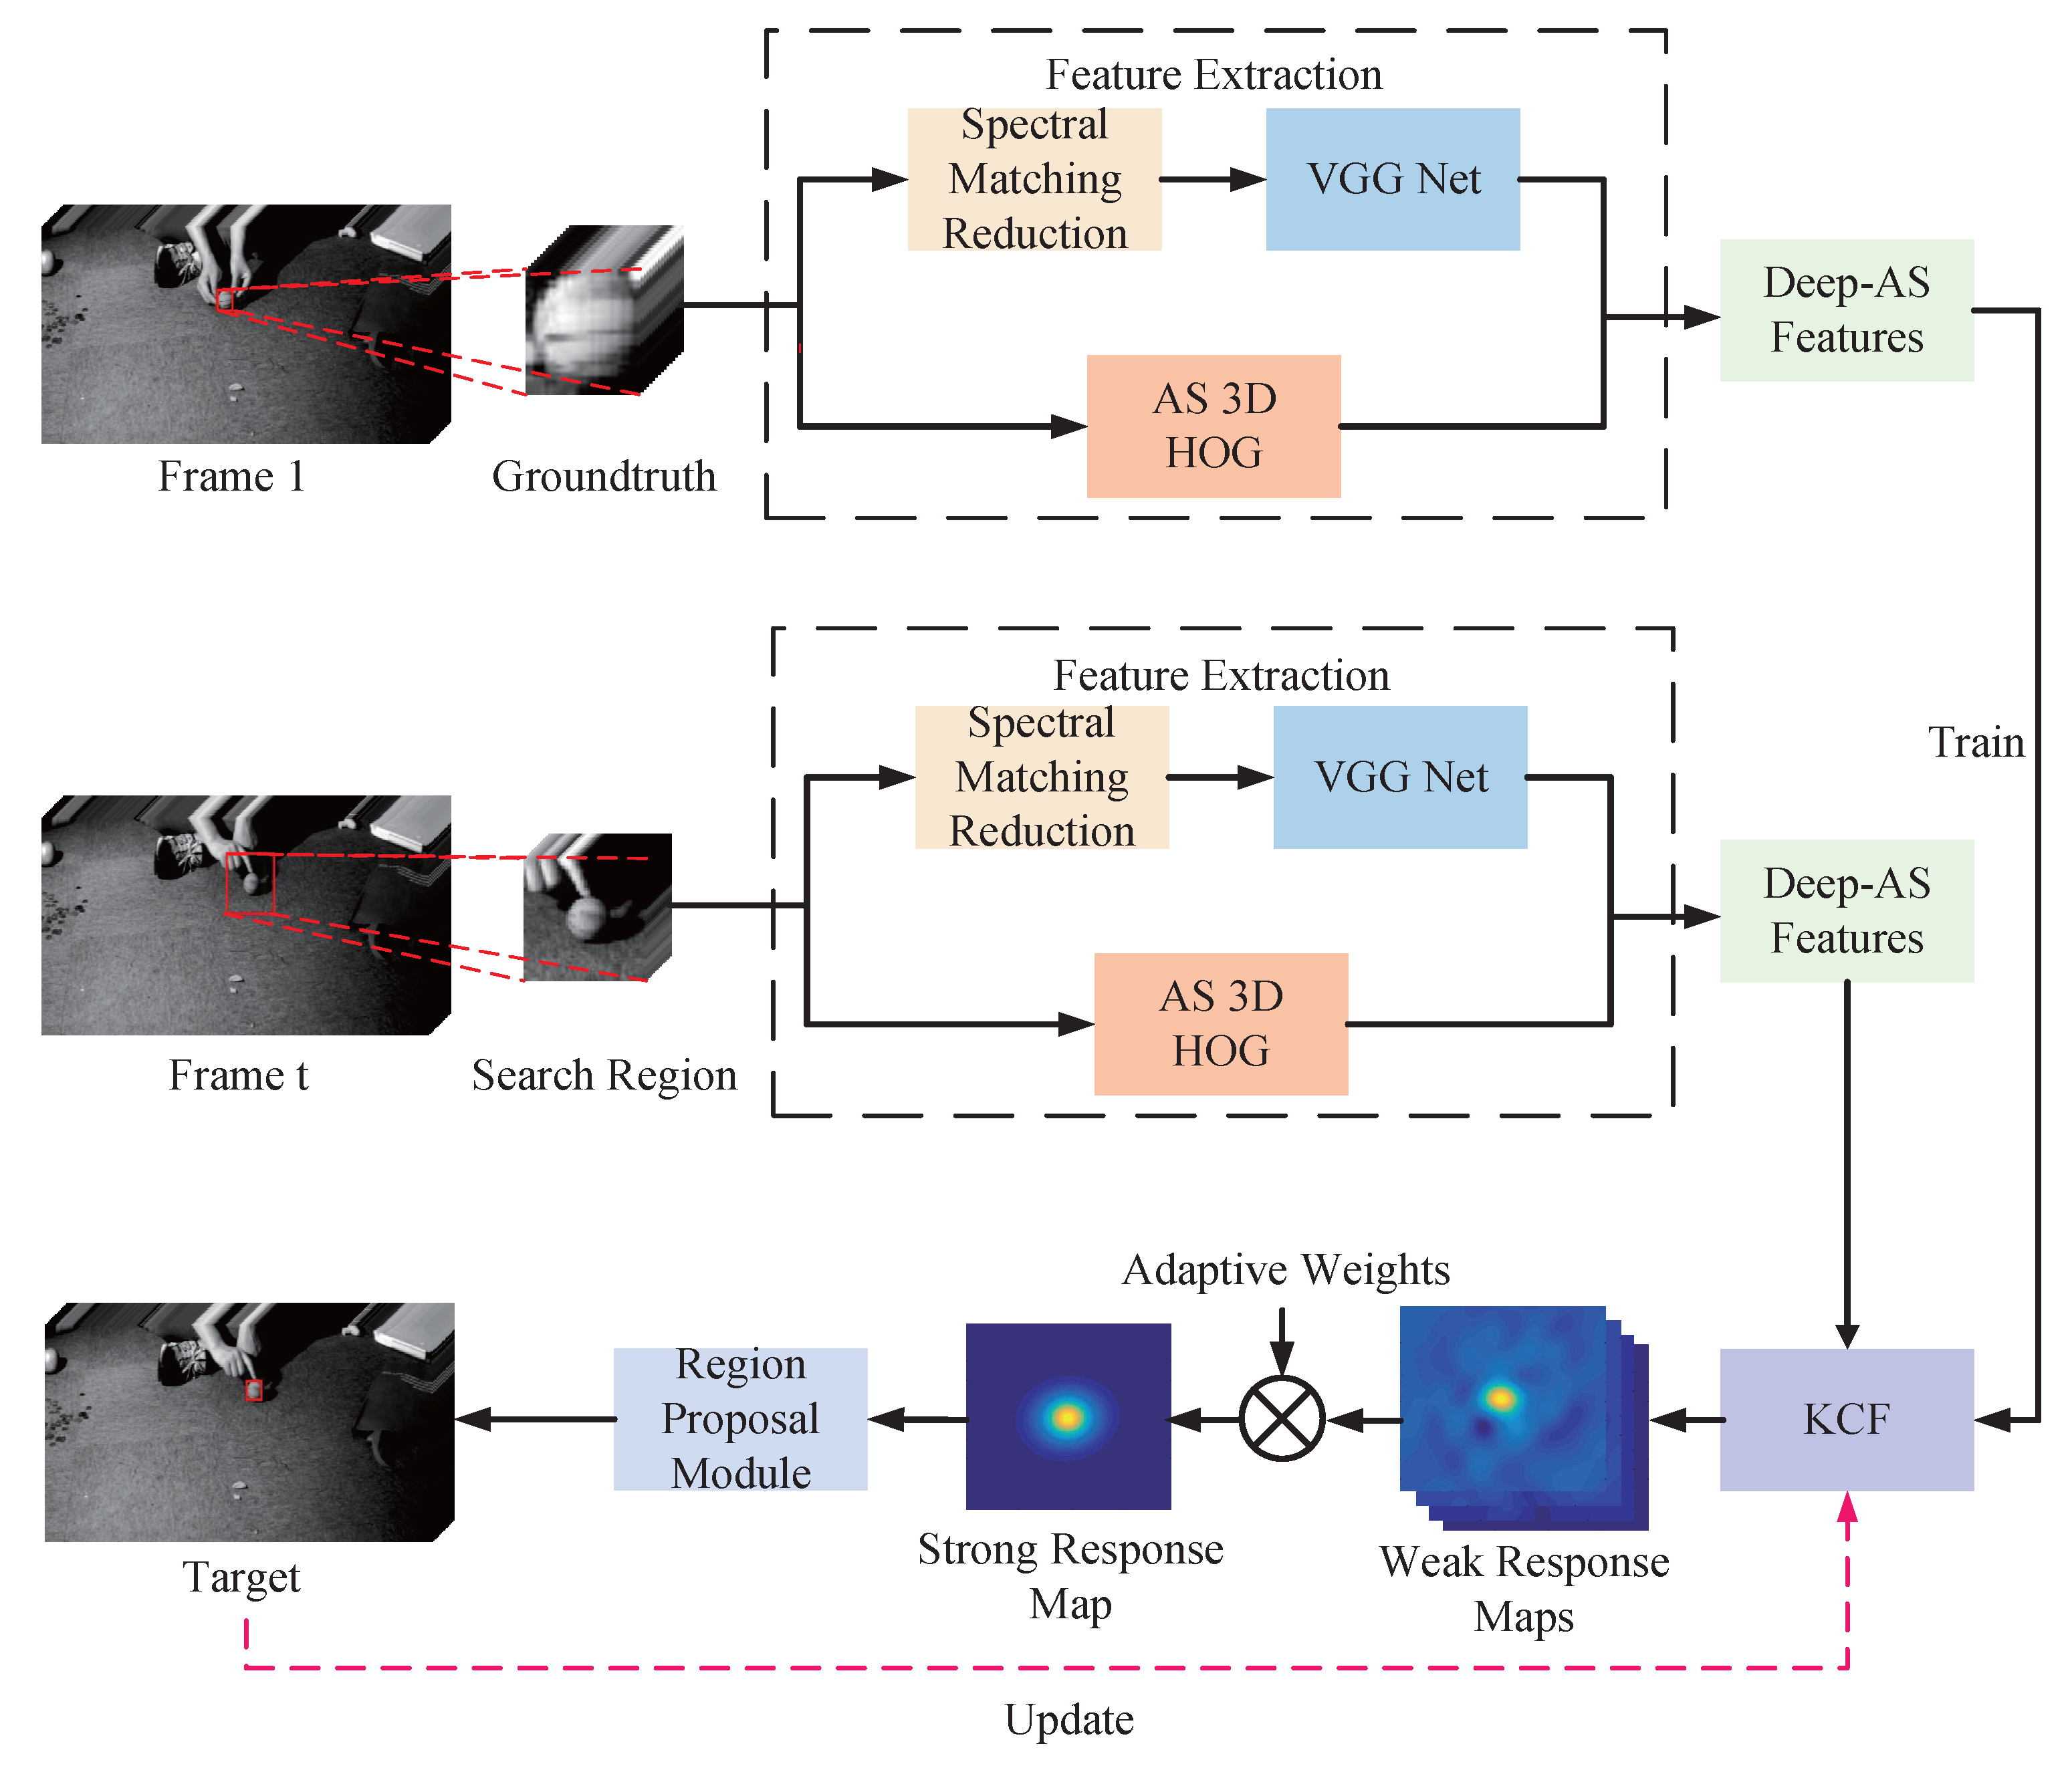
In this paper, a Deep and Adaptive-scale Hyperspectral Video Tracker (DA-HVT) based on deep features transformed with spectral matching reduction and adaptive-scale 3D Hog features is proposed. Similar to the traditional trackers, the proposed algorithm constitutes three modules, namely, the feature extraction, matching, and regression modules. The feature extraction module facilitates the separation of the objects from backgrounds, while the matching module locates the position of the target. The regression module estimates the size of the target box. It may be noted that the feature extraction module transforms the hypercube frames to a more discriminative feature space composed of the deep and adaptive-scale (Deep-AS) feature. The Deep-AS features are the deep features, transformed using spectral matching reduction, along with the adaptive-scale 3D histogram of gradient (AS 3D HOG) features. In the matching module, the basic KCF is used to obtain four weak response maps, and then adaptive weights are utilized to fuse weak response maps to locate the target. In the regression module, a region proposal model (RPM) is used to adapt to the aspect ratio variation of the moving targets. Real hyperspectral videos, obtained via a hyperspectral camera of 16 bands with wavelength from 470 nm to 620 nm, are used to evaluate the proposed tracker algorithm. The model of camera used is a snapshot VIS produced by IMEC, and the bandwidth used for each band is about 10 nm.
The main contributions of this paper are summarized as follows:
  • A spectral matching reduction method is proposed to reduce the dimensionality of the HSI. The proposed method estimates the final spectral curve using the global and local spectral curves. The dimensionality-reduced image is obtained by computing the similarity between final spectral curve, and the spectral curve of each pixel of original image. This approach makes the target more distinguishable from the background and is helpful for subsequent target tracking;
  • An AS 3D HOG feature is proposed to extract the 3D HOG features at different scales. The proposed approach ensures robustness against the scale variations of the target while maintaining the original spectral discrimination ability;
  • A weighted fusion strategy of feature maps is proposed in which the adaptive weighting coefficients are computed using peak-to-side lobe ratio in the time domain;
  • Inspired by Region Proposal Network (RPN), a novel target box estimation method, named RPM, is proposed. The proposed RPM method can adaptively change the aspect ratio of target box to obtain more accurate box estimation.
The rest of this paper is organized as follows. In Section 2, related work is given. In Section 3, the proposed algorithm is described in detail. In addition, Section 4 presents the experimental results of the proposed algorithm on the hyperspectral videos. Finally, the conclusion is discussed in Section 5.

2. Related Works

Dimension Reduction. Literature reports two classes of approaches for dimensionality reduction, namely, band selection and feature extraction. Band Selection methods [10,11,12] select the most representative bands from the original bands, which makes the low dimensional features physical significant and interpretable. Feature extraction methods calculate the optimal projection matrix to reduce the dimensionality. The Principal Component Analysis (PCA) [13] is a classic and widely used feature extraction method which constructs a projection matrix by maximizing the data variance. Independent Component Analysis (ICA) [14], another frequently used dimensionality reduction technique, simultaneously estimates the spectra of different ground objects. Green et al. [15] proposed Minimum Noise Fraction Transformation (MNFT) method, which used Signal-to-Noise Ratio (SNR) to distinguish the weights of different bands. Based on these methods, kernel tricks [16,17] were also explored for the nonlinear extraction of features. Rasti et al. [18] introduced the Orthogonal Total Variation Component Analysis (OTVCA) method to estimate the best low-dimensional representation by optimizing a non-convex loss function. With the advent of the recent technologies, supervised methods [19,20] and deep-learning-based methods [21,22] are also being widely used for dimensionality reduction.
Correlation Filter-based Trackers. Generally, most of the existing correlation filter-based trackers are first trained with the image patch of the target in the first frame. Different features are then extracted from the search area in the subsequent frames, and the target position is finally determined by the convolution operation of these filters and features. Discriminative Correlation Filter (DCF)-based frameworks have gained much attention because of their performance and computational efficiency. It may be noted that in the DCF-based trackers, filters are trained in the frequency domain. A correlation filter learns to localize the target in the consecutive frames while the target location is estimated based on the maximum response. Bolme et al. [23] introduced the Minimum Output Sum of Squared Error Filter (MOSSE) tracker using grayscale features. In addition, many other features are also used to improve the tracking robustness, including HOG [24], color name features [25], and convolution features [26]. Henriques et al. [24] introduced the kernel trick into a tracking framework, named the KCF, which improved the tracking performance by shifting the training samples. Zhang et al. [27] proposed the Spatial-Temporal Context (STC) using probability theory and is similar to the correlation filter approach.
The ensemble-based approaches [28] are also used to enhance the robustness of the tracking algorithms. Bailer [29] proposed a dynamic programming-based trajectory optimization approach to build a robust tracker. MEEM [30] exploited the relationship between the current tracker and historical snapshots. Khalid et al. [31] proposed a partition fusion framework to build a reliable tracker. Ning et al. [32] introduced an evaluation strategy to select the best from a pool of experts.
Recently, some researchers have begun to study target tracking algorithms based on hyperspectral videos. Qian et al. [26] selected input image patches as convolutional kernels to extract features, but the correlations among bands were neglected. Xiong et al. [33] extract features using material information, but it is difficult to ensure that each frame has the same unmixing result. Chen et al. [34] extracted spatial-spectral features in Fourier transform domain using a real-time spatial-spectral convolutional kernel, which sped up the hyperspectral video tracking algorithm. Chen et al. [35] tried to directly extract reliable feature using the value differences between pixels from hyperspectral image and achieved a better result.
Target Box Estimation. Most of the traditional target box estimation methods are scale-based [36,37,38]. They generally build search areas using different scales and select the maximum response size as the final target size. However, all these trackers maintain a fixed aspect ratio, which deteriorate the tracking performance. Recently, the advent of and subsequent improvements to deep learning approaches have resulted in some deep-learning-based target box estimation methods [39,40,41,42,43,44]. SiameseRPN-based trackers [39,40] use a Region Proposal Network (RPN) as the core module to estimate the target size. Mask-based trackers [41,42] predict the mask instead of the box to obtain higher precision. Although these methods showed better performance than the traditional target box estimation methods, it is difficult to apply them to the correlation-filter-based trackers. Recently, some state-of-the-art trackers [45,46,47] adopted the refinement module to obtain more accurate estimates. These methods locate the target first and refine the target size using the previous results.

3. Proposed Method

In this section, the details of the proposed algorithm are presented. The overall framework is shown in Figure 1.
In the overall process, the feature extraction module contains two kinds of features, namely, deep features and shallow features. Due to the lack of hyperspectral datasets, it is difficult to train a robust deep neural network to extract deep features. Therefore, dimensionality reduction and a pre-trained VGG-19 network [48] are used. Deep features have a strong ability to distinguish large targets; however, they are not effective for small targets due to the large receptive field. Therefore, AS 3D HOG features are used for shallow features to improve the discrimination of small targets. After obtaining the deep-AS features, KCF trackers are utilized to obtain weak response maps for the features of each channel. Adaptive weights, calculated using the peak side lobe ratio (PSLR) and integral side lobe ratio (ISLR), are utilized to fuse weak response maps to locate the target. In addition, a region proposal module is used to estimate the target scale. The spectral matching reduction method is described in Section 3.1. In Section 3.2, the extraction methods of both the features are introduced. The basic KCF is briefly introduced in Section 3.3. In Section 3.4 and Section 3.5, the approach for predicting the target area, including the target localization and scale estimation, are discussed.

3.1. Spectral Matching Reduction

Generally, the input of a pre-trained VGG-19 network is either a gray-scale (1 band) or an RGB image (3 bands). However, the input test sequences used in this study have sixteen bands. Therefore, spectral matching reduction (SMR) is adopted to reduce the dimensionality of the inputs to match the requirements of VGG-19.
To ensure the spectral fidelity of the dimensionality reduction result, two spectral curves, namely, global and local spectral curves, are extracted to represent the target spectral curve.
We denote T t R B × H T × W T and S t + 1 R B × H S × W S as the target area from the frame t and the search area in frame ( t + 1 ) , respectively. More specifically, the target area is regarded as the groundtruth in the first frame and the result of the previous frame in the other frames, where the groundtruth is provided from the author of the dataset and the result of the previous frame is estimated by the tracker. The search area is a larger rectangle region with the same center as the target area, and it is assumed that the target will appear in the search area only, which varies with the variation in the target area. The global spectral curve is calculated by averaging T t as:
C g = C g i C g i = M ( T i t ) i 1 , , B
where C g denotes the global spectral curve, B is the number of hyperspectral camera’s bands (16 in our experiments due to the hyperspectral data), T i t denotes the i-th band in T t , and M ( · ) represents the averaging function given as:
M T i t = 1 H T × W T × j = 1 H T × W T T i j t
where T i j t denotes the j-th pixel of T i t , and H T and W T are the height and width of T t , respectively.
It is worth noting that due to the irregularity of the target shape, the background information will be captured in T t . Along with the background information, the local target spectral curve is also necessary for tracking, and the same is extracted using a statistical method.
Each T i t is divided in n r bins according to the pixel values and is described as:
B n ( i , j ) = floor ( n r × T i j t ) mod n r
where B n ( i , j ) denotes the index of bins of each pixels, and floor ( · ) is the round down operation. The number of bins n r influences the accuracy and speed of local area division. The larger the n r is, the more accurate the obtained result is, but the longer time is consumed in its calculation. Through experiments, n r is set to 10.
Based on such quantization, we can define the intensity feature F I ( i , j ) and number feature F N ( i , j ) as:
F I ( i , j ) b = T i j t if b = B n ( i , j ) 0 otherwise
F N ( i , j ) b = 1 if b = B n ( i , j ) 0 otherwise
where b indexes the spectral intensity range. Both the features are summed up across the same band as:
F I ( i ) b = F I ( i , j ) b
F N ( i ) b = F N ( i , j ) b
As the target occupies the vast majority of T t , the maximum index of F N ( i ) is computed as:
b ( i ) m = max b F N ( i ) b
where b ( i ) m denotes the index of the i bands, having the most concentrated scope, which can be regarded as the spectral intensity range of the target. Therefore, the local spectral curve is estimated as:
C l = C l i C l i = F I ( i ) b ( i ) m F N ( i ) b ( i ) m i 1 , , B
where C l denotes the local spectral curve.
C g and C l are fused using:
C f = μ r × C g + ( 1 μ r ) × C l
where C f denotes the final spectral curve, μ r is the weight coefficient of C g , and 1 μ r is the weight coefficient of C l . The range of μ r is from 0 to 1. The larger μ r is, the greater the contribution of C g on C f is, the smaller 1 μ r is, and the less contribution of C l has on C f is. Through a large amount of experiments, μ r is set to 0.3 in our experiments, which means C l has a greater contribution to obtaining C f . The dimensionality reduction in the spectral curve is obtained by calculating the naive correlation between S t + 1 and C f as:
X d r = C f S t + 1
where X d r is the dimensionality reduction result and ⊗ denotes the naive correlation.
Figure 2 shows the process of our dimension reduction method. Figure 2a is the original image S t + 1 , which has B bands. Figure 2b–d illustrate the global spectral curve, local spectral curve, and final spectral curve, respectively. In Figure 2b–d, the x-axis represents band indices and shows different peak wavelengths, and the y-axis represents spectral reflectance. Spectral reflectance is obtained from the pixel value of input images. Among these three curves, the global spectral curve is calculated using the target area, as it contains a large amount of target information and some background information due to the irregularity of the tracking target. Then, the local spectral curve is obtained by a histogram operation on the target area of each band image, and this curve contains incomplete target information. These two curves vary with the variation in target area. At last, a final spectral curve is obtained by fusing the above two curves to find a complete representation of the target. It can be seen that the final spectral curve has a lot of differences from the global spectral curve in the twelfth band. It is most similar to the local spectral curve because there is no background information in these two curves. However, the final spectral curve is also different from the local spectral curve in the tenth band because the information in the latter one is incomplete. Figure 2e is the spectral matching reduction result. It is obvious that the target is highlighted well and that the background is effectively suppressed, which helps extract distinguishing features.

3.2. Feature Extraction

According to the existing literature [28], the correlation filter-based trackers, which use a single feature, have the problem of drift or even failure during the tracking process. In fact, the robustness and tracking accuracy of the correlation filter-based trackers in the current complex environments are not satisfactory. Therefore, we combine the deep features and AS 3D HOG features to achieve stable target tracking.

3.2.1. Deep Features

A pre-trained VGG-19 network, which has 16 convolution layers and 3 fully connected layers, is used to extract the deep features. Compared with AlexNet [49], the biggest characteristic of the VGG networks is the stacking of neural networks using 3 × 3 convolution kernels. This characteristic increases the depth of the entire neural network and effectively improves the performance of the network.
In convolutional neural networks, low-level features mean the features extracted from the first few layers of the convolutional neural network, and high-level features mean the features extracted from the latter layers. It is found that the high-level features are rich in semantic information and can improve the robustness of tracking but are insufficient. In the context of similarity, semantic information may lead to instantaneous drift or the prediction of incorrect locations. The detailed information from low-level features plays a great role in precisely tracking the location. However, these features can be easily influenced by the background, leading to tracking failure. Therefore, in order to take into account both the semantic information and detailed information, the conv 3-4, conv 4-4, and conv 5-4 of the VGG-19 network are used to extract deep features of the image. These three features use a ball sequence, shown in Figure 1, as the input of the VGG-19 network and are illustrated in Figure 3, Figure 4, and Figure 5, respectively.
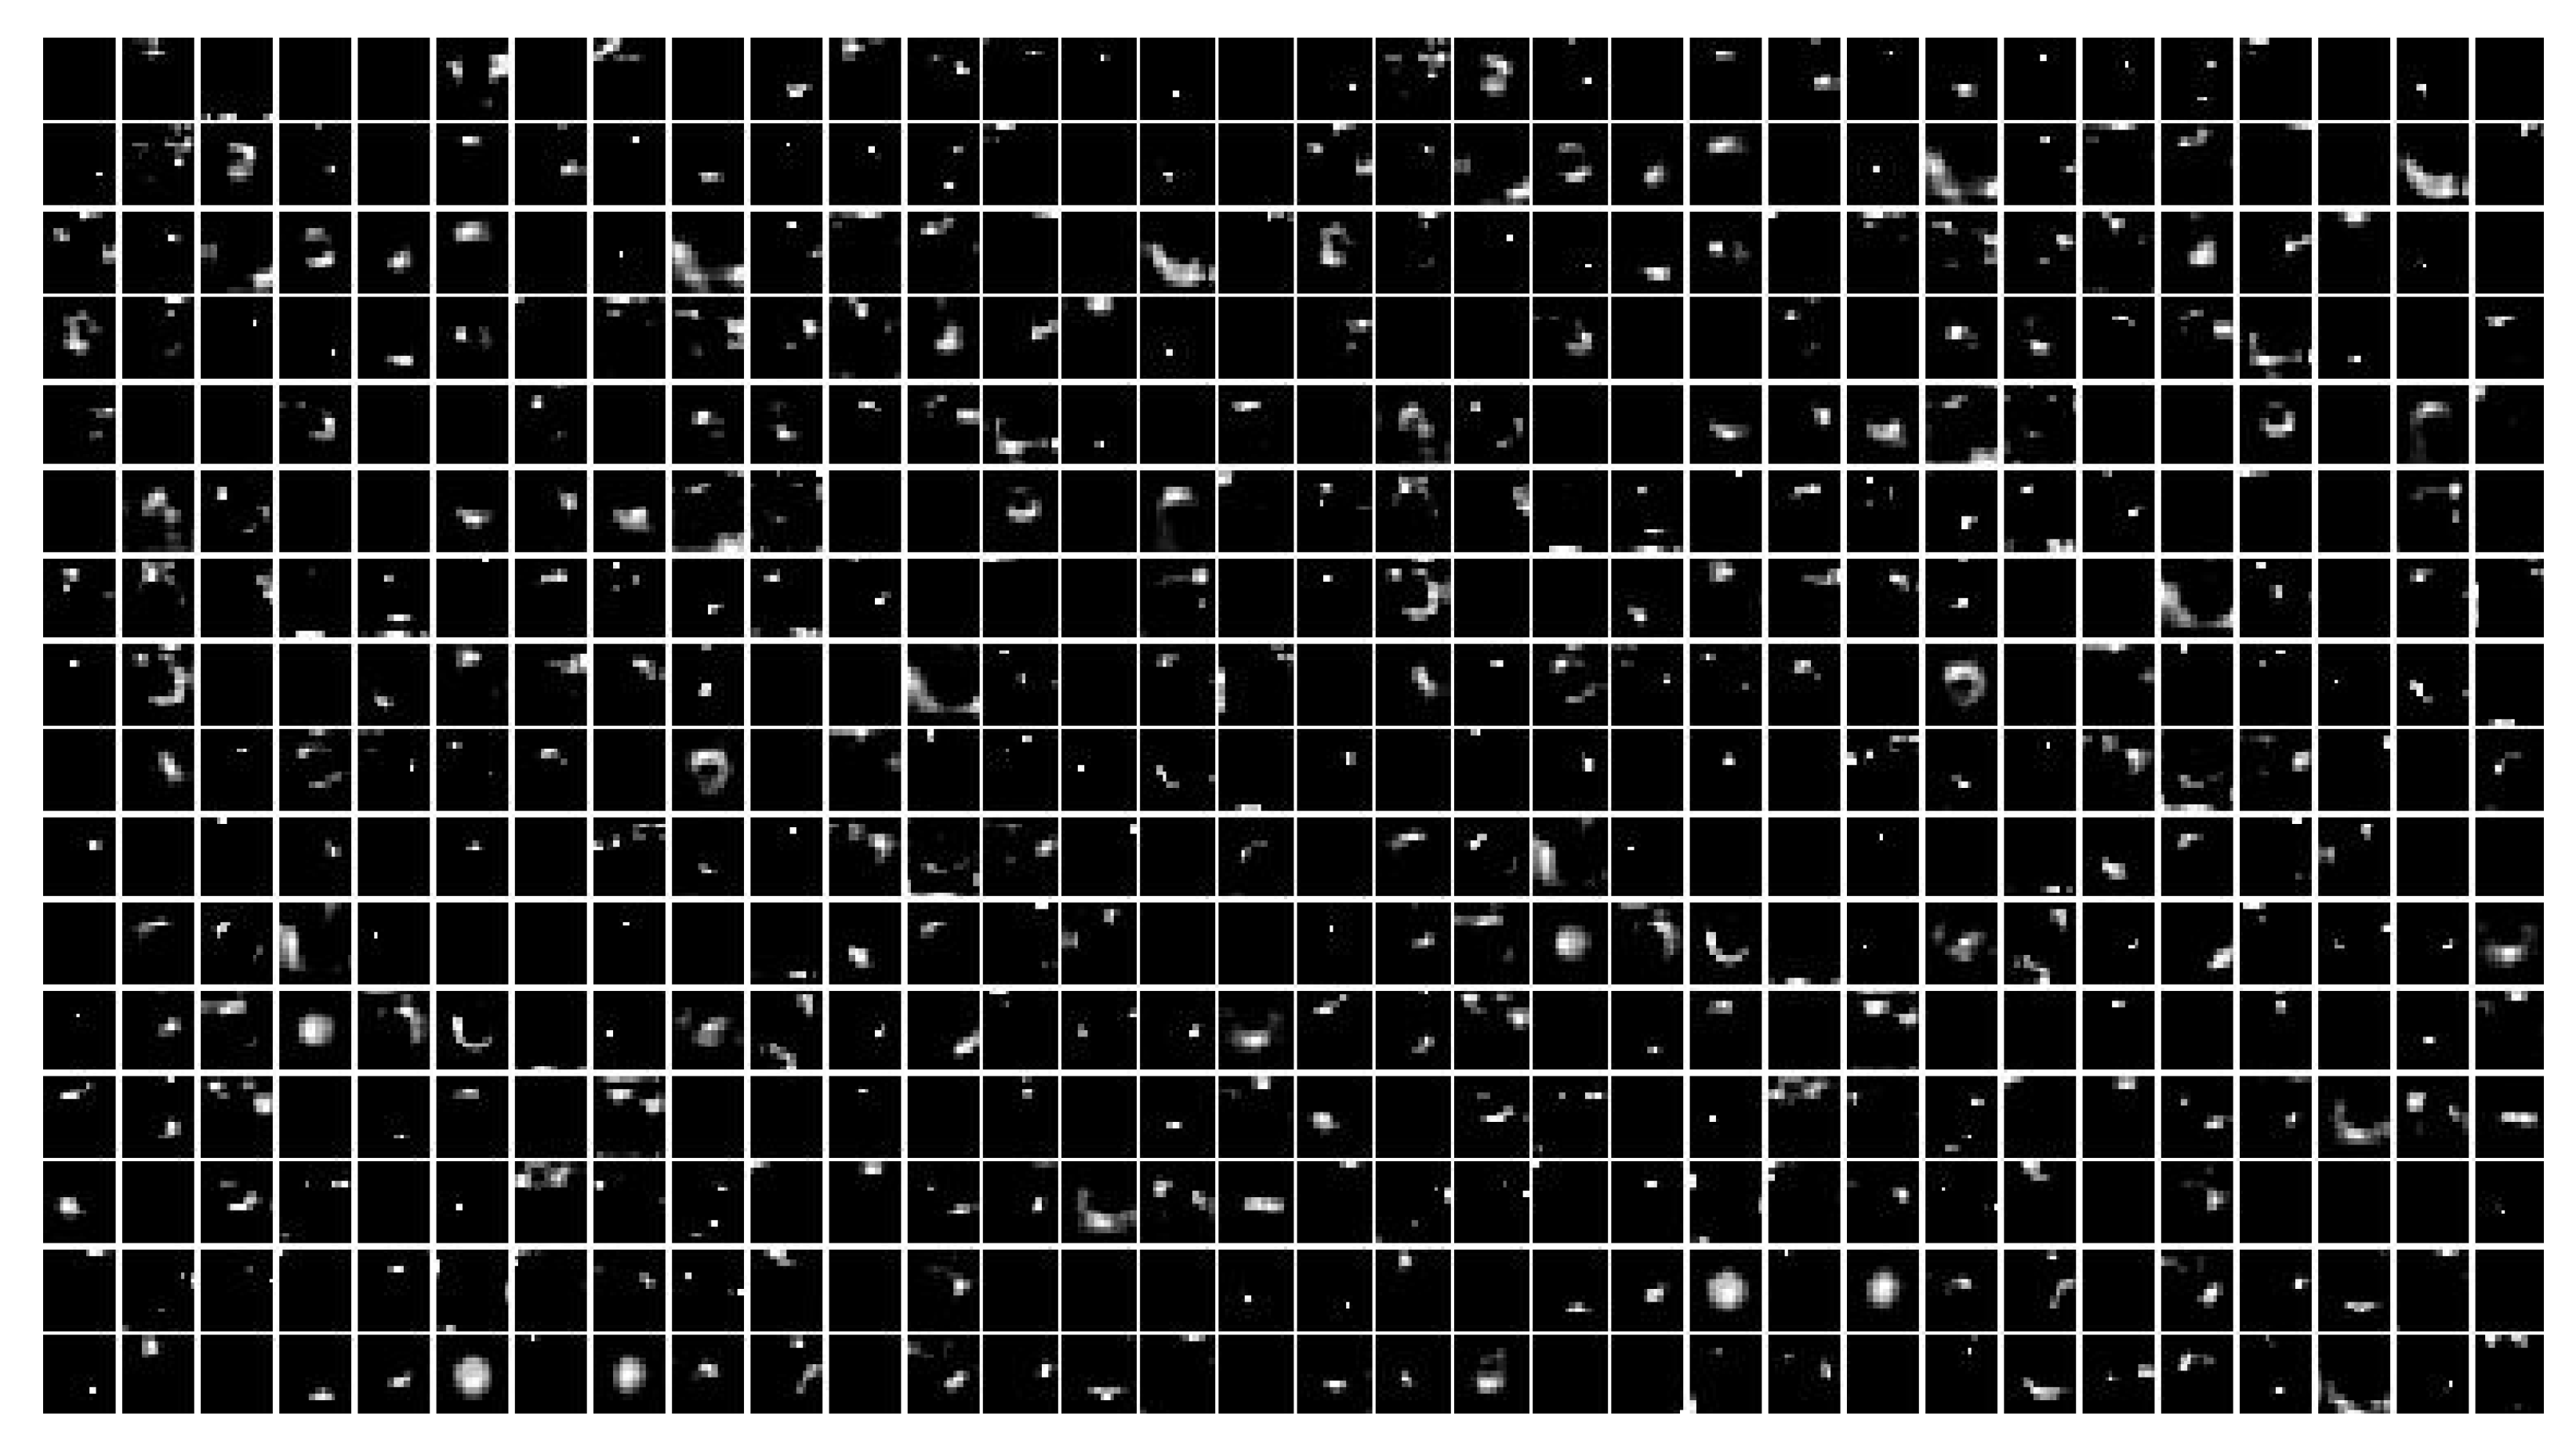
The size of the feature map output by the VGG-19 network is H × W × C , where C is the number of channels. Specifically, the size of the feature map output by the conv 3-4 layer is 56 × 56 × 256 , the size of the feature map output by the conv 4-4 layer is 28 × 28 × 512 , and the size of the feature map output by the conv 5-4 layer is 14 × 14 × 512 . To simply express these features, only the first several layers are shown. From the above three figures, it is found that the features from conv 3-4 retains more background information, the feature from conv 4-4 reduces the background and appears more abstract, and the feature from conv 5-4 is rich in semantic information, but without details.

3.2.2. AS 3D Features

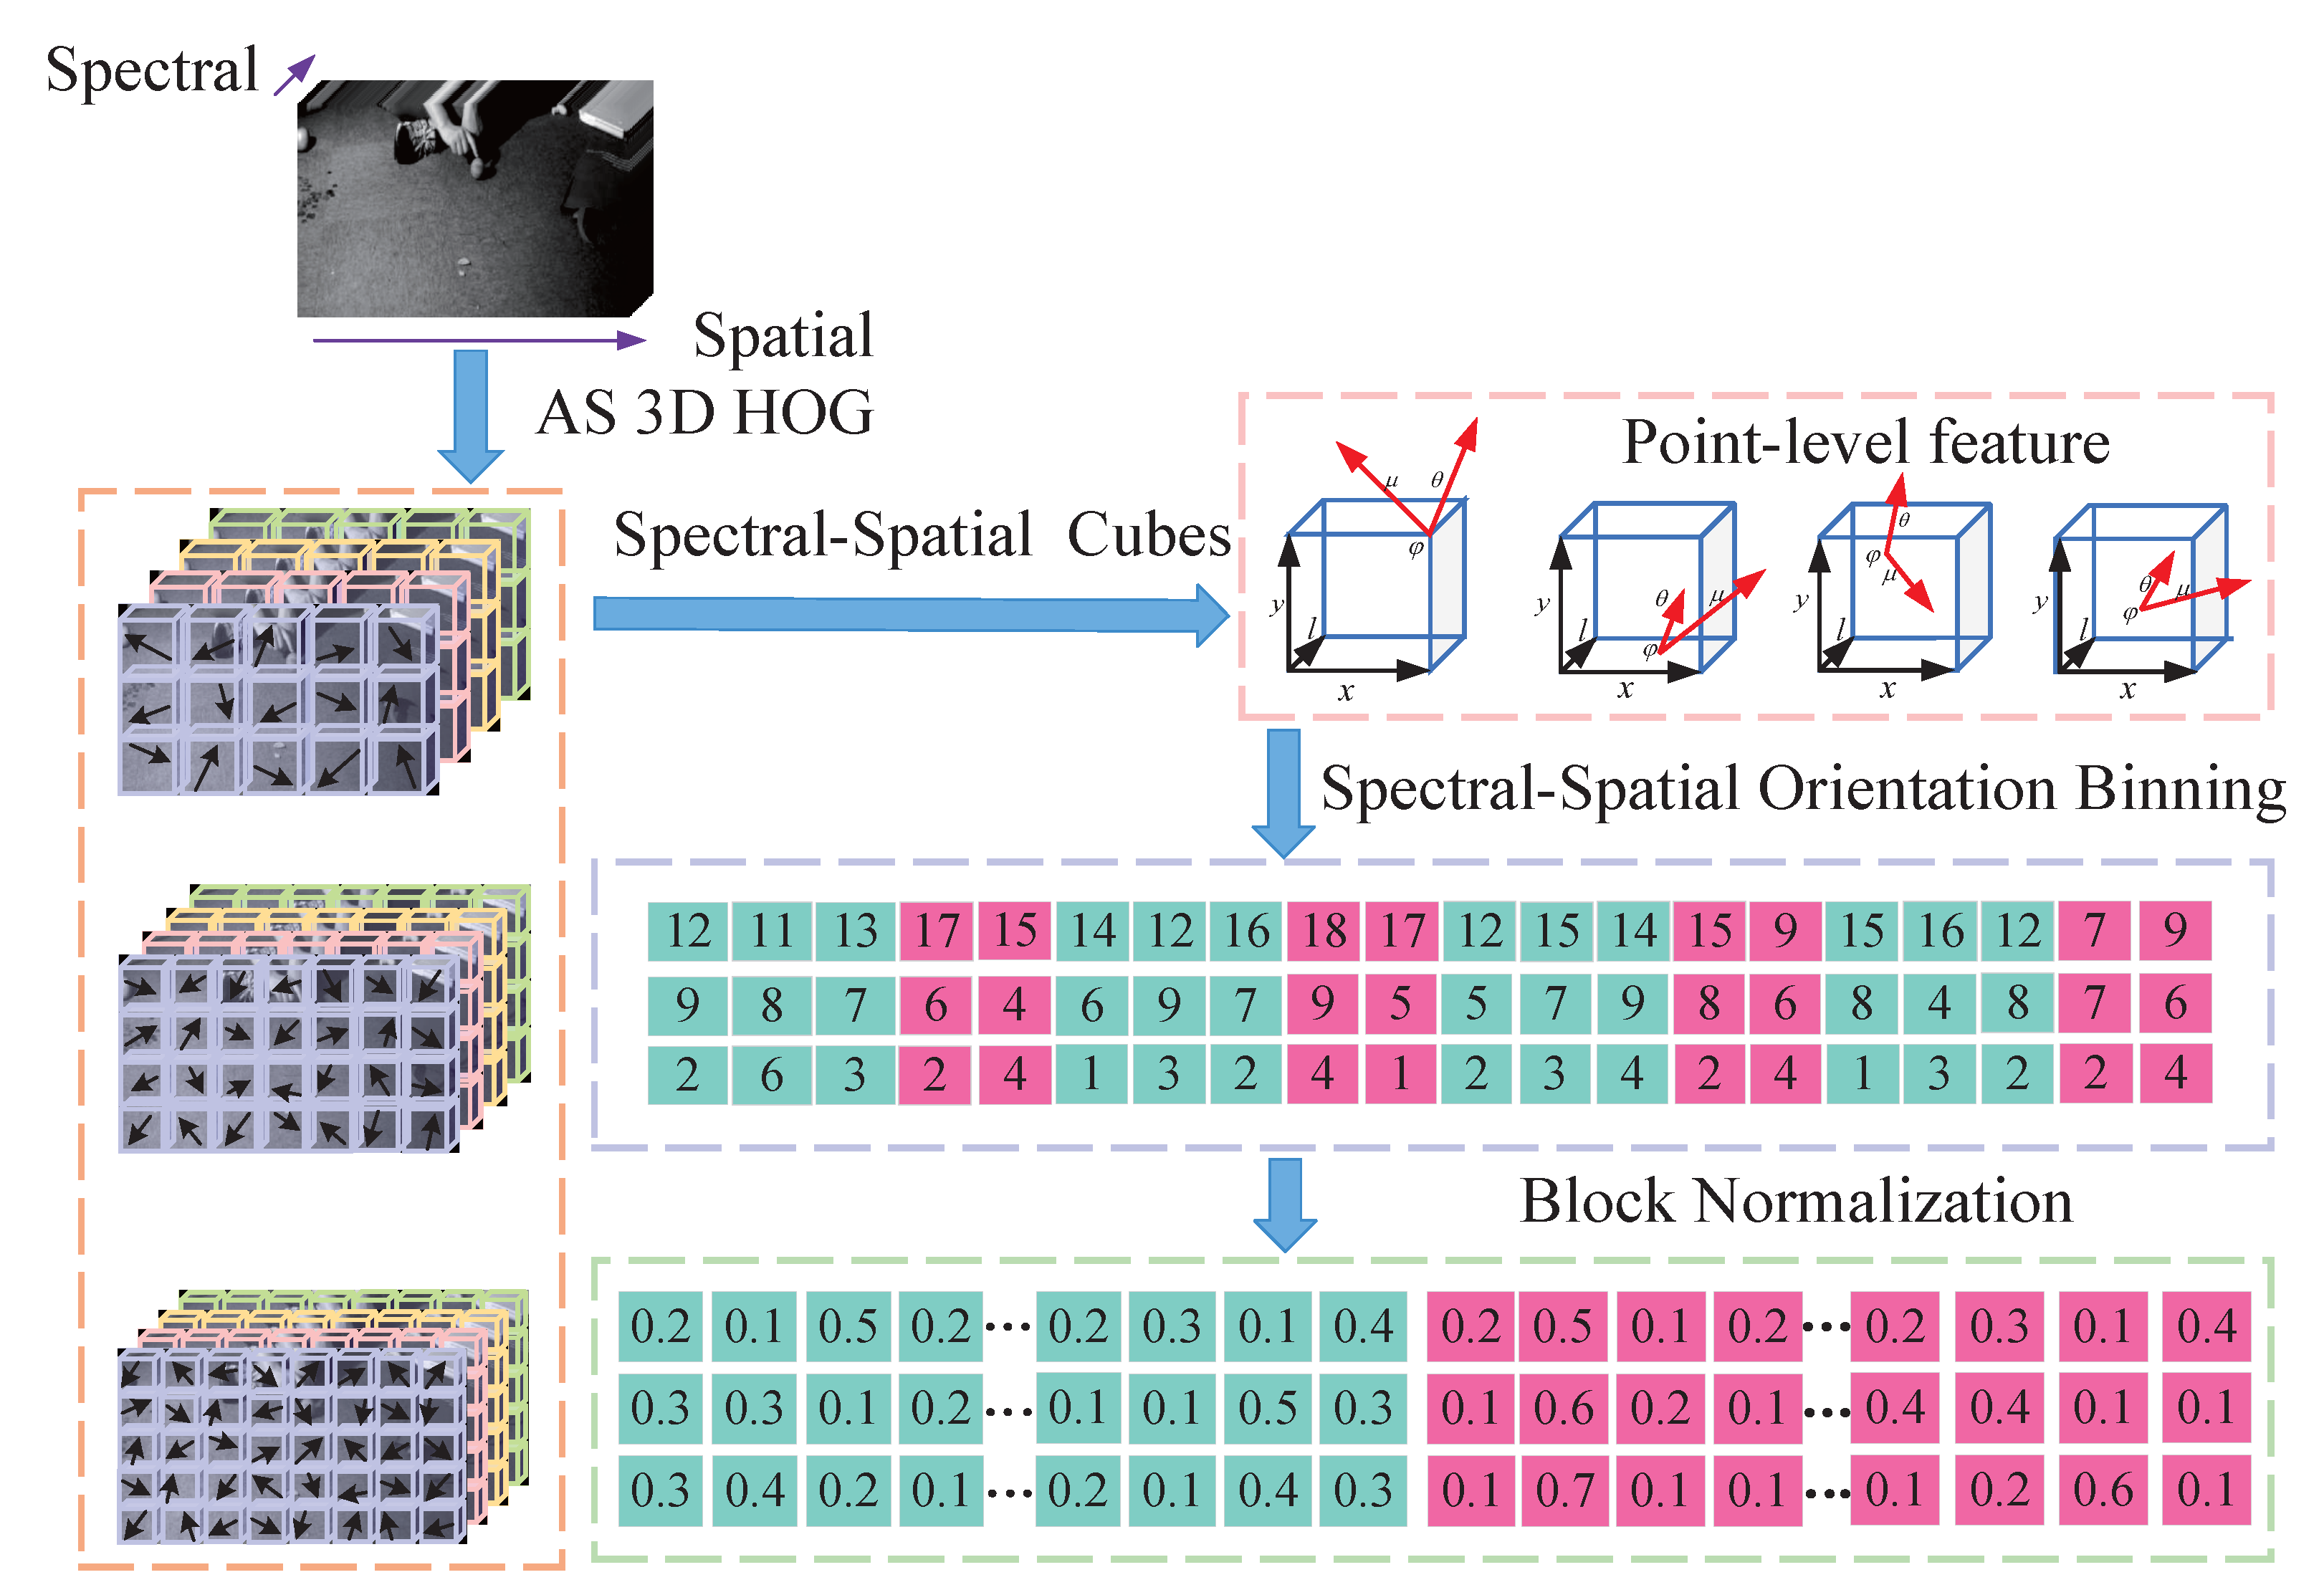
As mentioned earlier, HSI is a three-dimensional data cube that includes two spatial dimensions and one spectral dimension. The 3D HOG features are operated on the local cube element of HSI, and they maintain good invariance to the geometric and optical deformation of HSI. However, single cube partition cannot meet the tracking needs of objects of different sizes. Hence, we use multi-cube partitions of different sizes to construct our adaptive spectral-space gradient histogram features. These features are illustrated in Figure 6.
It may be noted that T x and T y represent the horizontal and vertical gradients in space, and T l represents the spectral gradients. Then, for each pixel point in a cube cell, the point can be represented by a three-dimensional vector φ , μ , θ . Here, φ represents the magnitude of the multidimensional gradient, μ represents the direction of the gradient in space, and θ represents the direction of the gradient in the spectrum. These three variables are calculated as:
φ x , y , l = T x 2 + T y 2 + T l 2
μ x , y , l = arctan T y T x
θ x , y , l = arctan T l T x 2 + T y 2
Then, the μ and θ of each points in the cube cell can be substituted in the following two equations to respectively obtain the statistics of the gradient in the spatial dimension B μ and the spectral dimension B θ :
B μ x , y , l = round n μ μ x , y , l 2 π mod n μ
B θ x , y , l = round n θ θ x , y , l π mod n θ
where n μ and n θ are the number of bins in the spatial and spectral direction, respectively.
The number of bins in the spatial and spectral directions are represented as n μ and n θ , respectively. Based on the statistics of the gradient directions, as described by the above two equations, the spatial and spectral characteristics of each pixel point in the cube, represented as F μ ( x , y , l ) and F θ ( x , y , l ) , respectively, can be computed as:
F μ ( x , y , l ) p = φ x , y , l if p = B μ ( x , y , l ) 0 otherwise
F θ ( x , y , l ) q = φ x , y , l if q = B θ ( x , y , l ) 0 otherwise
where p and q index the gradient direction of the spatial and spectral dimension, respectively. Furthermore, we accumulate the spectral and spatial features of all pixels in the cube cells in each bin to obtain the feature histogram of the cube in the spatial and spectral dimensions as:
C μ r , k , g p = F μ ( x , y , l ) p
C θ r , k , g q = F θ ( x , y , l ) q
where r, k, and g are the indices of the cube, and C μ and C θ are the cube-level histograms in the spatial and spectral dimensions, respectively.
The cube cell size is shown in Equation (21). Additionally, different cube cell sizes influence the spatial representation. Therefore, in order to maintain the robustness and accuracy of our tracker when the tracking objects are of different sizes, we use three different cube cell sizes to adaptively process such features:
C s = v × v × v s
where C s represents the size of the cube cell, v is the width and height in space, and v s denotes the number of spectral bands. Therefore, the ranges of r, k, g in Equations (19) and (20) are 0 r W S 1 v ) , 0 k H S 1 v ) , and 0 g B 1 v s ) , respectively. In our experiments, v is 4, 6, and 8, and v s is set to 4.
We combine the adjacent 2 × 2 cube elements together to form a block with a size of 2 v × 2 v × v s and then correspondingly connect the cube-level features to obtain the block-level feature h. Finally, by connecting the block-level features together in the direction of the spectrum, we can obtain the proposed AS 3D HOG.
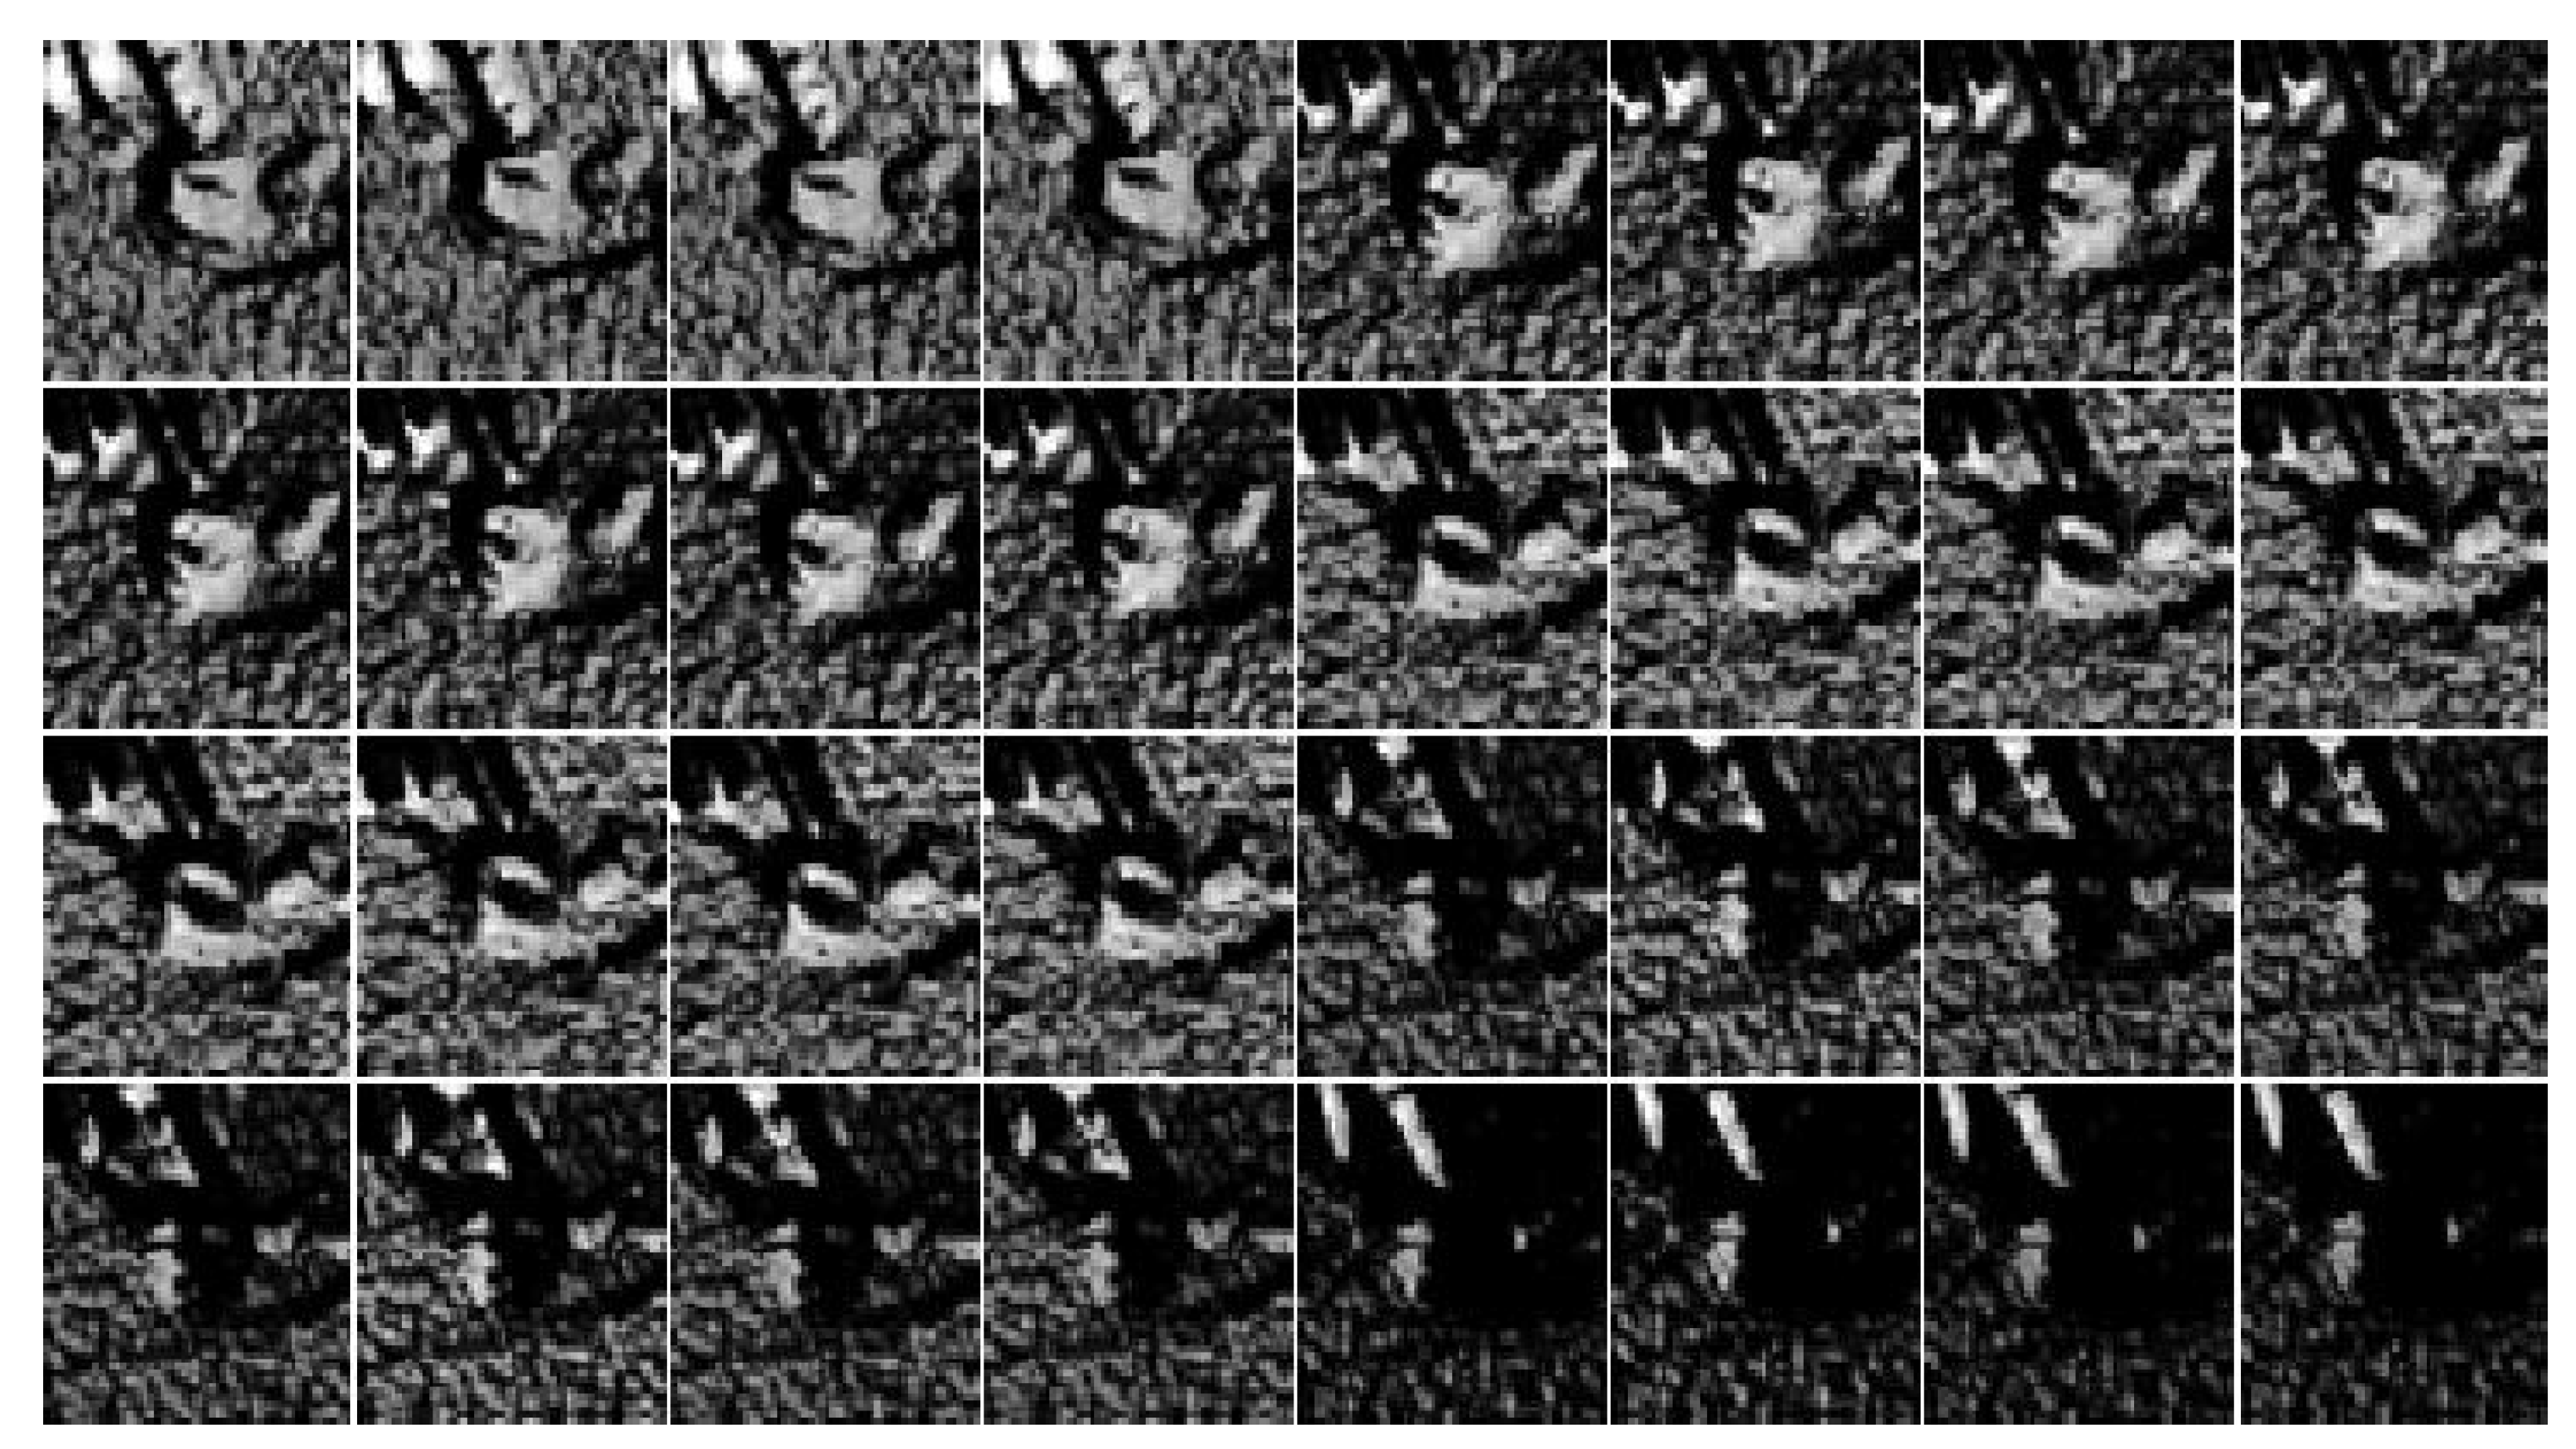
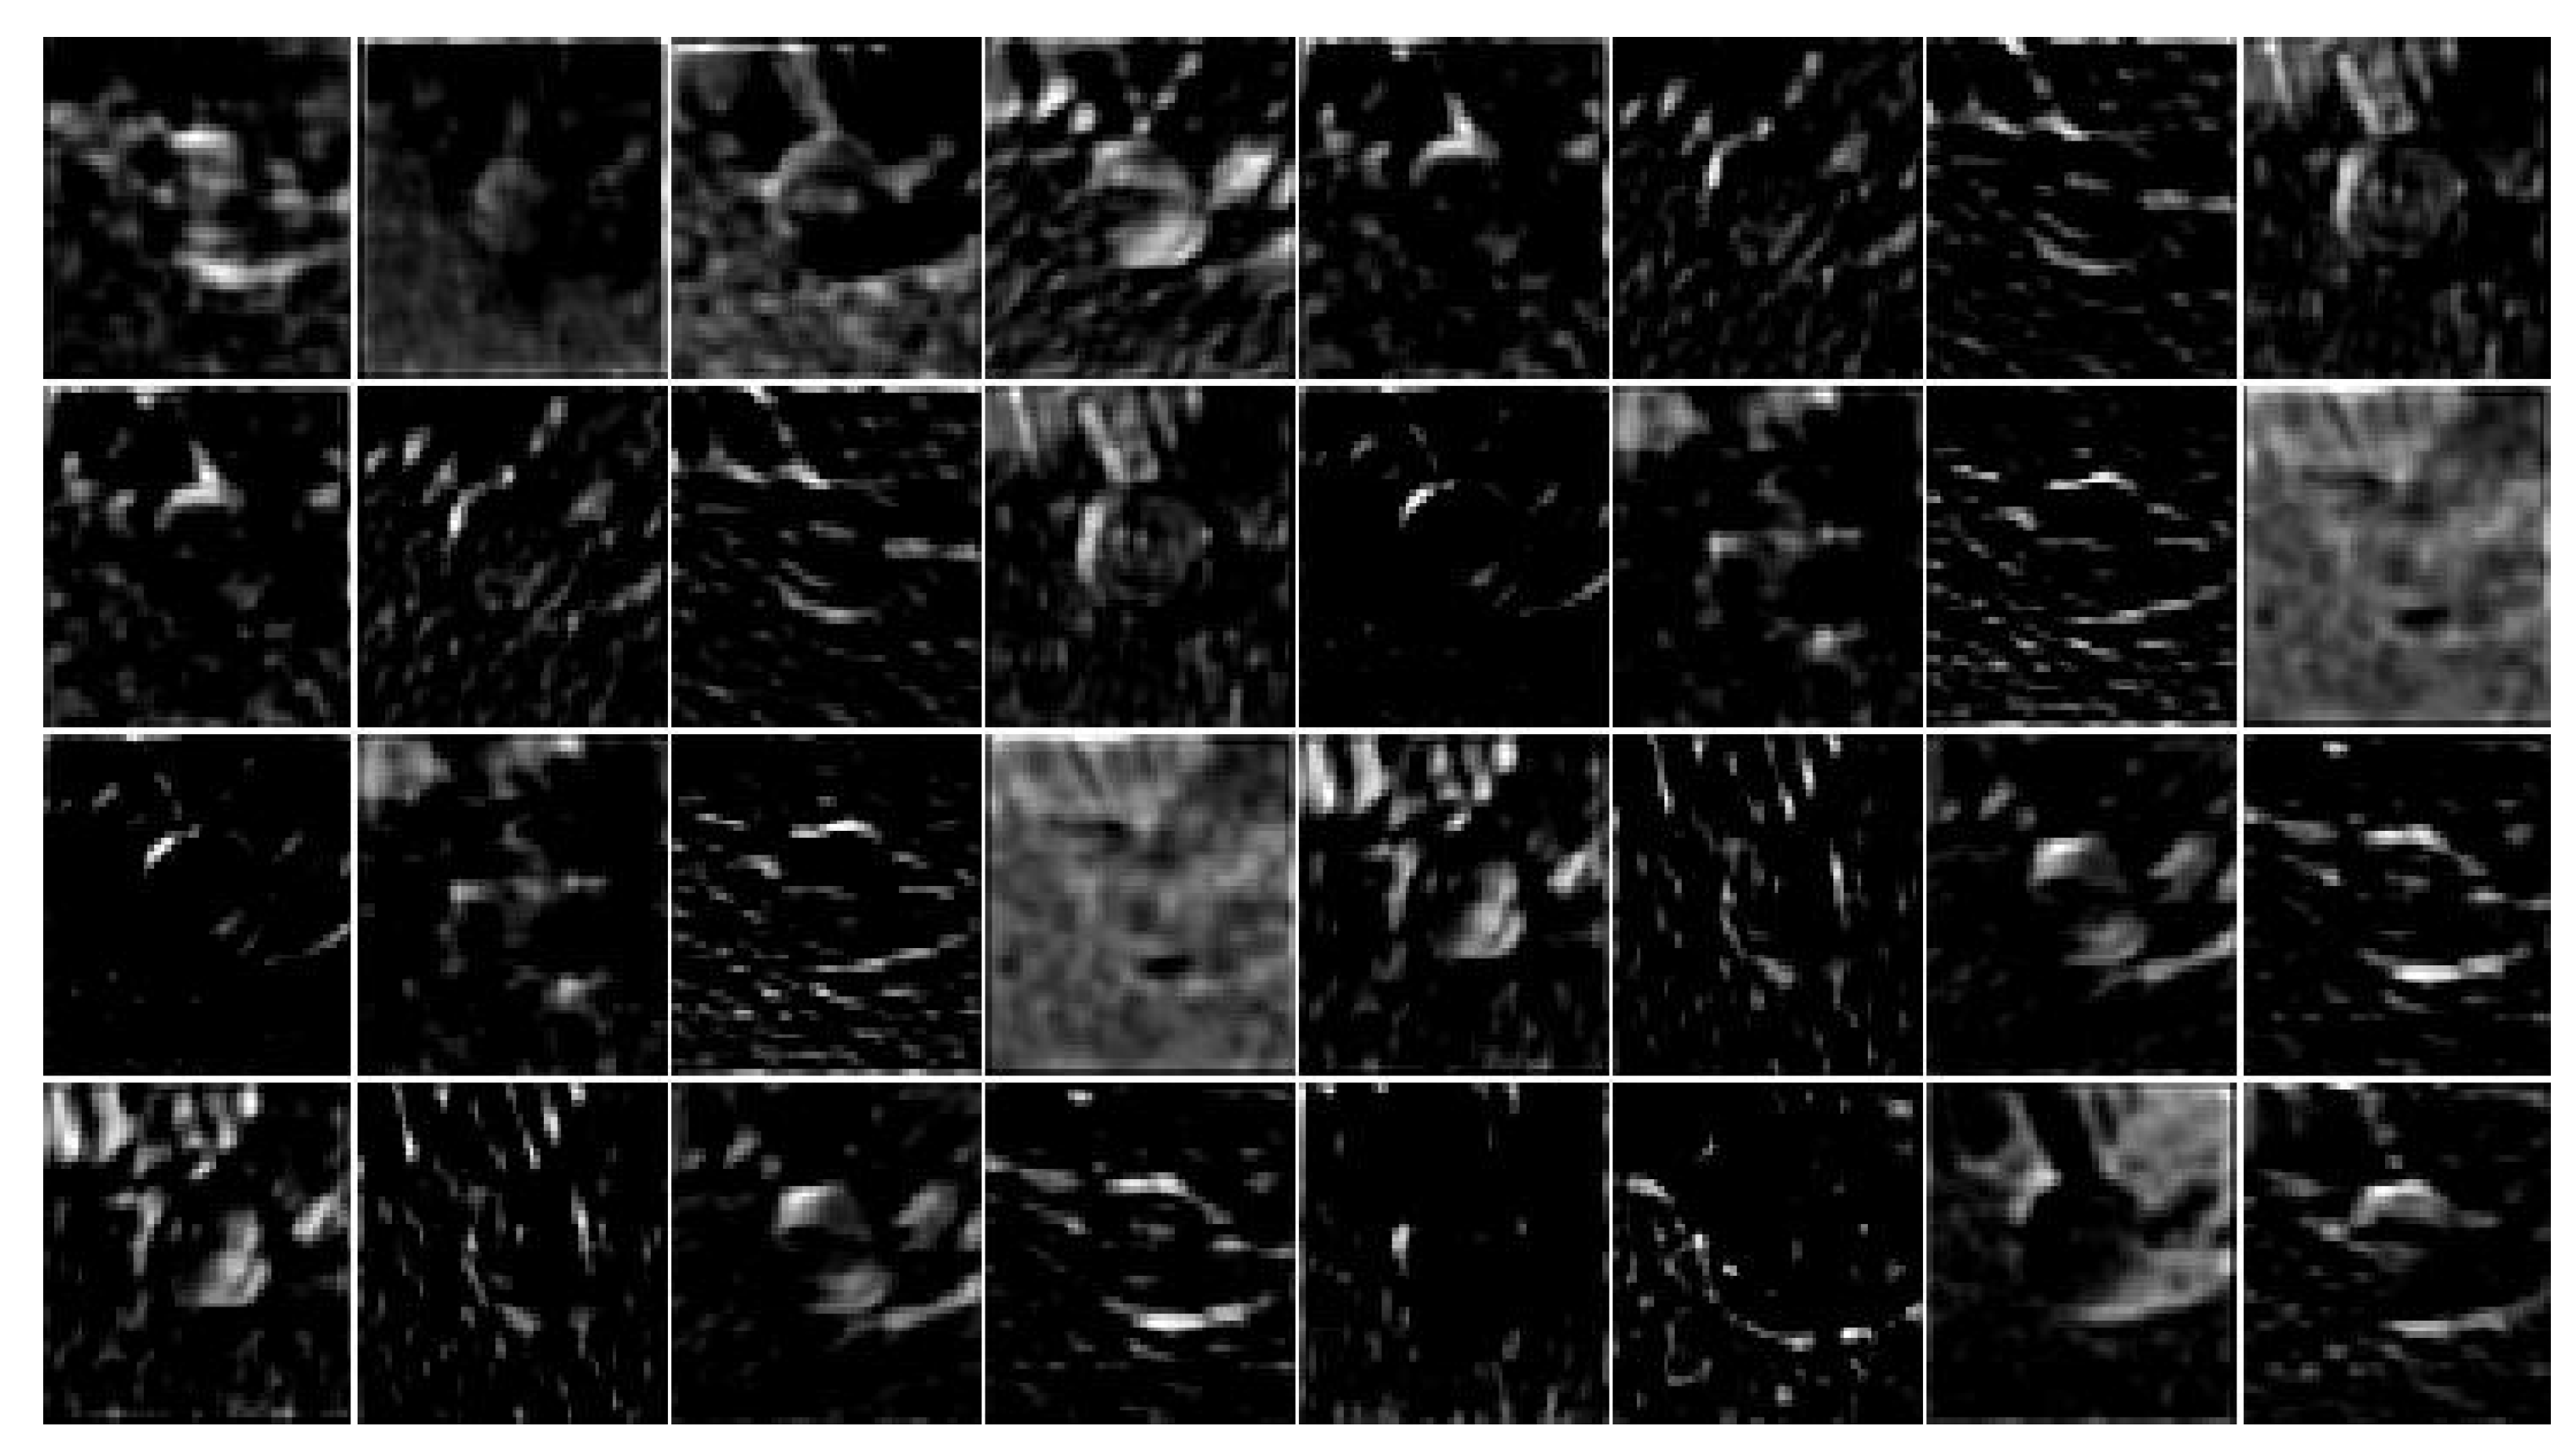
Figure 7 shows the first 32 channels of AS 3D HOG. As seen from Figure 7, AS 3D HOG has more distinct details compared with all three deep features above.

3.3. Kernel Correlation Filter

The KCF algorithm adopts ridge regression model that can obtain closed-form optimal solution by regularized least square method. The purpose of training the classifier with ridge regression method is to find a function f ( x ) = w T x to minimize the sum of squared errors between sample set x i and regression target y i . The ridge regression model equation is given as:
min w i f x i y i 2 + λ w 2
where x denotes the features of the training samples, y denotes the corresponding label, λ is the regularization parameter to prevent the classifier from over fitting, and w is the classifier coefficient. Following the setting in [24], λ is set to 0.0001 in our experiments.
Transforming Equation (22) into matrix form and then substituting the function f ( x ) = w T x into Equation (22) and making its derivative zero to obtain a closed-form solution, we obtain the specific form as:
w = X H X + λ I 1 X H Y
where X H is the Hermitian transposition of X, which is X H = X T , and X denotes conjugate complex numbers of X. X is the sample matrix, Y is the regression target matrix, and I is the unit matrix.
Since the sample matrix X is obtained by cyclic shifting of the base sample, the sample matrix X is a cyclic matrix. The diagonalization of a circular matrix using the discrete Fourier transform matrix can be expressed as:
X = F diag ( x ^ ) F H
where F is a discrete Fourier transform matrix independent of the vector x, and x ^ is the discrete Fourier transformation of the vector x. Hence, x ^ = F ( x ) ; F H is the conjugate transposition of F.
After substituting Equation (24) into Equation (23), Eigenvalue inversion is performed instead of matrix inversion due to the nature of the inversion of the circular matrix. Hence, w becomes
w = F diag x ^ x ^ x ^ + λ F H y
After introducing the kernel technique, the kernel regression equation becomes f ( z ) = α T k ( z ) . Similarly, the solution can be defined as:
α = ( K + λ I ) 1 y
where K is the kernel correlation matrix for all training samples, and α is a vector consisting of the solution of the dual space. It is known from the literature [24] that choosing an appropriate kernel function will ensure K to be a circular matrix.
Then, K is diagonalized using the properties of the circular matrix. Equation (26) is transformed using DFT to obtain the optimal solution of the ridge regression in the frequency domain:
α ^ = y ^ k ^ x x + λ
The kernel function used in our tracker is a Gaussian kernel function in the form of:
k x x = exp 1 σ 2 x 2 + x 2 2 F 1 x x ^
During the detection process, Equation (29) can be used to predict the central location of the target:
f ^ ( z ) = k ^ x z α ^
where f ^ ( z ) is the detection response of the filter in the frequency domain. k ^ x z is derived from the discrete Fourier transformation of the first row of the asymmetric kernel matrix between all the training and candidate samples.
After Equation (29), weak response maps are obtained, which are shown in Figure 8.
The four weak response maps in Figure 8 are obtained using conv 5-4, conv 4-4, conv 3-4, and AS 3D HOG features in Section 3.2, corresponding to f ^ 1 z , f ^ 2 z , f ^ 3 z , and f ^ 4 z , respectively.
After position prediction, the filter parameters α and x are updated as follows:
α n e w = ( 1 β ) α p r e + β α
x n e w = 1 β x p r e + β x
where α p r e and x p r e denote the parameters of the previous frame filter model, and β represents the learning rate used to update the correlation filter. The larger β is, the greater contribution of x on x n e w is and the faster the correlation filter is updated. Following the settings in [24], β is set to 0.02 in our experiments. Moreover, x and α are the parameters of the current frame, and α n e w and x n e w are the updated parameters.

3.4. Target Localization

As mentioned in Section 3.3, a response map is realized by using a filter to correlate the image. The peak correlation value represents a high degree of similarity between the current frame target and the template frame target. Therefore, an adaptive weighting coefficient η i is used to synthesize a strong response map, which is computed as:
η i = R p c i R p a i , i 1 , 2 , 3 , 4
where R p c i and R p a i represent the i-th level peak response value of the current frame and the i-th level peak response value of all time, respectively.
Due to the influence of background variation in image sequences, R p a i can be updated via
R p a i = R p c i R p c i R p a i μ R p a i + 1 μ R p c i R p c i < R p a i
where μ denotes a coefficient used to update R p a i . The larger μ is, the less contribution of R p c i has on R p a i and the slower R p a i is updated. Through experiments, μ is set to 0.95 in our experiments.
From the experiments, it is observed that the higher the feature level, the stronger its the ability to adapt to complex situations. However, the conv 5-4 feature has a large receptive field, which leads to the inability in tracking small targets. Accordingly, an activation function is applied to the first level response map instead of the adaptive weighting coefficient:
η ^ 1 = η 1 η 1 v t h 0 e l s e
where v t h represents a threshold value, which is used to limit the impact of first-level features due to the reasons mentioned above. Moreover, v t h is an experimental value, and we found that the tracker performs well when this value is set to 0.8.
After the adaptive weights are determined, the four weak response maps are fused based on corresponding weights to obtain a strong response map, which can be expressed as:
f ^ ( z ) = η ^ 1 f 1 ^ ( z ) + η 2 f 2 ^ ( z ) + η 3 f 3 ^ ( z ) + η 4 f 4 ^ ( z )
The strong response map is shown in Figure 9. Compared to the four weak response maps, the strong response map contains less clutter, resulting in more accurate positioning. The center of target is located at the position with the maximum value of the response map. Moreover, the size of target is estimated in Section 3.5.

3.5. Scale Estimation

Scale estimation is an issue that has not been addressed well in most of the existing state-of-the-art target tracking algorithms. In the tracking process, if there is a sharp change in the target size, the bounding box will not precisely surround the target. This issue will negatively influence the model, leading to the tracking failure. Therefore, it is very important to introduce scale estimation into the target tracking algorithms.
After locating the target position of the current frame target in Section 3.4, we generate a series of target boxes with different sizes based on the size of the target box in the last frame:
T b = γ i · H T × γ j · W T
where γ denotes the step of scale changing, i and j are series of integers, and H T and W T are the height and width of the target box of the previous frame, respectively. In our experiments, γ is set to 1.05 following the original setting in [32], and i and j are both in the range of −2 to 2. It may be noted that i and j change independently, generating 25 boxes of different sizes, where 25 equals the square of 5 ( 2 , 1 , 0 , 1 , 2 ). Therefore, the larger the range is, the more accurate the obtained estimation is, but the more time that is consumed. After comprehensive consideration of accuracy and speed, we set the range to 5 (from −2 to 2).
The images in all target boxes are resized to the same size and are used to extract AS 3D HOG features. The extracted features are then fed into the basic KCF filter to obtain the peak response values. Finally, the box with the highest value is regarded as the one corresponding to the target.

4. Results and Analysis

The details of the experiment settings are presented in Section 4.1, and the qualitative and quantitative comparisons with the existing algorithms are presented in Section 4.2 and Section 4.3, respectively. Moreover, to verify the advantages of the hyperspectral trackers mentioned in Section 1, comparisons with color video trackers are shown in Section 4.4.

4.1. Experiment Setup

The proposed DA-HVT method is implemented in a MATLAB R2016b framework. We achieved a processing speed of 3.5 frames per second on a PC with an Intel i5-8500 CPU (3 GB), 16 GB RAM, and a TITAN V GPU with 12 GB of Graphics Memory. Additionally, the MatConvNet toolbox is used for extracting the deep features in a VGG-19 network. In order to improve the performance of our tracker, appropriate parameters are determined based on experiments.
To verify the performance of our tracker, six experiments are conducted. All the experiment sequences are selected from the hyperspectral dataset disclosed in [33]. To verify the ability of our tracker to adapt to scale variation, five of the six sequences have the challenges of scale variation (SV). Moreover, to verify the universality of our tracker, the selected sequences have other challenges, including Occlusion (OCC), Fast Motion (FM), Background Clutter (BC), Out of View (OV), and Low Resolution (LR).
The disclosed dataset contains 35 groups of videos. Each group includes hyperspectral and visible light videos, and their pixels have a relationship of one-to-one correspondence. The hyperspectral video is obtained via a hyperspectral camera of 16 bands with wavelength from 470 nm to 620 nm, the hyperspectral camera’s model is snapshot VIS produced by IMEC, and the bandwidth for each band is about 10 nm. This camera can capture videos up to 180 frames per second (fps), and all the videos in this dataset are captured at 25 fps. This camera is equipped with an acquisition software, and this software can crop the output image or video to any size smaller than the camera resolution. Moreover, the whole dataset is available on the website (www.hsitracking.com). The resolution of the downloaded HSI is various. We do not change the resolution of six experimental sequences.
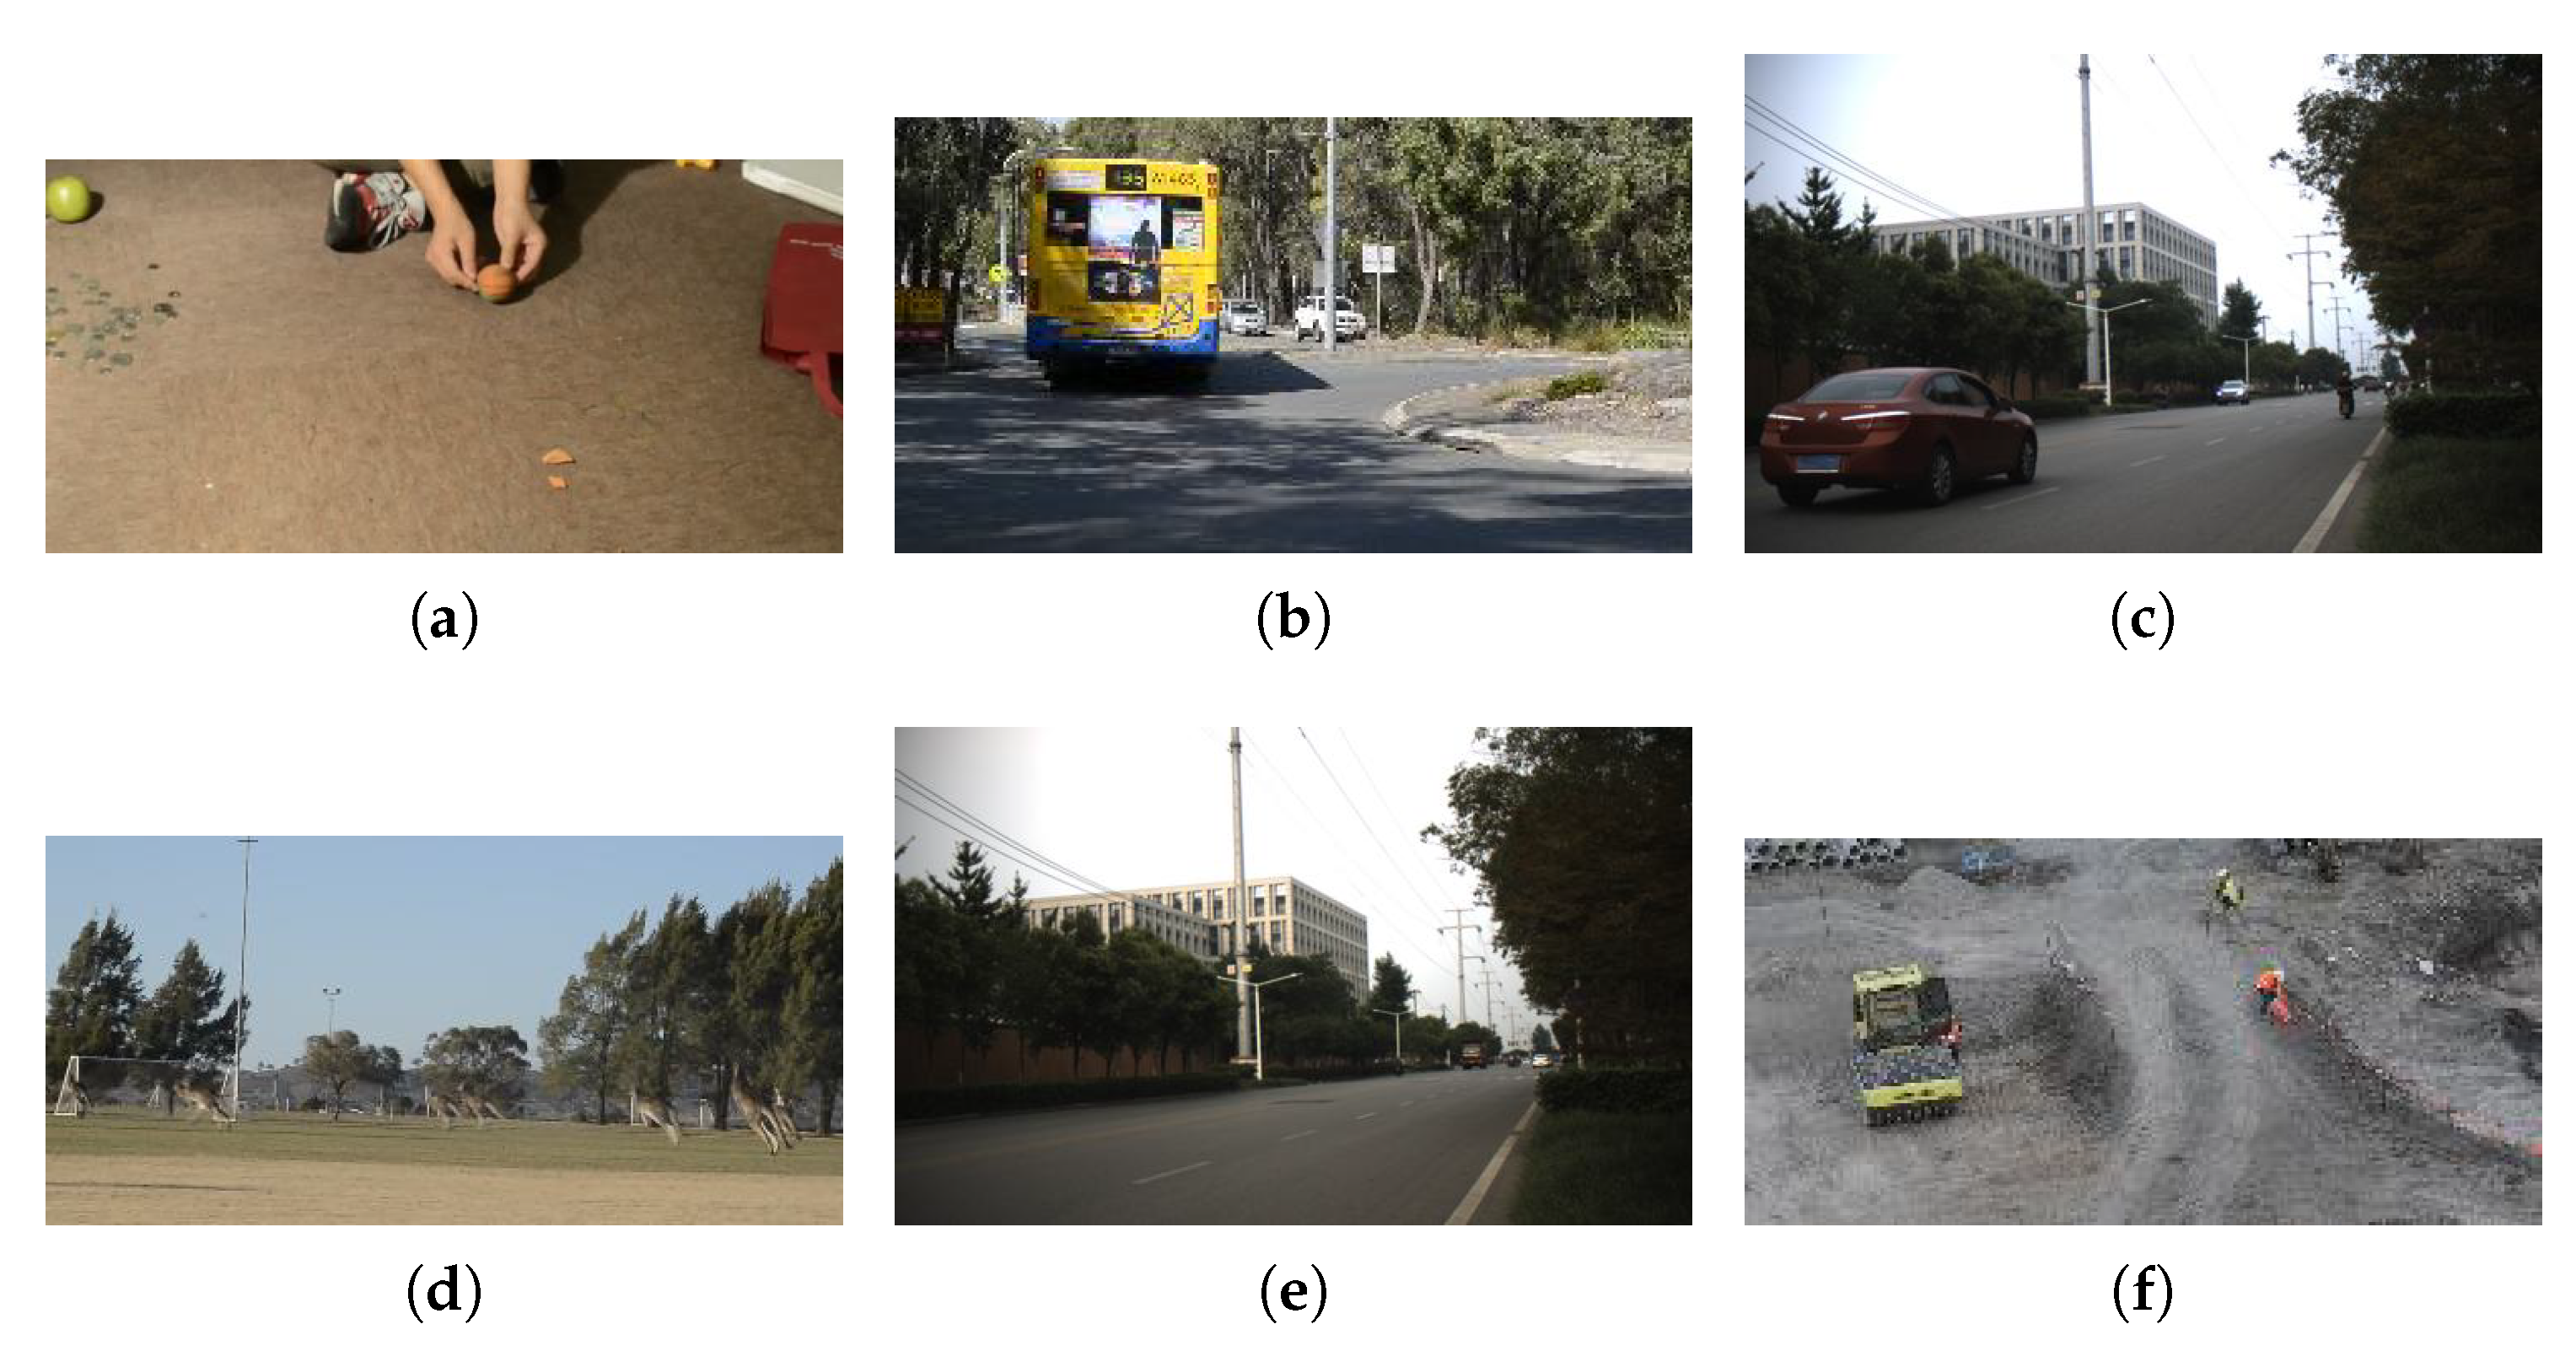
The details of our experiment sequences are shown in Table 1 and the RGB version of sequences are shown in Figure 10.
For Figure 10a, the sequence consists of 625 frames of 471 × 207 pixels. The tracking target is a small ball, which is rolled randomly on the ground by hand. The size of the small ball varies from 17 × 20 pixels to 21 × 23 pixels. This sequence has the SV and OCC challenges.
Similar information of other five sequences can be found in Table 1. Moreover, the tracking target in Figure 10b is a bus which travels quickly from near to far and whose size varies from 85 × 92 pixels to 61 × 65 pixels. In Figure 10c, the tracking target is a red car with a size that varies from 188 × 84 pixels to 21 × 19 pixels. The red car drives from the left side to the right side in the video. In Figure 10d, our tracking target is a kangaroo in a migrating kangaroo colony, whose size varies from 18 × 37 pixels to 25 × 48 pixels. Then, in Figure 10e, the tracking target is a truck with a size that varies from 17 × 17 pixels to 46 × 43 pixels. The truck drives from far to near on the road in the video. At last, in Figure 10f, the tracking target is the worker dressed in red on the far right of the first frame, and there are two other workers in the scene, which will pose great challenges to accurate tracking.

4.2. Qualitative Comparison

In this section, to verify the performance of the proposed algorithm, we compare our algorithm with five existing trackers, MHT [33], MFI-HVT [50], DeepHKCF [51], CNHT [26], and 3D HOG.
In the MHT method, the consideration of material characteristics has a good effect on the model’s ability to distinguish between targets of the same color. In the MFI-HVT method, the multiple integrated features provide more information than a single feature, thereby improving the separability.
In the DeepHKCF method, the deep features can be obtained by converting the HIS image into a pseudo-color image and feeding it to the VGG-19 network for feature extraction. In the CNHT method, a normalized three-dimensional chunk from the target region of the initial frame is used as a fixed convolutional kernel for the feature extraction of the subsequent frames. In the 3D HOG method, the authors propose a spectral-spatial histogram of a multidimensional gradient (SSHMG) to effectively represent the information in the spatial and spectral dimensions.
The experimental results of the proposed algorithm and five benchmark algorithms on all six experiment sequences are shown in Figure 11, Figure 12, Figure 13, Figure 14, Figure 15 and Figure 16.
In Figure 11, Figure 12, Figure 13, Figure 14, Figure 15 and Figure 16, there are many rectangular boxes with different colors in the image, and as shown in the legend below these images, different colors represent different algorithms. For example, red represents ours, purple represents MFI-HVT, green represents MHT, blue represents DeepHKCF, yellow represents 3D HOG, and black represents CNHT. Additionally, the white one is the groundtruth, which is the real result of manual annotation. Therefore, if the rectangular box of a certain color is closest to the white box, both size and location, it means that the corresponding algorithm of this color has the best effect. Among all these six sequences, the maximum variation in the scale is about 36 in the car sequence, from 188 × 84 to 21 × 19 . It can be seen that the proposed algorithm can adapt to such a large-scale variation.
In Figure 11, the whole sequence has the issue of fingers obscuring the ball and deformation being caused by the ball bouncing on the ground. Although the finger occasionally obscures the rolling ball, most trackers can still track it successfully. As CNHT trains its convolution filters using only positive samples, it does not have great robustness, which leads to an early failure at about frame 53. Moreover, at frame 598, the ball is completely occluded by fingers, which makes the MHT and DeepHKCF methods require large updates on the models using false information. Therefore, these two trackers lose their targets at frame 617.
In Figure 12, the branches on both sides of the bus can block the sunlight, which in turn causes the light intensity on the truck to change continuously. In addition, the size of the bus gradually decreases as it travels away. As DeepHKCF and 3D HOG do not have scale estimation modules, their prediction boxes cannot vary adaptively. Therefore, even if these two trackers can locate the target during whole sequences, the performance is not satisfactory after frame 113.
In Figure 13, as the target car is driving to the end of the road, another car follows closely to the road. During this time, the two cars gradually become smaller. At the end of the sequence, there are cyclists who obstruct the red cars, which have become smaller. Since the 3D HOG and DeepHKCF trackers introduce too much background clutter during the update, these two trackers lose their targets at frame 17.
In Figure 14, the kangaroo’s rapid bouncing causes a change in the appearance of the scale and leads to increased tracking difficulty. In addition, other kangaroos cause a considerable degree of background disturbance as they are very similar to the tracking target. As mentioned in Section 3.2, the semantic information of deep features leads to failure when facing similarity. However, the DeepHKCF tracker uses only a single deep feature, which makes it difficult to distinguish between similar targets, and the tracker loses the target at about frame 24. Different from DeepHKCF, the other five trackers use the detail information of the picture, resulting in good performance for this sequence.
In Figure 15, the truck starts from the end of the road and continues to grow larger as it drives closer. In addition, when the truck is about to leave the road, a person on a bicycle drives in the opposite direction of the truck, causing a brief obstruction of the truck. Due to the change in the aspect ratio of the truck, all five benchmark trackers discussed in this study were unable to surround the target accurately. As a result, these trackers can only track a part of the target. With the increase in target size, this issue becomes more and more obvious. At frame 209, it can be seen clearly that only our tracker has good overlap with the groundtruth.
In Figure 16, the workers in green clothes in the sequence work along with the tracking target, causing background clutter and temporary obscuring. As mentioned in Section 3.4, deep feature tracking has a large respective field and is not effective in tracking small targets. Therefore, the DeepHKCF tracker loses the target early at about frame 53. The MFI-HVT, another tracker using deep feature tracking, loses the target at frame 1096 due to the usage of HOG features. Different from these two trackers, our tracker adopts an activation operation for deep features and becomes inoperative when unreliable. As a result, our tracker can track the target accurately during the whole sequence.

4.3. Quantitative Comparison

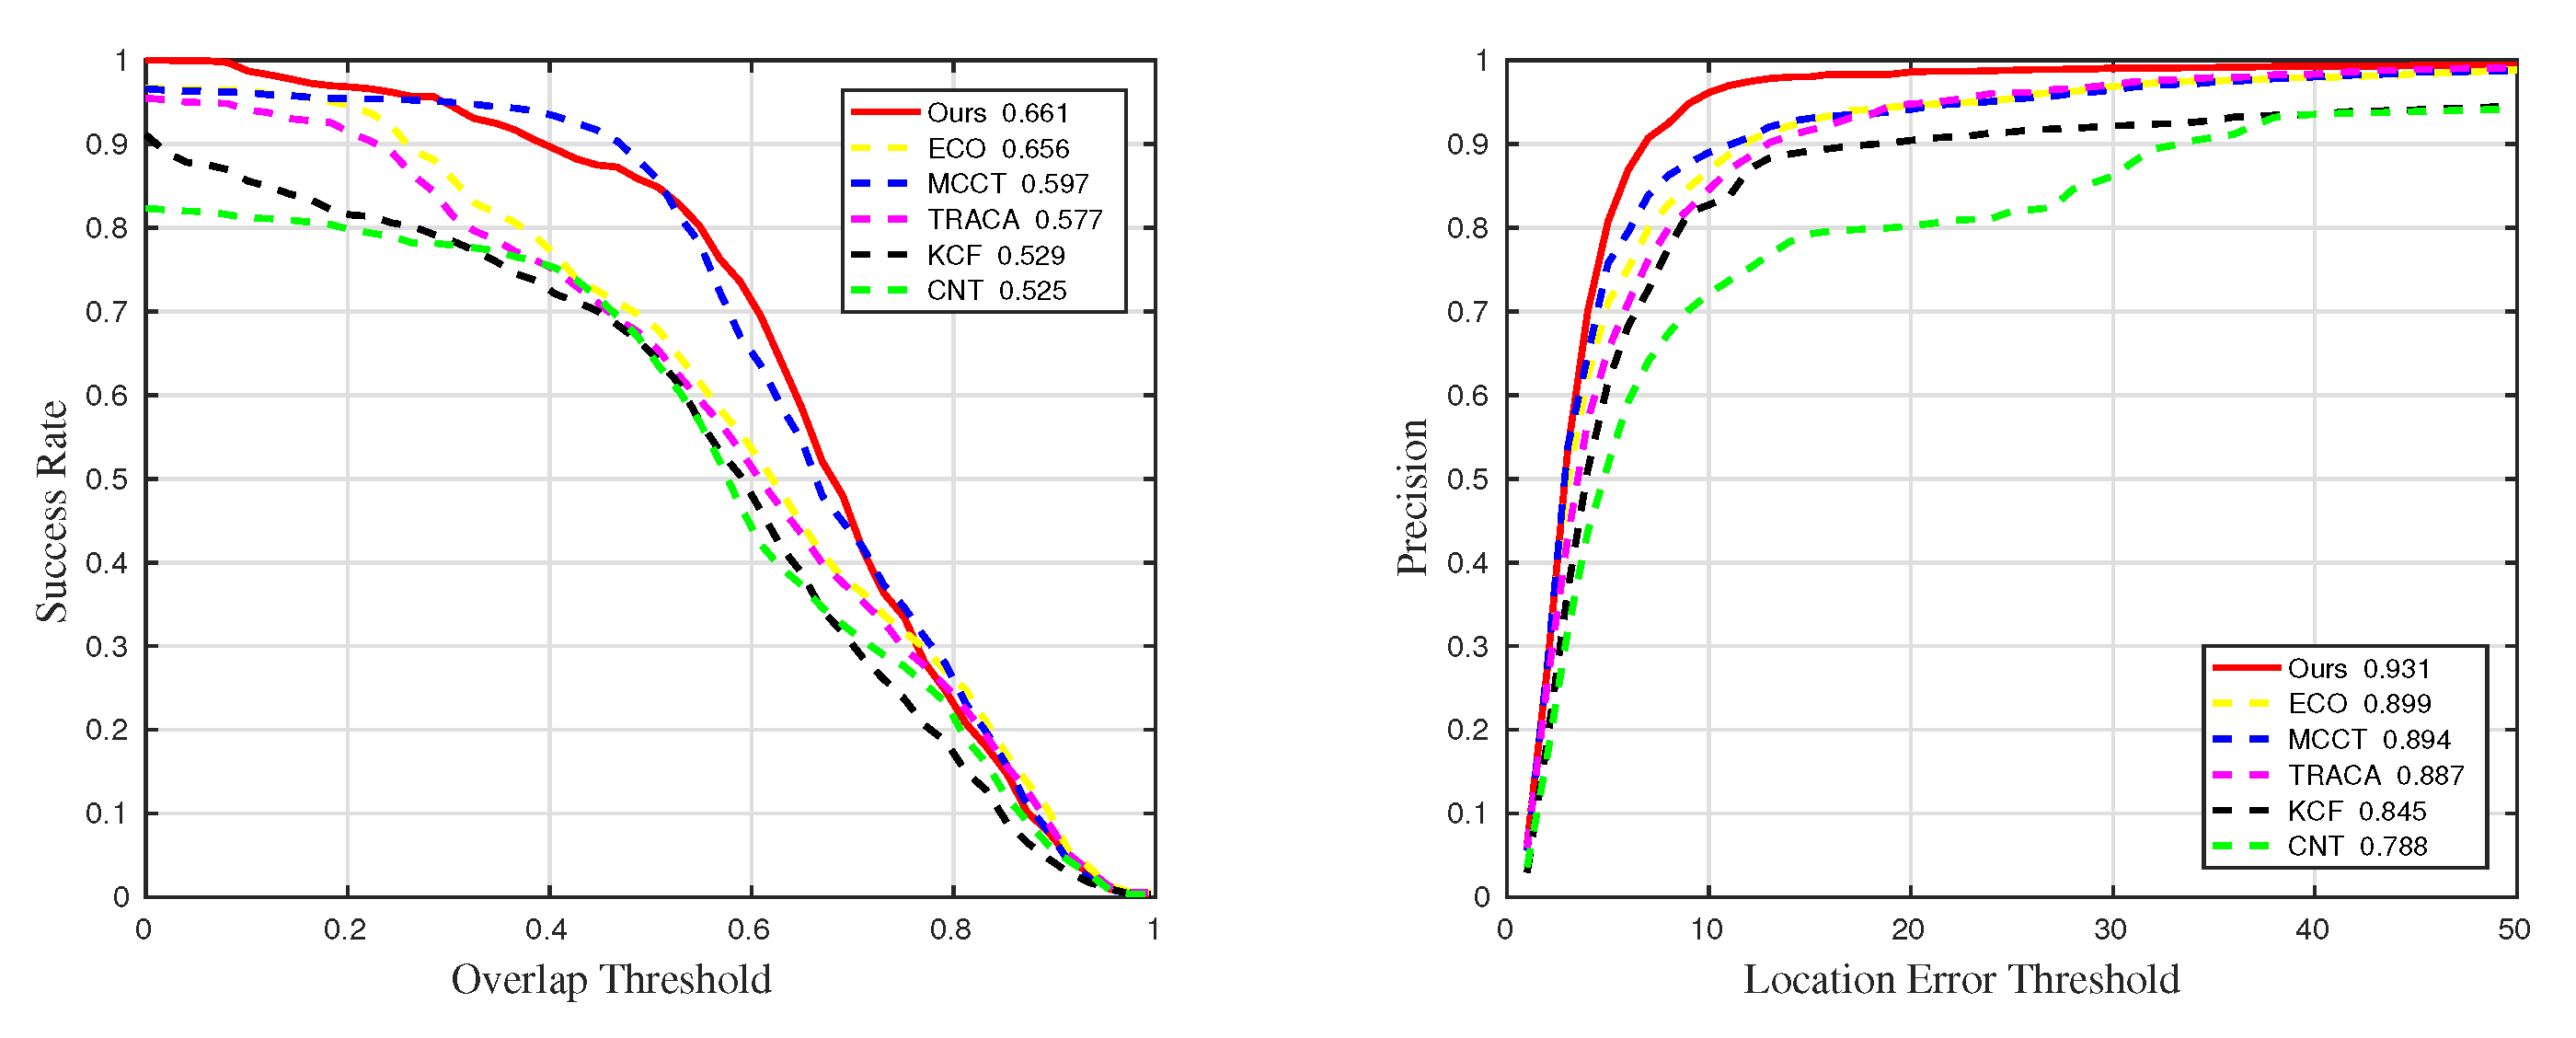
In this section, the success rate curve and precision curve are used to quantitatively analyze the six algorithms. In the field of target tracking, the precision shows the locating accuracy and the success rate shows the box estimation accuracy. More specifically, in the left of Figure 17, the x-axis overlap threshold is a series of consecutive thresholds from 0 to 1, and the y-axis success rate is defined as the percentage of frames whose overlap between the estimated box and the groundtruth is larger than the overlap threshold. Similarly, in the right of Figure 17, the x-axis location error threshold is a series of consecutive thresholds from 0 to 50 and the y-axis precision is defined as the percentage of frames whose distance between the center of the estimated box and the groundtruth are less than the location error threshold. The area under curve (AUC) of precision and success rate are used to measure the performance of trackers. In order to avoid the influence of the x-axis value range on computing AUC, the average y-axis value of each curve is used to represent AUC. Moreover, the larger the average value is, the closer the estimated box is to the groundtruth under different thresholds, and the better the algorithm’s performance is. Therefore, the scores in Figure 17, Figure 18, Figure 19 and Figure 20 are obtained by calculating the average value.
Figure 17 shows the the success rate curve and the precision curve of the six trackers on all test sequences. Similarly, Figure 18, Figure 19 and Figure 20 are the experimental results of the six trackers tested only on partial sequence having challenges including scale variation, occlusion, and background clutter, respectively. The itemized comparisons are shown in Table 2 and Table 3.
The scores in Table 2 and Table 3 come from Figure 17, Figure 18, Figure 19 and Figure 20. Specifically, the Precision in Table 3 comes from the right of Figure 17, and the Success in Table 2 comes from the left of Figure 17. Similarly, Precision_SV, Precision_OCC, and Precision_BC are obtained from the right of Figure 18, Figure 19 and Figure 20, respectively. Success_SV, Success_OCC, and Success_BC are obtained from the left of Figure 18, Figure 19 and Figure 20, respectively.
It can be seen from the above figures and tables that the proposed tracker has achieved good performance. Compared with different challenges, the success rate and precision of our tracker on the sequence with the SV challenge are the best. More specifically, it achieves a precision of 1.8% higher than all the sequences, 2.3% higher than the sequences with OCC, and 6.9% higher than the sequences with BC. Similarly, in terms of success rate, the proposed approach achieves 1.7% higher performance than all sequences, 9.6% higher than sequences with OCC, and 5.3% higher than sequences with BC. The above data prove that our tracker has better adaptability to the targets with scale changes due to the use of AS 3D HOG.
Moreover, compared with other existing HSV-based trackers, the proposed tracker achieves 0.931 precision and 0.661 success rate in all test sequences, which are the best among all the existing HSV-based trackers. Specifically, in the sequences with the SV challenge, the proposed tracker has a better result of 0.949 precision and a 0.678 success rate. However, in the sequences with the BC challenge, MHT achieves the best results of 0.894 precision and a 0.627 success rate. This can be attributed to the use of material information. Because of the usage of SMR, our tracker achieves the second best result, only 0.6% lower in precision and 0.2% lower in success rate as compared to MHT.

4.4. Comparisons with Color Video Trackers

In this section, experiments are made to show the advantages of hyperspectral video trackers compared with color video trackers. The experiment sequences in this section are the corresponding RGB versions with six sequences mentioned in Section 4.1, whose details are the same as shown in Table 1. All these color sequences are also obtained from the public dataset in [33]. Five color video trackers are used to compare the performance, namely, CNT [25], KCF [24], TRACA [52], MCCT [32], and ECO [36]. Among these five trackers, CNT uses the most classic color name feature, KCF is the foundation of our tracker, and TRACA, MCCT, and ECO are state-of-the-art CF-based trackers. These five color video trackers can cope with SV due to the usage of scale estimation modules. Qualitative comparisons are shown in Figure 21, Figure 22, Figure 23, Figure 24, Figure 25 and Figure 26, and quantitative comparisons are shown in Figure 27 and Table 4.
As shown in Figure 22, Figure 23, Figure 24 and Figure 25, when the targets are not subject to large interference outside the SV, all the color video trackers can track the target. Because the targets are complete in space and all color video trackers have a scale estimation module, they can extract robust features. However, as shown in Figure 21, after the ball is completely occluded by figures, CNT loses the target at frame 617 because the color name feature is not reliable when the target is occluded. When facing an LR challenge, shown in Figure 26, all the color video trackers are unable to obtain satisfactory results at frame 351. The estimated boxes of these color video trackers have a significant deviation from the groundtruth because, in the case of LR, spatial features will become too fuzzy to have a bad impact on the tracking results.
It can be clearly seen that the proposed tracker has better results compared with color video trackers from Figure 27 and Table 4. The proposed tracker achieves 0.931 precision and 0.661 success rate in all experiment sequences, which are higher than all color video trackers. Both precision and success rate have achieved results of 0.032 and 0.005 higher than ECO, the best one in color video trackers. All the qualitative and quantitative results show that the proposed tracker can learn a more reliable correlation filter due to the rich information in HSIs.

5. Conclusions

A hyperspectral video target tracking method based on deep features with spectral matching reduction and AS 3D HOG features is proposed. The proposed spectral dimension reduction method reduces the amount of image frame data and significantly improves the distinction between the target and the background, which facilitates the subsequent use of VGG networks for feature extraction. The introduction of the AS 3D HOG ensures that the tracker remains robust against targets with complex scale transformations. Finally, the proposed use and computation of adaptive weights give satisfactory results while dealing with complex background disturbances. Experimental results show that the proposed algorithm has achieved good performance. Specifically, the proposed algorithm achieves a 0.931 precision and a 0.661 success rate in all test sequences. Moreover, when facing the sequences with SV challenges, these two scores are increased to 0.949 and 0.678, respectively. In our future work, we will improve our method in two aspects: one is to train an HSI-based network with the the enrichment of data sources, and the other one is to improve the scale estimation module with a refinement method for the target box estimation.

Author Contributions

Conceptualization, Z.Z. and X.Z.; methodology, Z.Z.; software, Z.Z.; validation, Z.Z., X.Z., and D.Z.; formal analysis, X.Z.; investigation, Z.Z.; resources, Z.Z.; data curation, Z.Z. and K.Q.; writing—original draft preparation, Z.Z. and X.Z.; writing—review and editing, D.Z., H.Z., and P.V.A.; visualization, K.Q.; supervision, H.Z. and J.H. All authors have read and agreed to the published version of the manuscript.

Funding

This research was supported by the 111 Project (B17035), the National Natural Science Foundation of China (62001443,62105258), the Aeronautical Science Foundation of China (201901081002), the Natural Science Foundation of Jiangsu Province (BK20210063,BK20210064), The Start-up Fund for Introducing Talent of Wuxi University (2021r007), The Jiangsu Higher Education Institutions of China (17KJB510037), Natural Science Foundation of ShanDong province (ZR2020QE294), and The Fundamental Research Funds for the Central Universities (JUSRP121072).

Data Availability Statement

Data are available from the corresponding author upon reasonable request.

Acknowledgments

Thanks are due to Jialu Cao for valuable discussion.

Conflicts of Interest

The authors declare no conflict of interest.

References

  1. Zhao, D.; Gu, L.; Qian, K.; Zhou, H.; Cheng, K. Target tracking from infrared imagery via an improved appearance model. Infrared Phys. Technol. 2019, 104, 103–116. [Google Scholar] [CrossRef]
  2. Yan, B.; Peng, H.; Wu, K.; Wang, D.; Fu, J.; Lu, H. LightTrack: Finding Lightweight Neural Networks for Object Tracking via One-Shot Architecture Search. In Proceedings of the IEEE Conference on Computer Vision and Pattern Recognition, Nashville, TN, USA, 19–25 June 2021. [Google Scholar]
  3. Borsuk, V.; Vei, R.; Kupyn, O.; Martyniuk, T.; Krashenyi, I.; Matas, J. FEAR: Fast, Efficient, Accurate and Robust Visual Tracker. In Proceedings of the European Conference on Computer Vision, Tel Aviv, Israel, 23–27 October 2022. [Google Scholar]
  4. Cao, Z.; Huang, Z.; Pan, L.; Zhang, S.; Liu, Z.; Fu, C. TCTrack: Temporal Contexts for Aerial Tracking. In Proceedings of the IEEE Conference on Computer Vision and Pattern Recognition, New Orleans, LA, USA, 19–24 June 2022. [Google Scholar]
  5. Danelljan, M.; Häger, G.; Khan, F.S.; Felsberg, M. Adaptive Decontamination of the Training Set: A Unified Formulation for Discriminative Visual Tracking. In Proceedings of the IEEE Conference on Computer Vision and Pattern Recognition, Las Vegas, NV, USA, 27–30 June 2016. [Google Scholar]
  6. Feng, W.; Han, R.; Guo, Q.; Zhu, J.; Wang, S. Dynamic Saliency-Aware Regularization for Correlation Filter-Based Object Tracking. IEEE Trans. Image Process. 2019, 28, 3232–3245. [Google Scholar] [CrossRef] [PubMed]
  7. Li, Y.; Xie, W.; Li, H. Hyperspectral image reconstruction by deep convolutional neural network for classification. Pattern Recognit. 2017, 63, 371–383. [Google Scholar] [CrossRef]
  8. Song, S.; Zhou, H.; Yang, Y.; Song, J. Hyperspectral Anomaly Detection via Convolutional Neural Network and Low Rank with Density-Based Clustering. IEEE J. Sel. Top. Appl. Earth Obs. Remote Sens. 2019, 12, 3637–3649. [Google Scholar] [CrossRef]
  9. Liang, J.; Zhou, J.; Tong, L.; Bai, X.; Wang, B. Material based salient object detection from hyperspectral images. Pattern Recognit. J. Pattern Recognit. Soc. 2018, 76, 476–490. [Google Scholar] [CrossRef] [Green Version]
  10. Chang, C.I.; Su, W. Constrained band selection for hyperspectral imagery. IEEE Trans. Geosci. Remote Sens. 2006, 44, 1575–1585. [Google Scholar] [CrossRef]
  11. Kim, J.H.; Kim, J.; Yang, Y.; Kim, S.; Kim, H.S. Covariance-based band selection and its application to near-real-time hyperspectral target detection. Opt. Eng. 2017, 56, 053101. [Google Scholar] [CrossRef]
  12. Yang, C.; Bruzzone, L.; Zhao, H.; Tan, Y.; Guan, R. Superpixel-Based Unsupervised Band Selection for Classification of Hyperspectral Images. IEEE Trans. Geosci. Remote Sens. 2018, 56, 7230–7245. [Google Scholar] [CrossRef]
  13. Jolliffe, I.T. Principal Component Analysis. J. Mark. Res. 2002, 87, 513. [Google Scholar]
  14. Villa, A.; Chanussot, J.; Jutten, C.; Benediktsson, J.A. On the use of ICA for hyperspectral image analysis. In Proceedings of the IEEE International Geoscience and Remote Sensing Symposium, Cape Town, South Africa, 12–17 July 2009. [Google Scholar]
  15. Green, A.A.; Berman, M.; Switzer, P.; Craig, M. A transformation for ordering multispectral data in terms of image quality with implications for noise removal. IEEE Trans. Geosci. Remote Sens. 1988, 26, 65–74. [Google Scholar] [CrossRef] [Green Version]
  16. Nielsen, A.A. Kernel Maximum Autocorrelation Factor and Minimum Noise Fraction Transformations. IEEE Trans. Image Process. 2011, 20, 612–624. [Google Scholar] [CrossRef] [PubMed]
  17. Xia, J.; Falco, N.; Benediktsson, J.A.; Du, P.; Chanussot, J. Hyperspectral Image Classification with Rotation Random Forest Via KPCA. IEEE J. Sel. Top. Appl. Earth Obs. Remote Sens. 2017, 10, 1601–1609. [Google Scholar] [CrossRef] [Green Version]
  18. Rasti, B.; Ulfarsson, M.O.; Sveinsson, J.R. Hyperspectral Feature Extraction Using Total Variation Component Analysis. IEEE Trans. Geosci. Remote Sens. 2016, 54, 6976–6985. [Google Scholar] [CrossRef]
  19. Bandos, T.V.; Bruzzone, L.; Camps-Valls, G. Classification of Hyperspectral Images With Regularized Linear Discriminant Analysis. IEEE Trans. Geosci. Remote Sens. 2009, 47, 862–873. [Google Scholar] [CrossRef]
  20. Li, J.; Qian, Y. Dimension reduction of hyperspectral images with sparse linear discriminant analysis. In Proceedings of the Geoscience and Remote Sensing Symposium, Vancouver, BC, Canada, 24–29 July 2011. [Google Scholar]
  21. Zhang, L.; Zhang, L.; Bo, D. Deep Learning for Remote Sensing Data: A Technical Tutorial on the State of the Art. IEEE Geosci. Remote Sens. Mag. 2016, 4, 22–40. [Google Scholar] [CrossRef]
  22. Li, S.; Song, W.; Fang, L.; Chen, Y.; Benediktsson, J.A. Deep Learning for Hyperspectral Image Classification: An Overview. IEEE Trans. Geosci. Remote Sens. 2019, 57, 6690–6709. [Google Scholar] [CrossRef] [Green Version]
  23. Danelljan, M.; Khan, F.S.; Felsberg, M.; Weijer, J. Adaptive Color Attributes for Real-Time Visual Tracking. In Proceedings of the IEEE Conference on Computer Vision and Pattern Recognition, Columbus, OH, USA, 23–28 June 2014. [Google Scholar]
  24. Henriques, J.F.; Caseiro, R.; Martins, P.; Batista, J. High-Speed Tracking with Kernelized Correlation Filters. IEEE Trans. Pattern Anal. Mach. Intell. 2015, 37, 583–596. [Google Scholar] [CrossRef] [Green Version]
  25. Bolme, D.S.; Beveridge, J.R.; Draper, B.A.; Lui, Y.M. Visual object tracking using adaptive correlation filters. In Proceedings of the IEEE Conference on Computer Vision and Pattern Recognition, San Francisco, CA, USA, 13–18 June 2010. [Google Scholar]
  26. Qian, K.; Zhou, J.; Xiong, F.; Zhou, H.; Du, J. Object Tracking in Hyperspectral Videos with Convolutional Features and Kernelized Correlation Filter. In Proceedings of the International Conference on Smart Multimedia, Toulon, France, 24–26 August 2018. [Google Scholar]
  27. Zhang, K.; Lei, Z.; Yang, M.H.; Zhang, D. Fast Tracking via Spatio-Temporal Context Learning. arXiv 2013, arXiv:1311.1939. [Google Scholar]
  28. Chao, M.; Huang, J.B.; Yang, X.; Yang, M.H. Hierarchical Convolutional Features for Visual Tracking. In Proceedings of the IEEE International Conference on Computer Vision, Las Vegas, NV, USA, 27–30 June 2016. [Google Scholar]
  29. Bailer, C.; Pagani, A.; Stricker, D. A Superior Tracking Approach: Building a Strong Tracker through Fusion. In Proceedings of the European Conference on Computer Vision, Zurich, Switzerland, 6–12 September 2014. [Google Scholar]
  30. Zhang, J.; Ma, S.; Sclaroff, S. MEEM: Robust Tracking via Multiple Experts Using Entropy Minimization. In Proceedings of the European Conference on Computer Vision, Zurich, Switzerland, 6–12 September 2014. [Google Scholar]
  31. Khalid, O.; SanMiguel, J.C.; Cavallaro, A. Multi-Tracker Partition Fusion. IEEE Trans. Circuits Syst. Video Technol. 2017, 27, 1527–1539. [Google Scholar] [CrossRef]
  32. Ning, W.; Zhou, W.; Qi, T.; Hong, R.; Li, H. Multi-Cue Correlation Filters for Robust Visual Tracking. In Proceedings of the IEEE Conference on Computer Vision and Pattern Recognition, Salt Lake City, UT, USA, 18–23 June 2018. [Google Scholar]
  33. Xiong, F.; Zhou, J.; Qian, Y. Material Based Object Tracking in Hyperspectral Videos. IEEE Trans. Image Process. 2020, 29, 3719–3733. [Google Scholar] [CrossRef]
  34. Chen, L.; Zhao, Y.; Yao, J.; Chen, J.; Li, N.; Chan, J.C.W.; Kong, S.G. Object Tracking in Hyperspectral-Oriented Video with Fast Spatial-Spectral Features. Remote Sens. 2021, 13, 1922. [Google Scholar] [CrossRef]
  35. Chen, L.; Zhao, Y.; Chan, J.C.W.; Kong, S.G. Histograms of oriented mosaic gradients for snapshot spectral image description. ISPRS J. Photogramm. Remote Sens. 2022, 183, 79–93. [Google Scholar] [CrossRef]
  36. Danelljan, M.; Bhat, G.; Khan, F.S.; Felsberg, M. ECO: Efficient Convolution Operators for Tracking. In Proceedings of the IEEE Conference on Computer Vision and Pattern Recognition, Honolulu, HI, USA, 21–26 July 2017. [Google Scholar]
  37. Sun, C.; Wang, D.; Lu, H.; Yang, M.H. Correlation Tracking via Joint Discrimination and Reliability Learning. In Proceedings of the IEEE Conference on Computer Vision and Pattern Recognition, Salt Lake City, UT, USA, 18–23 June 2018. [Google Scholar]
  38. Cen, M.; Jung, C. Fully Convolutional Siamese Fusion Networks for Object Tracking. In Proceedings of the European Conference on Computer Vision, Amsterdam, The Netherlands, 11–14 October 2016. [Google Scholar]
  39. Bo, L.; Yan, J.; Wei, W.; Zheng, Z.; Hu, X. High Performance Visual Tracking with Siamese Region Proposal Network. In Proceedings of the IEEE Conference on Computer Vision and Pattern Recognition, Salt Lake City, UT, USA, 18–23 June 2018. [Google Scholar]
  40. Li, B.; Wu, W.; Wang, Q.; Zhang, F.; Xing, J.; Yan, J. SiamRPN++: Evolution of Siamese Visual Tracking with Very Deep Networks. In Proceedings of the IEEE Conference on Computer Vision and Pattern Recognition, Long Beach, CA, USA, 15–20 June 2019. [Google Scholar]
  41. Wang, Q.; Zhang, L.; Bertinetto, L.; Hu, W.; Torr, P. Fast Online Object Tracking and Segmentation: A Unifying Approach. In Proceedings of the IEEE Conference on Computer Vision and Pattern Recognition, Long Beach, CA, USA, 15–20 June 2019. [Google Scholar]
  42. Lukezic, A.; Matas, J.; Kristan, M. D3S—A Discriminative Single Shot Segmentation Tracker. In Proceedings of the IEEE Conference on Computer Vision and Pattern Recognition, Seattle, WA, USA, 13–19 June 2020. [Google Scholar]
  43. Xu, Y.; Wang, Z.; Li, Z.; Yuan, Y.; Yu, G. SiamFC++: Towards Robust and Accurate Visual Tracking with Target Estimation Guidelines. In Proceedings of the Association for the Advance of Artificial Intelligence, New York, NY, USA, 7–12 February 2020. [Google Scholar]
  44. Chen, X.; Yan, B.; Zhu, J.; Wang, D.; Lu, H. Transformer Tracking. In Proceedings of the IEEE Conference on Computer Vision and Pattern Recognition, Nashville, TN, USA, 20–25 June 2021. [Google Scholar]
  45. Bhat, G.; Danelljan, M.; Gool, L.V.; Timofte, R. Learning Discriminative Model Prediction for Tracking. In Proceedings of the International Conference on Computer Vision, Seoul, Republic of Korea, 27 October–2 November 2019. [Google Scholar]
  46. Danelljan, M.; Bhat, G.; Khan, F.S.; Felsberg, M. ATOM: Accurate Tracking by Overlap Maximization. In Proceedings of the IEEE Conference on Computer Vision and Pattern Recognition, Long Beach, CA, USA, 15–20 June 2019. [Google Scholar]
  47. Yan, B.; Wang, D.; Lu, H.; Yang, X. Alpha-Refine: Boosting Tracking Performance by Precise Bounding Box Estimation. In Proceedings of the IEEE Conference on Computer Vision and Pattern Recognition, Seattle, WA, USA, 13–19 June 2020. [Google Scholar]
  48. Simonyan, K.; Zisserman, A. Very Deep Convolutional Networks for Large-Scale Image Recognition. arXiv 2014, arXiv:1409.1556. [Google Scholar]
  49. Krizhevsky, A.; Sutskever, I.; Hinton, G. ImageNet Classification with Deep Convolutional Neural Networks. Adv. Neural Inf. Process. Syst. 2017, 60, 84–90. [Google Scholar] [CrossRef] [Green Version]
  50. Zhang, Z.; Qian, K.; Du, J.; Zhou, H. Multi-Features Integration Based Hyperspectral Videos Tracker. In Proceedings of the IEEE Workshop on Hyperspectral Image and Signal Processing: Evolution in Remote Sensing, Amsterdam, The Netherlands, 24–26 March 2021. [Google Scholar]
  51. Uzkent, B.; Rangnekar, A.; Hoffman, M.J. Tracking in Aerial Hyperspectral Videos Using Deep Kernelized Correlation Filters. IEEE Trans. Geosci. Remote Sens. 2019, 57, 449–461. [Google Scholar] [CrossRef]
  52. Choi, J.; Chang, H.J.; Fischer, T.; Yun, S.; Lee, K.; Jeong, J.; Demiris, Y.; Choi, J.Y. Context-Aware Deep Feature Compression for High-Speed Visual Tracking. In Proceedings of the IEEE Conference on Computer Vision and Pattern Recognition, Salt Lake City, UT, USA, 18–23 June 2018. [Google Scholar]
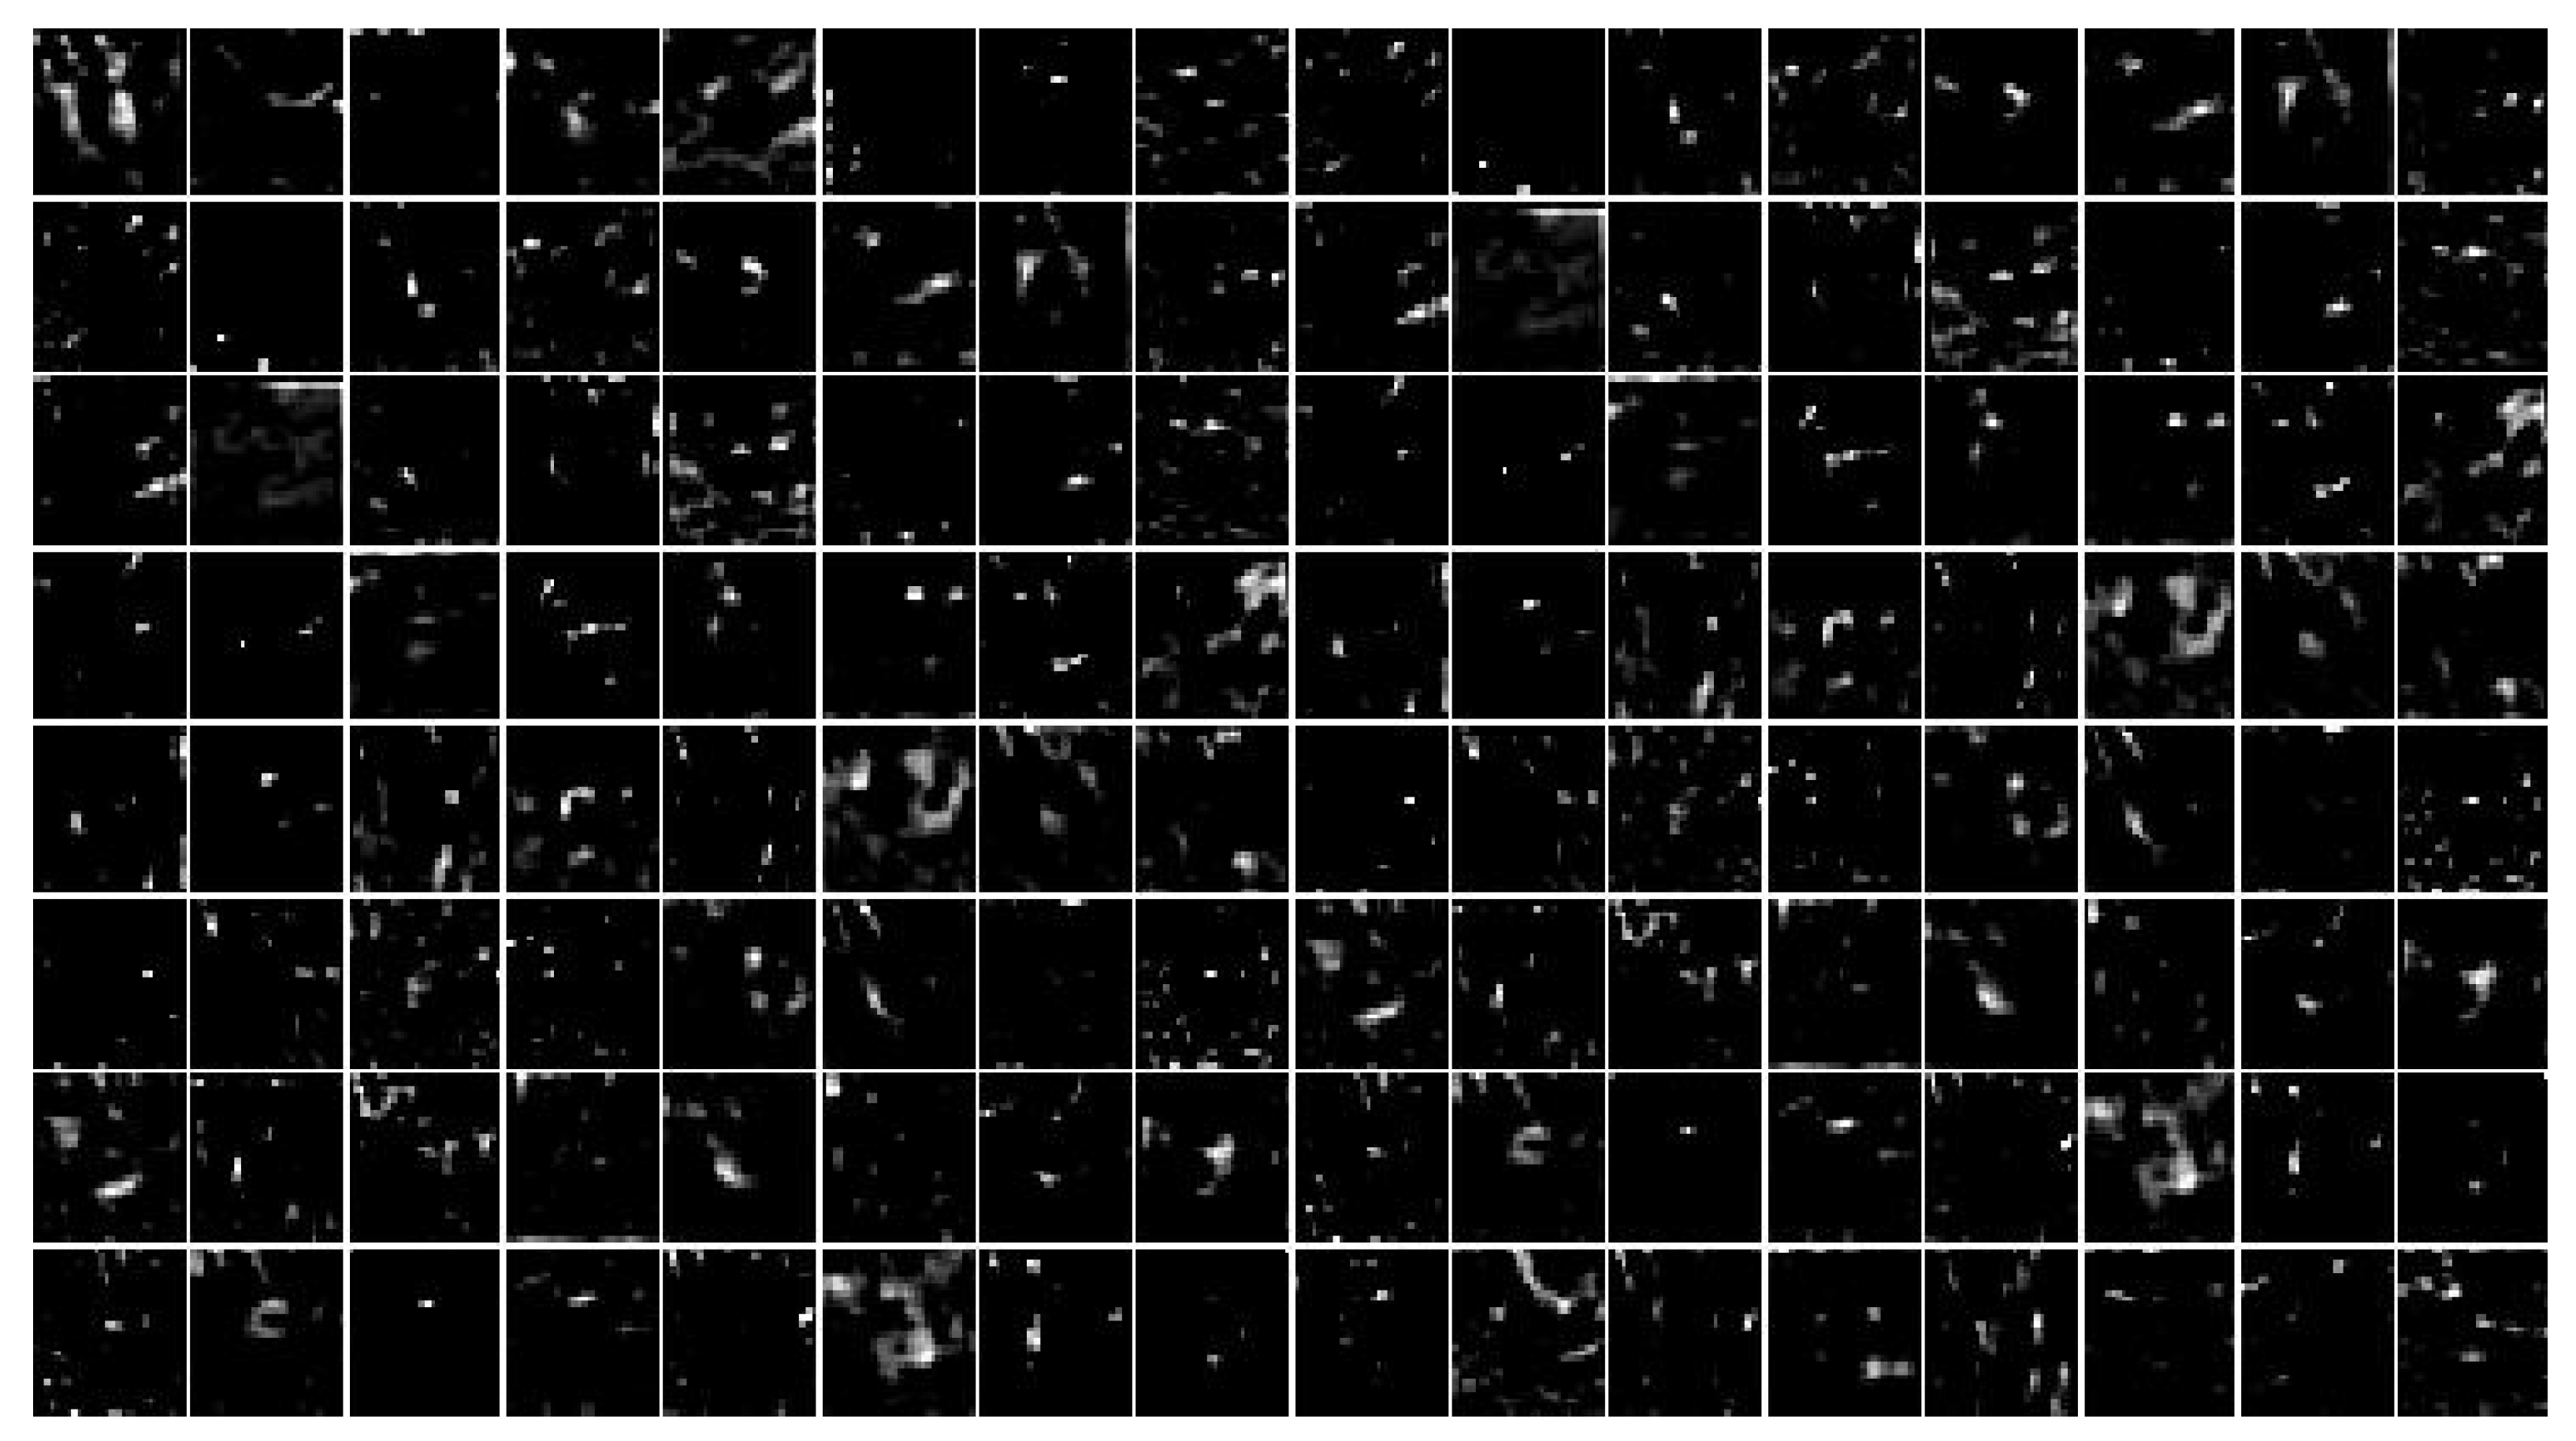
Figure 1. The overall framework of our algorithm.
Remotesensing 14 05958 g001
Figure 2. The result of proposed dimensionality reduction method: (a) original HSI; (b) global spectral curve; (c) local spectral curve; (d) final spectral curve; (e) result image.
Remotesensing 14 05958 g002
Figure 3. The first 32 channels of deep features from conv 3-4.
Remotesensing 14 05958 g003
Figure 4. The first 128 channels of deep features from conv 4-4.
Remotesensing 14 05958 g004
Figure 5. The first 512 channels of deep features from conv 5-4.
Remotesensing 14 05958 g005
Figure 6. Schematic diagram of AS 3D HOG features. The original hyperspectral image is divided according to three different scales, HOG features are calculated separately in each cube, and each HOG feature is concatenated to obtain the final AS 3D HOG. The dark squares represent the results of spectral direction and the light squares represent the results of spatial directions.
Remotesensing 14 05958 g006
Figure 7. The first 32 channels of AS 3D HOG feature.
Remotesensing 14 05958 g007
Figure 8. All four weak response maps: (a) Conv 5-4 Response; (b) Conv 4-4 Response; (c) Conv 3-4 Response; (d) AS 3D HOG Response.
Remotesensing 14 05958 g008
Figure 9. A strong response map fused by four weak response maps with adaptive weights.
Remotesensing 14 05958 g009
Figure 10. Six experiment sequences in RGB. (a) Ball; (b) Bus; (c) Car; (d) Kangaroo; (e) Truck; (f) Worker.
Remotesensing 14 05958 g010
Figure 11. Qualitative results on the ball sequence.
Remotesensing 14 05958 g011
Figure 12. Qualitative results on the bus sequence.
Remotesensing 14 05958 g012
Figure 13. Qualitative results on the car sequence.
Remotesensing 14 05958 g013
Figure 14. Qualitative results on the kangaroo sequence.
Remotesensing 14 05958 g014
Figure 15. Qualitative results on the truck sequence.
Remotesensing 14 05958 g015
Figure 16. Qualitative results on the worker sequence.
Remotesensing 14 05958 g016
Figure 17. Quantitative results for all sequences.
Remotesensing 14 05958 g017
Figure 18. Quantitative results for sequences with challenge SV.
Remotesensing 14 05958 g018
Figure 19. Quantitative results for sequences with challenge OCC.
Remotesensing 14 05958 g019
Figure 20. Quantitative results for sequences with challenge BC.
Remotesensing 14 05958 g020
Figure 21. Qualitative results on the ball sequence in color.
Remotesensing 14 05958 g021
Figure 22. Qualitative results on the bus sequence in color.
Remotesensing 14 05958 g022
Figure 23. Qualitative results on the car sequence in color.
Remotesensing 14 05958 g023
Figure 24. Qualitative results on the kangaroo sequence in color.
Remotesensing 14 05958 g024
Figure 25. Qualitative results on the truck sequence in color.
Remotesensing 14 05958 g025
Figure 26. Qualitative results on the worker sequence in color.
Remotesensing 14 05958 g026
Figure 27. Quantitative results for all sequences in color.
Remotesensing 14 05958 g027
Table 1. The details of six experiment sequences.
SequencesBallBusCarKangarooTruckWorker
Frames6253263311172211209
Resolution 471 × 207 351 × 176 512 × 256 385 × 206 512 × 256 228 × 121
Initial Size 19 × 21 85 × 92 188 × 84 22 × 41 17 × 17 9 × 19
ChallengesSV, OCCSV, FMSV, OCCSV, BCSV, OVLR, BC
Table 2. The details of precision results. The suffixes mean that the measurements are only counted in the sequences with the corresponding challenges. The best and the second best results are marked by symbols * and #, respectively.
MethodsPrecisionPrecision_SVPrecision_OCCPrecision_BC
Ours 0.931 0.949 0.926 0.88 #
MHT0.8890.9010.852 0.894
MFI-HVT 0.9 # 0.91 # 0.914 # 0.865
DeepHKCF0.7450.6940.4990.847
3DHOG0.5440.5570.5430.517
CNHT0.2890.3050.2410.258
Table 3. The details of success rate results. The suffixes mean that the measurements are only counted in the sequences with the corresponding challenges. The best and the second best results are marked by symbols * and #, respectively.
MethodsSuccessSuccess_SVSuccess_OCCSuccess_BC
Ours 0.661 0.678 0.582 0.625 #
MHT 0.565 # 0.535 # 0.526 # 0.627
MFI-HVT0.5260.5170.4860.542
DeepHKCF0.3240.3110.3330.349
3DHOG0.2460.2710.3910.194
CNHT0.09860.10.0680.0957
Table 4. The details of quantitative results. The best and the second best results are marked by symbols * and #, respectively.
MethodsOursECOMCCTTRACAKCFCNT
Precision 0.931 0.899 # 0.8940.8870.8450.788
Success 0.661 0.656 # 0.5970.5770.5290.525
Publisher’s Note: MDPI stays neutral with regard to jurisdictional claims in published maps and institutional affiliations.