Article

Rainfall Forecast Using Machine Learning with High Spatiotemporal Satellite Imagery Every 10 Minutes

by
Febryanto Simanjuntak
1,2,
Ilham Jamaluddin
3,
Tang-Huang Lin
4,5,*,
Hary Aprianto Wijaya Siahaan
2,6 and
Ying-Nong Chen
3,4
1
Malikussaleh Meteorological Station, The Agency for Meteorology, Climatology, and Geophysics of the Republic of Indonesia (BMKG), Jl. Bandara Malikussaleh, Muara Batu, Aceh Utara 24355, Indonesia
2
The Agency for Meteorology, Climatology, and Geophysics of the Republic of Indonesia (BMKG), Jl. Angkasa I No. 2, Kemayoran, Jakarta Pusat 10720, Indonesia
3
Department of Computer Science and Information Engineering, National Central University, No. 300, Jhongda Rd., Jhongli Dist., Taoyuan City 32001, Taiwan
4
Center for Space and Remote Sensing Research, National Central University, No. 300, Jhongda Rd., Jhongli Dist, Taoyuan City 32001, Taiwan
5
Center for Astronautical Physics and Engineering, National Central University, No. 300, Jhongda Rd., Jhongli Dist, Taoyuan City 32001, Taiwan
6
Domine Eduard Osok Meteorological Station, The Agency for Meteorology, Climatology, and Geophysics of the Republic of Indonesia (BMKG), Klabala, West Sorong, Sorong City 98411, Indonesia
*
Author to whom correspondence should be addressed.
Remote Sens. 2022, 14(23), 5950; https://doi.org/10.3390/rs14235950
Submission received: 4 October 2022 / Revised: 22 November 2022 / Accepted: 22 November 2022 / Published: 24 November 2022

Abstract

:
Increasing the accuracy of rainfall forecasts is crucial as an effort to prevent hydrometeorological disasters. Weather changes that can occur suddenly and in a local scope make fast and precise weather forecasts increasingly difficult to inform. Additionally, the results of the numerical weather model used by the Indonesia Agency for Meteorology, Climatology, and Geophysics are only able to predict the rainfall with a temporal resolution of 1–3 h and cannot yet address the need for rainfall information with high spatial and temporal resolution. Therefore, this study aims to provide the rainfall forecast in high spatiotemporal resolution using Himawari-8 and GPM IMERG (Global Precipitation Measurement: The Integrated Multi-satellite Retrievals) data. The multivariate LSTM (long short-term memory) forecasting is employed to predict the cloud brightness temperature by using the selected Himawari-8 bands as the input and training data. For the rain rate regression, we used the random forest technique to identify the rainfall and non-rainfall pixels from GPM IMERG data as the input in advance. The results of the rainfall forecast showed low values of mean error and root mean square error of 0.71 and 1.54 mm/3 h, respectively, compared to the observation data, indicating that the proposed study may help meteorological stations provide the weather information for aviation purposes.

Graphical Abstract

1. Introduction

Precipitation is an essential element of the hydrological cycle on Earth and is a crucial input to a large variety of hydrological and meteorological processes [1,2]. In addition, precipitation measurement at high spatiotemporal resolution is required to represent the hydrological conditions of natural systems accurately. An in-depth analysis of precipitation features, including rainfall pattern and intensity, is needed to study the hydrometeorological behavior of any catchment [2,3,4].
The traditional way to measure precipitation is through the ground-based station and weather radars to provide precipitation data at a high temporal resolution [5]. However, the lack of ground-based instruments is the main issue in most parts of the world in providing precipitation measurements at a high spatial resolution, particularly in developing countries [6]. Additionally, weather radars are limited to anomalous propagation, signal attenuation, and beam blockage, making precipitation measurements from weather radars prone to various errors and uncertainties [7]. In the last decades, precipitation products derived from multiple algorithms from space have been successfully launched and operated, such as geostationary meteorological satellites (e.g., Himawari-8, GEOS (Geostationary Operational Environmental Satellite), and Fengyun-2), and low-orbit passive microwave satellite (e.g., TRMM (Tropical Rainfall Measuring Mission), and GPM (Global Precipitation Measurement)) [8], which can be used to provide the precipitation data in the remotely populated areas. Geostationary meteorological satellite and low-orbit passive microwave satellite have their advantages and disadvantages.
It has been widely known that the precipitation products derived from geostationary meteorological satellites have a relatively high spatial and temporal resolution despite the fact limited retrieval accuracy as the result of the indirect relationship between rainfall and cloud top brightness temperatures (TBB) [9,10]. On the other hand, the precipitation product from microwave sensors may provide data under bad weather conditions as the microwave radiation may penetrate through clouds [11]. Recently, the most well-known satellite-based precipitation products involved the integration of IR and MW to take advantage of their strengths. For example, the Precipitation Estimation from Remotely Sensed Information Using Artificial Neural Networks (PERSIANN) method estimates rainfall by generating relationships between IR and MW data [12].
Machine learning (ML) techniques such as artificial neural network (ANN) [13], deep learning (DL) [14], support vector machine (SVM) [15], random forest (RF) [16], adaptive network-based fuzzy inference system [17], and extreme learning machines [18] have been widely used in estimating rainfall recently [19,20]. The advantages of using ML are that its computation is relatively small and fast [21]. Unlike NWP, the data-driven models from ML have fewer assumptions and restrictions on modeling. Additionally, several ML frameworks such as TensorFlow [22], Theano [23], and Scikit-learn [24], allow users to explore sophisticated ML algorithms to perform high-performance forecasting.
Several studies have been conducted on generating precipitation using ML and DL. In [25], short-term rain forecasts were made using the dislocation support vector machine (DSVM) model. Observations and satellite data were used as the input data. The results were validated with the weather threat scores and showed a good prediction in the first to the next six hours. In [26], the author proposed a new approach, a modified version of the wavelet transform and artificial neural network (WANN), to predict rainfall and runoff in the river basin. Compared to the traditional WANN, the proposed model shows a better performance through uncertainty analysis. In [27], the authors recommend using recurrent neural networks (RNN) with a convolutional structure to deal with the spatiotemporal sequence forecasting problem. Additionally, in [28], the author proposed a system that incorporates the meteorological data with the regression functions. The results were compared to other ML techniques, such as RF, SVM, and a fitted linear model, showing the robustness of the system.
LSTM (long short-term memory) has been widely used in many remote sensing applications in the deep learning field. LSTM have shown a promising result in time series prediction since 1997, when LSTM was first proposed by Hochreiter and Schmidhuber [29]. The LSTM model outperforms other machine learning algorithms in catching the time-series dynamics of discharges while consuming less time and memory [30]. The author of [31] reveals a good result in modeling the rainfall–runoff process using the LSTM and performs more stability in different lead-time modeling than the ANN [32]. There has been no previous attempt to deploy the LSTM network on discharge forecasting in Indonesia to assess its performance in rainfall forecasting.
Breiman [16] introduced the RF approach, which has been frequently employed for classification and regression analysis. This approach trains multiple DT predictors, which are then averaged to enhance predicted accuracy and minimize overfitting. Additionally, it can identify nonlinear relationships between predictor and predictand variables. Despite the benefits listed above, the RF approaches does not allow the predictand values cannot be outside of the ranges of training data value [19,33].
Compared to the polar-orbiting satellite, the geostationary satellites (GEOs) captured images more frequently instead of once or twice a day, which is beneficial for rainfall forecasting. Therefore, it is possible to see how weather systems move and how quickly they change. Several meteorological agencies such as the National Oceanic and Atmospheric Administration (NOAA) of the United States, the China Meteorological Administration (CMA), the European Organization for the Exploitation of Meteorological Satellites (EUMETSAT), and the Japan Meteorological Agency (JMA) have launched geostationary meteorological satellites [34]. The next generation of geostationary satellite operated by JMA, Himawari-8, was successfully launched on 7 October 2014, and began to release the observation data on 7 July 2015. The Advanced Himawari Imager (AHI) sensor, which is equipped with 16 bands, is onboard Himawari-8 with various spatial resolutions ranging from 500 (visible band) to 2000 m (IR band) and temporal resolution of 10 min (http://www.jma-net.go.jp/msc/en/, accessed on 16 April 2022). However, the rainfall forecasting from Himawari-8 is quite limited, let alone those using ML.
This study aims to explore the ability of LSTM and RF to forecast rainfall by using Himawari-8 data and GPM IMERG data. By providing rainfall forecasting every 10 min interval, our study may capture a quick change in local rainfall in the Indonesia region. In addition, many meteorological stations in Indonesia provide takeoff–landing weather information, which requires accurate and quick weather information from the forecaster on duty at the Agency for Meteorology, Climatology, and Geophysics of the Republic of Indonesia (BMKG). Additionally, the hydrometeorological disaster often occurs in Indonesia, coinciding with heavy rainfall. Our study may also become the early warning system for anticipating the hydrometeorological disaster.
The structure of this paper is as follows. The satellite observations data, and the methods used, are described in Section 2. The results are presented in Section 3, including (1) Multivariate LSTM Himawari-8 forecasting; (2) random forest rainfall and non-rainfall classification results; (3) random forest rain rate regression; and (4) Testing results. Section 4 and Section 5 highlight the discussion and the conclusions.

2. Materials and Methods

2.1. Study Area

Indonesia is geographically located between two basins, the Indian Ocean and the Pacific Ocean, and two continents, namely the Asian continent and the Australian continent [35]. In addition, the Indonesian areas consist of about 17,000 islands and vary in topography ranging from 0 to 4800 m above sea level. Consequently, the weather and climate variation are complex in Indonesia [36]. In this study, the Indonesia areas will cover 12°S–10°N and 90°E–145°E, which includes Sumatra Island (denoted by Su in Figure 1), Kalimantan Island (denoted by K in Figure 1), Sulawesi Island (denoted by S in Figure 1), Java Island (denoted by J in Figure 1), Lesser Sunda Island which ranged from Bali to Alor Island (denoted by B and A, respectively in Figure 1), and Papua Island (denoted by P in Figure 1).
The atmospheric dynamics in Indonesia are strongly affected by the Asian–Australian monsoon system, which comprised the southeast monsoon season, that usually occurs from June to August, and the northwest monsoon season, that usually occurs from December to February [37,38,39,40,41,42]. On an interannual scale, the atmospheric dynamics in Indonesia are significantly influenced by the ENSO (El Nino Southern Oscillation) and IOD (Indian Ocean Dipole). The ENSO is a natural global phenomenon that can be identified by the sea surface temperature changes over the Pacific Ocean, which includes El Niño (related to drought in Indonesia) and La Niña phases (related to the flood in Indonesia) [43,44]. ENSO events have a strong correlation with rainfall in southern Indonesia [45,46]. Additionally, the IOD is a seasonal oscillation of sea surface temperatures in the Indian Ocean. The high activity of the IOD has been linked to droughts in Indonesia [47].
The rainfall characteristics in Indonesia can be divided into three regions: Region A, Region B, and Region C. Region A cover southern Sumatra, southern Kalimantan, Java Island, Lesser Sunda Island, Sulawesi, and Papua. The rainfall type in Region A is a monsoonal type, in which the wet and dry seasons can be clearly identified. Region B cover northern Sumatra and northern Kalimantan. The rainfall type in Region B is equatorial type, which has a two-times peak rainfall within a year. Region C includes northern Sulawesi and Maluku. The rainfall type in Region C is the local type, which is the opposite type of the monsoonal type that occurs in Regions A [45]. A quick change in weather often occurs in Indonesia, which is caused by the varied global phenomena such as ENSO, IOD, Asia-Australia monsoon, and some interactions due to the local influences [48], which lead to hydrometeorological disasters such as landslides [49]. Therefore, providing rainfall forecasting with sufficient accuracy is needed to prevent any hydrometeorological disasters.

2.2. Data

2.2.1. Himawari-8

The Japan Meteorological Agency (JMA) launched Himawari-8, one of Japan’s next-generation geostationary meteorological satellites, on 7 October 2014, and it has been in Earth-synchronous orbit since 16 October 2014, at 140.7° [50]. AHI is a multispectral imaging payload onboard Himawari-8 that has 16 bands in total, comprising three visible bands, three near-infrared bands, and ten infrared bands. [51] With a geographical resolution of 0.5 to 2 km and a temporal resolution of 2.5 to 10 min, the AHI wavelengths range from 0.47 to 13.3 m. In addition to its main usage of distinct bands [52,53,54], it has other purposes.
Table 1 illustrates the specifications, spatial resolutions, and radiometric calibration accuracy of H8/AHI (http://www.data.jma.go.jp/mscweb/en/himawari89/spacesegment/doc/AHI8 performance test en.pdf, accessed on 16 April 2022). Bands 1–6, which are centered in the visible and near-IR wavelengths, are meant to measure earth-view surface-reflected solar radiation during daytime hours and are commonly used to retrieve cloud, aerosol, and vegetation properties or create true color [55]. During the day and night, thermal emission radiations from Earth objects may be detected in the thermal emissive bands (bands 7–16). The measured radiances at the 3.8 µm band are inevitably impacted by sunlight throughout the day and at dusk (the 3.8 µm band contains both reflected and emissive radiations). We employ the 10 min temporal resolutions TBBs detected by nine IR bands (Bands 8–16) of H08/AHI from 6.24 to 13.28 m on 21 August 2021, from 10.00 UTC to 15.00 UTC, to forecast quantitative precipitation using a machine learning technique to eliminate the impacts of heterogeneous reflected sunlight. The radiometric calibration accuracies of H08 AHI’s IR bands are about 0.25 percent (Table 1), assuring model stability and consistency.

2.2.2. GPM IMERG

Recently, in 2014, NASA and Japan Aerospace Exploration Agency (JAXA) cooperated to launch the Global Precipitation Measurement (GPM) satellite after the impressive success of TRMM. It consists of one main observatory satellite and ten other partner satellites, carrying an up-to-date Dual-frequency Precipitation Radar (DPR), GPM Microwave Imager (GMI), and other innovative instruments [56,57]. According to NASA, the GPM provides four levels of data which are Level-0, Level-1, Level-2, and Level-3. The Level-3 product is the Integrated Multi-satellite Retrievals for GPM (IMERG), released in early 2015, and has since gained more attention and recommendations from researchers and practitioners. IMERG products have a high resolution (spatially 0.1° latitude × 0.1° longitude) and multiple temporal resolutions (ranging from half-hourly to monthly basis). It includes three modes of output namely an early-run (IMERG-E), late-run (IMERG-L), and final-run (IMERG-F) product based on latency and accuracy. The near-real-time products are pure satellite products, which are released 4 h and 12 h after real-time, respectively; while the post-real-time IMERG-F is calibrated with the GPCC data and released after about 2 months [58,59]. The IMERG products were requested and collected from NASA’s website through the link (https://pmm.nasa.gov/data-access/downloads/gpm, accessed on 16 April 2022).

2.2.3. Observation Data

For the observation data, we used the rainfall data from the Agency of Meteorology, Climatology, and Geophysics Indonesia, which is available at 3 h intervals. For instance, the data on 21 August 2021, at 10.00 UTC, represent the accumulation of rainfall from 07.00 UTC to 10.00 UTC. We then compared the accumulation of rainfall forecast results to the observation rainfall from any available meteorological stations in Indonesia that have a rainfall accumulation larger than 0 mm per 3 h.

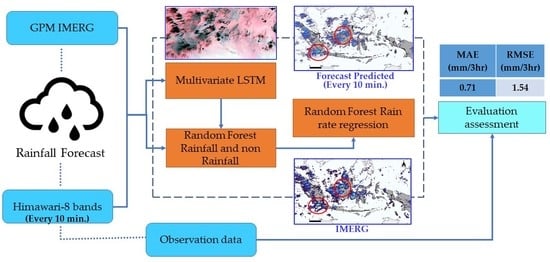
2.3. Machine Learning Method

The machine learning method for this research is divided into three steps (Figure 2). The first step is multivariate LSTM to predict the Himawari-8 forecast in 60 min based on 90 min of Himawari-8 input data (Section 2.3.1). The second step is to predict rain and non-rain pixels by using random forest classification (RFc) (Section 2.3.2). The third step is to predict the rain rate value (mm/h) by using random forest regression (RFr) (Section 2.3.3). In general, the whole process of the machine learning method in this research started with the input data from Himawari-8 (90 min) and the target data from Himawari-8 (60 min); the Himawari-8 data was trained by using a multivariate LSTM model to produce trained multivariate LSTM model. The trained multivariate LSTM model was used to predict the Himawari-8 forecast in 60 min by using the new 90 min Himawari-8 input data.
The second and third steps used Himawari-8 as the input data and IMERG as the target data. The matching process for Himawari-8 with IMERG data based on the available time of IMERG (every 30 min) was used here to select the input data for the second and third steps. Then the trained RFc model was used to predict rain and non-rain pixels from the forecast Himawari-8 in 60 min. The subsequent process involved selecting the rain pixels and then using a trained RFr model to forecast the rain rate value in rain pixels. The final output from this research is a forecasted rain rate value in 60 min with a 1 km spatial resolution.
The machine learning model in this study was used to forecast rain rate values in 60 min using 90 min of input data. The final goal of this study was to forecast the rain rate from 13:00 to 15:00 UTC on 21 August 2021. The model was updated every 30 min; to produce forecasting results from 13:00 to 15:00, this required a 4-step model (Supplementary Materials). Each step consisted of the first 90 min of Himawari-8 data for the input multivariate LSTM and the next 60 min for the target, then the trained multivariate LSTM model used the next 90 min to produce 60 min of the Himawari-8 forecast result.
Meanwhile, the RF classification and regression training process used 30 min of data from 90 min of Himawari-8 and IMERG data within the time range of input forecasting. Then, the trained RF classification and RF regression model were used to predict rainfall and non-rainfall pixels and rain rate values from the produced 60 min Himawari-8 forecast result, and the IMERG data within the range of forecast results were used for the evaluation assessment. For example, in model Step 1, the goal of model Step 1 was to forecast the rain rate from 13:00 to 13:50, the input and target data for the multivariate LSTM training process was from 09:00 to 11:20, then the forecast input was from 11:30 to 12:50, and the predicted Himawari-8 forecast was from 13:00 to 13:50. The input data for the RF classification and regression training process within the time range of forecast input (11:30, 12:00, and 12:30), then the IMERG data at 13:00 and 13:30 was used for evaluation assessment.

2.3.1. Multivariate LSTM Forecasting

Long short-term memory (LSTM) is a recurrent neural network and has the ability to exploit long-term spectral–temporal relationships. The main idea of LSTM is to predict the future value by considering the relationship of previous data from the previous time step. The inner structure of LSTM starts with the “forget gate layer” by using the sigmoid layer to decide what information we are going to throw away from the cell state, then the next step is to decide what information to store in the cell state by using “input gate layer” and the tanh layer, then the new candidate value will be updated in the next step, and the final step is to decide what information for LSTM output from filtering version by using sigmoid and tanh layer.
This study used multivariate LSTM to forecast more than one variable. The multivariate LSTM in this study consisted of the input layer, encoder block, repeat vector layer, decoder block, and output layer. As shown in Figure 3, the input layer of this multivariate LSTM forecasting is a 3D tensor with shape (Xn, T, D), where the number of batches is denoted as Xn, timesteps are denoted as T, and the dimension of features is denoted as D. In this study the input layer consists of (Xn, 9, 16), where 9 is timesteps stand for 90 min Himawari-8 data, and 16 is the total number of Himawari-8 bands. The next part is the decoder block that consists of two LSTM layers, the first LSTM layer consists of 100 output feature maps with return sequences, while the second LSTM layer consists of 100 output feature maps without return sequences. The output from the encoder block was fed to the repeat vector layer with the shape of (6, 100), where 6 was the candidate forecast time steps (60 min) and 100 was the output feature maps from the encoder block. Then the repeat vector layer was used for the decoder block input. The decoder block consists of two LSTM layers with time steps of 6 and feature maps of 100 with return sequences for both LSTM layers. The final step is the output layer, the output layer used a time-distributed layer from Keras TensorFlow with 16 dense layers represented as the Himawari-8 bands. The predicted 16 features from Himawari-8 in 60 min were used as the input data for random forest classification to classify rain and non-rain pixels and random forest regression to predict the rain rate value from the rain pixel.
The multivariate LSTM model was constructed with Keras-TensorFlow. We divided the input for the training process to become training data (75%) and validation data (25%) to perform early stopping and model parameters’ tuning. The early stopping function is based on validation loss with a patience of 30 epochs and maximum epochs of 200. After the model parameters’ tuning, by considering the model performance based on validation data, the training process of multivariate LSTM model for this study was conducted with a batch size of 512, Huber Loss as the loss function, and Adam as the optimizer with a learning rate of 0.001.

2.3.2. Random Forest Rainfall and Non-Rainfall Classification

The next step after the multivariate LSTM output was RF classification for rainfall and non-rainfall classification. The RF algorithm is a tree-based classification that consists of more than one tree and uses majority voting in the final step to decide the final class. In this study, we have two classes, namely the non-rain class, which represents non-rain pixels, and the rain class, which represents rainy pixels and has a rain rate value of more than 0 mm/h. The IMERG data were first reclassified from rain rate to rain and non-rain class and used as the target data, while Himawari-8 bands were firstly resampled to 0.1° and used for the input data. The input data for the RFc rainfall and non-rainfall classification process was within the time range of Himawari-8 forecast input data. Then the trained RFc model was used to classify the forecasted Himawari-8 in 60 min with 0.02° spatial resolution. So, the final output from this second step is rain and non-rain pixels from forecasted Himawari-8 in 60 min with 0.02° spatial resolution.

2.3.3. Random Forest Rain Rate Regression

The next step was RFr for rain rate prediction from all rain pixels. The idea of RF for regression is the same as with the RF for classification, but in the final step, the RFr uses averaging output value from each tree to decide the final rain rate value. The rain pixels in IMERG and Himawari-8 were first selected for the training data. We just used the rain pixel value for the RFr training process in this step. The training data for RFr rain rate regression process is within the time range of Himawari-8 forecast input data and IMERG data. So, the training data is the rain rate value from IMERG every 30 min. Then, the trained RFr model was used to predict rain rate value based on rain pixels from previous RFc classified the forecasted Himawari-8 in 60 min. So, the final output from this third step is the rain rate value from the forecasted Himawari-8 in 60 min with 0.02° spatial resolution.

2.4. Evaluation Assesment

Several statistical indices are used to measure and compare the performance of rainfall forecasting results against the GPM IMERG rainfall products and rainfall observations at selected meteorological stations in Indonesia. These indices include Mean Absolute Error (MAE) and Root Mean Square Error (RMSE). Table 2 is a detailed list of the statistical indices. MAE demonstrates the average absolute error between rainfall forecasting results and rainfall observations. Additionally, RMSE evaluates the average squared error magnitude between the rainfall forecasting results and observed rainfall data. To compare the rainfall forecasting results (resampled to match the GPM IMERG’s spatial resolution) against the GPM IMERG rainfall products, the GPM IMERG rainfall products every 30 min (corresponds to the availability of GPM IMERG rainfall products) was used. Additionally, for comparing the rainfall forecasting results against the rainfall observations at the 41 selected meteorological stations as shown in Figure 1, the accumulation of rainfall observations every three hours was compared with the accumulation of rainfall observations from the forecasting results.

3. Results

3.1. Machine Learning Model Result

3.1.1. Multivariate LSTM Himawari-8 Forecasting

The input data for the multivariate LSTM Himawari-8 forecasting is 90 min of Himawari-8 16 bands, and the target data is 60 min of Himawari-8 16 bands. The multivariate LSTM model was trained by using the input data until attaining the best-trained model by using the early stopping function. The validation data (25%) were used here to perform the early stopping function by considering the loss value; the model will automatically stop if the loss value does not decrease again. The trained model from multivariate LSTM will be used to forecast 16 bands of Himawari-8.
The trained model could forecast 16 bands of Himawari-8 for 60 min by using 90 min of data as the input. Based on the four-step processing in Supplementary Materials, the Himawari-8 multivariate LSTM forecasting result was from 13:00 to 13:50 in Step 1, 13:30 to 14:20 in Step 2, 14:00 to 14:50 in Step 3, and 14:30 to 15:20 in Step 4. The examples for the multivariate LSTM Himawari-8 forecasting result in Step 1 are shown in Figure 4. Based on Figure 4, the trained multivariate LSTM model from Step 1 was used to forecast the Himawari-8 for 60 min (13:00 to 13:50) by using the 90 min input Himawari-8 data from 11:30 to 12:50. The forecasted multivariate LSTM result in Step 1 (as the example) shows the promised results. The result shows the forecasted 16 bands of Himawari-8 from 13:00 to 13:50 have a similar pattern to the input data. Based on the example result in Figure 4, the trained multivariate LSTM successfully forecasted 16 bands of Himawari-8 for 60 min.

3.1.2. Random Forest Rainfall and Non-Rainfall Classification Result

The next result was from the second process or RF classification. The RFc produced rain and non-rain classification based on forecasted Himawari-8 for 60 min (every 10 min) with spatial resolution of 0.02 ° . The final results of RF classification from this study are predicted rain and non-rain pixels from 13:00 to 15:00 every 10 min. The visual comparison between IMERG data as the ground truth and forecast predicted rain and non-rain pixels at 13:00, 13:30, and 14:00 as shown in Figure 5. The final result was every 10 min, but in the figure just shows each 30 min for visual comparison purposes, because IMERG only provided rain data every 30 min.
Based on the visual comparison result, in general, the predicted rain and non-rain results have a similar pattern with the IMERG data, which means the RFc model successfully classified forecasted Himawari-8 images into rain and non-rain pixels. The advantages of our predicted results are that we can provide every 10 min rain and non-rain forecast results and they have a finer spatial resolution (0.02°) than the IMERG data (0.1°). The forecast predicted rain and the non-rain result shows acceptable results if we compare them with IMERG data. Almost all the rain pixels from IMERG data were successfully identified as rain pixels based on the RFc result. The forecast predicted result successfully classified the rain pixels in Region A, which cover southern Sumatra, southern Kalimantan, Java Island, Lesser Sunda Island, and Sulawesi, except for the Papua. Additionally, a similar pattern can also be seen from the predicted rainfall and the IMERG in Region B, which cover northern Sumatra and northern Kalimantan. The main reason is that the central and western areas have more rain pixels. In contrast, the forecast predicted by RFc failed to classify the rain pixels around Region C, which cover the Sulawesi and Maluku due to fewer rain pixels existing in these locations.
The comparison results from the IMERG rain pixel with the forecast predicted RFc result to forecast the rain pixels every 30 min shows a promising result. Based on the visual analysis, we can see the rain pixels from IMERG decreasing from 13:00 to 14:00. It also happened to the forecast predicted RFc result, in which we can see the total rain pixels from 13:00 to 14:00 also decreased. This pattern demonstrated the forecasted 16 bands from the multivariate LSTM that were used here for RFc, succeeded in predicting rain areas every 10 min.

3.1.3. Random Forest Rain Rate Regression

The predicted rain pixels from the previous step were used to predict the rain rate value based on the trained RF regression model. The RFr produced rain rate values based on the forecasted Himawari-8 for 60 min (every 10 min) with a spatial resolution of 0.02°. The final results of RF regression from this study are predicted rain rate values based on rain pixels from 13:00 to 15:00 every 10 min.
The visual comparison between IMERG data as the ground truth and forecast predicted rain rate value at 13:00, 13:30, and 14:00 is shown in Figure 6. The final result was every 10 min, but the figure just shows each 30 min for visual comparison purposes, because IMERG only provided rain data every 30 min. Based on the visual comparison result, in general, the predicted rain rate value at 13:00, 13:30, and 14:00 have a similar pattern to the IMERG rain rate value. The trained RF regression models successfully predicted rain rate values every 10 min.
Based on the visualization results, the forecast predicted rain rate successfully predicts low to medium rain rate value, but has difficulty in predicting high rain rate value. It is related to the total high rain rate training pixels being fewer than the total low or medium rain rate value. For example, in the southwest area, there are groups of high rain rate values found in the IMERG data from 13:00 to 14:00 (red circle, Figure 6). The forecast predicted rain rate at 13:00 successfully predicts the high rain rate value in the southwest area, but the forecast predicted result at 13:30 and 14:00 just predict that area as the medium rain rate value This also happened to the central area (Kalimantan Island), there are groups of high rain rate value from IMERG dataset, but the forecast predicted rain rate only predicts that area as the medium rain rate value.

3.2. Testing Result

The predicted rain rate and rain non-rain classification results at 13:00, 13:30, 14:00, 14:30, and 15:00 were evaluated by using the IMERG dataset. The evaluation assessment results are shown in Table 3. The RF classification overall accuracy results were larger than 0.80 for all the testing times. Additionally, the average RFc overall accuracy is 0.83, which is an acceptable result. MAE and MSE were calculated to evaluate RF regression results. Based on the result, the average MAE from all the testing times was 0.336 mm/h with the largest error being 0.371 mm/h (13:30) and the lowest error being 0.318 mm/h (15:00). While for the RMSE results, the average RMSE result was 1.463 mm/h with the largest RMSE value is 1.676 (15:00) and the lowest is 1.222 (13:00). Based on the evaluation results, the RFc and RFr models have acceptable results in comparison with IMERG data.
The frequency histogram from predicted rain rate and IMERG data is shown in Figure 7. The frequency histogram represents the distribution of rain rate in the “x” axis and occurrence frequencies in the “y” axis. Those histogram aims to determine the comparison of rain rate distribution between predicted result and IMERG data. This figure shows the frequency histogram in the time series data from the testing data (13:00, 13:30, 14:00, 14:30, and 15:00). Overall, according to the predicted and IMERG data, the distribution of rain rate values at 13:00, 13:30, 14:00, 14:30, and 15:00 mostly range from 0 to 10 mm/h, and there is only a partial range of rain rate values larger than 15 mm/h.
In the first test data (13:00), which had the smallest RMSE value, the distribution of the predicted rain rate value almost matched the IMERG data with small overestimate rain rate values in the range of 1 to 3 mm/h. In the second test data (13:30), overall, the distribution of predicted results had a similar pattern with IMERG data, the predicted rain rate value has underestimated results in the range of 0 to 1 mm/h, overestimated results in the range of 1 to 3 mm/h, whereas the predicted rain rate value almost matched the IMERG data in the range of 3 to 10 mm/h. In the third test data (14:00), the distribution of predicted results seemed to be overestimated in the range of 0–3 mm/h; however, overall, the distribution of predicted results had a similar pattern with IMERG data. In the fourth test data (14:30), the predicted rain rate had high overestimated in the range of 0 to 1 mm/h, the distribution of the predicted rain rate did not really come close with the IMERG data but still had the same pattern. In the last test data (15:00), we pointed the predicted rain rate also had a high overestimation in the range of 0 to 1 mm/h, but almost matched IMERG data in the range of 1 to 2 mm/h.
Overall, the predicted rain rate distribution based on the frequency histogram had the same patterns as the IMERG data, which means the model has an acceptable result to predict the forecasted rain rate value. We noticed the model result had better performance when forecasting the data that is closest to the initial time and then the performance decreases when it is used to predict data that is far from the initial time. It is also shown in the RMSE calculation that the first test data (13:00) has a smaller RMSE value (1.222 mm/h) compared to the last testing data (15:00), which has an RMSE value of 1.676 mm/h. This issue will be our main consideration for the future research.

4. Discussion

The study on rainfall forecast in high spatiotemporal resolution using a machine learning approach in Indonesia is limited. The adaptive network-based neuro fuzzy inference system has been used to predict rainfall in Banyuwangi, East Java, Indonesia [60]. Meanwhile, [61] LSTM based on rainfall parameters: El-Nino and Indian Ocean Dipole. The El-Nino and IOD parameters were employed in the first scheme, while the rainfall time series pattern was used in the second scheme in the investigations. The forecast findings employing rainfall characteristics produced a more accurate prediction with a MAAPE (Mean Arctangent Absolute Percentage Error) value of 0.5810 in Sidoarjo, East Java, Indonesia. Additionally, [62] employed conventional approaches such as seasonal autoregressive integrated moving average (SARIMA), and machine learning approaches such as gradient boosting and support vector machine (SVM) to predict rainfall in Bogor, West Java, Indonesia. The author found that the SVM provides an accurate result with a small MAPE (Mean Absolute Percentage Error). In addition, [63] explored the single and multi-layer LSTM model by adding intermediate variable signals into the LSTM memory block to build an adaptive model for predicting the weather variable such as temperature, pressure, humidity, and dew point. A comparison study was conducted between the Adaline method and the multiple linear regression method for rainfall forecasting in Kota Denpasar, Bali [64].
In our study, we used the Himawari-8 data and GPM IMERG data as the input data, which allowed us to produce high spatiotemporal rainfall forecast results. To the best of our knowledge, we are the first to generate rainfall forecasts in high spatiotemporal resolution using satellite data in the Indonesia region, particularly. We used the satellite data in this study as the satellite data to provide wide-ranging spatial coverage and continuous monitoring, which allows us to generate rainfall forecasts in high spatiotemporal resolution.
For evaluation purposes, we also calculated the error of the rainfall forecast results to the observations data selected from 41 meteorological stations in Indonesia (Figure 1). The Mean Absolute Error (MAE) was 0.71 mm/3 h, while the Root Mean Square Error was 1.54 mm/3 h. The low (high) value of MAE and RMSE indicate rainfall forecast results present a reliable (not reliable) result compared to the observations data.
As shown in Table 4, in comparison with the other rainfall products (GSMaP and GSMaP-Gauge Calibrated), the average MAE from all the testing times was 0.3134 mm/h and 0.365 mm/h with the largest error being 0.3381 mm/h (13:00) and 0.2895 mm/h (14:00) for the GSMaP and GSMaP-Gauge Calibrated products, respectively. While for the RMSE results, the average RMSE result was 1.3374 mm/h and 1.155 mm/h with the largest RMSE value being 1.4515 mm/h (15:00) and the lowest being 1.239 mm/h (15:00) for the GSMaP and GSMaP-Gauge Calibrated products, respectively. Based on the evaluation results, the rainfall forecasting results showed a good forecasting within the time interval in comparison with GSMaP and GSMaP-Gauge Calibrated data.
The rainfall forecast in high spatiotemporal resolution is needed to meet the end-user requirement. For instance, the need for a quick and accurate rainfall forecast for landing–takeoff purposes. Quick weather changes frequently occur in some areas that have not had sophisticated equipment such as weather radar, particularly in developing countries. The limited instrument often constrains a weather forecaster to rely on the numerical weather prediction results, which are limited to temporal resolution (time interval) and satellite imagery only.
Additionally, the rainfall forecast in high spatiotemporal resolution may also be the answer to the need for early warning of extreme weather in Indonesia. Recently, the weather forecaster used the numerical weather prediction products provided by many meteorological agencies that have a rainfall forecast for every 3 to 6 h time intervals. The information from the numerical weather prediction products does not meet the need for a quick and accurate rainfall forecast for landing–takeoff purposes. Our study may solve these issues by providing a quick and accurate rainfall forecast.

5. Conclusions

The results of this study show that LSTM and RF could forecast the rainfall by using Himawari-8 data. The RF classification overall accuracy results are more than 0.80 in all testing times, and the average RF overall accuracy is 0.83, which is an acceptable result. MAE and RMSE are calculated to evaluate RF regression results. The MAE average value from all the testing times is 0.336 mm/h. Meanwhile, the average RMSE value is 1.463 mm/h. Based on the result, the models could be implemented in a hydrometeorological disaster early warning system, because the model can provide rainfall forecasting information in 10 min intervals with 2 km spatial resolution, which is a high spatiotemporal resolution with a reliable result compared to the observation data. Additionally, it also may capture a quick change in local rainfall in the Indonesia region, which can be used to help the weather forecaster at any meteorological station to provide weather information for aviation purposes in Indonesia.

Supplementary Materials

The following supporting information can be downloaded at: https://www.mdpi.com/article/10.3390/rs14235950/s1.

Author Contributions

F.S., I.J., T.-H.L. and H.A.W.S. designed the research and conceived the analysis. F.S. and H.A.W.S. collected and processed the data. F.S., I.J. and Y.-N.C. analyzed the data and wrote the manuscript. Y.-N.C. provided analysis tools. T.-H.L. and Y.-N.C. supervised the manuscript. F.S., I.J., T.-H.L. and H.A.W.S. edited the manuscript. All authors provided critical feedback and helped to edit and improve the manuscript. All authors have read and agreed to the published version of the manuscript.

Funding

This work was financially supported by Taiwan Ministry of Science and Technology (MOST) (Grant MOST 111-2111-M-008-027 and MOST 111-2119-M-008-006).

Data Availability Statement

The data used in this study are open to the public and free to use. Himawari-8 data can be obtained from https://www.eorc.jaxa.jp/ptree/index.html (accessed on 16 April 2022), GPM IMERG data can be obtained from https://gpm.nasa.gov/data/sources (accessed on 16 April 2022), rainfall observation data can be obtained from any selected meteorological stations organized by The Agency for Meteorology, Climatology, and Geophysics of the Republic of Indonesia (BMKG).

Acknowledgments

The authors deeply appreciate the Himawari-8 data provided by JAXA JMA, rainfall products from Global Precipitation Measurement (GPM) satellite, and the rainfall observation data provided by The Agency for Meteorology, Climatology, and Geophysics of the Republic of Indonesia (BMKG). The authors are also very grateful to the editor and reviewers for their efforts in processing and reviewing the manuscript of this work.

Conflicts of Interest

The authors declare no conflict of interest. The funders had no role in the design of the study; in the collection, analyses, or interpretation of data; in the writing of the manuscript, or in the decision to publish the results.

References

  1. Katiraie-Boroujerdy, P.S.; Nasrollahi, N.; Hsu, K.L.; Sorooshian, S. Evaluation of satellite-based precipitation estimation over Iran. J. Arid Environ. 2013, 97, 205–219. [Google Scholar] [CrossRef] [Green Version]
  2. Mahmoud, M.T.; Al-Zahrani, M.A.; Sharif, H.O. Assessment of global precipitation measurement satellite products over Saudi Arabia. J. Hydrol. 2018, 559, 1–12. [Google Scholar] [CrossRef]
  3. Derin, Y.; Yilmaz, K.K. Evaluation of Multiple Satellite-Based Precipitation Products over Complex Topography. J. Hydrometeorol. 2014, 15, 1498–1516. [Google Scholar] [CrossRef] [Green Version]
  4. Saouabe, T.; El Khalki, E.M.; Saidi, M.E.; Najmi, A.; Hadri, A.; Rachidi, S.; Jadoud, M.; Tramblay, Y. Evaluation of the GPM-IMERG precipitation product for flood modeling in a semi-arid mountainous basin in Morocco. Water 2020, 12, 2516. [Google Scholar] [CrossRef]
  5. Yu, R.; Zhou, T.; Xiong, A.; Zhu, Y.; Li, J. Diurnal variations of summer precipitation over contiguous China. Geophys. Res. Lett. 2007, 34, 223–234. [Google Scholar] [CrossRef] [Green Version]
  6. Sharifi, E.; Steinacker, R.; Saghafian, B. Assessment of GPM-IMERG and other precipitation products against gauge data under different topographic and climatic conditions in Iran: Preliminary results. Remote Sens. 2016, 8, 135. [Google Scholar] [CrossRef] [Green Version]
  7. Islam, T.; Rico-Ramirez, M.A.; Han, D.; Srivastava, P.K.; Ishak, A.M. Performance evaluation of the TRMM precipitation estimation using ground-based radars from the GPM validation network. J. Atmos. Sol. Terr. Phys. 2012, 77, 194–208. [Google Scholar] [CrossRef]
  8. Huffman, G.J.; Bolvin, D.T.; Nelkin, E.J.; Wolff, D.B.; Adler, R.F.; Gu, G.; Hong, Y.; Bowman, K.P.; Stocker, E.F. The TRMM Multisatellite Precipitation Analysis (TMPA): Quasi-global, multiyear, combined-sensor precipitation estimates at fine scales. J. Hydrometeorol. 2007, 8, 38–55. [Google Scholar] [CrossRef]
  9. Kuligowski, R.J. GOES-R Advanced Baseline Imager (ABI) Algorithm Theoretical Basis Document for Rainfall Rate (QPE). Version 2.0, Algorithm Theoretical Basis Document (ATBD), Technical Report. 2010; pp. 1–44. Available online: https://www.ncei.noaa.gov/access/metadata/landing-page/bin/iso?id=gov.noaa.ncdc:C01517 (accessed on 16 April 2022).
  10. Thies, B.; Nauss, T.; Bendix, J. Discriminating raining from nonraining cloud areas at mid-latitudes using meteosat second generation SEVIRI night-time data. Meteorol. Appl. 2008, 15, 219–230. [Google Scholar] [CrossRef]
  11. Hou, A.Y.; Kakar, R.K.; Neeck, S.; Azarbarzin, A.A.; Kummerow, C.D.; Kojima, M.; Oki, R.; Nakamura, K.; Iguchi, T. The global precipitation measurement mission. Bull. Am. Meteorol. Soc. 2014, 95, 701–722. [Google Scholar] [CrossRef]
  12. Sorooshian, S.; Hsu, K.L.; Gao, X.; Gupta, H.V.; Imam, B.; Braithwaite, D. Evaluation of PERSIANN system satellite-based es-timates of tropical rainfall. Bull. Am. Meteorol. Soc. 2000, 81, 2035–2046. [Google Scholar] [CrossRef]
  13. Schmidhuber, J. Deep learning in neural networks: An overview. Neural Netw. 2015, 61, 85–117. [Google Scholar] [CrossRef] [PubMed] [Green Version]
  14. LeCun, Y.; Bengio, Y.; Hinton, G. Deep learning. Nature 2015, 521, 436–444. [Google Scholar] [CrossRef] [PubMed]
  15. Mountrakis, G.; Im, J.; Ogole, C. Support vector machines in remote sensing: A review. ISPRS J. Photogramm. Remote Sens. 2011, 66, 247–259. [Google Scholar] [CrossRef]
  16. Breiman, L. Random forests. Mach. Learn. 2001, 46, 5–32. [Google Scholar] [CrossRef] [Green Version]
  17. Talei, A.; Chua, L.H. Influence of lag time on event-based rainfall—Runoff modeling using the data driven approach. J. Hydrol. 2012, 438–439, 223–233. [Google Scholar] [CrossRef]
  18. Taormina, R.; Chau, K.W. Data-driven input variable selection for rainfall–runoff modeling using binary-coded particle swarm optimization and Extreme Learning Machines. J. Hydrol. 2015, 529, 1617–1632. [Google Scholar] [CrossRef]
  19. Kuhnlein, M.; Appelhans, B.T.; Naub, T. Precipitation estimates from MSG SEVIRI daytime, nighttime, and twilight data with random forests. J. Appl. Meteorol. Climatol. 2014, 53, 2457–2480. [Google Scholar] [CrossRef] [Green Version]
  20. Grimes, D.I.; Coppola, E.; Verdecchia, M.; Visconti, G. A neural network approach to real-time rainfall estimation for Africa using satellite data. J. Hydrometeorol. 2003, 4, 1119–1133. [Google Scholar] [CrossRef]
  21. Mosavi, A.; Ozturk, P.; Chau, K.W. Flood prediction using machine learning models: Literature review. Water 2018, 10, 1536. [Google Scholar] [CrossRef]
  22. Abadi, M. TensorFlow: A system for large-scale machine learning. In Proceedings of the 12th USENIX Symposium on Operating Systems Design and Implementation, Savannah, GA, USA, 2–4 November 2016. [Google Scholar]
  23. Bergstra, J. Theano: A CPU and GPU math compiler in Python. In Proceedings of the 9th Python in Science Conference (SciPy 2010), Austin, TX, USA, 28 June–3 July 2010; pp. 1–7. [Google Scholar]
  24. Pedregosa, F. Scikit-learn: Machine learning in Python. J. Mach. Learn. Res. 2011, 12, 2825–2830. [Google Scholar]
  25. Chen, X.; He, G.; Chen, Y.; Zhang, S.; Chen, J.; Qian, J.; Yu, H. Short-term and local rainfall probability prediction based on a dislocation support vector machine model using satellite and in-situ observational data. IEEE Access 2019. [Google Scholar] [CrossRef]
  26. Alizadeh, M.J.; Kavianpour, M.R.; Kisi, O.; Nourani, V. A new approach for simulating and forecasting the rainfall-runoff process within the next two months. J. Hydrol. 2017, 548, 588–597. [Google Scholar] [CrossRef]
  27. Shi, X.; Chen, Z.; Wang, H.; Yeung, D.; Wong, W.; Woo, W. Convolutional LSTM network: A machine learning approach for precipitation nowcasting. Adv. Neural Inf. Process. Syst. 2015, 28, 802–810. Available online: http://papers.nips.cc/paper/5955-convolutional-lstm-network-a-machine-learning-approach-for-precipitation-nowcasting (accessed on 17 November 2022).
  28. Pérez-Vega, A.; Travieso-González, C.; Hernández-Travieso, J. An Approach for Multiparameter Meteorological Forecasts. Appl. Sci. 2018, 8, 2292. [Google Scholar] [CrossRef] [Green Version]
  29. Hochreiter, S.; Schmidhuber, J. Long Short-Term Memory. Neural Comput. 1997, 9, 1735–1780. [Google Scholar] [CrossRef]
  30. Zhang, D.; Lin, J.; Peng, Q.; Wang, D.; Yang, T.; Sorooshian, S.; Liu, X.; Zhuang, J. Modeling and simulating of reservoir operation using the artificial neural network, support vector regression, deep learning algorithm. J. Hydrol. 2018, 565, 720–736. [Google Scholar] [CrossRef] [Green Version]
  31. Kratzert, F.; Klotz, D.; Brenner, C.; Schulz, K.; Herrnegger, M. Rainfall-runoff modelling using Long Short-Term Memory (LSTM) networks. Hydrol. Earth Syst. Sci. 2018, 22, 6005–6022. [Google Scholar] [CrossRef] [Green Version]
  32. Hu, C.; Wu, Q.; Li, H.; Jian, S.; Li, N.; Lou, Z. Deep learning with a long short-term memory networks approach for rain-fall-runoff simulation. Water 2018, 10, 1543. [Google Scholar] [CrossRef] [Green Version]
  33. Kühnlein, M.; Appelhans, T.; Thies, B.; Nauss, T. Improving the accuracy of rainfall rates from optical satellite sensors with machine learning—A random forests-based approach applied to MSG SEVIRI. Remote Sens. Environ. 2014, 141, 129–143. [Google Scholar] [CrossRef] [Green Version]
  34. Kidder, S.Q.; Vonder Haar, T.H. Satellite Meteorology, an Introduction; Academic Press: New York, NY, USA, 1995; Volume 466. [Google Scholar]
  35. Sipayung, S. The Spectrum Analysis of Meteorogical Elements in Indonesia. Master’s Thesis, Nagoya University, Nagoya, Japan, 1995. [Google Scholar]
  36. Pramudia, A. Climate Dynamics in Indonesia; Agricultural Research and Development Agency: Bangkok, Thailand, 2020. [Google Scholar]
  37. Gordon, A.L. Oceanography of the Indonesian seas and their throughflow. Oceanography 2005, 18, 15–27. [Google Scholar] [CrossRef] [Green Version]
  38. Setiawan, R.Y.; Habibi, A. Satellite detection of summer chlorophyll-a bloom in the gulf of tomini. IEEE J. Sel. Top. Appl. Earth Obs. Remote Sens. 2011, 4, 944–948. [Google Scholar] [CrossRef]
  39. Susanto, R.D.; Moore, T.S.; Marra, J. Ocean color variability in the Indonesian Seas during the SeaWiFS era. Geochem. Geophys. Geosyst. 2006, 7, 1–16. [Google Scholar] [CrossRef]
  40. Wyrtki, K. Physical oceanography of the southeast asian waters. Scientific results of marine investigation of the south China sea and the gulf of Thailand 1959–1961. Phys. Oceanogr. Southeast Asian Waters Naga Rep. 1961, 2, 195. [Google Scholar]
  41. Mohtadi, M.; Oppo, D.W.; Steinke, S.; Stuut, J.B.W.; Pol-Holz, D.; Hebbeln, D.; Lückge, A. Glacial to Holocene swings of the Australian–Indonesian monsoon. Nat. Geosci. 2011, 4, 540–544. [Google Scholar] [CrossRef]
  42. Pramuwardani, I.; Sopaheluwakan, A. Indonesian rainfall variability during Western North Pacific and Australian monsoon phase related to convectively coupled equatorial waves. Arab. J. Geosci. 2018, 11, 673. [Google Scholar] [CrossRef]
  43. Ropelewski, C.F.; Halpert, M.S. Global and Regional Scale Precipitation Patterns Associated with the El Niño/Southern Oscillation. Mon. Weather Rev. 1987, 115, 1606–1626. [Google Scholar] [CrossRef]
  44. Hendon, H.H. Indonesian rainfall variability: Impacts of ENSO and local air-sea interaction. J. Clim. 2003, 16, 1775–1790. [Google Scholar] [CrossRef]
  45. Aldrian, E.; Susanto, R.D. Identification of three dominant rainfall regions within Indonesia and their relationship to sea surface temperature. Int. J. Climatol. 2003, 23, 1435–1452. [Google Scholar] [CrossRef]
  46. Lee, H.S. General Rainfall Patterns in Indonesia and the Potential Impacts of Local Seas on Rainfall Intensity. Water 2015, 7, 1751–1768. [Google Scholar] [CrossRef]
  47. Saji, N.; Goswami, B.; Vinayachandran, P.; Yamagata, T. A dipole mode in the Tropical Ocean. Nature 1999, 401, 360–363. [Google Scholar] [CrossRef]
  48. McBride, M.; Haylock, M.R.; Nicholls, N. Relationships between the Maritime Continent Heat Source and the El Niño–Southern Oscillation Phenomenon Relationships between the Maritime Continent Heat Source and the El Niño–Southern Oscillation Phenomenon. J. Clim. 2003, 16, 2905–2914. [Google Scholar] [CrossRef]
  49. Muntohar, A.S.; Mavrouli, O.; Jetten, V.G.; van Westen, C.J.; Hidayat, R. Development of Landslide Early Warning System Based on the Satellite-Derived Rainfall Threshold in Indonesia. In Understanding and Reducing Landslide Disaster Risk; Springer: Cham, Switzerland, 2021; pp. 227–235. [Google Scholar]
  50. Da, C. Preliminary assessment of the Advanced Himawari Imager (AHI) measurement onboard Himawari-8 geostationary satellite. Remote Sens. Lett. 2015, 6, 637–646. [Google Scholar] [CrossRef]
  51. Bessho, K. An Introduction to Himawari-8/9-Japan’s New-Generation Geostationary Meteorological Satellites. J. Meteorol. Soc. Jpn. 2016, 94, 151–183. [Google Scholar] [CrossRef] [Green Version]
  52. Min, M. Developing the science product algorithm testbed for Chinese next-generation geostationary me-teorological satellites: FengYun-4 series. J. Meteorol. Res. 2017, 31, 707–719. [Google Scholar] [CrossRef]
  53. Greenwald, T.J.; Pierce, R.B.; Schaack, T.K.; Otkin, J.A.; Rogal, M.; Bah, K.; Lenzen, A.J.; Nelson, J.P.; Li, J.; Huang, H.-L. Real-time simulation of the GOES-R ABI for user readiness and product evaluation. Bull. Am. Meteorol. Soc. 2016, 97, 245–261. [Google Scholar] [CrossRef] [Green Version]
  54. Chen, D.; Guo, J.; Wang, H.; Li, J.; Min, M.; Zhao, W.; Yao, D. The cloud top distribution and diurnal variation of clouds over East Asia: Preliminary results from Advanced Himawari Imager. J. Geophys. Res. Atmos. 2018, 123, 3724–3739. [Google Scholar] [CrossRef]
  55. Miller, S.D.; Schmit, T.L.; Seaman, C.J.; Lindsey, D.T.; Gunshor, M.M.; Kohrs, R.A.; Sumida, Y.; Hillger, D. A sight for sore eyes: The return of true color to geostationary satellites. Bull. Am. Meteorol. Soc. 2016, 97, 1803–1816. [Google Scholar] [CrossRef]
  56. Huffman, G.; Bolvin, D. TRMM and Other Data Precipitation Data Set Documentation; NASA: Greenbelt, MD, USA, 2007; pp. 1–25.
  57. Kim, K.; Park, J.; Baik, J.; Choi, M. Evaluation of topographical and seasonal feature using GPM IMERG and TRMM 3B42 over Far-East Asia. Atmos. Res. 2017, 187, 95–105. [Google Scholar] [CrossRef]
  58. Schneider, U.; Becker, A.; Finger, P.; Meyer-Christoffer, A.; Ziese, M.; Rudolf, B. GPCC’s new land surface precipitation climatology based on quality-controlled in situ data and its role in quantifying the global water cycle. Theor. Appl. Climatol. 2014, 115, 15–40. [Google Scholar] [CrossRef] [Green Version]
  59. Tan, J.; Huffman, G.J.; Bolvin, D.T.; Nelkin, E.J. IMERG V06: Changes to the morphing algorithm. J. Atmos. Ocean. Technol. 2019, 36, 2471–2482. [Google Scholar] [CrossRef]
  60. Alfarisy, G.A.; Mahmudy, W.F. Rainfall Forecasting in Banyuwangi Using Adaptive Neuro Fuzzy Inference System. J. Inf. Technol. Comput. Sci. 2016, 1, 65–71. [Google Scholar] [CrossRef] [Green Version]
  61. Haq, D.Z.; Novitasari, D.C.R.; Hamid, A.; Ulinnuha, N.; Farida, Y.; Nugraheni, R.D.; Nariswari, R.; Rohayani, H.; Pramulya, R.; Widjayanto, A. Long Short-Term Memory Algorithm for Rainfall Prediction Based on El-Nino and IOD Data. Procedia Comput. Sci. 2021, 179, 829–837. [Google Scholar] [CrossRef]
  62. Abdullah, A.S.; Ruchjana, B.N.; Jaya, I.G.; Soemartini. Comparison of SARIMA and SVM model for rainfall forecasting in Bogor city, Indonesia. J. Phys. 2021, 1722, 012061. [Google Scholar] [CrossRef]
  63. Afan, G.S.; Yaya, H.; Edi, A.; Wayan, S. Single Layer & Multi-layer Long Short-Term Memory (LSTM) Model with Intermediate Variables for Weather Forecasting. Procedia Comput. Sci. 2018, 135, 88–98. [Google Scholar]
  64. Sutawinaya, I.P.; Astawa, I.N.G.A.; Hariyanti, N.K.D. Comparison of Adaline and Multiple Linear Regression Methods for Rainfall Forecasting. J. Phys. Conf. Ser. 2018, 953, 012046. [Google Scholar] [CrossRef]
Figure 1. Map of study area. The names of islands (marked by lowercase alphabet letters) are Sumatra (Su), Kalimantan (K), Java (J), Bali (B), Alor (A), Sulawesi (S), and Papua (P). The star sign indicates the available meteorological stations. The uppercase alphabet letters of A (purple color), B (blue color), and C (red color) shows the three regions used in this research “Reprinted/adapted with permission from Ref. [45]. 2017, Balai Besar Teknologi Modifikasi Cuaca”. The purple line means the borderline of Region A, the blue dash line means the borderline of Region B, and the red dash line means the borderline of Region C.
Remotesensing 14 05950 g001
Figure 2. The machine learning approaches. Th+n represents the time step of data, RF and LSTM are stands for random forest and long short-term memory, respectively.
Remotesensing 14 05950 g002
Figure 3. LSTM approaches.
Remotesensing 14 05950 g003
Figure 4. Himawari-8 LSTM forecast results.
Remotesensing 14 05950 g004
Figure 5. The visual comparison between IMERG data as the ground truth and forecast predicted rain and non-rain pixel, blue color (other colors) represents of the rain pixels (non-rain pixels).
Remotesensing 14 05950 g005
Figure 6. The visual comparison between IMERG data as the ground truth and forecast predicted rain rate value.
Remotesensing 14 05950 g006
Figure 7. Frequency histogram of predicted and IMERG data.
Remotesensing 14 05950 g007
Table 1. Himawari-8 specifications.
ChannelNo.Band (µm)Spatial Resolution (km)Calibration Accuracy (%)Primary Application
Visible & Near-Infrared10.471.02.63Aerosol
20.511.02.53Vegetation
30.640.52.55Vegetation
40.861.02.39Cirrus
51.612.02.73Cloud, Snow
62.252.02.82Cloud, Aerosol
Shortwave IR73.882.00.42Fire, Land and surface
Water Vapor86.242.00.34Water Vapor
96.942.00.29Water Vapor
107.352.00.24Water Vapor
Longwave IR118.62.00.2Water Vapor, Cloud
129.632.00.21Ozone
1310.42.00.23Cloud
1411.242.00.22SST, Cloud
1512.382.00.2SST, Cloud
1613.282.00.22Cloud
Table 2. Statistical indices used to evaluate the performance of rainfall forecasting results. K is the simulated data, O is the observed precipitation data, and n is the number of samples.
Statistical IndexEquation
Mean Absolute Error (MAE) MAE = 1 n i = 1 n K i O i  
Root Mean Square Error (RMSE) RMSE = 1 n i = 1 n K i O i 2
Table 3. The evaluation assessment results.
Time/ErrorMAE (mm/h)RMSE (mm/h)RnR Classification Accuracy
13:000.3391.2220.8360
13:300.3711.4040.8349
14:000.3301.4760.8359
14:300.3211.5350.8272
15:000.3181.6760.8205
Table 4. Error comparison with GSMaP and GSMaP-Gauge Calibrated rainfall products.
Comparison DataTime/ErrorMAE (mm/h)RMSE (mm/h)
GSMaP13:000.33811.2541
GSMaP14:000.28951.3067
GSMaP15:000.31271.4515
GSMaP-Gauge Calibrated13:000.397581461.1890213
GSMaP-Gauge Calibrated14:000.340815721.0395403
GSMaP-Gauge Calibrated15.000.356717351.2393955
Publisher’s Note: MDPI stays neutral with regard to jurisdictional claims in published maps and institutional affiliations.

