
Construction and Optimization of Ecological Security Pattern in the Loess Plateau of China Based on the Minimum Cumulative Resistance (MCR) Model

 ,
, 
Abstract
1. Introduction
2. Materials and Methods
2.1. Study Area
2.2. Materials
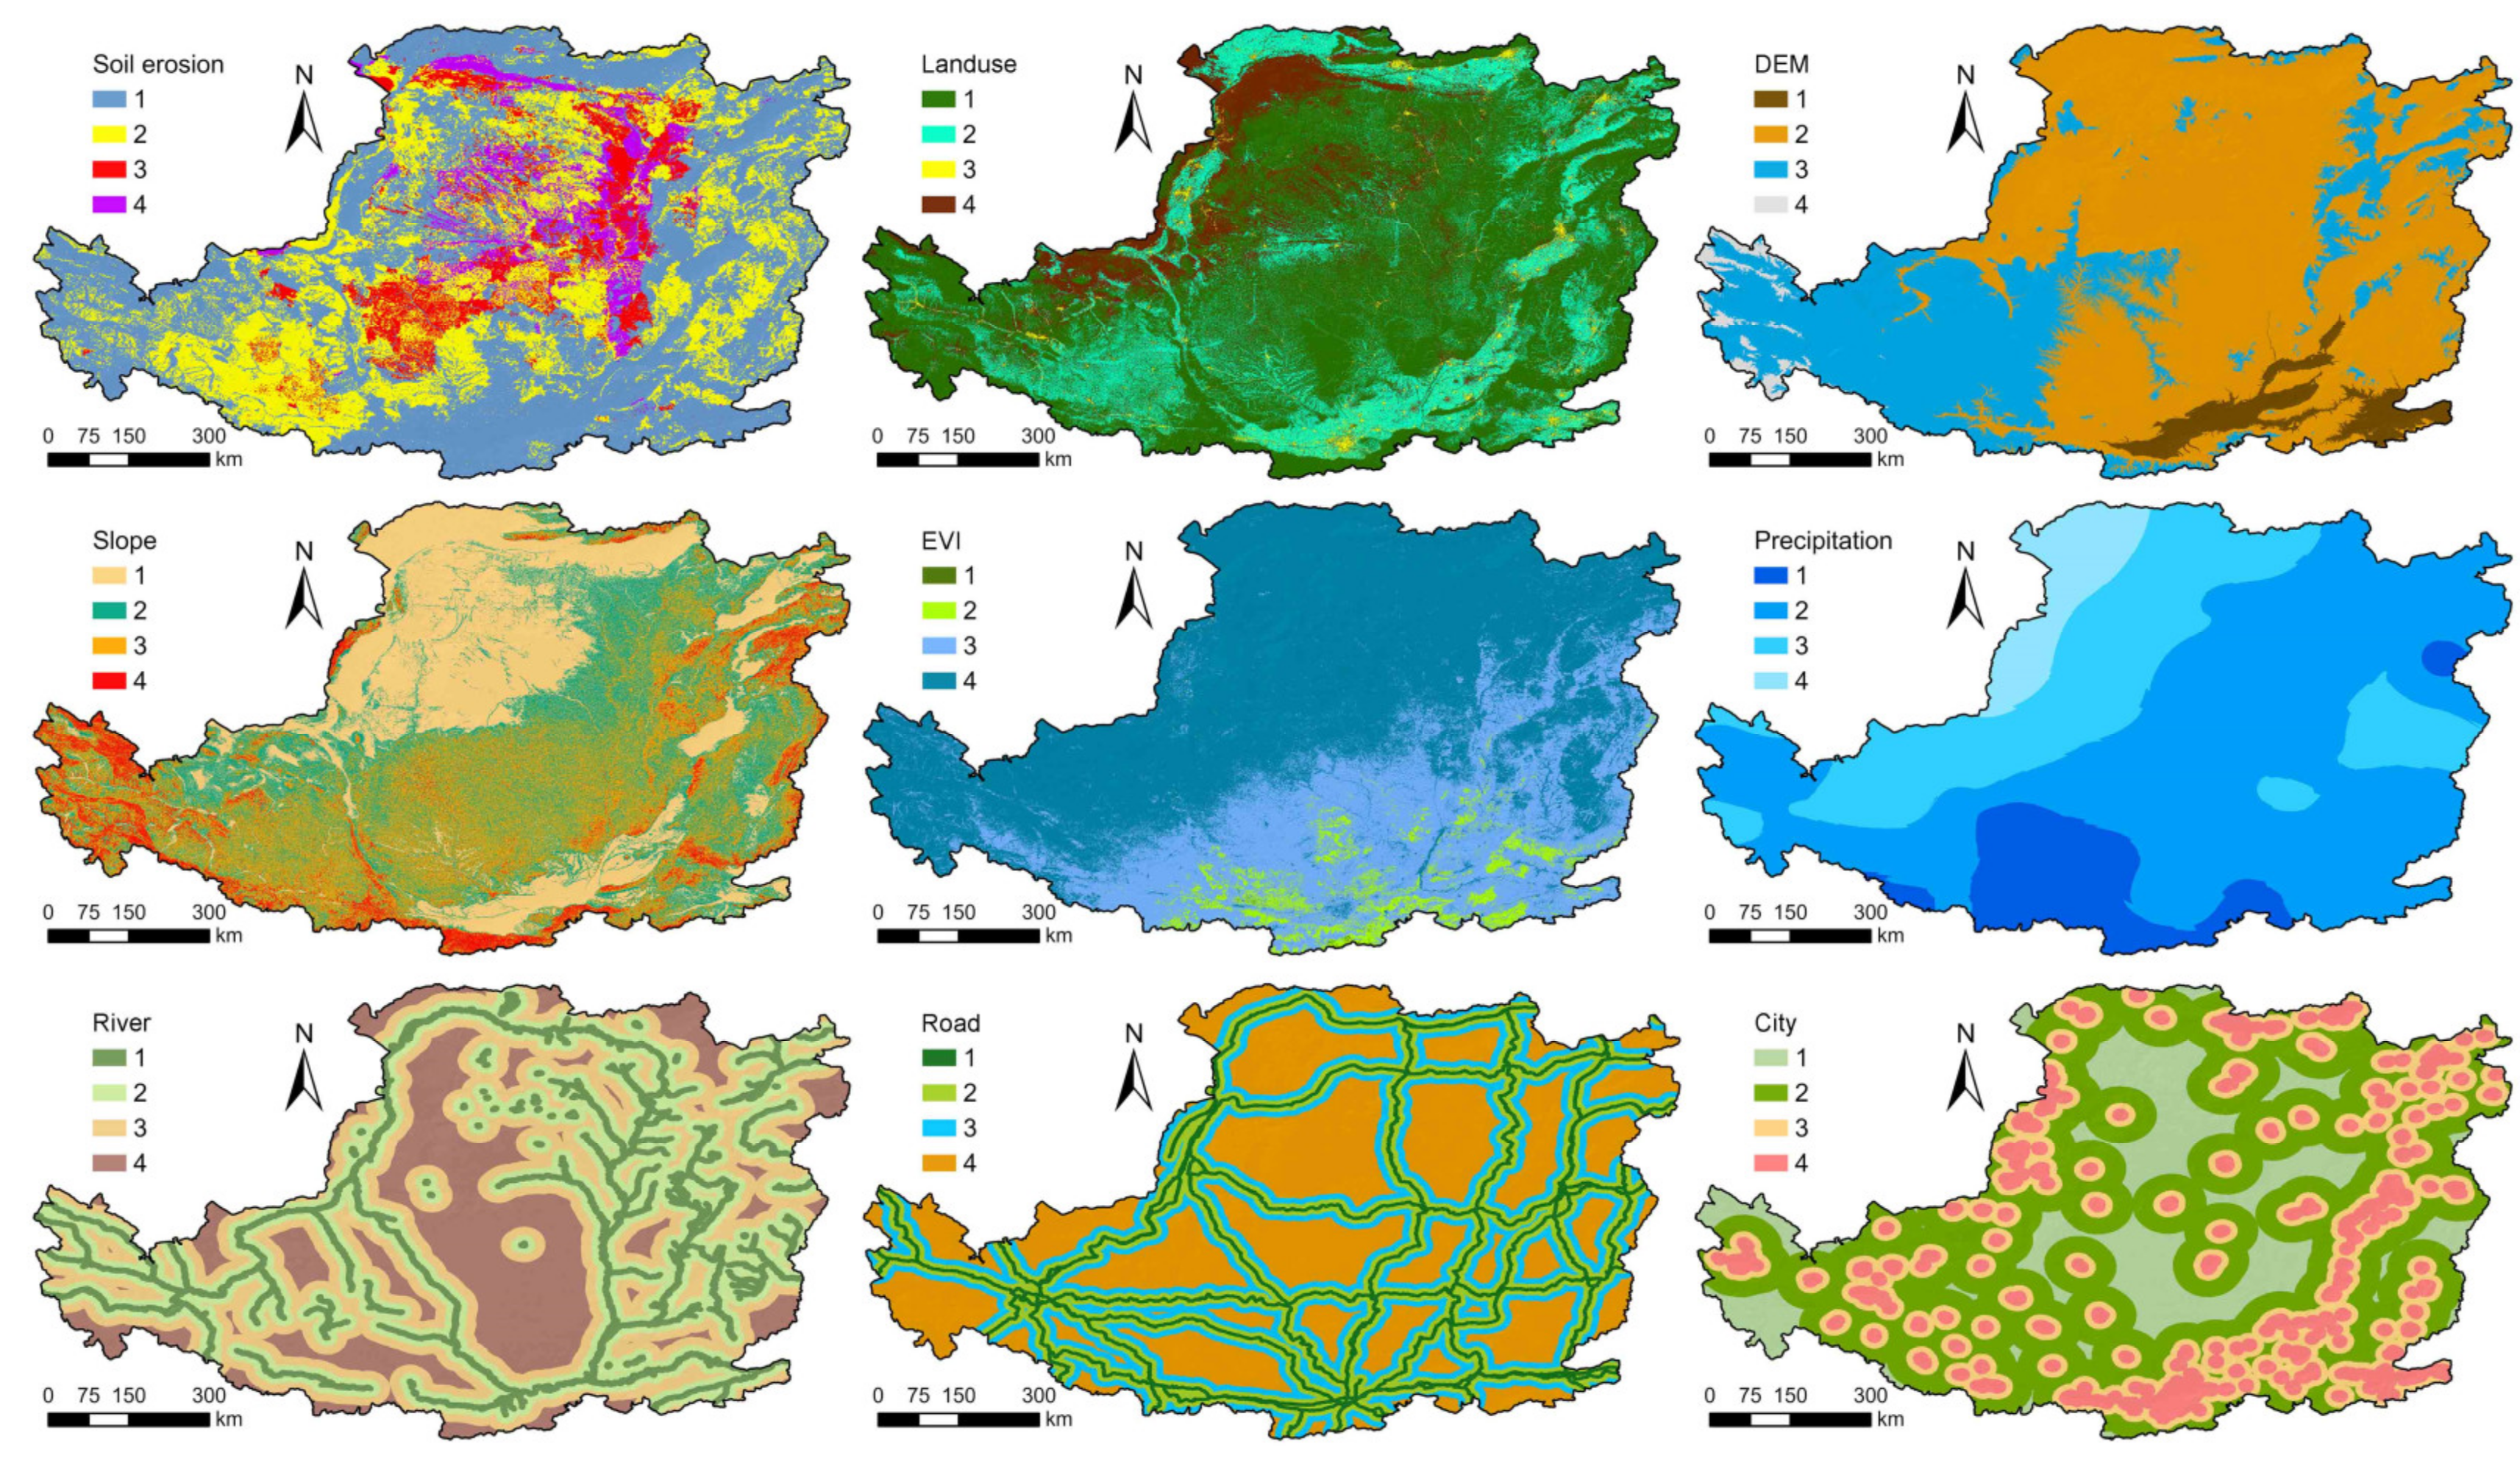
2.3. Methods
2.3.1. Identification of the Ecological Source
- (1)
- MSPA Pattern Analysis
- (2)
- Landscape connectivity
2.3.2. Resistance Surface Construction
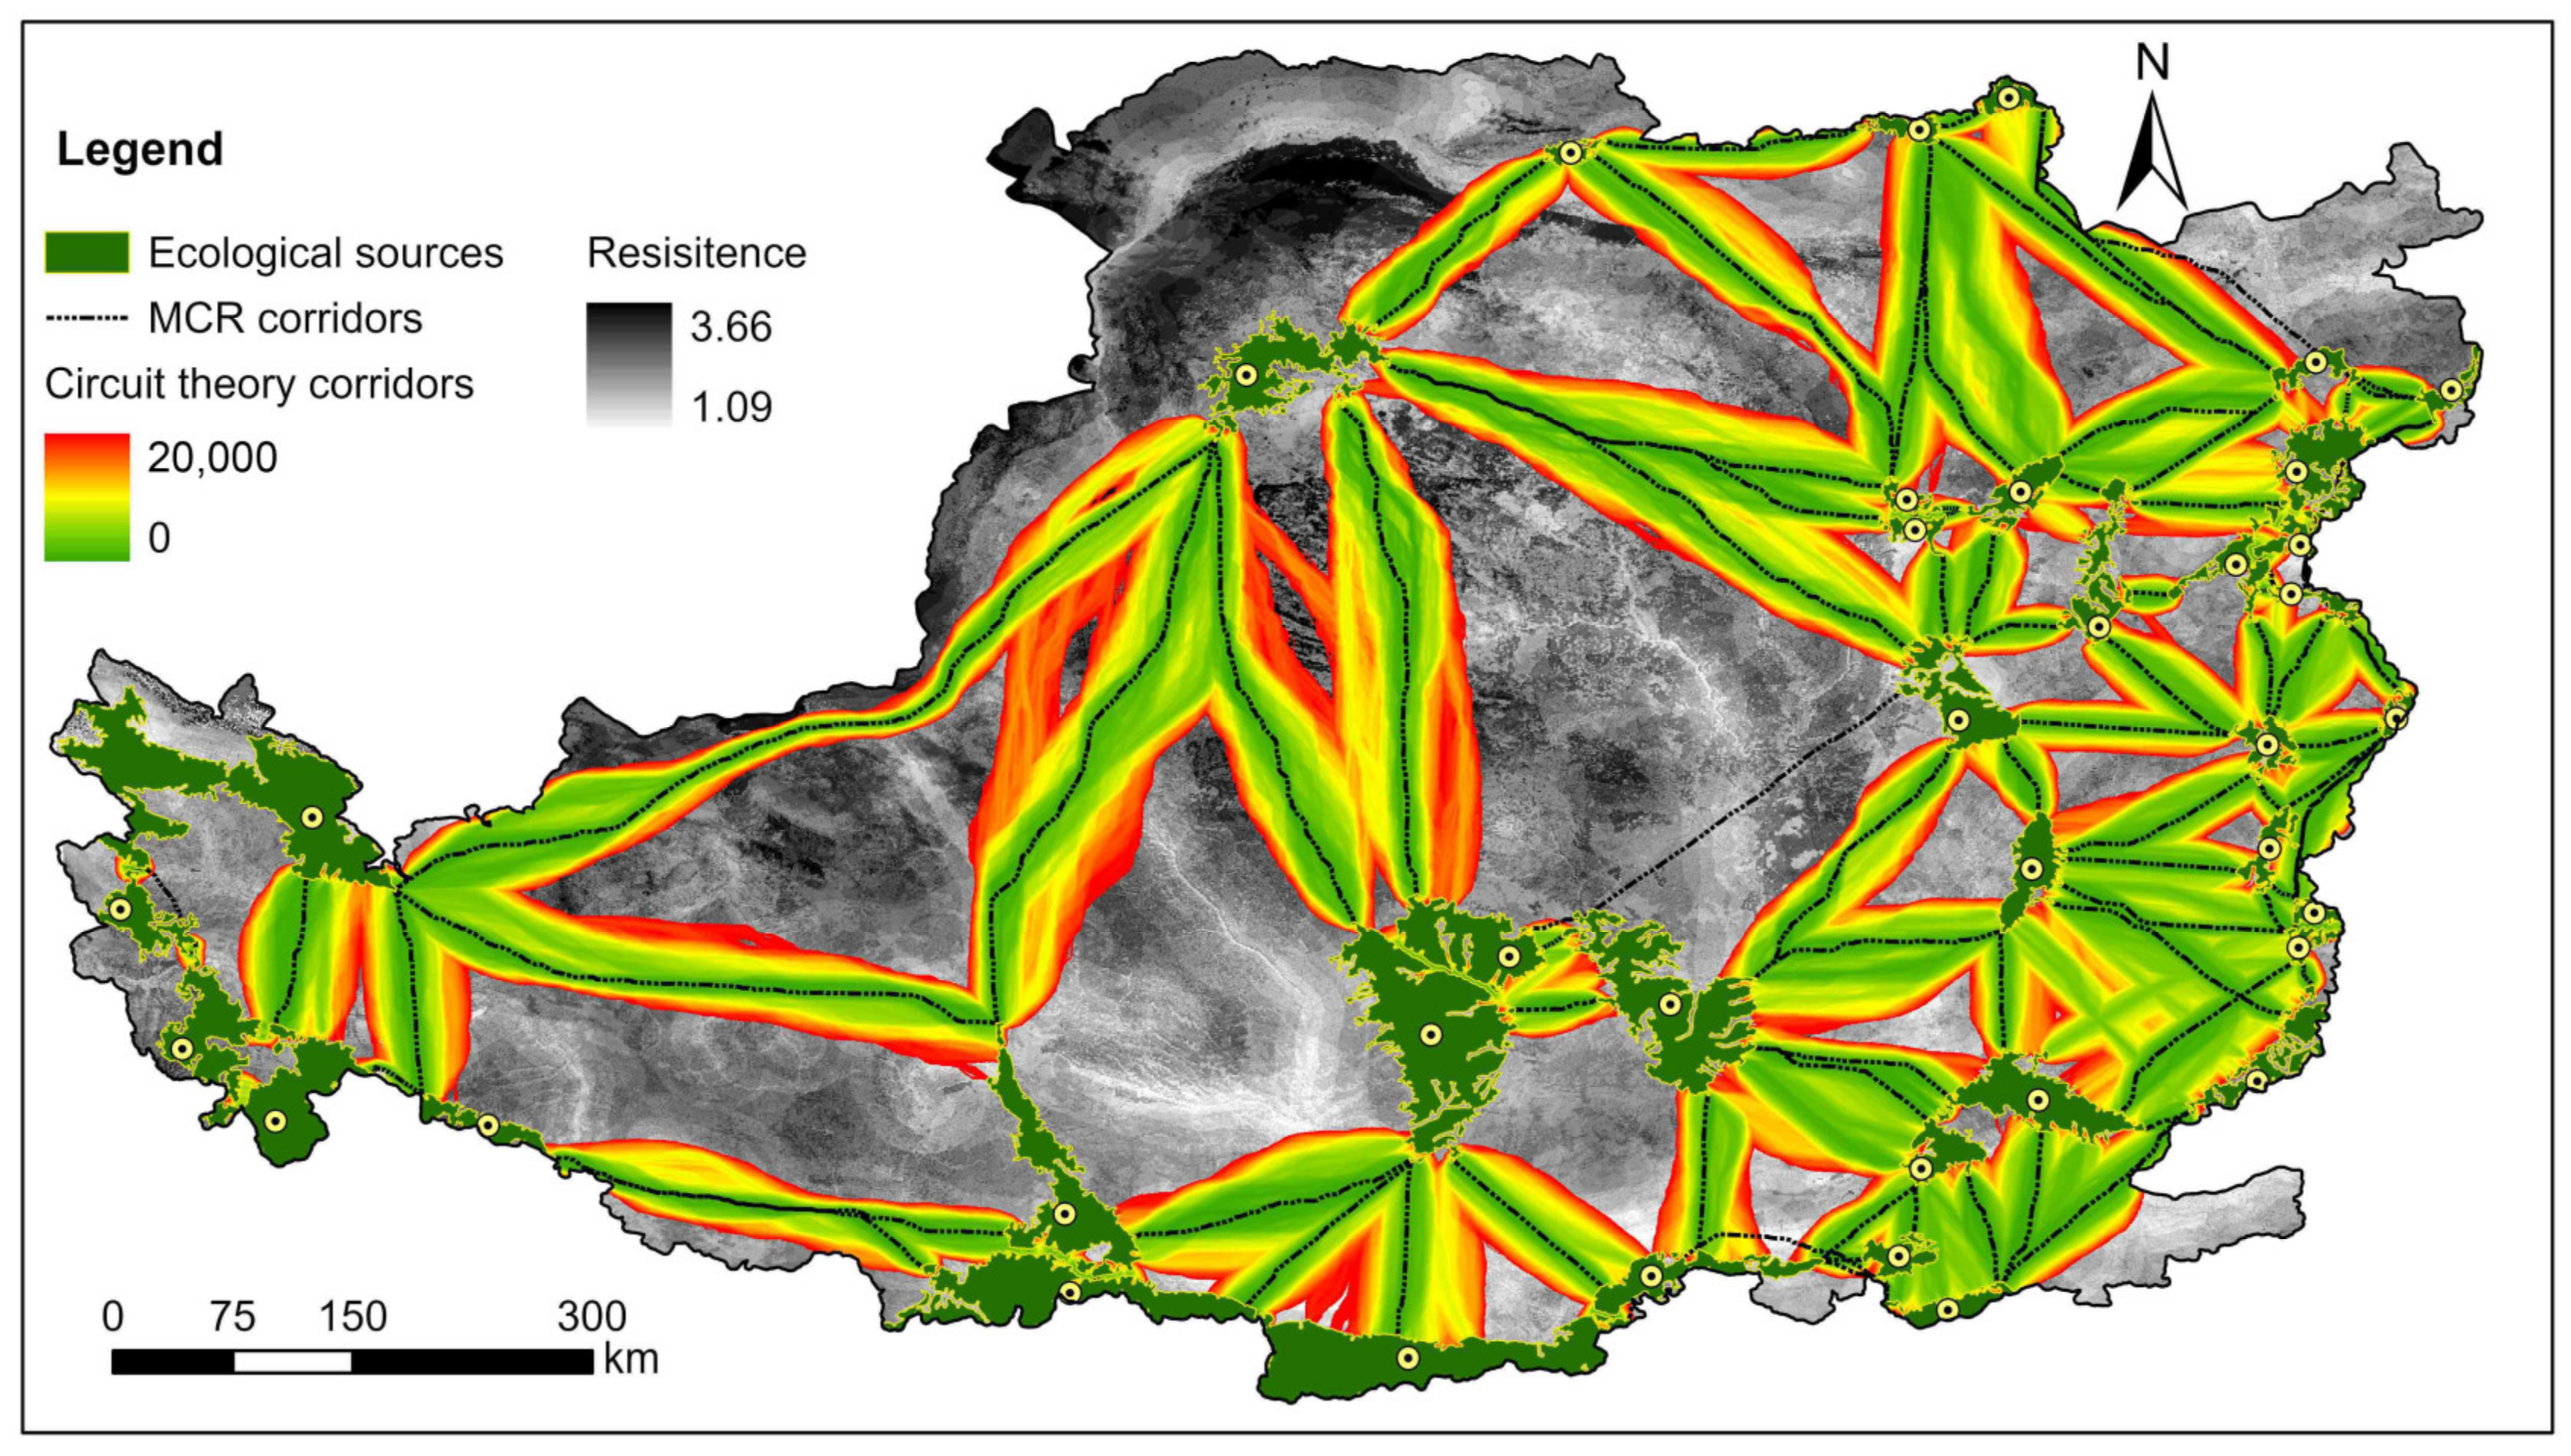
2.3.3. Extraction of Ecological Corridors and Nodes
3. Results
3.1. Results of Landscape Patterns Using MSPA and Ecological Source
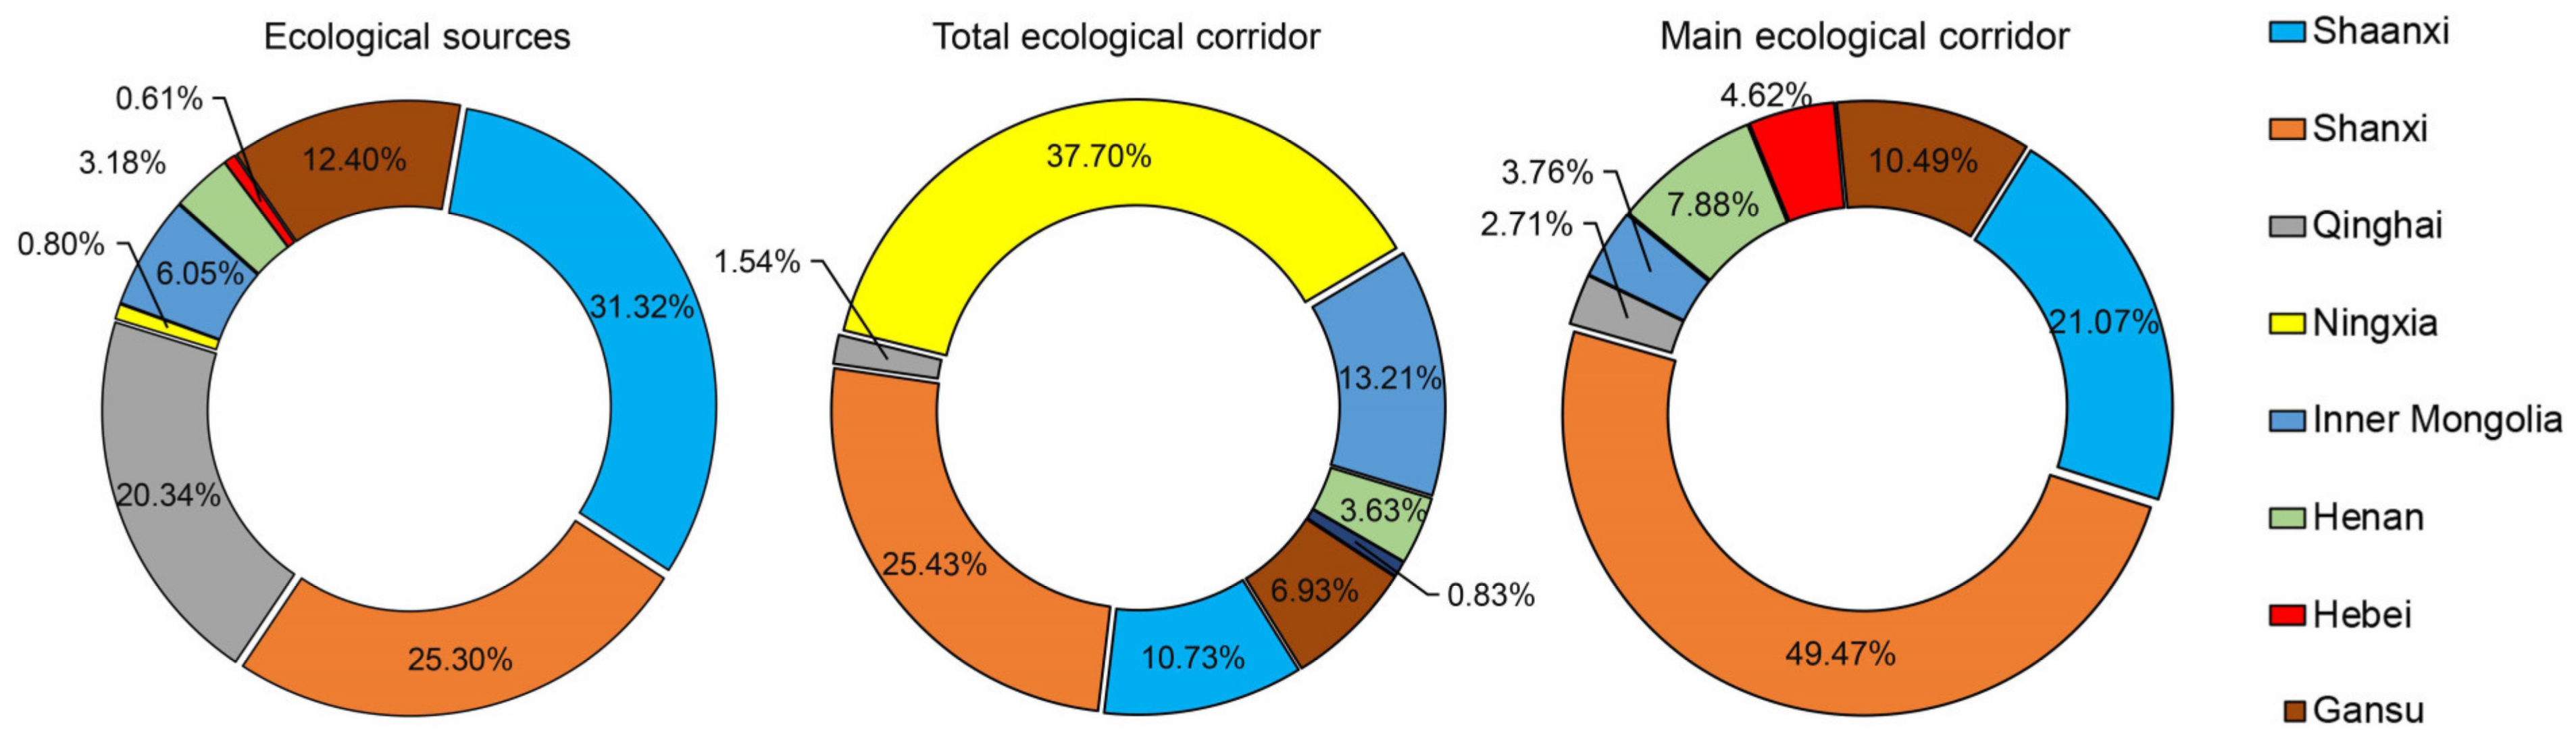
3.2. Ecological Network Structure Analysis Based on the MCR Model
3.3. Optimization Scheme of Ecological Spatial Security Pattern in LPC
4. Discussion
4.1. Construction of Resistance Surface Factors and Ecological Corridors
4.2. Influencing Factors of Regional Differences in ESP
4.3. Limitations and Future Research Directions
5. Conclusions
- (1)
- The dominant landscape type in the LPC is core (47.51%); among the core area, 57,757.8 km2 was identified as ecological sources due to its high landscape connectivity, and the spatial distribution shows a certain regional agglomeration effect.
- (2)
- Twenty-four main ecological corridors, seventy-two secondary ecological corridors, and fifty-three ecological nodes are extracted based on the MCR model. Most corridors and nodes are in the southeastern area of LPC, reflecting the efficient species migration and energy flow in this region. The opposite situation is that the spatial connectivity in the northern and northwestern parts of the study area is weak due to the low density of corridors and fewer ecological nodes.
- (3)
- Based on the identified ecological sources, corridors, and nodes, combined with the current status of land-use in the study area, soil erosion status, and other attributes, a “two barriers, five corridors, three zones, and multipoint” ESP optimization scheme was proposed to provide a reference for land space planning and ecological environment governance.
Author Contributions
Funding
Data Availability Statement
Acknowledgments
Conflicts of Interest
References
- Newbold, T.; Hudson, L.N.; Arnell, A.P.; Contu, S.; De Palma, A.; Ferrier, S.; Hill, S.L.L.; Hoskins, A.J.; Lysenko, I.; Phillips, H.R.P.; et al. Has Land Use Pushed Terrestrial Biodiversity beyond the Planetary Boundary? A Global Assessment. Science 2016, 353, 288–291. [Google Scholar] [CrossRef] [PubMed]
- Li, S.; Zhao, Y.; Xiao, W.; Yue, W.; Wu, T. Optimizing Ecological Security Pattern in the Coal Resource-Based City: A Case Study in Shuozhou City, China. Ecol. Indic. 2021, 130, 108026. [Google Scholar] [CrossRef]
- Jiang, W.; Cai, Y.; Tian, J. The Application of Minimum Cumulative Resistance Model in the Evaluation of Urban Ecological Land Use Efficiency. Arab. J. Geosci. 2019, 12, 714. [Google Scholar] [CrossRef]
- Li, J.; Xu, J.; Chu, J. The Construction of a Regional Ecological Security Pattern Based on Circuit Theory. Sustainability 2019, 11, 6343. [Google Scholar] [CrossRef]
- Cui, S.; Han, Z.; Yan, X.; Li, X.; Zhao, W.; Liu, C.; Li, X.; Zhong, J. Link Ecological and Social Composite Systems to Construct Sustainable Landscape Patterns: A New Framework Based on Ecosystem Service Flows. Remote Sens. 2022, 14, 4663. [Google Scholar] [CrossRef]
- Wei, H.; Xiong, L.; Tang, G.; Strobl, J.; Xue, K. Spatial–Temporal Variation of Land Use and Land Cover Change in the Glacial Affected Area of the Tianshan Mountains. Catena 2021, 202, 105256. [Google Scholar] [CrossRef]
- Zhou, X.; Wang, Y.-C. Spatial–Temporal Dynamics of Urban Green Space in Response to Rapid Urbanization and Greening Policies. Landsc. Urban Plan. 2011, 100, 268–277. [Google Scholar] [CrossRef]
- Jongman, R.H.G.; Külvik, M.; Kristiansen, I. European Ecological Networks and Greenways. Landsc. Urban Plan. 2004, 68, 305–319. [Google Scholar] [CrossRef]
- Zhang, Y.; Yu, B.; Ashraf, M.A. Ecological Security Pattern for the Landscape of Mesoscale and Microscale Land: A Case Study of the Harbin City Center. J. Environ. Eng. Landsc. Manag. 2015, 23, 192–201. [Google Scholar] [CrossRef][Green Version]
- Gao, J.; Wang, Y.; Zou, C.; Xu, D.; Lin, N.; Wang, L.; Zhang, K. China’s Ecological Conservation Redline: A Solution for Future Nature Conservation. Ambio 2020, 49, 1519–1529. [Google Scholar] [CrossRef]
- Huck, M.; Jędrzejewski, W.; Borowik, T.; Jędrzejewska, B.; Nowak, S.; Mysłajek, R.W. Analyses of Least Cost Paths for Determining Effects of Habitat Types on Landscape Permeability: Wolves in Poland. Acta Theriol. 2011, 56, 91–101. [Google Scholar] [CrossRef] [PubMed]
- Zhao, X.Q.; Xu, X.H. Research on Landscape Ecological Security Pattern in a Eucalyptus Introduced Region Based on Biodiversity Conservation. Russ. J. Ecol. 2015, 46, 59–70. [Google Scholar] [CrossRef]
- Zhang, S.; Shao, H.; Li, X.; Xian, W.; Shao, Q.; Yin, Z.; Lai, F.; Qi, J. Spatiotemporal Dynamics of Ecological Security Pattern of Urban Agglomerations in Yangtze River Delta Based on LUCC Simulation. Remote Sens. 2022, 14, 296. [Google Scholar] [CrossRef]
- Cao, K.; Huang, B.; Wang, S.; Lin, H. Sustainable Land Use Optimization Using Boundary-Based Fast Genetic Algorithm. Comput. Environ. Urban Syst. 2012, 36, 257–269. [Google Scholar] [CrossRef]
- Xie, H.; He, Y.; Choi, Y.; Chen, Q.; Cheng, H. Warning of Negative Effects of Land-Use Changes on Ecological Security Based on GIS. Sci. Total Environ. 2020, 704, 135427. [Google Scholar] [CrossRef]
- Huang, J.; Hu, Y.; Zheng, F. Research on Recognition and Protection of Ecological Security Patterns Based on Circuit Theory: A Case Study of Jinan City. Environ. Sci. Pollut. Res. 2020, 27, 12414–12427. [Google Scholar] [CrossRef]
- Lin, S.; Chen, N.; He, Z. Automatic Landform Recognition from the Perspective of Watershed Spatial Structure Based on Digital Elevation Models. Remote Sens. 2021, 13, 3926. [Google Scholar] [CrossRef]
- Bennett, A.F. Habitat Corridors and the Conservation of Small Mammals in a Fragmented Forest Environment. Landsc. Ecol. 1990, 4, 109–122. [Google Scholar] [CrossRef]
- Brose, U. Improving Nature Conservancy Strategies by Ecological Network Theory. Basic Appl. Ecol. 2010, 11, 1–5. [Google Scholar] [CrossRef]
- Zhang, L.; Peng, J.; Liu, Y.; Wu, J. Coupling Ecosystem Services Supply and Human Ecological Demand to Identify Landscape Ecological Security Pattern: A Case Study in Beijing–Tianjin–Hebei Region, China. Urban Ecosyst. 2017, 20, 701–714. [Google Scholar] [CrossRef]
- Pierik, M.E.; Dell’Acqua, M.; Confalonieri, R.; Bocchi, S.; Gomarasca, S. Designing Ecological Corridors in a Fragmented Landscape: A Fuzzy Approach to Circuit Connectivity Analysis. Ecol. Indic. 2016, 67, 807–820. [Google Scholar] [CrossRef]
- Sutton-Grier, A.E.; Bamford, H.; Wowk, K. Future of Our Coasts: The Potential for Natural and Hybrid Infrastructure to Enhance the Resilience of Our Coastal Communities, Economies and Ecosystems. Environ. Sci. Policy 2015, 51, 137–148. [Google Scholar] [CrossRef]
- Ayaviri Matuk, F.; Behagel, J.; Gonçalves Reynaud Schaefer, C.E.; Duque-Brasil, R.; Turnhout, E. Deciphering Landscapes through the Lenses of Locals: The “Territorial Social-Ecological Networks” Framework Applied to a Brazilian Maroon Case. Geoforum 2019, 100, 101–115. [Google Scholar] [CrossRef]
- Kong, F.; Yin, H.; Nakagoshi, N.; Zong, Y. Urban Green Space Network Development for Biodiversity Conservation: Identification Based on Graph Theory and Gravity Modeling. Landsc. Urban Plan. 2010, 95, 16–27. [Google Scholar] [CrossRef]
- Peng, J.; Yang, Y.; Liu, Y.; Hu, Y.; Du, Y.; Meersmans, J.; Qiu, S. Linking Ecosystem Services and Circuit Theory to Identify Ecological Security Patterns. Sci. Total Environ. 2018, 644, 781–790. [Google Scholar] [CrossRef]
- Li, S.; Xiao, W.; Zhao, Y.; Xu, J.; Da, H.; Lv, X. Quantitative Analysis of the Ecological Security Pattern for Regional Sustainable Development: Case Study of Chaohu Basin in Eastern China. J. Urban Plan. Dev. 2019, 145, 04019009. [Google Scholar] [CrossRef]
- Wang, C.; Yu, C.; Chen, T.; Feng, Z.; Hu, Y.; Wu, K. Can the Establishment of Ecological Security Patterns Improve Ecological Protection? An Example of Nanchang, China. Sci. Total Environ. 2020, 740, 140051. [Google Scholar] [CrossRef]
- Dai, L.; Liu, Y.; Luo, X. Integrating the MCR and DOI Models to Construct an Ecological Security Network for the Urban Agglomeration around Poyang Lake, China. Sci. Total Environ. 2021, 754, 141868. [Google Scholar] [CrossRef]
- Zhang, D.; Wang, X.; Qu, L.; Li, S.; Lin, Y.; Yao, R.; Zhou, X.; Li, J. Land Use/Cover Predictions Incorporating Ecological Security for the Yangtze River Delta Region, China. Ecol. Indic. 2020, 119, 106841. [Google Scholar] [CrossRef]
- Yang, X.; Li, S.; Zhu, C.; Dong, B.; Xu, H. Simulating Urban Expansion Based on Ecological Security Pattern—A Case Study of Hangzhou, China. Int. J. Environ. Res. Public. Health 2021, 19, 301. [Google Scholar] [CrossRef]
- Zong, S.; Hu, Y.; Zhang, Y.; Wang, W. Identification of Land Use Conflicts in China’s Coastal Zones: From the Perspective of Ecological Security. Ocean. Coast. Manag. 2021, 213, 105841. [Google Scholar] [CrossRef]
- Xin, Z.; Xu, J.; Zheng, W. Spatiotemporal Variations of Vegetation Cover on the Chinese Loess Plateau (1981–2006): Impacts of Climate Changes and Human Activities. Sci. China Ser. Earth Sci. 2008, 51, 67–78. [Google Scholar] [CrossRef]
- Li, Y.; Zhang, X.; Cao, Z.; Liu, Z.; Lu, Z.; Liu, Y. Towards the Progress of Ecological Restoration and Economic Development in China’s Loess Plateau and Strategy for More Sustainable Development. Sci. Total Environ. 2021, 756, 143676. [Google Scholar] [CrossRef]
- Li, Z.; Zheng, F.; Liu, W.; Flanagan, D.C. Spatial Distribution and Temporal Trends of Extreme Temperature and Precipitation Events on the Loess Plateau of China during 1961–2007. Quat. Int. 2010, 226, 92–100. [Google Scholar] [CrossRef]
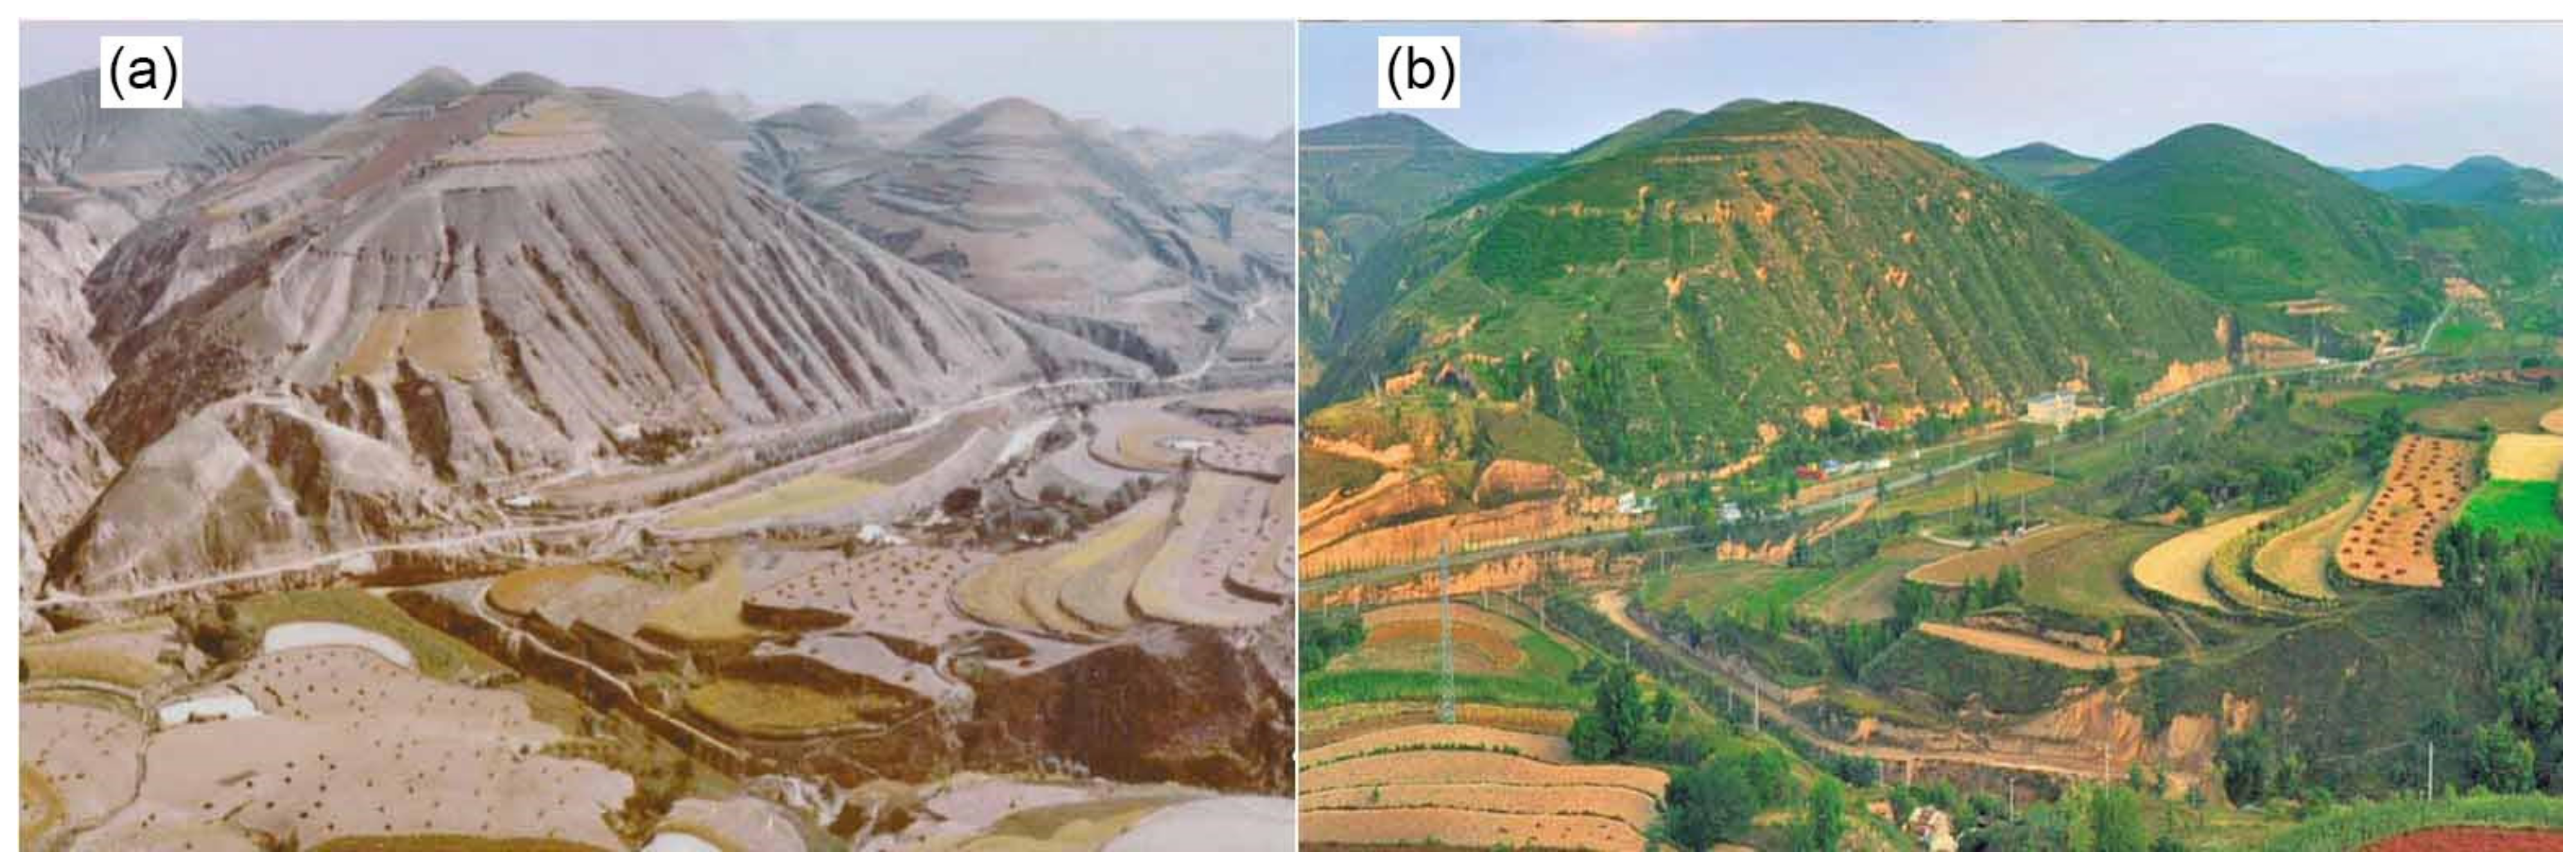
- Chen, L.; Wei, W.; Fu, B.; Lü, Y. Soil and Water Conservation on the Loess Plateau in China: Review and Perspective. Prog. Phys. Geogr. Earth Environ. 2007, 31, 389–403. [Google Scholar] [CrossRef]
- Fu, B.; Liu, Y.; Lü, Y.; He, C.; Zeng, Y.; Wu, B. Assessing the Soil Erosion Control Service of Ecosystems Change in the Loess Plateau of China. Ecol. Complex. 2011, 8, 284–293. [Google Scholar] [CrossRef]
- Lü, Y.; Fu, B.; Feng, X.; Zeng, Y.; Liu, Y.; Chang, R.; Sun, G.; Wu, B. A Policy-Driven Large Scale Ecological Restoration: Quantifying Ecosystem Services Changes in the Loess Plateau of China. PLoS ONE 2012, 7, e31782. [Google Scholar] [CrossRef]
- Karra, K.; Kontgis, C.; Statman-Weil, Z.; Mazzariello, J.C.; Mathis, M.; Brumby, S.P. Global Land Use/Land Cover with Sentinel 2 and Deep Learning. In Proceedings of the 2021 IEEE International Geoscience and Remote Sensing Symposium IGARSS, Brussels, Belgium, 12–16 July 2021; pp. 4704–4707. [Google Scholar]
- Wu, X.; Wang, P.; Huo, Z.; Wu, D.; Yang, J. Crop Drought Identification Index for Winter Wheat Based on Evapotranspiration in the Huang-Huai-Hai Plain, China. Agric. Ecosyst. Environ. 2018, 263, 18–30. [Google Scholar] [CrossRef]
- Ceccherini, G.; Ameztoy, I.; Hernández, C.P.R.; Moreno, C.C. High-Resolution Precipitation Datasets in South America and West Africa Based on Satellite-Derived Rainfall, Enhanced Vegetation Index and Digital Elevation Model. Remote Sens. 2015, 7, 6454–6488. [Google Scholar] [CrossRef]
- Huete, A.; Didan, K.; Miura, T.; Rodriguez, E.P.; Gao, X.; Ferreira, L.G. Overview of the Radiometric and Biophysical Performance of the MODIS Vegetation Indices. Remote Sens. Environ. 2002, 83, 195–213. [Google Scholar] [CrossRef]
- Zhang, X.; Du, H.; Wang, Y.; Chen, Y.; Ma, L.; Dong, T. Watershed Landscape Ecological Risk Assessment and Landscape Pattern Optimization: Take Fujiang River Basin as an Example. Hum. Ecol. Risk Assess. Int. J. 2021, 27, 2254–2276. [Google Scholar] [CrossRef]
- Soille, P.; Vogt, P. Morphological Segmentation of Binary Patterns. Pattern Recognit. Lett. 2009, 30, 456–459. [Google Scholar] [CrossRef]
- Xiao, L.; Cui, L.; Jiang, Q.; Wang, M.; Xu, L.; Yan, H. Spatial Structure of a Potential Ecological Network in Nanping, China, Based on Ecosystem Service Functions. Land 2020, 9, 376. [Google Scholar] [CrossRef]
- Yang, R.; Bai, Z.; Shi, Z. Linking Morphological Spatial Pattern Analysis and Circuit Theory to Identify Ecological Security Pattern in the Loess Plateau: Taking Shuozhou City as an Example. Land 2021, 10, 907. [Google Scholar] [CrossRef]
- Taylor, P.D.; Fahrig, L.; Henein, K.; Merriam, G. Connectivity Is a Vital Element of Landscape Structure. Oikos 1993, 68, 571. [Google Scholar] [CrossRef]
- Saura, S.; Pascual-Hortal, L. A New Habitat Availability Index to Integrate Connectivity in Landscape Conservation Planning: Comparison with Existing Indices and Application to a Case Study. Landsc. Urban Plan. 2007, 83, 91–103. [Google Scholar] [CrossRef]
- Saura, S.; Torné, J. Conefor Sensinode 2.2: A Software Package for Quantifying the Importance of Habitat Patches for Landscape Connectivity. Environ. Model. Softw. 2009, 24, 135–139. [Google Scholar] [CrossRef]
- Pan, J.; Liu, X. Assessment of landscape ecological security and optimization of landscape pattern based on spatial principal component analysis and resistance model in arid inland area: A case study of Ganzhou District, Zhangye City, Northwest China. Ying Yong Sheng Tai Xue Bao J. Appl. Ecol. 2015, 26, 3126–3136. [Google Scholar]
- Xiong, L.; Li, S.; Tang, G.; Strobl, J. Geomorphometry and Terrain Analysis: Data, Methods, Platforms and Applications. Earth-Sci. Rev. 2022, 233, 104191. [Google Scholar] [CrossRef]
- Strand, J.; Carson, R.T.; Navrud, S.; Ortiz-Bobea, A.; Vincent, J.R. Using the Delphi Method to Value Protection of the Amazon Rainforest. Ecol. Econ. 2017, 131, 475–484. [Google Scholar] [CrossRef]
- Teng, M.; Wu, C.; Zhou, Z.; Lord, E.; Zheng, Z. Multipurpose Greenway Planning for Changing Cities: A Framework Integrating Priorities and a Least-Cost Path Model. Landsc. Urban Plan. 2011, 103, 1–14. [Google Scholar] [CrossRef]
- Knaapen, J.P.; Scheffer, M.; Harms, B. Estimating Habitat Isolation in Landscape Planning. Landsc. Urban Plan. 1992, 23, 1–16. [Google Scholar] [CrossRef]
- Zhang, W.; Li, B. Research on an Analytical Framework for Urban Spatial Structural and Functional Optimization: A Case Study of Beijing City, China. Land 2021, 10, 86. [Google Scholar] [CrossRef]
- Zhu, K.; Chen, Y.; Zhang, S.; Yang, Z.; Huang, L.; Lei, B.; Li, L.; Zhou, Z.; Xiong, H.; Li, X. Identification and Prevention of Agricultural Non-Point Source Pollution Risk Based on the Minimum Cumulative Resistance Model. Glob. Ecol. Conserv. 2020, 23, e01149. [Google Scholar] [CrossRef]
- Yu, K. Security Patterns and Surface Model in Landscape Ecological Planning. Landsc. Urban Plan. 1996, 36, 1–17. [Google Scholar] [CrossRef]
- Wanghe, K.; Guo, X.; Wang, M.; Zhuang, H.; Ahmad, S.; Khan, T.U.; Xiao, Y.; Luan, X.; Li, K. Gravity Model Toolbox: An Automated and Open-Source ArcGIS Tool to Build and Prioritize Ecological Corridors in Urban Landscapes. Glob. Ecol. Conserv. 2020, 22, e01012. [Google Scholar] [CrossRef]
- Yu, Q.; Yue, D.; Wang, J.; Zhang, Q.; Li, Y.; Yu, Y.; Chen, J.; Li, N. The Optimization of Urban Ecological Infrastructure Network Based on the Changes of County Landscape Patterns: A Typical Case Study of Ecological Fragile Zone Located at Deng Kou (Inner Mongolia). J. Clean. Prod. 2017, 163, S54–S67. [Google Scholar] [CrossRef]
- Sun, J.; Li, Y.P.; Gao, P.P.; Xia, B.C. A Mamdani Fuzzy Inference Approach for Assessing Ecological Security in the Pearl River Delta Urban Agglomeration, China. Ecol. Indic. 2018, 94, 386–396. [Google Scholar] [CrossRef]
- Yu, H.; Gu, X.; Liu, G.; Fan, X.; Zhao, Q.; Zhang, Q. Construction of Regional Ecological Security Patterns Based on Multi-Criteria Decision Making and Circuit Theory. Remote Sens. 2022, 14, 527. [Google Scholar] [CrossRef]
- Larsen, L.G.; Harvey, J.W. Modeling of Hydroecological Feedbacks Predicts Distinct Classes of Landscape Pattern, Process, and Restoration Potential in Shallow Aquatic Ecosystems. Geomorphology 2011, 126, 279–296. [Google Scholar] [CrossRef]
- Nsabimana, D.; Haynes, R.J.; Wallis, F.M. Size, Activity and Catabolic Diversity of the Soil Microbial Biomass as Affected by Land Use. Appl. Soil Ecol. 2004, 26, 81–92. [Google Scholar] [CrossRef]
- Wan, J.; Su, Y.; Zan, H.; Zhao, Y.; Zhang, L.; Zhang, S.; Dong, X.; Deng, W. Land Functions, Rural Space Governance, and Farmers’ Environmental Perceptions: A Case Study from the Huanjiang Karst Mountain Area, China. Land 2020, 9, 134. [Google Scholar] [CrossRef]
- Xia, M.; Wang, L.; Wen, B.; Zou, W.; Ou, W.; Qu, Z. Land Consolidation Zoning in Coastal Tidal Areas Based on Landscape Security Pattern: A Case Study of Dafeng District, Yancheng, Jiangsu Province, China. Land 2021, 10, 145. [Google Scholar] [CrossRef]
- Fan, X.; Rong, Y.; Tian, C.; Ou, S.; Li, J.; Shi, H.; Qin, Y.; He, J.; Huang, C. Construction of an Ecological Security Pattern in an Urban–Lake Symbiosis Area: A Case Study of Hefei Metropolitan Area. Remote Sens. 2022, 14, 2498. [Google Scholar] [CrossRef]
- Fu, W.S.; Zhao, G.J.; Dai, W.Q.; Wang, Y.; Li, J.W.; Tan, M.Y.; Li, Y.; Liu, H.R.; Xie, B.; Jin, X.; et al. Surprising Leopard Restoration in Fragmented Ecosystems Reveals Connections as the Secret to Conservation Success. Sci. Total Environ. 2022, 858, 159790. [Google Scholar] [CrossRef]
- Wu, J. Effects of Changing Scale on Landscape Pattern Analysis: Scaling Relations. Landsc. Ecol. 2004, 19, 125–138. [Google Scholar] [CrossRef]
- He, H.S.; Mladenoff, D.J. Spatially Explicit and Stochastic Simulation of Forest-Landscape Fire Disturbance and Succession. Ecology 1999, 80, 81–99. [Google Scholar] [CrossRef]
- Sui, D.Z. Tobler’s First Law of Geography: A Big Idea for a Small World? Ann. Assoc. Am. Geogr. 2004, 94, 269–277. [Google Scholar] [CrossRef]


| Data Name | Type | Resolution | Data Resource |
|---|---|---|---|
| EVI | Raster | 250 m | https://modis.gsfc.nasa.gov/, accessed on 13 November 2022 |
| Soil erosion data | Raster | 1 km | http://www.geodata.cn/, accessed on 13 November 2022 |
| Meteorological station data | Text | -- | http://data.cma.cn/, accessed on 13 November 2022 |
| DEM | Raster | 30 m | https://lpdaac.usgs.gov/, accessed on 13 November 2022 |
| Land-use data | Raster | 10 m | https://www.arcgis.com/, accessed on 13 November 2022 |
| Primary map data of LPC | Vector | -- | 1:250,000 national basic geographic database |
| Pattern Types | Description |
|---|---|
| Core | Habitat patches that are relatively important to the ecosystem and larger in size usually serve as ecological sources for the ecological network. |
| Perforation | The pixels located in the transition area between the foreground and background, which form the outer edge of the background. |
| Islet | Small, isolated, broken patches are disconnected from each other and do not contain core patches. |
| Edge | The transition area where the foreground and background intersect is located in the inner pixel of the foreground. |
| Bridge | Pixels in the foreground connect two or more separate core patches. Usually represents a corridor in an ecological network. |
| Loop | Foreground pixels connecting the same core area, serve as a shortcut for species to migrate within the same core area. |
| Branch | Foreground pixels connecting the core to other types (edge, bridge, loop, or perforation) |
| Resistance Factor | Level Classification | Value | Weight | Resistance Factor | Level Classification | Value | Weight |
|---|---|---|---|---|---|---|---|
| DEM (m) | 0–500 | 1 | 0.08 | EVI (%) | >70 | 1 | 0.10 |
| 500–1500 | 2 | 50–70 | 2 | ||||
| 1500–3500 | 3 | 20–50 | 3 | ||||
| >3500 | 4 | 0–20 | 4 | ||||
| Slope (°) | <8° | 1 | 0.08 | Distance to road (km) | <3 | 1 | 0.06 |
| 8–15° | 2 | 3–10 | 2 | ||||
| 15–25° | 3 | 10–20 | 3 | ||||
| >25° | 4 | >20 | 4 | ||||
| Land use | Water body, forest land, grassland | 1 | 0.15 | Distance to city (km) | >1.5 | 1 | 0.09 |
| Cultivated land | 2 | 1–1.5 | 2 | ||||
| Built-up land | 3 | 0.5–1 | 3 | ||||
| Bare land | 4 | <0.5 | 4 | ||||
| Soil erosion | Slight erosion | 1 | 0.18 | Distance to river (km) | <1 | 1 | 0.14 |
| Moderate erosion | 2 | 1–3 | 2 | ||||
| Severe erosion | 3 | 3–5 | 3 | ||||
| Extremely severe erosion | 4 | >5 | 4 | ||||
| Precipitation (mm) | >600 | 1 | 0.12 | ||||
| 400–600 | 2 | ||||||
| 200–400 | 3 | ||||||
| 0–200 | 4 |
| Landscape Type | Area (×104 km2) | Accounting for Forestry Area (%) | Accounting for the Study Area (%) |
|---|---|---|---|
| Core | 30.8 | 81.91% | 47.51% |
| Islet | 0.53 | 1.41% | 0.82% |
| Perforation | 1.75 | 4.66% | 2.70% |
| Edge | 2.92 | 7.75% | 4.50% |
| Bridge | 0.44 | 1.18% | 0.68% |
| Loop | 0.83 | 2.20% | 1.28% |
| Branch | 0.33 | 0.89% | 0.52% |
Publisher’s Note: MDPI stays neutral with regard to jurisdictional claims in published maps and institutional affiliations. |
© 2022 by the authors. Licensee MDPI, Basel, Switzerland. This article is an open access article distributed under the terms and conditions of the Creative Commons Attribution (CC BY) license (https://creativecommons.org/licenses/by/4.0/).
Share and Cite
Wei, H.; Zhu, H.; Chen, J.; Jiao, H.; Li, P.; Xiong, L. Construction and Optimization of Ecological Security Pattern in the Loess Plateau of China Based on the Minimum Cumulative Resistance (MCR) Model. Remote Sens. 2022, 14, 5906. https://doi.org/10.3390/rs14225906
Wei H, Zhu H, Chen J, Jiao H, Li P, Xiong L. Construction and Optimization of Ecological Security Pattern in the Loess Plateau of China Based on the Minimum Cumulative Resistance (MCR) Model. Remote Sensing. 2022; 14(22):5906. https://doi.org/10.3390/rs14225906
Chicago/Turabian StyleWei, Hong, Hui Zhu, Jun Chen, Haoyang Jiao, Penghui Li, and Liyang Xiong. 2022. "Construction and Optimization of Ecological Security Pattern in the Loess Plateau of China Based on the Minimum Cumulative Resistance (MCR) Model" Remote Sensing 14, no. 22: 5906. https://doi.org/10.3390/rs14225906
APA StyleWei, H., Zhu, H., Chen, J., Jiao, H., Li, P., & Xiong, L. (2022). Construction and Optimization of Ecological Security Pattern in the Loess Plateau of China Based on the Minimum Cumulative Resistance (MCR) Model. Remote Sensing, 14(22), 5906. https://doi.org/10.3390/rs14225906