The Identification and Driving Factor Analysis of Ecological-Economi Spatial Conflict in Nanjing Metropolitan Area Based on Remote Sensing Data
Abstract
1. Introduction
2. Materials and Methods
2.1. Study Area
2.2. Research Framework
2.3. Data Collection
2.4. Indicator Construction
2.5. Interpretation and Calculation of Indicators
2.6. Data Sources and Methods of Driving Factor
3. Results
3.1. Spatial Distribution Characteristics of Ecological-Economic Space Conflict
3.2. Spatial-Temporal Evolution of Ecological-Economic Spatial Conflict
3.3. Factors Influencing the Change of Ecological-Economic Spatial Conflict in Nanjing Metropolitan Area
3.3.1. Effect of Land Use on Ecological-Economic Space Conflict
3.3.2. Driving Factor of Changes in the Ecological-Economic Space Conflict
4. Discussion
4.1. The overall Pattern of Ecological-Economic Spatial Conflicts Is Stabilizing, but the Lowest Conflict Areas Will Gradually Shrink
4.2. Different Land Use Types Have Different Effects on Changes in Ecological-Economic Spatial Conflicts
4.3. The Development of Eco-Economic Spatial Conflict Mitigation Measures Needs to Be Tailored to Local Conditions
4.4. Findings and Policy Suggestions
4.5. Implications and Limitations
5. Conclusions
- (1)
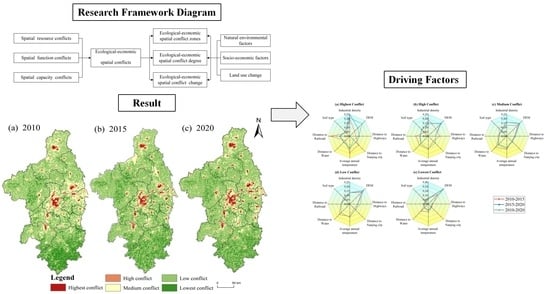
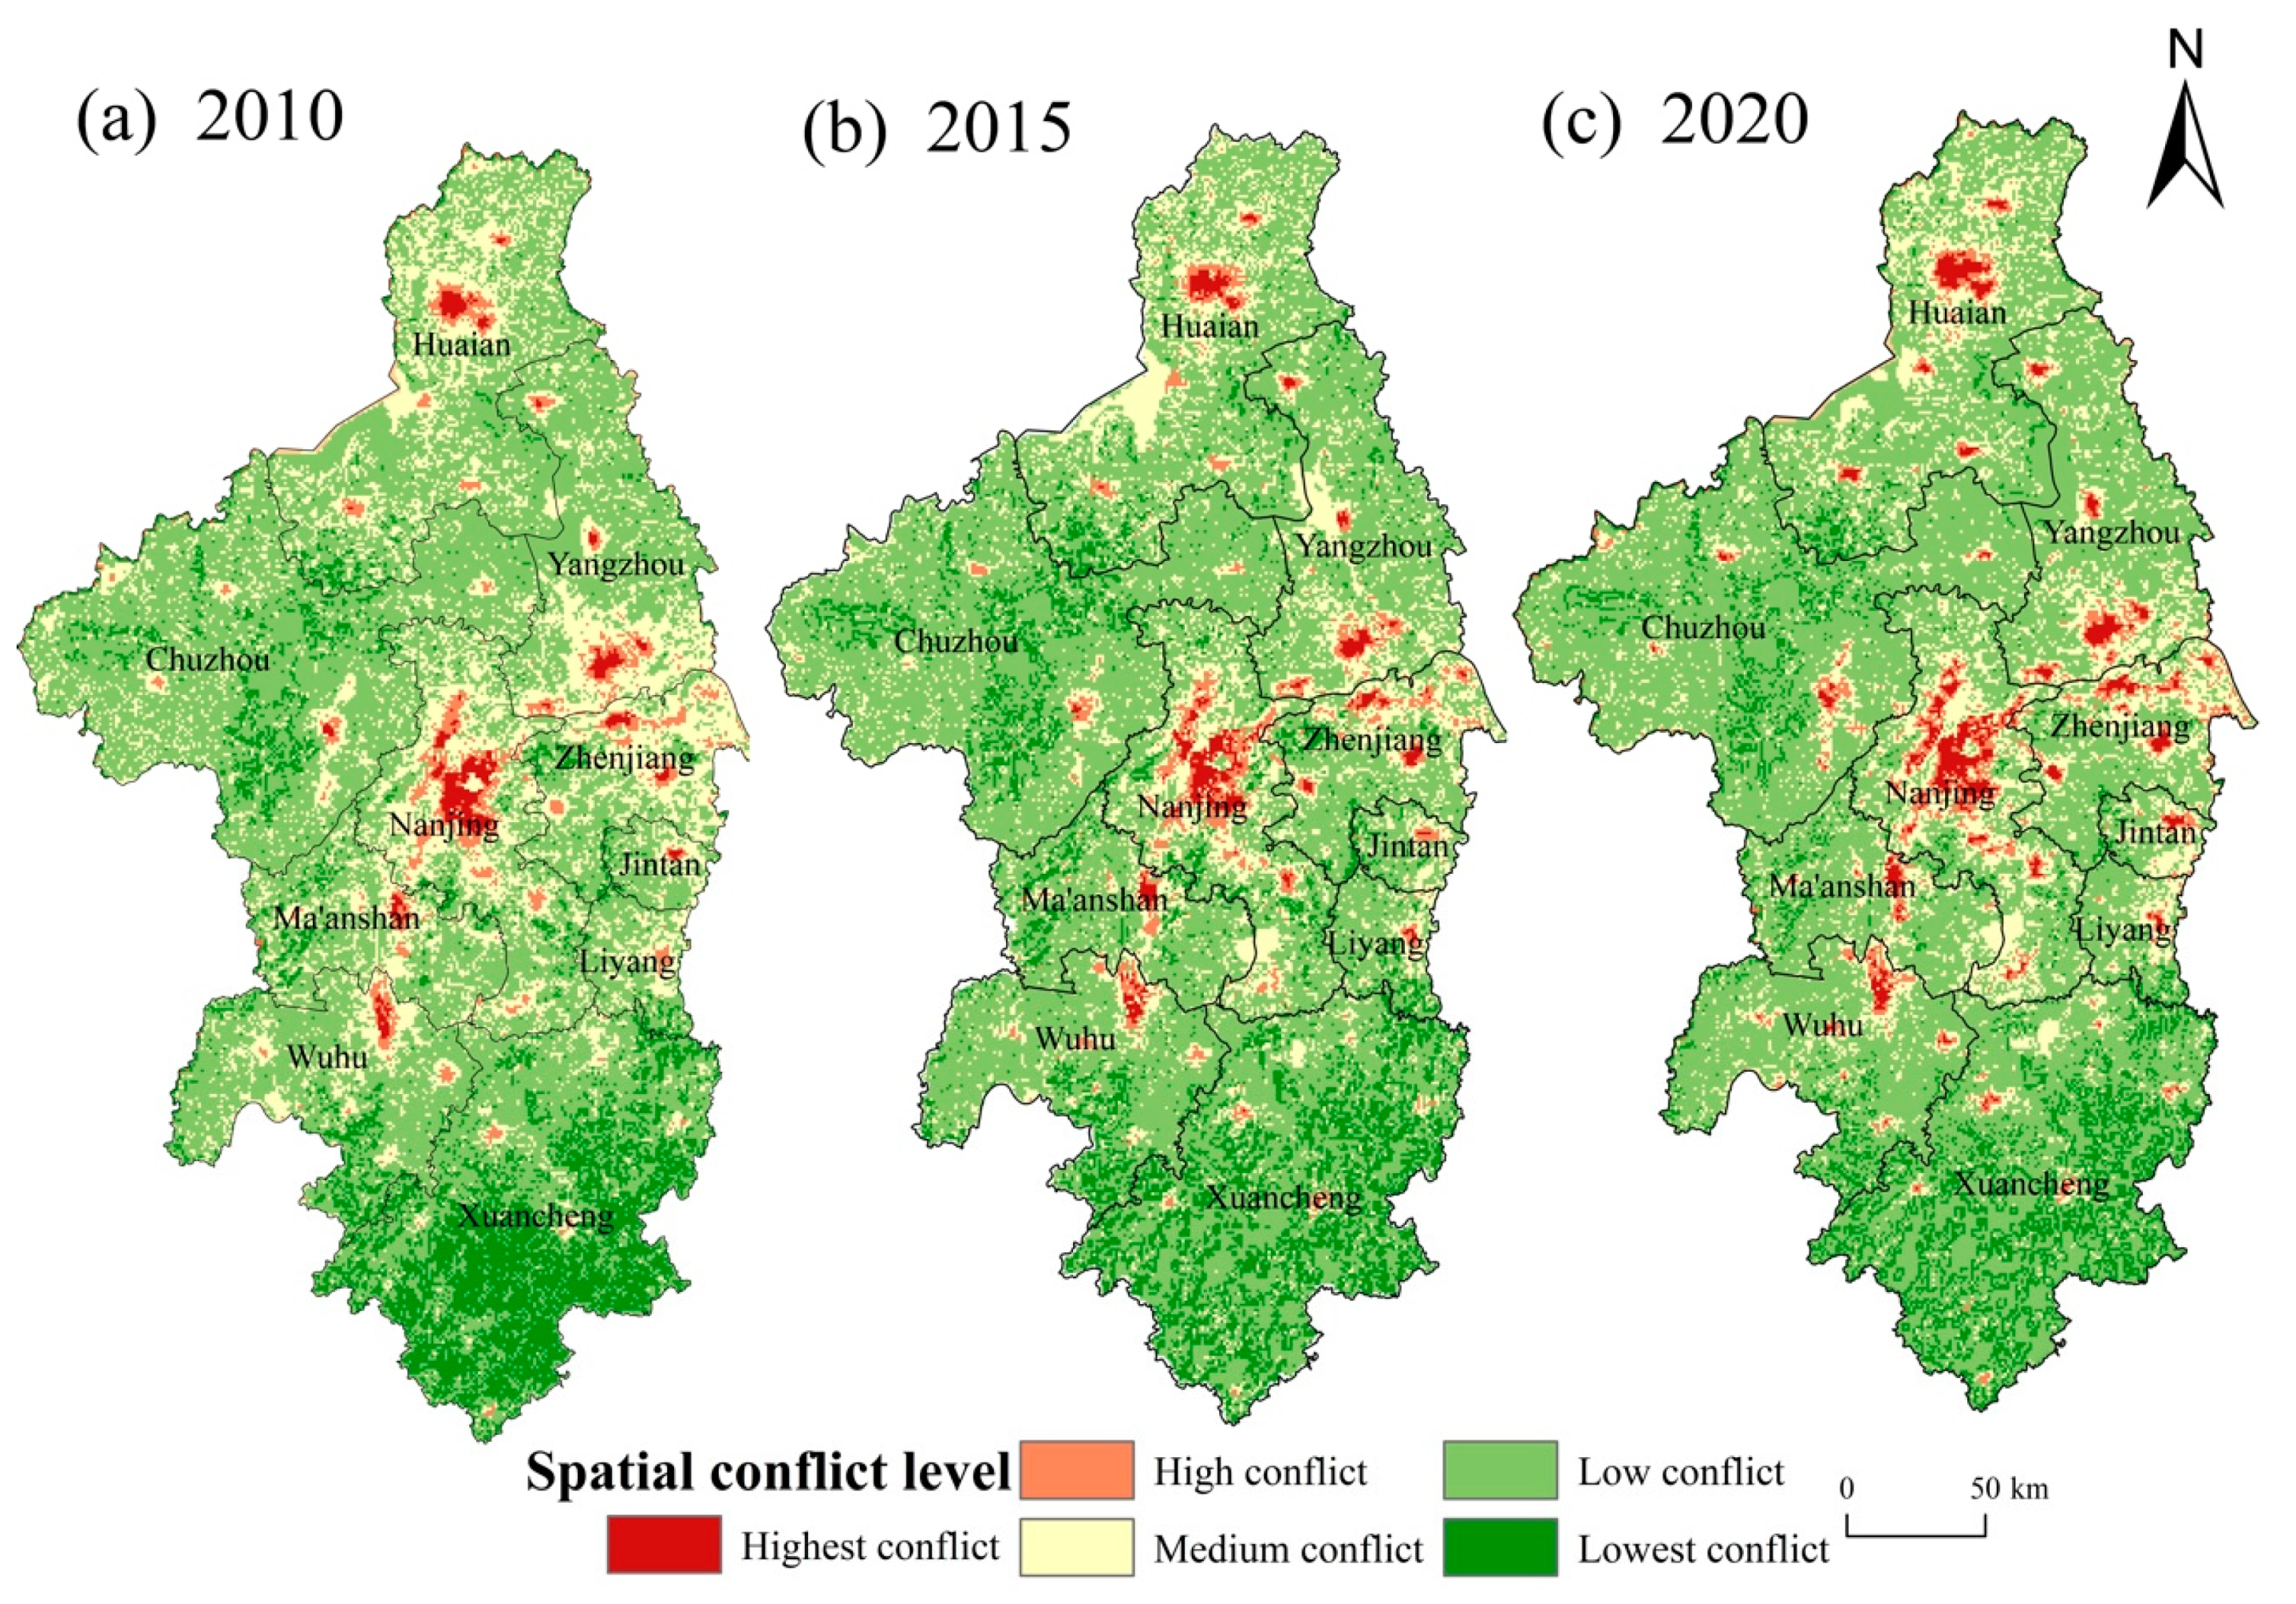
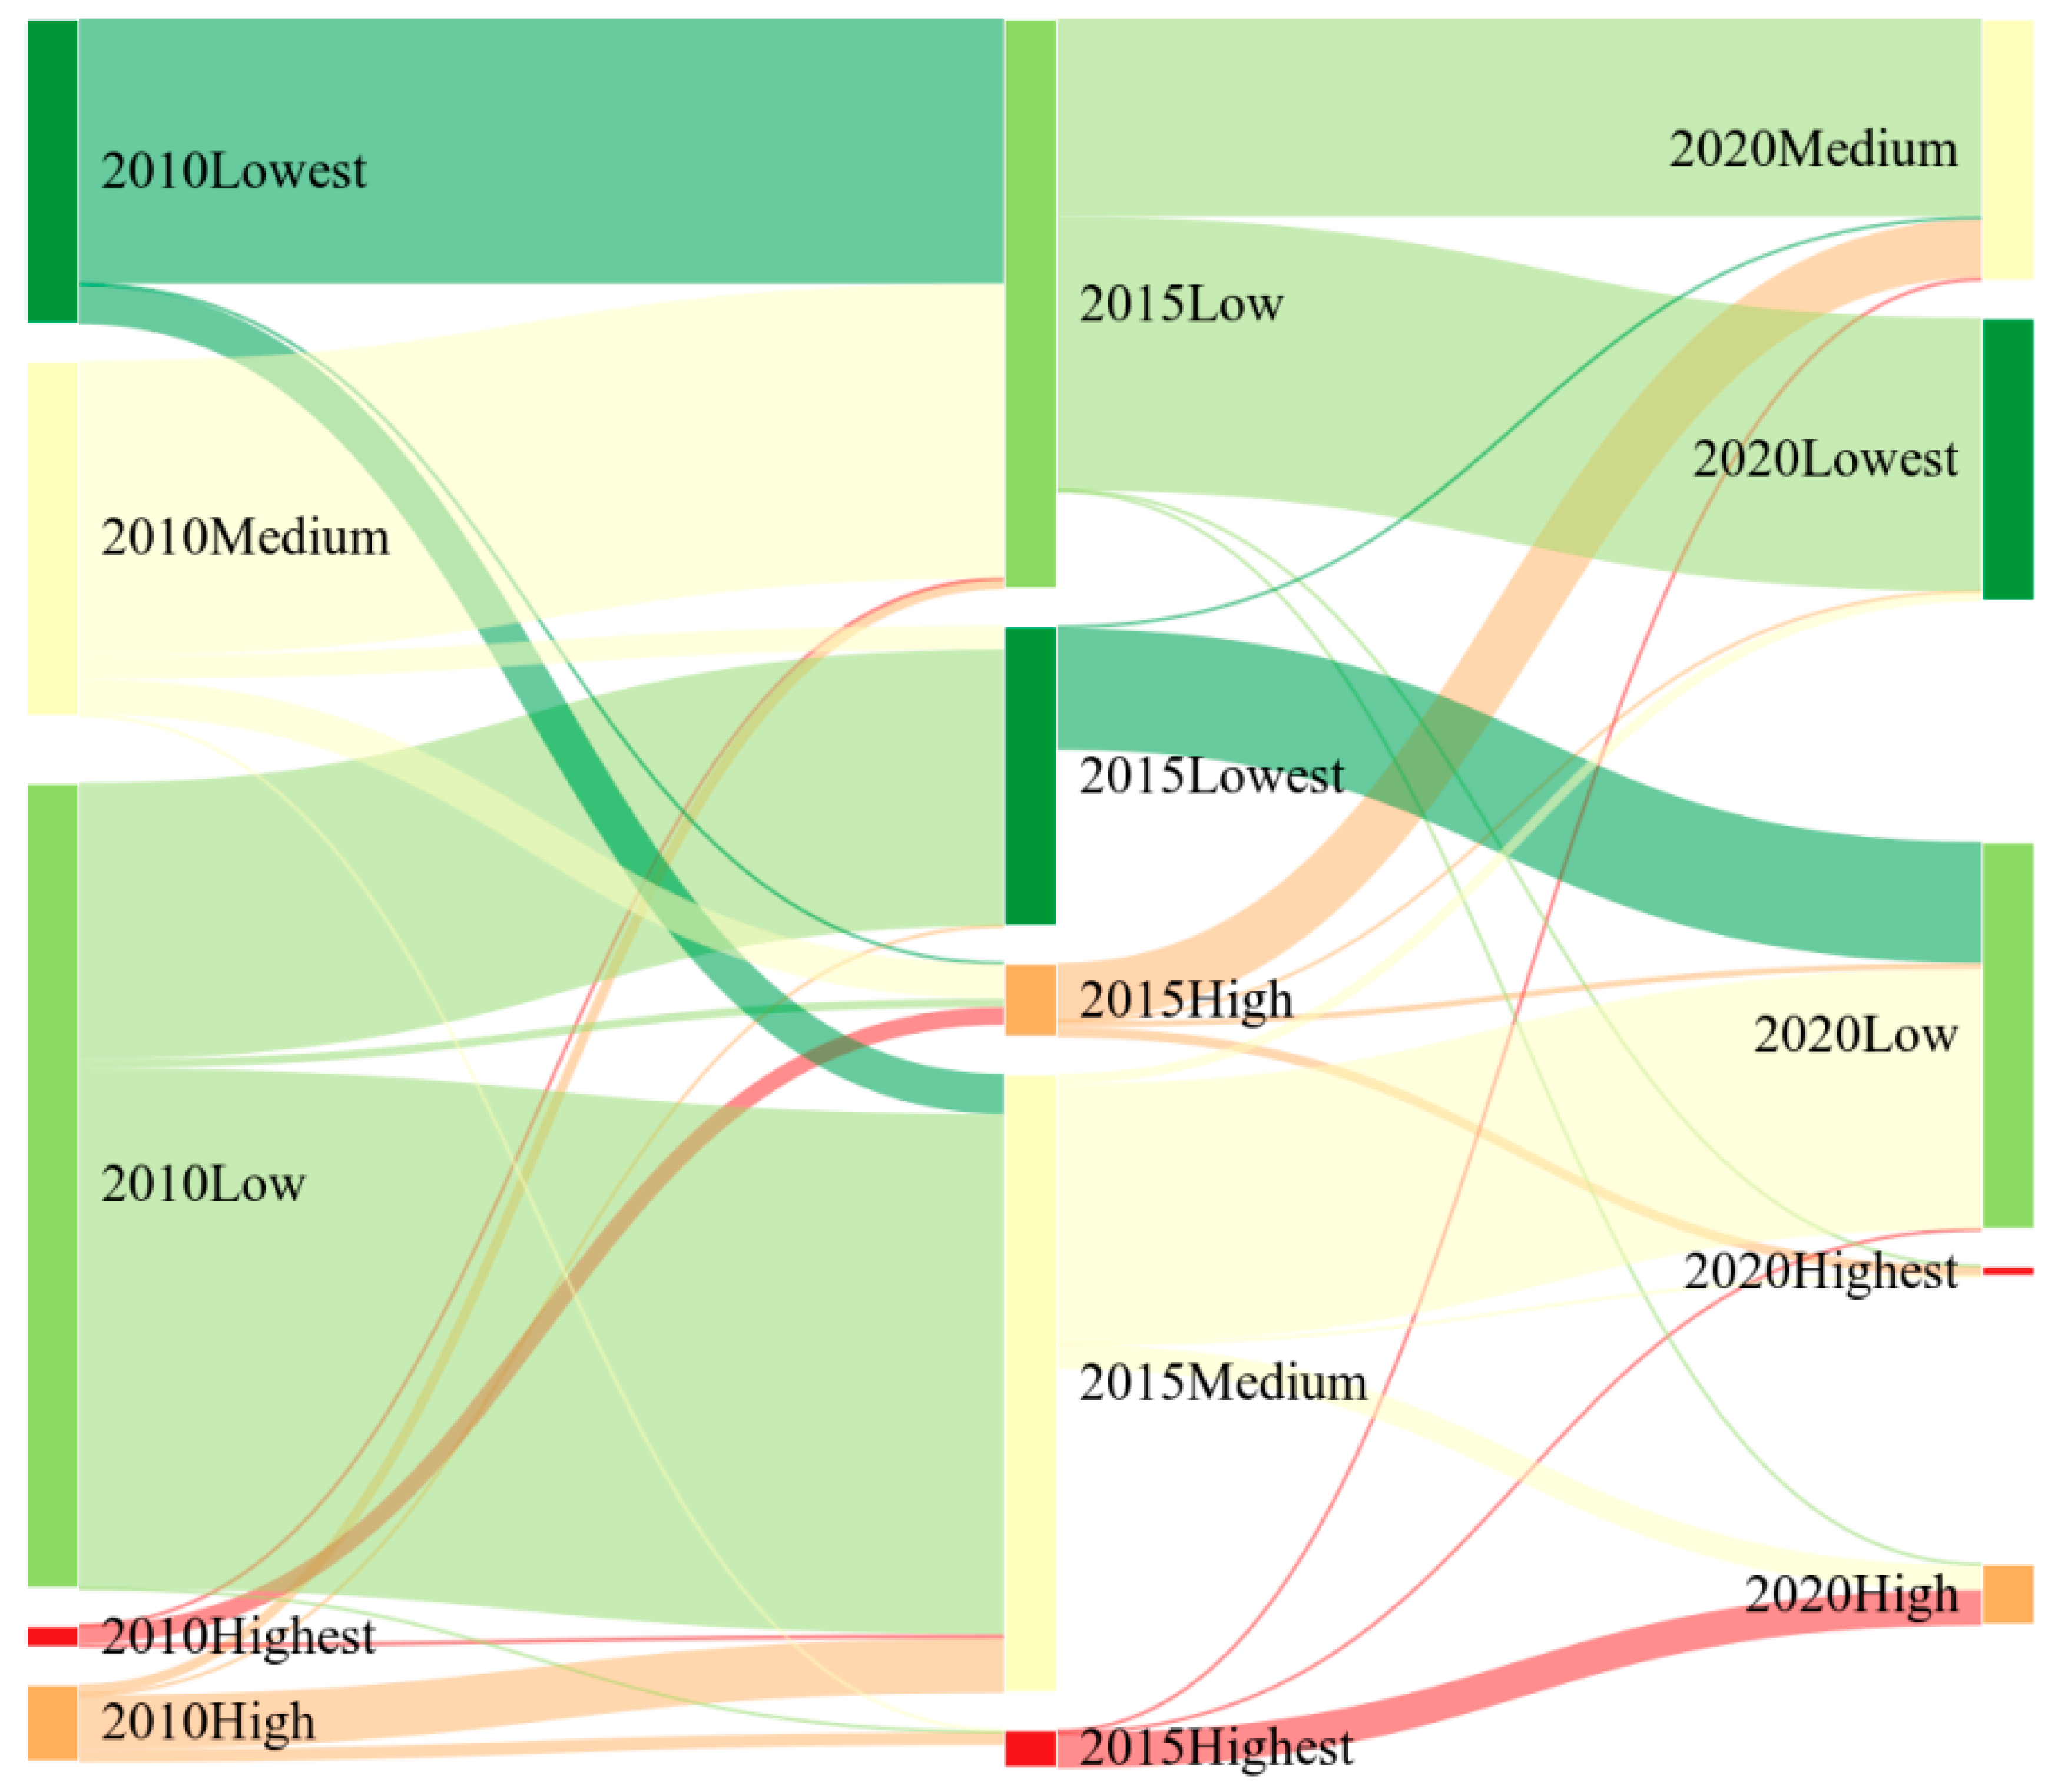
- From 2010 to 2020, the ecological-economic space conflict in the Nanjing metropolitan area changed considerably. The spatial conflict status of the Nanjing metropolitan area was dominated by low conflict areas, and the lowest-conflict areas were mainly concentrated in the hilly areas of Chuzhou and the mountainous areas of Xuancheng. High-conflict and highest-conflict areas had the lowest proportion and were mainly concentrated in urban areas, while two large conflict areas formed in the central and northern regions of the metropolitan area. The proportion of medium-conflict areas is larger and mainly concentrated in the urban periphery.
- (2)
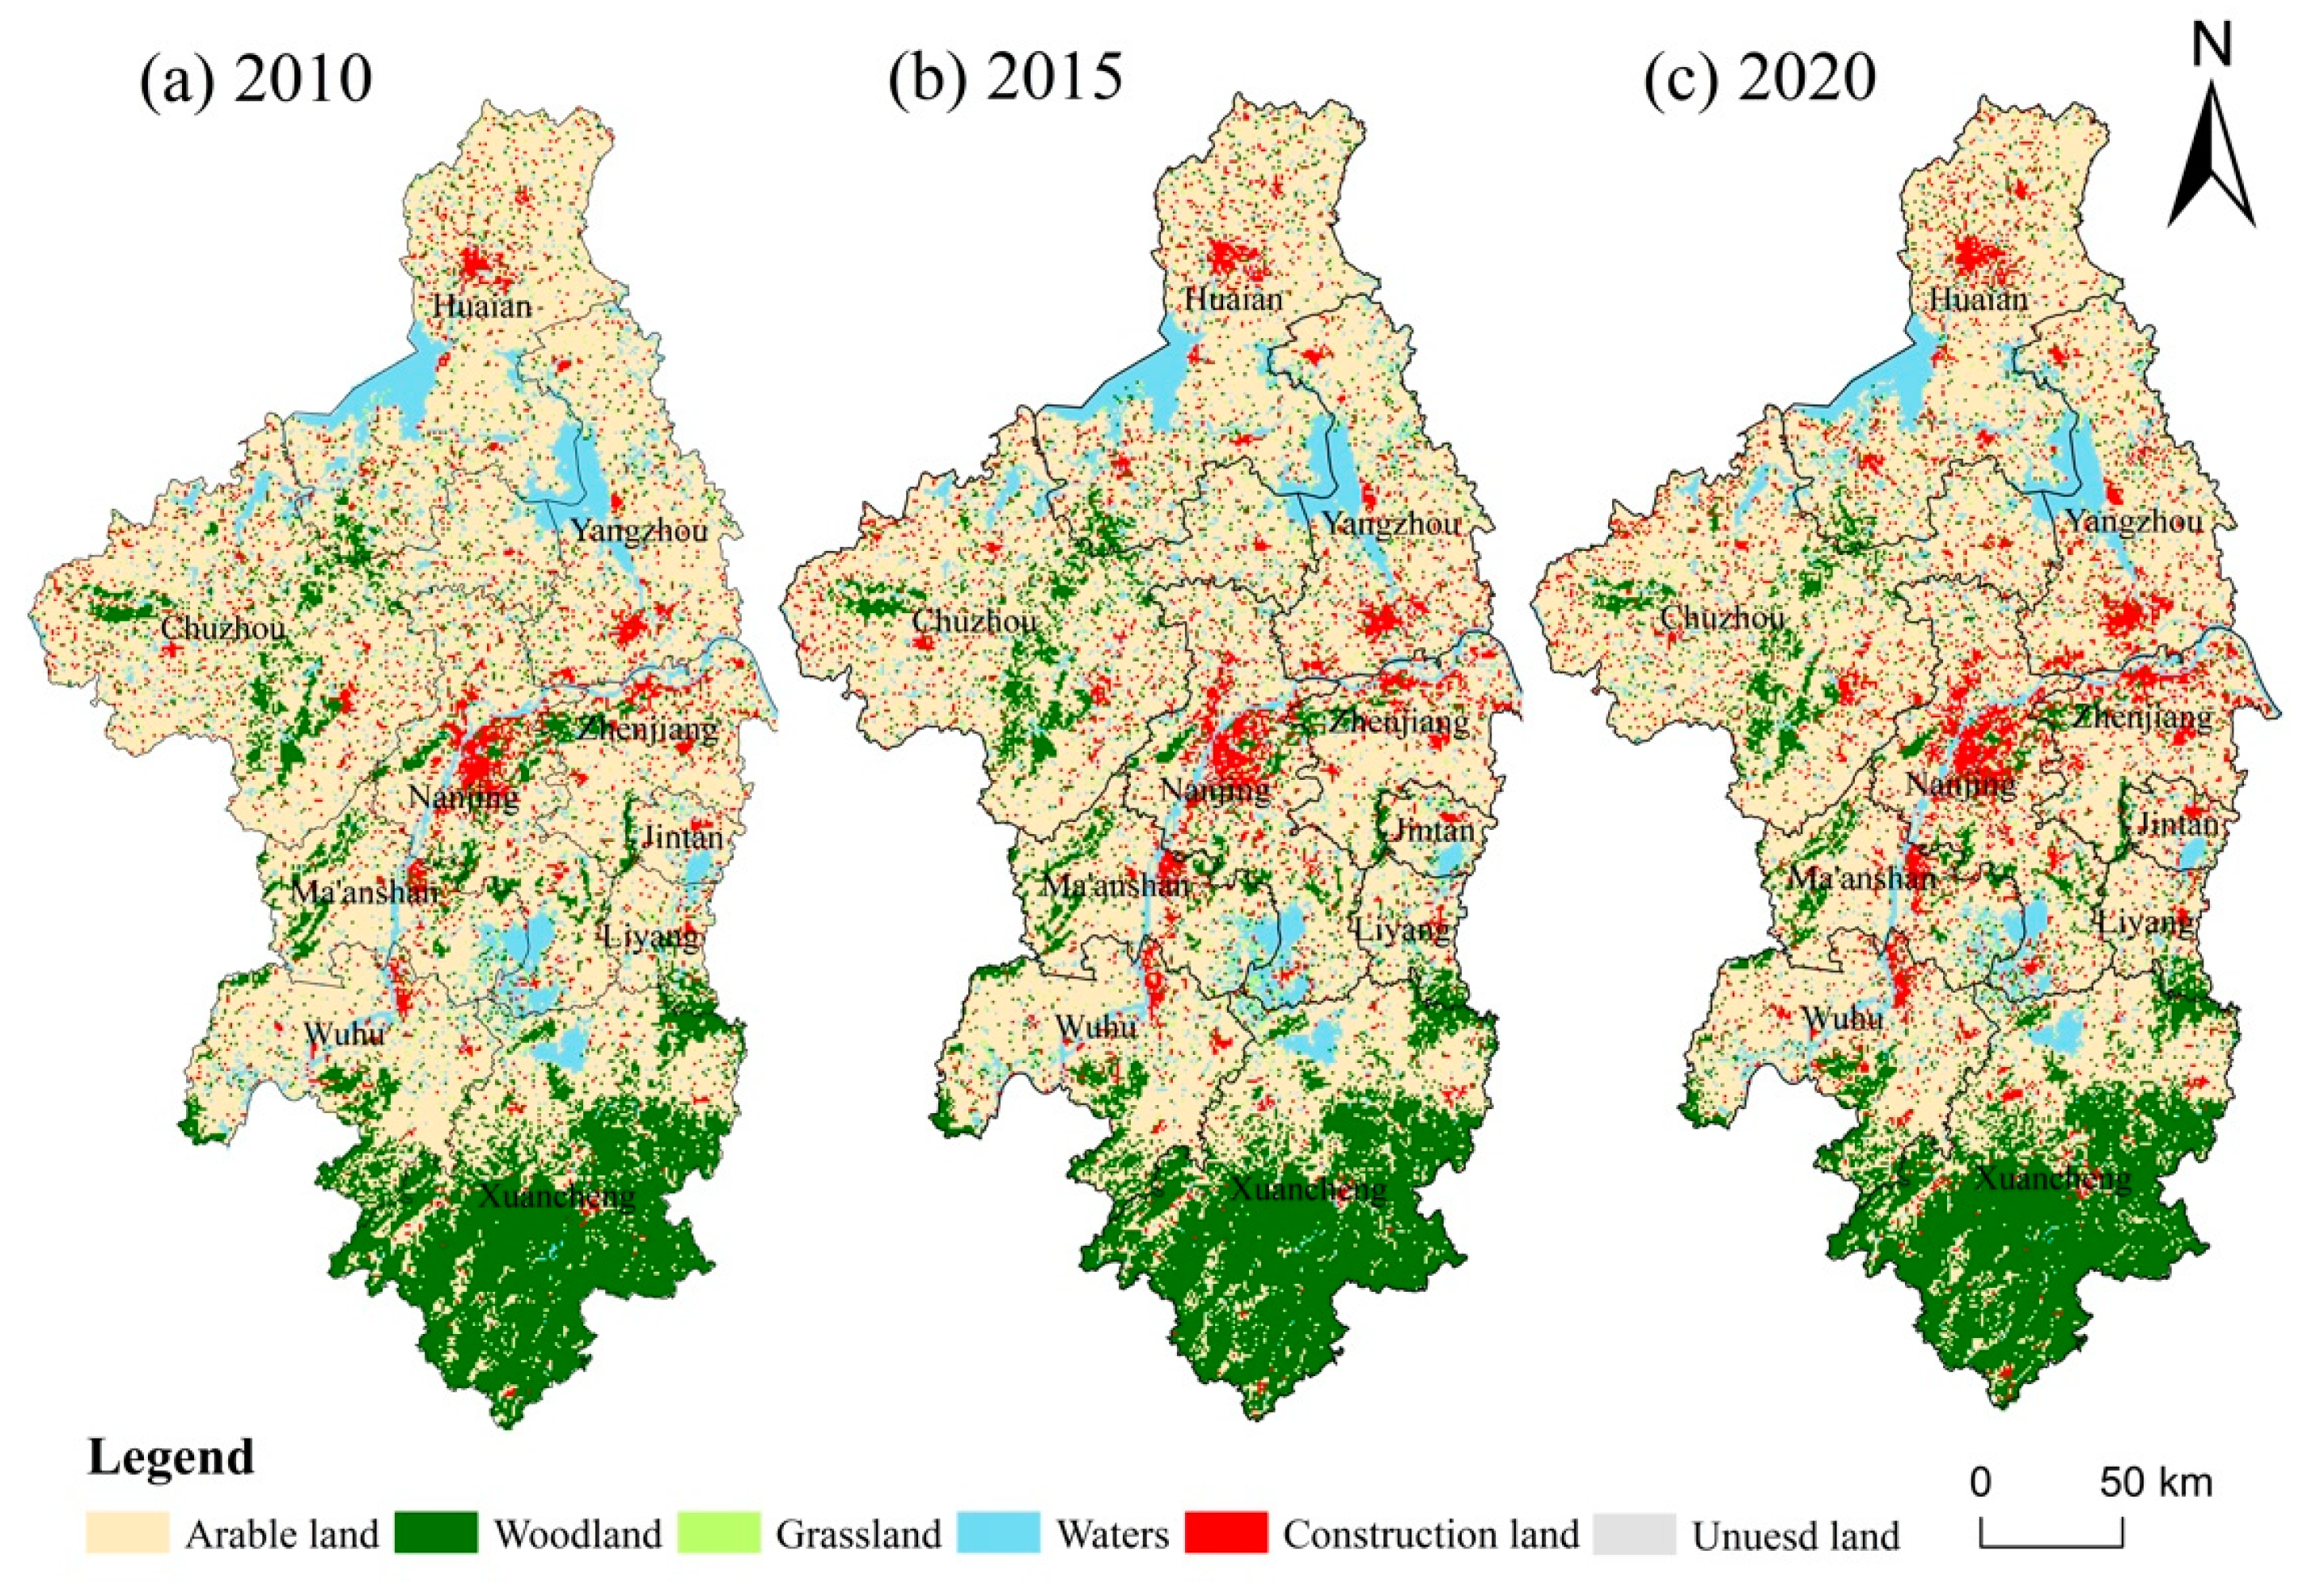
- The change in land use has a substantial effect on spatial conflicts. In general, the main land use types in the lowest-conflict zone are forest land and arable land, the main land use types in the low-conflict and medium-conflict zones are arable land, and the high-conflict and highest-conflict zones consist mainly of construction land. Therefore, spatial conflicts are easily triggered or intensified by disorderly urban expansion, whereas the presence of ecological land can mitigate spatial conflicts.
- (3)
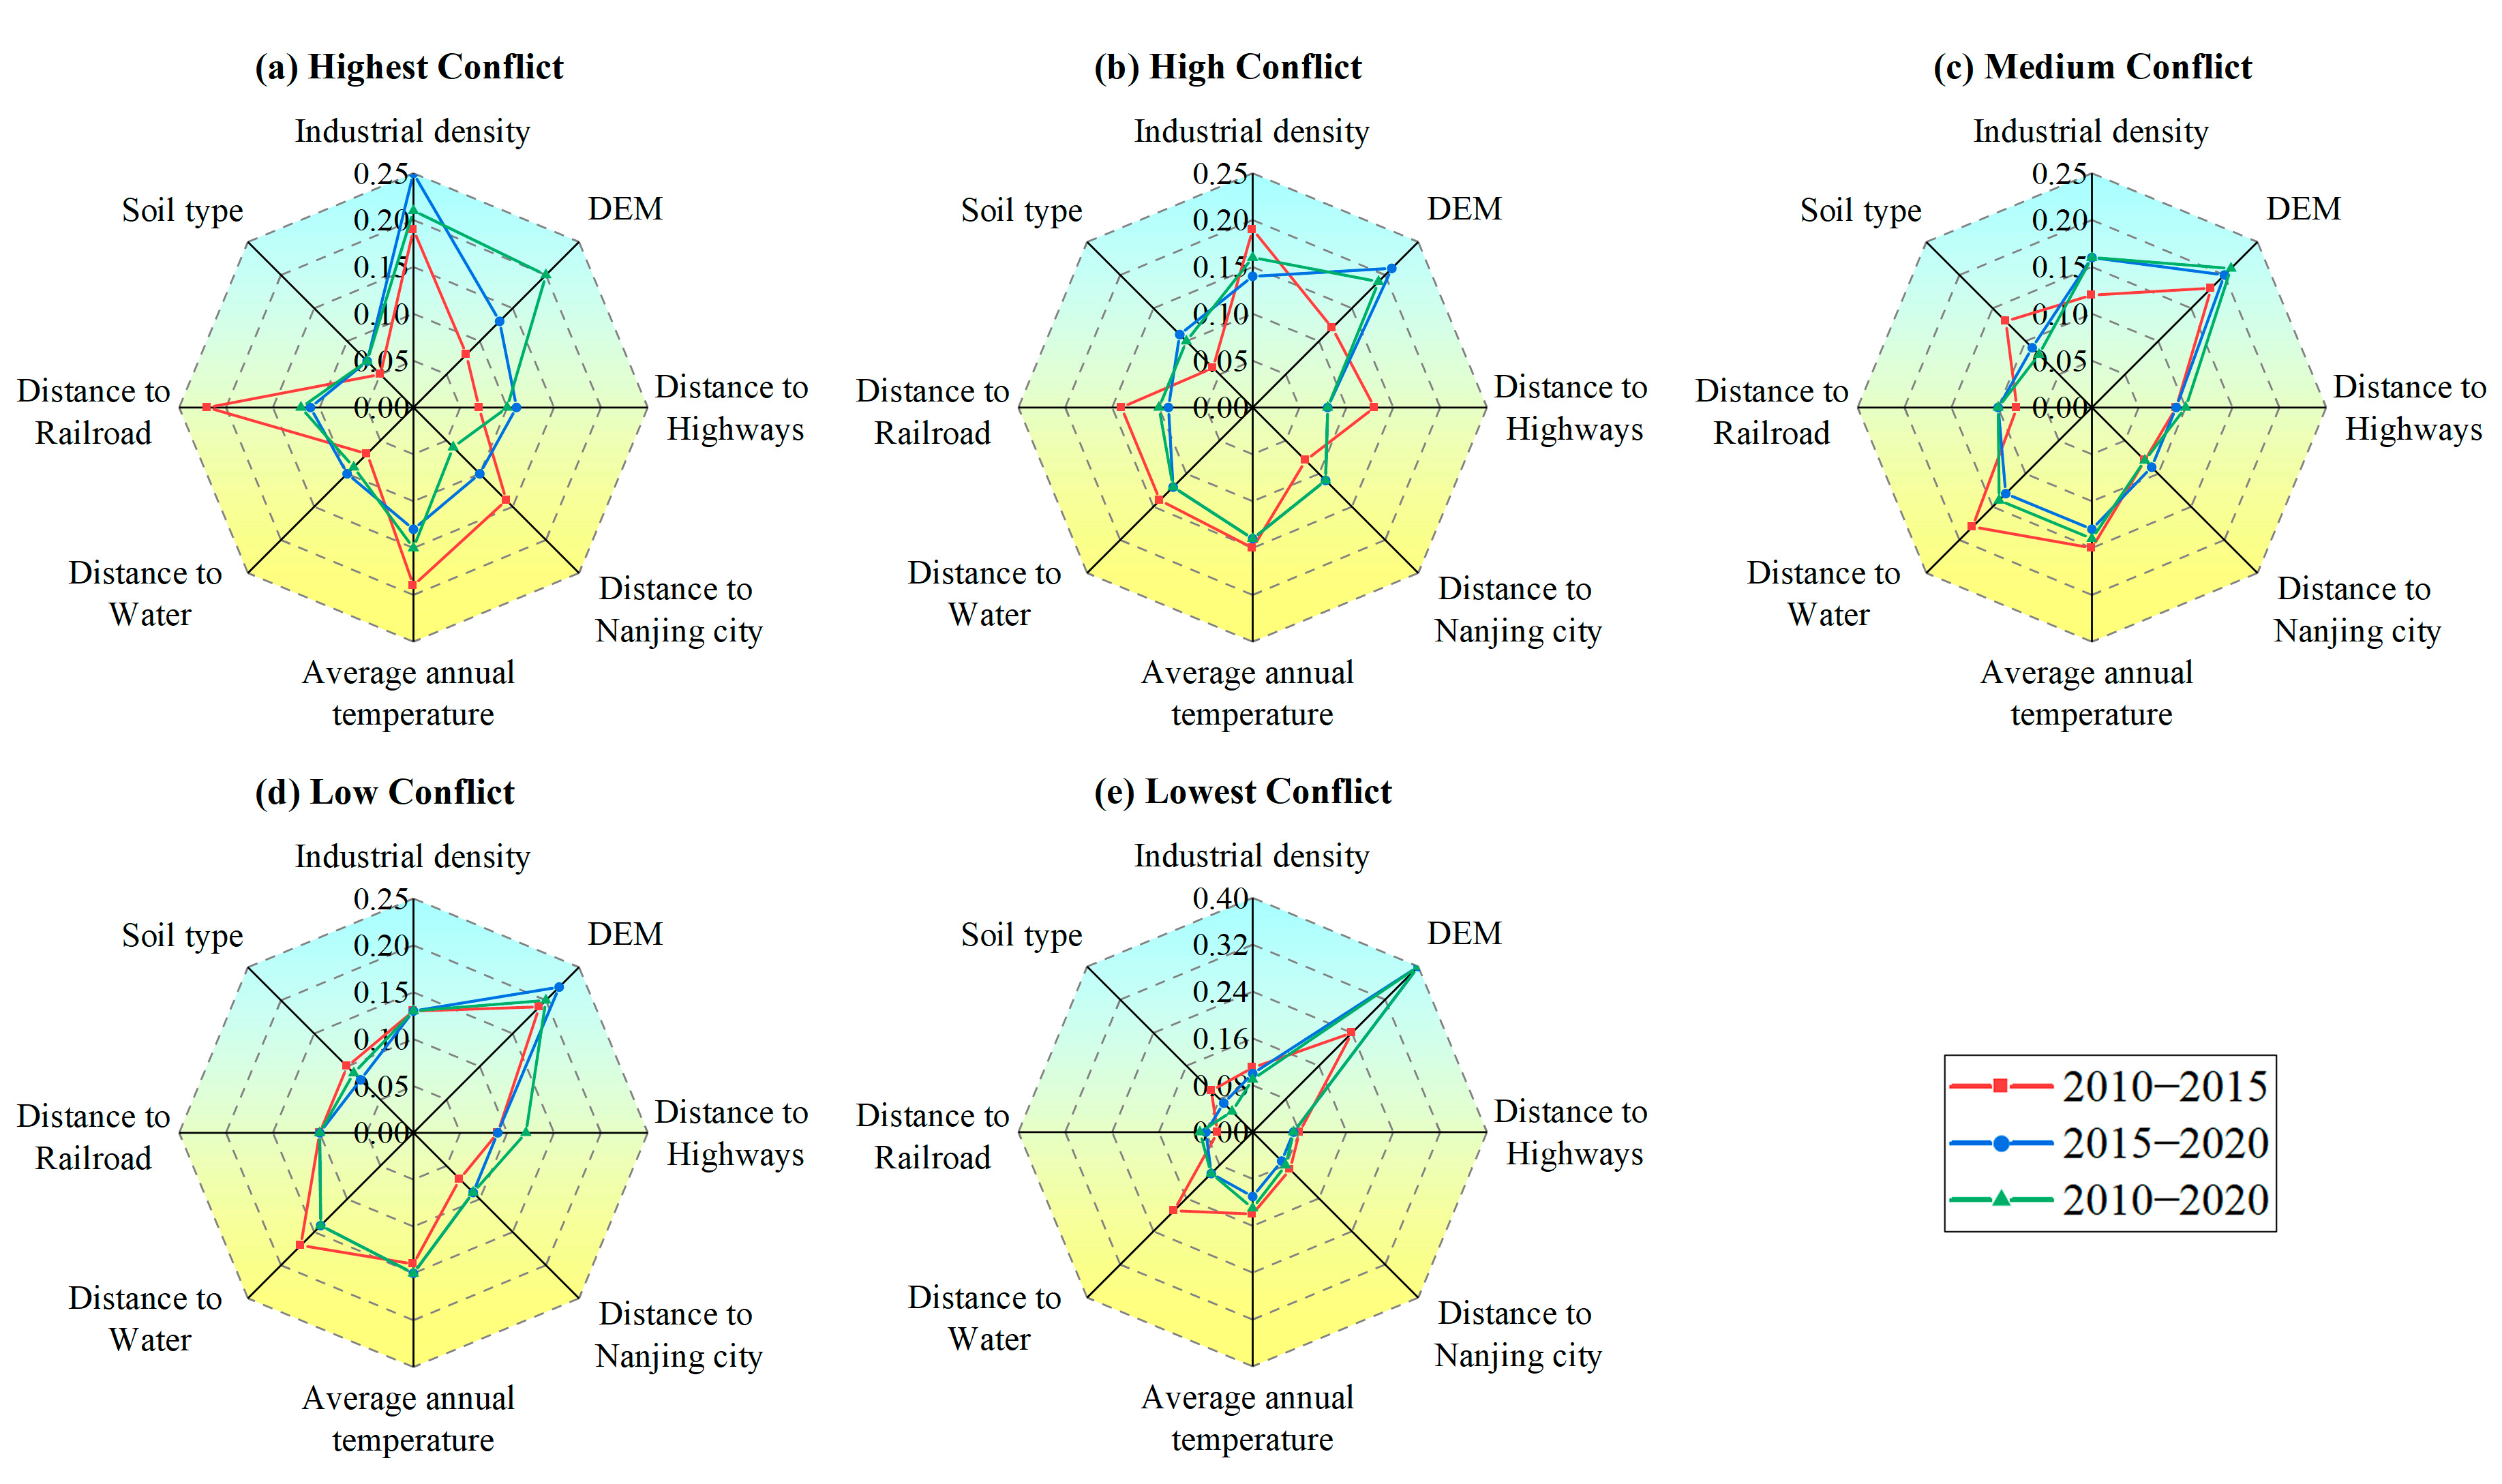
- The relevant driving factors of spatial conflicts showed multi-level features. The factor that contributed most to the lowest-conflict and low-conflict areas was DEM, and the factor that contributed most to the highest-conflict and high-conflict areas was industrial density. However, the situation varied from year to year and from region to region, so the development of conflict reconciliation countermeasures needs to be tailored to local conditions.
Author Contributions
Funding
Data Availability Statement
Conflicts of Interest
References
- Zhou, G.H.; Peng, J.J. The evolution characteristics and influence effect of spatial conflict: A case study of Changsha-Zhuzhou-Xiangtan urban agglomeration. Prog. Geogr. 2012, 31, 717–723. [Google Scholar]
- Peng, J.; Zhou, G.; Tang, C.; He, Y. The analysis of spatial conflict measurement in fast urbanization region based on ecological security: A case study of Changsha-Zhuzhou-Xiangtan urban agglomeration. J. Nat. Resour. 2012, 27, 1507–1519. [Google Scholar]
- Fan, J.; Wang, Y.; Wang, C.; Chen, T.; Jin, F.; Zhang, W.; Li, L.; Xu, Y.; Dai, E.; Tao, A.; et al. Reshaping the Sustainable Geographical Pattern: A Major Function Zoning Model and Its Applications in China. Earth’s Future 2019, 7, 25–42. [Google Scholar] [CrossRef]
- Zhou, D.; Xu, J.; Lin, Z. Conflict or coordination? Assessing land use multi-functionalization using production-living-ecology analysis. Sci. Total Environ. 2017, 577, 136–147. [Google Scholar] [CrossRef] [PubMed]
- Svoboda, J.; Štych, P.; Laštovička, J.; Paluba, D.; Kobliuk, N. Random Forest Classification of Land Use, Land-Use Change and Forestry (LULUCF) Using Sentinel-2 Data—A Case Study of Czechia. Remote Sens. 2022, 14, 1189. [Google Scholar] [CrossRef]
- Khavarian Nehzak, H.; Aghaei, M.; Mostafazadeh, R.; Rabiei-Dastjerdi, H. Chapter 5—Assessment of machine learning algorithms in land use classification. In Computers in Earth and Environmental Sciences; Pourghasemi, H.R., Ed.; Elsevier: Amsterdam, The Netherlands, 2022; pp. 97–104. [Google Scholar]
- Carr, M.; Zwick, P. Using GIS suitability analysis to identify potential future land use conflicts in North Central Florida. J. Conserv. Plan. 2005, 1, 58–73. [Google Scholar]
- Dong, G.; Ge, Y.; Jia, H.; Sun, C.; Pan, S. Land Use Multi-Suitability, Land Resource Scarcity and Diversity of Human Needs: A New Framework for Land Use Conflict Identification. Land 2021, 10, 1003. [Google Scholar] [CrossRef]
- Geoghegan, J. The value of open spaces in residential land use. Land Use Policy 2002, 19, 91–98. [Google Scholar] [CrossRef]
- Shan, L.; Yu, A.T.; Wu, Y. Strategies for risk management in urban–rural conflict: Two case studies of land acquisition in urbanising China. Habitat Int. 2017, 59, 90–100. [Google Scholar] [CrossRef]
- Zhang, Y.; Long, H.; Tu, S.; Ge, D.; Ma, L.; Wang, L. Spatial identification of land use functions and their tradeoffs/synergies in China: Implications for sustainable land management. Ecol. Indic. 2019, 107, 105550. [Google Scholar] [CrossRef]
- Zou, L.; Liu, Y.; Wang, J.; Yang, Y. An analysis of land use conflict potentials based on ecological-production-living function in the southeast coastal area of China. Ecol. Indic. 2020, 122, 107297. [Google Scholar] [CrossRef]
- Sun, Y.; Ge, X.; Liu, J.; Chang, Y.; Liu, G.-J.; Chen, F. Mitigating Spatial Conflict of Land Use for Sustainable Wetlands Landscape in Li-Xia-River Region of Central Jiangsu, China. Sustainability 2021, 13, 11189. [Google Scholar] [CrossRef]
- Ma, G.; Li, Q.; Yang, S.; Zhang, R.; Zhang, L.; Xiao, J.; Sun, G. Analysis of Landscape Pattern Evolution and Driving Forces Based on Land-Use Changes: A Case Study of Yilong Lake Watershed on Yunnan-Guizhou Plateau. Land 2022, 11, 1276. [Google Scholar] [CrossRef]
- Jiao, M.; Hu, M.; Xia, B. Spatiotemporal dynamic simulation of land-use and landscape-pattern in the Pearl River Delta, China. Sustain. Cities Soc. 2019, 49, 101581. [Google Scholar] [CrossRef]
- Gao, Y.; Wang, J.; Zhang, M.; Li, S. Measurement and prediction of land use conflict in an opencast mining area. Resour. Policy 2021, 71, 101999. [Google Scholar] [CrossRef]
- Qiu, G.; Wang, Y.; Guo, S.; Niu, Q.; Qin, L.; Zhu, D.; Gong, Y. Assessment and Spatial-Temporal Evolution Analysis of Land Use Conflict within Urban Spatial Zoning: Case of the Su-Xi-Chang Region. Sustainability 2022, 14, 2286. [Google Scholar] [CrossRef]
- Costanza, R.; Arge, A.; Groot, R.; Farberk, S.; Grasso, M.; Bruce, H.; Limburg, K.; Naeem, S.; O’Neill, R.V.; Paruelo, J.; et al. The value of the world’s ecosystem services and natural capital. Ecol. Econ. 1997, 25, 3–15. [Google Scholar] [CrossRef]
- Wolff, S.; Schulp, C.; Verburg, P. Mapping ecosystem services demand: A review of current research and future perspectives. Ecol. Indic. 2015, 55, 159–171. [Google Scholar] [CrossRef]
- Wei, H.; Fan, W.; Wang, X.; Lu, N.; Dong, X.; Zhao, Y.; Ya, X.; Zhao, Y. Integrating supply and social demand in ecosystem services assessment: A review. Ecosyst. Serv. 2017, 25, 15–27. [Google Scholar] [CrossRef]
- Assessment, M.E. Ecosystems and Human Well-Being: Wetlands and Water; World Resources Institute: Washington, DC, USA, 2005. [Google Scholar]
- Tian, J.-L.; Peng, Y.; Huang, Y.-H.; Bai, T.; Liu, L.-L.; He, X.-A.; Luo, S.-Q. Identifying the priority areas for enhancing the ecosystem services in hilly and mountainous areas of southern China. J. Mt. Sci. 2022, 19, 338–349. [Google Scholar] [CrossRef]
- Fu, J.; Zhang, Q.; Wang, P.; Zhang, L.; Tian, Y.; Li, X. Spatio-Temporal Changes in Ecosystem Service Value and Its Coordinated Development with Economy: A Case Study in Hainan Province, China. Remote Sens. 2022, 14, 970. [Google Scholar] [CrossRef]
- Elliot, T.; Goldstein, B.; Gómez-Baggethun, E.; Proença, V.; Rugani, B. Ecosystem service deficits of European cities. Sci. Total Environ. 2022, 837, 155875. [Google Scholar] [CrossRef] [PubMed]
- Sun, R.; Jin, X.; Han, B.; Liang, X.; Zhang, X.; Zhou, Y. Does scale matter? Analysis and measurement of ecosystem service supply and demand status based on ecological unit. Environ. Impact Assess. Rev. 2022, 95, 106785. [Google Scholar] [CrossRef]
- Wu, X.; Liu, S.; Zhao, S.; Hou, X.; Xu, J.; Dong, S.; Liu, G. Quantification and driving force analysis of ecosystem services supply, demand and balance in China. Sci. Total Environ. 2018, 652, 1375–1386. [Google Scholar] [CrossRef] [PubMed]
- Wang, A.; Liao, X.; Tong, Z.; Du, W.; Zhang, J.; Liu, X.; Liu, M. Spatial-temporal dynamic evaluation of the ecosystem service value from the perspective of “production-living-ecological” spaces: A case study in Dongliao River Basin, China. J. Clean. Prod. 2021, 333, 130218. [Google Scholar] [CrossRef]
- Wang, H.; Liu, X.; Zhao, C.; Chang, Y.; Liu, Y.; Zang, F. Spatial-temporal pattern analysis of landscape ecological risk assessment based on land use/land cover change in Baishuijiang National nature reserve in Gansu Province, China. Ecol. Indic. 2021, 124, 107454. [Google Scholar] [CrossRef]
- Zhang, S.; Zhong, Q.; Cheng, D.; Xu, C.; Chang, Y.; Lin, Y.; Li, B. Coupling Coordination Analysis and Prediction of Landscape Ecological Risks and Ecosystem Services in the Min River Basin. Land 2022, 11, 222. [Google Scholar] [CrossRef]
- Liu, X.; Zhang, Z.; Li, M.; Fu, Y.; Hui, Y. Spatial conflict simulation of land-use based on human-land-landscape elements intercoordination: A case study in Tianjin, China. Environ. Monit. Assess. 2022, 194, 1–17. [Google Scholar] [CrossRef]
- Tao, Y.; Wang, Q. Quantitative Recognition and Characteristic Analysis of Production-Living-Ecological Space Evolution for Five Resource-Based Cities: Zululand, Xuzhou, Lota, Surf Coast and Ruhr. Remote Sens. 2021, 13, 1563. [Google Scholar] [CrossRef]
- Liu, Y.; Wang, S.; Chen, Z.; Tu, S. Research on the Response of Ecosystem Service Function to Landscape Pattern Changes Caused by Land Use Transition: A Case Study of the Guangxi Zhuang Autonomous Region, China. Land 2022, 11, 752. [Google Scholar] [CrossRef]
- Wang, Q.; Wang, H. Dynamic simulation and conflict identification analysis of production–living–ecological space in Wuhan, Central China. Integr. Environ. Assess. 2022. [Google Scholar] [CrossRef] [PubMed]
- Hong, W.; Guo, R.; Wang, W. A diagrammatic method for the identification and resolution of urban spatial conflicts. J. Environ. Manag. 2022, 316, 115297. [Google Scholar] [CrossRef] [PubMed]
- Din, S.U.; Mak, H.W.L. Retrieval of Land-Use/Land Cover Change (LUCC) Maps and Urban Expansion Dynamics of Hyderabad, Pakistan via Landsat Datasets and Support Vector Machine Framework. Remote Sens. 2021, 13, 3337. [Google Scholar] [CrossRef]
- Shih, H.-C.; Stow, D.A.; Chang, K.-C.; Roberts, D.A.; Goulias, K.G. From land cover to land use: Applying random forest classifier to Landsat imagery for urban land-use change mapping. Geocarto Int. 2022, 37, 5523–5546. [Google Scholar] [CrossRef]
- Zeng, C.; He, J.; He, Q.; Mao, Y.; Yu, B. Assessment of Land Use Pattern and Landscape Ecological Risk in the Chengdu-Chongqing Economic Circle, Southwestern China. Land 2022, 11, 659. [Google Scholar] [CrossRef]
- Liu, Y.; Yang, R.; Sun, M.; Zhang, L.; Li, X.; Meng, L.; Wang, Y.; Liu, Q. Regional sustainable development strategy based on the coordination between ecology and economy: A case study of Sichuan Province, China. Ecol. Indic. 2021, 134, 108445. [Google Scholar] [CrossRef]
- Han, B.; Jin, X.; Sun, R.; Li, H.; Liang, X.; Zhou, Y. Land use sustainability evaluation based on conflict-adaptation perspective. Acta Geogr. Sin. 2021, 76, 1763–1777. [Google Scholar]
- Zhang, T.; Zhang, S.; Cao, Q.; Wang, H.; Li, Y. The spatiotemporal dynamics of ecosystem services bundles and the social-economic-ecological drivers in the Yellow River Delta region. Ecol. Indic. 2022, 135, 108573. [Google Scholar] [CrossRef]
- Pan, G.; Xu, Y.; Yu, Z.; Song, S.; Zhang, Y. Analysis of river health variation under the background of urbanization based on entropy weight and matter-element model: A case study in Huzhou City in the Yangtze River Delta, China. Environ. Res. 2015, 139, 31–35. [Google Scholar] [CrossRef]
- Wen, D.; Liu, M.; Yu, Z. Quantifying Ecological Landscape Quality of Urban Street by Open Street View Images: A Case Study of Xiamen Island, China. Remote Sens. 2022, 14, 3360. [Google Scholar] [CrossRef]
- Zhang, N.; Ye, H.; Wang, M.; Li, Z.; Li, S.; Li, Y. Response Relationship between the Regional Thermal Environment and Urban Forms during Rapid Urbanization (2000–2010–2020): A Case Study of Three Urban Agglomerations in China. Remote Sens. 2022, 14, 3749. [Google Scholar] [CrossRef]
- Liu, J.; Chen, J.J.; Zhao, X.N.; Zhang, H.Z. Spatial differentiation characteristics of alpine grassland patches in the source region of the yellow river and its ecological significance. ISPRS-Int. Arch. Photogramm. Remote Sens. Spat. Inf. Sci. 2020, 42, 755–762. [Google Scholar] [CrossRef]
- Peng, J.; Shen, H.; Wu, W.; Liu, Y.; Wang, Y. Net primary productivity (NPP) dynamics and associated urbanization driving forces in metropolitan areas: A case study in Beijing City, China. Landsc. Ecol. 2015, 31, 1077–1092. [Google Scholar] [CrossRef]
- Chen, Y.; Wang, J.; Xiong, N.; Sun, L.; Xu, J. Impacts of Land Use Changes on Net Primary Productivity in Urban Agglomerations under Multi-Scenarios Simulation. Remote Sens. 2022, 14, 1755. [Google Scholar] [CrossRef]
- Zhai, T.; Wang, J.; Jin, Z.; Qi, Y.; Fang, Y.; Liu, J. Did improvements of ecosystem services supply-demand imbalance change environmental spatial injustices? Ecol. Indic. 2020, 111, 106068. [Google Scholar] [CrossRef]
- Lin, X.; Ma, J.; Chen, H.; Shen, F.; Ahmad, S.; Li, Z. Carbon Emissions Estimation and Spatiotemporal Analysis of China at City Level Based on Multi-Dimensional Data and Machine Learning. Remote Sens. 2022, 14, 3014. [Google Scholar] [CrossRef]
- Yang, H.; Huang, J.; Liu, D. Linking climate change and socioeconomic development to urban land use simulation: Analysis of their concurrent effects on carbon storage. Appl. Geogr. 2020, 115, 102135. [Google Scholar] [CrossRef]
- Xiao, P.; Zhou, Y.; Li, M.; Xu, J. Spatiotemporal patterns of habitat quality and its topographic gradient effects of Hubei Province based on the InVEST model. Environ. Dev. Sustain. 2022. [Google Scholar] [CrossRef]
- Tang, F.; Fu, M.; Wang, L.; Song, W.; Yu, J.; Wu, Y. Dynamic evolution and scenario simulation of habitat quality under the impact of land-use change in the Huaihe River Economic Belt, China. PLoS ONE 2021, 16, e0249566. [Google Scholar] [CrossRef]
- Zhou, D.; Lin, Z.; Lim, S.H. Spatial characteristics and risk factor identification for land use spatial conflicts in a rapid urbanization region in China. Environ. Monit. Assess. 2019, 191, 677. [Google Scholar] [CrossRef]
- Wei, J.; Li, Z.; Lyapustin, A.; Sun, L.; Peng, Y.; Xue, W.; Su, T.; Cribb, M. Reconstructing 1-km-resolution high-quality PM2.5 data records from 2000 to 2018 in China: Spatiotemporal variations and policy implications. Remote Sens. Environ. 2020, 252, 112136. [Google Scholar] [CrossRef]
- Liang, X.; Guan, Q.; Clarke, K.C.; Liu, S.; Wang, B.; Yao, Y. Understanding the drivers of sustainable land expansion using a patch-generating land use simulation (PLUS) model: A case study in Wuhan, China. Comput. Environ. Urban Syst. 2020, 85, 101569. [Google Scholar] [CrossRef]
- Jiang, Y.; Huang, M.; Chen, X.; Wang, Z.; Xiao, L.; Xu, K.; Zhang, S.; Wang, M.; Xu, Z.; Shi, Z. Identification and risk prediction of potentially contaminated sites in the Yangtze River Delta. Sci. Total Environ. 2021, 815, 151982. [Google Scholar] [CrossRef]
- Tang, Y.; Gao, C.; Wu, X. Urban Ecological Corridor Network Construction: An Integration of the Least Cost Path Model and the InVEST Model. ISPRS Int. J. Geo-Information 2020, 9, 33. [Google Scholar] [CrossRef]
- Liu, J.-Y.; Deng, X.-Z.; Liu, M.-L.; Zhang, S.-W. Study on the spatial patterns of land-use change and analyses of driving forces in Northeastern China during 1990–2000. Chin. Geogr. Sci. 2002, 12, 299–308. [Google Scholar] [CrossRef]
- Cui, S.; Han, Z.; Yan, X.; Li, X.; Zhao, W.; Liu, C.; Li, X.; Zhong, J. Link Ecological and Social Composite Systems to Construct Sustainable Landscape Patterns: A New Framework Based on Ecosystem Service Flows. Remote Sens. 2022, 14, 4663. [Google Scholar] [CrossRef]
- Wei, S.; Pan, J.; Liu, X. Landscape ecological safety assessment and landscape pattern optimization in arid inland river basin: Take Ganzhou District as an example. Hum. Ecol. Risk Assessment: Int. J. 2018, 26, 782–806. [Google Scholar] [CrossRef]
- Cao, Y.; Liu, M.; Cao, Y.; Chen, C.; Zhang, D. Change Pattern and Driving Mechanism of Construction Land in China’s Undertaking Industrial Transfer Demonstration Area: Taking the Wanjiang City Belt along the Yangtze River as an Example. Earth Sci. Res. J. 2020, 24, 215–223. [Google Scholar] [CrossRef]
- Wang, Y.; Duan, X.; Wang, L.; Zou, H. Spatial temporal patterns and driving factors of industrial pollution and structures in the Yangtze River Economic Belt. Chemosphere 2022, 303, 134996. [Google Scholar] [CrossRef]
- Zhang, Y.; Liu, Y.; Kong, X.; Jing, Y.; Cai, E.; Zhang, L.; Liu, Y.; Wang, Z.; Liu, Y. Spatial Patterns and Driving Forces of Conflicts among the Three Land Management Red Lines in China: A Case Study of the Wuhan Urban Development Area. Sustainability 2019, 11, 2025. [Google Scholar] [CrossRef]
- Xu, W.; He, M.; Meng, W.; Zhang, Y.; Yun, H.; Lu, Y.; Huang, Z.; Mo, X.; Hu, B.; Liu, B.; et al. Temporal-spatial change of China’s coastal ecosystems health and driving factors analysis. Sci. Total Environ. 2022, 845, 157319. [Google Scholar] [CrossRef] [PubMed]
- Saarikoski, H.; Raitio, K.; Barry, J. Understanding ‘successful’ conflict resolution: Policy regime changes and new interactive arenas in the Great Bear Rainforest. Land Use Policy 2013, 32, 271–280. [Google Scholar] [CrossRef]
- Bircol, G.A.C.; de Souza, M.P.; Fontes, A.T.; Chiarello, A.G.; Ranieri, V.E.L. Planning by the rules: A fair chance for the environment in a land-use conflict area. Land Use Policy 2018, 76, 103–112. [Google Scholar] [CrossRef]
- Moomen, A. Strategies for managing large-scale mining sector land use conflicts in the global south. Resour. Policy 2017, 51, 85–93. [Google Scholar] [CrossRef]
- Lovell, S.T.; DeSantis, S.; Nathan, C.A.; Olson, M.B.; Méndez, V.E.; Kominami, H.C.; Erickson, D.L.; Morris, K.S.; Morris, W.B. Integrating agroecology and landscape multifunctionality in Vermont: An evolving framework to evaluate the design of agroecosystems. Agric. Syst. 2010, 103, 327–341. [Google Scholar] [CrossRef]
- Stockdale, A.; Barker, A. Sustainability and the multifunctional landscape: An assessment of approaches to planning and management in the Cairngorms National Park. Land Use Policy 2009, 26, 479–492. [Google Scholar] [CrossRef]
- Schirpke, U.; Timmermann, F.; Tappeiner, U.; Tasser, E. Cultural ecosystem services of mountain regions: Modelling the aesthetic value. Ecol. Indic. 2016, 69, 78–90. [Google Scholar] [CrossRef]



| Data | Resolution Data | Available Time Interval | Source |
|---|---|---|---|
| Land Use Data | 1 km × 1 km | 2010, 2015, 2020 | Resource and Environmental Science and Data Center (https://www.resdc.cn (accessed on 25 January 2020)) |
| Net primary productivity (NPP) | 0.5 km × 0.5 km | 2010–2020 | Product of MOD17A3H estimated by moderate resolution imaging spectroradiometer (MODIS) images (http://www.noaa.gov/ (accessed on 26 January 2020)) |
| Normalized difference vegetation index (Ndvi) | 1 km × 1 km | 2010–2020 | MYDND1M China 500M (http://www.noaa.gov/ (accessed on 11 January 2021)) |
| Fine particulate matter (PM2.5) | 1 km × 1 km | 2010–2020 | https://doi.org/10.5281/zenodo.6372847 (accessed on 18 March 2022) |
| Nighttime light (NtL) | 1 km × 1 km | 2010–2020 | NOAA (https://ngdc.noaa.gov/eog/dmsp/downloadV4composites.html (accessed on 7 April 2022)) |
| Gross domestic product (GDP) | 1 km × 1 km | 2010, 2015, 2019 | Resource and Environmental Science and Data Center (https://www.resdc.cn (accessed on 17 April 2022)) |
| Population data (Pop) | 1 km × 1 km | 2010–2020 | Worldpop (https://www.worldpop.org/ (accessed on 27 March 2021)) |
| Indicator Type | Standard Layer | Indicator Layer | Indicator Attribute | Indicator Description |
|---|---|---|---|---|
| Resource Conflict (RC) | Land use conflict (RC1) | Landscape aggregation index (AI) | Negative | Reflects the conflict between cultivated land resources and construction land |
| Landscape sprawl index (Contag) | Negative | Reflects the conflict between ecological land resources and construction land | ||
| Human activities clash with natural resources (RC2) | NPP data | Negative | Reflects the vegetation regeneration capacity | |
| Construction–land density reaction | positive | Reaction to the consumption of land resources | ||
| Function Conflict (FC) | Supply and demand of ecosystem services conflict (FC1) | Supply of ecosystem services | Negative | Reflects the supply and demand of ecosystem services |
| Demand of ecosystem services | positive | |||
| Carbon-fixing capacity conflicts with carbon emissions (FC2) | Carbon emissions | positive | Reflect carbon emissions and carbon storage | |
| Carbon sequestration | Negative | |||
| Capacity Conflict (CC) | Biodiversity conflict (CC1) | Habitat quality | Negative | Reflects species richness through biodiversity |
| Economic and environmental conflict (CC2) | GDP | positive | Reflects the economic development situation | |
| PM2.5 | positive | Reflects the air environmental quality situation | ||
| Pop | positive | Reflects the size of the population | ||
| Ndvi data | Negative | Reflects the vegetation coverage situation |
| Conflict Types | Highest Conflict | High Conflict | Medium Conflict | Low Conflict | Lowest Conflict |
|---|---|---|---|---|---|
| 2010 | 1.07% | 2.95% | 24.49% | 58.94% | 12.56% |
| 2015 | 1.24% | 3.33% | 18.22% | 64% | 13.21% |
| 2020 | 1.94% | 3.69% | 18.98% | 66.15% | 9.24% |
| Time | Land Use Type | Lowest Conflict | Low Conflict | Medium Conflict | High Conflict | Highest Conflict |
|---|---|---|---|---|---|---|
| 2010 | Arable land | 24.97 | 63.97 | 61.76 | 29.31 | 2.34 |
| Woodland | 65.73 | 11.68 | 5.11 | 3.97 | 3.21 | |
| Grassland | 6.46 | 4.26 | 1.83 | 0.26 | 0.15 | |
| Waters | 1.57 | 11.57 | 11.52 | 6.52 | 2.63 | |
| Construction Land | 1.20 | 8.44 | 19.68 | 59.57 | 91.68 | |
| Unused land | 0.07 | 0.08 | 0.10 | 0.37 | 0 | |
| 2015 | Arable land | 6.3 | 74.71 | 40.90 | 11.80 | 0 |
| Woodland | 70.51 | 10.86 | 1.12 | 0.33 | 0 | |
| Grassland | 12.89 | 3.08 | 0.53 | 0.09 | 0 | |
| Waters | 10.20 | 9.23 | 14.79 | 1.42 | 0.25 | |
| Construction Land | 0.06 | 2.09 | 42.36 | 85.88 | 99.75 | |
| Unused land | 0.04 | 0.03 | 0.29 | 0.47 | 0 | |
| 2020 | Arable land | 9.67 | 68.17 | 48.93 | 15.12 | 0.98 |
| Woodland | 77.54 | 13.20 | 2.28 | 1.07 | 0 | |
| Grassland | 10.22 | 4.18 | 0.77 | 0.17 | 0 | |
| Waters | 2.45 | 10.07 | 15.46 | 4.33 | 0.98 | |
| Construction Land | 0.10 | 4.31 | 32.35 | 79.22 | 98.04 | |
| Unused land | 0.02 | 0.06 | 0.21 | 0.09 | 0 |
| Time | Highest Conflict | High Conflict | Medium Conflict | Low Conflict | Lowest Conflict |
|---|---|---|---|---|---|
| 2010–2015 | 0.03 | 0.07 | 0.14 | 0.17 | 0.12 |
| 2015–2020 | 0.07 | 0.15 | 0.17 | 0.13 | 0.09 |
| 2010–2020 | 0.07 | 0.14 | 0.16 | 0.13 | 0.09 |
| Time | Factors | Highest Conflict | High Conflict | Medium Conflict | Low Conflict | Lowest Conflict |
|---|---|---|---|---|---|---|
| 2010–2015 | Industrial density | 0.18 | 0.18 | 0.12 | 0.13 | 0.12 |
| DEM | 0.09 | 0.13 | 0.19 | 0.2 | 0.24 | |
| Distance to highways | 0.06 | 0.13 | 0.09 | 0.1 | 0.09 | |
| Distance to Nanjing city | 0.13 | 0.08 | 0.07 | 0.07 | 0.09 | |
| Average annual temperature | 0.19 | 0.17 | 0.14 | 0.13 | 0.13 | |
| Distance to water | 0.07 | 0.13 | 0.18 | 0.16 | 0.19 | |
| Distance to railroad | 0.22 | 0.12 | 0.08 | 0.11 | 0.05 | |
| Soil type | 0.05 | 0.07 | 0.12 | 0.1 | 0.09 | |
| 2015–2020 | Industrial density | 0.23 | 0.15 | 0.16 | 0.11 | 0.11 |
| DEM | 0.15 | 0.19 | 0.19 | 0.21 | 0.39 | |
| Distance to highways | 0.11 | 0.1 | 0.09 | 0.12 | 0.06 | |
| Distance to Nanjing city | 0.07 | 0.1 | 0.1 | 0.1 | 0.09 | |
| Average annual temperature | 0.13 | 0.14 | 0.13 | 0.15 | 0.11 | |
| Distance to water | 0.1 | 0.13 | 0.12 | 0.14 | 0.1 | |
| Distance to railroad | 0.14 | 0.1 | 0.1 | 0.1 | 0.08 | |
| Soil type | 0.07 | 0.09 | 0.1 | 0.08 | 0.05 | |
| 2010–2020 | Industrial density | 0.2 | 0.23 | 0.13 | 0.15 | 0.13 |
| DEM | 0.12 | 0.1 | 0.22 | 0.18 | 0.24 | |
| Distance to highways | 0.09 | 0.09 | 0.08 | 0.1 | 0.08 | |
| Distance to Nanjing city | 0.09 | 0.08 | 0.08 | 0.08 | 0.08 | |
| Average annual temperature | 0.17 | 0.17 | 0.16 | 0.14 | 0.17 | |
| Distance to water | 0.12 | 0.11 | 0.12 | 0.15 | 0.11 | |
| Distance to railroad | 0.15 | 0.13 | 0.1 | 0.11 | 0.09 | |
| Soil type | 0.07 | 0.09 | 0.11 | 0.09 | 0.1 |
Publisher’s Note: MDPI stays neutral with regard to jurisdictional claims in published maps and institutional affiliations. |
© 2022 by the authors. Licensee MDPI, Basel, Switzerland. This article is an open access article distributed under the terms and conditions of the Creative Commons Attribution (CC BY) license (https://creativecommons.org/licenses/by/4.0/).
Share and Cite
Cao, J.; Cao, W.; Fang, X.; Ma, J.; Mok, D.; Xie, Y. The Identification and Driving Factor Analysis of Ecological-Economi Spatial Conflict in Nanjing Metropolitan Area Based on Remote Sensing Data. Remote Sens. 2022, 14, 5864. https://doi.org/10.3390/rs14225864
Cao J, Cao W, Fang X, Ma J, Mok D, Xie Y. The Identification and Driving Factor Analysis of Ecological-Economi Spatial Conflict in Nanjing Metropolitan Area Based on Remote Sensing Data. Remote Sensing. 2022; 14(22):5864. https://doi.org/10.3390/rs14225864
Chicago/Turabian StyleCao, Ji, Weidong Cao, Xianwei Fang, Jinji Ma, Diana Mok, and Yisong Xie. 2022. "The Identification and Driving Factor Analysis of Ecological-Economi Spatial Conflict in Nanjing Metropolitan Area Based on Remote Sensing Data" Remote Sensing 14, no. 22: 5864. https://doi.org/10.3390/rs14225864
APA StyleCao, J., Cao, W., Fang, X., Ma, J., Mok, D., & Xie, Y. (2022). The Identification and Driving Factor Analysis of Ecological-Economi Spatial Conflict in Nanjing Metropolitan Area Based on Remote Sensing Data. Remote Sensing, 14(22), 5864. https://doi.org/10.3390/rs14225864


