Article

Frequency-Domain Q-Compensated Reverse Time Migration Using a Stabilization Scheme

1
College of Geophysics and Petroleum Resources, Yangtze University, Wuhan 430100, China
2
Yangtze Delta Research Institute, University of Electronic Science and Technology of China (Huzhou), Huzhou 313000, China
3
School of Geophysics, China University of Petroleum-Beijing, Changping, Beijing 102249, China
*
Author to whom correspondence should be addressed.
Remote Sens. 2022, 14(22), 5850; https://doi.org/10.3390/rs14225850
Submission received: 18 September 2022 / Revised: 24 October 2022 / Accepted: 16 November 2022 / Published: 18 November 2022
(This article belongs to the Special Issue Geophysical Data Processing in Remote Sensing Imagery)

Abstract

:
Seismic attenuation occurs during seismic wave propagation in a viscous medium, which will result in a poor image of subsurface structures. The attenuation compensation by directly amplifying the extrapolated wavefields may suffer from numerical instability because of the exponential compensation for seismic wavefields. To alleviate this issue, we have developed a stabilized frequency-domain Q-compensated reverse time migration (FQ-RTM). In the algorithm, we use a stabilized attenuation compensation operator, which includes both the stabilized amplitude compensation operator and the dispersion correction operator, for the seismic wavefield extrapolation. The dispersion correction operator is calculated based on the frequency-domain dispersion-only viscoacoustic wave equation, while the amplitude compensation operator is derived via a stabilized division of two propagation wavefields (the dispersion-only wavefield and the viscoacoustic wavefield). Benefiting from the stabilization scheme in the amplitude compensation, the amplification of the seismic noises is suppressed. The frequency-domain cross-correlation imaging condition is exploited to obtain the compensated image. The layered model experiments demonstrate the effectiveness and great compensation performance of our method. The BP gas model examples further verify its feasibility and stability. The field data applications indicate the practicability of the proposed method. The comparison between the acoustic and compensated results confirms that the proposed method is able to compensate for the seismic attenuation while suppressing the amplification of the high-frequency seismic noise.

1. Introduction

Since the subsurface media are viscous, seismic waves will suffer from amplitude attenuation and velocity dispersion when propagating through it [1,2,3]. The overall attenuation effect on seismic data is that the high frequencies attenuate more rapidly than the low frequencies, which results in a low resolution of the recorded data [4,5,6]. In recent years, many algorithms have been developed to compensate for seismic attenuation [7,8,9,10,11,12,13,14,15,16,17,18,19,20,21]. These methods include seismic-record-based compensation methods and propagation-path-based compensation methods.
The first kind of approaches compensate for the seismic attenuation directly on the post-stack records without considering the paths of seismic wave propagation. Thus, these approaches enjoy greater simplicity and higher efficiency at the expense of the compensation accuracy. However, the attenuation effects occur during seismic wave propagation, so it is more physically reasonable to carry out attenuation compensation in the migration [22]. Therefore, the propagation-path-based compensation methods implemented during the seismic wave propagation have also been investigated by many researchers [23,24,25]. This category of compensation schemes includes Q-compensated ray-based migration [26], Q-compensated one-way wave equation-based migration (Q-OWEM) [27], and Q-RTM [28,29,30,31,32]. Among them, each one has its own advantages and disadvantages. For example, the OWEM is commonly formulated in the frequency domain; therefore, Q-OWEM can be easily implemented by replacing the real-value velocity with the complex-value phase velocity [22]. Although Q-OWEM is easy to implement, it has some limitations to image the complex geological structures [33]. However, Q-RTM has been considered as a preferred technique for imaging the complex geological structures [34].
The major problem of Q-RTM is the numerical instability of attenuation compensation. If it is not handled properly, the migrated profiles will suffer from severe artifacts [35]. Recently, many efficient algorithms have been developed to stabilize the compensated image. For example, Suh et al. [36] exploit a high-cut filter to stabilize the backward-extrapolation seismic wavefields. Fletcher et al. [37] stabilize the Q-compensated migration process by separately applying amplitude and phase filters to the propagation wavefields before imaging. Sun and Zhu [38] discuss the stable compensation strategies for Q-RTM with the decoupled fractional Laplacians equation (DFLE). Considering the time-variance and Q-dependence property of seismic attenuation, Wang et al. [35] develop an adaptive stabilization algorithm for time-domain Q-RTM based on the DFLE. Furthermore, Zhao et al. [39] present a stable viscoelastic RTM using excitation amplitude imaging condition. Chen et al. [40] apply an implicit scheme for the stabilized Q-RTM algorithm, which is more robust than the traditional low-pass filtering strategy. In addition, the numerical instability can also be avoided by adopting the inversion scheme, that is, Q-compensated least-squares RTM (Q-LSRTM) [41,42]. Although Q-LSRTM is unconditionally stable, it has a higher computational cost than conventional Q-RTM.
Q-RTM can be performed either in the time domain [29] or in the frequency domain [43]. In this paper, we focus on investigating the FQ-RTM. Compared with the time-domain Q-RTM, FQ-RTM is attractive for several reasons. Firstly, the frequency-domain viscoacoustic wave equation can be easily obtained by replacing the real-valued velocities with the complex-valued velocities for accounting for the attenuation effects [44,45]. Secondly, the forward modeling and Q-RTM in the frequency domain is straightforward and is appropriate for multishot surveys by using a direct solver (e.g., LU decomposition) [46,47]. More importantly, the numerical instability of Q-RTM results from the amplification of the high-frequencies; thus, it is more direct and natural to deal with instability problems in the frequency domain.
For obtaining a stable Q-compensated image, we develop a stabilized migration scheme by the following steps: firstly, we choose the commonly used Kolsky–Futterman model to account for the attenuation effects and further obtain a Kolsky–Futterman-model-based viscoacoustic wave equation by allowing the real-valued velocity to be the complex-valued velocity. Secondly, we develop a stabilized attenuation compensation operator which consists of a stabilized amplitude compensation operator and a dispersion correction operator. Thirdly, we formulate the stabilized compensation wavefields in both source forward-propagation and receiver backward-propagation using the stabilized compensation operators. Finally, we apply the cross-correlation imaging condition for the migrated result. The algorithmic stability and compensation accuracy of the proposed method is verified by both synthetic examples and field data applications.
We organize this paper as follows: first, we briefly review the finite-difference forward modeling for acoustic and viscoacoustic wave equations in the frequency domain. Then, we introduce the processing flows of the frequency-domain acoustic RTM (FA-RTM). Next, we construct an amplitude compensation operator by a stabilized division and apply it for the stabilized FQ-RTM. Subsequently, a layered model is applied to demonstrate the effectiveness and accuracy of our method, and the BP gas model is used to further verify its stability and anti-noise property. The field data applications are conducted to indicate the practicability of the proposed method. Finally, we make a discussion on the method and draw some conclusions.

2. Materials and Methods

2.1. Acoustic and Viscoacoustic Wave Equation Forward Modeling in the Frequency Domain

The 2D acoustic wave equation in the frequency domain can be expressed as [48,49],
2 P ( x , z , ω ) + ω 2 v 2 ( x , z ) P ( x , z , ω ) = f ( ω ) δ ( x x s ) δ ( z z s ) ,
where 2 = 2 x 2 + 2 z 2 is the Laplacian operator, P ( x , z , ω ) is the frequency-domain wavefield, v ( x , z ) denotes the propagation velocity, f ( ω ) is the source function, δ ( · ) is the Dirac delta function, and ( x s , z s ) is the source location.
Since Equation (1) is formulated in the frequency domain, we can simply generalize it from an acoustic equation to viscoacoustic case by allowing the real-valued velocity to be complex-valued. We adopt the commonly used Kolsky–Futterman model [1,2] for this replacement, which can be expressed as
1 v ( x , z , ω ) = 1 v ( x , z ) 1 1 π Q ln ω ω 0 1 i 2 Q ,
where v ( x , z , ω ) is the complex-valued phase velocity, Q is the quality factor, and ω 0 is the reference angular frequency. In Equation (2), the second term, 1 1 π Q ln ω ω 0 , is responsible for the phase distortion, while the third term, 1 i 2 Q , controls the amplitude attenuation. The velocity dispersion and amplitude dissipation are naturally decoupled. Therefore, we can separately obtain the dissipation-only, the dispersion-only, and the viscoacoustic equations, which are useful for developing a stabilized attenuation compensation operator.
Replacing the real-valued velocity with the complex-valued phase velocity, we can obtain the corresponding viscoacoustic equation. The matrix-vector formulation is [50,51],
S p = f ,
where p is the seismic wavefield vector, f is the source vector, and S is the impedance matrix computed by the numerical approximation of the discretized Laplacian and the discretized model parameters. In this paper, we use the optimal 9-point finite-difference scheme [52,53] to calculate the impedance matrix. The 9-point stencil and the structure of the impedance matrix are shown in Figure 1.
Note that the impedance matrix S implicitly includes the boundary conditions and it is very sparse, so we can store it in a compressed format. Furthermore, this sparse matrix can be solved using the sparse lower/upper triangular (LU) decomposition [54]. Once we obtain the L and U operators, the solution for any other sources can be efficiently computed by the elimination and back-substitution steps. Therefore, the direct LU solver is appropriate for multishot surveys with numerous independent real or virtual sources.
To testify the decoupling property of the Kolsky–Futterman model, we separately perform the acoustic forward modeling, the dissipation-only forward modeling by using velocity 1 v ( x , z , ω ) = 1 v ( x , z ) 1 i 2 Q , the dispersion-only forward modeling by using velocity 1 v ( x , z , ω ) = 1 v ( x , z ) 1 1 π Q ln ω ω 0 , and the viscoacoustic modeling. Figure 2 shows the snapshots at 280 ms in the four cases. Compared with the acoustic wavefront (Figure 2a), the dispersion-only wavefront (Figure 2c) shows no amplitude attenuation but evident phase distortion, whereas the dissipation-only wavefront (Figure 2b) exhibits decayed amplitude but no phase dispersion (see red dashed circle). Furthermore, the viscoacoustic wavefront (Figure 2d) describes both amplitude attenuation and phase distortion.

2.2. Frequency-Domain Acoustic RTM

In the acoustic media, the cross-correlation imaging condition in the frequency domain can be expressed as [48],
I k = ω = 0 ω max j = 1 n s h o t Re p j ( ω ) m k T [ r j ( ω ) ] ,
where I k is the image for the k t h model parameter m k (e.g., velocity), ω max represents the maximum angular frequency, j and n s h o t are the shot index and total shot number, respectively, Re ( · ) denotes the real part operator, p j ( ω ) is the forward-propagating source wavefield of j t h shot at the frequency ω , r j ( ω ) is the frequency-domain recorded data of j t h shot at the frequency ω , and the superscript † denotes the complex conjugate.
The calculation of the partial derivative wavefield, p j ( ω ) m k , is very cumbersome, so we do not directly use Equation (4) for imaging. To avoid the numerical calculation of the partial derivative wavefield, Gao and Li [43] simplify the above equation and obtain the following equation (see details in Appendix A),
I ( x , z ) = ω = 0 ω max j = 1 n s h o t Re G j T r ˜ j = ω = 0 ω max j = 1 n s h o t Re ω 2 p j r ˜ j ,
where G is a diagonal matrix with the element G k , k = ω 2 p j , and r ˜ j = S 1 T r j ( ω ) .
As shown in Figure 1b, the impedance matrix S is symmetric (more accurately, it is not perfectly symmetric due to the boundary conditions, but it does not cause problems in RTM), then we have S 1 T S 1 . Therefore, the term r ˜ j S 1 r j ( ω ) can be explained as the backward-propagating receiver wavefield with the recorded data as backward-propagation sources. Among them, the complex conjugate of the frequency-domain recorded data is equivalent to the time reversal in the time domain. In addition, we can find that we use the same propagation operator S in both source and receiver propagating-wavefields. Thus, L and U operators calculated in the forward propagation can be re-used in the backward propagation. Therefore, the frequency-domain RTM and the frequency-domain forward modeling have similar computational costs since they require the same number of LU decompositions.
Generally, the image is often normalized by the autocorrelation of the source wavefield (equivalent to the multiplication of the source wavefield with its conjugation in the frequency domain) [55],
I ( x , z ) = ω = 0 ω max j = 1 n s h o t Re G j r ˜ j ω = 0 ω max j = 1 n s h o t Re p j p j = ω = 0 ω max j = 1 n s h o t Re ω 2 p j r ˜ j ω = 0 ω max j = 1 n s h o t Re p j p j .
Figure 3 shows the schematic of the frequency-domain acoustic forward modeling and FA-RTM. As shown in Figure 3b, FA-RTM for common-shot gathers (CSGs) can carry out in the following three steps [56] (the pseudo-code of FA-RTM algorithm can be summarized in Appendix B):
  • Calculating the source wavefield p ( ω ) in the frequency domain by solving Equation (3);
  • Computing the receiver wavefield r ˜ j ( ω ) by treating the received CSGs as sources;
  • Obtaining the image using Equation (6).

2.3. Stablized Frequency-Domain Viscoacoustic RTM

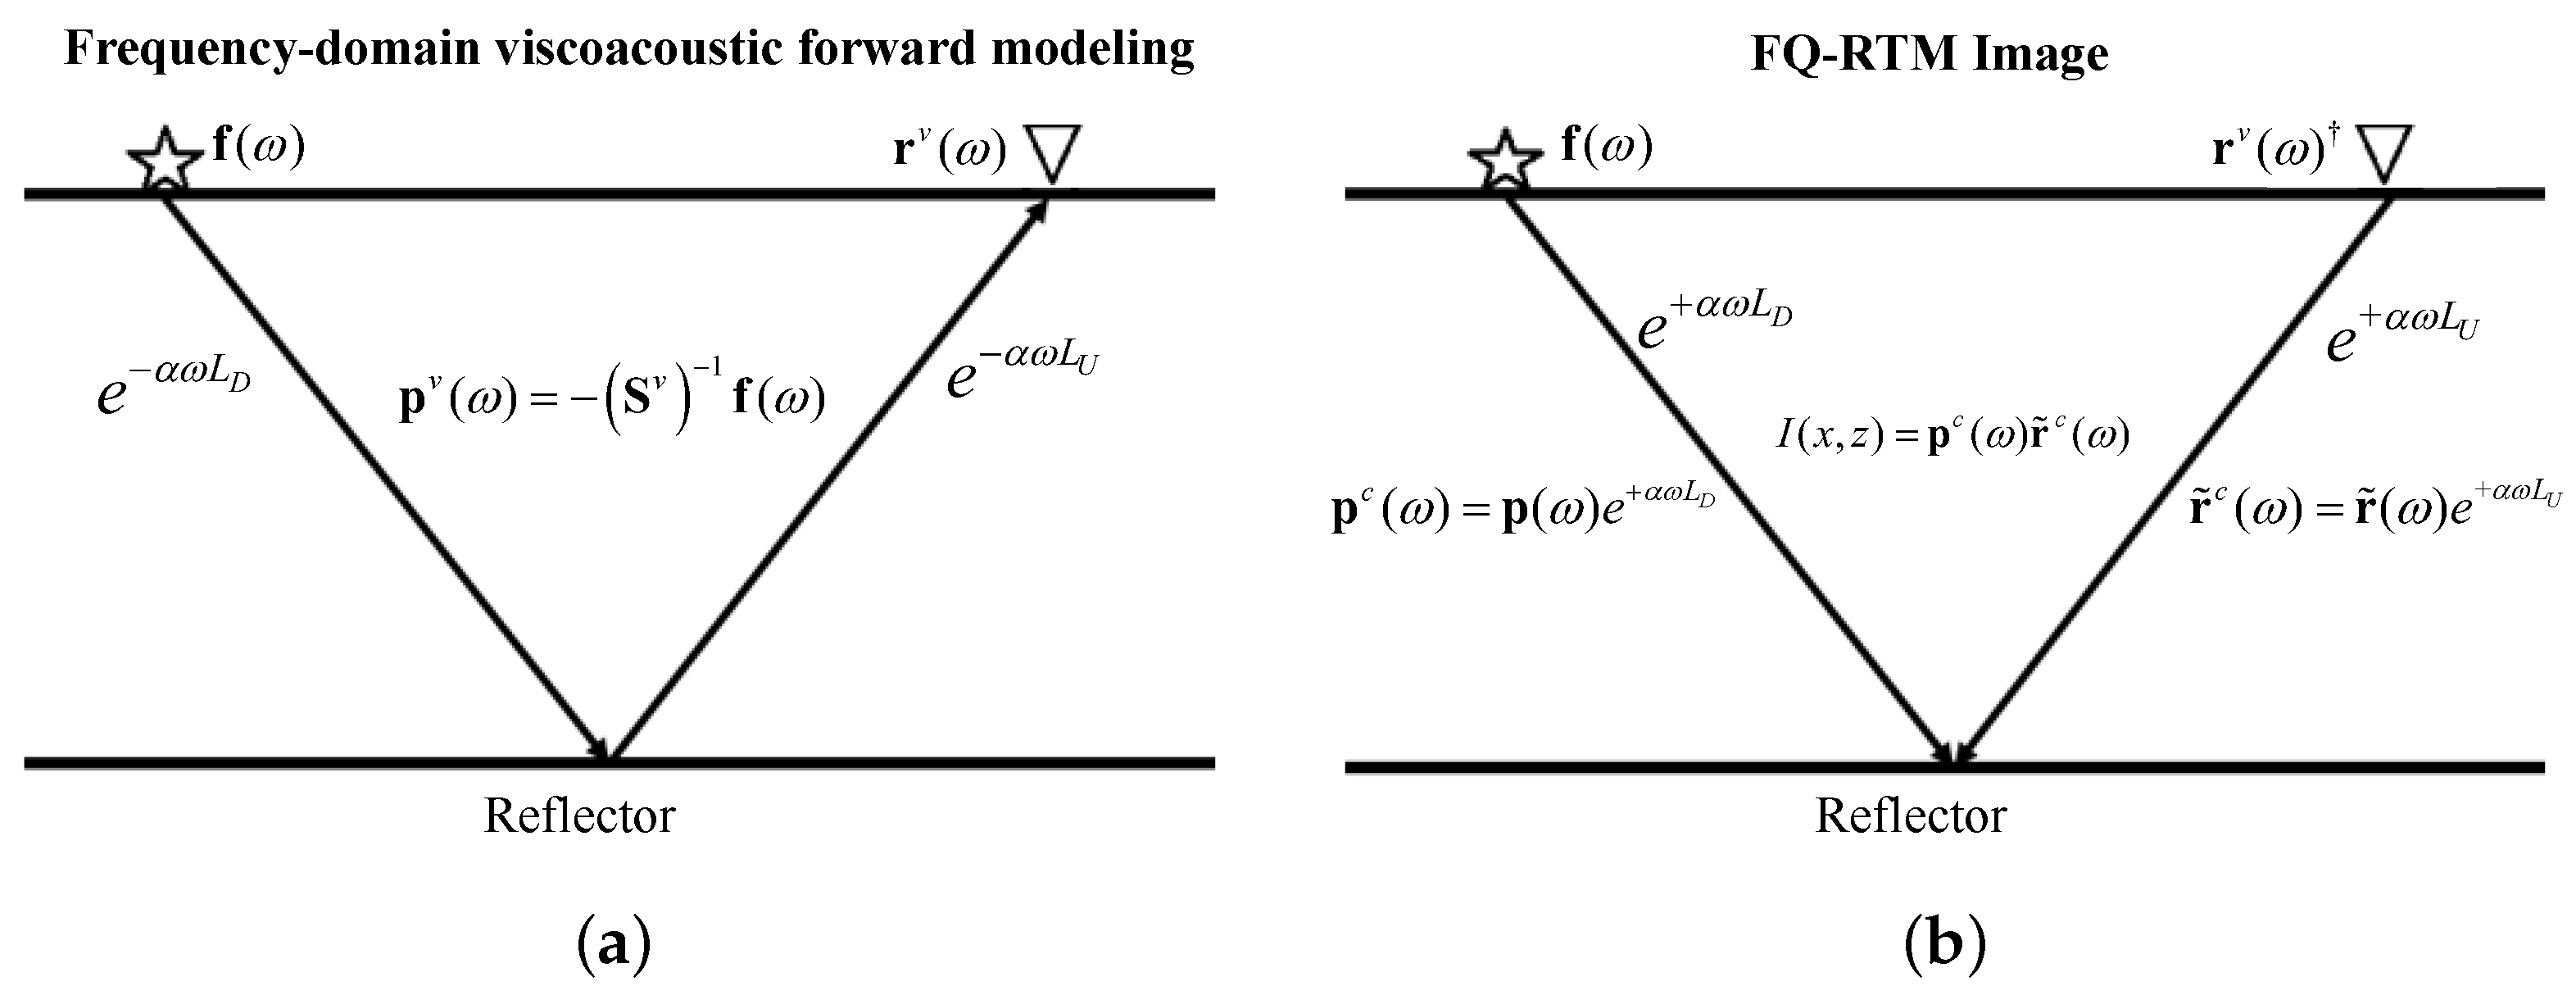
In the viscoacoustic media, seismic waves suffer from attenuating effects when traveling from source to receiver. Figure 4a displays the schematic of a seismic wave traveling in the attenuated media (the velocity dispersion is not considered since the correction of velocity dispersion is unconditionally stable). In this figure, the exponential decay function ( e α ω L ) describes the amplitude attenuation. The wave path consists of two parts, that is, the downgoing and the upgoing wave paths. The frequency-domain attenuated records r ˜ v ( ω ) can be expressed as [33],
r ˜ v ( ω ) = r ˜ ( ω ) e α ω L D e α ω L U .
where r ˜ v ( ω ) and r ˜ ( ω ) denote the acoustic and attenuated records, respectively, α represents the attenuation coefficient, and L D and L U are the downgoing and upgoing wave-paths, respectively.
To compensate for the amplitude attenuation, the measured records r ˜ v ( ω ) should be corrected by a gain factor e + α ω L D e + α ω L U in the backward-propagating. As shown in Figure 4b, we can exploit a compensation factor e + α ω L D to extrapolate the source wavefield from the source to the reflector and a gain factor e + α ω L U to extrapolate the receiver wavefield from the receiver to the reflector to achieve the same compensation for the amplitude loss. Therefore, the compensated source wavefield p c ( ω ) and the compensated receiver wavefield r ˜ c ( ω ) are,
p c ( ω ) = p ( ω ) e + α ω L D ,
and
r ˜ c ( ω ) = r ˜ ( ω ) e + α ω L U .
Furthermore, we can obtain the compensated image,
I c ( x , z ) = ω = 0 ω max j = 1 n s h o t Re ω 2 p j c r ˜ j c ω = 0 ω max j = 1 n s h o t Re p j p j .
From the Q-compensated image, we can find that seismic wavefields are exponentially compensated during both source forward-propagating and receiver backward-extrapolating, which may boost the high-frequency seismic noise and result in severe instability. To alleviate this issue, we develop a stabilized amplitude compensation operator in the frequency domain which is expressed as,
Λ ( ω ) = w d ( ω ) w v ( ω ) w v ( ω ) w v ( ω ) + ε 2 ,
where Λ ( ω ) represents a stabilized amplitude compensation operator, w d ( ω ) and w v ( ω ) are the dispersion-only and viscoacoustic extrapolation wavefields, respectively, ε 2 is the stabilization factor, and the notations · represent the smoothing operator. As shown in Figure 2, both the dispersion-only and viscoacoustic propagation wavefields account for the velocity dispersion effects; therefore, their extrapolation wavefields have the same phase. This means the division of two wavefields eliminates the phase information and generates a stabilized amplitude compensation operator.
Combining a stabilized amplitude compensation operator with a dispersion correction operator, we obtain a stabilized forward-propagating source wavefield,
p c ( ω ) = Λ P ( ω ) p d ( ω ) ,
and a stabilized backward-propagating receiver wavefield,
r ˜ c ( ω ) = Λ R ( ω ) r ˜ d ( ω ) ,
where Λ p ( ω ) and Λ r ( ω ) are the amplitude compensation operators for the source and receiver extrapolation wavefields, respectively. p d ( ω ) and r ˜ d ( ω ) are the dispersion-only forward-propagating source wavefield and the dispersion-only backward-propagating receiver wavefield, respectively. Note that the dispersion correction operator is equal to the dispersion-only propagation wavefield. The physical reason is that in the forward-propagation source wavefield, the higher frequency components travel faster than the lower frequencies. Therefore, in the backward extrapolation, the high frequencies again need to propagate faster than the lower frequencies to arrive simultaneously at the reflectors.
Applying the stabilized source and receiver compensation wavefields to Equation (10), we derive the stabilized Q-compensated image. In the acoustic image (Equation (6)), we only compute the acoustic (forward-propagation and backward-extrapolation) wavefields. Meanwhile, in the Q-compensated image (Equation (10)), we have to calculate the dispersion-only, the viscoacoustic, and the acoustic seismic wavefields. The computational cost is approximately three times that of the acoustic algorithm. To improve the computational efficiency, we modify the Q-compensated imaging condition as,
I c ( x , z ) = ω = 0 ω max j = 1 n s h o t Re ω 2 p j c r ˜ j c ω = 0 ω max j = 1 n s h o t Re p j d ( p j d ) .
Since the dispersion-only wavefield has the same amplitude spectrum as the acoustic wavefield, the autocorrelation of the acoustic wavefield is equal to that of the dispersion-only wavefield. Therefore, the computational cost reduces to approximately two times that of FA-RTM.
The procedure of FQ-RTM can be summarized as (the pseudo-code of the stabilized FQ-RTM can be summarized in Appendix C):
  • Calculating the frequency-domain dispersion-only source wavefield p d ( ω ) and viscoacoustic source wavefield p v ( ω ) with a given source wavelet and then exploiting them to construct a stabilized amplitude compensation operator Λ p ( ω ) using Equation (11). Afterward, designing a stabilized viscoacoustic-compensated source wavefield p c ( ω ) using Equation (12);
  • Treating the attenuated CSGs as the frequency-domain receiver sources and computing the frequency-domain dispersion-only receiver wavefield r ˜ d ( ω ) and viscoacoustic receiver wavefield r ˜ v ( ω ) . Afterward, deriving a stabilized viscoacoustic-compensated receiver wavefield r ˜ c ( ω ) by using both Equations (11) and (13).
  • Applying the imaging condition (Equation (14)) to retrieve the image of the subsurface structure.

3. Results

3.1. The Layered Model Experiments

In the first experiment, a five-layer model shown in Figure 5 is exploited to test our method. The model size is 1100 × 1000 m and the grid spacing is 5 m. There are 21 shots in total which are equidistantly distributed on the surface ( z s = 5 m). The shot interval is 50 m. The receivers are also placed on the surface with an interval of 5 m. The maximum record length is 1.0 s with d t = 0.002 s.
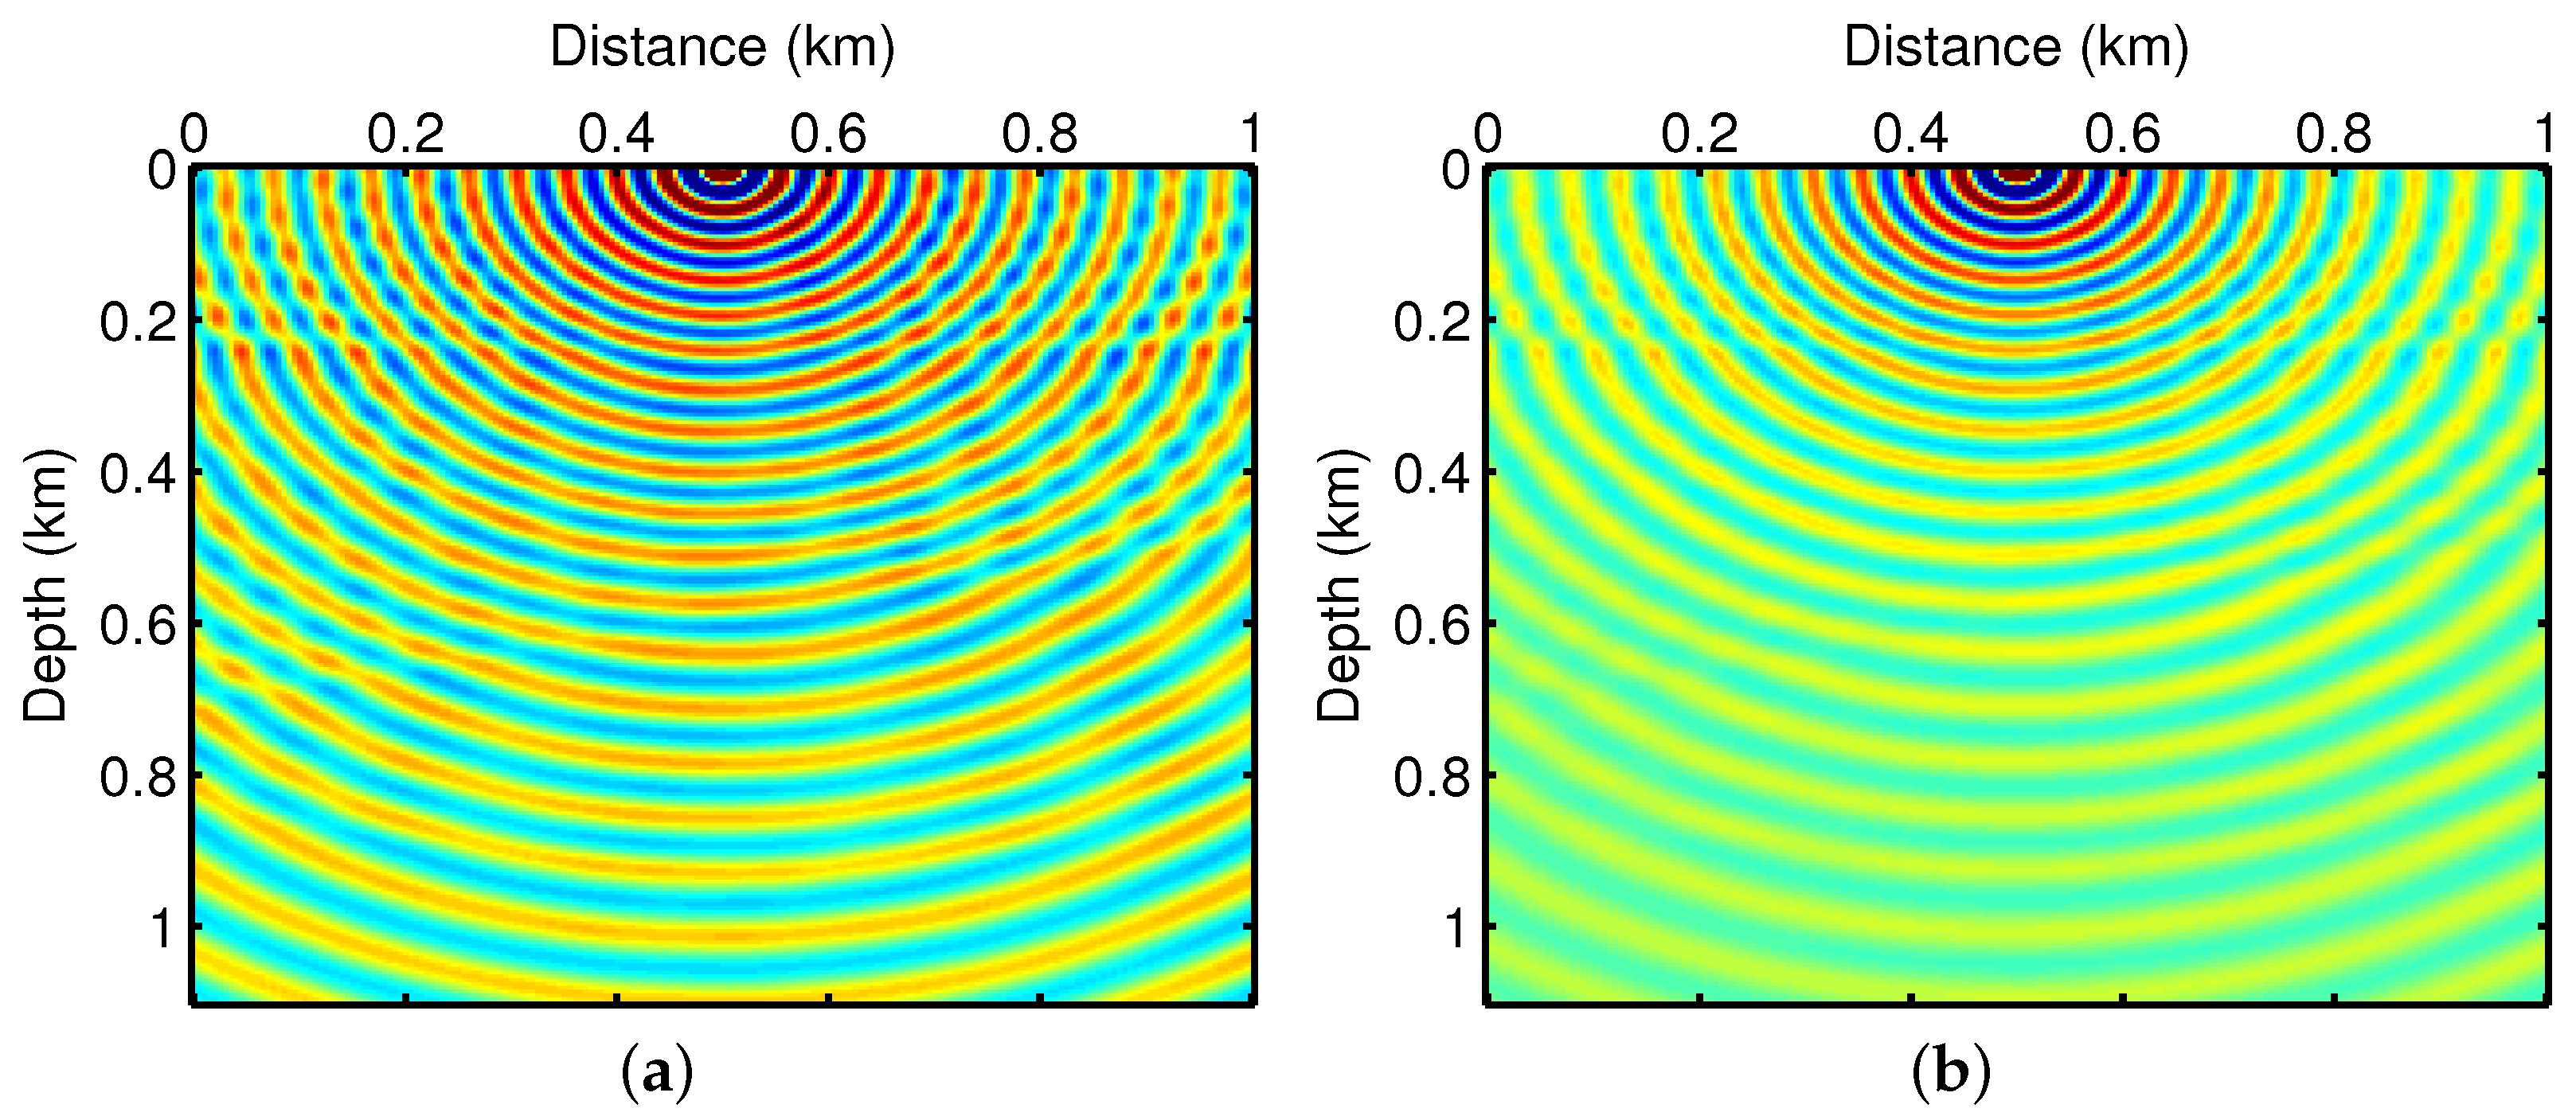
Figure 6 shows the real part of 30 Hz monochromatic acoustic and viscoacoustic wavefields stimulated at the location x s = 500 m. Figure 7 displays the corresponding amplitude part of the frequency-domain wavefields. The comparison between the acoustic and viscoacoustic wavefields illustrates that the energy of the viscoacoustic waves dissipates faster than acoustic waves in the same distance after being radiated from the source. Thus, FA-RTM with viscoacoustic data may encounter some difficulties in migrating the depth structure. Transforming the frequency-domain wavefields into the time domain, we obtain the time-domain snapshots and CSGs shown in Figure 8 and Figure 9, respectively. We can find that the amplitude decay in both the viscoacoustic snapshot and shot gather is evident. For a clearer view, we select three seismic traces from Figure 9 at x = 200 m, 500 m, and 800 m and further display them in Figure 10. From the comparison of these seismic traces, we can see evident attenuation effects in the viscoacoustic traces.
Figure 11a shows the migrated image obtained from the acoustic CSGs (without direct wave) using FA-RTM, which can be treated as a reference image. Figure 11b displays the imaging result with the viscoacoustic CSGs (without direct wave) using FA-RTM. We can see that the image without attenuation compensation (Figure 11b) exhibits evident energy decay and slight phase distortion compared with the reference image (Figure 11a). To compensate for the attenuating effects, we use the proposed FQ-RTM to process the viscoacoustic CSGs and show the Q-compensated image in Figure 11c. The compensated image recovers the seismic energy and exhibits a clear structure. Figure 11d displays the difference profile between the reference image and the Q-compensated image. The small residual energy indicates the high compensation accuracy of the proposed algorithm. Figure 12 compares the migrated seismic traces extracted from Figure 11a–c at x = 300 m, 500 m, and 700 m. From these extracted traces, we can draw two conclusions. First, the viscoacoustic traces (extracted from the non-compensated image) exhibit evident amplitude attenuation and phase distortion. Second, the compensated traces using the proposed method match the acoustic traces well owing to the good compensation performance of FQ-RTM.

3.2. The BP Gas Model Experiments

To further evaluate the performance of the FQ-RTM algorithm, we exploit the BP gas model (Figure 13) for the experiment [33]. The model size is a 201 × 398 grid with the grid spacing d x = d z = 10 m. There is a strong attenuation area (gas cloud with Q = 20 ) in the model (1600 m < x < 2600 m, 700 m < z < 1300 m). There are 41 shots equidistantly placed on the surface with an interval of 50 m. The receivers are also evenly distributed with an interval of 10 m. The maximum record length is 2.5 s with d t = 0.002 s.
Figure 14 shows the CSGs stimulated at x s = 2100 m in both acoustic (Figure 14a) and viscoacoustic media (Figure 14b). Comparing to the acoustic CSG, we can see visible energy attenuation in the viscoacoustic CSG. Figure 14c shows the noisy viscoacoustic CSG with an overall signal-to-noise ratio (SNR) of 2 dB. Figure 15a displays the seismic traces extracted from Figure 14 at the location x = 2100 m. The comparison of these traces demonstrates that the viscosity will induce the amplitude loss and the random noise will cause the high-frequency oscillations. Figure 15b shows the averaged amplitude spectra of the three CSGs, which reveals an evident frequency shift due to Q attenuation effects.
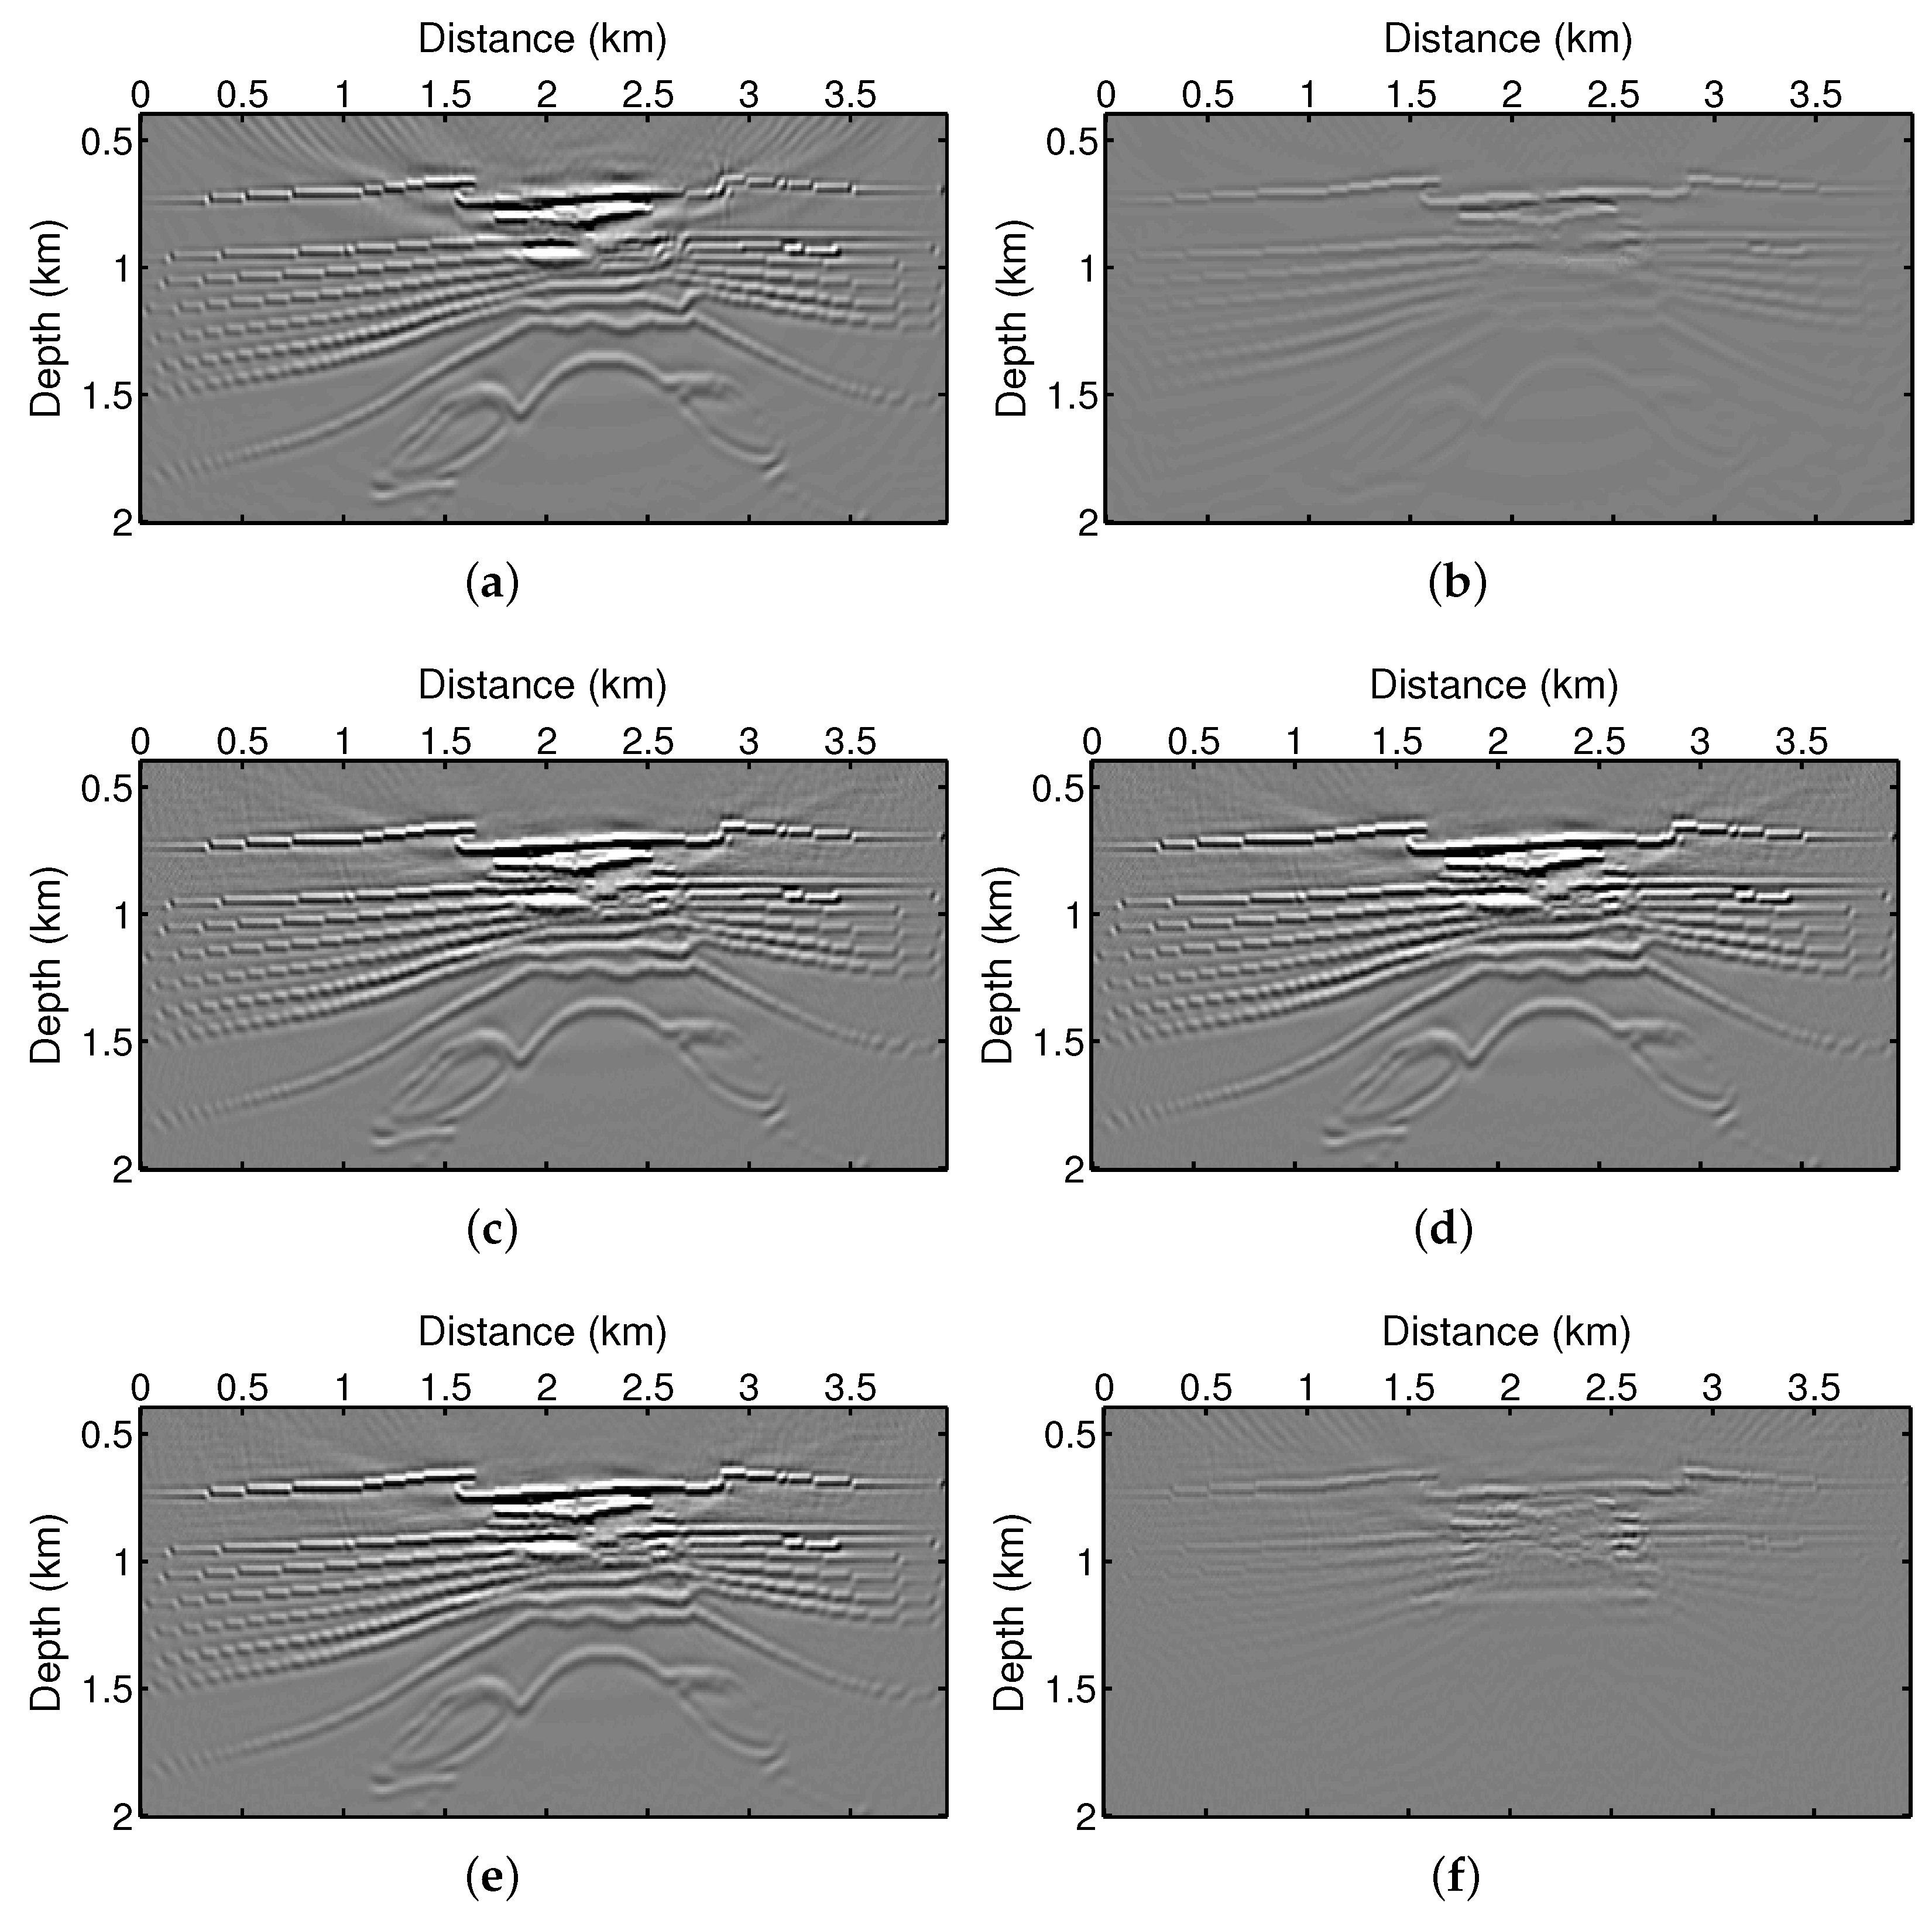
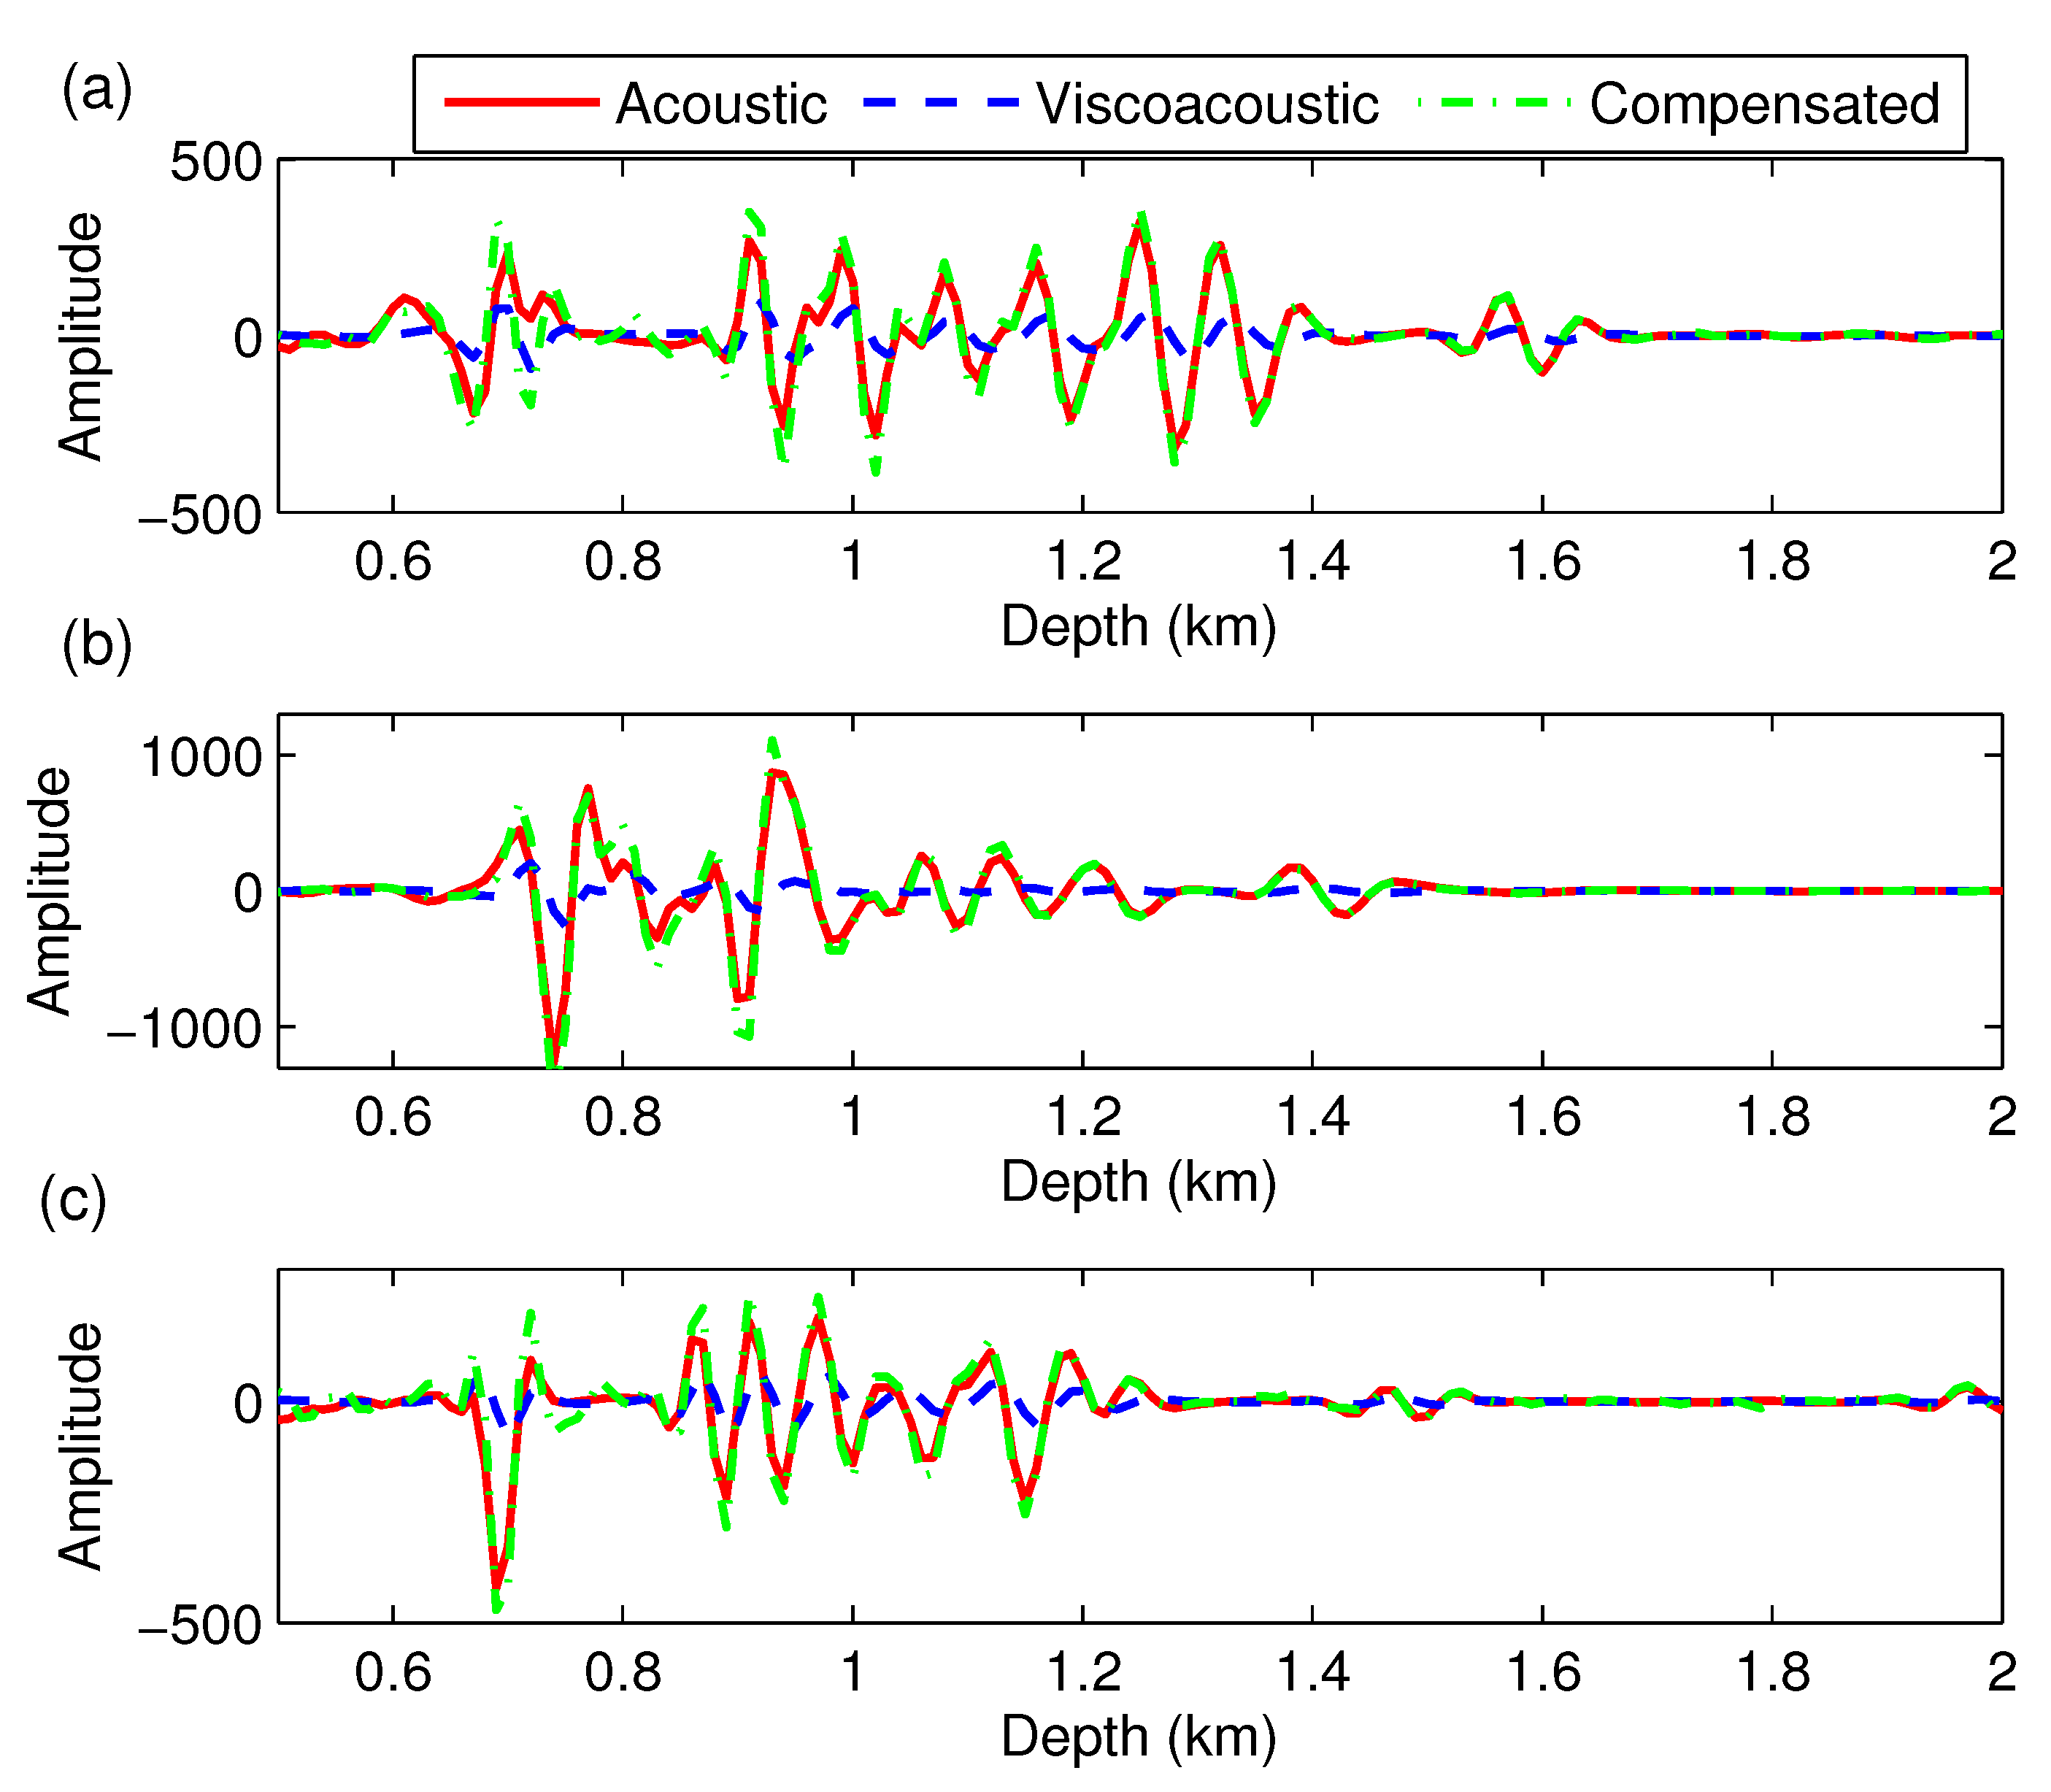
We first use FA-RTM to process the acoustic CSGs (Figure 14a) and show the migrated profile (reference image) in Figure 16a. Considering that the subsurface media are usually viscous and the recorded shot gathers contain Q attenuation effects, then, we implement FA-RTM to migrate the (noise-free) viscoacoustic data (Figure 14b) and display the migrated result in Figure 16b. Compared with the reference profile, the image without compensation (Figure 16b) exhibits a poor resolution below the gas cloud. To compensate for the seismic attenuation, we migrate the (noise-free) viscoacoustic data using the proposed FQ-RTM algorithm. In this test, we try different values σ 2 = 10 9 , 10 6 , and 10 4 and show the output migration results in Figure 16c–e accordingly. We can find that the three images are almost the same, which verifies the robustness of FQ-RTM to σ 2 . We further calculate the differences between the three Q-compensated images and the reference. The residual profiles are displayed in Figure 16f–h. These residual profiles further confirm the effectiveness of the proposed FQ-RTM algorithm. Furthermore, we extract three seismic traces from Figure 16a–c at x = 1100 m, 2100 m, and 3500 m and show them in Figure 17. The good agreement of the Q-compensated traces with the reference traces demonstrates the great compensation performance of the proposed FQ-RTM.
To verify the stability of FQ-RTM, we further implement FQ-RTM using the noisy viscoacoustic CSGs (Figure 14c). Figure 18a–c show the migration profiles with the parameters σ 2 = 10 9 , 10 6 , and 10 4 , respectively. We find that the Q-compensated images with noisy data suffer from numerical instability compared with the noise-free case. When the stabilization parameter σ 2 is small (e.g., σ 2 = 10 9 ), the Q-compensated image is disturbed by some numerical artifacts (Figure 18a). However, the main reflection events are still imaged in the migration profile. When σ 2 increases to 10 6 , the numerical artifacts are partially suppressed (Figure 18b) and the stability of FQ-RTM is enhanced. As σ 2 increases to 10 4 , an acceptable image (with a few artifacts) shown in Figure 18c can be obtained, which demonstrates the good stability of the proposed method.
The processing time of the FA-RTM and FQ-RTM algorithms is directly dependent on many factors (e.g., the model size, the number of frequency components for imaging, the finite-difference scheme for modeling, the type of boundary condition). Among these influencing factors, we focus on investigating the effect of model size on computational efficiency. To make an objective evaluation, other parameters of all experiments are selected the same, including the same number of frequency components (1–100 Hz with an interval of 1 Hz) for imaging, the same finite-difference scheme (optimal nine-point finite-difference) for modeling, the same PML boundary condition with a fixed thickness. For the layered model with a grid size of 241 × 261 (including the PML layers), the processing time of the FA-RTM algorithm is 48 s and the memory cost is 3.1 GB. While in the FQ-RTM algorithm, the processing time increases to 101 s and the memory cost is 4.6 GB. For the BP gas model with a grid size of 241 × 438, the processing time of the FA-RTM algorithm is 103 s and the memory cost is 5.2 GB. In the FQ-RTM algorithm, the processing time increases to 218 s, and the memory cost is 7.5 GB. We find that the processing time of the FQ-RTM scheme is about twice that of the FA-RTM algorithm, which is consistent with the theoretical analysis. In addition, the memory cost increases significantly as the model size increases. Note that the related code used in the tests is not fully optimized (e.g., vectorized or parallelized), which is beyond the scope of the current study. The tests are conducted on the computer with 12th Gen Intel(R) Core(TM) i5-12400 2.50 GHz CPU and 16 GB RAM in a Windows operating system.

3.3. The Field Data Applications

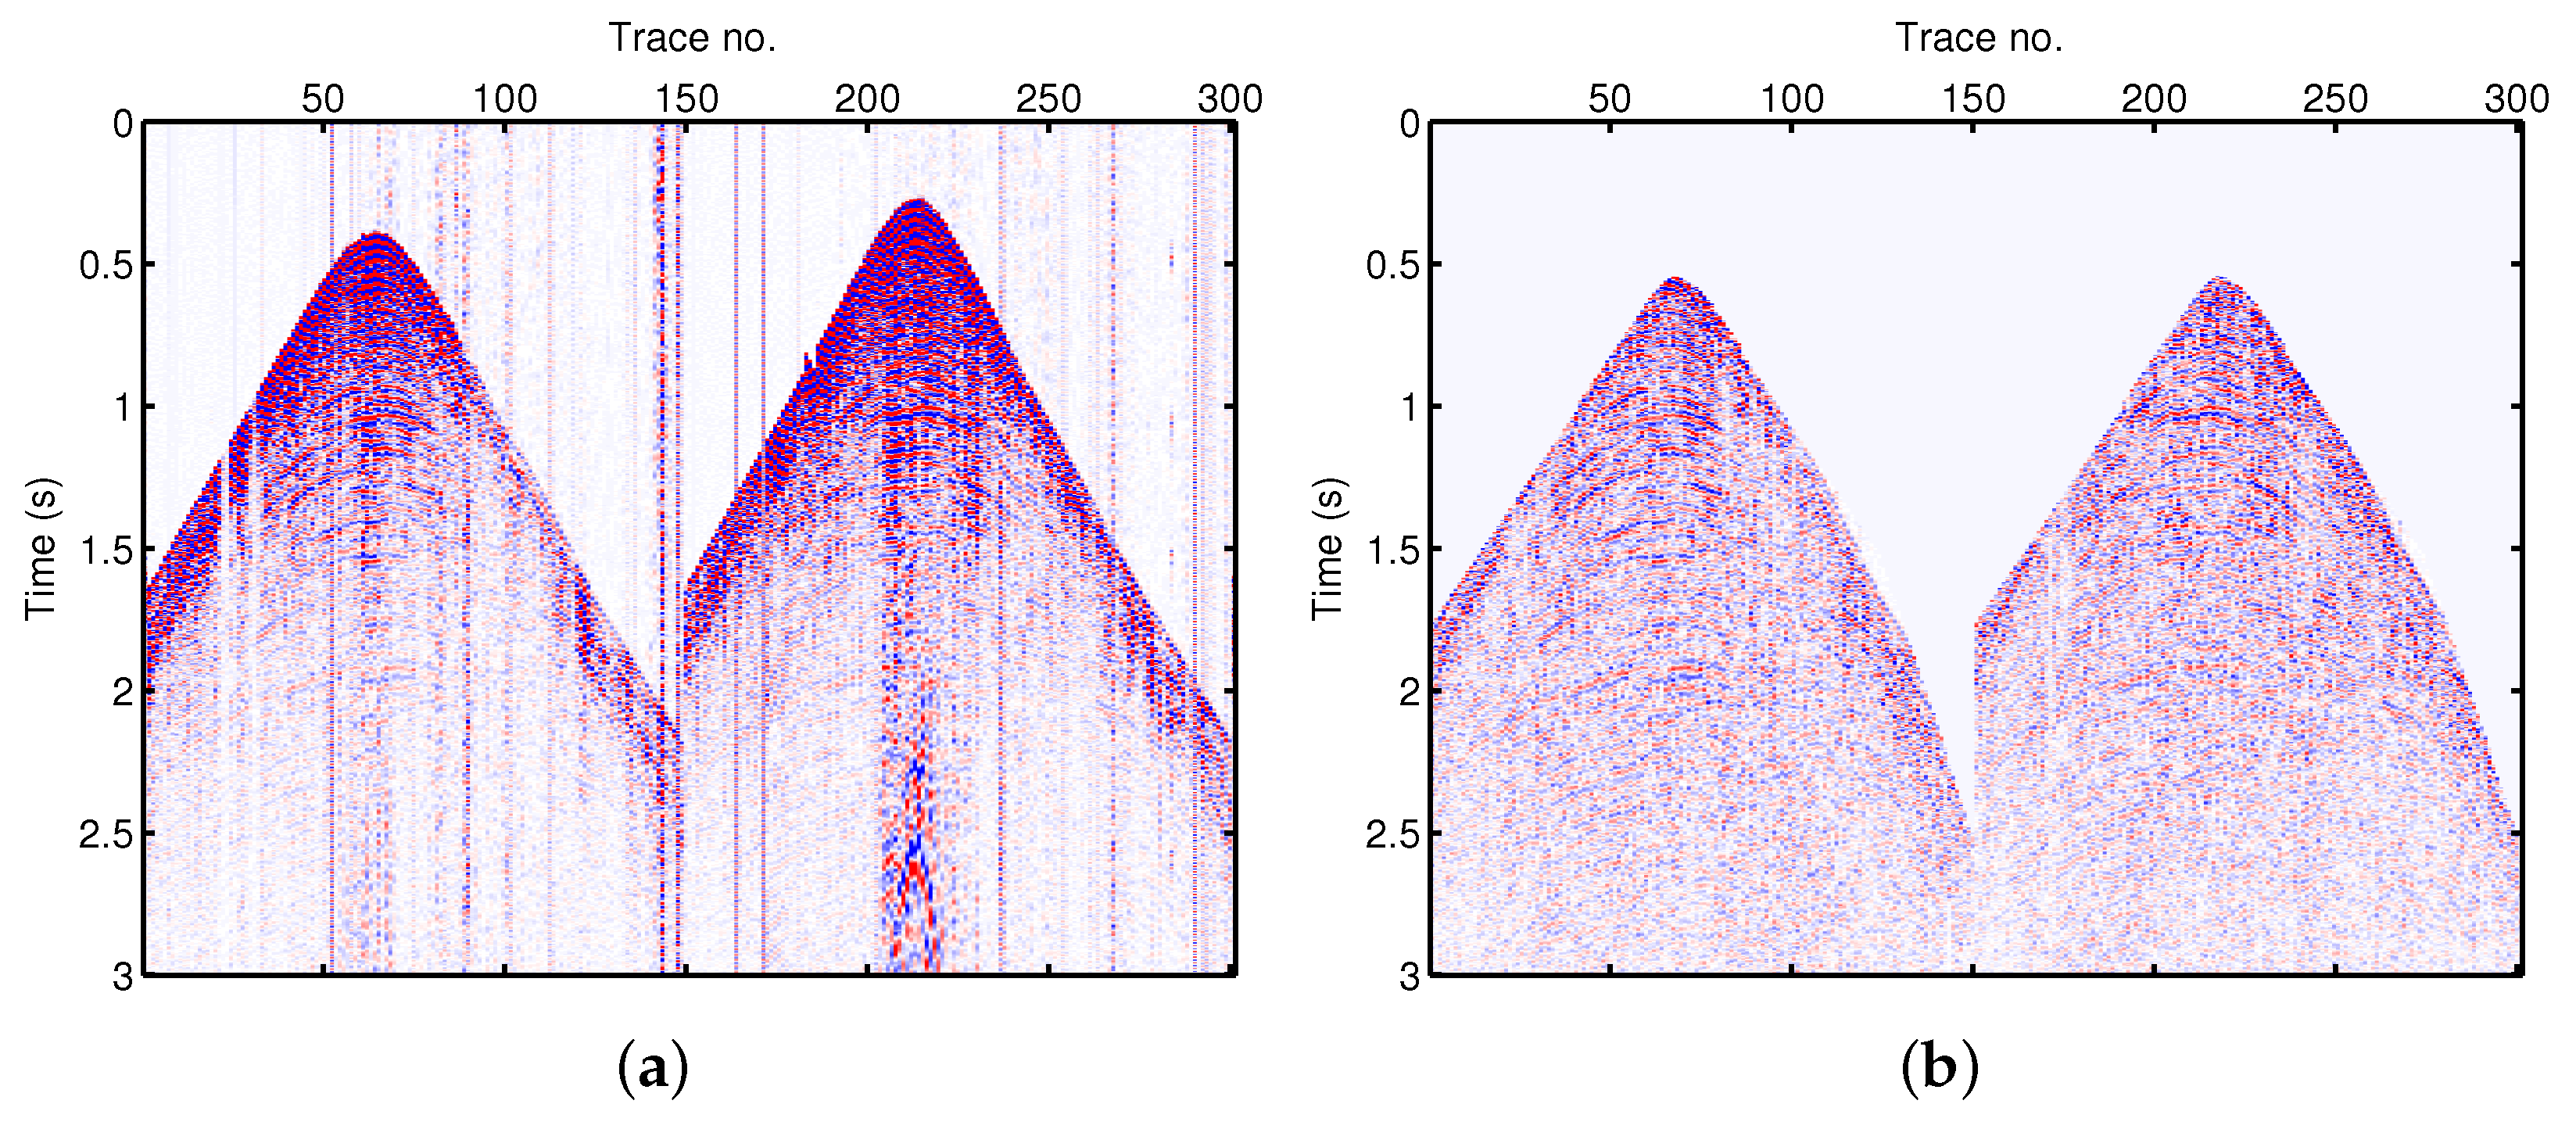
We use the 2D field data to further verify the practicability of the FQ-RTM algorithm. The prestack data include 101 CSGs, and each shot gather contains 151 traces. The recording length is 3 s with the time sampling interval of 0.002 s. Before seismic migration, we carry out some preprocessing, such as direct wave cutting and prestack noise attenuation. Figure 19 shows two shot gathers before and after above processing. Using these prestack shot gathers, we can implement the velocity analysis and obtain the velocity model shown in Figure 20. In addition, we apply Li’s empirical formula [57] for obtaining the Q model.
We use both the FA-RTM algorithm and FQ-RTM method to process the field data and show the corresponding results in Figure 21. Compared with the FA-RTM imaging result, the FQ-RTM image recovers the deep amplitude and improves the seismic resolution. Figure 22 shows the magnified view of the black boxes in Figure 21, which further indicates the improvement in the image quality and resolution, especially the seismic image in the black arrows.

4. Discussion

Seismic migration is a very important technology in seismic data processing and it has been widely used in the petroleum and mining exploration. Compared with the traditional OWEM, RTM has superior performance in imaging the complex geological structures [32]. Considering that the subsurface media are viscoelastic, compensating for seismic attenuation in the RTM algorithm is necessary and useful for the imaging of the subsurface structures. In this paper, we develop a novel Q-RTM algorithm in the frequency domain and verify its effectiveness and stability using two synthetic data experiments. In the field data applications, we need to consider many issues (e.g., the accuracy of input velocity and Q model, the estimated seismic wavelet, and the noise suppression), which will seriously affect the imaging results.
In the onshore case, the signal-to-noise ratio of prestack seismic data is usually very low. Thus, the noise suppression processing is very important but difficult. If the seismic noises are suppressed too much, some effective signals may also be filtered, which will influence the imaging of some weak reflections. On the contrary, if the seismic noise suppression is too weak, the instability of absorption compensation will be troublesome. However, considering that the proposed algorithm has a certain stability and anti-noise property, the noise suppression and instability problems can be solved to some extent by careful handling. In addition, the estimation of seismic wavelet is also an ongoing research topic in seismic processing. The accuracy of the estimated seismic wavelet affects the imaging accuracy of the geological structures because the inaccurate wavelet will cause the disaccord between the field data and the modeling data. The improvement of wavelet estimation accuracy is a direction of our follow-up research. In the synthetic data examples, we use the true models (velocity and Q) for migration. In fact, it is almost impossible for us to obtain the true models of subsurface in practical application; thus, we usually use the smoothed version for migration in field data processing at the expense of slight degradation of imaging accuracy [39].
For marine seismic data application, high-precision velocity and Q value modeling is also a problem to be further studied. Compared with velocity modeling, Q value modeling is more difficult and challenging, especially for reflection seismic data. Therefore, we should pay enough attention to it, and it is an important direction of my future research. In addition, Gasperini and Stanghellini [58] develop a useful interactive computer program for the processing and interpretation of high-resolution seismic reflection profiles. This program can used to estimate the source wavelet from marine seismic data. Although the estimation accuracy could be further improved, its effectiveness and feasibility have been proved using field data acquired in the Saros Gulf [59]. Compared with the onshore seismic data, the offshore seismic data are often contaminated by strong multiples (e.g., water column reverberation, seabed multiples, interlayer multiples), which will degrade the quality of recorded data and produce notches in amplitude spectra. The mixing of primaries and multiples increases the difficulty of seismic migration. Thus, the separation of primaries and multiples before migration is required. In recent years, some researchers suggest to use both primaries and multiples for migration to improve the image quality. This strategy is correct in theory, but it is difficult to apply in field data. In general, the proposed method can be applied to field data, but it requires many preprocessing operations. The imaging accuracy has a certain relationship with the preprocessing results.
In this paper, we propose a stabilized FQ-RTM which has many attractions compared with the time-domain methods. Firstly, for the Kolsky–Futterman model, its attenuation effects (dispersion-only effects, dissipation-only effects and viscoacoustic effects) can be easily taken into account in the frequency domain, and its frequency-domain viscoacoustic equation is straightforward to obtain, whereas its corresponding viscoacoustic equation in the time domain has not yet been deduced. This means that we cannot implement Kolsky–Futterman-model-based forward modeling and RTM in the time domain, while we can study them in the frequency domain. Although some absorption models, e.g., the Kjartansson model, have a time-domain viscoacoustic equation, the derived viscoacoustic wave equation is unusually a time-fractional or space-fractional equation, which requires more complicated numerical modeling than conventional wave equations [60].
Secondly, solving the viscoacoustic equation in the frequency domain is straightforward and is appropriate for multishot surveys by using a direct solver (e.g., LU decomposition). For the time-domain Q-RTM, the computational time for multishot imaging is approximately proportional to the number of shots, while in the frequency domain, its computational time is nearly independent of the number of shots (the extra calculations brought by multiple shots is mainly from the elimination and back-substitution steps of the LU solution, and these parts of calculation are more efficient than LU decomposition).
Thirdly, for the time-domain Q-RTM, we traditionally restore the full forward-propagation source wavefields in the disk, since the source wavefields are propagating from 0 to maximum record time, while the receiver wavefields are back-propagating from the maximum record time to 0 and the imaging of the maximum record time requires the calculated and restored source wavefield at the maximum record time [61]. It is time-consuming to constantly read the source wavefields at each record time from the disk. Although some researchers propose the wavefield reconstruction methods [62] and the checkpointing strategy [63] to mitigate the memory requirement for restoring the full wavefields, the computational cost increases as the memory requirement decreases. Different from the time-domain algorithm, we do not need to restore the forward-propagation source wavefields in frequency-domain Q-RTM because the calculation of each frequency wavefield (both source and receiver wavefields) is independent of other frequencies, and the image of each frequency component is straightforward. Thus, the time-consuming process of reading data from a disk is removed in the frequency-domain algorithm.
Fourthly, because of the redundancy exists in seismic data with respect to frequency, only a subset of frequencies needs to be considered in the migration process [64], while in the time domain, we have to image the subsurface structure from the maximum record time to 0 with no skip. Last but not least, we can use coarser grids for modeling the lower-frequency wavefields and finer grids for the higher frequencies. This variable grid spacing strategy can help us improve the computational efficiency [53].
The main disadvantage of our approach is that the direct solver (LU decomposition) requires huge memory in the decomposition process, especially for a 3D case. Considering a simple 3D cube with a size of 100 × 100 × 100 , the size of the impedance matrix S is 10 6 × 10 6 . In this case, LU decomposition is time consuming and memory-intensive. In the 3D field data application, the decomposition and memory cost are unaffordable for production.

5. Conclusions

We have exploited the Kolsky–Futterman model to derive the viscoacoustic wave equation in the frequency domain. In this equation, the amplitude dissipation and velocity dispersion are naturally decoupled, which helps us to construct a stabilized amplitude compensation operator. Combining the stabilized amplitude compensation operator with the dispersion correction operator, we obtain a stabilized attenuation compensation operator. Using the stabilized attenuation compensation operators, we have formulated the stabilized compensation wavefields in both source forward-propagation and receiver backward-propagation. Then, we apply a modified imaging condition to retrieve the image of the subsurface structure. We further use Laplacian filtering to suppress the undesirable imaging artifacts in the migrated image. The numerical experiments and the field data examples demonstrate the accuracy and effectiveness of the proposed FQ-RTM algorithm.

Author Contributions

Conceptualization, X.M.: methodology, software and writing—original draft preparation. H.L.: formal analysis, writing—review and editing. Z.G.: validation, supervision and project administration. X.P.: data curation and investigation. G.L.: resources and funding acquisition. All authors have read and agreed to the published version of the manuscript.

Funding

This research was funded by the National Natural Science Foundation of China (42074141), the Fundamental Research Project of CNPC Geophysical Key Lab (2022DQ0604-3) and CNPC“14th five-year plan” forward-looking foundation of major scientific and technological projects (2021DJ3704).

Institutional Review Board Statement

Not applicable.

Informed Consent Statement

Not applicable.

Data Availability Statement

The data used in this study are available by contacting the corresponding author.

Conflicts of Interest

The authors declare no conflict of interest. The funders had no role in the design of the study; in the collection, analyses, or interpretation of data; in the writing of the manuscript; or in the decision to publish the results.

Appendix A. The Derivation of Equation (5)

In Equation (4), the calculation of the partial derivative wavefield, p j ( ω ) m k , is very cumbersome, so we do not directly use it for imaging. Instead, we first take the partial derivative for Equation (3) [65],
S p m k + S m k p = 0 ,
and then we have
p m k = S 1 g k ,
where g k = S m k p . The term, S m k , serves as an amplitude filtering to the source wavefield p . Ref. [66] takes the velocity as the model parameter; in the paper, we choose the square of slowness as the model parameter. Then, the virtual source vector reduces to
g k = ( 2 + ω 2 v 2 ) ( 1 v k 2 ) p   = ω 2 0 0 0 0 0 0 0 1 0 0 0 0 0 0 0 0 P ( 1 , ω ) P ( k , ω ) P ( n x × n z , ω ) = 0 ω 2 P ( k , ω ) 0 .
Substituting Equations (A2) and (A3) into Equation (4), we have
I k = ω = 0 ω max j = 1 n s h o t Re ( g k ) j T S 1 T r j ( ω ) .
When considering all of the model parameters, the vector g k can be replaced by the matrix G = [ g 1 , g 2 , , g ( n x × n z ) ] , and the image for all model parameters is,
I ( x , z ) = ω = 0 ω max j = 1 n s h o t Re G j T r ˜ j ,
where G is a diagonal matrix with the element G k , k = ω 2 p j , and r ˜ j = S 1 T r j ( ω ) .

Appendix B. The Pseudo-Code of FA-RTM Algorithm

Algorithm A1 Acoustic RTM in the frequency domain
Input: CSGs r ( t , x , n ) , source wavelet w ( t ) , velocity model v ( x , z ) .
Output: The image I ( x , z ) .
1: Preprocessing: w ^ ( ω ) F o u r i e r t r a n s f o r m w ( t ) ;
2:         r c u t ( t , x , n ) c u t o f f t h e d i r e c t w a v e r ( t , x , n ) ;
3:         r ^ c u t ( ω , x , n ) F o u r i e r t r a n s f o r m r c u t ( t , x , n ) ;
4:         r ^ c u t ( ω , x , n ) c o n j u g a t e r ^ c u t ( ω , x , n ) ;
5: for: i = 1 · · · ω m a x
6:  S ( ω i ) i m p e d a n c e m a t r i x v ( x , z ) , P M L ;
7:  L , U L U d e c o m p o s i t i o n S ( ω i ) ;
8: for: j = 1 · · · n s h o t s
9:   p j ( ω i ) s o u r c e w a v e f i e l d L , U , w ^ ( ω i ) ;
10:   r ˜ j ( ω i ) r e c e i v e r w a v e f i e l d L , U , r ^ c u t ( ω i , x j , j ) ;
11:   I ( x , z ) i m a g e p j ( ω i ) , r ˜ j ( ω i ) ;
12:   S I ( x , z ) s o u r c e i l l u m i n a t i o n p j ( ω i ) , p j ( ω i ) ;
13: end
14: end
15: I ( x , z ) n o r m l i z e d i m a g e I ( x , z ) , S I ( x , z ) ;
16: I ( x , z ) L a p l a c i a n f i l t e r i n g I ( x , z ) .

Appendix C. The Pseudo-Code of the Stabilized FQ-RTM Algorithm

Algorithm A2 Stabilized Q-compensated RTM in the frequency domain
Input: CSGs r ( t , x , n ) , source wavelet w ( t ) , velocity model v ( x , z ) , Q model Q ( x , z ) .
Output: The image I ( x , z ) .
1: Preprocessing: w ^ ( ω ) F o u r i e r t r a n s f o r m w ( t ) ;
2:          r c u t ( t , x , n ) c u t o f f t h e d i r e c t w a v e r ( t , x , n ) ;
3:         r ^ c u t ( ω , x , n ) F o u r i e r t r a n s f o r m r c u t ( t , x , n ) ;
4:        r ^ c u t ( ω , x , n ) c o n j u g a t e r ^ c u t ( ω , x , n ) ;
5: for: i = 1 · · · ω m a x
6:  v v ( ω i ) v i s c o a c o u s t i c v e l o c i t y v ( x , z ) ;
7:  S v ( ω i ) i m p e d a n c e m a t r i x v v ( ω i ) , Q ( x , z , ) , P M L ;
8:  L v , U v L U d e c o m p o s i t i o n S v ( ω i ) ;
9:  v d ( ω i ) d i s p e r s i o n o n l y v e l o c i t y v ( x , z ) ;
10:  S d ( ω i ) i m p e d a n c e m a t r i x v d ( ω i ) , Q ( x , z ) , P M L ;
11:  L d , U d L U d e c o m p o s i t i o n S d ( ω i ) ;
12:  for: j = 1 · · · n s h o t s
13:   p j v ( ω i ) v i s c o a c o u s t i c s o u r c e w a v e f i e l d L v , U v , w ^ ( ω i ) ;
14:   p j d ( ω i ) d i s p e r s i o n o n l y s o u r c e w a v e f i e l d L d , U d , w ^ ( ω i ) ;
15:   Λ j ( ω i ) s t a b i l i z e d a m p l i t u d e c o m p e n s a t i o n o p e r a t o r p j v ( ω i ) , p j d ( ω i ) ;
16:   p j c ( ω i ) s o u r c e c o m p e n s a t i o n w a v e f i e l d Λ j ( ω i ) , p j d ( ω i ) ;
17:   r ˜ j v ( ω i ) v i s c o a c o u s t i c r e c e i v e r w a v e f i e l d L v , U v , r ^ c u t ( ω i , x j , j ) ;
18:   r ˜ j d ( ω i ) d i s p e r s i o n o n l y r e c e i v e r w a v e f i e l d L d , U d , r ^ c u t ( ω i , x j , j ) ;
19:   Λ j ( ω i ) s t a b i l i z e d a m p l i t u d e c o m p e n s a t i o n o p e r a t o r r ˜ j v ( ω i ) , r ˜ j d ( ω i ) ;
20:   r ˜ j c ( ω i ) r e c e i v e r c o m p e n s a t i o n w a v e f i e l d Λ j ( ω i ) , r ˜ j d ( ω i ) ;
21:   I ( x , z ) i m a g e p j c ( ω i ) , r ˜ j c ( ω i ) ;
22:   S I ( x , z ) s o u r c e i l l u m i n a t i o n p j d ( ω i ) , [ p j d ( ω i ) ] ;
23: end
24: end
25: I ( x , z ) n o r m l i z e d i m a g e I ( x , z ) , S I ( x , z ) ;
26: I ( x , z ) L a p l a c i a n f i l t e r i n g I ( x , z ) .

References

  1. Kolsky, H. LXXI. The propagation of stress pulses in viscoelastic solids. Philos. Mag. 1956, 1, 693–710. [Google Scholar] [CrossRef]
  2. Futterman, W.I. Dispersive body waves. J. Geophys. Res. 1962, 67, 5279–5291. [Google Scholar] [CrossRef]
  3. Kjartansson, E. Constant Q-wave propagation and attenuation. J. Geophys. Res. 1979, 84, 4737–4748. [Google Scholar] [CrossRef] [Green Version]
  4. Mangriotis, M.D.; Rector, J.W.I.; Herkenhoff, E.F.; Neu, J.C. Scattering versus intrinsic attenuation in the vadose zone: A VSP experiment. Geophysics 2013, 78, B49–B63. [Google Scholar] [CrossRef]
  5. Wang, B. Inversion based data-adaptive attenuation compensation method. J. Seism. Explor. 2014, 23, 341–356. [Google Scholar]
  6. Li, G.; Sacchi, M.D.; Zheng, H. In situ evidence for frequency dependence of near-surface Q. Geophys. J. Int. 2016, 204, 1308–1315. [Google Scholar] [CrossRef]
  7. Bickel, S.H.; Natarajan, R.R. Plane-wave Q deconvolution. Geophysics 1985, 50, 1426–1439. [Google Scholar] [CrossRef]
  8. Wang, Y. A stable and efficient approach of inverse Q filtering. Geophysics 2002, 67, 657–663. [Google Scholar] [CrossRef] [Green Version]
  9. Wang, Y. Inverse Q-filter for seismic resolution enhancement. Geophysics 2006, 71, V51–V60. [Google Scholar] [CrossRef] [Green Version]
  10. Margrave, G.F.; Lamoureux, M.P.; Henley, D.C. Gabor deconvolution: Estimating reflectivity by nonstationary deconvolution of seismic data. Geophysics 2011, 76, W15–W30. [Google Scholar] [CrossRef]
  11. Wang, S.; Chen, X. Absorption-compensation method by L1-norm regularization. Geophysics 2014, 79, V107–V114. [Google Scholar] [CrossRef]
  12. Li, G.; Yang, L.; Hao, Z.; Wei, H. Absorption decomposition and compensation via a two-step scheme. Geophysics 2015, 80, V145–V155. [Google Scholar] [CrossRef]
  13. Wang, B.; Chen, X.; Li, J.; Chen, Z.; Liu, G. A Stable and Efficient Attenuation Compensation Method based on Inversion. Chin. J. Geophys. 2015, 58, 375–386. [Google Scholar] [CrossRef]
  14. Wang, B. An Amplitude Preserving S-Transform for Seismic Data Attenuation Compensation. IEEE Signal Process. Lett. 2016, 23, 1155–1159. [Google Scholar] [CrossRef]
  15. Wang, B.; Lu, W. An Efficient Amplitude-Preserving Generalized S Transform and Its Application in Seismic Data Attenuation Compensation. IEEE Trans. Geosci. Remote Sens. 2018, 56, 859–866. [Google Scholar] [CrossRef]
  16. Wang, Y.; Ma, X.; Zhou, H.; Chen, Y. L1-2 minimization for exact and stable seismic attenuation compensation. Geophys. J. Int. 2018, 213, 1629–1646. [Google Scholar] [CrossRef]
  17. Ma, X.; Li, G.; Li, H.; Yang, W. Multichannel absorption compensation with a data-driven structural regularization. Geophysics 2020, 85, V71–V80. [Google Scholar] [CrossRef]
  18. Ma, X.; Li, G.; He, S.; Li, H.; Wang, Z. Spatially constrained attenuation compensation in the mixed domain. Geophys. Prospect. 2020, 68, 1819–1833. [Google Scholar] [CrossRef]
  19. Ma, X.; Li, G.; Li, H.; Li, J.; Fan, X. Stable absorption compensation with lateral constraint. Acta Geophys. 2020, 68, 1039–1048. [Google Scholar] [CrossRef]
  20. Wang, B.; Li, J.; Wang, P.; Si, W.; Wang, Z. Visco-acoustic full waveform inversion using decoupled fractional Laplacian constant-Q wave equation and optimal transport-based misfit function. Explor. Geophys. 2022, 53, 140–150. [Google Scholar] [CrossRef]
  21. Ma, X.; Huo, L.; Li, G.; Li, H.; Meng, Q. Inversion-based attenuation compensation with dip constraint. Pet. Sci. 2022, 19, 543–553. [Google Scholar] [CrossRef]
  22. Zhang, Y.; Zhang, P.; Zhang, H. Compensating for visco-acoustic effects in reverse-time migration. In SEG Technical Program Expanded Abstracts 2010, Proceedings of the 80th Annual Interational Meeting, Denver, CO, USA, 17–22 October 2010; Society of Exploration Geophysicists: Houston, TX, USA, 2010; pp. 3160–3164. [Google Scholar] [CrossRef]
  23. Dai, N.; West, G.F. Inverse Q migration. In SEG Technical Program Expanded Abstracts 1994, Proceedings of the 64th Annual Interational Meeting, Los Angeles, CA, USA, 11 June–6 July 1994; Society of Exploration Geophysicists: Houston, TX, USA, 1994; pp. 1418–1421. [Google Scholar] [CrossRef]
  24. Wang, Y.; Guo, J. Seismic migration with inverse Q filtering. Geophys. Res. Lett. 2004, 31, 608–611. [Google Scholar] [CrossRef]
  25. Mittet, R. A simple design procedure for depth extrapolation operators that compensate for absorption and dispersion. Geophysics 2007, 72, S105–S112. [Google Scholar] [CrossRef]
  26. Bai, M.; Chen, X.; Wu, J.; Liu, G.; Chen, Y.; Chen, H.; Li, Q. Q-compensated migration by Gaussian beam summation method. J. Geophys. Eng. 2016, 13, 35–48. [Google Scholar] [CrossRef]
  27. Zhang, J.; Wu, J.; Li, X. Compensation for absorption and dispersion in prestack migration:An effective Q approach. Geophysics 2013, 78, S1–S14. [Google Scholar] [CrossRef]
  28. Causse, E.; Ursin, B. Viscoacoustic reverse-time migration. J. Seism. Explor. 2000, 9, 165–184. [Google Scholar]
  29. Deng, F.; McMechan, G.A. True-amplitude prestack depth migration. Geophysics 2007, 72, S155–S166. [Google Scholar] [CrossRef]
  30. Sun, J.; Fomel, S.; Zhu, T.; Hu, J. Q-compensated least-squares reverse time migration using low-rank one-step wave extrapolation. Geophysics 2016, 81, S271–S279. [Google Scholar] [CrossRef]
  31. Yang, J.; Zhu, H. Viscoacoustic reverse time migration using a time-domain complex-valued wave equation. Geophysics 2018, 83, S505–S519. [Google Scholar] [CrossRef]
  32. Wang, Y.; Zhou, H.; Zhao, X.; Zhang, Q.; Chen, Y. Q-compensated viscoelastic reverse time migration using mode-dependent adaptive stabilization scheme. Geophysics 2019, 84, S301–S315. [Google Scholar] [CrossRef]
  33. Zhu, T.; Harris, J.M.; Biondi, B. Q-compensated reverse-time migration. Geophysics 2014, 79, S77–S87. [Google Scholar] [CrossRef] [Green Version]
  34. Guo, P.; McMechan, G.A.; Guan, H. Comparison of two viscoacoustic propagators for Q-compensated reverse time migration. Geophysics 2016, 81, S281–S297. [Google Scholar] [CrossRef]
  35. Wang, Y.; Zhou, H.; Chen, H.; Chen, Y. Adaptive stabilization for Q-compensated reverse time migration. Geophysics 2018, 83, S15–S32. [Google Scholar] [CrossRef]
  36. Suh, S.; Yoon, K.; Cai, J.; Wang, B. Compensating visco-acoustic effects in anisotropic reverse-time migration. In SEG Technical Program Expanded Abstracts 2012, Proceedings of the 82nd Annual International Meeting, Las Vegas, NV, USA, 4–9 November 2012; Society of Exploration Geophysicists: Houston, TX, USA, 2012; pp. 557–567. [Google Scholar] [CrossRef]
  37. Fletcher, R.P.; Nichols, D.; Cavalca, M. Wavepath-consistent Effective Q Estimation for Q-compensated Reverse-time Migration. In Proceedings of the 74th EAGE Conference and Exhibition Incorporating EUROPEC 2012, Copenhagen, Denmark, 4–7 June 2012; p. A20. [Google Scholar] [CrossRef] [Green Version]
  38. Sun, J.; Zhu, T. Strategies for stable attenuation compensation in reverse-time migration. Geophys. Prospect. 2018, 66, 498–511. [Google Scholar] [CrossRef]
  39. Zhao, X.; Zhou, H.; Wang, Y.; Chen, H.; Zhou, Z.; Sun, P.; Zhang, J. A stable approach for Q-compensated viscoelastic reverse time migration using excitation amplitude imaging condition. Geophysics 2018, 83, S459–S476. [Google Scholar] [CrossRef]
  40. Chen, H.; Zhou, H.; Rao, Y. An implicit stabilization strategy for Q-compensated reverse time migration. Geophysics 2020, 85, S169–S183. [Google Scholar] [CrossRef]
  41. Dutta, G.; Schuster, G.T. Attenuation compensation for least-squares reverse time migration using the viscoacoustic-wave equation. Geophysics 2014, 79, S251–S262. [Google Scholar] [CrossRef] [Green Version]
  42. Guo, P.; McMechan, G.A. Compensating Q effects in viscoelastic media by adjoint-based least-squares reverse time migration. Geophysics 2018, 83, S151–S172. [Google Scholar] [CrossRef]
  43. Gao, B.; Li, G. Frequency-space domain viscoacoustic RTM using stable compensation operator. In SEG Technical Program Expanded Abstracts 2019, Proceedings of the 89th Annual Meeting 2019, San Antonio, TX, USA, 15–20 September 2019; Society of Exploration Geophysicists: Houston, TX, USA, 2019; pp. 4370–4374. [Google Scholar] [CrossRef]
  44. Liao, Q.; Mcmechan, G.A. Multifrequency viscoacoustic modeling and inversion. Geophysics 1996, 61, 1371–1378. [Google Scholar] [CrossRef]
  45. Stekl, I.; Pratt, R.G. Accurate viscoelastic modeling by frequency-domain finite differences using rotated operators. Geophysics 1998, 63, 1779–1794. [Google Scholar] [CrossRef]
  46. Marfurt, K. Accuracy of finite-difference and finite-element modelling of the scalar and elastic wave equation. Geophysics 1984, 49, 533–549. [Google Scholar] [CrossRef]
  47. Takekawa, J.; Mikada, H. A mesh-free finite-difference method for elastic wave propagation in the frequency-domain. Comput. Geosci. 2018, 118, 65–78. [Google Scholar] [CrossRef]
  48. Kim, Y.; Min, D.J.; Shin, C. Frequency-domain reverse-time migration with source estimation. Geophysics 2011, 76, S41–S49. [Google Scholar] [CrossRef]
  49. Luo, J.; Wang, B.; Wu, R.S.; Gao, J. Elastic Full Waveform Inversion With Angle Decomposition and Wavefield Decoupling. IEEE Trans. Geosci. Remote Sens. 2021, 59, 871–883. [Google Scholar] [CrossRef]
  50. Shin, C.; Sohn, H. A frequency-space 2-D scalar wave extrapolator using extended 25-point finite-difference operator. Geophysics 1998, 63, 289–296. [Google Scholar] [CrossRef] [Green Version]
  51. Min, D.J.; Shin, C.; Kwon, B.D.; Chung, S. Improved frequency-domain elastic wave modeling using weighted-averaging difference operators. Geophysics 2000, 65, 884–895. [Google Scholar] [CrossRef]
  52. Jo, C.H.; Shin, C.; Suh, J.H. An optimal 9-point, finite-differnce, frequency-space, 2-D scalar wave extrapolator. Geophysics 1996, 61, 529–537. [Google Scholar] [CrossRef]
  53. Hustedt, B.; Operto, S.; Virieux, J. Mixed-grid and staggered-grid finite-difference methods for frequency-domain acoustic wave modeling. Geophys. J. Int. 2004, 157, 1269–1296. [Google Scholar] [CrossRef] [Green Version]
  54. Pratt, R.G. Frequency-domain elastic wave modeling by finite differences: A tool for crosshole seismic imaging. Geophysics 1990, 55, 626–632. [Google Scholar] [CrossRef]
  55. Schleicher, J.; Costa, J.; Novais, A. A comparison of imaging conditions for wave-equation shot-profile migration. Geophysics 2008, 73, S219–S227. [Google Scholar] [CrossRef] [Green Version]
  56. Chattopadhyay, S.; McMechan, G.A. Imaging conditions for prestack reverse-time migration. Geophysics 2008, 73, S81–S89. [Google Scholar] [CrossRef]
  57. Li, Q. High Resolution Seismic Data Processing; Petroleum Industry Press: Beijing, China, 1993. [Google Scholar]
  58. Gasperini, L.; Stanghellini, G. SeisPrho: An interactive computer program for processing and interpretation of high-resolution seismic reflection profiles. Comput. Geosci. 2009, 35, 1497–1507. [Google Scholar] [CrossRef]
  59. Gasperini, L.; Ligi, M.; Stanghellini, G. Pseudo-3D techniques for analysis and interpretation of high-resolution marine seismic reflection data. Bull. Geophys. Oceanogr. 2021, 62, 599–614. [Google Scholar] [CrossRef]
  60. Chen, H.; Zhou, H.; Rao, Y.; Sun, P.; Zhang, J.; Chen, Y. A matrix-transform numerical solver for fractional Laplacian viscoacoustic wave equation. Geophysics 2019, 84, T283–T297. [Google Scholar] [CrossRef]
  61. Sun, W.; Fu, L.Y. Two effective approaches to reduce data storage in reverse time migration. Comput. Geosci. 2013, 56, 69–75. [Google Scholar] [CrossRef]
  62. Tan, S.; Huang, L. Reducing the computer memory requirement for 3D reverse-time migration with a boundary-wavefield extrapolation method. Geophysics 2014, 79, S185–S194. [Google Scholar] [CrossRef]
  63. Symes, W.W. Reverse time migration with optimal checkpointing. Geophysics 2007, 72, SM213–SM221. [Google Scholar] [CrossRef]
  64. Mulder, W.A.; Plessix, R.E. How to choose a subset of frequencies in frequency-domain finite-difference migration. Geophys. J. Int. 2004, 158, 801–812. [Google Scholar] [CrossRef] [Green Version]
  65. Pratt, R.G. Seismic waveform inversion in the frequency domain. Part 1: Theory and verification in a physical scale model. Geophysics 1999, 64, 888–901. [Google Scholar] [CrossRef]
  66. Shin, C.; Min, D.J.; Yang, D.; Lee, S.K. Evaluation of poststack migration in terms of virtual source and partial derivative wavefields. J. Seism. Explor. 2003, 12, 17–37. [Google Scholar]
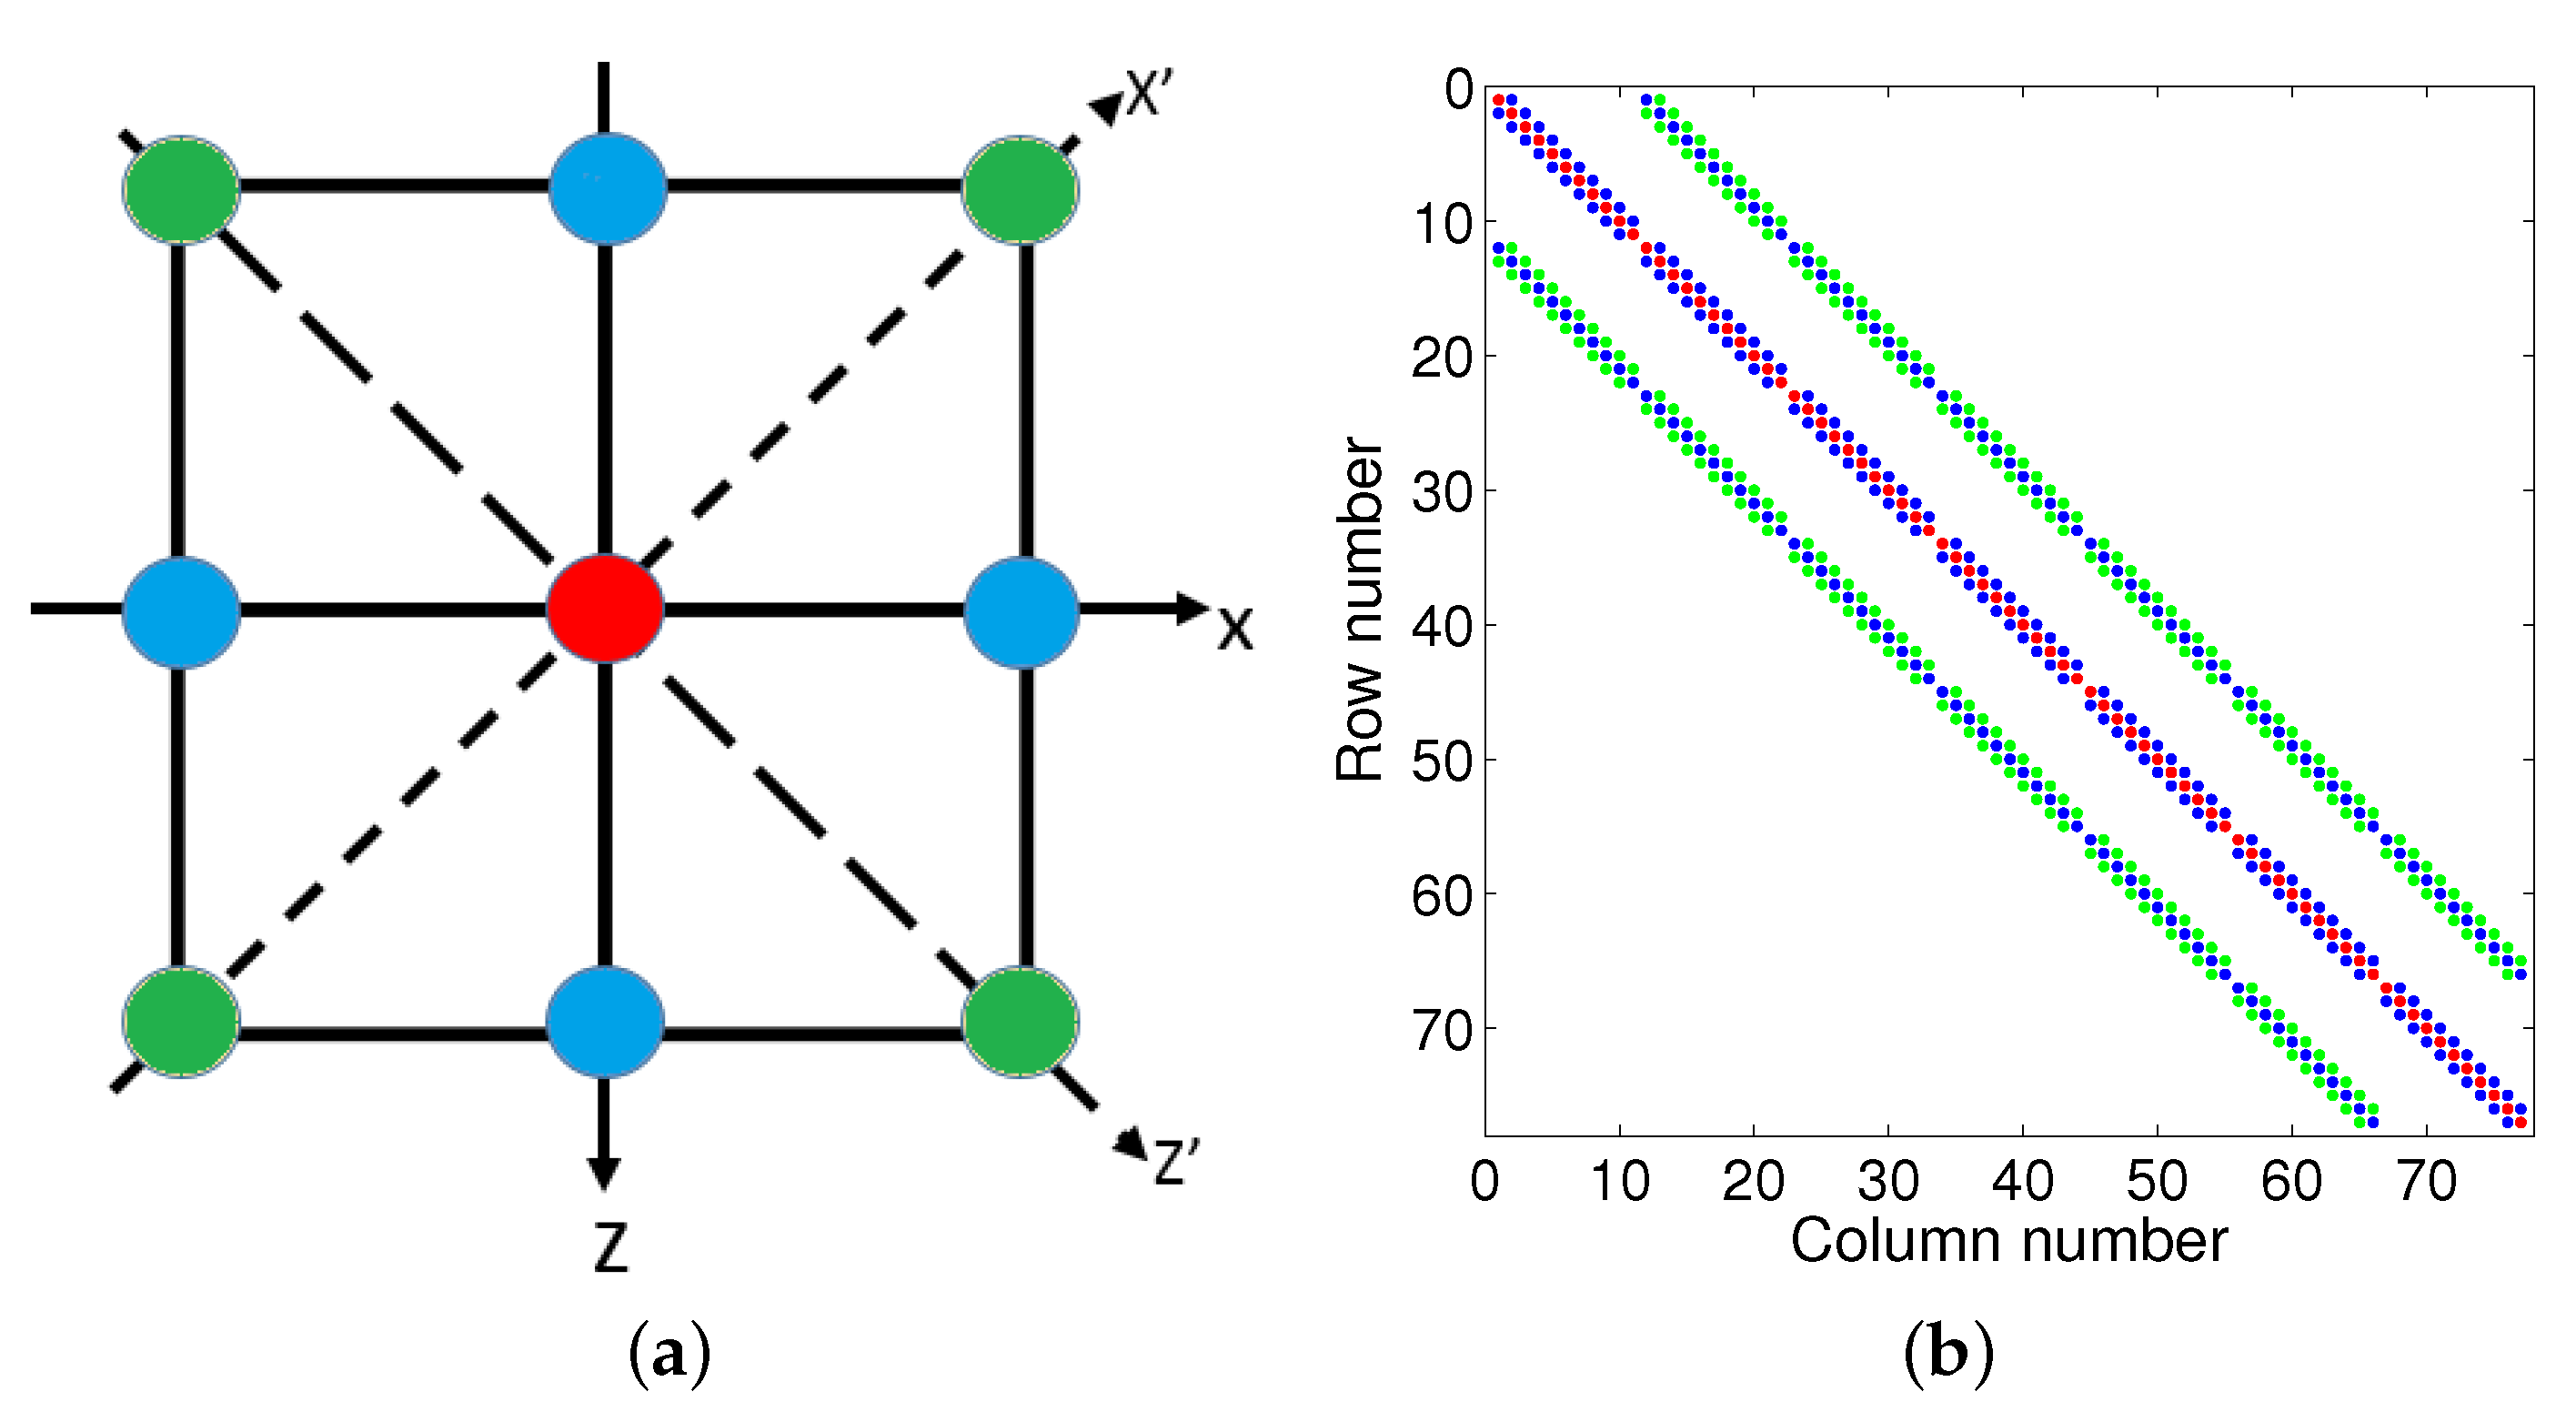
Figure 1. (a) The stencil used to approximate the discretized Laplacian. (b) The structure of the impedance matrix corresponding to a 9-point finite-difference scheme. The red dots indicate the coefficients at the center of the 9-point stencil. The green dots indicate the coefficients at the corners of the 9-point stencil. The blue dots indicate the midpoint coefficients of the middle corners of the 9-point stencil.
Remotesensing 14 05850 g001
Figure 2. Four snapshots simulated by different formulations: (a) acoustic, (b) dissipation-only, (c) dispersion-only, (d) viscoacoustic. The source is located at the center of the model marked as red point.
Remotesensing 14 05850 g002
Figure 3. (a) Schematic of the frequency-domain acoustic forward modeling. The stars and triangles represent the sources and receivers. p ( ω ) is the forward-propagating source wavefield, and r ( ω ) is the frequency-domain record data. (b) FA-RTM image. r ˜ ( ω ) is the backward-propagating receiver wavefield with the recorded data r ( ω ) as source, and the complex conjugate operator † is equivalent to the time reversal in the time domain.
Remotesensing 14 05850 g003
Figure 4. (a) Schematic of the frequency-domain viscoacoustic forward modeling. The stars and triangles represent the sources and receivers. p v ( ω ) is the viscoacoustic source wavefield, and the record data r v ( ω ) are attenuated by e α ω L D e α ω L U compared to the acoustic data r ( ω ) . (b) FQ-RTM image. To obtain an image equivalent to the acoustic case, the backward-extrapolation receiver wavefield should be compensated by e + α ω L D e + α ω L U , which is equivalent to the combination of the compensated source wavefield p c ( ω ) = p ( ω ) e + α ω L D and the compensated receiver wavefield r ˜ c ( ω ) = r ˜ ( ω ) e + α ω L U .
Remotesensing 14 05850 g004
Figure 5. A five-layered model: (a) velocity, (b) Q.
Remotesensing 14 05850 g005
Figure 6. The real part of the frequency-domain seismic wavefields stimulated at x s = 500 m: (a) acoustic and (b) viscoacoustic data.
Remotesensing 14 05850 g006
Figure 7. The amplitude of the frequency-domain seismic wavefields stimulated at x s = 500 m: (a) acoustic and (b) viscoacoustic data.
Remotesensing 14 05850 g007
Figure 8. The time-domain snapshot (T = 280 ms) stimulated at x s = 500 m: (a) acoustic and (b) viscoacoustic data.
Remotesensing 14 05850 g008
Figure 9. Common shot gathers stimulated at x s = 500 m: (a) acoustic, (b) viscoacoustic.
Remotesensing 14 05850 g009
Figure 10. Synthetic traces extracted from Figure 9 at x = (a) 200 m, (b) 500 m, and (c) 800 m.
Remotesensing 14 05850 g010
Figure 11. The migrated images: (a) FA-RTM with acoustic data, (b) FA-RTM with viscoacoustic data, (c) FQ-RTM with viscoacoustic data, (d) the differences between (a) and (c).
Remotesensing 14 05850 g011
Figure 12. Seismic traces extracted from Figure 11a–c at x = (a) 300 m, (b) 500 m, and (c) 700 m.
Remotesensing 14 05850 g012
Figure 13. The BP gas model: (a) velocity, (b) Q.
Remotesensing 14 05850 g013
Figure 14. Common-shot gathers stimulated at x s = 2100 m: (a) acoustic, (b) viscoacoustic, and (c) noisy viscoacoustic data.
Remotesensing 14 05850 g014aRemotesensing 14 05850 g014b
Figure 15. (a) Seismic traces extracted from Figure 14 at x = 2100 m and (b) their averaged amplitude spectra.
Remotesensing 14 05850 g015
Figure 16. Migrated images with the noise-free data: (a) FA-RTM with the acoustic data, (b) FA-RTM with the viscoacoustic data, (ce) are the Q-compensated images with the stabilization parameters σ 2 = 10 9 , 10 6 , and 10 4 respectively. (fh) are the differences between (a) and (ce).
Remotesensing 14 05850 g016aRemotesensing 14 05850 g016b
Figure 17. Seismic traces extracted from Figure 16a–c at x = (a) 1100 m, (b) 2100 m, and (c) 3500 m.
Remotesensing 14 05850 g017
Figure 18. Migrated images with the noisy data (SNR = 2 dB): FQ-RTM with the stabilization parameter σ 2 = (a) 10 9 , (b) 10 6 , and (c) 10 4 .
Remotesensing 14 05850 g018
Figure 19. The prestack shot gathers: (a) before preprocessing, (b) after preprocessing.
Remotesensing 14 05850 g019
Figure 20. The velocity model.
Remotesensing 14 05850 g020
Figure 21. The migrated images using: (a) FA-RTM, (b) FQ-RTM.
Remotesensing 14 05850 g021
Figure 22. The magnified view of the black boxes in: (a) Figure 21a, (b) Figure 21b.
Remotesensing 14 05850 g022
Publisher’s Note: MDPI stays neutral with regard to jurisdictional claims in published maps and institutional affiliations.