1. Introduction
Wireless sensor networks, which may be utilized for signal gathering, processing, and transmission in unique situations, are one of the study hotspots in the present information sector. It is an ad hoc network of wired or wireless sensors that works together to cooperatively detect, gather, and analyze data about the observed item in the sensor network’s coverage area and communicate it to the observer. A new information gathering and processing technology called a wireless sensor network is becoming more and more common in daily life. Data capture, event detection, and node control may all be continually performed by sensor nodes. With these features and wireless connection options for sensor nodes, wireless sensor networks have a very broad range of potential applications, encompassing a wide range of industries such as environmental forecasting and monitoring, health care, smart homes, building state monitoring, and many others. Wireless sensor networks have steadily entered into many areas of human life thanks to extensive research and widespread application, garnering the industry’s attention.
Wireless location technology is becoming more crucial as mobile Internet usage grows, since it can deliver accurate location data. In a location network made up of multi-agent devices, wireless location refers to a technique that determines the mobile node’s position based on wireless distance measurement data between the beacon node and the mobile node (to be tested node, source node) (sensors, mobile phones, drones, etc.). localization technology is a key technology in wireless sensor networks, and the lack of location data information is often meaningless. Existing localization algorithms are divided into the absolute localization algorithm and relative localization algorithm according to whether the beacon nodes with known locations need to be used in the localization process. The former generally arranges a certain proportion of beacon nodes in advance in the area to be measured. These nodes have known their absolute coordinates by GPS or other methods, and their unknown nodes obtain their own coordinates by communicating with these beacon nodes. The relative localization algorithm does not need to arrange beacon nodes in advance. Through the scheme formulated by the algorithm, a certain number of unknown nodes are selected to establish the relative coordinates. The nodes obtain their relative positions in the relative coordinate system through the cooperative relationship between nodes and message transmission.
Although the interdisciplinary area of electrical, mechanical, and industrial engineering considers radio positioning to be a relatively young issue, it has advanced significantly over the past ten years and significantly impacted our daily lives. For example, location detection in mobile social networks and automated identification systems, giving real-time guidance on the road and precisely tracking mission-critical individuals in emergency scenarios such as firefighting are a few of the most attractive uses. The fact that location information research has been a relatively active study topic up until this point suggests that there are still many problems to be resolved. The challenge depends on how accuracy and reliability are required by the program.
Line of sight (LOS) transmission is the term used to describe the signal sent directly between a mobile node and a beacon node during node localization. However, in practice, the only way a wireless signal may get to a receiver when there are obstructions are by reflection, scattering, and diffraction. This is referred to as NLOS transmission. The so-called NLOS error, which is caused by NLOS transmission, causes the signal transmission channel to lengthen and the measurement value to deviate positively. The primary factor impacting localization accuracy is NLOS error. The primary obstacle indoors is the RF environment, which is hindered by poor coverage, severe multipath signal fading, and NLOS circumstances that do not support wireless propagation. New algorithms or methods must be developed to overcome these physical restrictions. In order to accomplish this, the researchers reevaluated time-of-arrival ranging localization methods, implementing UWB communication ranging and NLOS suppression algorithms to mitigate the effects of soft propagation environments.
This paper proposes a nearest neighbor data fusion algorithm based on particle filter. The following are the contributions of our proposed algorithm:
- (1)
The advantage of the proposed approach is that it has a low level of complexity and is simple to implement on hardware. The hypothesis-verification procedure was used in the suggested NLOS identification method. The suggested technique can gather more NLOS environment data through NLOS identification than the conventional approach. Hypothesis testing for NLOS identification can considerably lessen the effects of NLOS.
- (2)
To guarantee the correctness of localization data, multi-level screening and weighted analysis are proposed. Even in a bad NLOS situation, the proposed algorithm offers great robustness. The proposed algorithm may be developed into a method for multi-targeted indoor localization. Additionally, sufficient tests based on extensive and difficult situations have been carried out to confirm the efficacy of our algorithm.
- (3)
The proposed algorithm can lessen the impact of the NLOS error when the NLOS error obeys distinct distributions, according to the simulation and experimental findings. This approach is easily adaptable to additional signal characteristics such as TDOA, RSS, or AOA, without compromising generality. The algorithm in this paper is not sensitive to the signal features and only processes the positioning results obtained by using the signal features, and does not involve the signal itself.
2. Related Works
The target localization issue in LOS and NLOS situations has been the subject of much investigation by many scholars. At present, there are two main solutions to improve the localization accuracy in LOS and NLOS environments: one is to identify radio localization, and the other is to suppress NLOS error localization. Both have made good progress.
In some common environments, especially in indoor scenarios, the location information between the beacon node and mobile node contains certain NLOS information, which will seriously reduce the performance of the localization algorithm. The simplest method of NLOS error suppression is to identify the NLOS measurements first, then discard the NLOS measurements, and only use the LOS measurements for location [
1,
2,
3]. Due to people’s incomplete understanding of the surrounding environment, there is no way to totally eradicate the impact of the NLOS mistake. However, in practical research, people have proposed solutions to eliminate part of the NLOS error. The commonly used NLOS identification technology [
4,
5] depends on the propagation channel model and statistical characteristics of historical data, in which some outliers from the signal characteristics of direct and indirect paths are used to distinguish LOS signals. In [
1], a nonparametric NLOS identification method is discussed, in which the distribution of known measurement error was assumed, and then the measurement distance was measured by the nonparametric estimation method to determine whether the given mobile node is LOS or NLOS. The detection of UWB systems in NLOS is briefly discussed in [
2] by comparing the normalized strongest path with the predefined threshold. However, for such a strategy, it is vital to make the right choice of parameters. A strong NLOS signal classification technique that can accurately identify and omit the majority of NLOS signals was proposed in [
4]. In [
5], a classification algorithm commonly used in machine learning was adopted by using the received waveform to extract obvious difference characteristics from LOS and NLOS signals, which makes a certain contribution to the NLOS path identification. The idea behind the approach to locate the multipath scattering center in [
6] is to understand the multipath’s direction of arrival. [
7] employed a geographic information system to turn the multipath scattering signal into a virtual sensor, and a source of radar radiation to provide location. In [
8], a three-dimensional angle of arrival (AOA) localization approach employing both LOS and unidirectional reflection NLOS channels was developed as well as a millimeter-wave LOS/NLOS identification system using the average shift (MS) clustering algorithm. In [
9], a multidimensional scaling (MDS) and accurate detection (QUAD)-based NLOS identification approach is provided. [
10] proposed a convolutional neural network-based technique for LOS/NLOS channel identification (CNN) to identify the channel impulse response diagram. This method can identify four different types of channel impulse response numbers and provide excellent recognition accuracy. The authors in [
11] proposed NLOS location identification based on UWB applications. Multi-sensor energy-saving technology and various calibration techniques for the localization process have also been investigated by several researchers and can be found in [
12,
13,
14].
In the study of the suppression localization method, maximum likelihood (ML) estimation and least-squares (LS) estimation are two effective methods for estimating position. In [
15], the authors conducted the normalized residual test to determine the NLOS measurement using the robust extended Kalman filter (REKF). Regression technology and EKF were combined to improve the EKF’s robustness in a NLOS environment and the algorithm’s accuracy. In a NLOS context, the interactive multiple model (IMM) technique is employed for tracking and localization. The range measurement in the LOS model and NLOS model was smoothed using the IMM technique in [
5] using two Kalman filters. The smooth range measurement in the NLOS model was deducted from the average NLOS error in order to minimize the NLOS error. An IMM technique based on TOA and RSS data fusion was suggested in [
16] to detect the mobile nodes. This is in accordance with the concept of data fusion. To handle the NLOS interference problem, almost all IMM algorithms must assume the NLOS statistical error, however, in real-world applications, the NLOS error’s previous knowledge is unknown. The study in [
17] proposed an approach that did not use the algorithm and was based on the NLOS estimate and IMM. In [
18], the robust interactive multiple model (R-IMM) method filtered data using both EKF and robust EKF (REKF). The REKF filter’s durability, improved filtering performance, and ability to effectively lessen the impact of NLOS error are all characteristics of the R-IMM method. In [
19], the authors proposed a mobile terminal (MT) tracking algorithm based on arrival time measurement in the NLOS environment. This was based on the NLOS detection and improved probabilistic data association method, which constructed a different range of measurement subgroups. A technique and indoor locating system based on installed LED lights in the surroundings are provided in [
20]. This idea was based on a visible light signal that had a modulation frequency between 50 kHz and 200 kHz and was detected by a PSD photodiode. In [
21], the authors used the quadratic programming method to propose the convex optimization method. This technique can withstand mistakes made when looking for NLOS pathways. In [
22], the authors identified a novel robust weighted least squares (RWLS) issue and developed a WLS estimator. This method does not need the NLOS error statistics and path state.
Non-cooperative localization only uses the ranging information between beacon node and mobile node to complete the location information estimation of the mobile node. However, when the communication radius is large, non-cooperative localization is prone to the problem of location communication interruption and cannot ensure the continuity of communication. The difference between cooperative localization and non-cooperative localization is that cooperative localization uses the distance information between beacon node and mobile node as well as between the mobile node and mobile node to form a pair of distance measurement matrices to complete localization. In cooperative placement, each object in a pair of distance measurement matrices is assigned to n places in P-dimensional space so that the distance between the placed objects and the distance in the supplied matrix match is nearly as feasible. In the MDS, two sets of distinct nodes are defined by how the moving node, called the target, is positioned in relation to the stationary node, called the beacon. The analysis of experimental data in molecular biology, geography, and psychology is made appealing by MDS [
23]. This strategy was developed by mathematical psychologists primarily as a tool for analysis and visualization, but it has subsequently found use in a variety of other sectors. It is frequently used as the foundation for cooperative localization techniques in localization. MDS is a technology that projects coordinate points in a high-dimensional space into a low-dimensional space. A dataset is a matrix of paired distances between objects. MDS maps the matrix to a low-dimensional space, usually 2- or 3-dimensions, for effective visualization purposes. By assigning coordinates to each object, similarity can be easily visualized while paired distances can be preserved. Classic MDS makes the assumption that these variations (in particular Eigenspace measurements) exist for Euclidean distances and tries to reconstruct appropriate geometric point arrangements. As a result of the dry scalar product matrix’s dimension knowledge and distinctive structure information, it is also a desirable robust cooperative localization approach in the presence of excessive measurement noise. A constraint optimization problem was established in [
24] to determine the deviation between each measurement distance and the ultimate moving node position in the MDS scheme by utilizing the asymmetry of the paired measurement matrix in the NLOS environment and the imprecise replication of the fixed node position. The findings demonstrate that the suggested strategy can enhance the localization performance when all fixed distance NLOS offsets are about equal. In the practice of remote multi-target tracking engineering, compared with the clutter problem, the data association of target crossing is the key problem. Combining the ideas of NN and JPDA, [
25] proposed the joint nearest neighbor data association (JNNDA). In [
26], a nearest neighbor data association algorithm based on the target “dynamic” monitoring model (TDMM) was proposed to solve the problem that the nearest neighbor data association (NNDA) algorithm could not detect the target “dynamic” change.
Based on the problem that NLOS identification is not accurate or the identification error is too large, a two-layer identification and verification mechanism was proposed in this algorithm, which greatly reduced the positioning error. In the process of error repair, the two-sided correction strategy was adopted, and the improved particle filter technology was used to repair the offset of the selected position estimation group, which solved the divergence problem well. The nearest neighbor algorithm was used for data fusion, which greatly optimized the accuracy and time complexity of the algorithm. Compared with existing algorithms, this algorithm has strong portability and practical operation.
3. Proposed Algorithm
3.1. Dynamic and Measurement Models
Assuming that the mobile node moves in the target monitoring area, the state vector of target motion at
time is defined as
where
represents the current horizontal and vertical coordinates and
represents the moving speed of the target in the
x,
y directions. The equation of the state is as follows
where matrix
is a state transition matrix, which describes the motion of target tracking between two continuous time steps. Matrix
describes the random acceleration corresponding to the position and velocity of the moving target under the condition of
process noise [
27].
is the Gaussian white process noise of the system with the mean value of 0 at time
and
is the sampling time.
The TOA measurement value monitored by beacon node at time
is
where
represents the real position between the beacon node and the mobile node,
is the measurement noise,
is the Gaussian white noise with zero mean value generated in the TOA measurement process, and obeys the
distribution.
is the positive delay and NLOS error caused by NLOS propagation, which can be described by exponential distribution, uniform distribution and Gaussian distribution. In the LOS environment, the main error is the system noise
, and at this time
= 0. In the NLOS environment, the main NLOS error affecting the localization accuracy is
, and there is a small system error
.
3.2. General Concepts
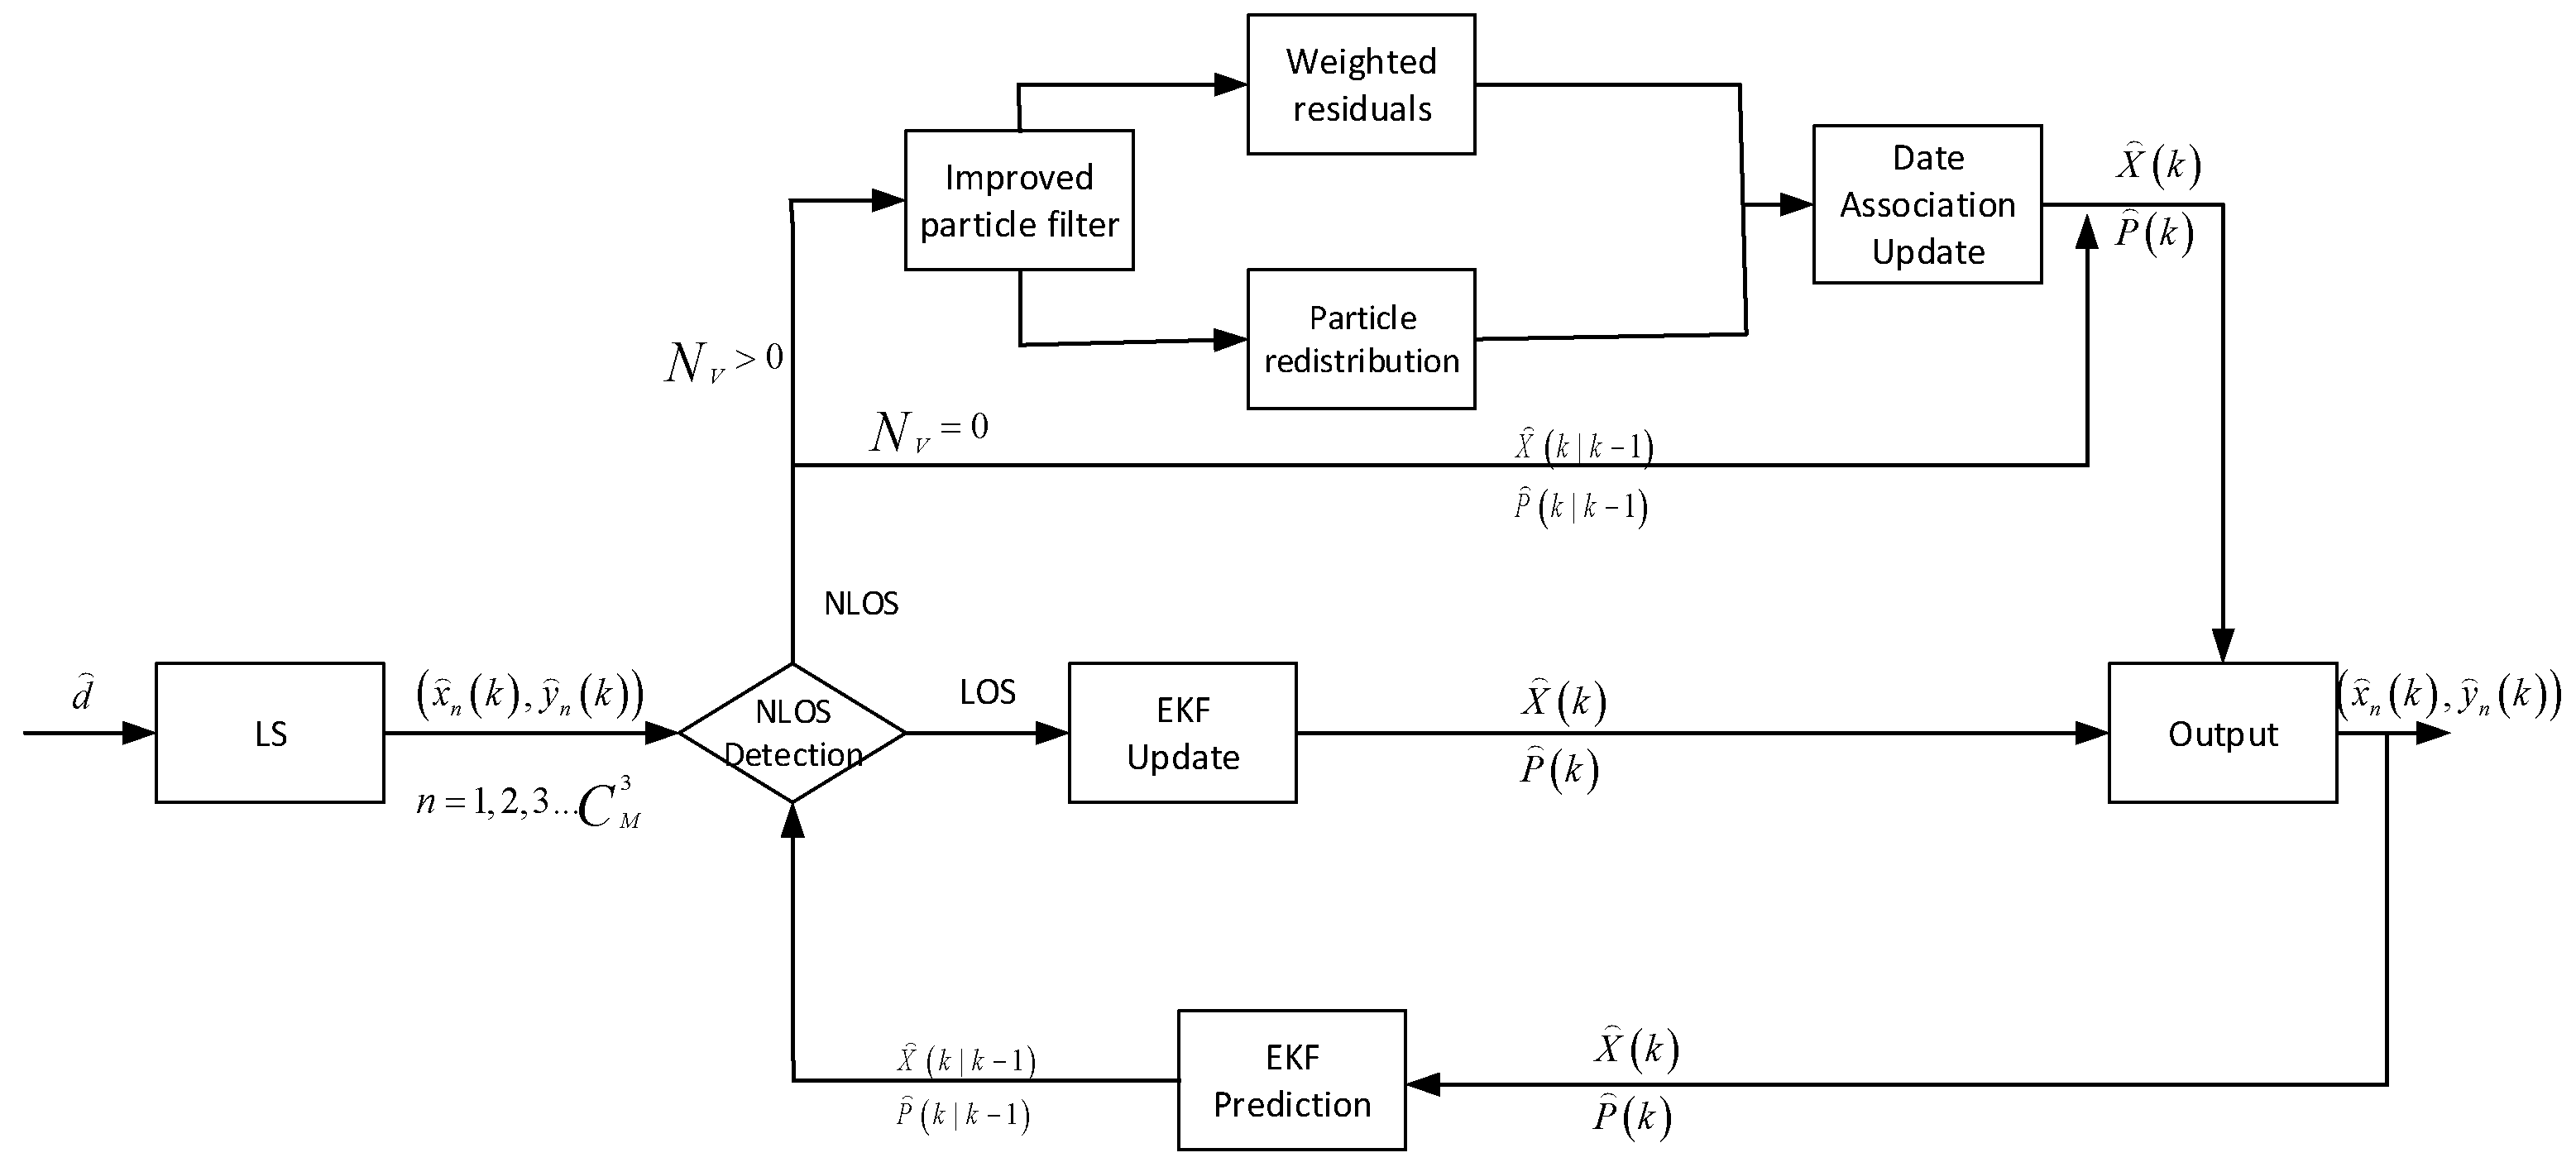
The proposed algorithm flow chart is shown in
Figure 1. At least three distance measurements of beacon nodes can be utilized to obtain the location of the mobile node. However, when the number of distance measurements is greater than 3, it will affect the distinction between LOS and NLOS. If more than three beacon nodes are used for positioning, the positioning results will repair each other, and the algorithm minimizes the error by n equations. It is difficult to distinguish whether the resulting localization results belong to LOS or NLOS. Therefore, we used three distance values as a subgroup to calculate the location of mobile nodes. The
beacon nodes can be divided into
different subgroups. Each group passes through the least square algorithm to obtain the corresponding position estimation value
. In the LOS environment, the least square algorithm can obtain higher localization accuracy. The EKF can be used to update the position directly while in the NLOS environment, the localization accuracy will be greatly reduced. To solve this problem, we set the verification function in advance for NLOS identification to effectively reduce the influence of NLOS. We used
to denote the estimated number of effective positions that fall into the validation gate. If
is 0, we will take the predicted value as the final position estimate. If
is greater than 0, the particle filter is introduced, and the filtered position estimation is weighted and redistributed. The main steps of particle filter are particle set initialization, update the centralization weight of particles, resampling, and calculate the corresponding estimate. The NLOS-contaminated location estimation is rejected, and the correct position estimation group is finally confirmed and reweighted by the nearest neighbor correlation algorithm to obtain a higher position accuracy.
3.3. Least Square Algorithm
The least square algorithm (LS) is a commonly used target tracking algorithm. Combined with the previous parameters, the relationship between the mobile node and the beacon node is
A linear matrix can be used to represent the previous equation.
where
,
, and
are
Finally, the estimated position to be determined at
k time is
All undetermined location points can be obtained after the LS location.
3.4. Kalman Prediction
We presumed that
and
represent the initial state vector and initial covariance matrix, respectively. Modeling their predicted values as
According to the prediction state, we model the prediction position as
where
.
3.5. NLOS Detection
If all three beacon nodes in the
group and mobile nodes are in the LOS environment, then
where
is innovation and
is the innovation covariance matrix of the position estimation corresponding to the group. In order to verify Equation (17), we defined the aforementioned premises and potential refutations.
When all the measured values in the sub-group had no NLOS error, the position estimation
falls into the verification gate, and the assumption of
holds. The position calculation will deviate greatly if a beacon node is present in the sub-group in an NLOS situation. At this time, the assumption of
holds, and the position estimation
falls outside the verification gate. In order to evaluate whether
enters the verification gate, the test statistics can be calculated as follows.
By comparing
with the threshold
of the verification door, whether
falls into the verification door is judged. If
is less than
, then
falls into the verification gate, assuming
holds, otherwise, assuming
holds. The threshold
of the verification door is related to the threshold probability
, and the probability that the location estimations from the LOS environment reach the validation region is referred to as the threshold probability.
With a degree of freedom of 2, is the chi-square distribution, represents the set false alarm rate. When the probability is determined, using a chi-square distribution table, we may determine the threshold . The location estimation that enters the verification gate is statistically studied. Assuming that the number is , if is equal to 0, the predicted position is taken as the estimated position. If is greater than 0, we conduct the next operation on the filtered position estimation group.
3.6. Improved Particle Filter
Suppose there are
L particles involved in the positioning, and the coordinate of the L-th particle is
. At time k, the distance between the L-th particle and the
m-th beacon node is
. The distance between the mobile node and the m-th beacon node is expressed as
. Let us call the difference between these two distances
.
The sum of
residuals corresponding to the L-th particle is recorded as
, its reciprocal is the weight
of the particle, and to normalize the particles as
.
For the particles involved in positioning, the corresponding residual value is greater than the distance measurement value corresponding to the average residual, which is considered to be affected by NLOS. Therefore, we took the probability that the residual value is greater than the average residual as the current non-line-of-sight probability, denoted as , then the line-of-sight probability is 1−.
- (1)
The first screening
The normalized particle weight is compared with the average particle weight. Determine whether the following formula is satisfied.
If yes, the particle is retained, if not, the particle is discarded. After the first screening, a total of
particles are selected and the weights of the particles are normalized.
- (2)
The second screening
After the first round of screening, we screened out the high-weight particles. We can use the residual to further simulate the probability of NLOS error. That is, to determine whether the following formula is satisfied.
We assumed that m starts at 0, and if the formula is true, then m plus 1. Finally, the NLOS probability is simulated by the percentage of the cumulative value of m. That is,
We performed a similar operation with the particles selected the first time being further refined:
We assumed that
q starts at 0, and if the formula is true, then q plus 1. Judge whether the following formula is satisfied.
If yes, particles are retained, otherwise the particles are discarded. After the second screening, a total of
particles were retained and the weights of the particles were normalized.
The measured distance from the particle to the beacon node is multiplied by the corresponding weight to obtain the measured distance from the mobile node to the corresponding beacon node, that is
The coordinate information of the mobile node can be obtained by using the three-sided measurement method.
We used the coordinate information obtained by particle filtering to correct the position estimation set through the verification gate. We set the position coordinate obtained by particle filtering as
. We now treat the position estimation group that fell into the verification gate as the particle object and compared the undetermined position at the time
of the previous screening with
, and their differences can be used as the basis for judging the weight.
represents the estimated position of the fall into the verification gate. Obviously,
reflects the difference’s absolute value between the estimated value of the position to be determined at time
and the particle filter value. Bring it into the following formula to obtain the required weight.
where
means the measuring noise.
The particle weights were normalized, and the normalized weight is
The closer particle has the larger weight. According to this prior knowledge, some particles were selected based on the principle of local optimization. By sorting the particles according to their weights and selecting half of the particles with higher weights, the optimal position can be calculated accurately. This improved strategy can reduce the computation of this segment by 40%. Because the distant particles are ignored, some error information is eliminated and the tracking accuracy is improved.
The improvement in the particle resampling is that only half of the weight particles above-mentioned were selected when splitting particles. The specific implementation process of the improved resampling is as follows.
The particles used were divided into two groups in the order of size. In the group with a high weight, each particle was split into three new particles. The group with the lower weight generated only one new particle per particle. This not only simplified the calculation, and improved the running speed, but also enhanced the effectiveness of resampling particles.
Residual weighting is an idea of grouping to resist NLOS error. We compared the resampled undetermined position estimation group with the predicted value again and carried out residual analysis to obtain an optimal position estimation group, which provides a double guarantee for the correct position estimation and a basis for the next nearest neighbor algorithm.
3.7. Nearest Neighbor Algorithm
The nearest neighbor method is a hard logic data association algorithm, which updates the target state by selecting the most correct echo closest to the target prediction. The core idea of the nearest neighbor association algorithm is very simple. First, according to the established target state equation, the target position at the previous moment is extrapolated to the current moment, and the extrapolation position is taken as the center to establish the tracking gate. If there is only one measuring point trace in the tracking gate, the point trace is directly used as the target trace, and the filtering algorithm is used to filter and adjust the target state. The commonly used filtering algorithm is the Kalman filter. When multiple measurement point traces appear in the tracking gate, the measurement point traces closest to the statistical distance of the extrapolation position are taken as the correlation point traces, which are used as the measurement point traces of the target at this time for filtering. The measurement area of the tracking gate is
where
is the setting parameter for the system. We introduce the error correction parameter
, which repairs the deviation of our position estimation, namely
Use this parameter to correct the deviation in four directions of position estimation.
Assuming that a measurement position at the current moment is
, the point trace at the previous moment is extrapolated to the target position after the current moment according to the motion equation, namely
The innovation covariance is recorded as
where
is the measurement error matrix, and the statistical distance can be calculated by the following formula.
According to this formula, the best measurement data are obtained in the patched pending position group
In this process, the optimal variance will also be calculated. Then, update the spatial state using the Kalman filter.
3.8. Update
In the update stage, we need to calculate the Kalman gain matrix
where
is the identity matrix.
is the identity matrix of order two,
.
Modified Filter Value and Error Covariance Matrix
4. Simulation and Experimental Results
In this section, the simulation effect of this algorithm in MATLAB is introduced, and the influence of accidental error is eliminated by 1000 times Monte Carlo operation. We randomly deployed six beacon nodes in the 100 m × 100 m area, where the mobile node ran along the fixed trajectory shown in
Figure 2, sampling time
, the total number of observations was 100, and the initial location of the mobile node was
=
, the initial covariance matrix was
, and the NLOS propagation error probability
between the beacon node and mobile node was generated randomly. The warning probability of verification gate
, the threshold probability was
, and the measurement noise was
. The simulation studies were conducted with three different distributions of NLOS error: exponential, Gaussian, and uniform. We compared the method in this study with EKF [
5], REKF [
15], IMM-EKF [
5], RIMM [
18], and PDA [
19] to assess the algorithm’s performance. As additional evaluation criteria, the root mean square error (RMSE) and error cumulative distribution function (CDF) of the localization error are presented.
RMSE, also known as standard error, is a commonly used index to measure the performance of location algorithms. In some indoor localization systems, the requirements for localization accuracy are usually high, and RMSE precisely reflects the deviation between the real mobile node location information and the estimated location information. Therefore, RMSE has been adopted as an important performance measurement parameter in a large number of studies. In subsequent studies, RMSE was primarily employed as a performance indicator for the approach. The calculation is as follows
where
refers to the total number of time observations;
represents the number of Monte Carlo operations;
is the real position; and
is the estimated position. In this paper,
.
CDF is a common index to measure localization performance, which is mainly used to count the proportion of localization errors in the total number of times under a specific precision threshold. When the localization error is lower than the accuracy threshold, the placement accuracy of the localization algorithm increases as the CDF value increases.
is the threshold value,
is the localization error, then CDF is calculated as follows
4.1. Gaussian Distribution
We assume that both the measurement noise and NLOS error obey Gaussian distribution, and the simulation parameter table of Gaussian distribution is shown in
Table 1.
As observed in
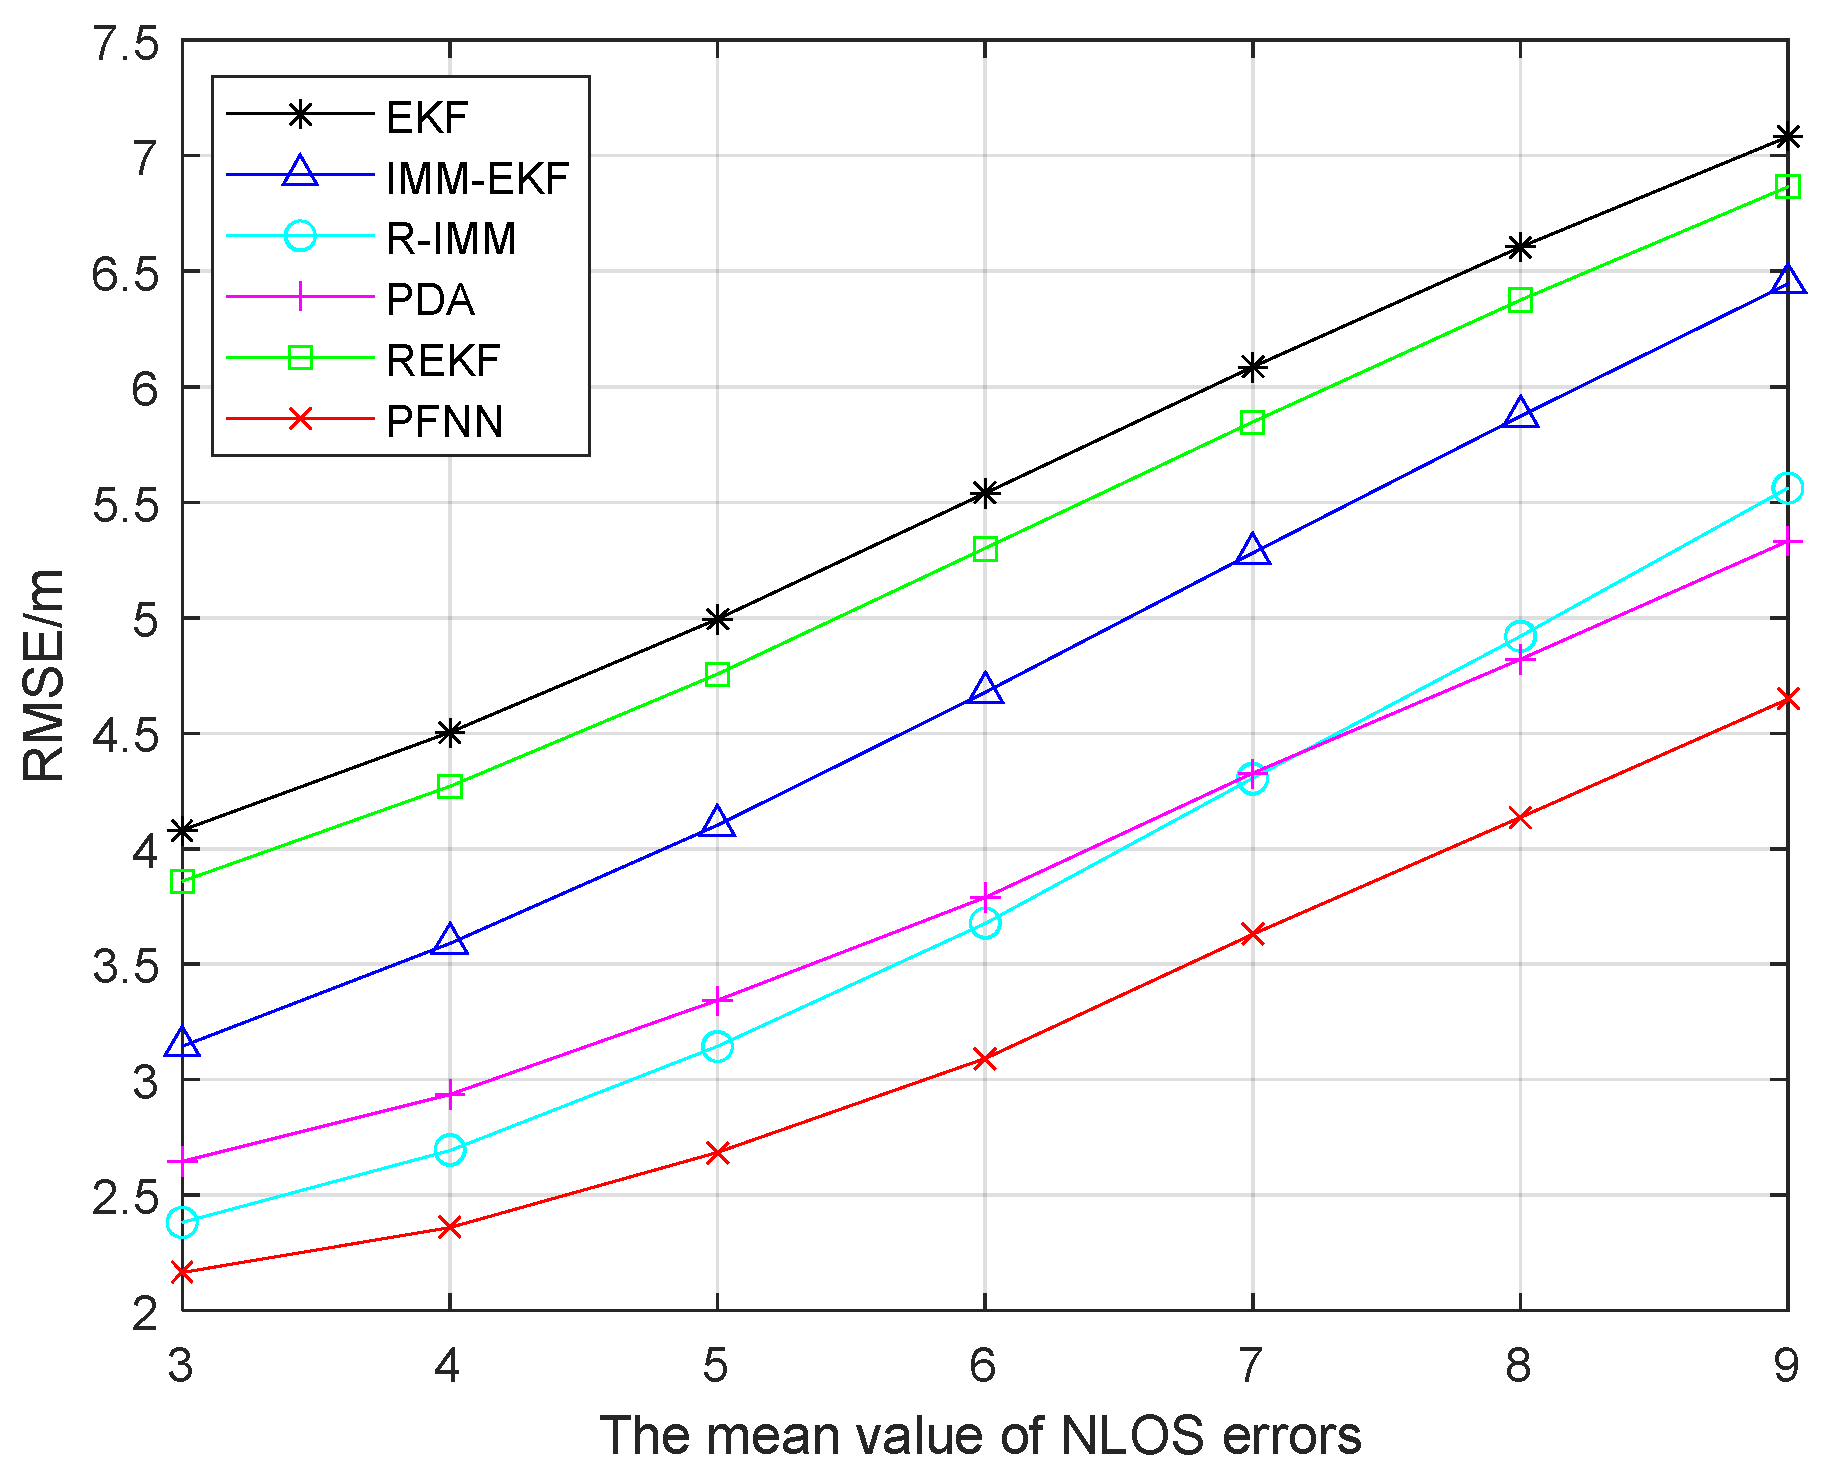
Figure 2, the RMSE of the EKF, IMM-EKF, R-IMM, PDA, REKF, and PFNN all increased when the average NLOS error was between 3 and 9. However, the accuracy of the proposed methodology was consistently the greatest, demonstrating remarkable stability, regardless of how it evolved. The six algorithms’ average placement accuracy was 5.798 m, 5.013 m, 4.111 m, 4.12 m, 5.571 m, and 3.494 m, respectively. The average placement accuracy of this method was higher than that of the preceding five algorithms by 39.74%, 30.31%, 15.01%,15.09%, and 37.28%.
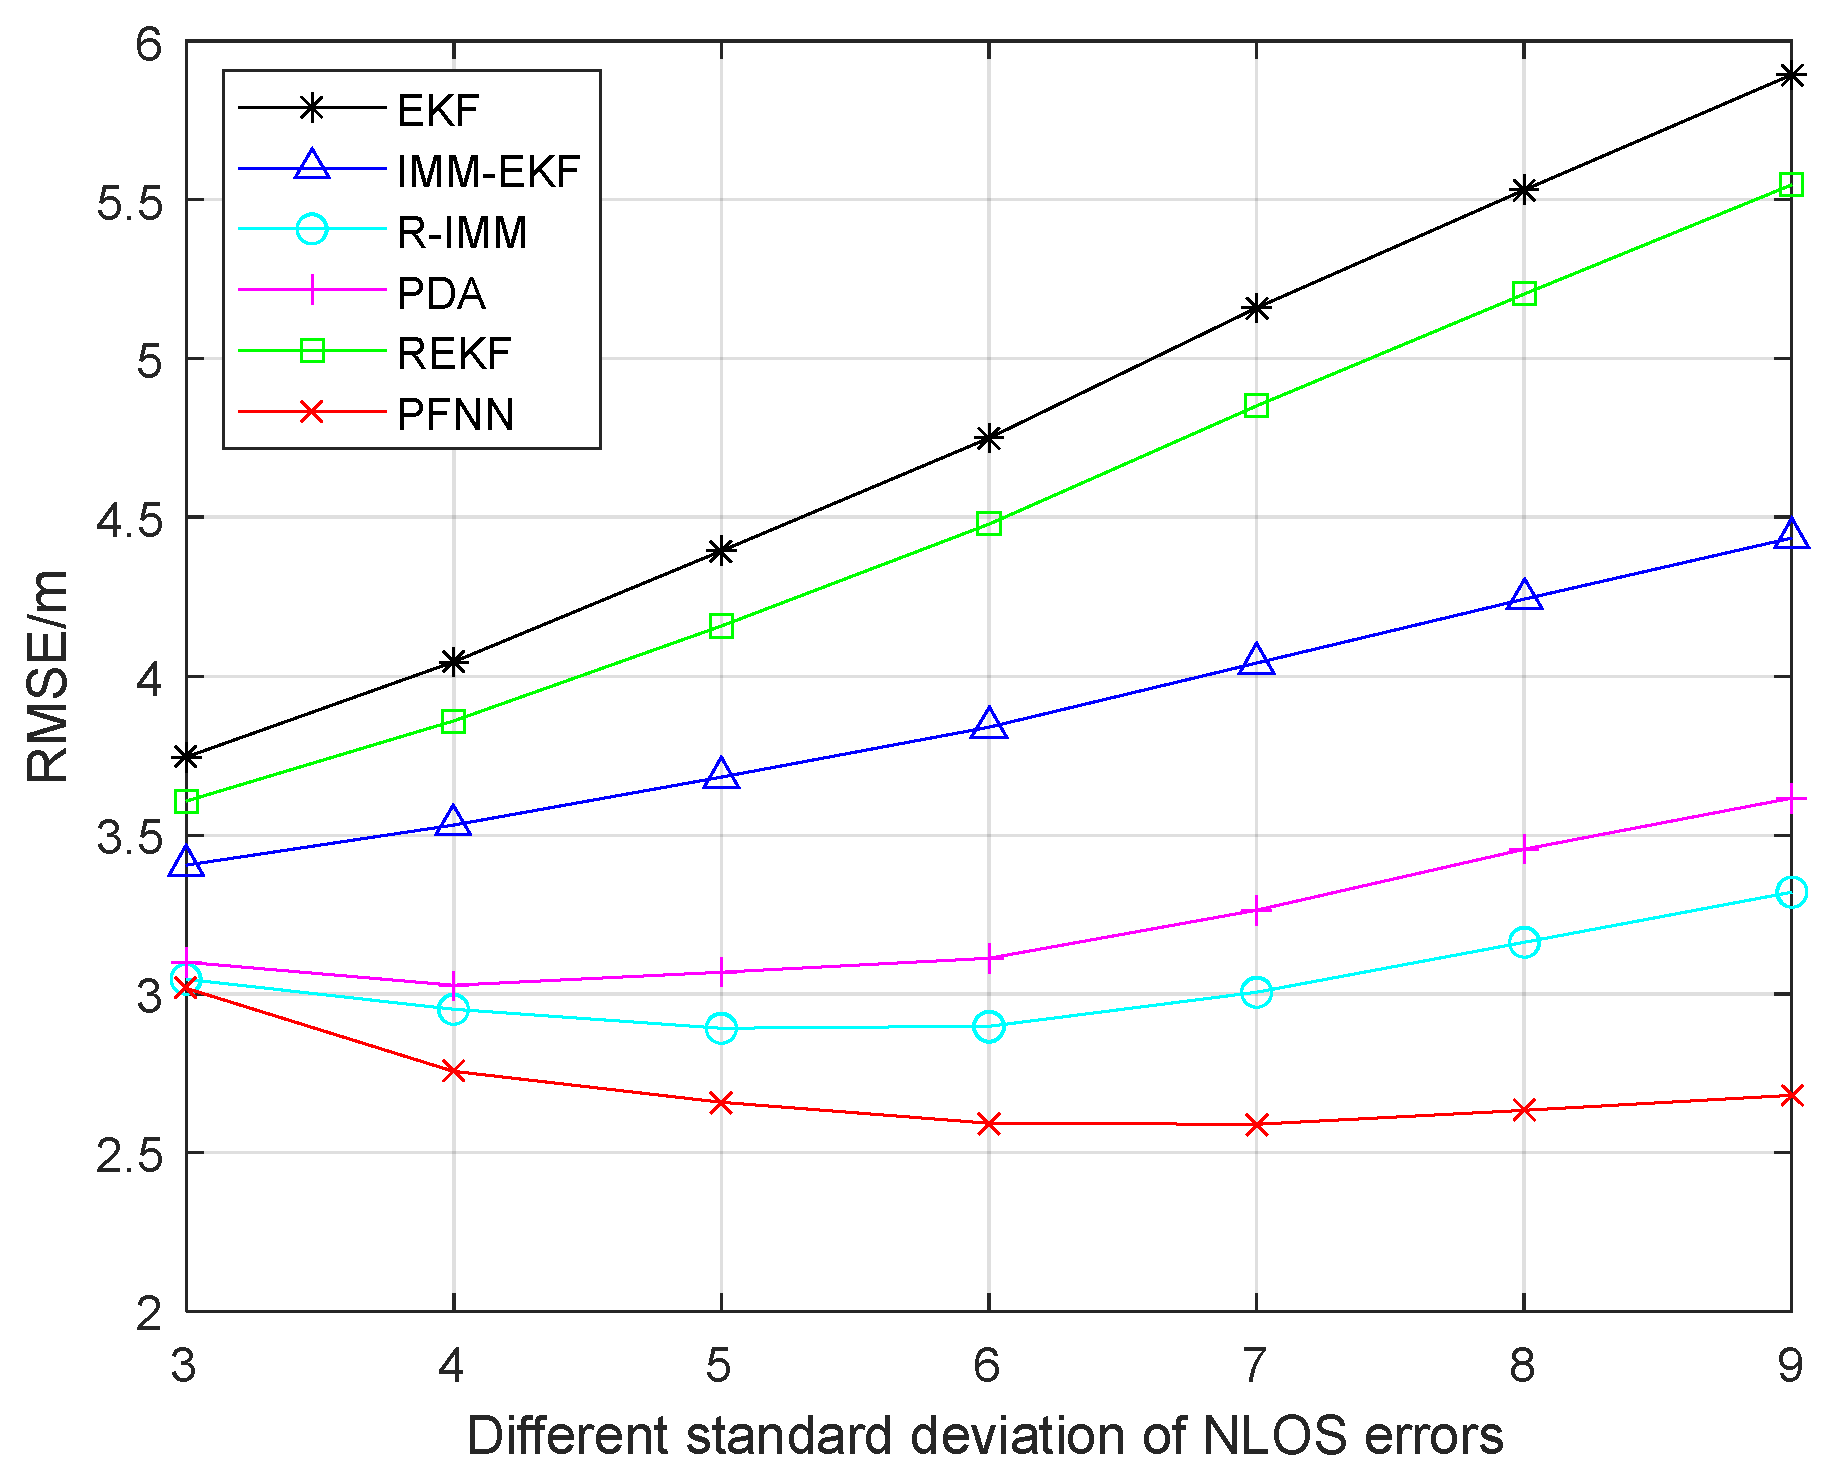
When the standard deviation of the NLOS error ranged from 3 to 9,
Figure 3 shows how robustly the six strategies performed. The RMSE of EKF, REKF, and IMM-EKF increased along with the growth in the standard deviation of the NLOS error, while the RMSE of PDA and R-IMM first decreased slightly, and then continuously increased. The RMSE of the proposed algorithm decreased, and then flattened out, always having good localization accuracy over other algorithms, showing a strong performance advantage.
As can be seen from
Figure 4, the greater the probability of the NLOS error, the worse the localization accuracy, and the less accurate the localization results. With the probability of the NLOS error between 0.1 and 0.8, the average localization accuracy of the proposed algorithm was reduced to 2.701 m, and the localization performance was higher than the other algorithms, while the average localization accuracy of EKF, IMM-EKF, R-IMM, PDA, and REKF were 5.528 m, 4.087 m, 3.342 m, 4.066 m, and 4.997 m, respectively.
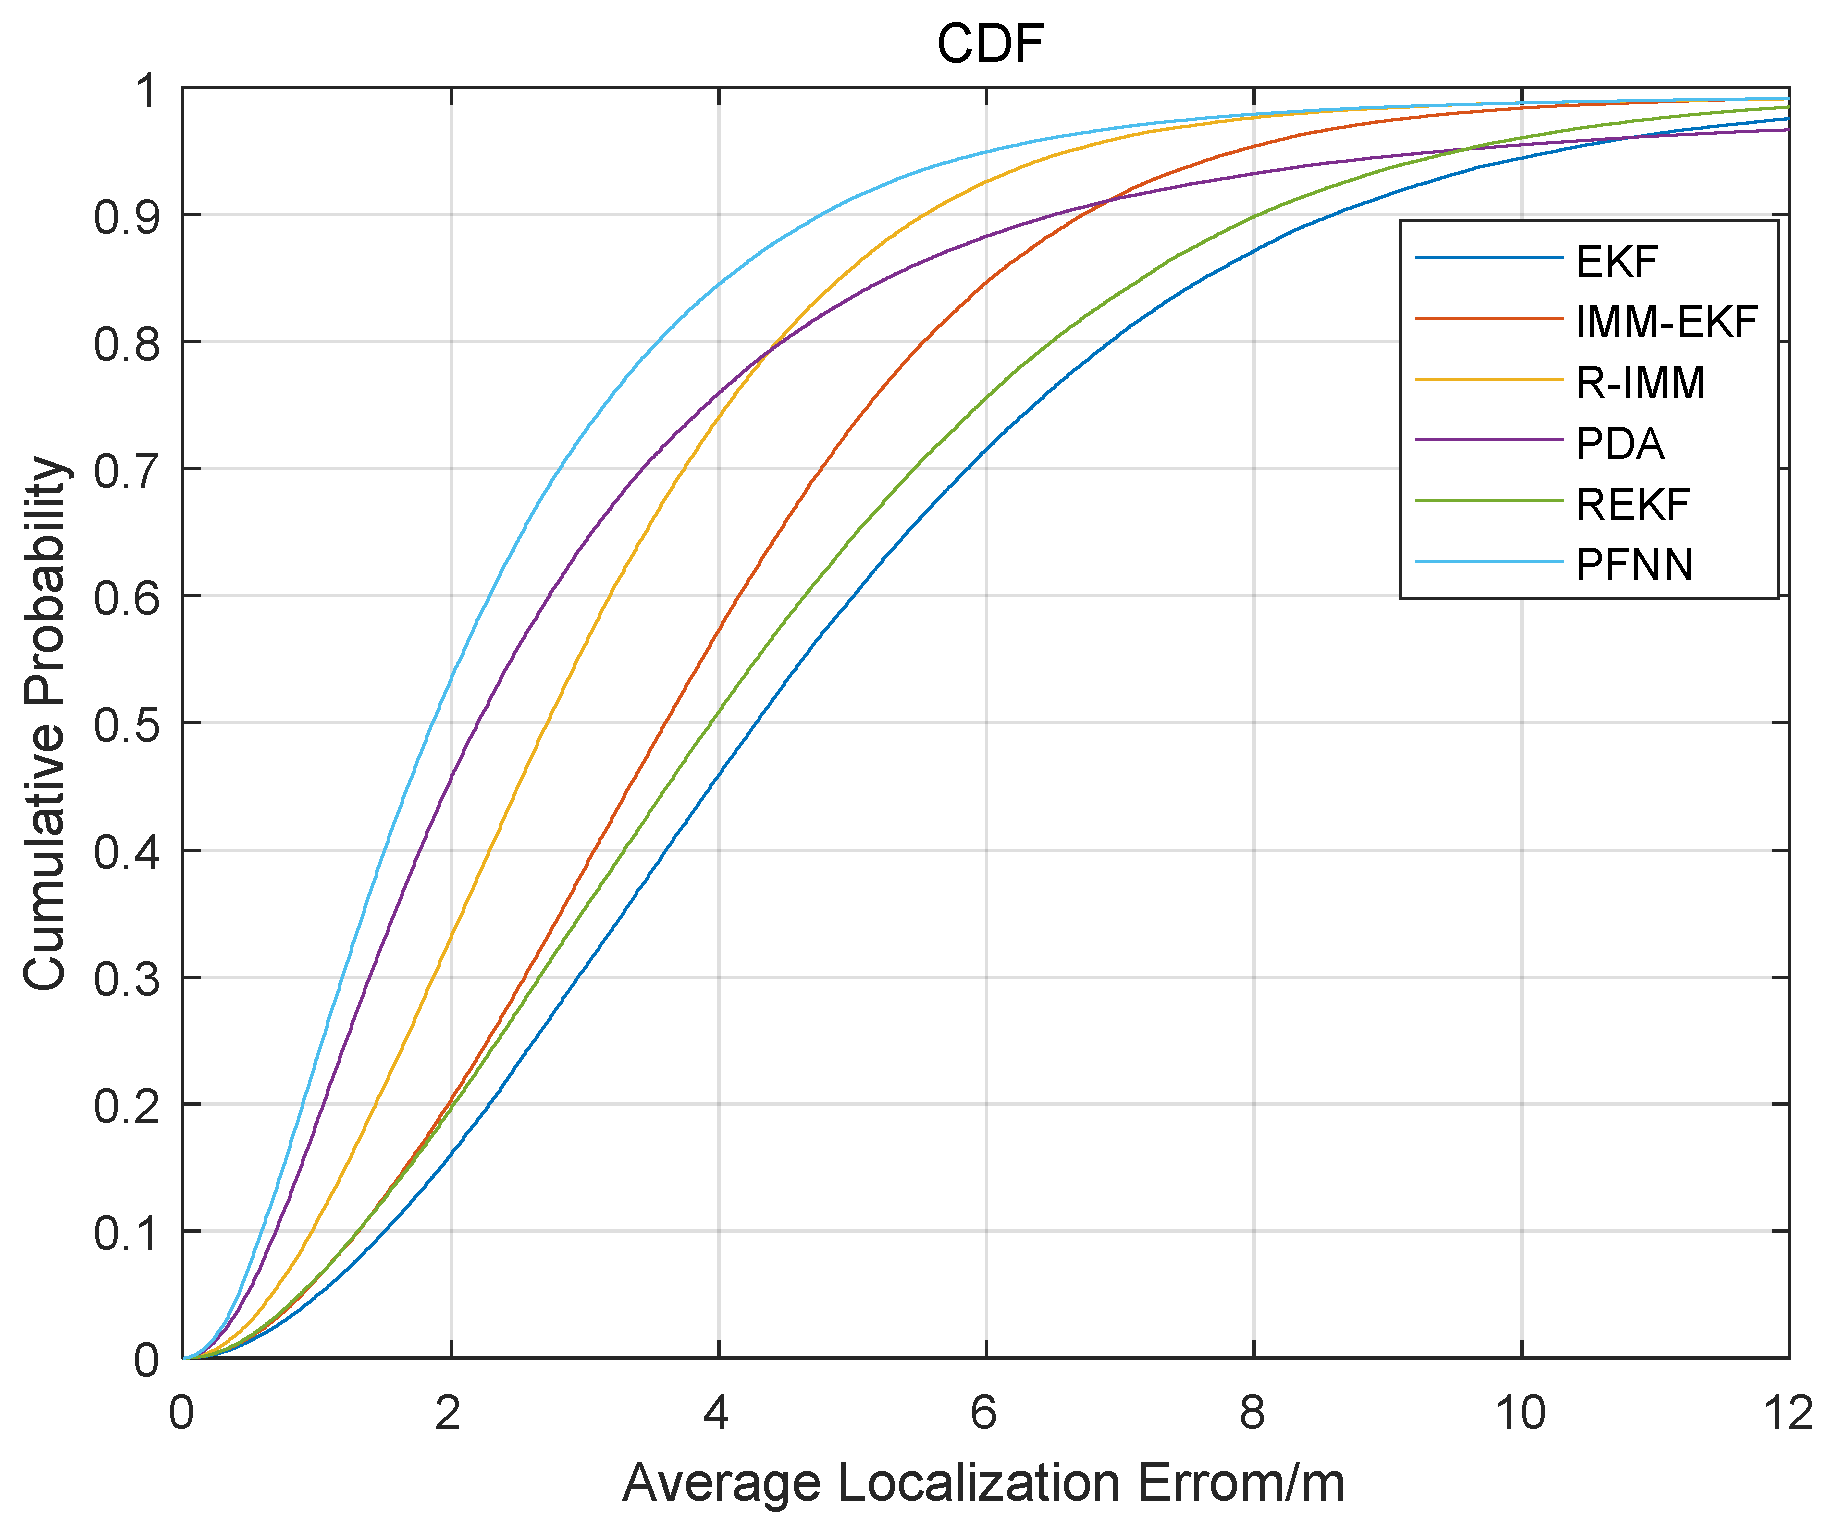
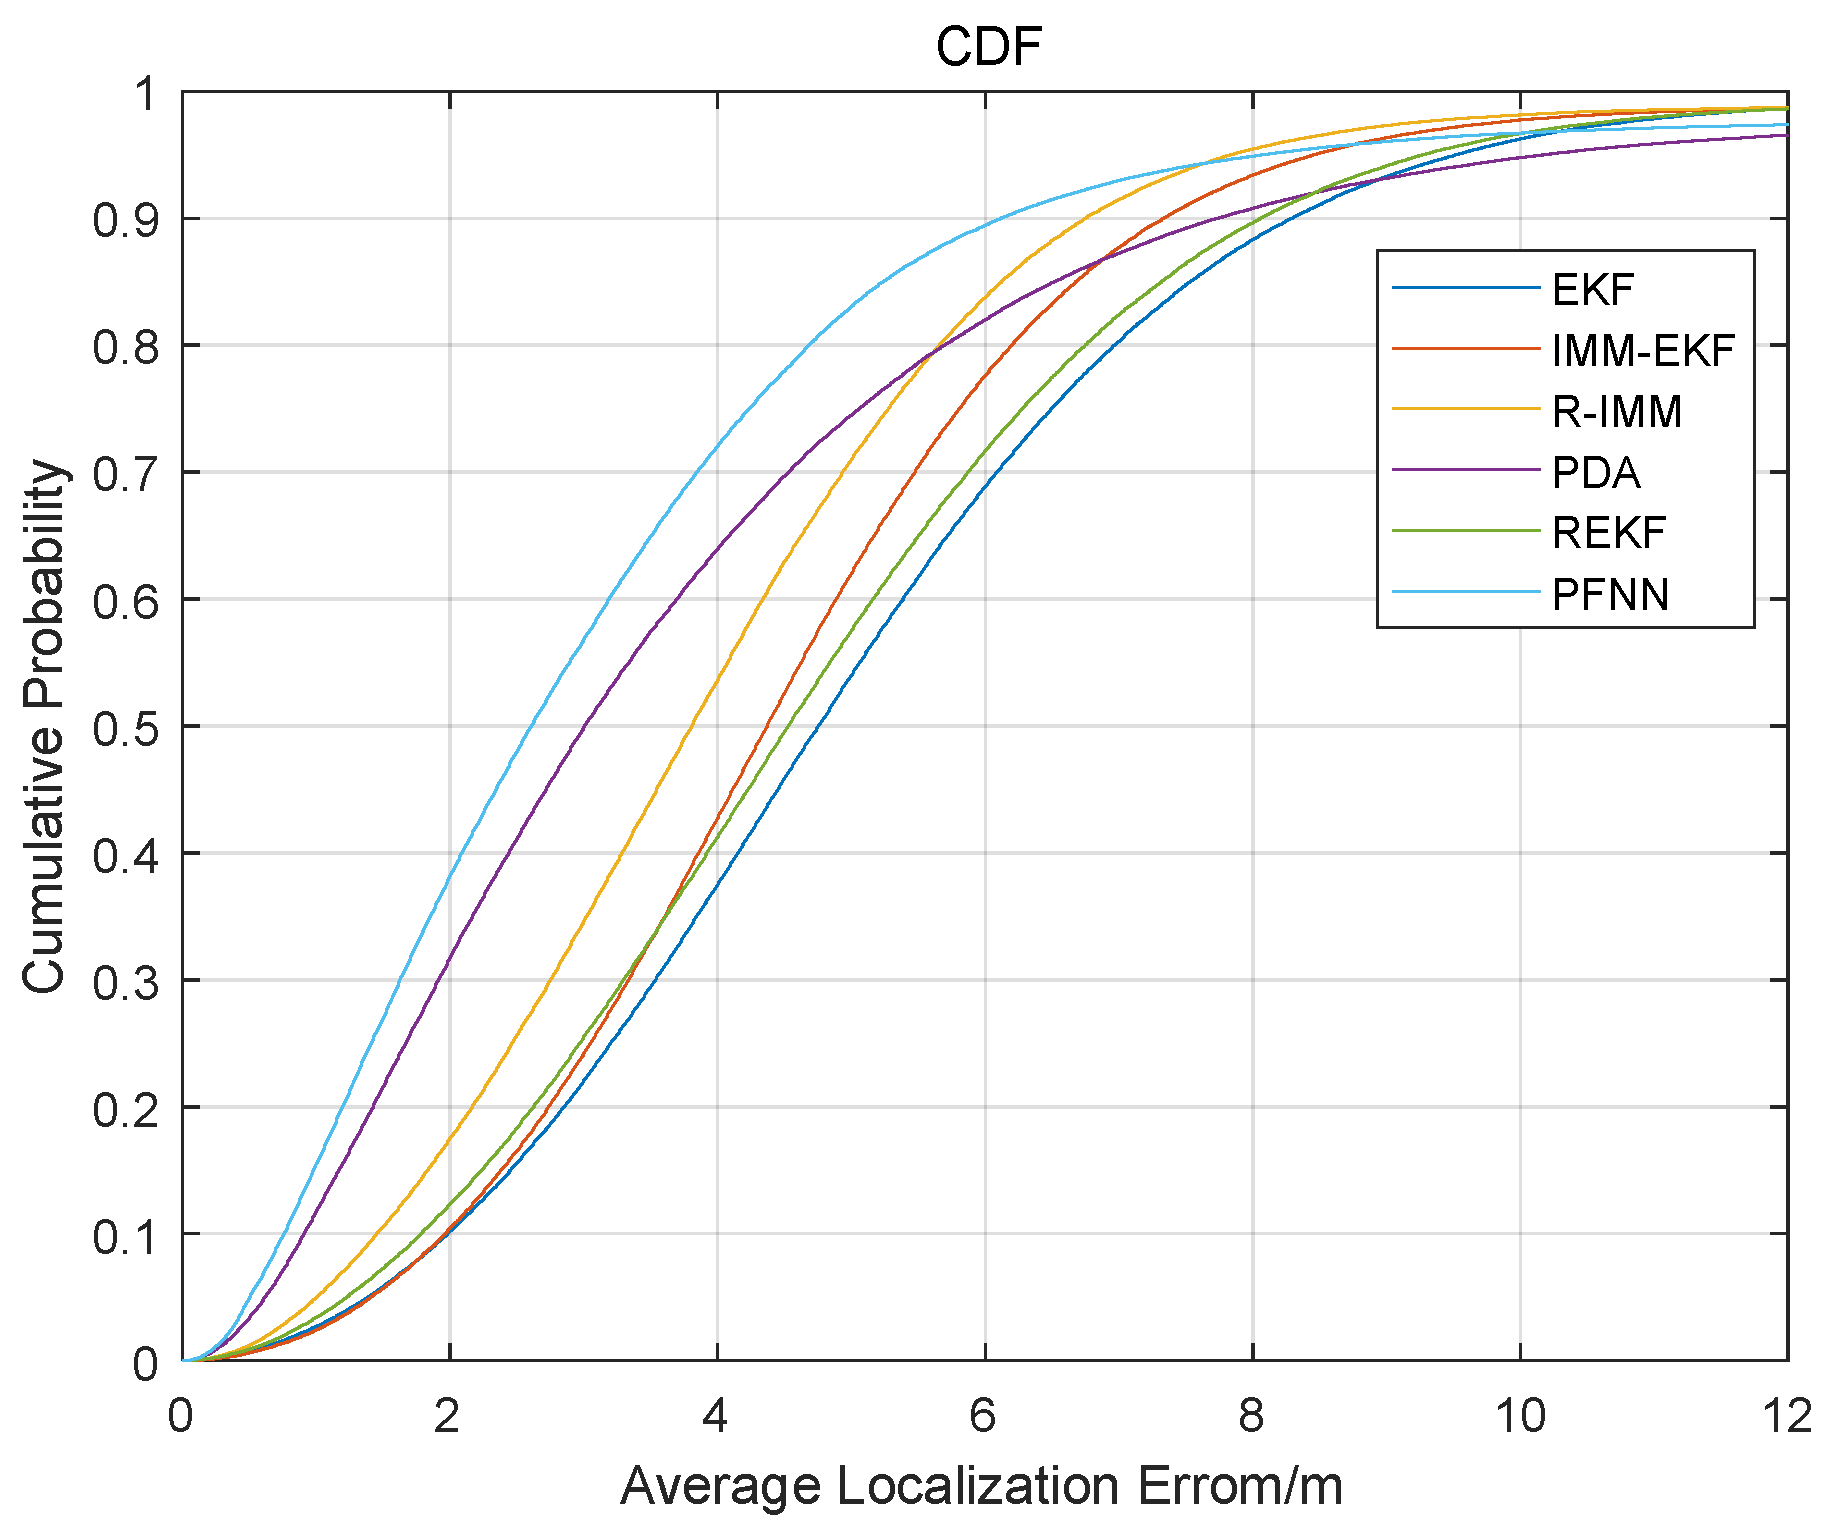
Figure 5 shows that the proposed algorithm’s 90 percent localization error was around 4.78 m, while the comparable values of EKF, IMM-EKF, R-IMM, PDA, and REKF were 8.59 m, 6.80 m, 5.53 m, 6.61 m, and 8.02 m, respectively.
4.2. Uniform Distribution
We assumed that the measurement error obeyed Gaussian distribution
and the NLOS error obeyed uniform distribution
. Default parameters for the uniform distribution simulation experiments are shown in
Table 2.
Figure 6 displays the RMSE results when the maximum value of the parameters varied from 9 to 16 in order to demonstrate the algorithm’s robustness when the maximum value of the parameters changed in the NLOS error. The localization accuracy of the six algorithms dropped as the maximum value of the parameters increased, while the localization accuracy of the suggested method remained ideal and is thus more reliable. The algorithm’s average localization accuracy was 3.658 m, which is much higher than the comparable figures for EKF, IMM-EKF, R-IMM, PDA, and REKF (4.901 m, 4.375 m, 3.907 m, 4.003 m, 4.715 m, respectively).
According to
Figure 7, which shows the cumulative distribution function of the localization error for the identical case, the proposed algorithm’s 90-percentile was less than 6.09 m. The 90-percentile of the EKF, IMM-EKF, R-IMM, PDA, and REKF, on the other hand, was less than 8.54 m, 7.38 m, 10.36 m, 8.06 m, and 8.02 m, respectively.
4.3. Distribution of Indicators
We assumed that the NLOS error obeyed the exponential distribution
and that the measurement noise obeyed Gaussian distribution
. The default parameter table of exponential distribution is shown in
Table 3.
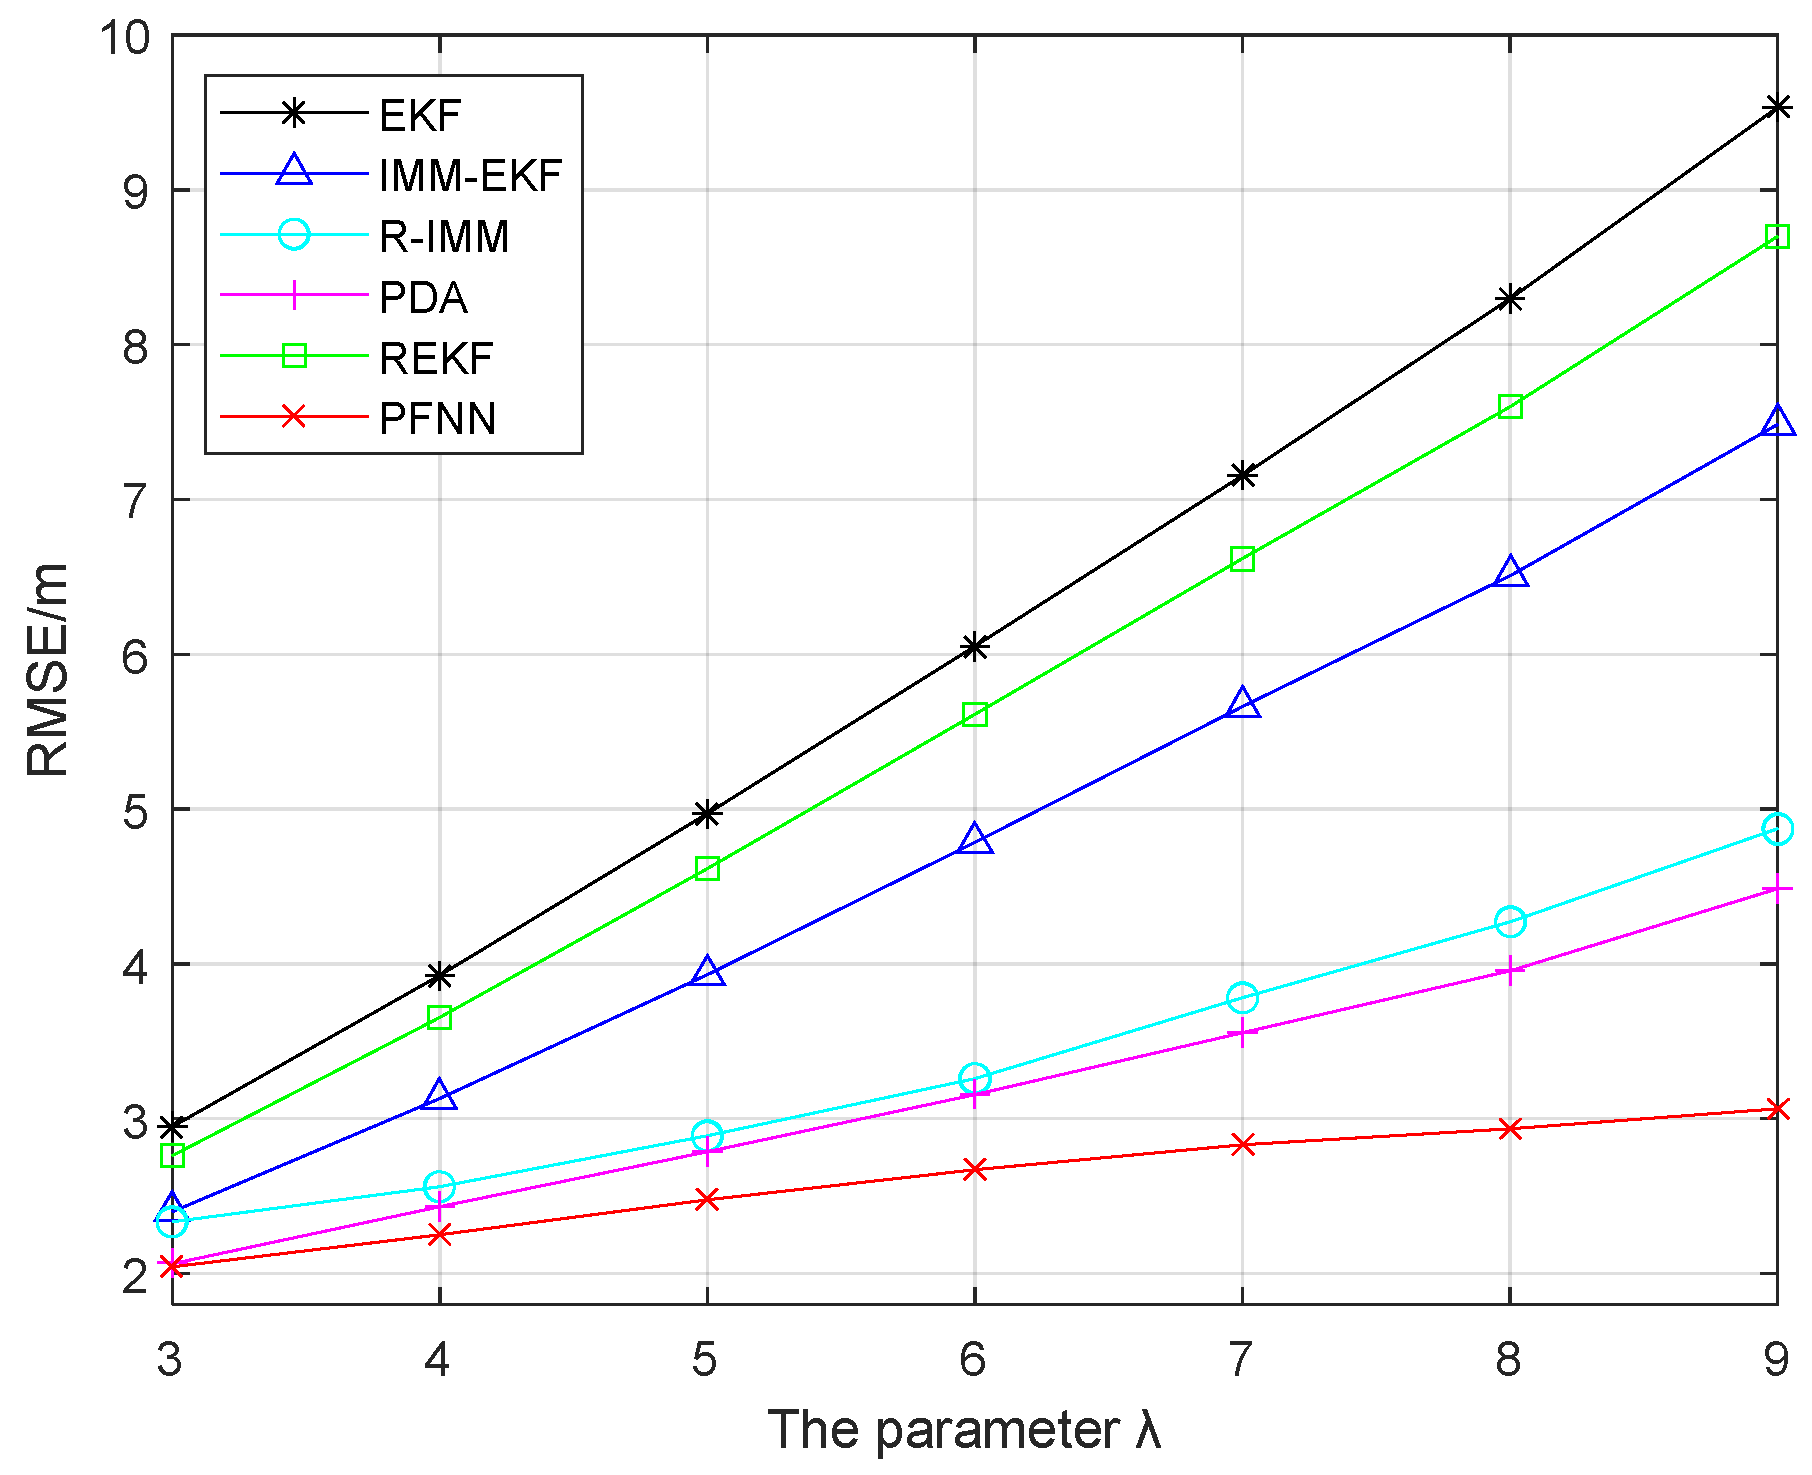
From
Figure 8, we can see that with the increase in parameter λ, the localization error of these algorithms was larger. In comparison, the proposed algorithm had a small change and tended to be stable, and had strong anti-interference ability. As the value of the parameter λ kept increasing, there was a greater in the difference between the performance advantage of the proposed algorithm and the other algorithms. This algorithm had a far greater average localization accuracy than the other algorithms.
It can be seen from
Figure 9 that the greater the probability of the NLOS error, the worse the localization accuracy and the more inaccurate the localization result. The average localization accuracy of EKF, IMM-EKF, R-IMM, PDA, REKF and PFNN was 6.279 m, 4.971 m, 3.52 m, 3.591 m, 5.8 m, and 2.436 m, respectively. Compared with the other five algorithms, the localization accuracy of the proposed algorithm was improved by 61.20%, 50.99%, 30.79%, 32.16%, and 58%, respectively, and the performance advantage was more obvious.
4.4. Time Complexity
In order to more intuitively reflect the time complexity of the algorithm, we used the running time of the algorithm for illustration.
Table 4 shows the comparison of the running time of each algorithm.
In comparison, it can be seen that the time complexity of this algorithm was relatively low, and the localization accuracy was the most ideal compared with other localization algorithms at the same time.
4.5. Experimental Results
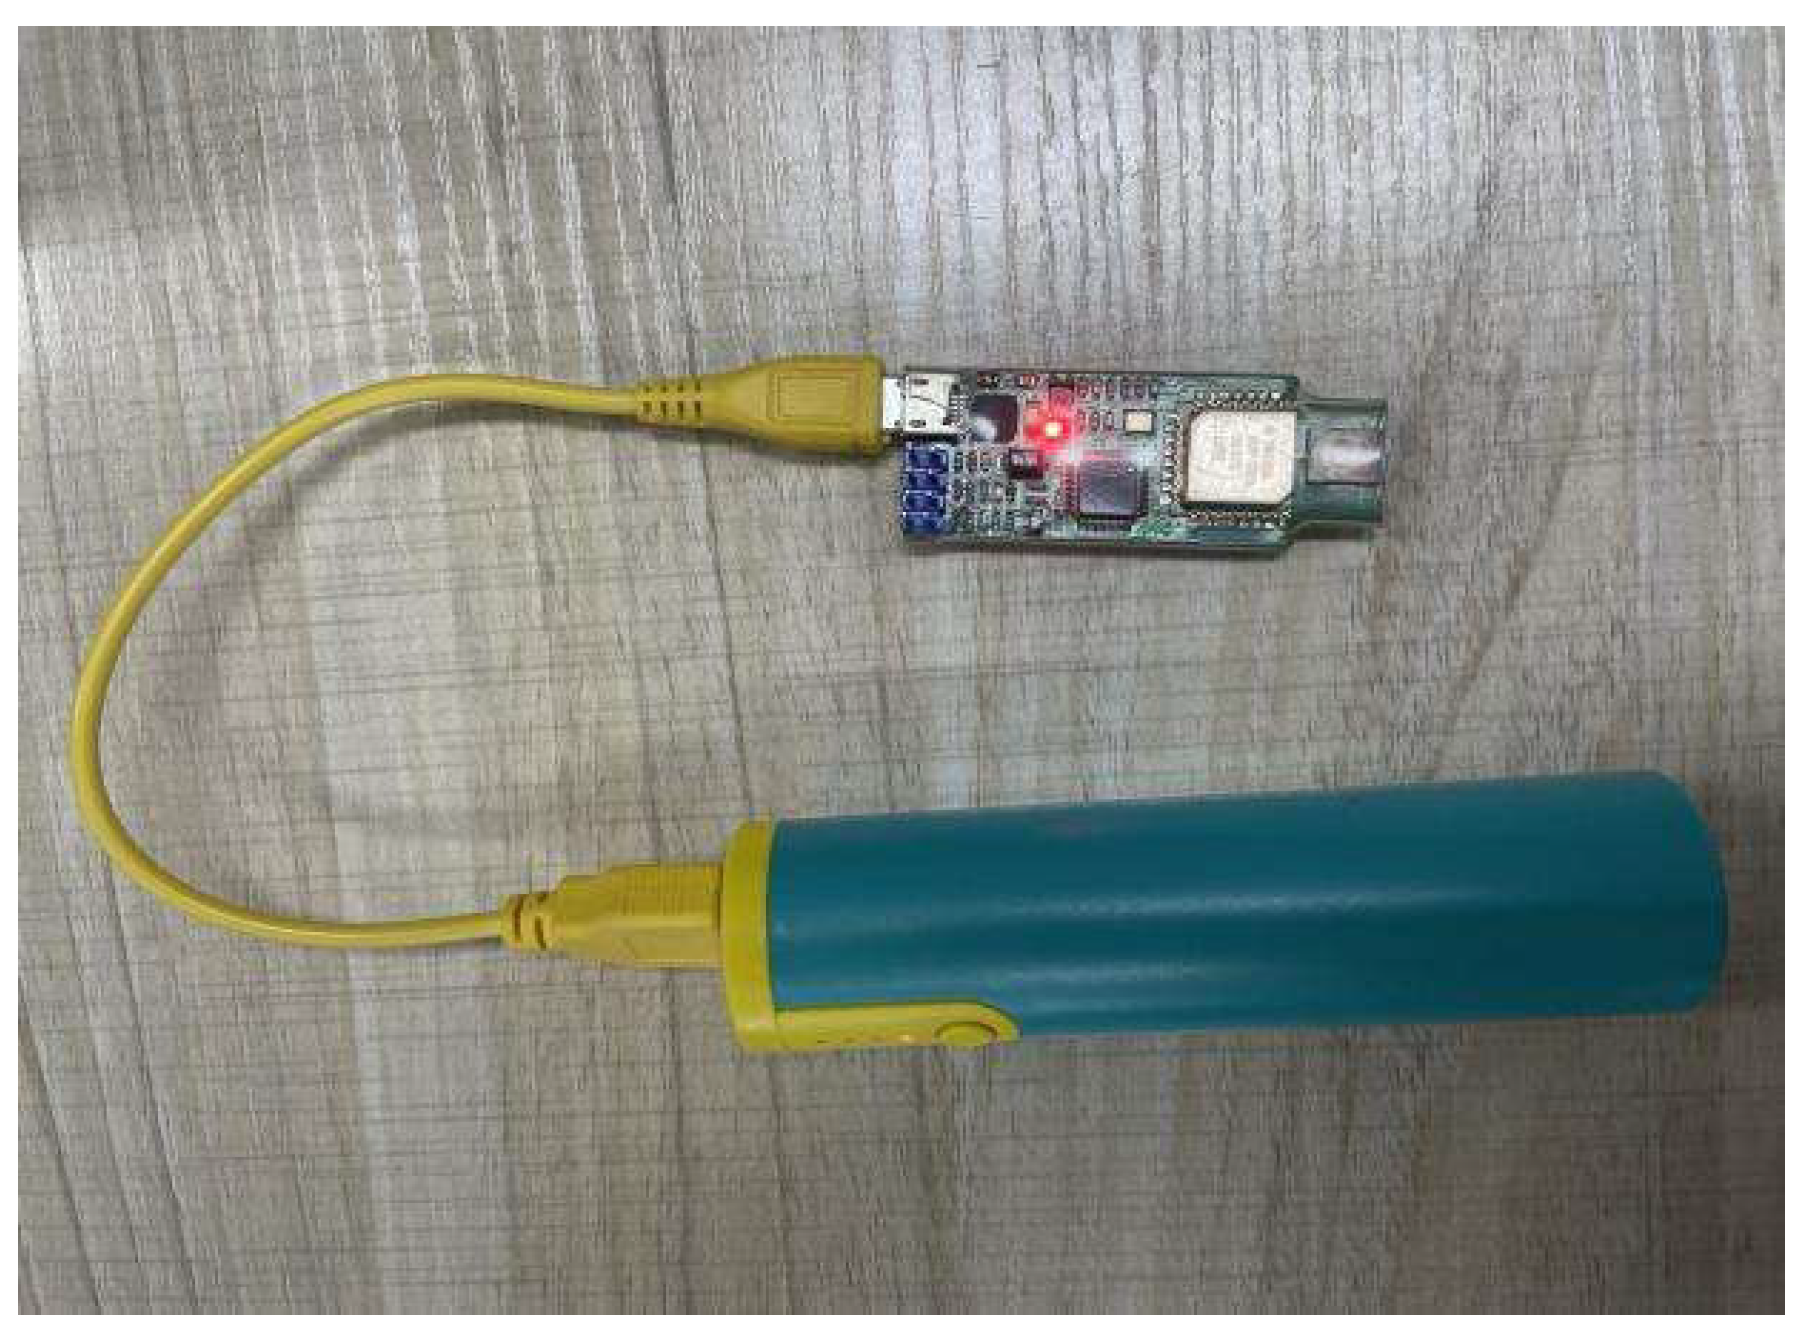
We confirmed the localization accuracy of the algorithm in a real environment before putting it to the test in that setting. We employed UWB technology to transfer signals between the beacon nodes and mobile nodes in order to acquire the distance measurement value. UWB technology is a wireless technology with a high transmission rate (up to 1000 Mbps), low transmission power, strong penetration ability, and based on very narrow pulse, without a carrier. It is these advantages that give it a very high application in the field of indoor localization, with high localization accuracy. While the beacon node is connected to the computer and communicates the acquired data to the computer, the mobile node is attached to the power source seen in
Figure 10 and is controlled by pedestrians as it moves. In
Figure 11, eight beacon nodes were deployed indoors. The mobile node follows a fixed trajectory uniformly. The virtual line represents the moving trajectory, and the purple solid circle represents the beacon node. We raised the mobile node to a height of at least 1 m to prevent the ground from reflecting the UWB signal. In the whole trajectory walking process, there were a total of 30 sampling points. Each sampling point was sampled 20 times, and the average value was the final measurement distance value.
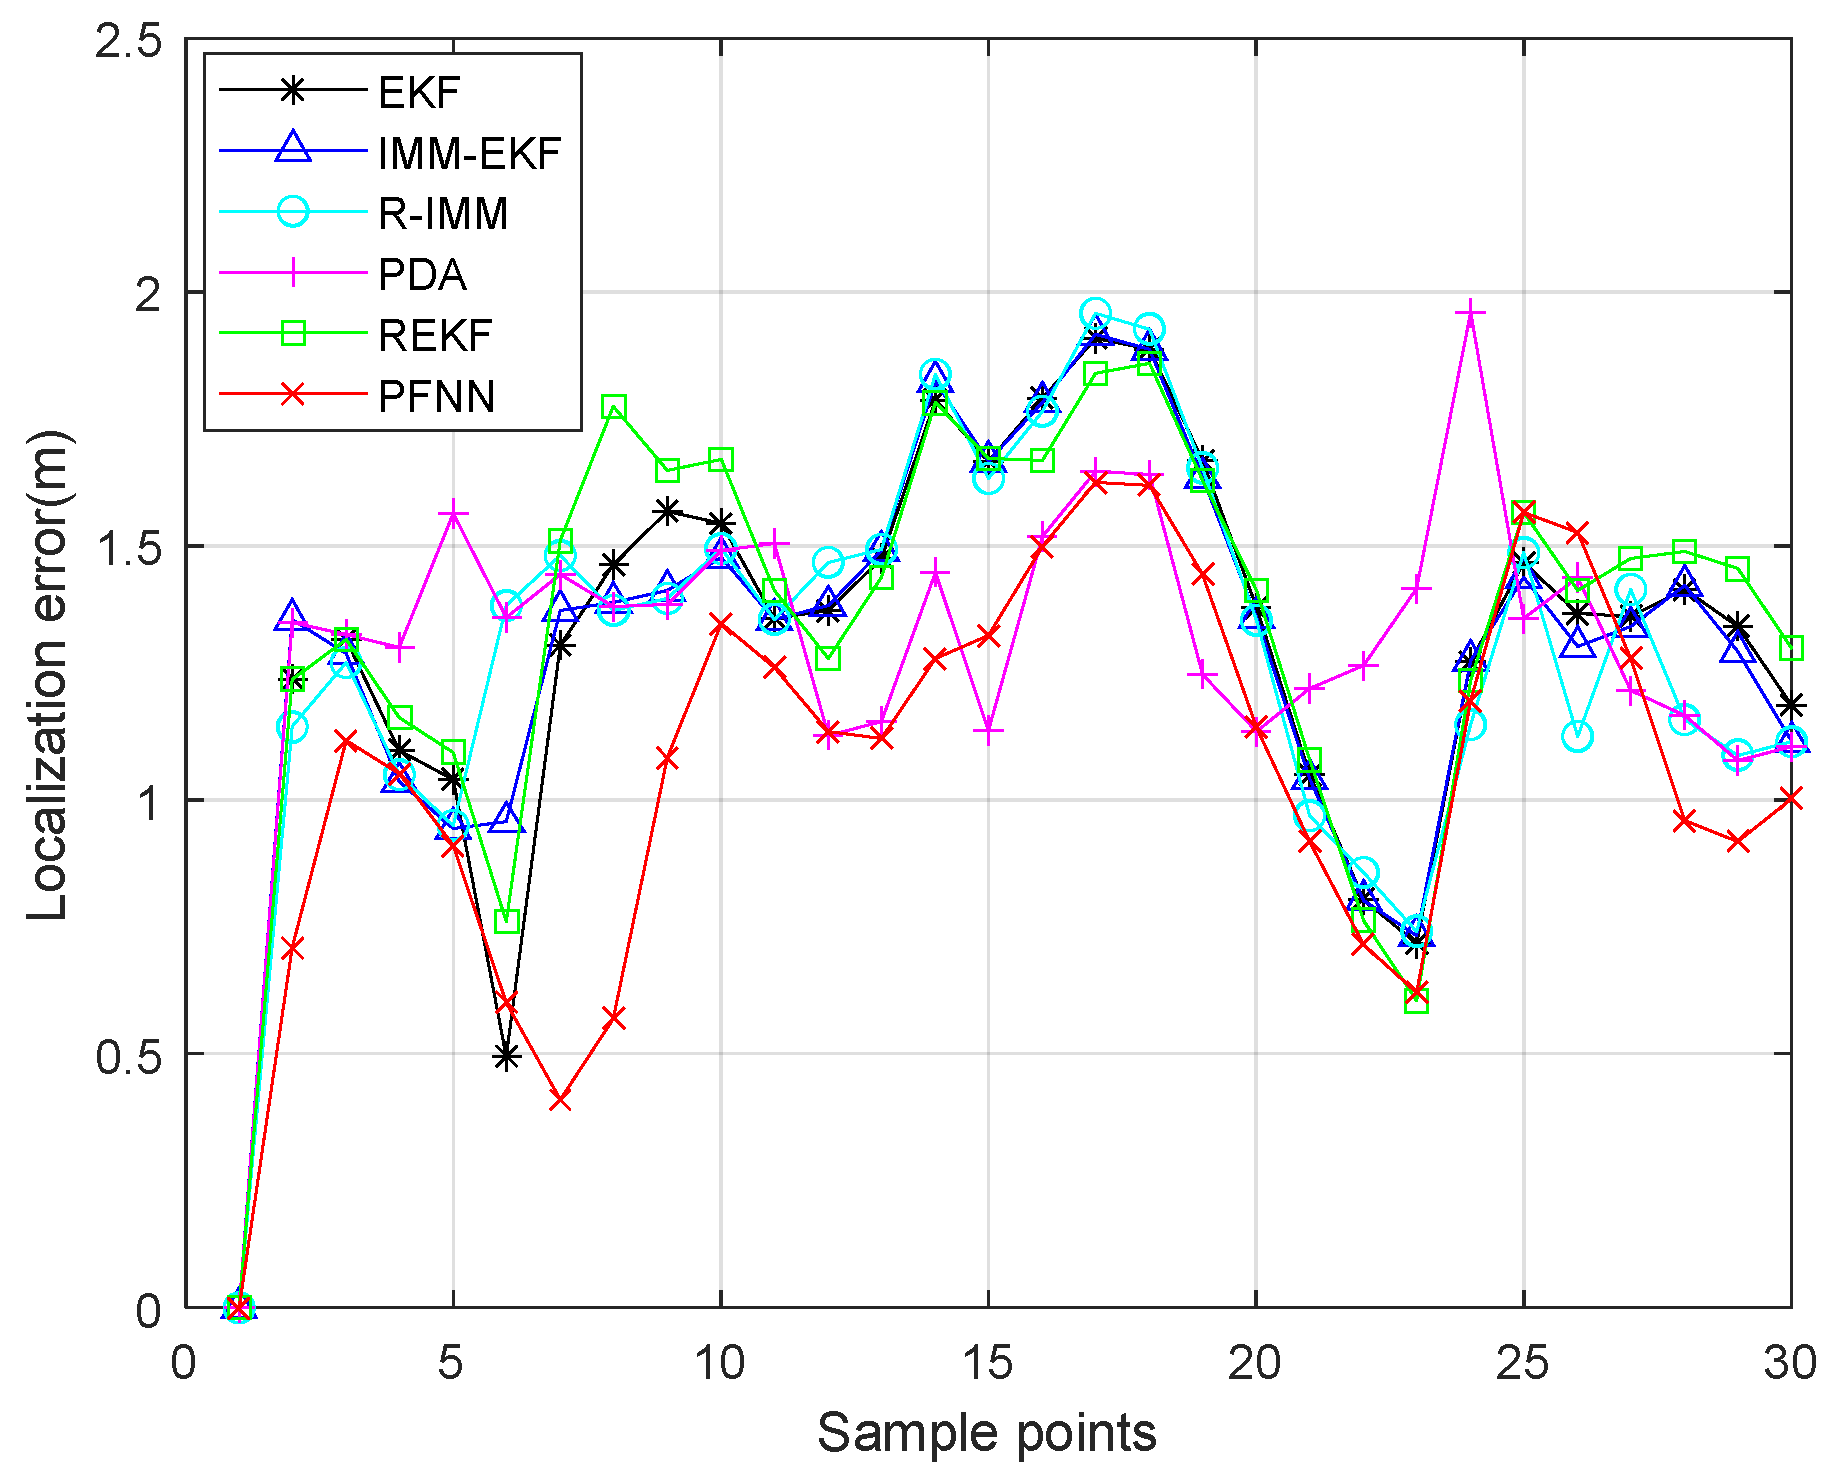
The localization error for each sampling point is shown in
Figure 12. It is evident that the proposed algorithm performed nearly at its best.
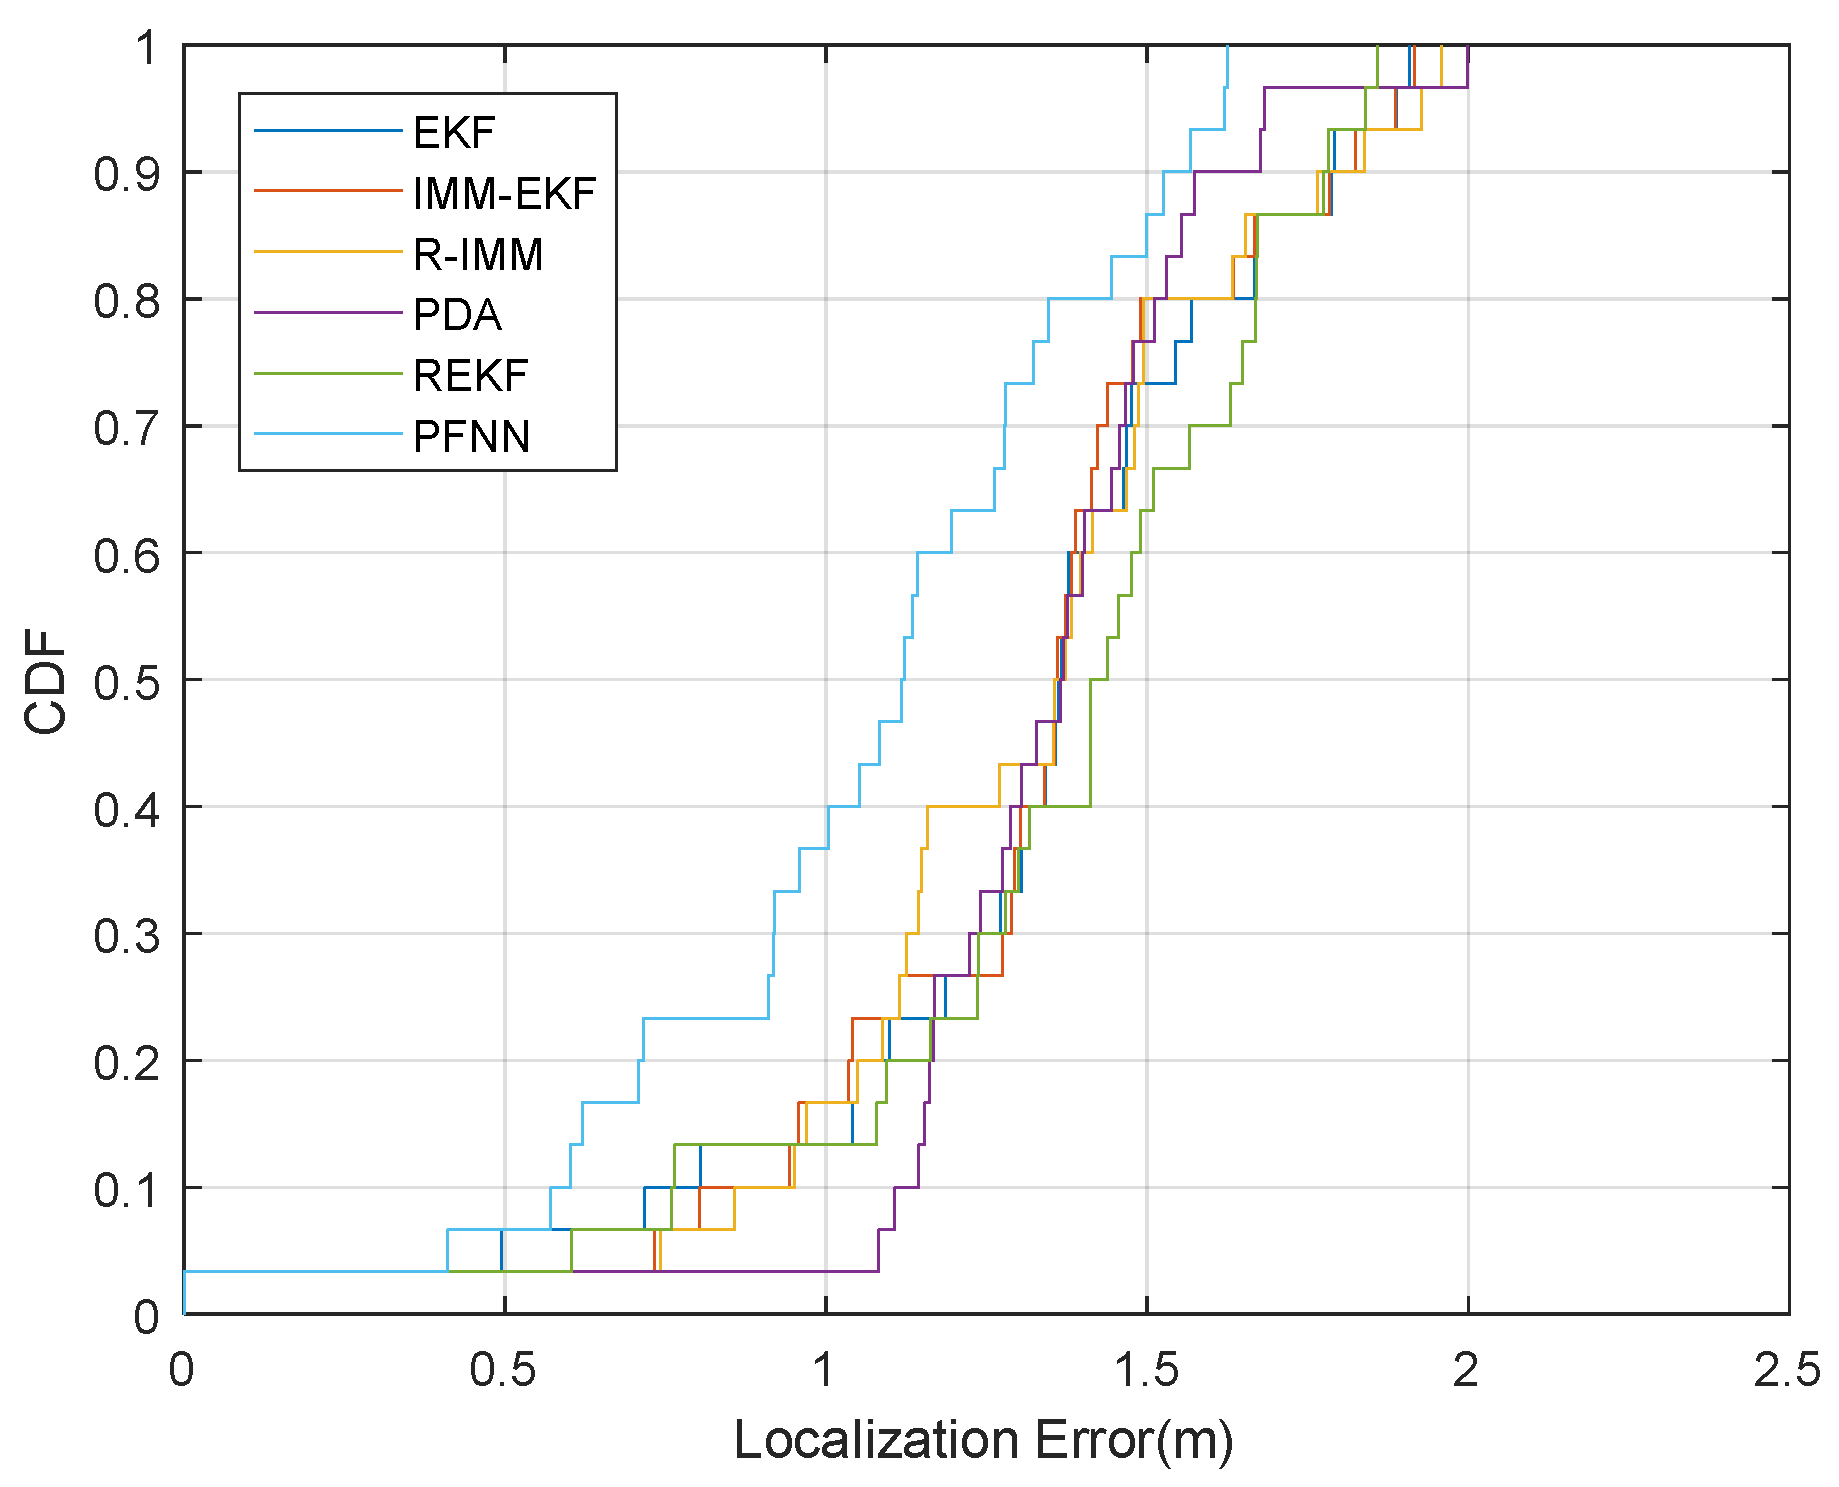
Figure 13 is the CDF of the localization error of the sampling point. The 90% localization error of EKF, IMM-EKF, R-IMM, PDA, REKF, and PFNN was about 1.79 m, 1.78 m, 1.77 m, 1.57 m, 1.77 m, and 1.53 m, respectively. In comparison, the proposed algorithm had the highest localization accuracy and good localization reliability.
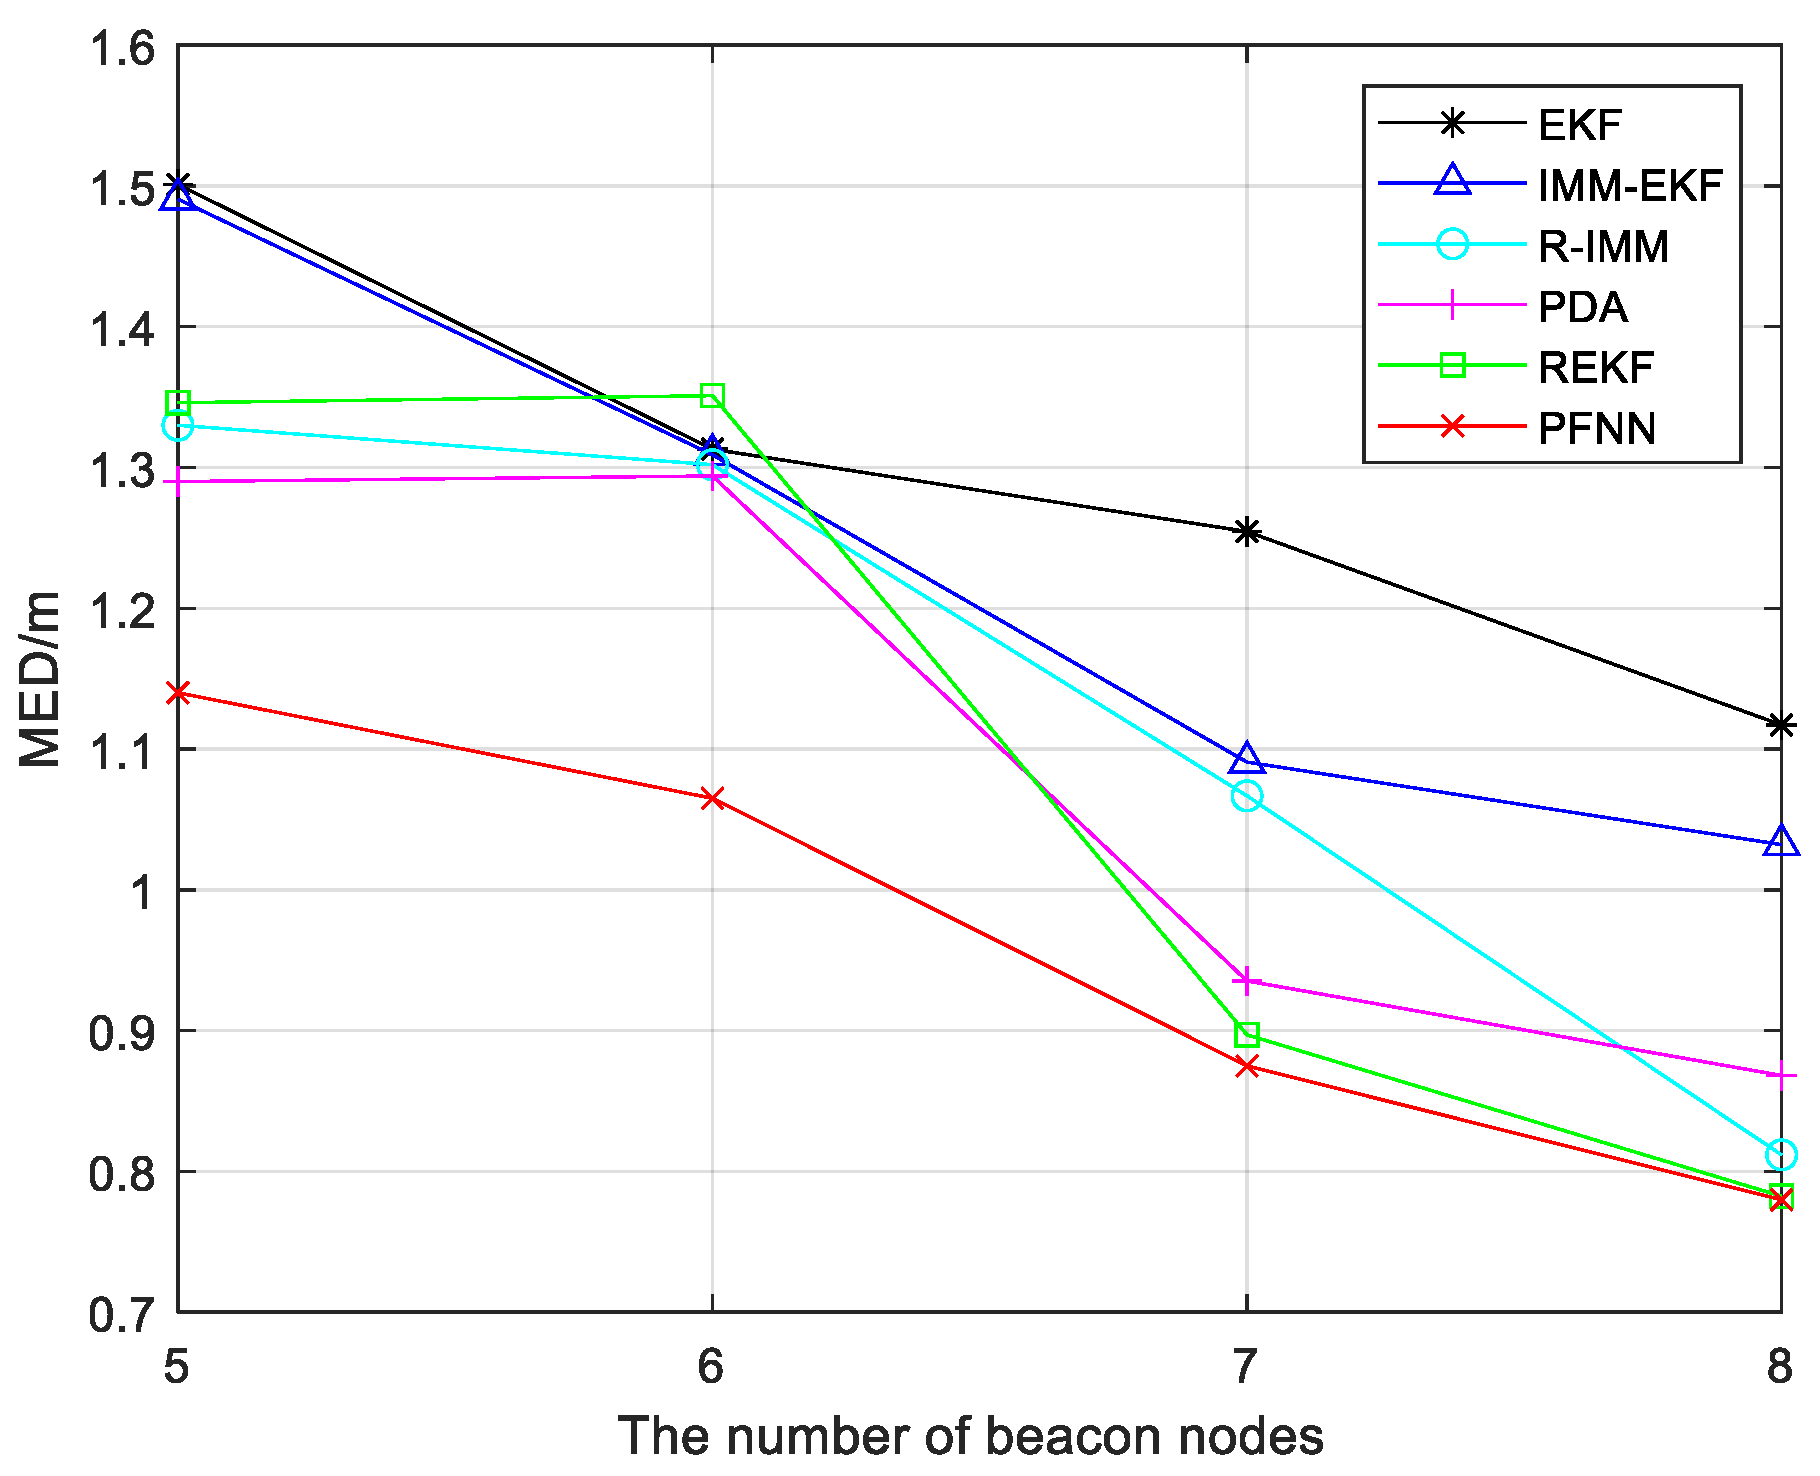
In order to further evaluate the localization effect of the proposed algorithm, we conducted more experiments in the experimental environment. We set the number of beacon nodes to vary from 5 to 8. It can be seen from
Figure 14 that the average localization error of the proposed algorithm was 0.96 m, and the average localization error of EKF, IMM-EKF, R-IMM, PDA, and REKF was 1.30 m,1.23 m,1.13 m,1.10 m, and 1.09 m, respectively. The average localization accuracy of the proposed algorithm was 26.15%, 21.95%, 15.04%, 12.73%, and 11.93% higher than that of EKF, IMM-EKF, R-IMM, PDA, and REKF, respectively. The experimental results showed that the proposed algorithm had better localization performance.
5. Conclusions
Because position sensing can provide a wide range of additional applications, the accurate localization of objects and human bodies is rapidly developing. At present, most localization techniques have good localization performance under LOS conditions. However, in the environment with NLOS information, how to achieve high-precision localization is always a difficult problem, because NLOS propagation will introduce positive errors into the distance estimation algorithm, thus affecting the performance of localization. In this study, a Bayesian framework-based improved nearest neighbor data association technique is suggested. First, the measured values were grouped to obtain a series of undetermined prediction position points, and the undetermined points were put into our set of verification gates for screening. Then, the particle filter was introduced to weight and redistribute the position estimation after screening, removing the NLOS-contaminated location estimation from consideration. Finally, the closest neighbor association method confirmed and weighted the proper position estimation group once again to provide superior position placement. The theoretical and experimental findings are consistent with this in both the LOS and NLOS circumstances. The suggested approach has strong localization dependability and much greater localization accuracy than EKF, IMM-EKF, R-IMM, PDA, and REKF. Next, we must strengthen the algorithm’s resilience and increase its placement accuracy in the presence of high NLOS error probabilities.
At present, the localization problem has only been studied in 2-dimensional space. In 3-dimensional space, if there is a NLOS environment, the situation becomes more complicated, which puts forward higher requirements for the localization algorithm. Most of the indoor three-dimensional space is flat, which is not conducive to radio localization, so three-dimensional space localization is an important direction of development. In this paper, only the TOA localization system was studied separately. In practical application, there are TDOA, RSS, AOA, and other localization systems as well as the fusion of multiple localization systems. The fusion algorithm of multiple localization systems is helpful to improve the robustness of the algorithm, but synchronization is difficult, so fusion algorithm research should be carried out in the future.
