Article

Analyzing Spatial Variations of Cloud Attenuation by a Network of All-Sky Imagers

by
Niklas Benedikt Blum
1,2,3,*,
Stefan Wilbert
1,
Bijan Nouri
1,
Jonas Stührenberg
2,
Jorge Enrique Lezaca Galeano
2,
Thomas Schmidt
2,
Detlev Heinemann
2,
Thomas Vogt
2,
Andreas Kazantzidis
4 and
Robert Pitz-Paal
3,5
1
Deutsches Zentrum für Luft- und Raumfahrt (DLR), Institut für Solarforschung, Paseo de Almería, 73, 2, E-04001 Almeria, Spain
2
DLR, Institut für Vernetzte Energiesysteme, Carl-von-Ossietzky-Straße 15, 26129 Oldenburg, Germany
3
Chair of Solar Technology, RWTH Aachen University, Linder Höhe, 51147 Köln, Germany
4
Laboratory of Atmospheric Physics, Department of Physics, University of Patras, 26500 Patras, Greece
5
DLR, Institut für Solarforschung, Linder Höhe, 51147 Köln, Germany
*
Author to whom correspondence should be addressed.
Remote Sens. 2022, 14(22), 5685; https://doi.org/10.3390/rs14225685
Submission received: 15 September 2022 / Revised: 3 November 2022 / Accepted: 8 November 2022 / Published: 10 November 2022
(This article belongs to the Special Issue Remote Sensing for Smart Renewable Cities)

Abstract

:
All-sky imagers (ASIs) can be used to model clouds and detect spatial variations of cloud attenuation. Such cloud modeling can support ASI-based nowcasting, upscaling of photovoltaic production and numeric weather predictions. A novel procedure is developed which uses a network of ASIs to model clouds and determine cloud attenuation more accurately over every location in the observed area, at a resolution of 50 m × 50 m. The approach combines images from neighboring ASIs which monitor the cloud scene from different perspectives. Areas covered by optically thick/intermediate/thin clouds are detected in the images of twelve ASIs and are transformed into maps of attenuation index. In areas monitored by multiple ASIs, an accuracy-weighted average combines the maps of attenuation index. An ASI observation’s local weight is calculated from its expected accuracy. Based on radiometer measurements, a probabilistic procedure derives a map of cloud attenuation from the combined map of attenuation index. Using two additional radiometers located 3.8 km west and south of the first radiometer, the ASI network’s estimations of direct normal (DNI) and global horizontal irradiance (GHI) are validated and benchmarked against estimations from an ASI pair and homogeneous persistence which uses a radiometer alone. The validation works without forecasted data, this way excluding sources of error which would be present in forecasting. The ASI network reduces errors notably (RMSD for DNI 136 W/m 2 , GHI 98 W/m 2 ) compared to the ASI pair (RMSD for DNI 173 W/m 2 , GHI 119 W/m 2 and radiometer alone (RMSD for DNI 213 W/m 2 ), GHI 140 W/m 2 ). A notable reduction is found in all studied conditions, classified by irradiance variability. Thus, the ASI network detects spatial variations of cloud attenuation considerably more accurately than the state-of-the-art approaches in all atmospheric conditions.

Graphical Abstract

1. Introduction

Short-term forecasts of the solar resource for lead times of up to six hours ahead (i.e., nowcasts) can be of interest to plan and compensate local fluctuations of the photovoltaic (PV) production in electric power grids [1,2,3,4,5]. Additionally, a nowcast of the spatial distribution of solar irradiance and cloud attenuation for the forecast instance time (i.e., an analysis) may be of interest to support numerical weather prediction (NWP) models [6], satellite-based nowcasts [7] and to upscale the production of distributed PV installations [8].
Timeseries-based nowcasts typically require a ground-based radiometer. Their accuracy decreases rapidly with the distance of the nowcasted location from the radiometer and with the forecast lead time, in particular in more variable conditions [9]. Based on satellites, nowcasts can be provided with a spatial resolution down to 0.5 km 2 at a sampling time of 5 min [10]. If a nowcast of higher temporal and spatial resolution is available, this may allow for capturing fluctuations which are relevant for distribution grids and to compensate imbalances in the fluctuating energy supply and demand in real time on a local scale. This is expected to avoid investments into grid infrastructure [11,12,13]. Corresponding regulatory incentives have already been implemented e.g., in Switzerland [14]. Various studies have investigated strategies to increase the self-sufficiency of neighborhoods and local communities [15,16,17,18] or to reduce the stress on the local grid infrastructure [19].
All-sky-imager- (ASI-) based nowcasts can have a spatial resolution of 5 m × 5 m and may cover lead times up to 25 min ahead in 1-min steps e.g., [20,21]. Systems based on up to four ASIs, located in proximity [22,23], have been validated practically. These nowcasts were used mainly to plan and optimize the production of solar power plants in which they were located. ASIs take images of the sky in which clouds are detected. The locations and velocities of the clouds are determined from image series and the clouds’ future positions are predicted. The radiative effect of clouds is modeled and finally irradiance is nowcasted. If more than one ASI is used or if cloud height is estimated with the help of external data, irradiance maps can be nowcasted for the ASIs’ vicinity.
The setup of state-of-the-art nowcasting systems allows accurate cloud observations only in a limited area. This limits the forecast domain, horizon and the accuracy towards higher lead times. Additionally, up to now, the overall accuracy of these nowcasting systems is only satisfying for certain applications e.g., [24].
In an urban distribution grid, a large number of small PV installations with a capacity of 20 kW or less can be spread over an area of e.g., 13 km × 12 km in the case of the German town Oldenburg. State-of-the-art ASI-based systems with up to four ASIs located at distances of typically less than 2.5 km [22,23] can be expected to bring increased deviations if the production of each installation in this large area needs to be nowcasted, see, e.g., [21]. A larger number of ASIs could therefore be distributed in such an urban area to achieve a higher accuracy. This suggests to use a combined evaluation which turns individual ASIs into an ASI network. An ASI network can be expected to increase the accuracy of cloud modeling as multiple perspectives on clouds are combined.
ASI networks have been used in the field of astronomy to monitor the night sky for example to locate and track fireballs [25,26] or to monitor the space weather [27]. To nowcast solar irradiance, a few ASI networks with up to 16 ASIs have been installed [28,29,30] or are planned [31].
The Eye2Sky ASI network [32] provides the experimental infrastructure for the present study. Eye2Sky is being set up in the region of Oldenburg. At present, Eye2Sky includes 29 stations distributed over an area of roughly 110 km × 100 km. Each station is equipped with an ASI. Nine of these stations are supported by rotating shadowband irradiometers (RSI) to provide direct normal (DNI), diffuse horizontal (DHI) and global horizontal irradiance (GHI) and measurements of ambient temperature and relative humidity. Eight ceilometers are included in the network. Six of these are operated by the meteorological service Deutscher Wetterdienst (DWD). Several PV plants and numerous smaller distributed PV installations are also present in the study area. In the urban area of Oldenburg, the network features a high density of 14 ASIs in an area of 13 km × 12 km.
First, studies have recently presented approaches to estimate solar irradiance or to model the atmosphere’s and clouds’ optical depth using ASI networks [28,30,33]. Chu et al. [30] used seven ASIs to estimate global, direct and diffuse irradiance pointwise at the ASIs’ locations. Instead of using a cloud modeling procedure, an irradiance map was estimated by Kriging interpolation. Mejia et al. [33] and Aides et al. [28] both followed an approach based on ray-tracing and tomographic reconstruction. These authors studied an ASI network either using simulated ASI images [33] or they presented experimental data to reconstruct an exemplary cloudy scene in a single timestamp [28]. The approach of the latter two studies accounts for the scattering processes in the atmosphere in a detailed and physically reasonable way.
This publication develops and validates a novel procedure to model the shape and optical properties of clouds and thus spatial variations of cloud attenuation by an ASI network. This procedure is intended to be applied to analyze and nowcast solar irradiance in an operational way. The ASI network approaches discussed previously [28,30,33] were not demonstrated in a practical nowcasting application. Because of the following considerations, we do not consider these approaches practical for that task. Chu et al. [30] essentially used the ASIs of their network as radiometers. Networks of radiometers have also been used in other previous studies to analyze and nowcast solar irradiance e.g., [34,35,36]. The ASIs’ potential to estimate spatial variations of cloud attenuation or solar irradiance on the ground beyond their application as radiometers was not tapped. We expect that this enhancement is important to analyze spatial variations of cloud attenuation more accurately. On the other hand, the tomographic approaches [28,33] were demonstrated only for specific conditions with a single cumulus cloud layer at a low cloud coverage. From the findings of these studies and others which followed voxel carving approaches [22], we conclude that the limited perspectives of ASIs monitoring clouds only from below and the high opacity of low layer clouds bring considerable challenges to tomographic reconstruction approaches. Consequently, in conditions with multiple cloud-layers or with a high cloud coverage, the functionality of these approaches may reduce noticeably. In a practical application and in particular in the Eye2Sky region’s climate, these cloud conditions are highly relevant. Additionally, high image quality is important for the tomographic approaches. Accordingly, in the previous studies, either ASIs equipped with a shadowband were evaluated for a single timestamp [28] or artificial, modeled images [33] were used as input. In the operational application pursued for Eye2Sky, lower image quality needs to be accepted as images of regular outdoor cameras need to be evaluated reliably at any timestamp and as the maintenance effort of the numerous cameras needs to be kept manageable. Under these conditions, especially, a beam irradiance incident on an ASI causes glare effects, complicating radiative transfer modeling [37,38,39]. Thus, instead of modeling clouds physically rigorously by tomography and radiative transfer, a more statistical approach is chosen.
We use previous operational cloud modeling procedures from the field of ASI-based nowcasting [22,23,40] as a basis for the present one. As a starting point, clouds are detected using the convolutional neural network (CNN) of [41], which was already used by a nowcasting system based on two ASIs [40]. However, in the present case, we use this method to also distinguish cloud types. The radiative transfer approaches [28,33] estimated cloud optical thickness based on pixel intensities in the ASI images. In contrast, the CNN also includes textural features of the ASI images to identify cloud classes, which indicate the clouds’ attenuation by a so-called attenuation index.
The cloud modeling procedures of [22,23,40] were only developed for up to four ASIs located in proximity and were not suited to combine the observations received from very different perspectives and with different accuracies. Compared to these approaches, the ASI network aims to mitigate errors in the cloud parameters derived from single ASIs more effectively. From the principles of error propagation, it is expected that multiple observations, i.e., maps of cloud properties, merged by accuracy-based averaging, are significantly more accurate than the most accurate of those observations alone. An accuracy-weighted average was previously used to combine analysis and nowcasted irradiance from satellites with ASI-based data and/or ground-based measurements [42,43]. Analogously, this approach is applied here to combine observations from the independent ASIs. The approach requires information on the uncertainty of the observations to be merged. The ASI observations’ uncertainties are estimated based on the result of previous validations of ASI-based systems [21,41,44,45,46].
After combining the observations from multiple ASIs, the attenuation index is expected to be a good indicator of cloud attenuation. As the used CNN can only differentiate sky and three classes of clouds and as there are still sources of error present in the procedure, a ground-based DNI measurement is included to estimate the final map of cloud attenuation by a statistical procedure. A similar statistical procedure which estimated cloud transmittance was developed in [47]. However, in the present case, we avoid a number of shortcomings. In particular, our procedure does not rely on cloud height information which is subject to errors and which is only available at rather coarse resolution. Due to this and as our method avoids a discretization of the observations, we can resolve variations of cloud attenuation in a much more graduated way. Finally, our cloud modeling procedure is validated comparing our estimations directly to those of two state-of-the-art analysis systems described by [40]. While the merging procedure can be adapted for various parameters related to clouds such as cloud velocity and DHI, attenuation index and derived cloud attenuation are the focuses in this study.
This publication is structured as follows: Section 2 introduces the experimental setup and datasets. Section 3 first introduces the reference analysis approaches and then develops the ASI network’s cloud modeling procedure. In Section 4, the new method is validated using ground-based RSIs providing DNI and with it the clear sky index of DNI ( k D N I * ) as well as GHI. Furthermore, the method is benchmarked against an ASI pair’s estimation as well as against a homogeneous persistence analysis of DNI and GHI derived from an RSI alone. Finally, Section 5 discusses the experimental findings and concludes the study.

2. Materials

The Eye2Sky ASI network was still under construction in the year 2020 when the experimental work of this research was conducted. Due to the ongoing extension and temporary outages, the number of available ASIs changed during the period of the experimental work. A maximum of 12 operational ASIs was achieved in the urban area of Oldenburg. This area is shown in Figure 1 and covers roughly 13 km × 12 km.
The all-sky imagers (ASIs) of Eye2Sky are surveillance cameras of type Mobotix Q25 6MP color version [48] with a fisheye lens providing 180 field of view. This camera model has been used in previous studies on ASI-based nowcasting e.g., [20]. Furthermore, the predecessor model of this ASI type, Mobotix Q24 3MP color version has been used in prior studies for ASI-based nowcasting [22,49,50], sky condition monitoring [51,52] and to estimate solar irradiance [37,49].
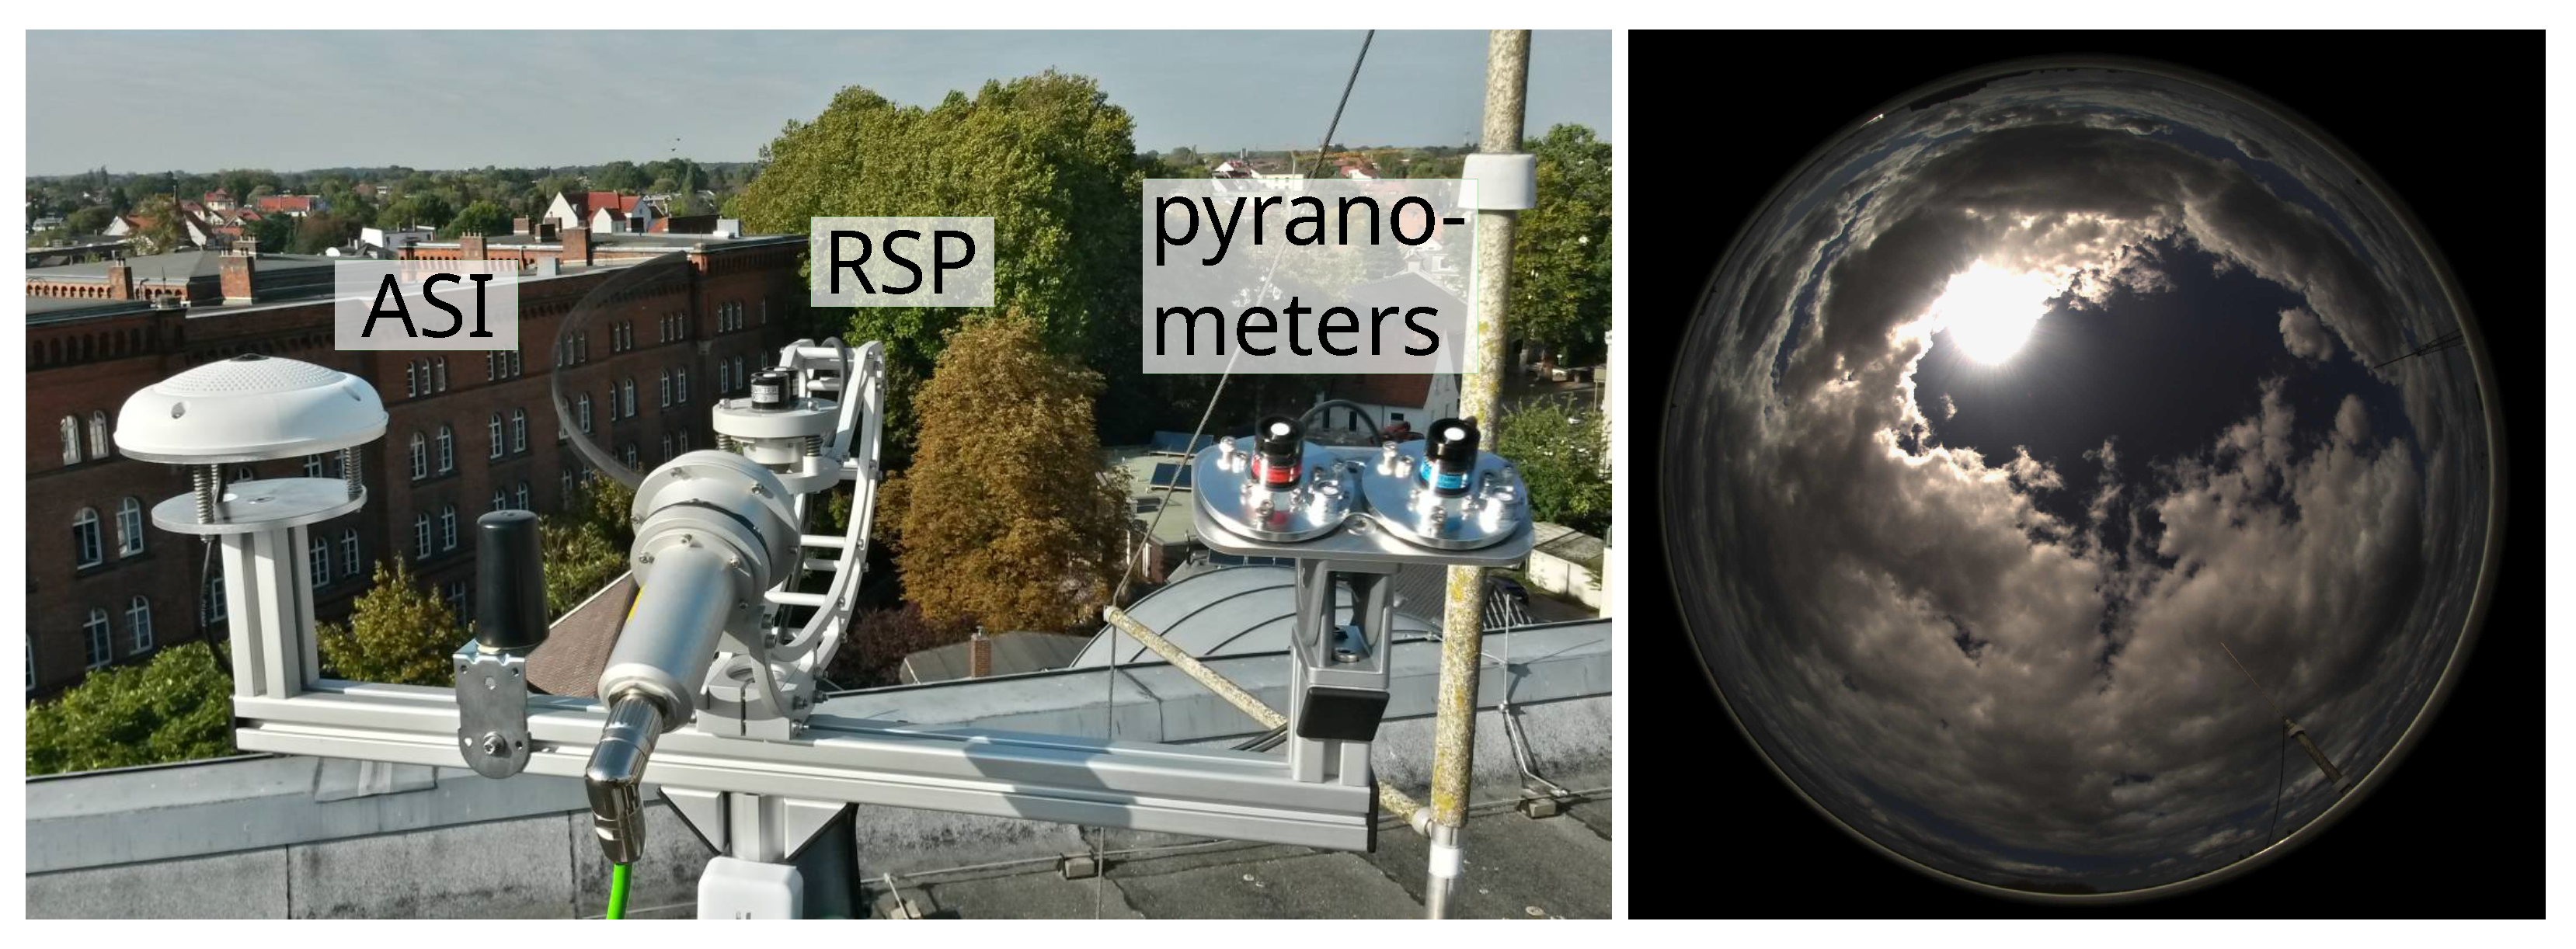
Exemplarily, Figure 2 shows the ASI at station DON (left) and an image from ASI DON (right). The ASIs record an image every half and full minute. Further details on the exposure and other camera settings are described by Blum et al. [37,53]. Each ASI was calibrated geometrically by an intrinsic calibration which describes a fisheye camera’s image distortion and by the ASI’s external orientation. The ASIs’ intrinsic calibrations were determined by the procedure of Scaramuzza et al. [54]. The ASIs’ locations defined by latitude, longitude and altitude were identified in geolocated satellite images which were available in Google Maps [55]. Altitude was estimated based on the local altitude of the ground and the stations’ height over ground. The cameras’ external orientation was determined as described by Blum et al. [37].

2.1. Reference Measurements of Solar Irradiance

Three meteorological stations DON, UOL and CLO are equipped with rotating shadowband irradiometers (RSI) and measurements of relative humidity and dry bulb temperature. The locations of these stations are shown in Figure 1 and listed in Table 1. Figure 2 (left) exemplarily shows the RSI at DON. The RSIs are of the type CSPS Twin-RSI [56]. The measurement accuracy of this instrument type was evaluated by Forstinger et al. [57]. Each radiometer station provides measurements of GHI, DHI and DNI.
Only the measurements of RSI DON are used as input to estimate DNI, DHI and GHI. UOL and CLO are reserved for validations. This holds for all estimations tested in this study. UOL and CLO are located at a distance of 3.8 km to the west and to the south of DON, respectively. The locations of DON, UOL and CLO represent the central and the peripheral parts of the urban area. These stations are therefore interesting to evaluate the ASI network’s ability to predict variations of DNI and GHI within the urban area.
All radiometric measurements were quality controlled with a method described by Geuder et al. [58]. Automatic filters were applied to guide the expert during the inspection. Measurements of the RSIs were corrected and calibrated as described by Geuder et al. [59]. To improve the homogeneity of the readings from the three RSIs, this calibration was modified by a relative calibration on-site based on selected clear-sky periods. In the calibrations and evaluations, the air mass correction function used by Geuder et al. [59] was omitted. Thus, the applied correction increases the irradiance measurements by 0.6% compared to the original correction at a sun elevation of 15° and has a smaller effect at larger sun elevations. As the present evaluation is limited to sun elevations of at least 15°, the effect is small compared to the expected errors of the analysis approaches. Furthermore, the applied calibration removes a possible bias which could be introduced by the influence of air mass.

2.2. Atmospheric Conditions and Datasets

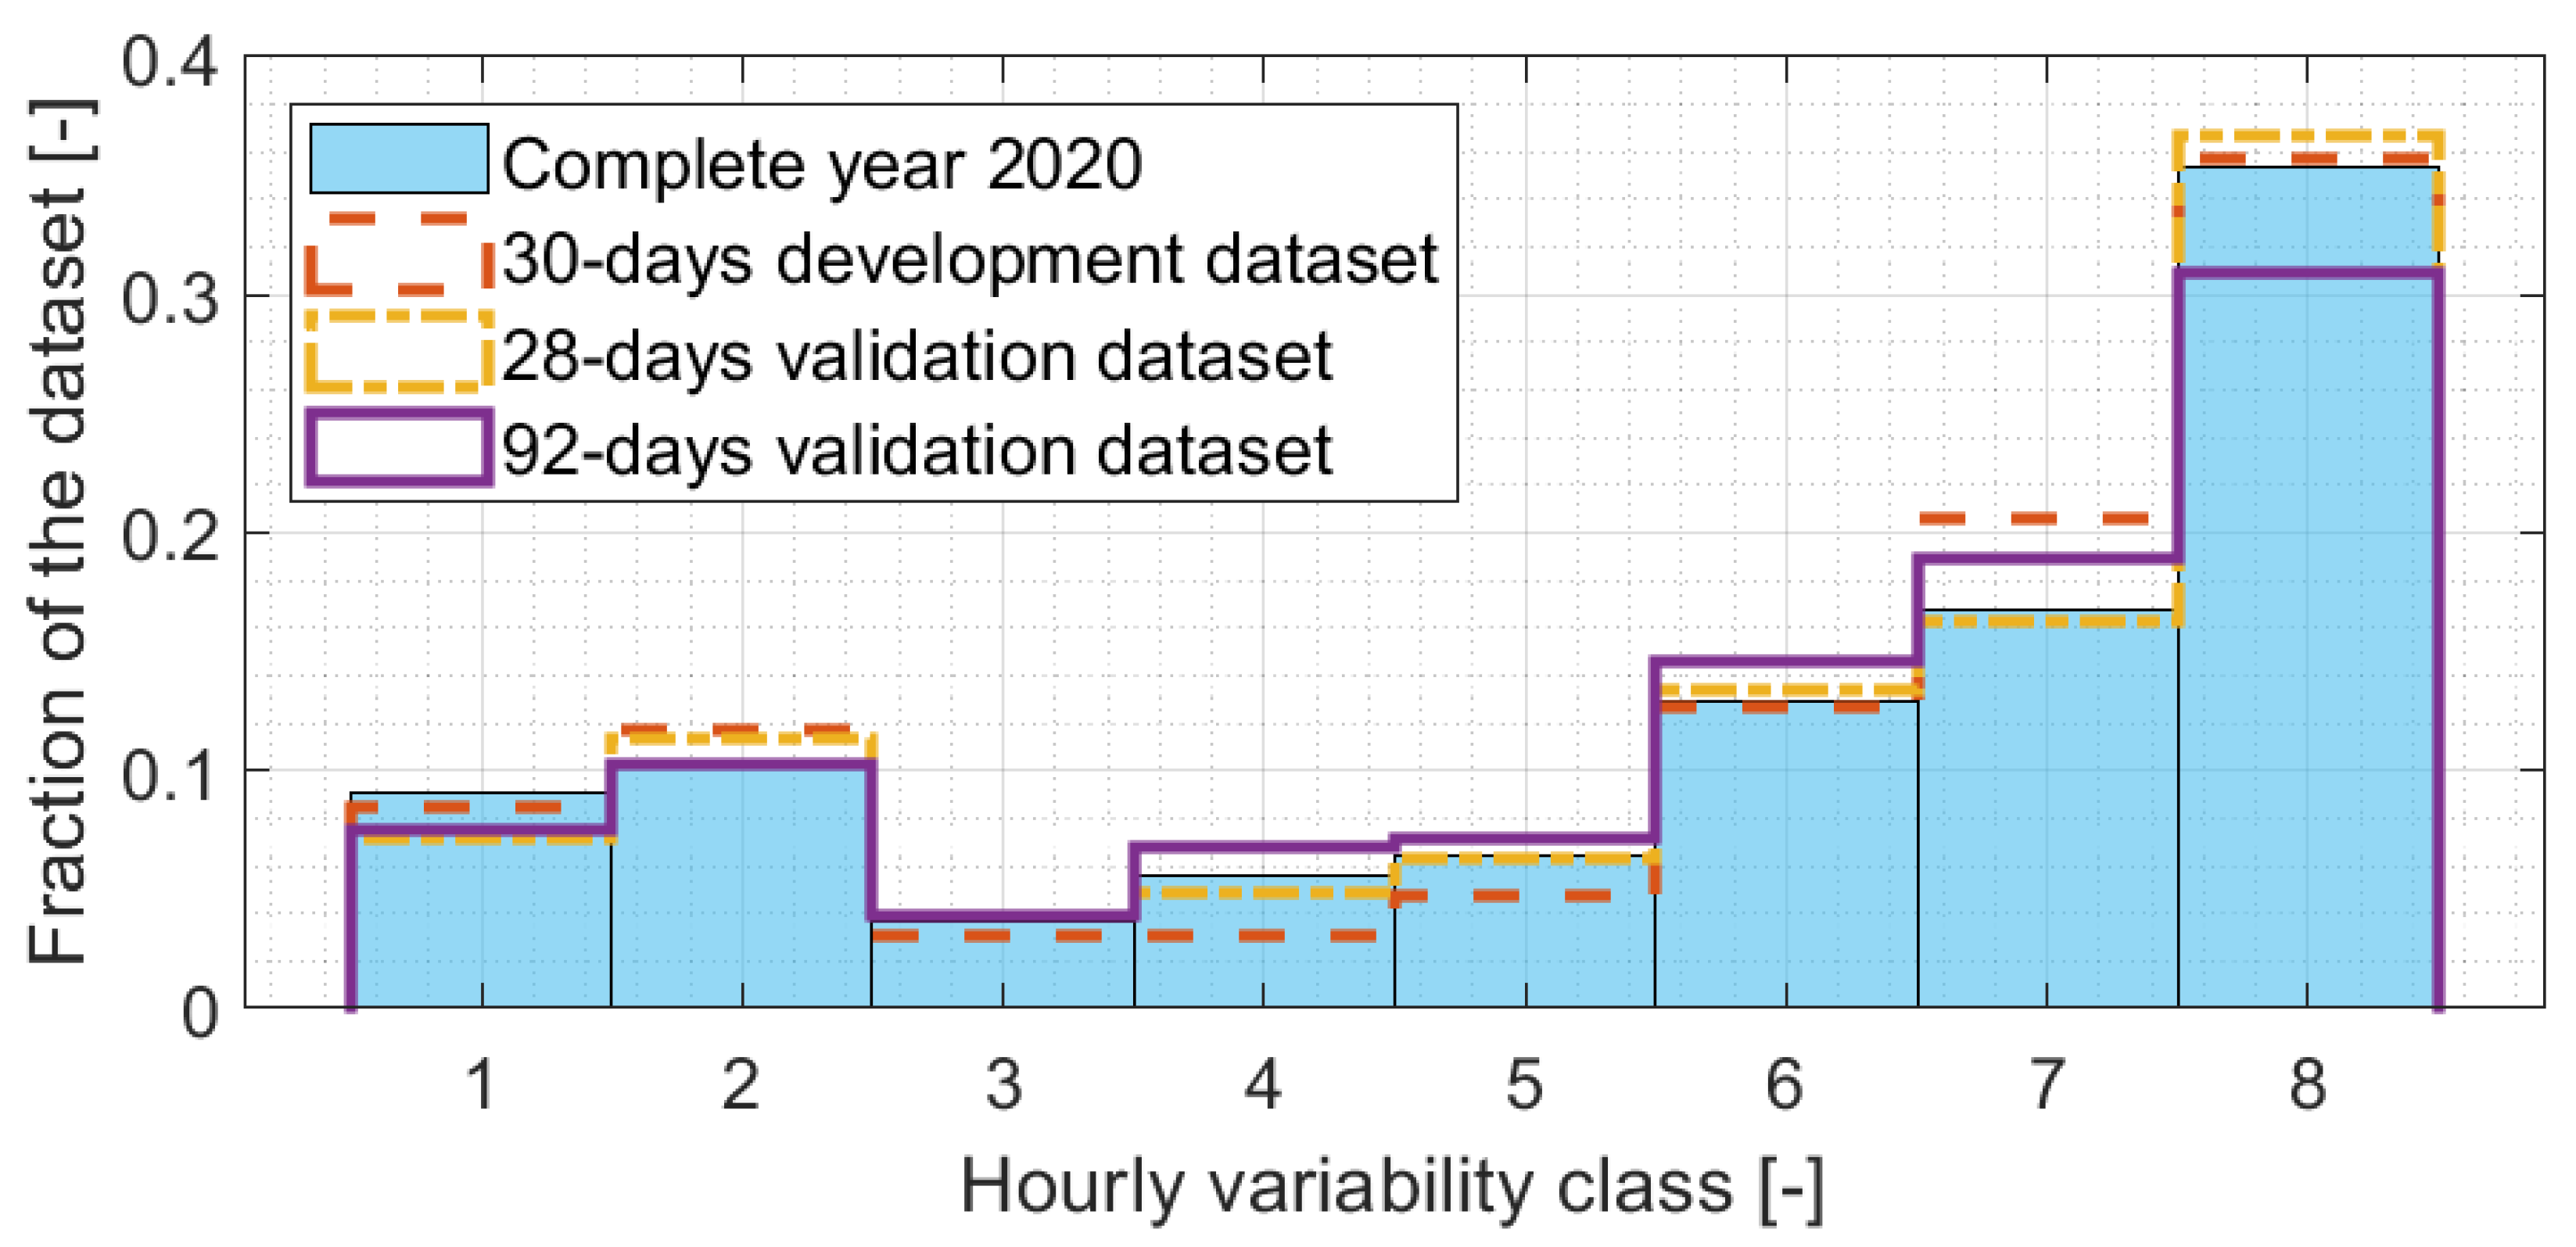
The atmospheric conditions in Oldenburg are evaluated to investigate the analysis approaches’ performance under different conditions. DNI measurements of RSI DON are used as input to calculate hourly DNI variability classes, by the procedure of Schroedter-Homscheidt et al. [60], for the whole year 2020. Table 2 provides a short description for each of the eight classes. The evaluation is restricted to times with a sun elevation of at least 15 . Lower sun elevations are expected to be less relevant for solar energy applications as they contribute a small share of the annual energy yield. Low sun elevations would affect the accuracy of the classification and can lead to increased errors of the ASI-based systems as the image areas close to the sun would be affected by lens distortion. Figure 3 shows the relative frequencies of the eight variability classes in the year 2020 (blue solid bars). Variability classes 6–8 are the most frequent ones and represent 65 % of the evaluated hours. These classes indicate a high degree of cloud coverage. In total, 35 % of the dataset belong to variability class 8. This means overcast is the most relevant sky condition at the site. Thus, the ASI-based system is required to perform robustly under conditions with a high cloud coverage. For the more variable classes 3, 4, 6 and 7, highly resolved analyses of GHI are of particular relevance. Around 39 % of the hours belong to these classes.
The year 2020 is used as measurement period to evaluate estimations of DNI and GHI. To be able to use separate datasets for model development and validation and also to keep the computation time moderate, only subsets of the whole annual dataset are evaluated. Three datasets are defined. The 30-days development dataset is used for estimations which provide a feedback for the model development. The 28-days validation dataset is used for a part of the validations if a smaller dataset is considered to be sufficient. The 92-days validation dataset is used for most validations presented in this study. Each of these datasets contains full days. As shown in Figure 3, each of these datasets was assembled to represent the DNI variability classes with similar relative frequencies as found for the dataset of the whole year 2020.
For the 30-days development dataset, roughly every 11th day of the months January to November 2020 was used. Consecutively, single days were exchanged if a reference station had an outage on a day and until the variability classes were represented by the dataset as intended. The days contained in the 28-days validation dataset are usually the days which follow those days of the 30-days development dataset. Again, single days were exchanged in the case of outages and to better represent the variability classes. The 92-days validation dataset contains all days of the 28-days validation dataset and usually the two days which follow a day of the 28-days validation dataset. As before, single days were removed or exchanged for the reasons given above. The individual dates contained in each dataset are listed in Appendix D.

3. Methods

This section presents the methods used in this publication. The ASI network’s cloud modeling procedure is developed. Furthermore, the state-of-the-are analysis approaches are introduced which are used as the basis of the model development and later as reference estimations to benchmark the ASI network against. Our development and validation focus on cloud modeling and not on forecasting. Therefore, only a lead time of 0 min (i.e., analysis) is investigated. Forecasts (i.e., predictions with lead times greater than 0 min) would contain errors related to the motion and temporal evolution of clouds. Therefore, a validation based on forecast data would be less suited to compare the deviations of cloud modeling approaches.

3.1. Reference Analysis Approaches

The state-of-the-art analysis based on an ASI pair [40] is the starting point of the developments in this study. Nouri et al. [40] additionally present a hybrid nowcast which is not used in this study as it is expected to bring a very limited advantage if only analysis data are evaluated.
The ASIs for the ASI pair were selected in a trade-off between multiple aspects. Firstly, one of the ASIs should be located right next to an RSI as measurements of DNI, DHI, relative humidity and dry bulb temperature are required as inputs to this system. A small camera distance is preferred as cloud base height (CBH) is rather low for most timestamps at this site [53]. Additionally, both ASIs should have a mostly free field of view up to a zenith angle of 78 . Based on these considerations, ASIs DON and FLE were selected to form the ASI pair DON-FLE. The location of these ASI is shown in Figure 1. The camera distance is 1.4 km. RSI DON is located directly next to ASI DON and supports the ASI pair with the required measurements. As desired, the fields of view of both ASIs are mostly free. The analysis of ASI pair DON-FLE is generated as follows.
The convolutional neural network (CNN) of Fabel et al. [41] detects cloudy pixels in the images from the ASIs DON and FLE. The stereoscopic approach of Nouri et al. [45] evaluates a series of three images from both ASIs and measures cloud motion vectors (CMVs) and CBH by cross-correlation of features in the red-channel images. Cloudy pixels observed from the ASIs’ perspectives are compared, and CBH is considered to model clouds as three-dimensional objects [22]. Ray tracing [47] yields the corresponding position of a cloud shadow on the ground. This way, a shadow map is estimated and, for each shaded grid cell, the shading cloud object is known. The radiative effect of clouds is modeled to assign DNI. From recent measurements of DNI, periods are rejected in which the DNI timeseries indicate that the RSI is shaded by a cloud [47]. From the remaining measurements, Linke turbidity as well as present and future clear sky DNI are derived. A probabilistic procedure determines the transmittance of each cloud object based on recent and historic data pairs of CBH and DNI [47]. The shadow map is transformed into a DNI map. The DNI in a grid cell is determined as the product of clear sky DNI and the transmittance of the shading cloud object, if applicable. DHI is assumed to be spatially homogeneous and persistent. The estimated DNI map together with the DHI measured at forecast instance time at DON yield a GHI map.
Homogeneous persistence will be used as a further reference approach to analyze irradiance maps. Homogeneous persistence uses a point-wise ground-based measurement of GHI and DNI and assigns the same value of GHI and DNI to all grid cells in the maps of GHI and DNI.

3.2. Development of the ASI Network’s Cloud Modeling Procedure

The ASI network’s cloud modeling procedure relies on up to twelve ASIs which are placed at distinct points in and around Oldenburg. As a starting point, sky images are segmented, undistorted, georeferenced and transformed into maps of attenuation index. The attenuation index is introduced as a parameter which indicates the presence and the expected attenuation of a potential cloud for each grid cell. As shown in Table 3, cloud classes are provided by the segmentation procedure for each image pixel of an individual ASI. These five cloud classes are mapped to one of five values of attenuation index which range between zero and one (see Table 3). The sources of uncertainty in the maps of the attenuation index are determined. Based on the local uncertainty of the single ASIs’ maps of the attenuation index, the merging procedure assigns a weight to the grid cell of each map and averages the weighted maps. Consecutively, a statistical procedure is applied to self-calibrate the relationship between the attenuation index and cloud attenuation. The remainder of this section describes these steps in more detail.

3.2.1. Cloud Classification and Cloud Mapping

The ASI network’s cloud modeling procedure requires a reliable cloud segmentation as input. In total, three of the cloud segmentation approaches [41,61,62] were tested for the site. In particular, a four-dimensional clear sky library (CSL) and a convolutional neural network (CNN) were seen as potentially useful approaches.
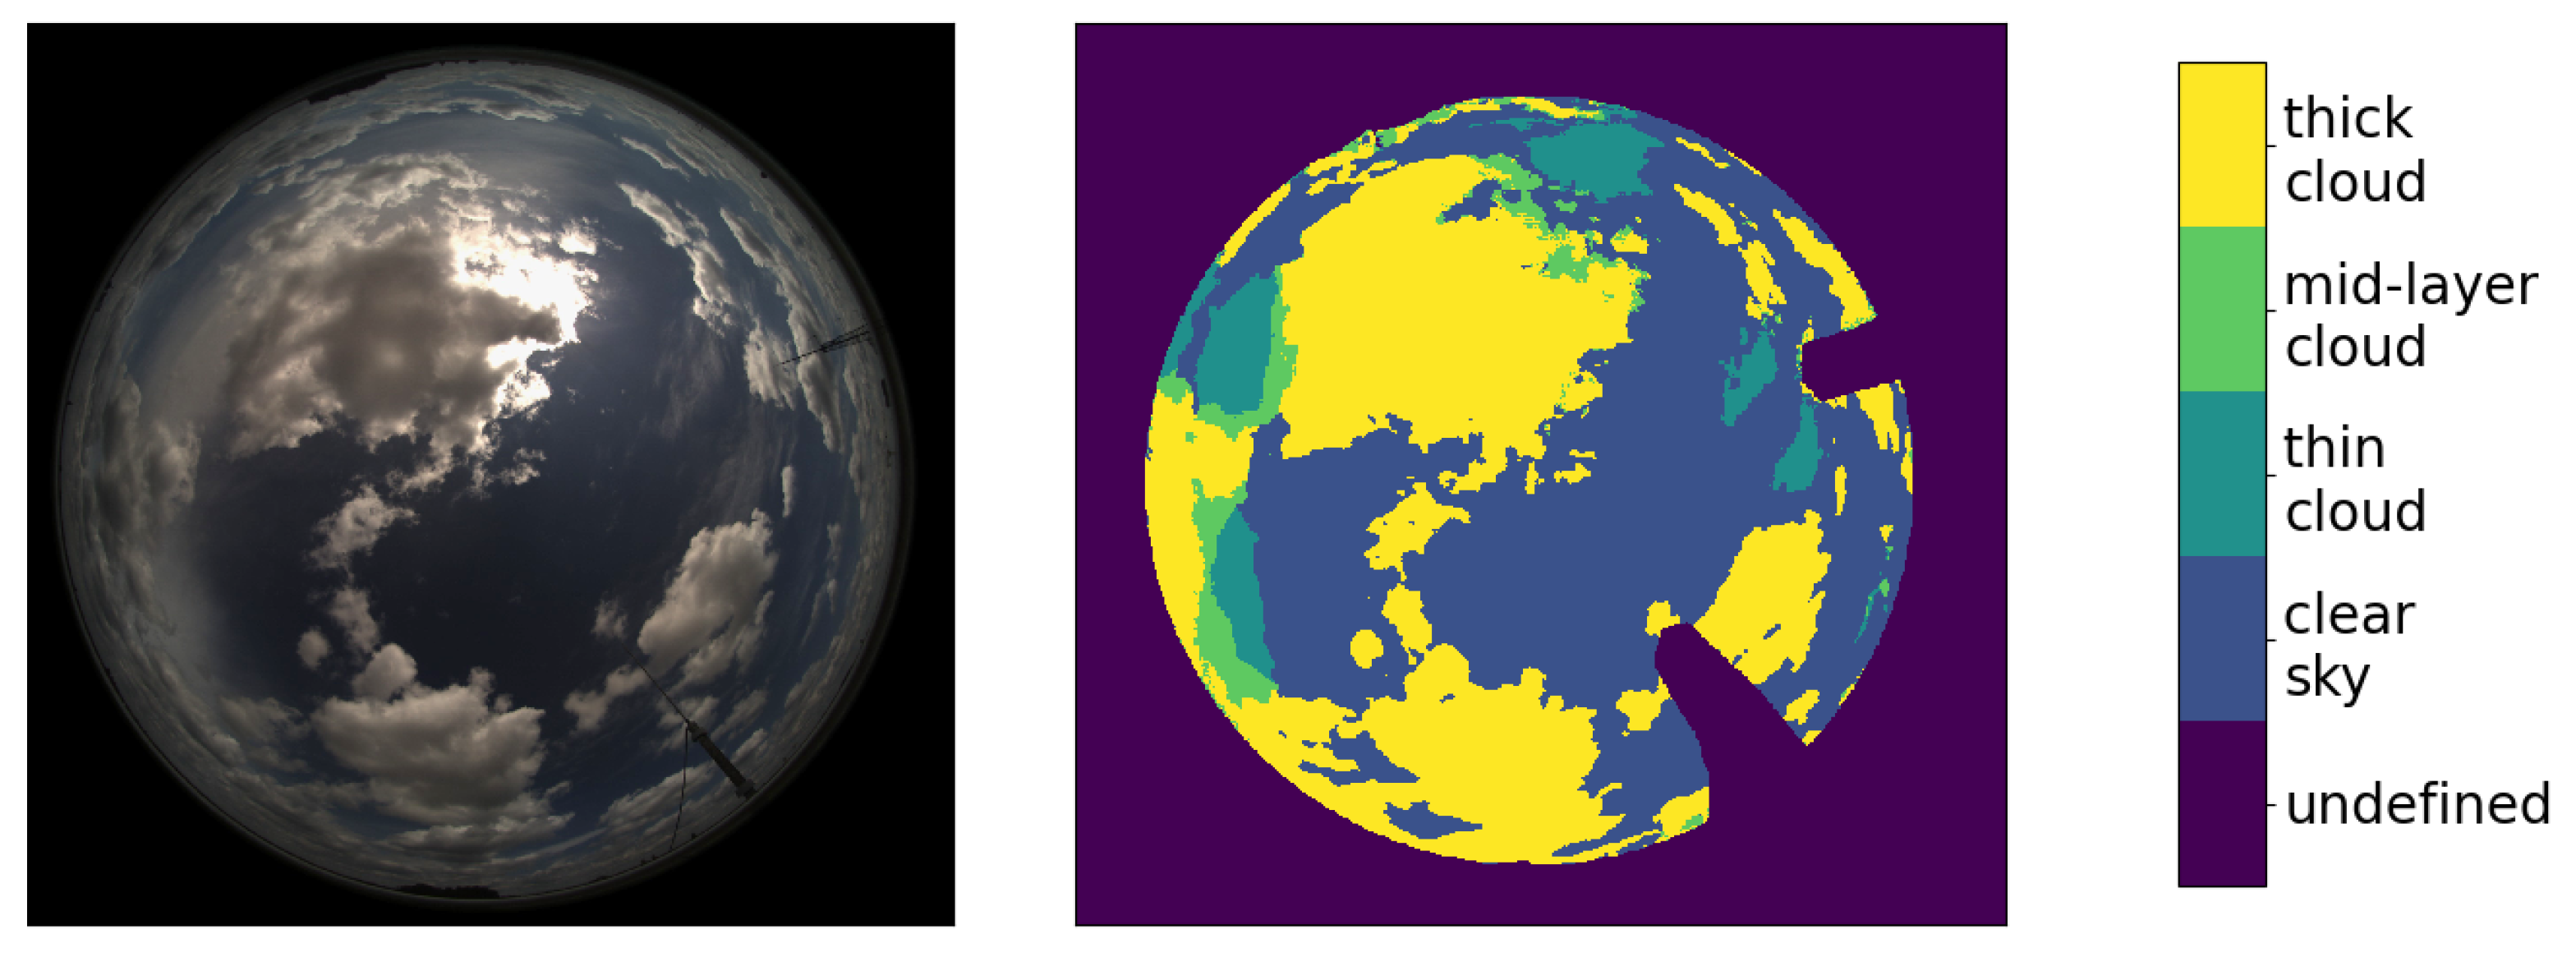
The CNN of Fabel et al. [41] represents a rather new segmentation approach. Own evaluations for the site Oldenburg qualitatively confirmed the high accuracy reported in the literature for the CNN in a different climate [41]. The CNN performed robustly under all relevant conditions. In very dark scenes, typically related to an overcast sky, the CNN’s performance was only slightly worse than under the remaining conditions. Soiling occasionally led to the faulty recognition of optically thin clouds. This is acceptable for the cloud modeling approach presented here, as these faultily detected clouds will be assigned a low attenuation. Due to these favorable test results and as the CNN allows for distinguishing cloud types, it is selected to provide the cloud segmentation for the ASI network. Unlike most prior cloud modeling approaches, the novel cloud modeling procedure will incorporate ASI-image-based cloud types as an indicator of cloud attenuation. Figure 4 shows an exemplary raw image of ASI DON (left) and the detected cloud types (right).
Up to this point, the cloud segmentation is given in the coordinate system of each ASI image. Using the known location of the ASI and with the geometrical calibrations, described in Section 2, each pixel of the segmented ASI image is projected onto a map, which represents a bottom view of the detected clouds. The height over ground of this map is fixed to the local CBH which may vary spatially. CBH is estimated by the technique presented by Blum et al. [53]. These maps and all other maps of parameters derived from the ASI network use a single coordinate system and a spatial resolution of 50 m × 50 m.
Based on the cloud segmentation, each of the map’s grid cells belongs to one of five classes listed in Table 3 (left column). This classification is converted into a floating scale ranging between zero and one, which is referred to as attenuation index A I in this study. The parameter A I is assigned to the five cloud classes as shown in Table 3 (right column). Each value of A I is chosen to indicate roughly which attenuation A is expected for the respective cloud class. However, the relationship of A I and A is superimposed by various errors, which are present in the ASI-based maps of A I .

3.2.2. Merging Maps of Attenuation Index

The merging operation applied to the maps of attenuation index, i.e., A I i , from independent ASIs is introduced in the following. The georeferenced map of A I i received from each ASI i is weighted by the inverse of the uncertainty u i , x , y of the respective map. The uncertainty u i , x , y is estimated in Appendix A. This weighting is referred to as accuracy weighting and corresponds with the one used by Meyer et al. [42]. The weighted maps are averaged to receive the merged map A I m e r g e d of the parameter:
A I m e r g e d , x , y = i = 1 N A I i , x , y · u i , x , y 1 j = 1 N u j , x , y 1 .
The subscript x , y in Equation (1) indicates that the merging operation is applied for each grid cell ( x , y ) independently, based on the specific values of A I i , x , y , u i , x , y for that grid cell.
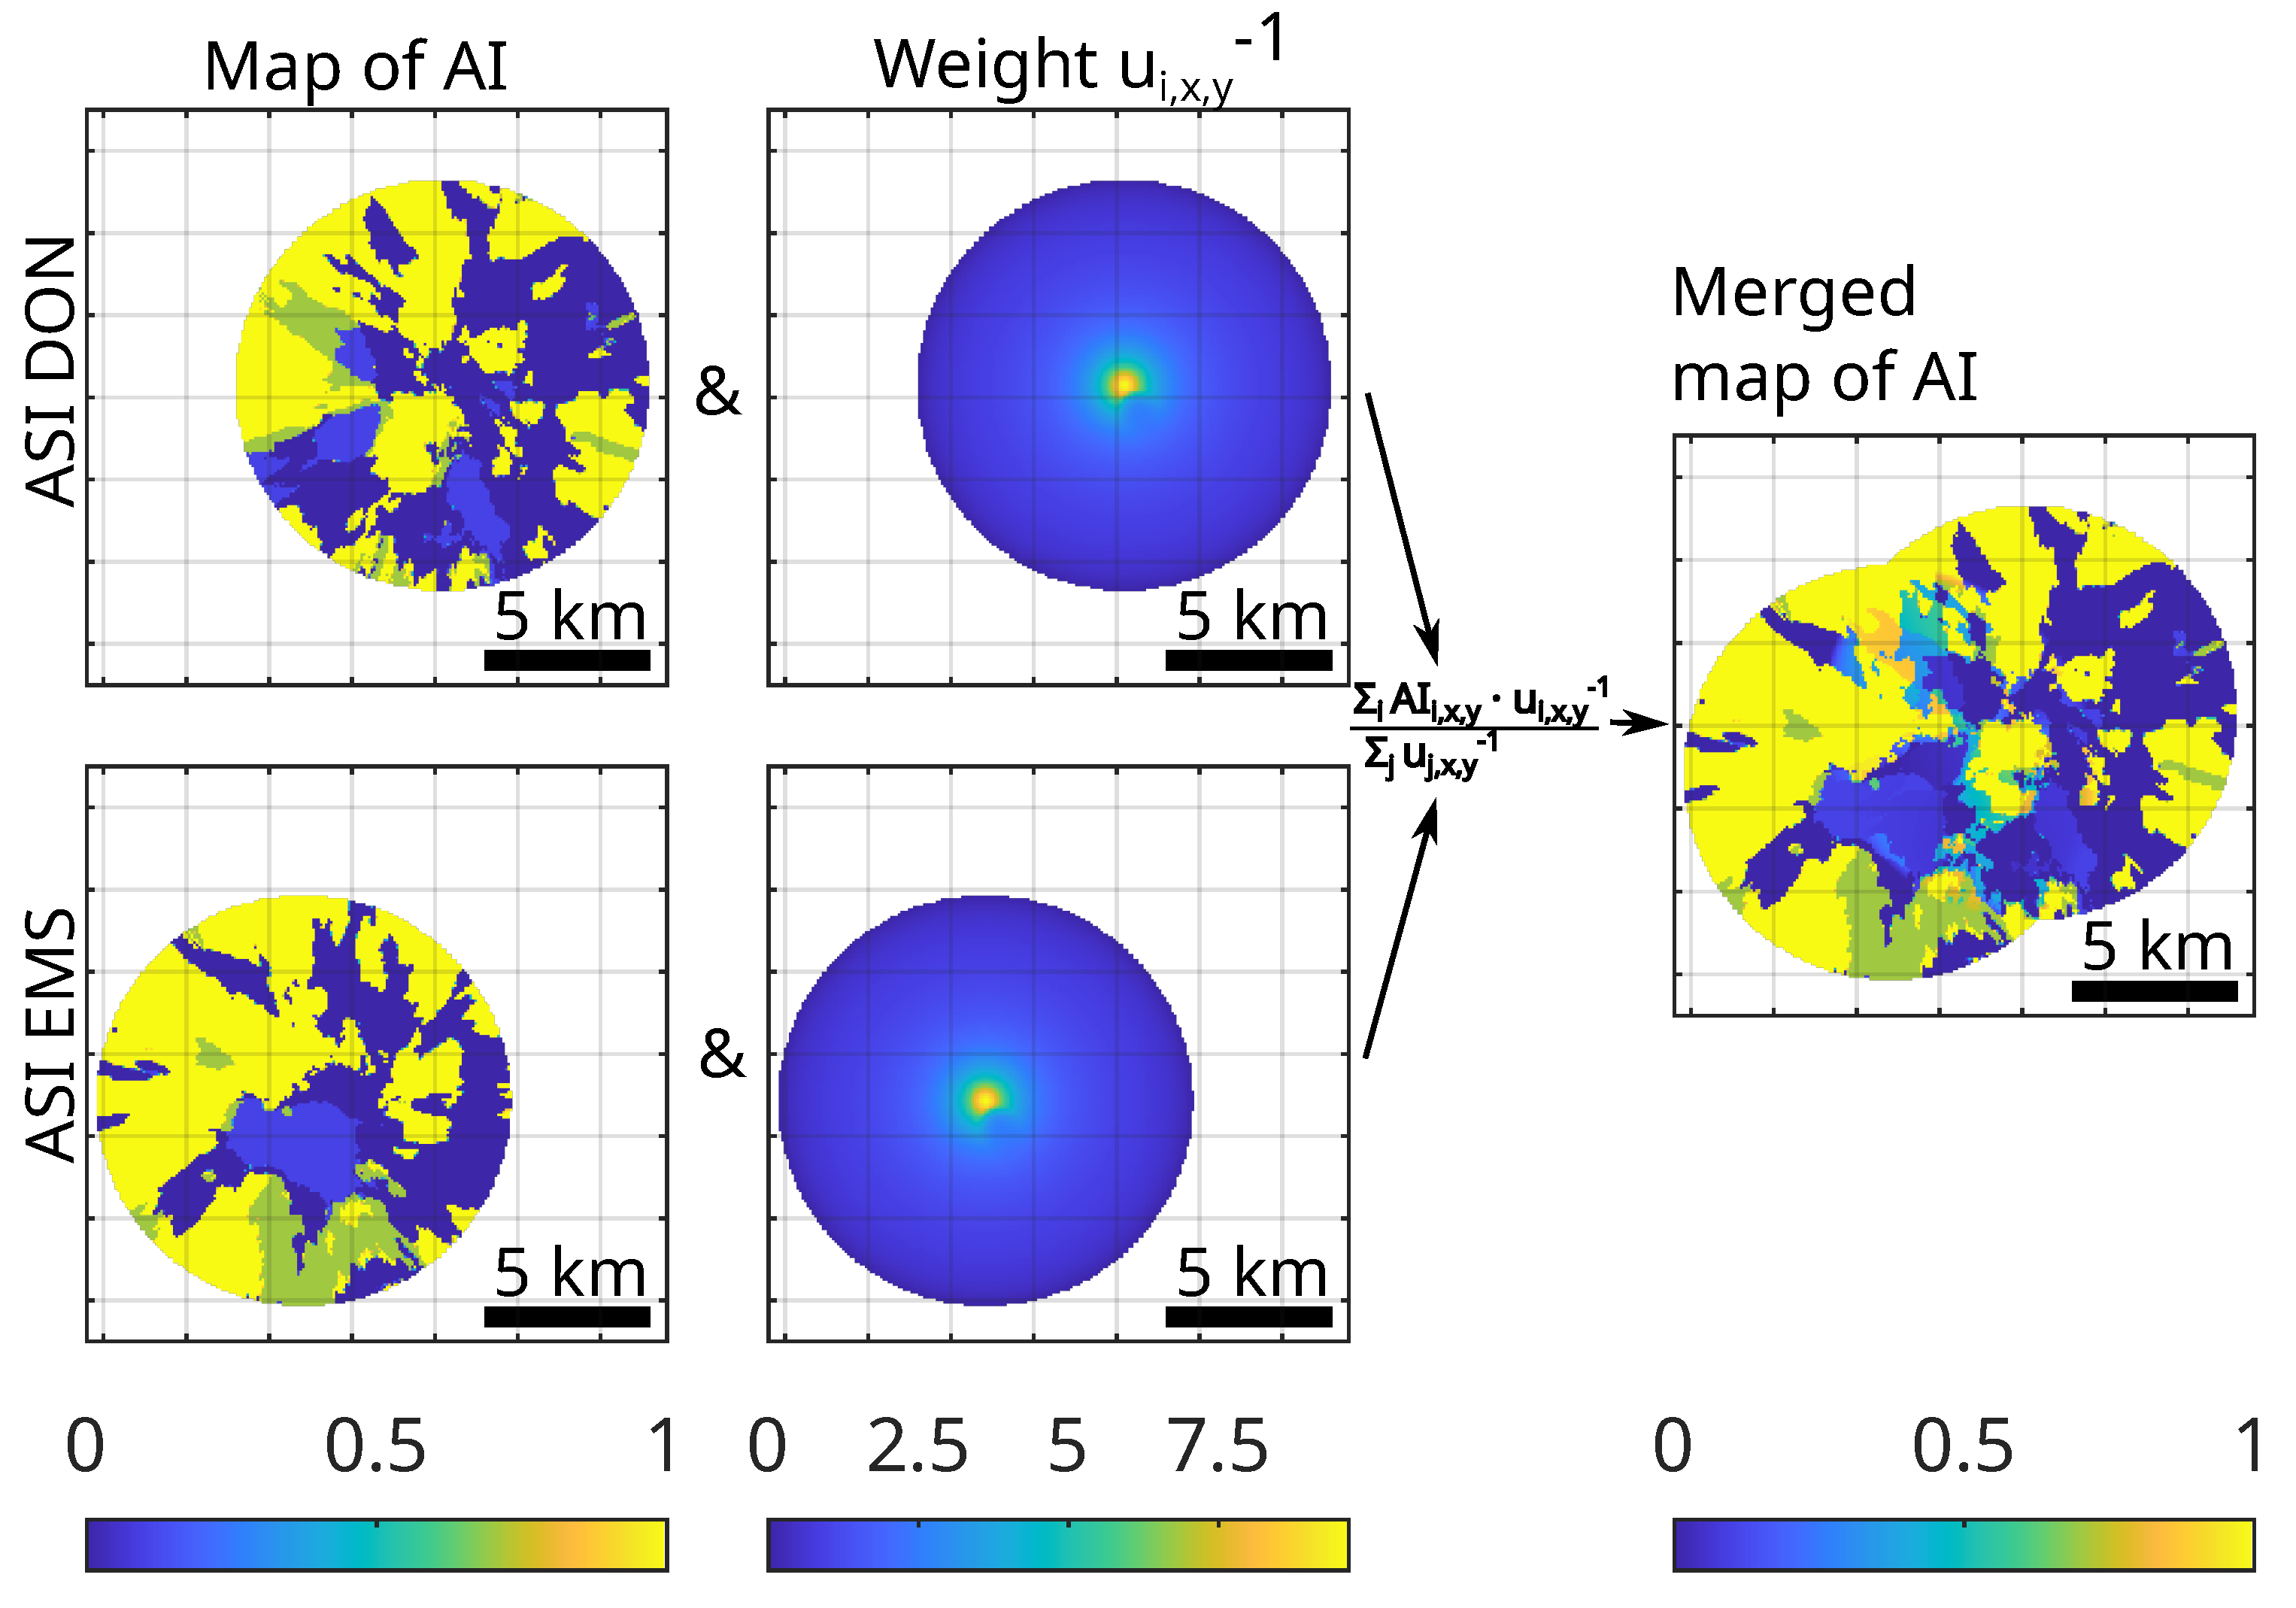
The merging operation for maps of A I is summarized in Figure 5.
To simplify the example, only the two ASIs EMS and DON have been included in the visualization. ASI EMS is located 4.5 km to the southwest of ASI DON. Each ASI provides A I in a circular area of the map (left column), referred to as an ASI’s observed area. The size of this area is determined by the ASI’s maximum viewing angle of θ m a x = 78 and the present CBH in the urban area (1200 m in this example). The weight u i , x , y (center column) decreases rapidly with the distance of a grid cell from the ASI’s location. In the merged map of A I (right column), the combined field of view then covers a larger area. The transition between the maps of A I received from both ASIs appears natural, i.e., continuous and smooth, in this example. Furthermore, the merged map features a finer graduation of A I .
Inaccuracies in the estimation of CBH present a sources of uncertainty which are accounted for implicitly by the merging procedure. Blum et al. [53] described the procedure which is used here to estimate CBH. This procedure can bring deviations, in particular, in situations with highly variable CBH e.g., in multi-cloud-layer situations. Due to an inaccurate CBH, the orthoimage of the single ASI is projected into a horizontal plane at the estimated local CBH and is expanded over an area which is either too small or too large. Consequently, in the ASI-based map, the area monitored by an ASI is stretched proportionally to the error in estimated CBH. In particular, a cloud is represented in the map of A I by a zone of increased A I . The area of this zone and the distance of this zone’s center of mass from the ASI’s location are both overestimated if CBH is overestimated.
These errors occur for each individual ASI-based map in the same way. For state-of-the-art ASI-based systems typically relying on two or less ASIs, these errors cannot be avoided as the ASIs need to be located in close proximity, to measure CBH robustly under all relevant conditions [44,53,63]. In the ASI network, the merged map of A I is automatically blurred if CBH is erroneous. This mechanism is comparable to a photograph viewing objects which are out of focus. This behavior may be advantageous and is used in the modeling of expected cloud attenuation, which is described below.

3.2.3. Clear Sky DNI

In the ASI network, clear sky DNI ( D N I c l e a r ) is estimated by a procedure previously used in ASI-based nowcasting e.g., [46]. This procedure identifies clear-sky periods and the corresponding clear sky DNI from recent readings of a ground-based DNI measurement. In a second step, the model of Ineichen et al. [64] is applied to identify the Linke turbidity T L which explains the timeseries of D N I c l e a r . Based on sun position and T L , D N I c l e a r can be calculated for any timestamp as long as T L remains constant. In the present study, the estimate of D N I c l e a r is required to be as steady as possible within the period from sun rise of the evaluated day until the timestamp when spatial variations of DNI should be analyzed. Prior ASI-based systems focused on detecting clouds which have a notable attenuation e.g., [47,65]. For those systems, it can be beneficial to include the attenuation of thin clouds in D N I c l e a r . An estimation of clear sky DNI of this kind was used, e.g., by Nouri et al. [20]. Unlike that, the present method to assign cloud attenuation considers variations of DNI related to optically very thin clouds in all cases. Furthermore, by the present approach, overestimations of D N I c l e a r are tolerated, while underestimations should be avoided.
Based on these considerations, the procedure to determine D N I c l e a r described by Nouri et al. [46] is used. The cloud-screening algorithm [66] used by that method is applied with an adapted set of parameters as follows. Measurements of DNI and T L from the recent 120 h instead of 48 h are inspected. This longer history allows for identifying clear periods more reliably during longer phases with high cloud coverage. On the other hand, this long history will lead to an overestimated D N I c l e a r if T L increases rapidly. This is acceptable, as an overestimation of D N I c l e a r can be compensated by the ASI network’s approach to model cloud attenuation. From this history, the most recent 240 instead of 15 observations, which were identified as clear sky, are retained for the consecutive weighted average. This assures a more inert behavior of D N I c l e a r . Furthermore, the cloud-screening algorithm is parameterized rather strictly rejecting any T L greater than 5 instead of 13. Higher values of T L are seldom at the site and are more likely to go back to an erroneous detection of clear sky in the presence of very thin clouds.
In a future enhancement of the present procedure, it could also be considered to estimate clear sky DNI and Linke turbidity based on multiple data sources, in particular including satellite-based services such as CAMS McClear [67,68]. This may bring an advantage in some cases when the present procedure erroneously detects clear sky.

3.2.4. Assigning Cloud Attenuation

Up to this point, merged maps of A I have been determined. A I was introduced as an indicator of cloud attenuation based on our experience that the cloud segmentation can indicate the existence of an optically thick/intermediate/thin cloud and that this indication gets more accurate as observations from multiples ASIs are merged. This indication is only qualitative as the classes optically thick ( A I = 1 )/intermediate ( A I = 0.7 )/thin ( A I = 0.2 ) are not strictly related to a certain cloud attenuation A. Accordingly, the relationship of A I and attenuation A can be nonlinear and biased. Furthermore, the relationship may not be static but depend on the segmentation procedure’s accuracy for the present cloud conditions. We now use measurements of DNI from RSI DON and calculate the local cloud attenuation A. Then, we use present, recent and historic values of A at DON to derive a relationship of A I and A which is apt to the respective timestamp of the analysis. With this relationship finally, A can be estimated in each point of the observed area. This procedure adapts the relationship of A I and A dynamically. Therefore, the exact values of A I , which were assigned to the cloud classes in the first step, have a minor influence on the method.
In the first step, the present measurement of DNI at RSI DON is evaluated. From DNI, together with clear sky DNI, D N I c l e a r , the local value of the attenuation A is calculated:
A = 1 D N I D N I c l e a r .
The local value of A together with A I of the cloud grid cell shading the RSI is stored as new entry to a database. In the proximity of the RSI at DON, the merged map of A I is influenced strongly by the maps of A I received from ASI DON and nearby ASIs. For other parts of the urban area, a smaller number of ASIs contributes to the estimation of A I . Likewise, in more peripheral grid cells, A I is determined based on larger zenith angles of the raw ASI images. These aspects may lead to a different relationship of A I and A in the central and in the peripheral parts of the urban area.
The relationship of A I and A reflected by the database is intended to hold for the whole urban area and if possible beyond this area. For these more peripheral locations, no separate radiometer station is included in the estimation. However, A I can often be tracked from these areas to the location of RSI DON. Consequently, A I of the cloud shading the grid cell of RSI DON is predicted based on ASI images from the present timestamp and also based on ASI images captured 30, 60, …, 300 s before, tracking the respective recent maps of A I along the local cloud motion vectors to RSI DON. This way, in total, eleven database entries are created per timestamp. Each of these entries consists of the local values of A, A I predicted for the cloud grid cell shading the reference radiometer (in this study only RSI DON), an ID of the radiometer, the timestamp based on which A I is predicted and the timestamp, at which A is calculated. Each database entry is referred to as an observation in the following.
In the second step, present and previous observations of A are each assigned a weight, which reflects how closely that prior value of A is related to the present and the future value of A. Observations of the same day receive a weight depending on the forecast instance time t and the timestamp t j , s a m e d a y of the observation. It is defined by
w j , s a m e d a y = 1 + ( t t j , s a m e d a y ) / T 1 / 2 1 .
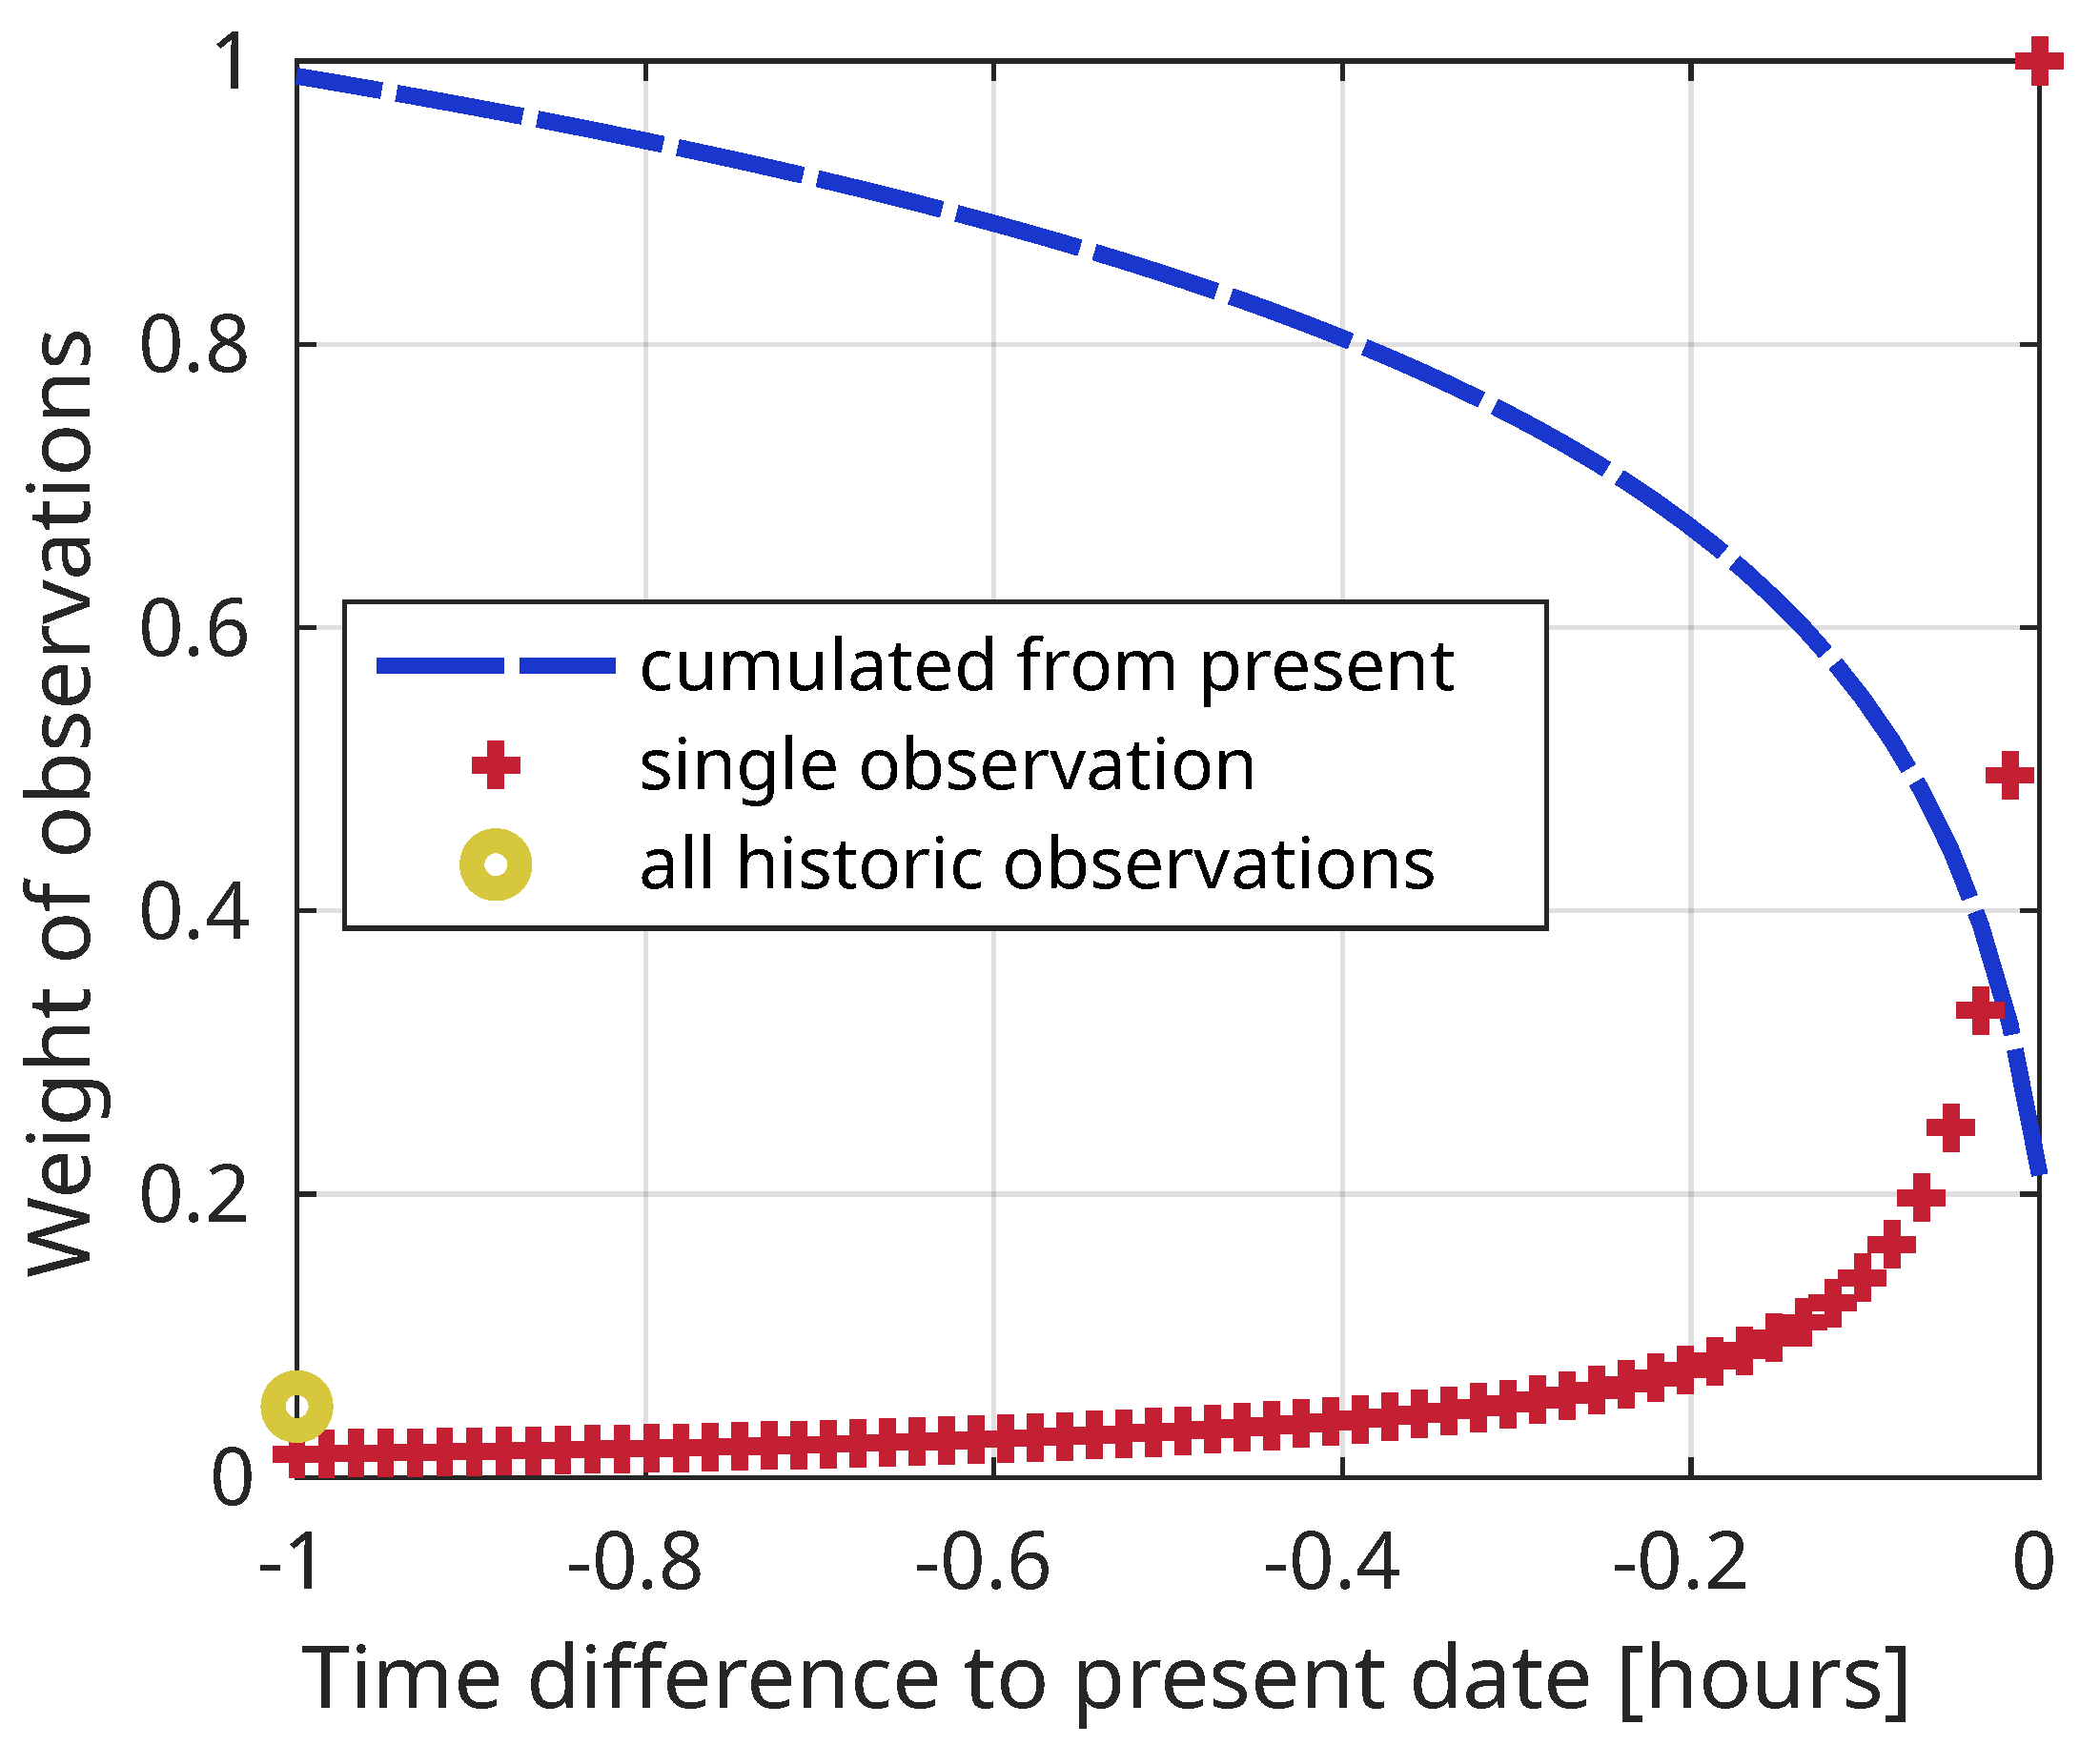
T 1 / 2 = 60 s is an empiric constant indicating after which time the weight of an observation reduces to 1 / 2 . The weight assigned to an observation of the same day, based on its age, is shown in Figure 6 (labeled single observation). The relationship between A I and A changes on the short-term as A varies depending on the present cloud types and also as the quality of the maps of A I may be variable depending on the present errors in the cloud segmentation and in the estimation of CBH. Figure 6 also shows the cumulated weight of observations over the age (labeled cumulated from present). The example evaluates a timestamp one hour after sun rise, given a constant rate of valid readings from the radiometer station during that hour.
Observations from before the present day are referred to as historic observations. In this study, only observations from the year 2020 are included. All M historic observations together are given a constant weight of 0.05 . Each historic observation (index j , h i s t o r i c ) then receives an identical weight w j , h i s t o r i c = 0.05 / M . The constant weight implies that there is a relationship between A I and A, which holds in general. Due to the small weight, the historic observations only contribute to the estimation of cloud attenuation in the sense of fallback values. These observations are relevant directly after sun rise, in the case of outages of the included radiometer and in some cases when the cloud conditions change abruptly.
In the third step, a function A ^ is fitted to represent the relationship of A I and A based on the weighted observations. A ^ is defined so that it must increase monotonically with A I . If a decrease is indicated by the observations, this may either be related to a small database of observations or artifacts in the cloud segmentation procedure. The exact definition of A ^ is given in Appendix C. Attenuation is expected to range between zero and one, provided that estimated clear sky DNI is not underestimated. Accordingly, the range of values taken on by A ^ is restricted to the same interval. A simple fit function is preferred. Based on these considerations, a piecewise linear function is used for the fit.
A loss function L o s s is defined which penalizes deviations between each observation of attenuation A j and the respective output of A ^ ( A I j ) , calculated from the observation of A I j . L o s s corresponds to a weighted sum of squared deviations:
L o s s ( A ^ ) = j = 1 N w j A ^ ( A I j ) A j 2 .
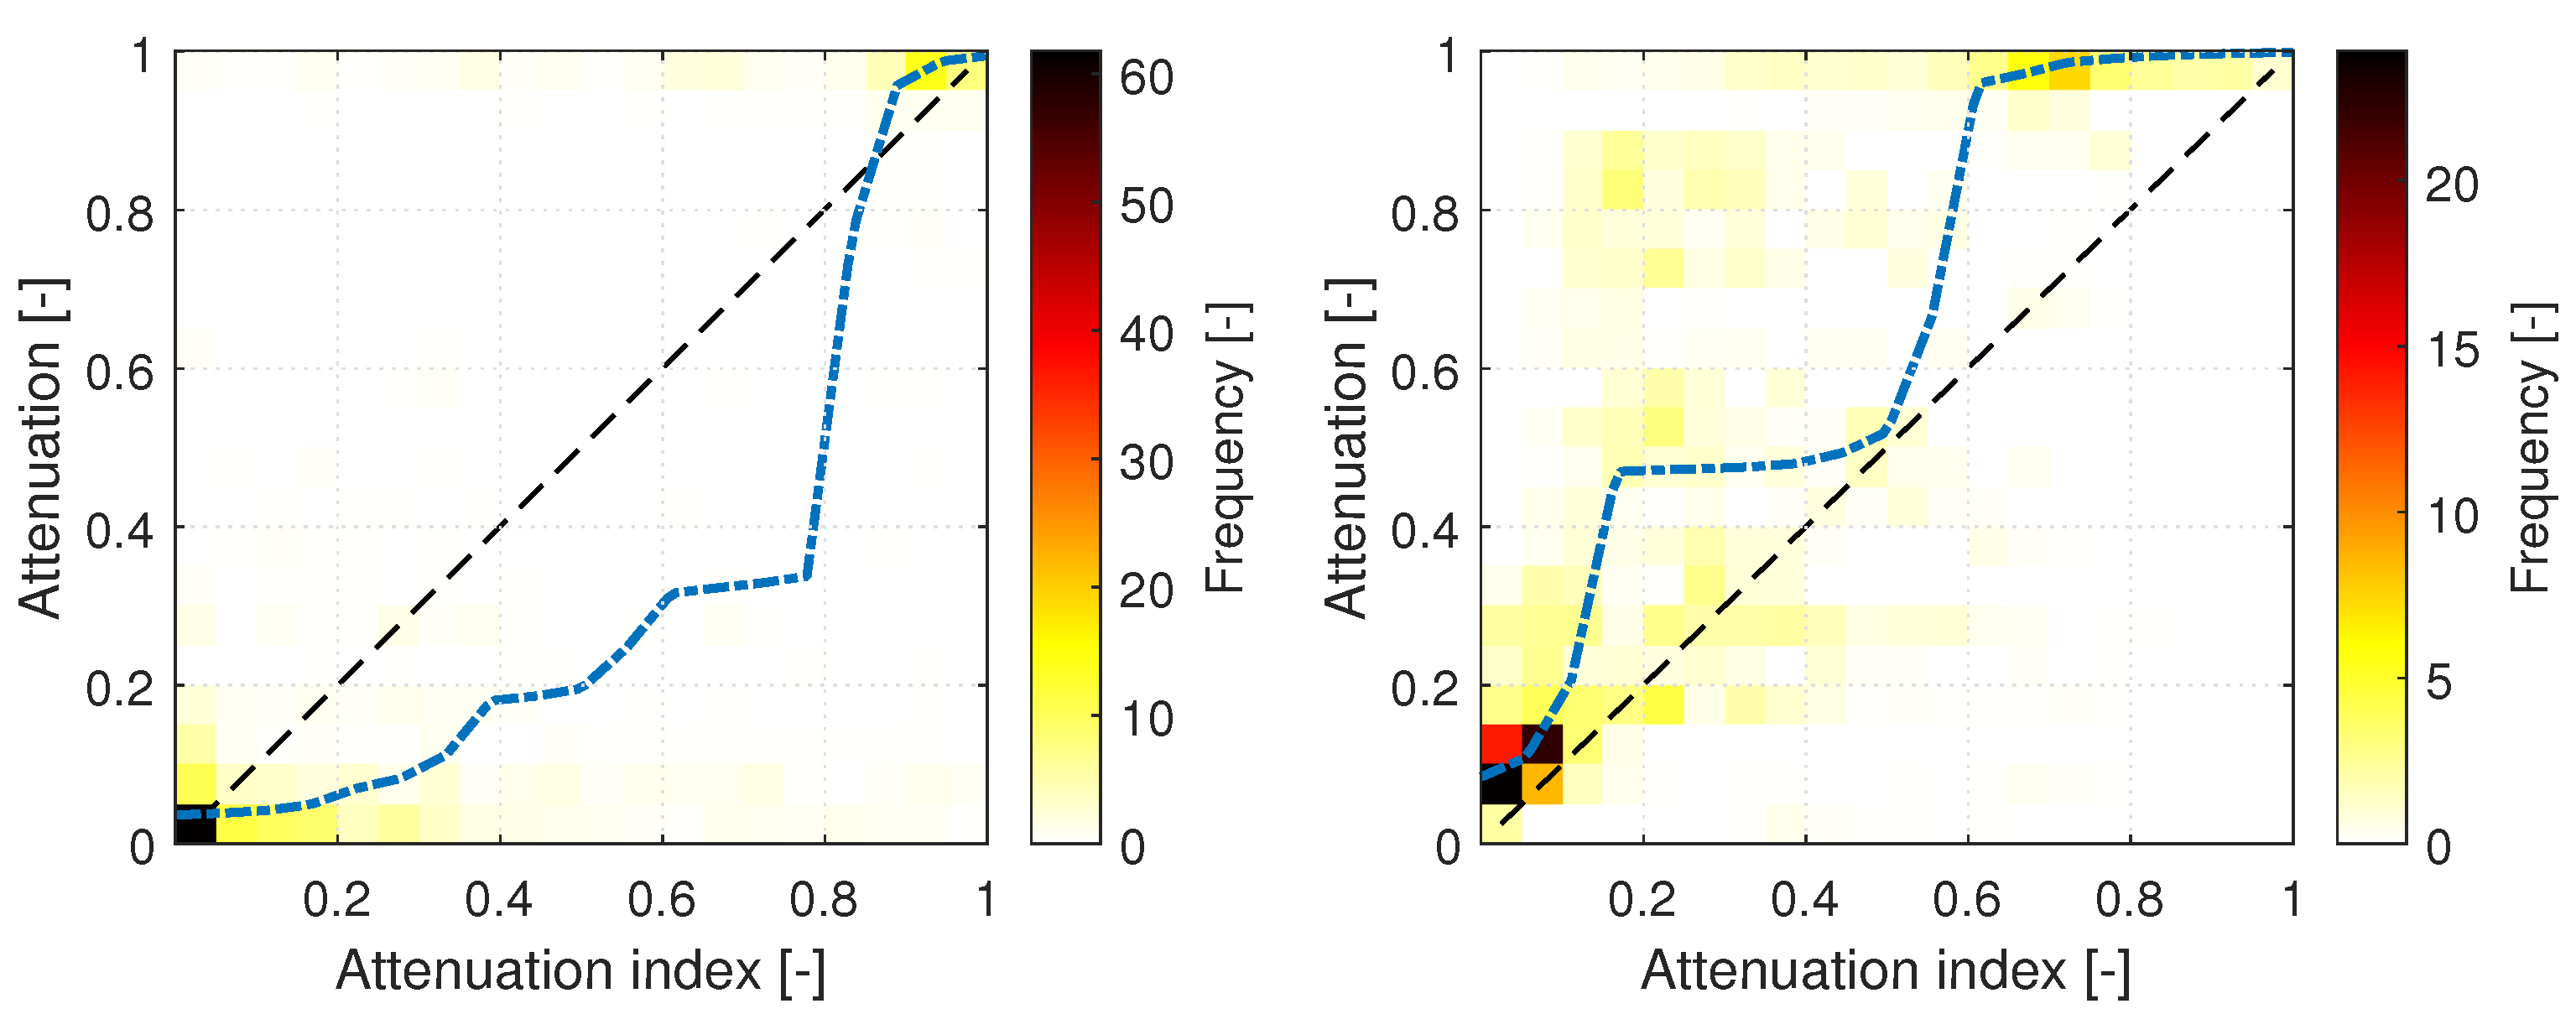
The weight w j corresponds to w j , s a m e d a y and w j , h i s t o r i c depending on the age of the respective observation. A numerical solver is applied to find the function A ^ which minimizes L o s s . At each forecast instance time, the database of observations and related weights are updated, and the solver is applied using the parameters which minimized the loss function at the forecast instance time evaluated before as starting value. Figure 7 shows weighted observations and the resulting distinct slopes of A ^ (blue dash-dotted curve) for a scattered (left) and a multi cloud layer situation (right). These situations are discussed further in the following section.
Finally, a map of the attenuation is created. For this, A ^ is applied to each grid cell of A I . A ray-tracing procedure then relates grid cells from the map of A at CBH to grid cells in the DNI map at the ground’s local altitude. The ray-tracing procedure used here modifies prior schemes which projected clouds as discrete bodies to the ground (e.g., used by [47]). Due to this restriction, the prior schemes were not suited to resolve variations of cloud properties within such rigid bodies, which is important here. In contrast to Nouri et al. [47], the procedure used here links each grid cell of the ground model at its local altitude with a grid cell at the local cloud base height. Together with D N I c l e a r , the respective ground-projected value of A yields DNI in each grid cell of the ground model.

4. Results and Discussion

In this section, the characteristics and the accuracy of the developed procedure to model clouds and assign cloud attenuation are evaluated in comparison to the readings of RSIs located within the urban area of Oldenburg. First, two exemplary situations are inspected in Section 4.1. Thereafter, the method is validated and benchmarked quantitatively. The validation evaluates 92 days, which represent the atmospheric conditions of the year 2020. This dataset is described in Section 2.2 and in Appendix D. As benchmarks, estimations from ASI pair DON-FLE and homogeneous persistence are used, which were both defined in Section 3.1. Please recall that homogeneous persistence receives a measurement of DNI/GHI from a single radiometer and applies it homogeneously to all grid cells of the map. Each of the three analysis approaches includes the measurements of DNI and DHI from radiometer station DON. The validation mostly examines DNI and the respective clear sky index k D N I * . Compared to GHI, DNI is more closely related to attenuation, which is the focus of this study. However, GHI is evaluated at some points to allow a comparison of the present results to those from the literature and due to its relevance for many solar technologies. The quantitative validations first evaluate deviation metrics for the overall dataset and for subsets corresponding to eight variability classes in Section 4.2. Thereafter, the procedure’s deviations are analyzed using a quantitative definition of variability in Section 4.3. Finally, the correlation of predicted and measured DNI is analyzed by relative frequency distributions in Section 4.4.

4.1. Maps of Attenuation Index and GHI in Different Cloud Conditions

Exemplary maps of attenuation index and GHI are inspected and compared to georeferenced raw sky images. The maps of GHI from the ASI network are compared to the ones from ASI pair DON-FLE. This visual inspection should provide a first overview of the properties of the ASI network’s maps of attenuation index and irradiance.
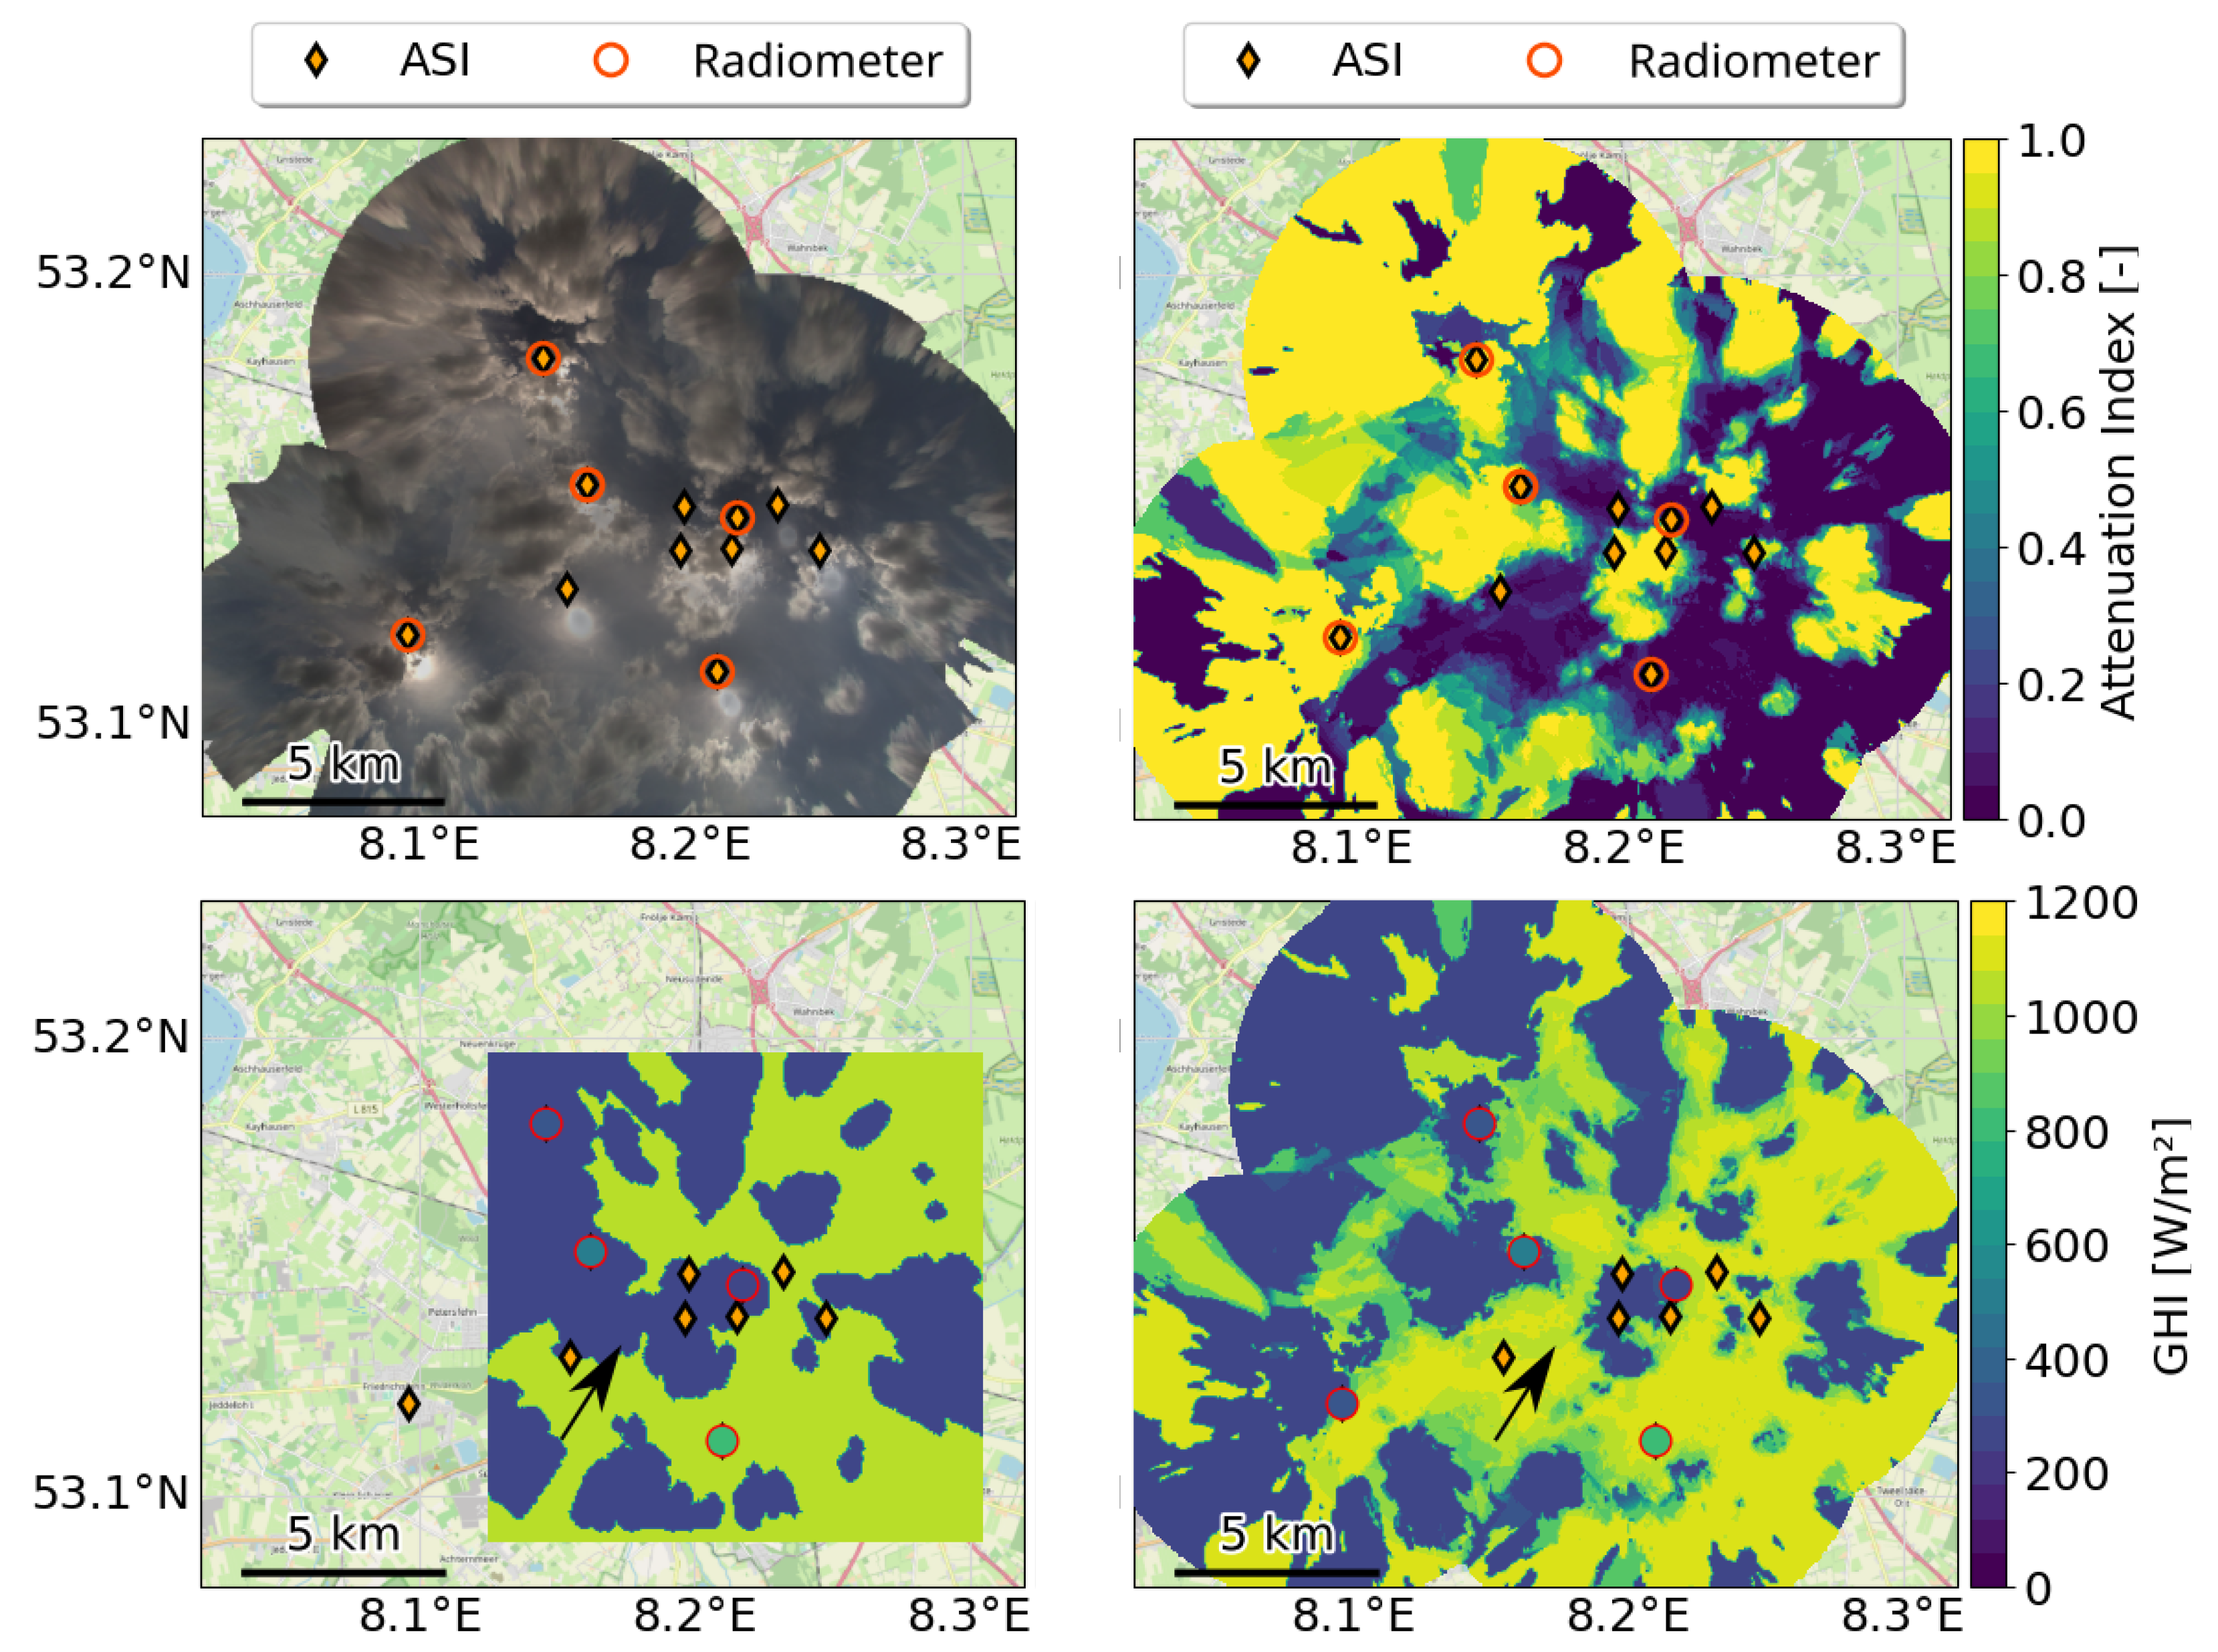
Figure 8 studies a scattered single cloud layer situation observed on 5 June 2020, 10:22:00. In the top left panel, the sky images of all ASIs available for this timestamp were overlaid. For this purpose, the raw RGB ASI images were split into red-, green- and blue-channel images. Images of the same color channel were georeferenced and merged by the procedure developed in Section 3.2. The three georeferenced and merged maps of the color channels were stacked into a sky image map with an RGB entry per grid cell. The sky image map gives an impression of the actual sky conditions in the evaluated area of around 20 km × 20 km.
As seen in the top right panel, the ASI network mainly recognizes sky ( A I 0 ) and a single cloud layer with A I 1 . In the urban center, the maps of A I , which are given the highest weight there, coincide well leading to sharply limited cloud edges. The urban periphery is observed by fewer ASIs and at larger zenith angles. For all ASIs, an increased uncertainty is expected in these areas. In the map of A I , this is reflected by less clear structures.
The bottom row of Figure 8 compares the maps of GHI received from ASI pair DON-FLE (left) and ASI network (right). For comparability between ASI pair and ASI network, DHI is modeled as homogeneous in this study. In these GHI maps, the positions of ground-based RSIs are marked by red circles. The color code inside each circle indicates the local measurement. The ASI network clearly allows for predict irradiance in a larger area. Furthermore, GHI from the ASI network is more graduated in particular at cloud edges which are connected to increased uncertainty. The GHI map retrieved from the ASI pair exhibits perspective errors at larger distances from the ASIs’ locations as a comparison of undistorted raw images showed. These errors are in large parts avoided by the ASI network. Shapes of cloud shadows detected by the ASI pair appear stretched in the direction pointing away from the two ASIs. For the ASI network, a similar distortion is only visible towards the periphery of the urban area, where only few ASIs provide cloud observations. Furthermore, by the combination of multiple observations, the ASI network apparently avoids faults of the cloud segmentation, e.g., in the area around ASI EMS (marked by an arrow). The raw image of ASI EMS from that timestamp shows that the circum-solar area is obscured by a thin cirrus cloud layer. Optically thicker clouds are only visible at sun angles of more than 20 . This matches with the ASI network’s map of GHI.
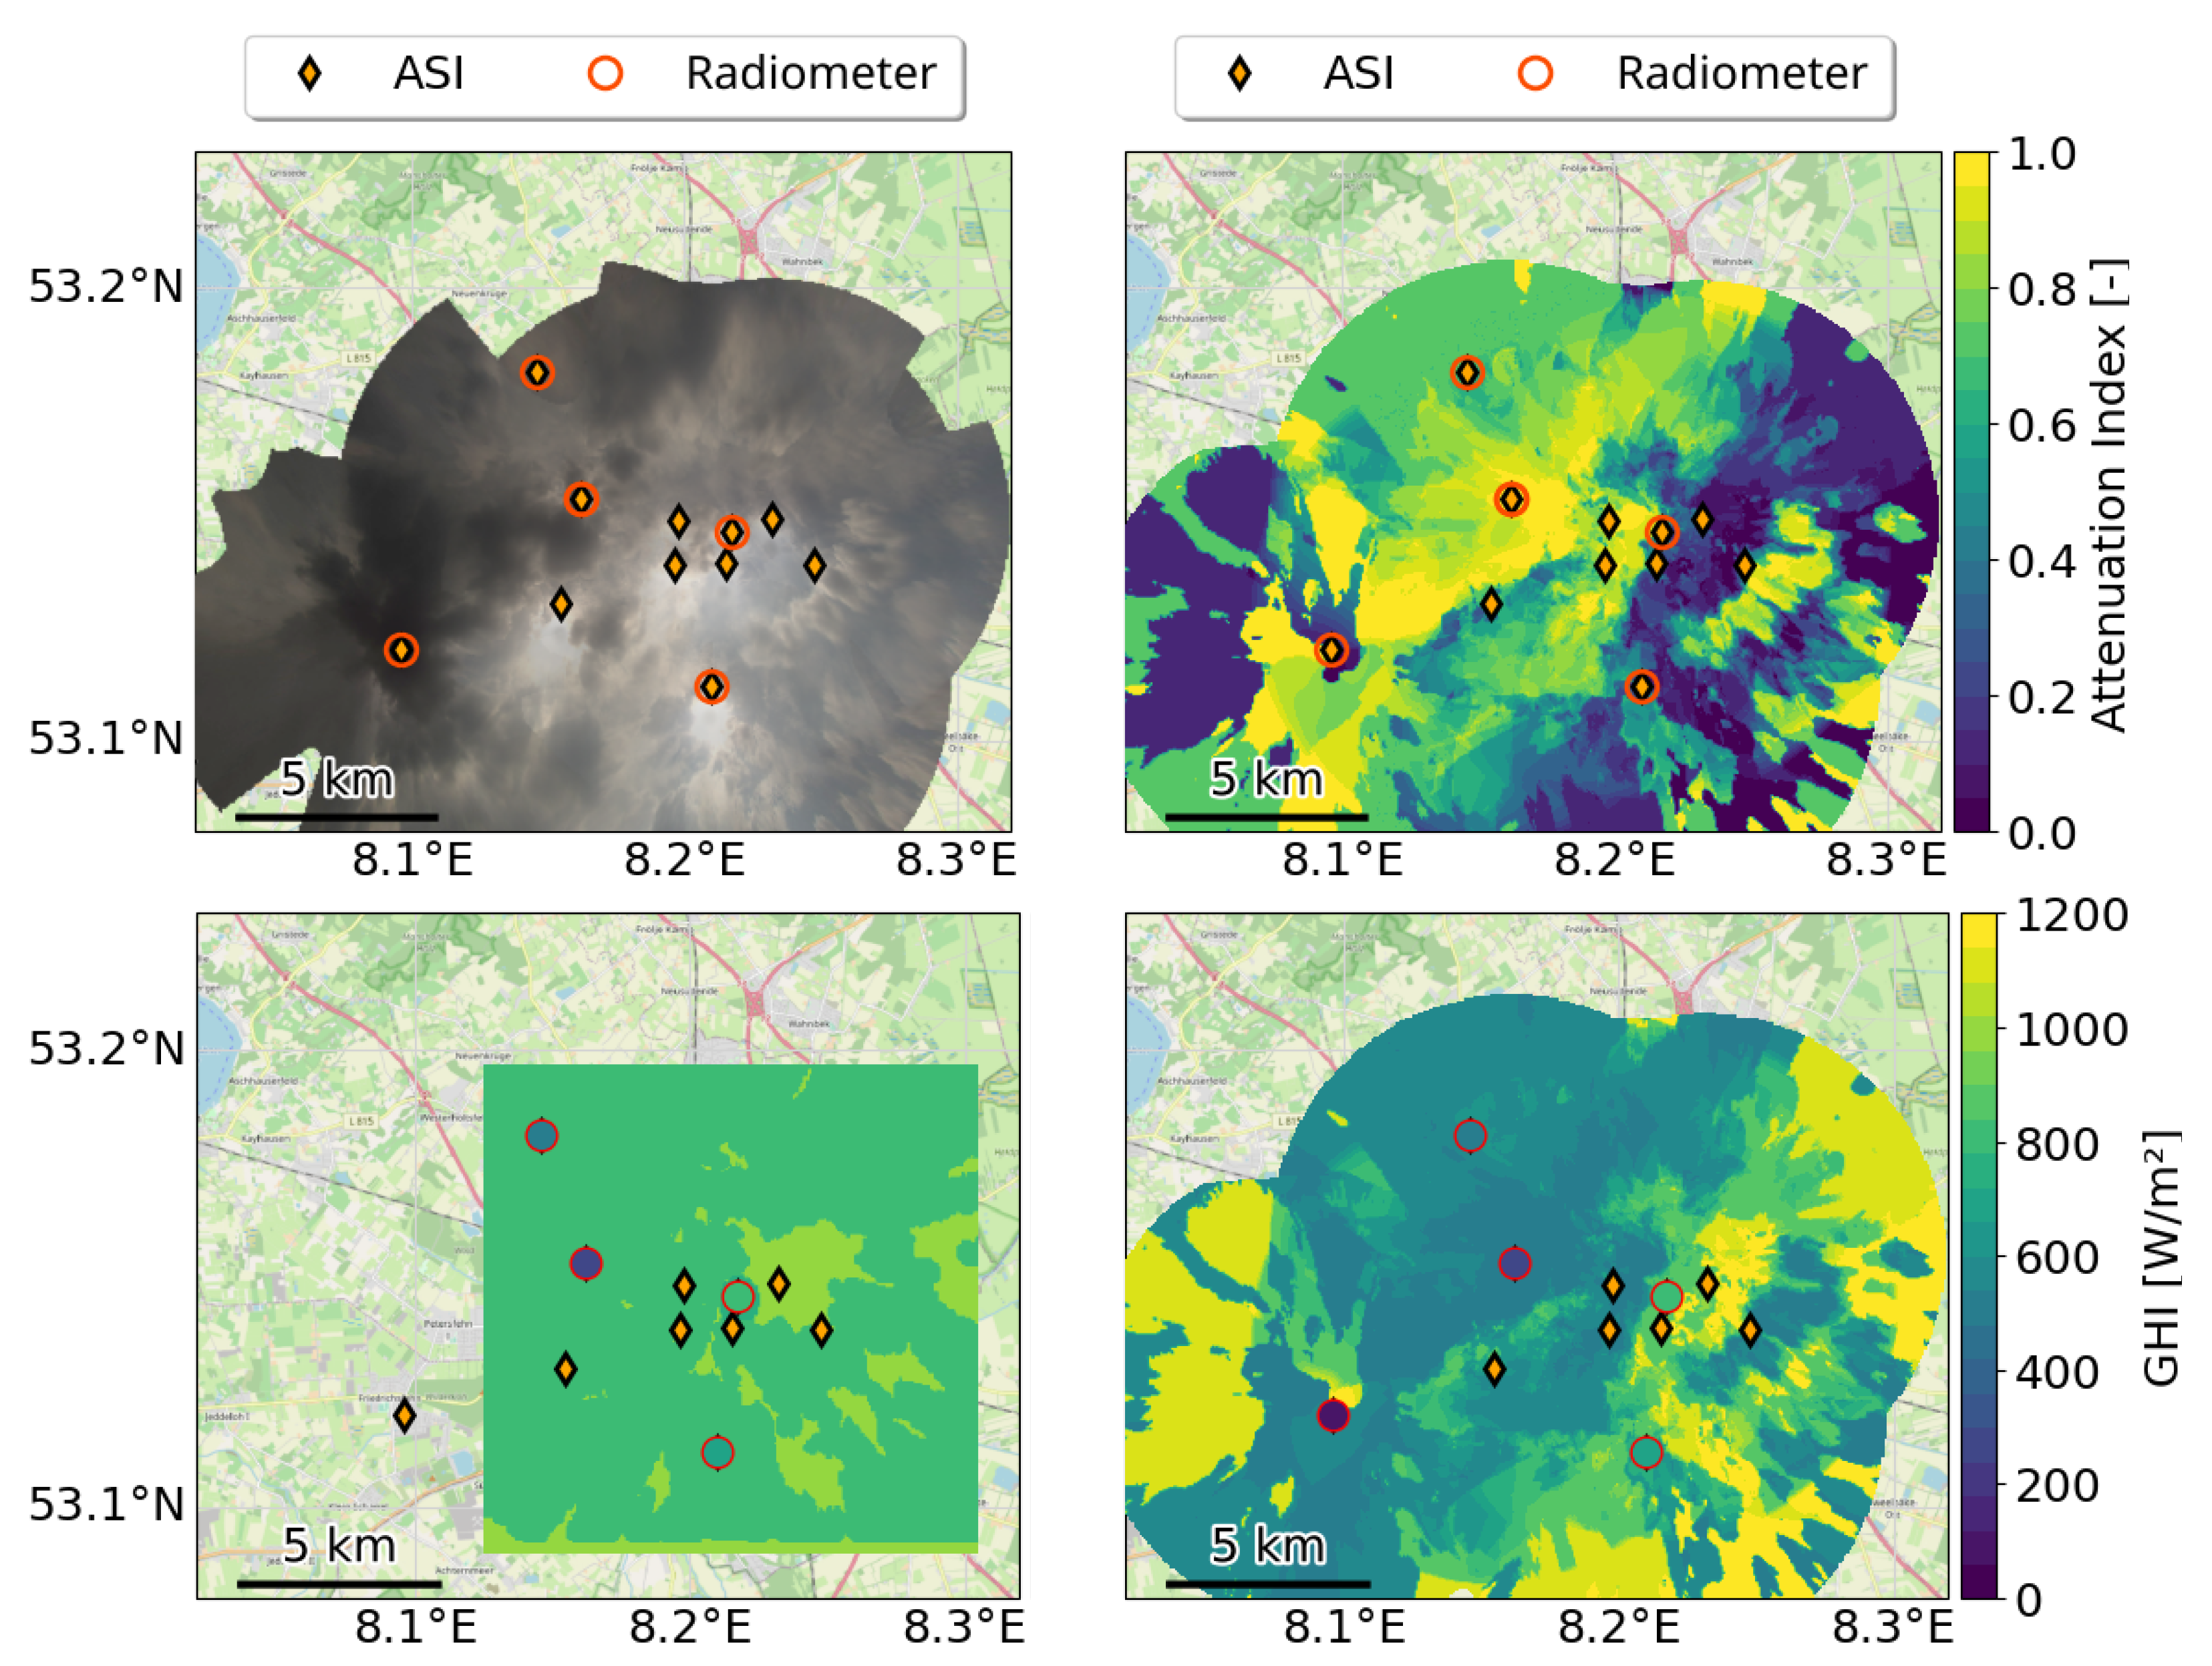
Analogous to Figure 8, Figure 9 shows a complex multi cloud-layer situation observed on 27 June 2020, 11:27:00. Here, the ASI network recognizes clouds at various levels of A I and correspondingly cloud attenuation (not shown) and GHI are also markedly graduated. The ASI pair on the other hand only predicts high GHI values, indicating that the urban area would only be shaded by various optically thin clouds. From an inspection of the ASI images and the GHI readings of the RSIs in the urban area, the ASI network’s GHI map qualitatively represents the distribution of cloud types and resulting attenuation and GHI realistically. While the overall GHI map is complex, the shapes of various optically thick clouds and their shadows are preserved also under these conditions. In the far west, the cloud segmentation of the western-most ASI’s sky image fails partly in the presence of very dark clouds. This western-most ASI alone covers this area. Consequently, no further ASIs can support the cloud detection and the faulty segmentation leads to an overestimation of local GHI.

4.2. Performance Overall and by Temporal Variability Class

In this and in the following subsections, the distinct analysis approaches are validated quantitatively. All data are 1-min-averages. ASI-based estimations of DNI and GHI are created at the rate of 30 s at which ASI images are recorded. A 1-min-average is then created by averaging three estimations. This averaging procedure is used for ASI network, ASI pair and homogeneous persistence. The experimental setup of this evaluation was shown in Figure 1 and described in Section 2. In the quantitative evaluations of this and the following sections, ASI UOL is excluded from the ASI network. This way, the RSI at UOL is located at a distance of 2.4 km from the closest ASI. In this section, for conciseness, only UOL is selected to compare the different approaches by the deviation metrics RMSD and bias.
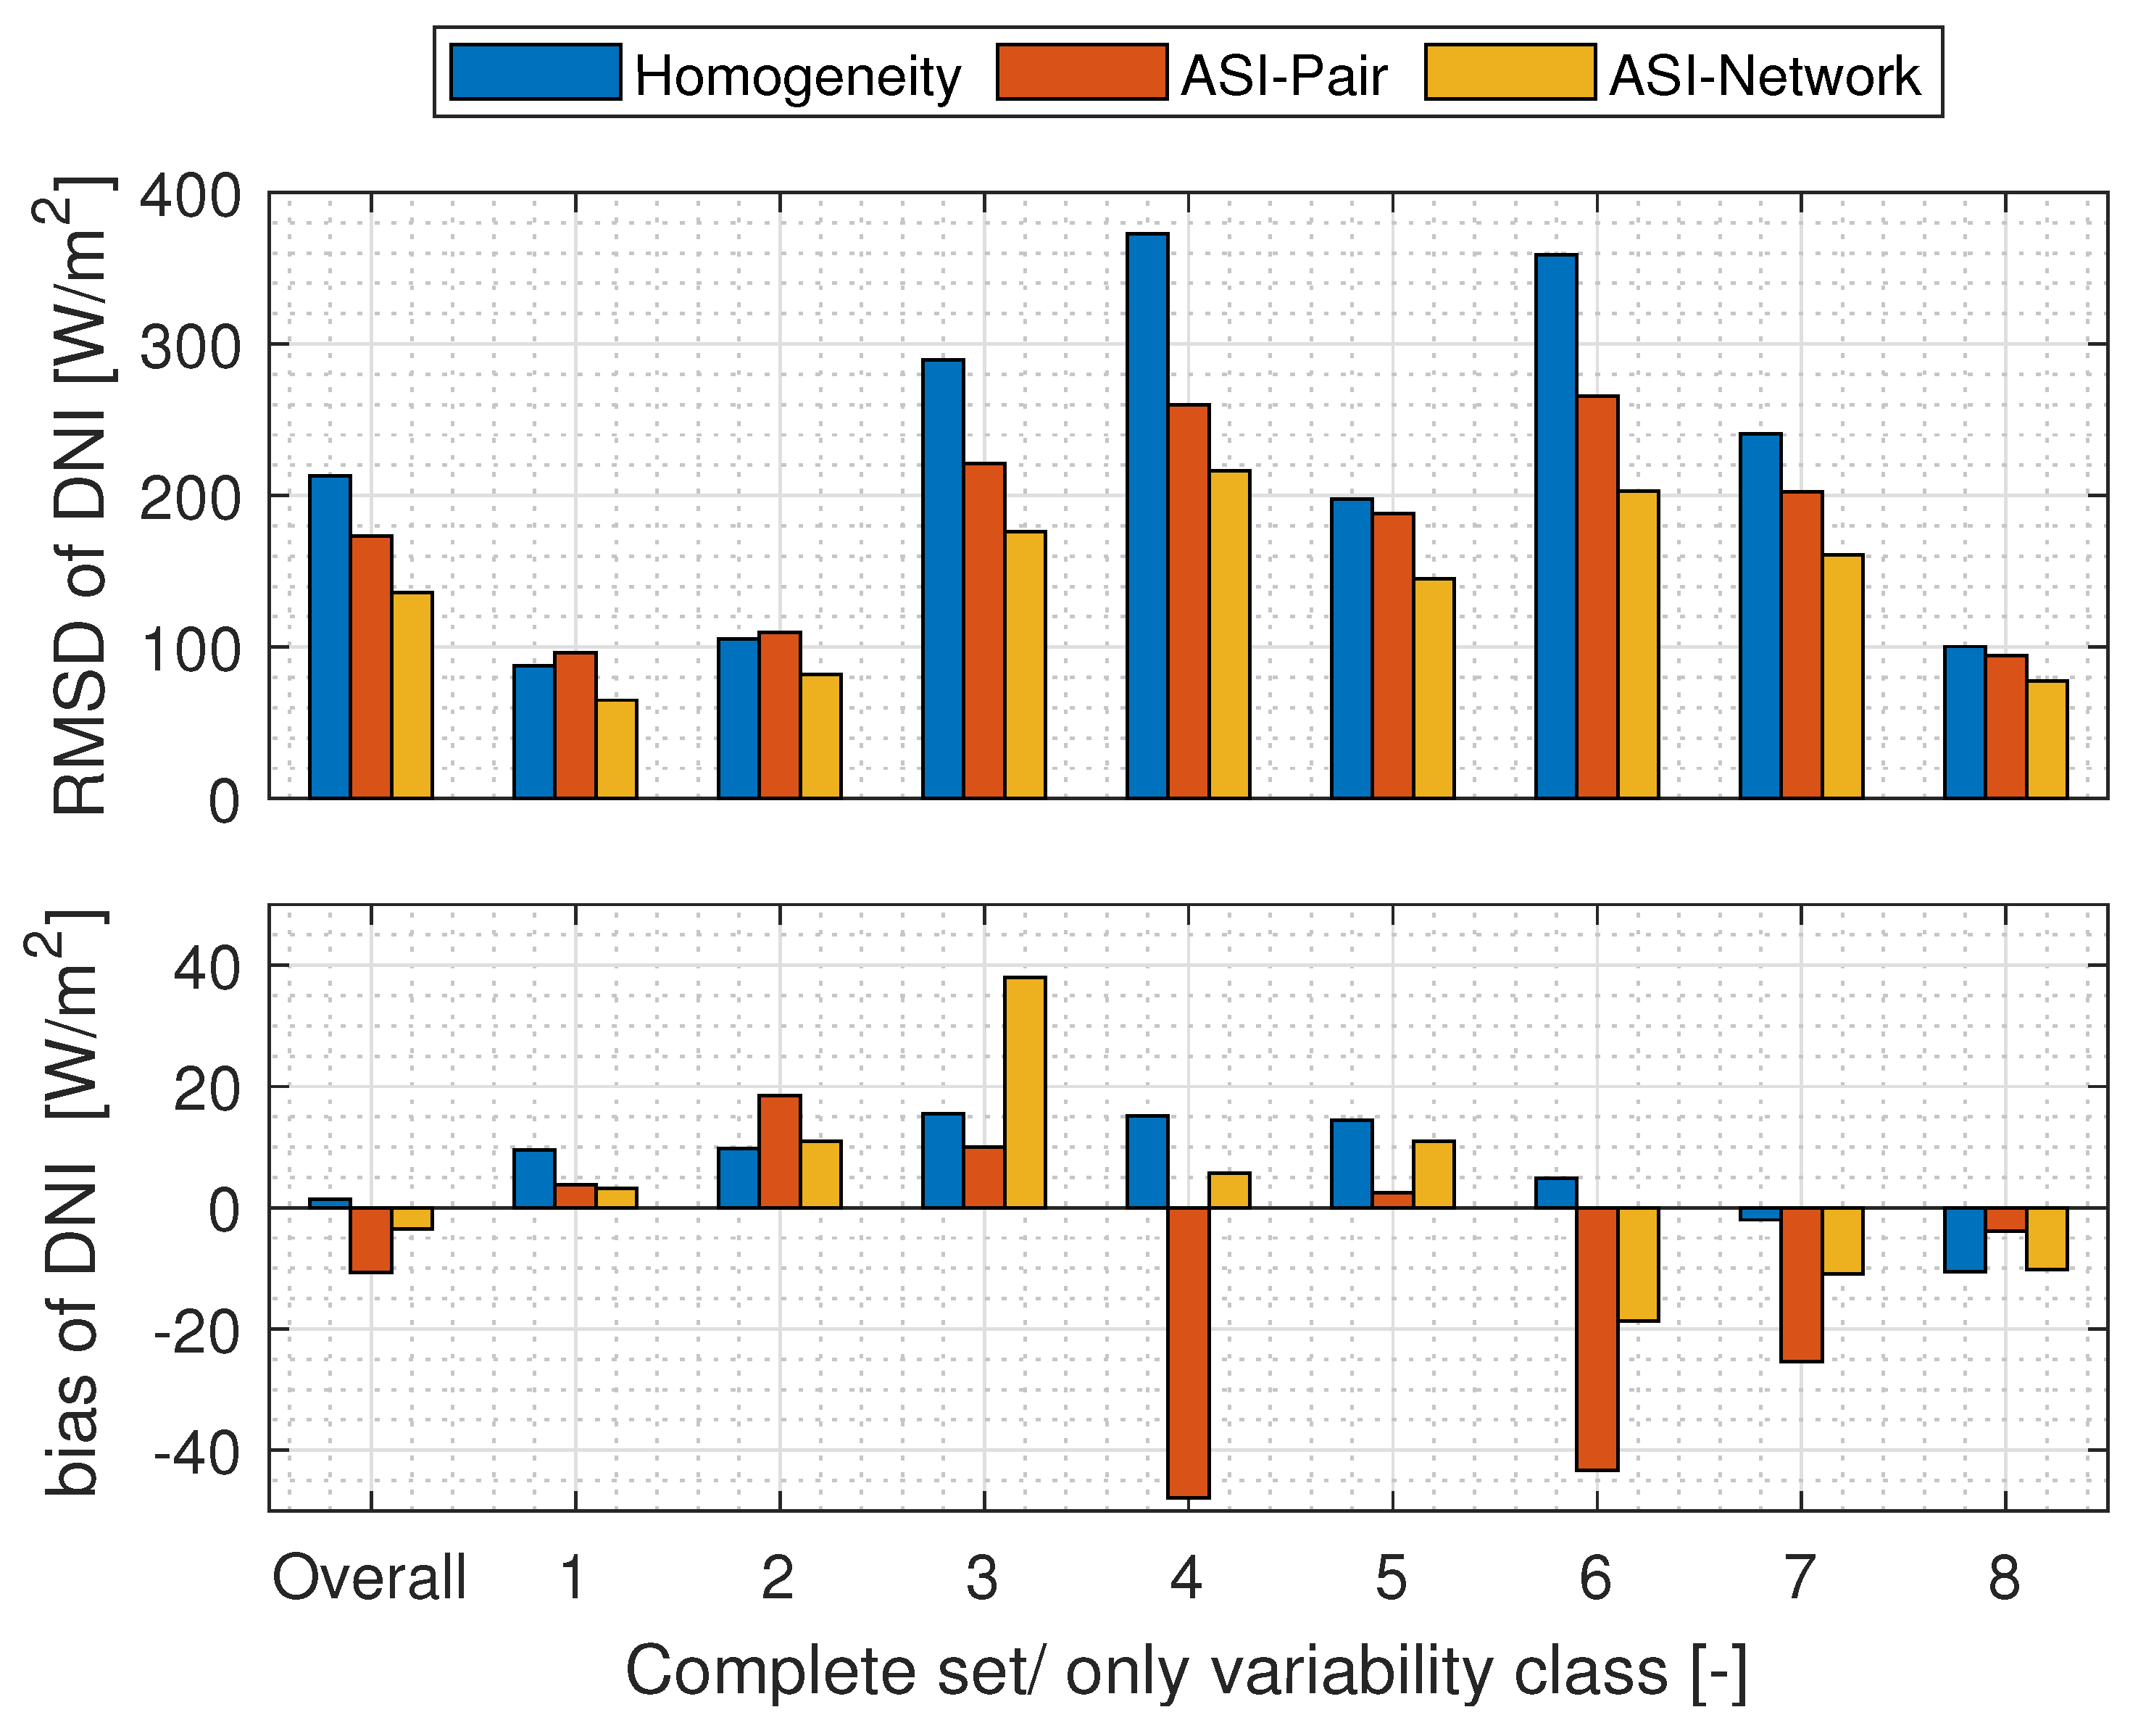
RMSD and bias are visualized in Figure 10. The first column overall shows the metrics for the complete 92 day dataset. Additionally, the influence of atmospheric conditions on the accuracy of the distinct analysis approaches should be studied. For this purpose, the columns labeled 1 8 provide the deviation metrics of each approach when the dataset is filtered to times in which the respective DNI variability class has been present in the preceding 15 min. The meaning of the eight DNI variability classes was summarized in Section 2.2 and Table 2. For comparability with previous studies, in this section, temporal variability is calculated on a 15-min basis using the procedure introduced by Nouri et al. [46].
In terms of RMSD, the ASI network performs best under all conditions and clearly also for the overall dataset. As to be expected, the advantage of the ASI network over the state-of-the-art approaches depends on the atmospheric conditions. Homogeneous persistence typically provides rather accurate estimations if temporal variability of DNI is low (classes 1, 2 and 8). Interestingly, the ASI network still brings a certain benefit in these classes.
As shown in Section 2, radiometer station DON is located in the urban center of Oldenburg. The radiometer at UOL is located at a notable distance of 3.8 km to the west of radiometer DON. At a temporal resolution of 1 min, homogeneous persistence based on DON will therefore yield increased deviations in the presence of broken clouds. Meanwhile, UOL is located in an area which is covered well by the ASI pair’s analysis given the cloud heights and sun positions typical to the site. As to be expected based on this, the ASI pair and especially the ASI network have a larger advantage the more variable a situation is. For variability classes 3 , 4 , 6 , the ASI network reduces RMSD by more than 100 W / m 2 in comparison to homogeneous persistence.
Assuming the local climates to be identical at points located at distance of 3.8 km, homogeneous persistence would be expected to have zero bias for the overall dataset and a small bias for any of the variability classes. The remaining bias of homogeneous persistence, especially within the subsets for the variability classes may therefore indicate effects which are related to the limited size of the dataset and which are for the larger part not statistically significant. Having this in mind, all approaches perform similarly in terms of bias. In particular for the overall dataset, all approaches deliver a small bias of 11 , 4 and 2 W / m 2 in the case of the ASI pair, ASI network and homogeneous persistence, respectively.
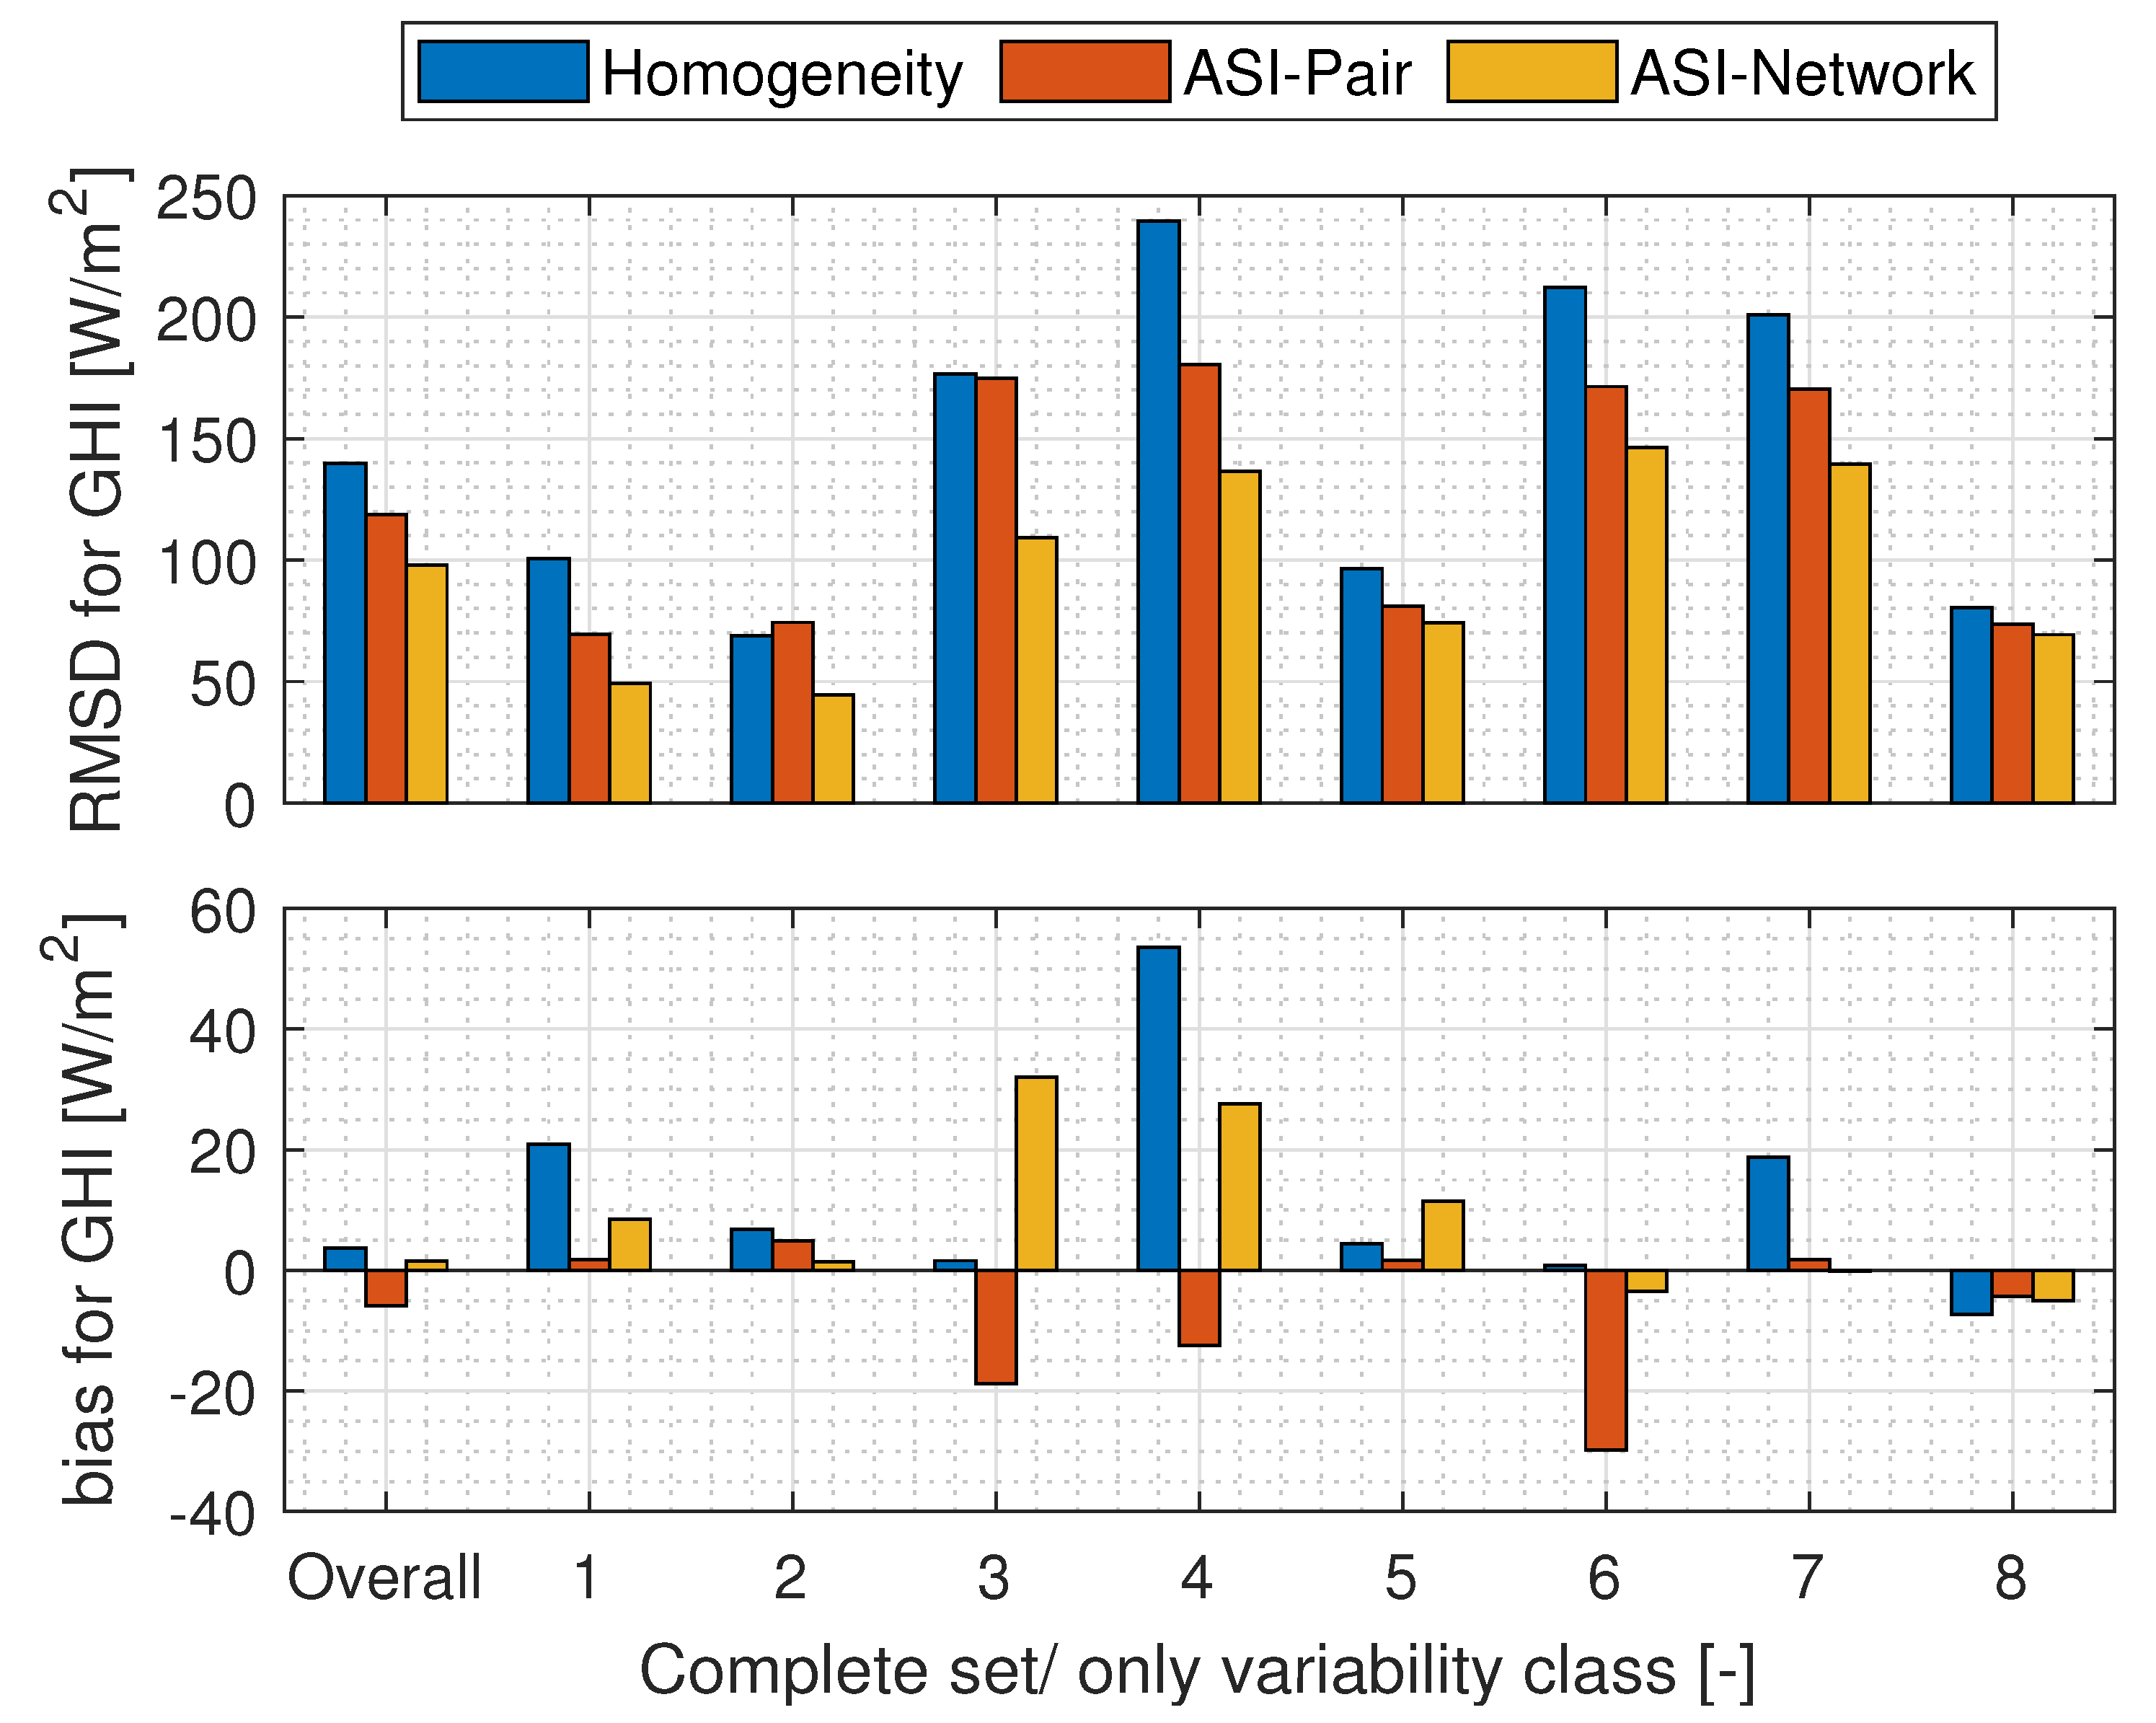
Figure 11 shows the corresponding evaluation shown in Figure 10 for GHI, however based on the smaller 28 day validation dataset. This evaluation allows for comparing analyses of GHI reported in the literature to the GHI analyses of the present ASI pair and ASI network. Qualitatively, the results for GHI coincide with the ones described above for DNI.

4.3. Influence of Spatial Variability on the Estimations’ Errors

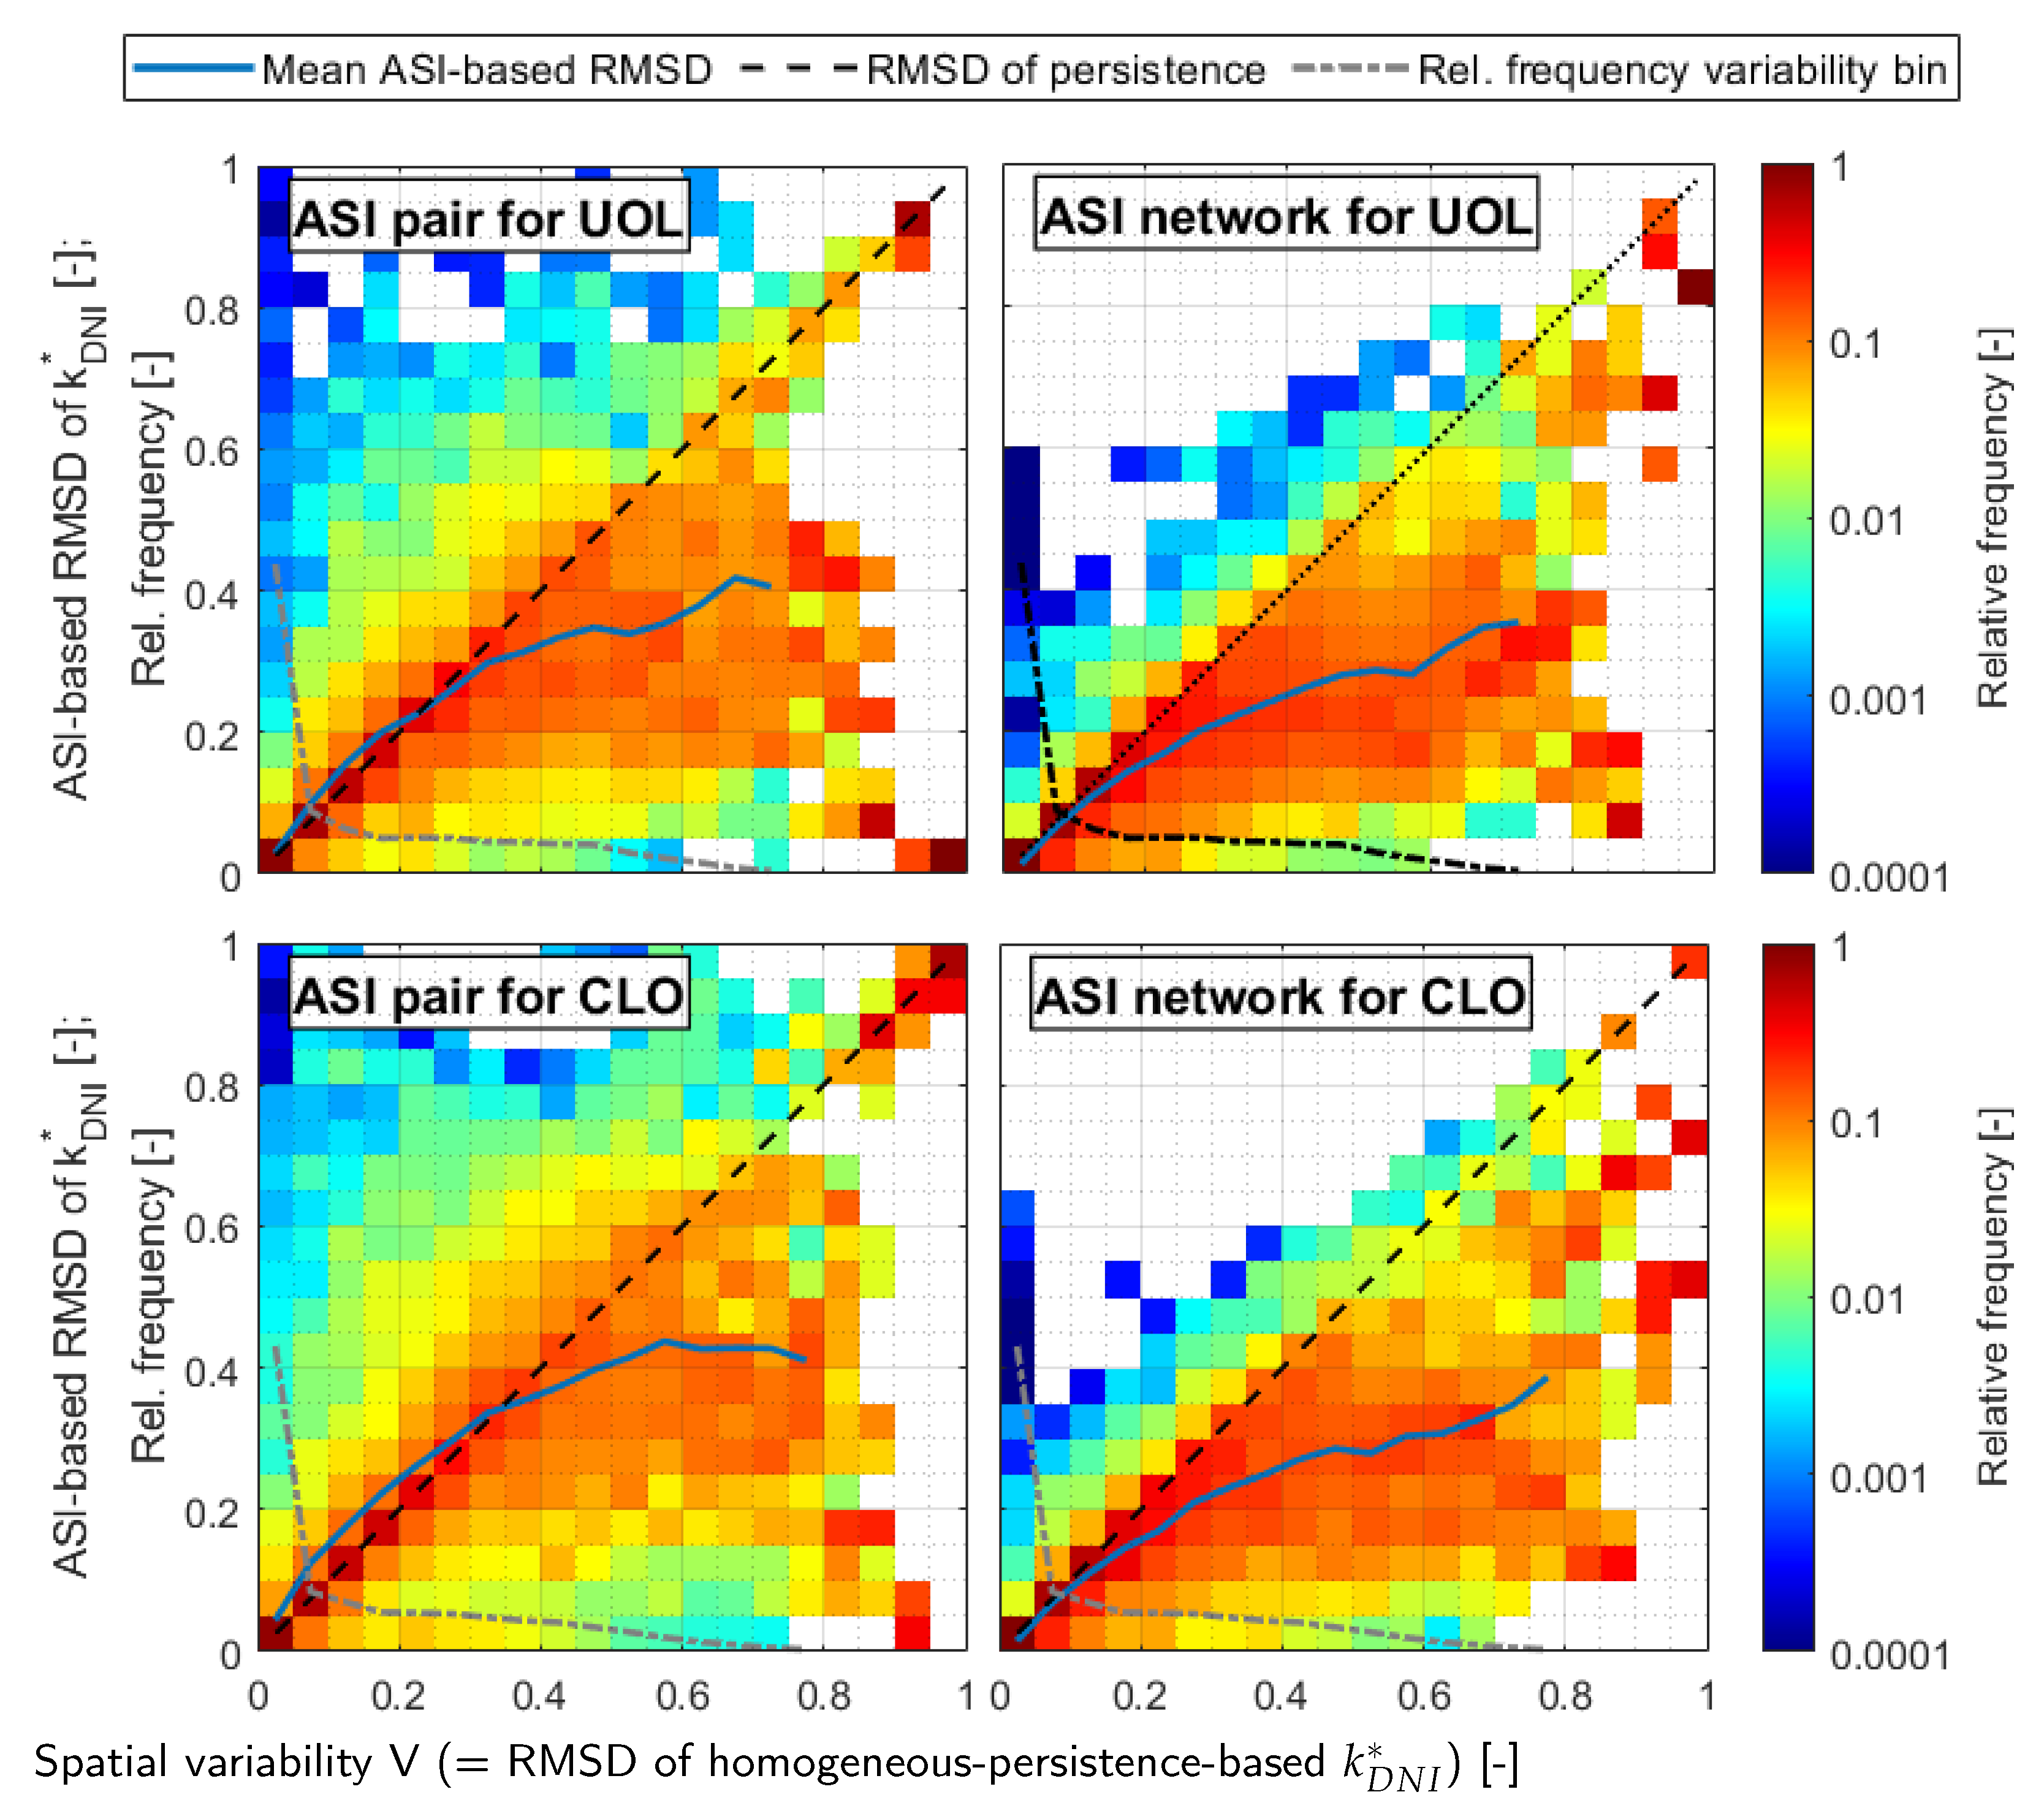
Thus far, we evaluated the analysis approaches’ deviations over temporal variability which was derived from a single RSI. Next, the deviations are studied over spatial variability derived from two separate RSIs. Spatial variability of k D N I * is calculated by a quantitative definition. Marquez et al. [69] defined temporal variability as the RMSD of k D N I * derived by a persistence forecast. Analogously, here, spatial variability V is defined as the RMSD of the k D N I * derived by homogeneous persistence for the location of interest (e.g., UOL or CLO).
Figure 12 is then created to relate the RMSD of an analysis approach to the spatial variability V: The 92 day dataset is grouped into floating 25-min windows. The window corresponding to a timestamp contains the timestamps from 25 min before until the evaluated timestamp. Thus, as many windows are yielded as there are timestamps in the dataset. For each 25-min window, a data pair of V and the RMSD of the ASI-based estimation of k D N I * is calculated. Then, V is discretized into bins with the edges (0, 0.05 , 0.1 , , 1). The ASI system’s RMSD is averaged over all windows for which V ranges in the respective bin (blue curve in Figure 12). Furthermore, the distribution of the ASI system’s RMSD is evaluated for each bin of V. For this, the ASI system’s RMSD is also discretized into bins with the edges (0, 0.05 , 0.1 , , 1). Subsequently, the relative frequency of the RMSD bins is plotted for each bin of V (color coding in Figure 12). Accordingly, the sum of the relative frequency equals one in each column of the plot. To evaluate the relevance of situations with a certain level of V, the relative frequencies of the variability bins are also plotted (grey dash-dotted curve). The mean RMSD is not plotted for bins of V with an absolute frequency of less than 100. A similar graph was suggested by Schmidt et al. [21] who related the RMSD of a nowcast to temporal variability.
Figure 12 (top row) evaluates the estimations for UOL. Note that it is desired to receive a low RMSD from an ASI-based system under all conditions also if there is an increased level of variability V. Accordingly, in the plots, increased relative frequencies of the RMSD further below the main diagonal indicate a higher accuracy of the evaluated ASI-based system. As to be expected, both ASI-based estimations increasingly outperform homogeneous persistence (black dashed line) at increased V. As indicated by the plotted relative frequencies of the variability bins (grey dash-dotted line), a large share of the situations corresponds to homogeneous and, in particular overcast conditions, which are typically spatially homogeneous in terms of DNI, exhibiting V < 0.05 . The ASI pair is less accurate than homogeneous persistence up to V 0.25 at UOL. Remarkably, the ASI network outperforms homogeneous persistence for all bins of V. The ASI network is noticeably more accurate than the ASI pair for any value of V. Additionally, the ASI network’s advantage over homogeneous persistence increases steadily with variability. Only for bins with very few occurrences can this trend not be verified. For instance, at V = 0.4 , the ASI network reduces the RMSD to 63 % of the RMSD of homogeneous persistence. Only for the rare cases of V > 0.7 can the performance of the ASI network not be evaluated reliably based on the small number of occurrences.
Figure 12 (bottom row) evaluates estimations for CLO. The ASI network performs very similar at CLO and UOL. This is interesting as an ASI is located right near radiometer station CLO, whereas the nearest ASI is located 2.4 km from UOL. Consequently, the ASI network will predict DNI in the whole urban area, which is surrounded by ASIs, at a similarly high accuracy. The ASI pair in turn is clearly less accurate at CLO than at UOL. CLO is located 3.8 km south of the ASIs which form the ASI pair DON-FLE. For the cloud conditions and sun elevations typical to the site, clouds shading CLO are frequently on the edge or outside the ASI pair’s field of view leading to low quality of the ASI-pair-based estimations for this location.
Overall, it is indicated that the ASI network represents spatial variability noticeably more accurately compared to simpler approaches such as an ASI pair or homogeneous persistence based on an RSI. This supports the validity of the presented procedure to model cloud geometry and attenuation. Beyond that, the distribution of the solar resource within the area of a city can be resolved in real time at increased accuracy. As shown, the ASI network can in particular reduce the uncertainty during more extreme situations with increased spatial variability. By a single radiometer, the presence of such a situation may not even be recognized.

4.4. Correlation of Predicted and Measured DNI

The correlation of measured and estimated k D N I * is further analyzed exemplarily for station UOL by scatter-density plots. The panels in the left column of Figure 13 provide the relative frequency for data pairs of measured and predicted k D N I * . Homogeneous persistence (top row), the ASI network (center row) and ASI pair (bottom row) are evaluated. Firstly, a notable fraction of the dataset features steady conditions, during which all estimations including homogeneous persistence (Figure 13, top, left) are well aligned with the main diagonal. Furthermore, situations with high cloud coverage and high cloud attenuation are most dominant at the site. This leads to a large share of timestamps for which either measured k D N I * is close to zero (first row in the scatter-density plots) or predicted k D N I * is close to zero (bottom row in the scatter-density plots). In particular in these situations, the ASI network is more accurate. If the measured or the ASI-network-based k D N I * is in the bin 0 0.05 , the counterpart (ASI-network-based, measured k D N I * ) typically also ranges at a rather small value. For persistence (Figure 13, top row) and for the ASI pair (Figure 13, bottom row), this relationship is less clear. If the measured or the ASI-pair-/persistence-based k D N I * is in the bin 0 0.05 , the counterpart (ASI-pair-/persistence-based, measured k D N I * ) frequently ranges at increased values of up to 1.
The panels in the right column of Figure 13 are normalized column-wise. The sum of the relative frequencies is one in each column of these scatter-density plots. This way, the plots indicate the approaches’ accuracy at a given reference k D N I * . In these plots, all analysis approaches tend to predict a very low k D N I * and thus underestimate the parameter. This effect is again caused by the dominance of very low k D N I * values at the site. The ASI network (center row) is most accurate in this evaluation. The ASI network’s estimation of k D N I * is in general more aligned with the main diagonal, compared to the other approaches. A better alignment with the main diagonal is seen clearest in the range of k D N I * in 0.05 0.5 . The 25th-, 50th-, 75th-percentiles received from the distinct approaches are plotted as black dashed and dotted lines in the panels in the right column of Figure 13. A comparison of these percentiles supports this finding. In addition, the ASI network apparently reduces the frequency of outliers to some extent. This can be seen from the 5th- and 95th-percentiles shown in each panel (black solid lines).
As a summary of the scatter-density plots, the coefficient of determination R 2 indicates a noticeably higher correlation of the ASI network’s analysis of k D N I * , over the ones from ASI pair and homogeneous persistence, with an R 2 value of 0.84 , 0.73 and 0.63 , respectively. Recall that R 2 indicates in this context which fraction of the variance of k D N I * is explained by the respective estimation. Interestingly, homogeneous persistence also yields an increased value of R 2 . This means that a variation of k D N I * from its mean value over the complete dataset often occurs simultaneously at both radiometers (DON and UOL), in spite of the stations’ considerable distance. This reflects that the overall atmospheric conditions are often homogeneous within the urban area (e.g., rather overcast or rather low cloud coverage). However, in particular, the ASI network can improve noticeably over this benchmark.

5. Conclusions

This publication presented a novel procedure by which an ASI network models clouds and assigns cloud attenuation to the sky over every location in the analyzed area. The approach is suited to combine the information from ASIs which monitor clouds from very different perspectives. First, from the sky images of each ASI, clouds were detected and assigned to classes. Then, a map of attenuation index A I was derived from each ASI image. These maps were combined by an accuracy-weighted average. The average assigned a higher weight to the grid cell of a map, the lower the local uncertainty of the map was. The local uncertainty of each map was determined based on geometric considerations and validation results reported in the literature. The merged map of A I was projected to the ground according to sun position and cloud height. A probabilistic procedure finally adjusted the relationship of A I and cloud attenuation in real-time, evaluating present, recent and more historic maps of A I together with the cloud attenuation derived from the DNI measurement of a rotating shadowband irradiometer (RSI).
The ASI network’s procedure to model clouds, assign cloud attenuation and finally estimate DNI was benchmarked against the homogeneous persistence analysis of DNI, which used only the RSI, and against the analysis from a state-of-the-art ASI pair. By the evaluation of spatially separated measurements, this validation was carried out only based on lead time 0 s, i.e., analysis data. This allowed for examining the accuracy of the cloud modeling alone and to exclude deviations which could be caused by a cloud tracking procedure. The validation dataset consisted of 92 days which were selected to represent the atmospheric conditions in Oldenburg in the year 2020. This validation dataset is large compared to the ones used in many recent validations of ASI-based systems e.g., [21,28,33,40,41,44,45,46]. Still, the results may change to some extent if a different dataset with distinct atmospheric conditions is evaluated.
The statistical evaluation attested a noticeably increased accuracy of the ASI network over an ASI pair as well as over homogeneous persistence for the overall dataset and for any of the studied conditions. For example, for the overall dataset and DNI, the ASI network yielded an RMSD of 136 W/m 2 , whereas the ASI pair and homogeneous persistence yielded an RMSD of 173 W/m 2 and 213 W/m 2 , respectively. Atmospheric conditions were distinguished by variability classes and also by a quantitative definition of variability. An inspection of the coefficient of determination ( R 2 ) and of scatter-density plots confirm that the ASI network’s estimations ( R 2 = 0.84 ) are noticeably more correlated with the reference measurement of DNI than the other systems’ estimations (ASI pair: R 2 = 0.73 ; homogeneous persistence: R 2 = 0.63 ). The validation was also evaluated GHI to allow a further comparison with the literature. Thus, the quantitative results of Section 4.2Section 4.4 support the indication from the initial evaluation of exemplary situations in Section 4.1: The ASI network locates cloud shadows more accurately and also performs better during complex cloud conditions providing a more graduated estimation cloud attenuation. At the same time, the ASI network detects slight variations of the cloud attenuation which brings an advantage over homogeneous persistence even in comparably homogeneous conditions. Therefore, the ASI network has an advantage over the reference approaches when variations of DNI need to be predicted.
Besides DNI, GHI was also estimated. It should be noted that GHI was calculated from DNI and DHI, which was modeled as spatially homogeneous. The modeling of DHI used in this study can be enhanced using the technique of Blum et al. [37]. This would bring an additional advantage to the ASI network. In the experiments, the ASI network was compared to an exemplary ASI pair. Schmidt et al. [21] presented a validation which focused on the spatio-temporal performance of an ASI-based analysis of solar irradiance. The ASI-based system studied by Schmidt et al. [21] with its single ASI in combination with a ceilometer is expected to be comparable to the ASI pair used as benchmark here. The discussed effects seen in this validation are qualitatively in agreement with Schmidt et al. [21], who classified cloud conditions by the dominant cloud type instead of by variability classes. Based on that study, the increased negative bias seen for the ASI pair for the more variable classes 4 , 6 , 7 is reasonable as perspective errors become more pronounced under these conditions. The ASI network reduced this bias to some extent, which also indicates that the ASI network reduces perspective errors.
Regarding the RMSD of estimated GHI, Schmidt et al. [21] found that their ASI system outperformed homogeneous persistence more clearly at large distances from the ASI and at increased variability. This effect is expected as in general the cross-correlation of irradiance in two points reduces if their distance and spatial variability increase. In that study, the ASI did not outperform homogeneous persistence at any distance for clear sky conditions or if cloud types related to low variability were present. In the present evaluation, a similar effect is found while the ASI pair still slightly outperforms homogeneous persistence in variability classes 5 , 8 . On the other hand, for more variable conditions, Schmidt et al.’s ASI [21] outperformed homogeneous persistence at distances larger than 1…6 km depending on the conditions. For clouds of type cumulus and at a distance from the ASI of around 3.8 km, this study found an RMSD of homogeneous persistence of around 240 W/m 2 , whereas the ASI yielded around 220 W/m 2 , both for GHI. Here, the ASI pair has a similar or rather increased accuracy, with an RMSD typically reduced by more than 10 % over homogeneous persistence. The strong advantage found here for the ASI network is therefore expected to also hold in comparison to other ASI-based systems besides the specific ASI pair evaluated here.
This study represents one of the first research works on the use of an ASI network to analyze solar irradiance. There is a number of enhancements that are not implemented and investigated yet. Eye2Sky was still under construction during our experiments. The cloud modeling procedure can profit from Eye2Sky’s extension. Thus, smaller errors and a higher spatial coverage may be achieved by the ASI network in the future. Furthermore, only one meteorological station was included in the analysis, and the remaining stations were reserved for validations. In the regular operation, the remaining meteorological stations of Eye2Sky should be included to further increase the ASI network’s accuracy. In a second step, Eye2Sky could be extended cost-effectively by one (e.g., photodiode-based) pyranometer per ASI station. Together with the method of [37] to measure DHI by the ASI image, this would allow for determining DHI, DNI and with it cloud attenuation comparably accurately in many points of the Eye2Sky region. These additional measurements could further support the present approach to estimate cloud attenuation. Additionally, with the help of a larger number of dispersed pyranometers, the present assignment of cloud attenuation based on the local attenuation index by a piece-wise linear fitted function may be refined by a machine learning model.
The approach presented here is versatile and is promising to predict further probabilistic quantities. Besides expected attenuation, the distribution of attenuation may also be estimated in the future. Firstly, by modifying the loss function, the approach can predict e.g., the spatial distribution of attenuation quantiles. Secondly, by logging and fitting to other quantities besides cloud attenuation and modifying the constraints to the optimization if required, the spatial distribution of e.g., ramps of photovoltaic production could also be predicted.
The ASI network’s cloud modeling procedure will be used to nowcast solar irradiance and photovoltaic production. In a future study, we will present and validate the final nowcasting system. Additionally, we will present combination strategies of the ASI network’s and satellite-based analyses and nowcasts to provide grid operators and energy traders with accurate nowcasts for the very short term and up to multiple hours ahead. Furthermore, it may be considered to use the ASI network’s analyses of cloud attenuation as input to NWP models.

Author Contributions

Conceptualization, N.B.B.; methodology, N.B.B.; software, N.B.B. and B.N.; validation, N.B.B. and B.N.; formal analysis, N.B.B.; investigation, N.B.B.; resources, T.V., J.S., J.E.L.G. and T.S.; data curation, J.E.L.G., J.S., T.S. and N.B.B.; writing—original draft preparation, N.B.B. and S.W.; writing—review and editing, N.B.B., S.W., B.N., J.S., J.E.L.G., T.S., D.H., T.V., A.K. and R.P.-P.; visualization, N.B.B.; supervision, S.W., D.H., A.K. and R.P.-P.; project administration, S.W., D.H., T.V. and B.N.; funding acquisition, S.W., D.H., T.S., T.V. and B.N. All authors have read and agreed to the published version of the manuscript.

Funding

This research received funding from the European Union’s Horizon 2020 research and innovation programme under Grant No. 864337 (Smart4RES project).

Data Availability Statement

Used all-sky images and measurements are the property of DLR, Institut für Vernetzte Energiesysteme and can be requested from the corresponding author. Processed data presented in this publication can be requested from the corresponding author ([email protected]).

Acknowledgments

We would like to thank Norman Noske, Ontje Lünsdorf and Hans-Hermann Redenius for their assistance in setting up the ASI network’s hardware and data acquisition.

Conflicts of Interest

The authors declare no conflict of interest.

Appendix A. Estimating the Uncertainty in Maps of the Attenuation Index

In the following, we aim to provide a simple estimation of the uncertainty present in the maps of A I received from the individual ASIs. As clouds are complex structures and as the ASI-based image acquisition and processing operations are similarly complex, this estimation relies on a number of rough approximations. At this point, we aim to account approximately for the most pronounced influences.
The map of A I derived from one ASI alone is affected by sources of uncertainty which can be classified into perspective uncertainty, uncertainty related to the camera alignment and internal calibration, uncertainty stemming from the image segmentation procedure and uncertainty related to inaccuracies in recognized CBH. These individual uncertainties are expected to be independent from each other. The combined uncertainty of A I in each grid cell ( x , y ) of the map is then computed as:
u i , x , y = u θ 2 + u b a s e 2 + u c i r c u m s o l a r 2 + u b o u n d a r y 2 ,
where i indicates the ASI used to generate the map of A I . u θ , u b a s e , u c i r c u m s o l a r , u b o u n d a r y indicate the uncertainties mentioned above. These terms are introduced one-by-one in the following.
Figure A1 (center) illustrates a typical ASI image. Towards the horizon, the image distortion is clearly visible, showing clouds rather from a side perspective. Cloud properties are in general monitored with increased uncertainty at a larger zenith angle θ due to this distortion: The horizontal location of a cloud property is determined less accurately, clouds obstruct each other and cloud side faces are mistaken for cloud bottom sides. The undistorted ASI image, i.e., orthoimage, shown in Figure A1 (right), exhibits this effect. Cloud side faces appear radially stretched, in particular at larger θ . This perspective uncertainty induced by image distortion is expected to be more pronounced if observed clouds have a notable cloud thickness [21,44].
Similarly, a random disturbance of the position of an image feature, such as a cloud edge, by for instance Δ θ = 0 . 5 (e.g., caused by an inaccurate calibration of the ASI’s optics) would also translate into a deviation of the feature’s horizontal location. This uncertainty goes back to the horizontal resolution of the original ASI image, which decreases over θ . The deviation would increase with the ratio of the cloud edge’s horizontal distance from the camera s to the cloud’s height over ground, which is typically CBH [45]. This deviation Δ b of a cloud edge’s horizontal position can be approximated as Δ b / C B H = π / 180 Δ θ / cos ( θ ) . Based on Wang et al. [70], the cloud thickness is typically notable with a median of around 800 m. Therefore, the perspective uncertainty is expected to be more dominant.
Figure A1. Left: The uncertainty of cloud edge positions Δ b is estimated from the ASI’s perspective on clouds with a cloud thickness d observed under zenith angle θ . Center: Exemplary sky image from ASI UOL, taken at 5 June 2020 10:22:00, featuring clouds at various zenith angles; for large zenith angles, rather the side faces of clouds than their bottom sides are viewed, causing the impression of increased cloud coverage in these areas of the sky. Right: Undistorted ASI image (UOL, 5 June 2020 10:22:00) treated as a view of the cloud bottom sides by the ASI-based approaches.
Remotesensing 14 05685 g0a1
For the merging procedure, these considerations should be expressed quantitatively. On the edge of each cloud, an area Δ A is expected to be classified erroneously as cloud or sky, due to perspective uncertainty. Δ A depends on the zenith angle θ under which the respective cloud edge is observed. An uncertainty in the assignment of sky/cloud is expected where clouds’ side surfaces facing the ASI are viewed. The cloud edge is recognized by a distance Δ b too close to the ASI’s location. The area Δ A covered by Δ b · w is thus recognized erroneously as cloud. w is the cloud’s width in the direction perpendicular to the cloud edge. From Figure A1 (left), it can further be estimated that Δ b = d tan ( θ ) , using the expected cloud thickness d. This uncertainty occurs at each of the n c l o u d s cloud edges which are present in the area A monitored by the ASI. The average number of cloud edges per area monitored by the ASI ( n c l o u d s / A ) as well as the cloud thickness d and cloud width w are expected to be specific to the monitored cloud conditions. The uncertainty of A I associated with the ASI’s perspective is then estimated as
u θ = Δ A / A = tan ( θ ) · d · w · n c l o u d s / A .
The term d w n c l o u d s / A is set to 1 / 3 . This is a rough approximation based on geometric considerations, typical cloud thicknesses and relevant literature. Appendix B derives this value.
In line with prior studies e.g., [46], cloud segmentation is expected to be a major contributor of uncertainty in the ASI-based prediction of solar irradiance. Therefore, the uncertainty of the cloud segmentation procedure needs to be considered for the present merging procedure of A I . While the segmentation technique used here is expected to provide a high accuracy, deviations still remain. The cloud segmentation detects each image pixel either as sky, low-, mid- or high-layer cloud. Based on the relationship of cloud classes and A I shown in Table 3, a deviation of an image pixel’s detected cloud class can be translated into a deviation of A I . Fabel et al. [41] found that the cloud segmentation assigns 86 % of all pixels to the correct class. According to Fabel et al. [41], errors of the method are often caused by confusing rather similar cloud classes, i.e., confusing: sky and high layer clouds, high and mid-layer clouds as well as mid and low layer clouds. As shown in Table 3, a confusion between similar cloud classes would cause an error of A I of not more than 0.5 . As a simplification, we assume that in 86 % of the image pixels no error, in 7 % of the pixels a confusion between similar classes with an error of A I of 0.5 and in 7 % of the pixels a confusion between sky and thick cloud with an error of A I of 1 occurs. As rather similar cloud classes are confused more often, the share of 7 % in the latter case may be rather conservative. The uncertainty of A I resulting from the cloud segmentation is estimated as u b a s e = 0.07 · 0.5 + 0.07 · 1 + 0.86 · 0 0.1 .
On top of u b a s e , the segmentation procedure is expected to be less accurate in parts of the ASI image which are close to the sun’s position. In this region, glare effects disturb the segmentation. This disturbance is of particular relevance in the ASI network as increased soiling of the ASIs’ lenses is observed for some of the ASIs and depending on the evaluated period. Consequently, for grid cells of the map in which A I is determined based on this circumsolar area of the ASI image, an additional uncertainty of A I is present:
u c i r c u m s o l a r = u ^ c i r c u m s o l a r · max ( 0 , 1 ( S P A / S P A c i r c u m s o l a r , m a x ) 2 ) ,
where the sun pixel angle  S P A indicates the angle between the sun’s center and the sky area based on which A I is determined in the grid cell of interest. The term takes on its maximum in the sun’s center with u ^ c i r c u m s o l a r = 0.3 . S P A c i r c u m s o l a r , m a x controls the S P A above which the correction is inactive. S P A c i r c u m s o l a r , m a x is set to 25 .
Finally, u b o u n d a r y in Equation (A1) assures a smooth transition between the ASI-based maps of A I :
u b o u n d a r y = m a x ( 0 , ( θ m a x θ ( x , y ) ) / 2 ) 1 , if θ < θ m a x , else .
θ m a x indicates the zenith angle up to which the ASI image is considered for the merger. In the present case, θ m a x = 78 is used. θ ( x , y ) indicates the zenith angle of the ASI image’s region which is used to determine A I in grid cell ( x , y ) .
Figure A2 (left) visualizes the combined uncertainty u i , x , y as well as its components discussed in this section over tan ( θ ) which corresponds to the distance of a grid cell in the map of A I from the ASI’s location normalized by the CBH in that grid cell. Over most of the ASI-based map of A I , the perspective uncertainty u θ contributes the major share to the combined uncertainty. At constant CBH, u θ scales linearly with the horizontal distance from the ASI. Towards small zenith angles of less than 45 as well as in the circumsolar area, uncertainties resulting from the segmentation contribute significantly to the combined uncertainty of A I . u b o u n d a r y causes u i , x , y to increase towards infinity as θ approaches θ m a x . The combined uncertainty u i , x , y surpasses 1 at tan ( θ ) 2.9 . This means, at larger values of tan ( θ ) , an uncertainty is estimated, which is larger than the maximum value of 1 which u i , x , y can take on based on its definition. Still, A I values from corresponding areas of the maps are not rejected completely but used with a small weight. This approach was chosen as a high spatial coverage even with low quality data may be beneficial in practical applications.
Finally, the uncertainty in the estimated local CBH is expected to affect the uncertainty of a single ASI’s map of A I significantly. This uncertainty is not accounted for by a separate term. Instead, it is accounted for implicitly by the merging procedure as described in the following Section 3.2.2.
Figure A2. Left: Uncertainties present in ASI-based maps of attenuation index A I , by source and combined, are plotted over the grid cell’s distance (s) from the ASI normalized by local cloud base height (CBH). Right: Associated weights are plotted. s / C B H is equivalent to the tangent of the zenith angle ( tan ( θ ) ), under which the ASI observes the grid cell of the map. The ASI images are evaluated up to a zenith angle θ = 78 . The circumsolar and consequently the combined weight are shown here for the direction which coincides with the sun’s azimuth angle on 5 June 2020 10:22:00.
Remotesensing 14 05685 g0a2

Appendix B. Derivation of the Uncertainty Related to Perspective Errors

In this section, we aim to estimate the term d w n c l o u d s / A from Equation (A2) quantitatively. This estimation focusses on cumulus clouds as these clouds have a comparably high attenuation. Due to the high attenuation, this cloud type is of particular relevance in the ASI-based estimation of solar irradiance. First, the geometrical cloud thickness d is set to 600 m. This value corresponds with the median cloud thickness of Dong et al. [71] but is smaller than the value of 800 m found by Wang et al. [70]. This rather small value is selected to better represent low and optically thick clouds.
Rodts et al. [72] and Sengupta et al. [73] studied the size distribution of cumulus clouds. Sengupta et al. [73] suggested to describe the number of clouds with a specific linear size in an area A by a cloud number density ρ c l o u d s , as follows:
ρ c l o u d s ( ) = ρ 0 · ( / k m ) b ρ ,
where ρ 0 and b ρ are empiric coefficients. ρ 0 is related to the overall number of clouds in the area A and has the unit km 1 . The number of clouds in a range of can be calculated by integrating ρ c l o u d s over this range of . Sengupta et al. [73] used a cloud’s diameter as . Based on Sengupta et al. [73], we select b ρ = 1.9 if < 1 km and b ρ = 3.3 otherwise.
Rodts et al. [72] set to the square root of the cloud’s area. Furthermore, Rodts et al. [72] expressed the cloud cover ( σ ) as the area covered by all n c l o u d s clouds divided by the overall area ( A ), as folllows:
σ = 1 A m i n m a x 2 · ρ c l o u d s ( ) d .
We rearrange Equation (A6) and insert Equation (A5) to express A as follows:
A = 1 σ m i n m a x 2 · ρ 0 · ( / k m ) b ρ d
We estimate the parameters in the above equation as follows. As highly variable conditions are of highest interest in the application of ASI systems, we set the cloud cover, i.e., the fraction of the sky which is covered by clouds to σ = 0.6 . Clouds with a diameter of less than half of the grid resolution will be overseen by the ASI network. Therefore, we set m i n = 25 m. Furthermore, we set the maximum size of a cloud which can be monitored by the ASI network to the spatial extent of Eye2Sky: m a x = 100 km. We insert these estimations and calculate A :
A = 5.6 k m 2 · ρ 0 .
Furthermore, we need to estimate the term w · n c l o u d s . We defined w as the average width of a cloud. Then, w · n c l o u d s corresponds to the cumulated width of all n c l o u d s clouds. Similar to Rodts et al. [72], we assume that an individual cloud’s width equals . Consequently, w · n c l o u d s can be calculated by weighting each linear cloud size () with the frequency at which it occurs (i.e., with the cloud number density, ρ c l o u d s ) and integrating over the whole range of observed :
w n c l o u d s = m i n m a x · ρ c l o u d s ( ) d
Again, we insert the cloud number density (Equation (A5)):
w n c l o u d s = m i n m a x · ρ 0 · ( / k m ) b ρ d .
For m i n , m a x and b ρ , the same estimations as above are used. We compute:
w n c l o u d s = 3.4 k m · ρ 0 .
We combine Equations (A8) and (A11) and the geometrical cloud thickness d = 600 m to estimate the term required for Equation (A2):
d w n c l o u d s A = 0.6 k m · 3.4 k m · ρ 0 5.6 k m 2 · ρ 0 = 0.3643 1 / 3 .
The approximation of this section is rough. In practice, the term d w n c l o u d s / A will vary depending on the present cloud conditions. A possible enhancement would be to estimate w · n c l o u d s / A from ASI-based cloud shadow maps which could be implemented easily. This approach was rejected so far as the estimation can be affected strongly by deviations and artifacts in the cloud segmentation and cloud height detection. The evaluations completed for this thesis suggested a high robustness of both components. Consequently, this enhancement could be added in the future.

Appendix C. A Piecewise Linear Fit Function for the Relationship of AI and A

A function A ^ is fit to represent the relationship of AI and A based on the weighted observations of AI and A . A ^ is required to increase monotonically with AI . Attenuation is expected to range between zero and one. Accordingly, the range of values taken on by the function is restricted to the same interval. A piecewise linear function is used as a base function of the fit:
ssf m , ξ low , ξ up ( ξ ) = 0 , if ξ ξ low m , if ξ ξ up m · ξ ξ low / ξ up ξ low , else .
This smooth step function of order zero is parametrized by the magnitude m of the step and the lower ξ low and upper bound ξ up which limit the step’s edge.
A set of these base functions is summed to receive the fit function A ^ :
A ^ ( AI ) = i = 0 N A ssf m i , ( i 1 ) / N A , i / N A ( AI ) .
Based on the observations of AI and A , the parameter m i needs to be found for each one i of the base function’s N A + 1 instances, with the restrictions:
m i 0 i [ 0 , 1 , , N A ]
and
i = 0 N A m i 1 .
In the case of m 0 > 0 , A ^ ( 0 ) will be larger than zero.

Appendix D. Definition of Representative Datasets

In Section 2.2, datasets have been introduced which represent the year 2020, the dates included in each of these datasets are given in the following.
The 30 day development dataset contains the following days of 2020: 13, 24 January; 04, 15, 26 February; 08, 13, 19 March; 10, 21 April; 13, 24 May; 03, 15, 26 June; 07, 18, 29 July; 07, 09, 20, 31 August; 11, 22 September; 03, 13, 25 October; 05, 16, 27 November.
The 28 day validation dataset contains the following days of 2020: 14, 25 January; 05, 16, 27 February; 09, 14, 20 March; 11 April; 25 May; 05, 16, 27 June; 08, 19, 30 July; 08, 10, 21 August; 01, 12, 23 September; 04, 15, 26 October; 06, 17, 28 November.
The 92 day validation dataset contains the following days of 2020: 14, 15, 16, 17, 25, 26, 27, 28 January; 05, 06, 07, 08, 16, 17, 18, 19, 27, 28, 29 February; 09, 10, 11, 14, 15, 16, 20, 21, 22 March; 11, 12, 13, 15, 17, 18, 19, 24 April; 15, 16, 25, 26, 27 May; 05, 06, 07, 16, 17, 18, 27, 28, 29 June; 08, 09, 10, 11, 19, 20, 21, 22, 30, 31 July; 01, 02, 08, 10, 11, 12, 13, 21, 22, 23, 24 August; 01, 02, 03, 04, 12, 13, 14, 15, 23, 24, 25, 26 September; 04, 05, 06, 15, 16, 17, 26, 27, 28 October.

References

  1. Mahdavi, N.; Braslavsky, J.H.; Seron, M.M.; West, S.R. Model predictive control of distributed air-conditioning loads to compensate fluctuations in solar power. IEEE Trans. Smart Grid 2017, 8, 3055–3065. [Google Scholar] [CrossRef]
  2. Ghosh, S.; Rahman, S.; Pipattanasomporn, M. Distribution voltage regulation through active power curtailment with PV inverters and solar generation forecasts. IEEE Trans. Sustain. Energy 2016, 8, 13–22. [Google Scholar] [CrossRef]
  3. Saleh, M.; Meek, L.; Masoum, M.A.S.; Abshar, M. Battery-Less Short-Term Smoothing of Photovoltaic Generation Using Sky Camera. IEEE Trans. Ind. Inform. 2018, 14, 403–414. [Google Scholar] [CrossRef]
  4. Kaur, A.; Nonnenmacher, L.; Pedro, H.T.; Coimbra, C.F. Benefits of solar forecasting for energy imbalance markets. Renew. Energy 2016, 86, 819–830. [Google Scholar] [CrossRef]
  5. Ryu, A.; Ishii, H.; Hayashi, Y. Battery smoothing control for photovoltaic system using short-term forecast with total sky images. Electr. Power Syst. Res. 2020, 190, 106645. [Google Scholar] [CrossRef]
  6. Kurzrock, F.; Hochebner, A.; Millerioux, Q.; Schmutz, N.; Reinhardt, M.; Acevedo, W.; Potthast, R. Hour-scale cloud cover forecasting using WRF and an infrared all-sky imager. In Proceedings of the EMS Annual Meeting 2022, Bonn, Germany, 5–9 September 2022. [Google Scholar]
  7. Hammer, A.; Nouri, B. Advanced weather forecasting for Renewable Energy System applications: Multi-source observations to improve solar forecasting within the Smart4Res project. In Proceedings of the ISGAN—International Smart Grid Action Network, Smart4RES Webinar Series No. 3.2 Data Observation & Assimilation, Online, 29 April 2021. [Google Scholar]
  8. Huxley, O.T. Measuring the Uncertainty Associated with Estimating National Photovoltaic Electricity Generation: A Great Britain Case Study. Ph.D. Thesis, University of Sheffield, Sheffield, UK, 19 July 2021. [Google Scholar]
  9. Sengupta, M.; Habte, A.; Wilbert, S.; Gueymard, C.; Remund, J. Best Practices Handbook for the Collection and Use of Solar Resource Data for Solar Energy Applications; Technical Report; National Renewable Energy Lab. (NREL): Golden, CO, USA, 2021.
  10. Bright, J.M.; Killinger, S.; Lingfors, D.; Engerer, N.A. Improved satellite-derived PV power nowcasting using real-time power data from reference PV systems. Sol. Energy 2018, 168, 118–139. [Google Scholar] [CrossRef]
  11. Benz, T.; Dickert, J.; Erbert, M.; Erdmann, N.; Johae, C.; Katzenbach, B.; Glaunsinger, W.; Müller, H.; Schegner, P.; Schwarz, J. Der Zellulare Ansatz—Grundlage einer Erfolgreichen, Regionen Übergreifenden Energiewende; Technical Report; VDE e.V.—Verband der Elektrotechnik Elektronik Informationstechnik: Frankfurt am Main, Germany, 2015. [Google Scholar]
  12. Kleineidam, G.; Krasser, M.; Reischböck, M. The cellular approach: Smart energy region Wunsiedel. Testbed for smart grid, smart metering and smart home solutions. Electr. Eng. 2016, 98, 335–340. [Google Scholar] [CrossRef]
  13. Volk, K.; Rupp, L.; Konermann, M. Grid-Control—Optimiertes Engpassmanagement durch Dynamischen-Quotenbasierten Netzampelansatz; Technical Report; Netze BW GmbH: Stuttgart, Germany, 2018. [Google Scholar]
  14. Nordmann, T. PV Eigenverbrauch und Eigenverbrauchsgemeinschaften Energiepolitik nach Schweizer Art–Ein Werkstattbericht. In Proceedings of the 34. PV-Symposium Bad Staffelstein, Bad Staffelstein, Germany, 19–21 March 2019; pp. 135–145. [Google Scholar]
  15. Sun, C.; Sun, F.; Moura, S.J. Nonlinear predictive energy management of residential buildings with photovoltaics & batteries. J. Power Sources 2016, 325. [Google Scholar] [CrossRef] [Green Version]
  16. Wille-Haussmann, B.; Brunner, M.; Gerhardt, N.; ETG, M.K.; Mayrhofer, P.; LEW, A.P.; Rummeni, J. Wärme-und Kälteversorgung in Städten und Regionen mit Hohen Anteilen an Erneuerbaren Energien in der Stromversorgung. In Proceedings of the VDE Kongress, Frankfurt am Main, Germany, 20–21 October 2014. Authors: Thank you this is fine. [Google Scholar]
  17. Fischer, D.; Madani, H. On heat pumps in smart grids: A review. Renew. Sustain. Energy Rev. 2017, 70, 342–357. [Google Scholar] [CrossRef] [Green Version]
  18. Lazos, D.; Sproul, A.B.; Kay, M. Optimisation of energy management in commercial buildings with weather forecasting inputs: A review. Renew. Sustain. Energy Rev. 2014, 39, 587–603. [Google Scholar] [CrossRef]
  19. Uebermasser, S.; Groiss, C.; Einfalt, A.; Thie, N.; Vasconcelos, M.; Helguero, J.; Laaksonen, H.; Hovila, P. Requirements for coordinated ancillary services covering different voltage levels. CIRED—Open Access Proc. J. 2017, 2017, 1421–1424. [Google Scholar] [CrossRef]
  20. Nouri, B.; Wilbert, S.; Blum, N.; Kuhn, P.; Schmidt, T.; Yasser, Z.; Schmidt, T.; Zarzalejo, L.F.; Lopes, F.M.; Silva, H.G.; et al. Evaluation of an All Sky Imager Based Nowcasting System for Distinct Conditions and Five sites. AIP Conf. Proc. 2020, 2303, 180006. [Google Scholar] [CrossRef]
  21. Schmidt, T.; Kalisch, J.; Lorenz, E.; Heinemann, D. Evaluating the spatio-temporal performance of sky-imager-based solar irradiance analysis and forecasts. Atmos. Chem. Phys. 2016, 16, 3399–3412. [Google Scholar] [CrossRef] [Green Version]
  22. Nouri, B.; Kuhn, P.; Wilbert, S.; Prahl, C.; Pitz-Paal, R.; Blanc, P.; Schmidt, T.; Yasser, Z.; Santigosa, L.R.; Heineman, D. Nowcasting of DNI maps for the solar field based on voxel carving and individual 3D cloud objects from all sky images. AIP Conf. Proc. 2018, 2033, 190011. [Google Scholar] [CrossRef] [Green Version]
  23. Peng, Z.; Yu, D.; Huang, D.; Heiser, J.; Yoo, S.; Kalb, P. 3D cloud detection and tracking system for solar forecast using multiple sky imagers. Sol. Energy 2015, 118, 496–519. [Google Scholar] [CrossRef] [Green Version]
  24. Nouri, B.; Noureldin, K.; Schlichting, T.; Wilbert, S.; Hirsch, T.; Schroedter-Homscheidt, M.; Kuhn, P.; Kazantzidis, A.; Zarzalejo, L.F.; Blanc, P.; et al. Optimization of parabolic trough power plant operations in variable irradiance conditions using all sky imagers. Sol. Energy 2020, 198, 434–453. [Google Scholar] [CrossRef]
  25. Howie, R.M.; Paxman, J.; Bland, P.A.; Towner, M.C.; Cupak, M.; Sansom, E.K.; Devillepoix, H.A. How to build a continental scale fireball camera network. Exp. Astron. 2017, 43, 237–266. [Google Scholar] [CrossRef]
  26. Spurny, P. Photographic monitoring of fireballs in Central Europe. In Proceedings of the Optical Science, Engineering and Instrumentation ’97, Small Spacecraft, Space Environments, and Instrumentation Technologies, San Diego CA, USA, 27 July–1 August 1997; pp. 144–155. [Google Scholar] [CrossRef]
  27. Bhatt, A.; Kendall, E.; Zalles, D.; Baumgardner, J.; Marshall, R.; Kaltenbacher, E. All Sky Imager Network for Science and Education. In Proceedings of the AGU Fall Meeting Abstracts, San Francisco, CA, USA, 3–7 December 2012; pp. ED33C–0775. [Google Scholar]
  28. Aides, A.; Levis, A.; Holodovsky, V.; Schechner, Y.Y.; Althausen, D.; Vainiger, A. Distributed Sky Imaging Radiometry and Tomography. In Proceedings of the 2020 IEEE International Conference on Computational Photography (ICCP), Saint Louis, MO USA, 24–26 April 2020; pp. 1–12. [Google Scholar] [CrossRef]
  29. SERIS. Sky Cameras. Available online: https://www.solar-repository.sg/sky-cameras (accessed on 8 July 2020).
  30. Chu, Y.; Li, M.; Pedro, H.T.C.; Coimbra, C.F.M. A network of sky imagers for spatial solar irradiance assessment. Renew. Energy 2022, 187, 1009–1019. [Google Scholar] [CrossRef]
  31. Straver, F. Pleidooi: Wolkencameras Kunnen Piek en Dip in Stroomvoorziening Voorkomen. Available online: https://www.trouw.nl/duurzaamheid-natuur/pleidooi-wolkencamera-s-kunnen-piek-en-dip-in-stroomvoorziening-voorkomen~b5486ffa/ (accessed on 29 November 2021).
  32. Schmidt, T.; Heinemann, D.; Vogt, T.; Blum, N.; Nouri, B.; Wilbert, S.; Kuhn, P. Energiemeteorologisches Wolkenkameranetzwerk für die Hochaufgelöste Kurzfristprognose der Solaren Einstrahlung. In Proceedings of the DACH-Tagung, Garmisch-Partenkirchen, Germany, 18–22 March 2019. [Google Scholar]
  33. Mejia, F.A.; Kurtz, B.; Levis, A.; de la Parra, Í.; Kleissl, J. Cloud tomography applied to sky images: A virtual testbed. Sol. Energy 2018, 176, 287–300. [Google Scholar] [CrossRef]
  34. Elsinga, B.; van Sark, W.G.J.H.M. Short-term peer-to-peer solar forecasting in a network of photovoltaic systems. Appl. Energy 2017, 206, 1464–1483. [Google Scholar] [CrossRef]
  35. Lorenzo, A.T.; Holmgren, W.F.; Cronin, A.D. Irradiance forecasts based on an irradiance monitoring network, cloud motion, and spatial averaging. Sol. Energy 2015, 122, 1158–1169. [Google Scholar] [CrossRef] [Green Version]
  36. Chen, X.; Du, Y.; Lim, E.; Wen, H.; Jiang, L. Sensor network based PV power nowcasting with spatio-temporal preselection for grid-friendly control. Appl. Energy 2019, 255, 113760. [Google Scholar] [CrossRef]
  37. Blum, N.B.; Wilbert, S.; Nouri, B.; Lezaca, J.; Huckebrink, D.; Kazantzidis, A.; Heinemann, D.; Zarzalejo, L.F.; Jiménez, M.J.; Pitz-Paal, R. Measurement of diffuse and plane of array irradiance by a combination of a pyranometer and an all-sky imager. Sol. Energy 2022, 232, 232–247. [Google Scholar] [CrossRef]
  38. Chauvin, R.; Nou, J.; Thil, S.; Grieu, S. Modelling the clear-sky intensity distribution using a sky imager. Sol. Energy 2015, 119, 1–17. [Google Scholar] [CrossRef] [Green Version]
  39. Kurtz, B.; Kleissl, J. Measuring diffuse, direct, and global irradiance using a sky imager. Sol. Energy 2017, 141, 311–322. [Google Scholar] [CrossRef]
  40. Nouri, B.; Blum, N.; Wilbert, S.; Zarzalejo, L.F. A hybrid solar irradiance nowcasting approach: Combining all sky imager systems and persistence irradiance models for increased accuracy. Solar RRL 2021, 6, 2100442. [Google Scholar] [CrossRef]
  41. Fabel, Y.; Nouri, B.; Wilbert, S.; Blum, N.; Triebel, R.; Hasenbalg, M.; Kuhn, P.; Zarzalejo, L.F.; Pitz-Paal, R. Applying self-supervised learning for semantic cloud segmentation of all-sky images. Atmos. Meas. Tech. 2022, 15, 797–809. [Google Scholar] [CrossRef]
  42. Meyer, R.; Torres Butron, J.; Marquardt, G.; Schwandt, M.; Geuder, N.; Hoyer-Klick, C.; Lorenz, E.; Hammer, A.; Beyer, H.G. Combining solar irradiance measurements and various satellite-derived products to a site-specific best estimate. In Proceedings of the 14th Biennial SolarPACES Symposium, Las Vegas, NV, USA, 4–7 March 2008. [Google Scholar]
  43. Ramirez, L.; Hanrieder, N.; Zarzalejo, L.; Landelius, T.; Müller, S.; Homscheidt, M.S.; Wilbert, S.; Dubranna, J.; Remund, J.; Vindel, J.M. Optimized DNI forecast using combinations of nowcasting methods from the DNICast project. In Proceedings of the SolarPACES Conference, Santiago, Chile, 26–29 September 2017. [Google Scholar]
  44. Nguyen, D.; Kleissl, J. Stereographic methods for cloud base height determination using two sky imagers. Sol. Energy 2014, 107, 495–509. [Google Scholar] [CrossRef]
  45. Nouri, B.; Kuhn, P.; Wilbert, S.; Hanrieder, N.; Prahl, C.; Zarzalejo, L.; Kazantzidis, A.; Blanc, P.; Pitz-Paal, R. Cloud height and tracking accuracy of three all sky imager systems for individual clouds. Sol. Energy 2019, 177, 213–228. [Google Scholar] [CrossRef] [Green Version]
  46. Nouri, B.; Wilbert, S.; Kuhn, P.; Hanrieder, N.; Schroedter-Homscheidt, M.; Kazantzidis, A.; Zarzalejo, L.; Blanc, P.; Kumar, S.; Goswami, N. Real-Time Uncertainty Specification of All Sky Imager Derived Irradiance Nowcasts. Remote Sens. 2019, 11, 1059. [Google Scholar] [CrossRef] [Green Version]
  47. Nouri, B.; Wilbert, S.; Segura, L.; Kuhn, P.; Hanrieder, N.; Kazantzidis, A.; Schmidt, T.; Zarzalejo, L.; Blanc, P.; Pitz-Paal, R. Determination of cloud transmittance for all sky imager based solar nowcasting. Sol. Energy 2019, 181, 251–263. [Google Scholar] [CrossRef] [Green Version]
  48. Mobotix. Technical Specifications MOBOTIX Q25 Hemispheric; Data Sheet; Mobotix AG: Langmeil, Germany, 2017. [Google Scholar]
  49. Alonso-Montesinos, J.; Batlles, F. The use of a sky camera for solar radiation estimation based on digital image processing. Energy 2015, 90, 377–386. [Google Scholar] [CrossRef]
  50. West, S.R.; Rowe, D.; Sayeef, S.; Berry, A. Short-term irradiance forecasting using skycams: Motivation and development. Sol. Energy 2014, 110, 188–207. [Google Scholar] [CrossRef]
  51. Kazantzidis, A.; Tzoumanikas, P.; Nikitidou, E.; Salamalikis, V.; Wilbert, S.; Prahl, C. Application of simple all-sky imagers for the estimation of aerosol optical depth. AIP Conf. Proc. 2017, 1850, 140012. [Google Scholar] [CrossRef] [Green Version]
  52. Wacker, S.; Gröbner, J.; Zysset, C.; Diener, L.; Tzoumanikas, P.; Kazantzidis, A.; Vuilleumier, L.; Stöckli, R.; Nyeki, S.; Kämpfer, N. Cloud observations in Switzerland using hemispherical sky cameras. J. Geophys. Res. Atmos. 2015, 120, 695–707. [Google Scholar] [CrossRef] [Green Version]
  53. Blum, N.B.; Nouri, B.; Wilbert, S.; Schmidt, T.; Lünsdorf, O.; Stührenberg, J.; Heinemann, D.; Kazantzidis, A.; Pitz-Paal, R. Cloud height measurement by a network of all-sky imagers. Atmos. Meas. Tech. 2021, 14, 5199–5224. [Google Scholar] [CrossRef]
  54. Scaramuzza, D.; Martinelli, A.; Siegwart, R. A Toolbox for Easily Calibrating Omnidirectional Cameras. In Proceedings of the RSJ International Conference on Intelligent Robots and Systems, Beijing, China, 9–15 October 2006; pp. 5695–5701. [Google Scholar] [CrossRef] [Green Version]
  55. Google; GeoContent; Technologies, M.; GeoBasis-DE/BKG. Google Maps. Available online: https://www.google.de/maps/@53.1571263,8.2126775,16367m/data=!3m1!1e3 (accessed on 29 November 2021).
  56. CSPS, C.S.P.S.G. Rotating Shadowband Irradiometer CSPS Twin-RSI Measurement Sensor for DNI, GHI and DHI; Technical Report; Concentrating Solar Power Services GmbH: Cologne, Germany, 2021. [Google Scholar]
  57. Forstinger, A.; Wilbert, S.; Driesse, A.; Kraas, B. Uncertainty Calculation Method for Photodiode Pyranometers. Sol. RRL 2022, 6, 2100468. [Google Scholar] [CrossRef]
  58. Geuder, N.; Wolfertstetter, F.; Wilbert, S.; Schüler, D.; Affolter, R.; Kraas, B.; Lüpfert, E.; Espinar, B. Screening and Flagging of Solar Irradiation and Ancillary Meteorological Data. Energy Procedia 2015, 69, 1989–1998. [Google Scholar] [CrossRef]
  59. Geuder, N.; Pulvermüller, B.; Vorbrugg, O. Corrections for rotating shadowband pyranometers for solar resource assessment. In Proceedings of the Solar Energy + Applications, Optical Modeling and Measurements for Solar Energy Systems II, San Diego, CA, USA, 11 September 2008. [Google Scholar] [CrossRef]
  60. Schroedter-Homscheidt, M.; Kosmale, M.; Jung, S.; Kleissl, J. Classifying ground-measured 1 minute temporal variability within hourly intervals for direct normal irradiances. Meteorol. Z. 2018, 27, 161–179. [Google Scholar] [CrossRef]
  61. Wilbert, S.; Nouri, B.; Prahl, C.; Garcia, G.; Ramirez, L.; Zarzalejo, L.; Valenzuela, R.; Ferrera, F.; Kozonek, N.; Liria, J. Application of Whole Sky Imagers for Data Selection for Radiometer Calibration. In Proceedings of the EUPVSEC, Munich, Germany, 21–24 June 2016; pp. 1493–1498. [Google Scholar] [CrossRef]
  62. Hasenbalg, M.; Kuhn, P.; Wilbert, S.; Nouri, B.; Kazantzidis, A. Benchmarking of six cloud segmentation algorithms for ground-based all-sky imagers. Sol. Energy 2020, 201, 596–614. [Google Scholar] [CrossRef]
  63. Kuhn, P.; Nouri, B.; Wilbert, S.; Hanrieder, N.; Prahl, C.; Ramirez, L.; Zarzalejo, L.; Schmidt, T.; Yasser, Z.; Heinemann, D.; et al. Determination of the optimal camera distance for cloud height measurements with two all-sky imagers. Sol. Energy 2019, 179, 74–88. [Google Scholar] [CrossRef] [Green Version]
  64. Ineichen, P.; Perez, R. A new airmass independent formulation for the Linke turbidity coefficient. Sol. Energy 2002, 73, 151–157. [Google Scholar] [CrossRef] [Green Version]
  65. Su, F.; Jiang, W.; Zhang, J.; Wang, H.; Zhang, M. A local features-based approach to all-sky image prediction. IBM J. Res. Dev. 2015, 59, 6: 1–6: 10. [Google Scholar] [CrossRef]
  66. Hanrieder, N.; Sengupta, M.; Xie, Y.; Wilbert, S.; Pitz-Paal, R. Modeling beam attenuation in solar tower plants using common DNI measurements. Sol. Energy 2016, 129, 244–255. [Google Scholar] [CrossRef]
  67. Schroedter-Homscheidt, M.; Arola, A.; Killius, N.; Lefèvre, M.; Saboret, L.; Wandji, W.; Wald, L.; Wey, E. The Copernicus atmosphere monitoring service (CAMS) radiation service in a nutshell. In Proceedings of the SOLARPACES 2016: International Conference on Concentrating Solar Power and Chemical Energy Systems, Abu Dhabi, United Arab Emirates, 11–14 October 2016; AIP Conference Proceedings 1850. pp. 11–14. [Google Scholar]
  68. Lefèvre, M.; Oumbe, A.; Blanc, P.; Espinar, B.; Gschwind, B.; Qu, Z.; Wald, L.; Schroedter-Homscheidt, M.; Hoyer-Klick, C.; Arola, A.; et al. McClear: A new model estimating downwelling solar radiation at ground level in clear-sky conditions. Atmos. Meas. Tech. 2013, 6, 2403–2418. [Google Scholar] [CrossRef]
  69. Marquez, R.; Coimbra, C.F.M. Proposed Metric for Evaluation of Solar Forecasting Models. J. Sol. Energy Eng. 2013, 135. [Google Scholar] [CrossRef] [Green Version]
  70. Wang, J.; Rossow, W.B.; Zhang, Y. Cloud Vertical Structure and Its Variations from a 20-Yr Global Rawinsonde Dataset. J. Clim. 2000, 13, 3041–3056. [Google Scholar] [CrossRef]
  71. Dong, X.; Minnis, P.; Xi, B. A Climatology of Midlatitude Continental Clouds from the ARM SGP Central Facility: Part I: Low-Level Cloud Macrophysical, Microphysical, and Radiative Properties. J. Clim. 2005, 18, 1391–1410. [Google Scholar] [CrossRef] [Green Version]
  72. Rodts, S.M.A.; Duynkerke, P.G.; Jonker, H.J.J. Size Distributions and Dynamical Properties of Shallow Cumulus Clouds from Aircraft Observations and Satellite Data. J. Atmos. Sci. 2003, 60, 1895–1912. [Google Scholar] [CrossRef]
  73. Sengupta, S.K.; Welch, R.M.; Navar, M.S.; Berendes, T.A.; Chen, D.W. Cumulus Cloud Field Morphology and Spatial Patterns Derived from High Spatial Resolution Landsat Imagery. J. Appl. Meteorol. Climatol. 1990, 29, 1245–1267. [Google Scholar] [CrossRef]
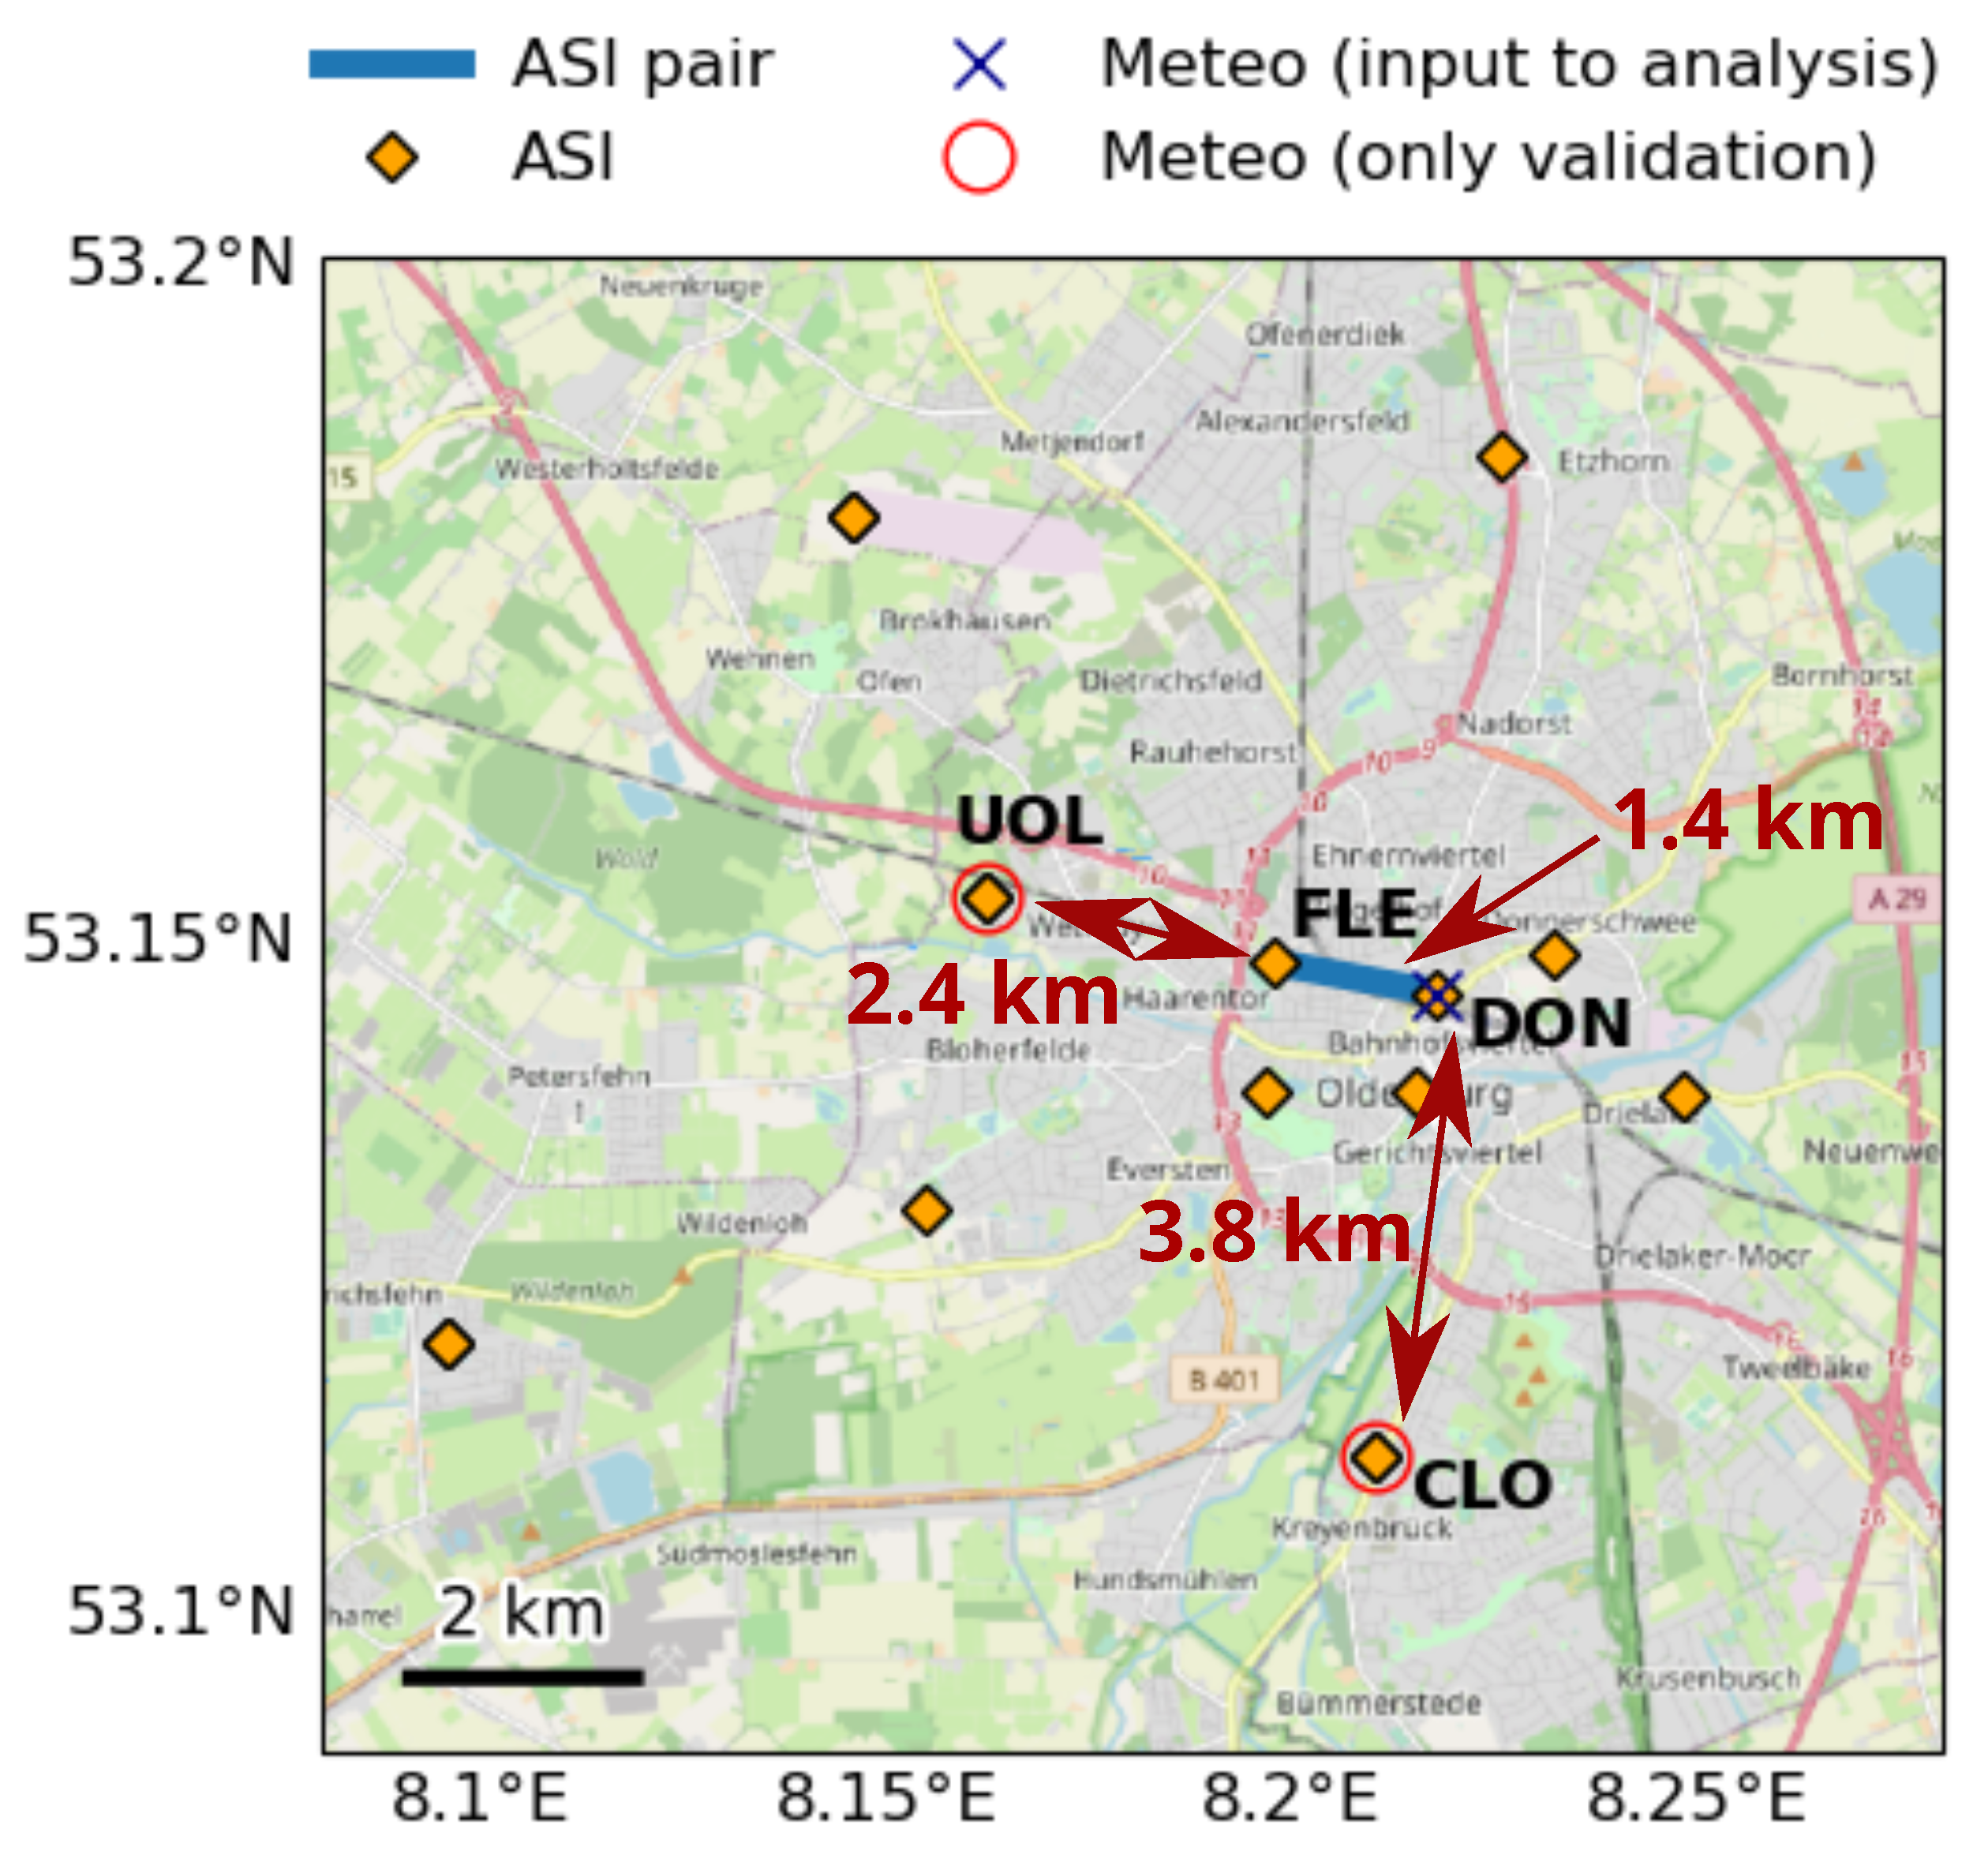
Figure 1. This map gives an overview of the Eye2Sky all-sky imager (ASI) network in the urban area of Oldenburg. ASIs are shown which were operational in 2020 (orange diamonds). The ASI pair uses the ASI stations DON and FLE and is marked with a blue line. The rotating shadowband irradiometer (RSI) at DON (×) provides input data to the analysis approaches (ASI network, ASI pair, and homogeneous persistence). The RSIs at stations UOL in the west and CLO in the south are only used for validations (∘). (background: © OpenStreetMap contributors 2022. Distributed under a Creative Commons BY-SA License).
Remotesensing 14 05685 g001
Figure 2. At station DON (located in the center of Oldenburg, left panel), an all-sky imager (ASI), a rotating shadowband irradiometer (RSI) and tilted pyranometers (from left to right) are set up. ASI and RSI provide input data to the analysis. The right panel shows an exemplary ASI image with 180 field of view taken at DON on 14 May 2020 12:27:00 UTC. Image source left image: Thomas Schmidt, DLR.
Remotesensing 14 05685 g002
Figure 3. The distribution of the DNI variability classes, which are defined according to Nouri et al. [40], is shown for the whole year 2020 and for datasets of 30, 28 and 92 days created from that year. The 30-days development dataset is used for model development. The separate 92-days validation dataset is only used for validations. The 28-days validation dataset is a subset of the 92-days validation dataset and is also used for validations.
Remotesensing 14 05685 g003
Figure 4. This figure shows an exemplary sky image taken by all-sky imager (ASI) DON (left) on 5 June 2020 10:22:00 and the corresponding detected cloud types (right). The map of AI which is derived from this sky image is shown in Figure 5.
Remotesensing 14 05685 g004
Figure 5. The accuracy-weighted combination procedure is demonstrated exemplarily with only two all-sky imagers (ASI). The evaluated timestamp is 5 June 2020, 10:22:00. Each ASI i delivers a georeferenced map of attenuation index A I i (left column); the map of A I from each ASI is weighted with u i , x , y 1 (center column), the inverse of the expected local uncertainty of A I ; the weighted average based on A I i , x , y · u i , x , y 1 from the included ASIs yields the merged map of A I (right column).
Remotesensing 14 05685 g005
Figure 6. The plot shows the weight assigned to each observation of cloud attenuation from the same day (+) as well as the cumulative weight assigned to all observations from the most recent hours (blue dashed line). This example evaluates a case with a constant rate of observations. As the observation from the present timestamp is given a large weight, the cumulative weight starts at about 0.2 at a time difference of 0 h. All historic observations (i.e., those from previous days) together are assigned a small weight of 0.05 (). These observations only contribute noticeably if there are no recent observations at a similar attenuation index.
Remotesensing 14 05685 g006
Figure 7. These plots show the weighted observations of attenuation index and attenuation (color coded) and the resulting fitted function A ^ (blue dash-dotted curve). The left panel evaluates 5 June 2020 10:22:00 and the right 27 June 2020 11:27:00.
Remotesensing 14 05685 g007
Figure 8. This figure shows an exemplary scattered, single cloud layer situation over Oldenburg on 5 June 2020 10:22:00. The panels show stitched raw, undistorted and georeferenced all-sky imager (ASI) images (top, left), the map of attenuation index derived from the ASI network (top, right), the GHI map derived by the ASI pair (bottom, left) and the GHI map derived by the ASI network (bottom, right). The GHI maps also show readings of the radiometer stations (red circles) by markers which are color coded as indicated by the color bar. Note that the sun position causes a shift of cloud observations in northeastern direction between the figures in the top row and bottom row. (background: © OpenStreetMap contributors 2022. Distributed under a Creative Commons BY-SA License).
Remotesensing 14 05685 g008
Figure 9. This figure shows an exemplary multi-cloud-layer situation over Oldenburg on 27 June 2020 11:27:00. The figure is created analogous to Figure 8. The panels’ contents are described in Figure 8. (background: © OpenStreetMap contributors 2022. Distributed under a Creative Commons BY-SA License).
Remotesensing 14 05685 g009
Figure 10. This figure shows deviation metrics RMSD and bias for the tested approaches to analyze DNI (homogeneous persistence, blue; ASI pair, red; and ASI network, yellow). The 92 day validation dataset (labeled overall) and eight subsets distinguished by the DNI variability classes are evaluated separately. As summarized in Table 2, each variability class describes a specific sky condition.
Remotesensing 14 05685 g010
Figure 11. This figure shows the deviation metrics RMSD and bias for the tested approaches to analyze GHI (homogeneous persistence, blue; ASI pair, red; and ASI network, yellow). The evaluation for GHI is based on the 28 day validation dataset (labeled overall) and for eight subsets distinguished by the DNI variability classes.
Remotesensing 14 05685 g011
Figure 12. The scatter-density plots compare the RMSD of k D N I * received from an ASI-based analysis to that received from homogeneous persistence. The 92 day dataset is split into floating 25-min windows. For each window, the RMSDs of the ASI-based and homogeneous persistence analysis are calculated. The periods are classified by the RMSD of homogeneous persistence. Per bin of the RMSD from homogeneous persistence (i.e., per column in the plot), the distribution (i.e., rows in the plot, color coded) and the mean value (blue line) of the ASI-based RMSD is evaluated. The top row evaluates station UOL. The bottom row evaluates CLO. Estimations based on homogeneous persistence (black dashed main diagonal in each panel), ASI pair (left panels) and ASI network (right panels) are shown. In addition, the relative frequency of the variability bins is plotted (grey, dash-dotted). Note that high relative frequencies of the RMSD further below the main diagonal (i.e., lower RMSD values of the ASI system) indicate a higher accuracy of the respective ASI-based system.
Remotesensing 14 05685 g012
Figure 13. This figure shows relative frequencies of the DNI clear sky index ( k D N I * ) from the respective analysis over the reference measurement. Homogeneous persistence (top row), the ASI network (center row) and ASI pair (bottom row) are evaluated. In the panels on the right-hand side, relative frequencies are normalized for each column in the plot. This means that relative frequencies add to one in each column of the respective plot. Each panel also shows 5th, 95th (solid), 25th, 75th (dashed) and 50th-percentile (dotted). The coefficient of correlation R 2 is 0.63 for homogeneous persistence (top row), 0.84 for the ASI network (center row), 0.73 for the ASI pair (bottom row).
Remotesensing 14 05685 g013
Table 1. The table gives an overview of the station IDs and geolocations of the radiometer and all-sky imager (ASI) stations of Eye2Sky which are used in this study. Additionally, the distances between the radiometer stations are given. Each radiometer station listed below is equipped with a rotating shadowband irradiometer (RSI) which uses two LI-COR LI-200 silicon pyranometers.
StationGeolocationDistance from [km]
IDLat. [ N]Lon. [ E]UOLDONCLO
AMM53.18168.1456
BFE53.14928.23204
CLO53.112008.21004 5.6 3.8 0
DON53.146388.21734 3.8 0 3.8
ETZ53.1862058.225326
EMS53.130218.15472
FLE53.148618.19747
HOL53.138738.24786
JET53.12048.09583
MAR53.139188.21504
TIR53.138928.19640
UOL53.153428.161910 3.8 5.6
Table 2. This table summarizes the sky conditions, DNI clear sky index and DNI variability which are indicated by each of the eight DNI variability classes. These classes are defined and calculated according to Nouri et al. [40]. The table was created based on [40].
Variability ClassSky ConditionsDNI Clear Sky IndexVariability
1mostly clear skyvery highlow
2almost clear skyhighlow
3almost clear skyhigh/intermediateintermediate
4partly cloudyintermediatehigh
5partly cloudyintermediateintermediate
6partly cloudyintermediate/lowhigh
7almost overcastlowintermediate
8mostly overcastvery lowlow
Table 3. The five cloud classes received from cloud segmentation are mapped to values of the attenuation index A I . These approximate values of attenuation index reflect our experience and are used in an intermediate step. Exact values of cloud attenuation are determined based on A I later in Section 3.2.4.
Cloud ClassAttenuation Index AI
undefinedn.d.
low layer/thick cloud1
mid-layer cloud0.7
high layer/thin cloud0.2
clear sky0
Publisher’s Note: MDPI stays neutral with regard to jurisdictional claims in published maps and institutional affiliations.