Abstract
The recognition and monitoring of marine ranching help to determine the type, spatial distribution and dynamic change of marine life, as well as promote the rational utilization of marine resources and marine ecological environment protection, which has important research significance and application value. In the study of marine ranching recognition based on high-resolution remote sensing images, the convolutional neural network (CNN)-based deep learning method, which can adapt to different water environments, can be used to identify multi-scale targets and restore the boundaries of extraction results with high accuracy. However, research based on deep learning still has problems such as rarely considering the feature complexity of marine ranching and inadequate discussion of model generalization for multi-temporal images. In this paper, we construct a multi-temporal dataset that describes multiple features of marine ranching to explore the recognition and generalization ability of the semantic segmentation models DeepLab-v3+ and U-Net (used in large-area marine ranching) based on GF-1 remote sensing images with a 2 m spatial resolution. Through experiments, we find that the F-score of the U-Net extraction results from multi-temporal test images is basically stable at more than 90%, while the F-score of DeepLab-v3+ fluctuates around 80%. The results show that, compared with DeepLab-v3+, U-Net has a stronger recognition and generalization ability for marine ranching. U-Net can identify floating raft aquaculture areas at different growing stages and distinguish between cage aquaculture areas with different colors but similar morphological characteristics.
1. Introduction
Marine ranching is a new model of sustainable fishery development, and it is one of the key development directions of marine fishery. The recognition and monitoring of marine ranching help to grasp the type, spatial distribution and dynamic change in marine life, which can provide information for fishery production estimation, marine carbon sink management, marine ecological environment evaluation and oceanic disaster monitoring. It promotes the rational development and utilization of marine resources and marine ecological environment protection.
Traditional field survey methods are time-consuming and laborious, and it is difficult to meet the needs of large-area and real-time marine ranching recognition and dynamic monitoring. Satellite remote sensing technology has advantages such as a short detection cycle, strong real-time performance and low cost, as well as allowing large-area coverage, and has become an important means of conducting marine ranching surveys. Therefore, it has great research significance and application value in marine ranching based on high-resolution remote sensing images. At present, the marine ranching recognition methods based on remote sensing images mainly include six categories: visual interpretation [1,2], image data transformation [3,4,5,6,7,8,9,10], image texture analysis [4,5,6,9,11], object-oriented recognition [11,12,13,14,15,16,17,18,19], association rule analysis [20,21], and machine learning [22,23,24,25,26,27,28,29,30,31]. Convolutional neural network (CNN)-based deep learning comes under the machine learning category [24,25,26,27,28,29,30,31], and can adapt to background water environments of different colors, recognize multi-scale targets and restore the clear boundary of extracted results, achieving good recognition in marine ranching.
Liu Yueming et al. used the RCF model to extract the boundary of raft aquaculture areas in Sanduo of Fujian Province based on a Gaofen-2 (GF-2) image and achieved good extraction results under the complex seawater background [25]. Shi Tianyang et al. proposed a DS-HCN model for the automatic extraction of raft aquaculture areas based on VGG-16 and dilated convolution using Gaofen-1 (GF-1) remote sensing images with a 16 m resolution and achieved 88.2% IOU with regard to test data [26]. Cui Binge et al. proposed a UPS-Net network, including U-Net and PSE structures, to solve the “adhesion” phenomenon in the extraction results of floating raft aquaculture areas based on GF-1 remote sensing images in the offshore area of Lianyungang in February 2017 [27]. Sui Baikai et al. proposed using OAE-V3 based on DeepLab-v3 to extract the cage and raft aquaculture areas in the eastern coastal area of Shandong Province using the Quick Bird images in May 2019, and the overall accuracy reached up to 94.8% [28]. Cheng Bo et al. proposed using HDCUNet by combining U-Net and HDC (hybrid dilated convolution) based on GF-2 remote sensing images in June 2016 to extract cage and floating raft aquaculture areas in Sandu Gulf of Fujian Province and the overall accuracy reached up to 99.16% [29]. Liang Chenbin et al. used multi-source remote sensing images (GF-2, GF-1) in 2019 and a generative adversarial network (GAN) to construct samples, and proposed a new semi-/weak supervision method (semi-SSN) based on SegNet and a dilated convolution network to discuss the extraction method of offshore aquaculture areas using samples with different spatial resolutions [30]. Zhang Yi et al. proposed a new semantic segmentation network combined with non-sub-sampled contourlet transform (NSCT) and U-Net structures to extract raft aquaculture areas in the eastern offshore area of Liaodong Peninsula from Sentinel-1 images, and achieved a high extraction accuracy [31].
To sum up, the main method used for conducting marine ranching extraction using deep learning is semantic segmentation based on a CNN, and the commonly used models include U-Net [32] and DeepLab series [33,34,35,36]. Although deep learning can adapt to marine environments of different colors, recognize multi-scale targets, restore the clear boundary of extraction results, and has achieved a high recognition accuracy in marine ranching, the following two problems generally exist in the current research based on deep learning: First, most experimental data have been imaged at the same or similar times in the literature, and the generalization ability of the model with regard to multi-temporal remote sensing images has not been fully discussed. Second, most studies only annotate aquaculture areas with single and simple features. For example, most research does not consider the complex features of raft aquaculture areas at different stages of growth and ignores the morphological changes of cage aquaculture areas over time. Therefore, there are still many problems to be solved in the recognition of large-scale marine ranching in multi-temporal high-resolution remote sensing images.
This paper takes the Sandu Gulf of Fujian Province and its surrounding sea areas as the study area and constructs a multi-temporal dataset that describes multiple features of marine ranching to explore the recognition and generalization ability of the classic semantic segmentation models DeepLab-v3+ and U-Net in large-area marine ranching tasks based on GF-1 images with 2 m resolution.
The research roadmap of this paper is illustrated in Figure 1.
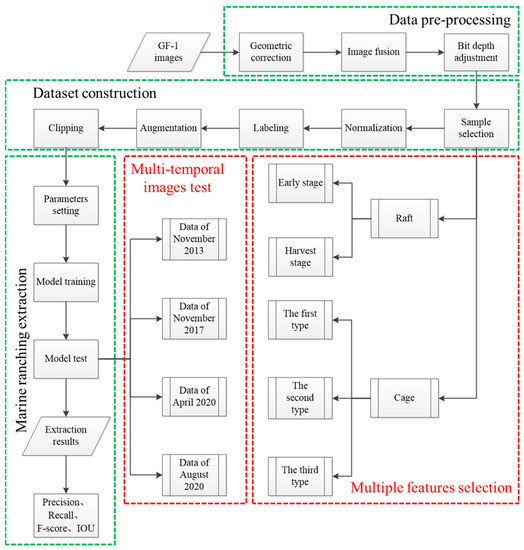
Figure 1.
Research roadmap.
2. Materials and Methods
2.1. Experimental Area and Data Source
This paper takes the Sandu Gulf of Fujian Province and its surrounding sea area as the study area (Figure 2). The Sandu Gulf is the largest cage aquaculture base of large yellow croaker in China, and also cultivates economic species on a large scale, such as nori, kelp and mussels. The aquaculture in the Sandu Gulf is mainly for marine ranching, mainly floating raft aquaculture and cage aquaculture.
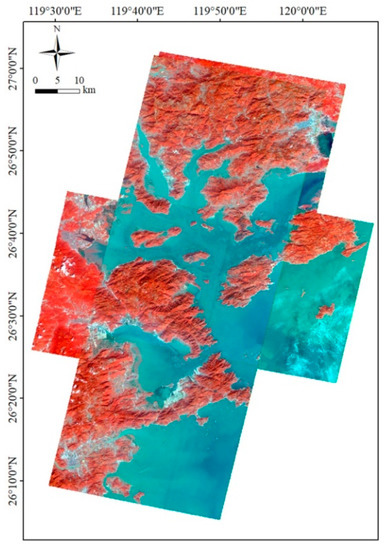
Figure 2.
Experimental area (false color).
The data used in this paper are from China’s high-resolution Earth observation satellite, GF-1. GF-1 was successfully launched on 26 April 2013, and its technical indicators are shown in Table 1. A total of 6 PMS images of GF-1 were selected as experimental data to construct the dataset (information shown in Table 2).

Table 1.
Technical indicators of Gaofen-1 (GF-1).

Table 2.
Experimental data of GF-1.
2.2. Dataset
2.2.1. Feature Analysis of Marine Ranching
This paper focuses on the recognition of floating raft aquaculture (Figure 3a) and cage aquaculture areas (Figure 3b) in the Sandu Gulf. For floating raft aquaculture, floats and ropes are used to form floating rafts, as is a cable to connect the floating raft to the bottom sink, so that the seedlings of seaweed (e.g., nori and kelp) and farmed animals (e.g., mussels) are fixed on the rope and are suspended from the floating raft. Nori grows from September to May and has three main harvest stages because it continues to grow after being cut. The first harvest stage is from mid-September to late November, the second harvest stage is from early December to late February of the following year, and the final harvest stage is from early March to early May. Kelp grows from November to May of the next year. Mussels grow in September and are harvested in November of the next year. The cultivation species in the floating raft aquaculture are located below the water surface, and the characteristics of the aquaculture areas change with the different growing stages of the species. In the early stages of culture, the spectral characteristics of the cultivated species in the floating raft aquaculture areas are not obvious, and the aquaculture areas mainly show the characteristics of seawater. At the harvest stage of culture, the characteristics of the floating raft aquaculture areas are obviously different from seawater. Because of the use of multiple farming modes, different species may be at different stages of growth at the same time, which causes complex image features in floating raft aquaculture. Most studies based on deep learning only label floating raft aquaculture areas at the harvest stage as the sample, while ignoring aquaculture areas at early stages. In GF-1 images, the floating raft aquaculture areas can be divided into three: The first has a rectangular shape with bright white spots on both sides and its interior area is mainly the color of seawater (Figure 4a). The second also has bright white spots on both sides but its interior area is a darker color than seawater (Figure 4b). The third is rectangular without bright white spots and its color is darker than seawater (Figure 4c). The first area is in the early stages of culture, and the second and third areas are in the harvest stage.
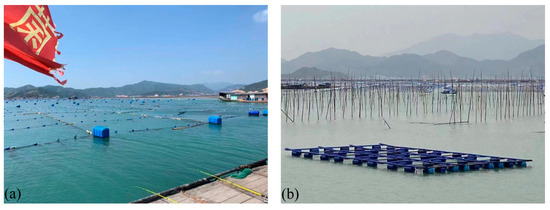
Figure 3.
Ground images of marine ranching areas (Xiapu County, Ningde, 1 November 2022). (a) Floating raft aquaculture areas. (b) Cage aquaculture areas.
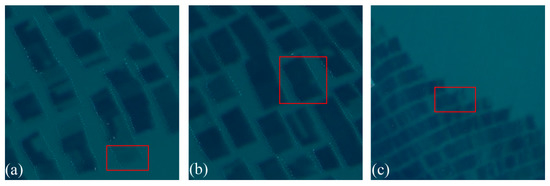
Figure 4.
Floating raft aquaculture areas (imaged on November 2013) by GF-1. (a) The first type (area in red box). (b) The second type (area in red box). (c) The third type (area in red box).
In cage aquaculture, cages are deployed in the seawater, mainly to cultivate fish. Although the image characteristics of cage aquaculture areas are irrelevant to the growth stages of the cultivated species, they are greatly influenced by the material and internal structure of the cage. According to the difference in color and internal structure, we divided the cage aquaculture areas into three: The image of the first cage aquaculture area presents a light gray and white rectangle with a relatively uniform internal color and an invisible grid structure, shown in Figure 5a. The image of the second cage aquaculture area has a dark gray color, and the grid structure is visible, but the seawater in the grid structure cannot be seen, as shown in Figure 5b. The image of the third cage aquaculture area has an obvious grid structure, and the seawater in the grid is relatively clear, as shown in Figure 5c. At present, most studies only label the first and second cage aquaculture areas or only the third aquaculture area as the sample area. The characteristics of cage aquaculture areas in the sample data are relatively simple and stable, making them unsuitable for research in multi-temporal and large-area marine ranching.
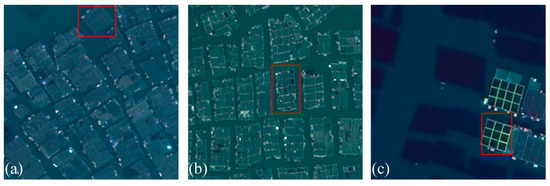
Figure 5.
Cage aquaculture areas in GF-1. (a) The first type of cage aquaculture (imaged in November 2013). (b) The second type of cage aquaculture (imaged in November 2017). (c) The third type of cage aquaculture (imaged in April 2020).
In this paper, we annotate floating raft aquaculture areas at different growing stages and use cage aquaculture areas with different colors and morphological characteristics as the sample to explore the ability of DeepLab-v3+ and U-Net to identify marine ranching areas with complex characteristics.
2.2.2. Data Processing
To obtain a dataset suitable for model training and testing, we processed GF-1 images, including data preprocessing and dataset construction.
Data preprocessing includes three steps: geometric correction, image fusion and bit depth adjustment. Geometric correction uses a rational polynomial coefficient model to make spatial corrections. Image fusion utilizes the Pansharp model to fuse multi-spectral bands and pan bands [37]. Bit depth adjustment changes bit depth from 16 to 8. The pre-processed GF-1 images have four bands (Blue: 0.45–0.52 μm; Green: 0.52–0.59 μm; Red: 0.63–0.69 μm; NIR: 0.77–0.89 μm) with bit depth of 8 bits (0–255) and spatial resolution of 2 m. Dataset construction includes sample selection, normalization, labeling, augmentation and clipping. We selected samples in pre-processed GF-1 images and considered the feature diversity of marine ranching and background. The sample of the floating raft culture areas includes the sample at early stages of cultivation and the sample at the harvest stage. Sample of cage culture areas includes samples of the three types of culture areas described in Section 2.2.1. In the large-scale marine ranching recognition of GF-1 remote sensing images, the background water color is quite different, and the characteristics of waves and ships are obvious. Therefore, the samples also include areas with different water colors, and the disturbing ground objects on the water surface, such as ships and wastes. Additionally, we controlled number of different sample types to avoid the large impact of sample imbalance on the model. To test model generalization ability, the sample of training set and test set located in different places and were imaged at different times because both aquaculture areas and background change over space and time.
Since the imaging conditions (atmosphere, sensor, etc.) of GF-1 remote sensing images are quite different with time, in order to make the sample obey the same distribution as far as possible, we calculated the mean () and variance () of each band of the sample at different times and then normalized the sample with respective mean and variance (Figure 6), its calculation is shown in Equation (1) where denotes the original value of pixel at row i and column j of band k, denotes the mean of band k and denotes the std (standard deviation) of band k. For example, we calculated the mean and variance of the sample from November 2013 and used the calculated mean and variance to normalize the sample from November 2013. The normalization mainly eliminates the influence of different atmosphere and sensor conditions, and it does not mean to eliminate the difference of the color of seawater because this difference is also a test dimension of the model’s generalization ability.
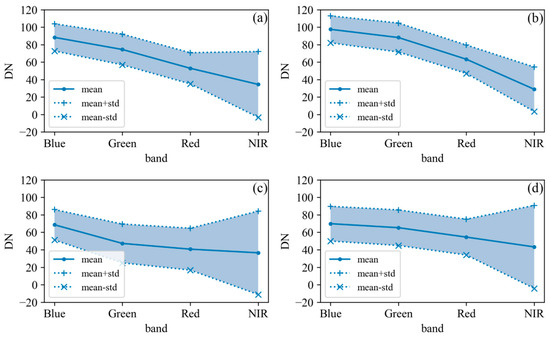
Figure 6.
Spectral features of sample from different time. (a) Sample from November 2013. (b) Sample from November 2017. (c) Sample from April 2020. (d) Sample from August 2020.
In labeling, the sample is divided into three categories. The first category is floating raft aquaculture area, and the label is set to 1. The second category is cage aquaculture area, and the label is set to 2. The third category is the background, that is, all ground objects except the two types of aquaculture areas, and the label is set to 0. The labeling is done in ArcGIS by manually visual interpretation. The augmentation strategy of the training sample is rotated clockwise 90°, 180° and 270°. We crop trained data every 128 pixels, tested data every 256 pixels and the sample clipping size was 256 × 256.
The dataset was comprised a training set and test set. The training set consisted of the data of November 2013 (Train A, Train B, Train C) and November 2017 (Train D, Train E), a total of five training areas, as shown in Figure 7. Test set included the data of November 2013 (Test A), November 2017 (Test B), April 2020 (Test C), and August 2020 (Test D), as shown in Figure 8. Dataset composition is shown in Figure 9.
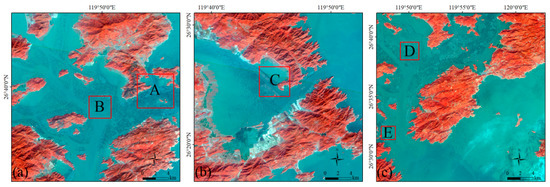
Figure 7.
Training data (false color: band combination 421). (a) Training data A and B from November 2013. (b) Training data C from November 2013. (c) Training data D and E from November 2017.
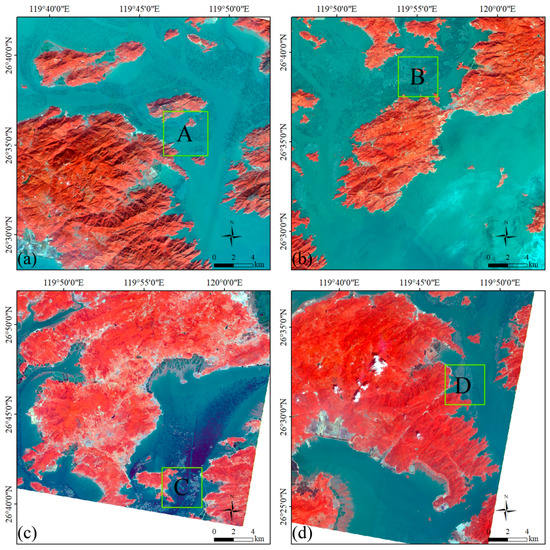
Figure 8.
Test data (false color: band combination 421). (a) Test data of November 2013 (test A). (b) Test data of November 2017 (test B). (c) Test data of April 2020 (test C). (d) Test data of August 2020 (test D).
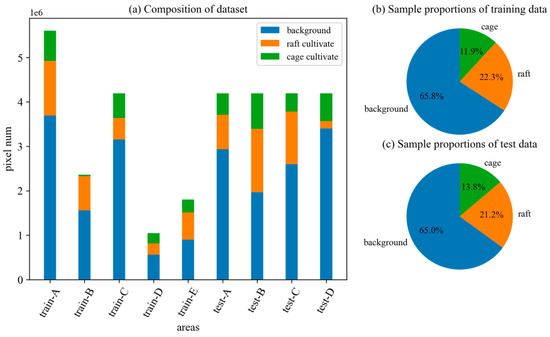
Figure 9.
The composition of dataset, training data and test data.
2.3. Semantic Segmentation
Semantic segmentation involves assigning a predefined label representing a semantic category to each pixel in an image to obtain a pixelated dense classification [38]. A deep learning semantic segmentation structure can be thought of comprising an encoder and decoder. The encoder is usually a classification network, such as VGG, ResNet, etc., whose task is to learn the features of images. The decoder has no fixed category, and its task is to semantically project the features learned by the encoder (low resolution) onto the pixel space (high resolution), and finally obtain a dense classification for each pixel.
2.3.1. DeepLab-v3+
DeepLab-v3+ [33] was released by Google in 2018 and it achieves a high accuracy in semantic segmentation. Its framework is shown in Figure 10. For an input image, DeepLab-v3+ uses a deep convolutional neural network (DCNN) to extract low-level features and uses atrous spatial pyramid pooling (ASPP) to extract multi-scale targets after DCNN to obtain high-level features in the encoder. We selected Xception65 [39] as the DCNN in this paper. In the decoder, DeepLab-v3+ restores image resolution by using two bilinear interpolations.
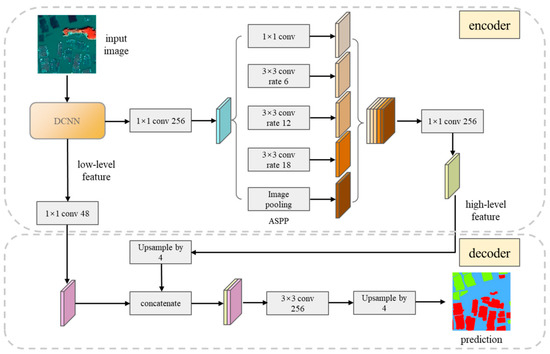
Figure 10.
The framework of DeepLab-v3+.
ASPP uses atrous convolution (dilated convolution) with a different dilated rate r to convolve the output images of the DCNN and extract features of different scales in parallel. An atrous convolution can control the resolution of the feature map while expanding the receptive field by inserting r-1 zeros between adjacent parameters of the standard convolution kernel, and the parameter r is the dilated rate [33,40].
2.3.2. U-Net
U-Net [32] was proposed by Olaf Ronneberger et al. in 2015 and is widely used in biomedical image segmentation. It can achieve good results through small-sample training. The overall structure of U-Net is simple (Figure 11), and its encoder and decoder modules correspond to each other. It uses multiple feature cascades and transposed convolutions to carry out upsampling and restore image details in the decoder.
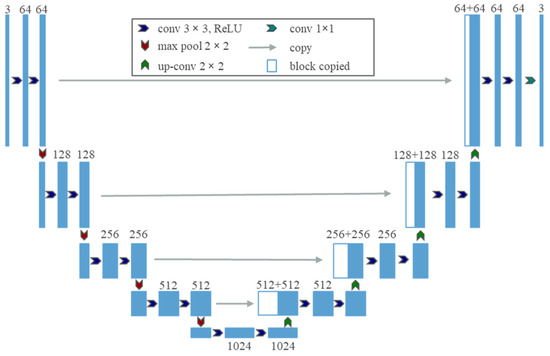
Figure 11.
The framework of U-Net.
2.3.3. Training Strategy
We assessed the performances of DeepLab-v3+ and U-Net in identifying marine ranching areas with different input and parameters settings. We implemented DeepLab-v3+ and U-Net in pyTorch and trained them on single titan v GPU.
The input of two semantic segmentation models is three channels, and we selected three from four bands of GF-1 and used the band combination 4 (NIR), 2 (Green), and 1 (Blue) as the default input because NIR has larger variance than Red, and so may provide more information. We also used the log-likelihood cost function, L2 regularization, and momentum optimization. The epoch was set to 100.
The specific settings of experimental parameters are shown in Table 3 and Table 4. “ASPP” is the dilated rate combination in the ASPP structure of DeepLab-v3+. “band” is the input band combination of GF-1. “weight decay” is the penalty coefficient of L2 regularization. “class weight” indicates the weights of different samples. The first number represents the weight of the background, the second number represents the weight of the floating raft aquaculture, and the third number represents the weight of the cage aquaculture. These parameters were set in accordance with [28,32,33]. Among them, the sample ratio of background, floating raft aquaculture and cage aquaculture is about 5.55:1.88:1 in the training set; therefore, we set the parameter of class weight as 1, 2.95, and 5.55 to simulate the situation where the training set has the same proportion of the three sample types

Table 3.
The setting of the parameters of DeepLab-v3+ (band combination: 4 (NIR), 2 (Green), 1 (Blue)).

Table 4.
The setting of the parameters of U-Net.
3. Results
In this paper, we used four evaluation indexes—precision, recall, F-score and IOU (intersection over union)—to evaluate the marine ranching recognition results of the models. Precision refers to the proportion of pixels judged as positive examples that are true positive examples. Recall means the proportion of pixels judged to be positive examples out of all pixels that are actually positive examples. Precision and recall are contradictory measures, and F-score is the harmonic average of the two, considering the results of both. IOU is the ratio between the intersection and the union of the predicted result and the true value of a certain category.
3.1. Performance Comparison of DeepLab-v3+ and U-Net
The precision, recall, F-score and IOU of DeepLab-v3+ and U-Net extraction results are shown in Figure 12 and their values are taken as the mean of four test images. We show the test images, labels, specific extraction results of DeepLab-v3+ experiment 2 and U-Net experiment 1 in Figure 13 because these two experiments were conducted with the same common parameters.
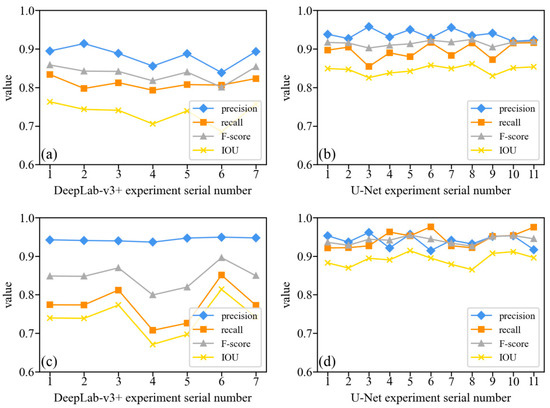
Figure 12.
Precision, recall, F-score and IOU of DeepLab-v3+ and U-Net extraction results. (a) DeepLab-v3+ extraction results of floating raft aquaculture. (b) U-Net extraction results of floating raft aquaculture. (c) DeepLab-v3+ extraction results of cage aquaculture. (d) U-Net extraction results of cage aquaculture.
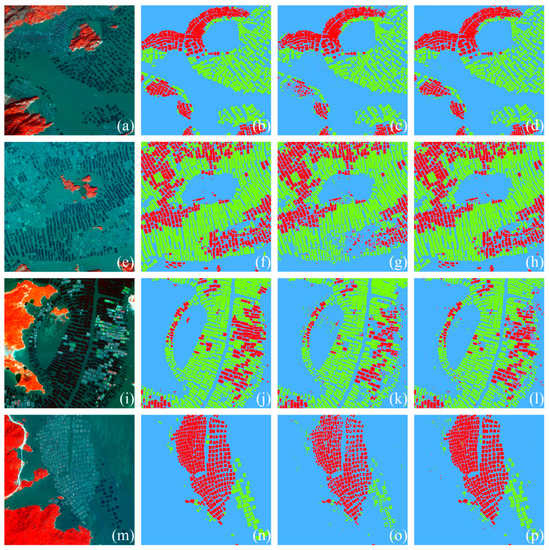
Figure 13.
The images (false color: band combination 421), labels and extraction results of four test images. (a) Test A. (b) Label A. (c) DeepLab-v3+ experiment 2 of test A. (d) U-Net experiment 1 of test A. (e) Test B. (f) Label B. (g) DeepLab-v3+ experiment 2 of test B. (h) U-Net experiment 1 of test B. (i) Test C. (j) Label C. (k) DeepLab-v3+ experiment 2 of test C. (l) U-Net experiment 1 of test C. (m) Test D. (n) Label D. (o) DeepLab-v3+ experiment 2 of test D. (p) U-Net experiment 1 of test D.
According to the results, the F-score of the DeepLab-v3+ extraction results fluctuate around 80% and IOU fluctuates around 75%. Changing the parameters did not greatly improve the performance of DeepLab-v3+. The F-score of the U-Net extraction results is basically stable at more than 90%, and the IOU is over 85%. When changing the parameters and band combination, U-Net maintains a relatively stable performance. This shows that U-Net has a stronger recognition and generalization ability for marine ranching areas than DeepLab-v3+.
3.2. Performance Comparison with Different Test Images
The precision, recall, F-score and IOU of 18 experiment extraction results in four test images of floating aquaculture and cage aquaculture are shown in Figure 14 and Figure 15.
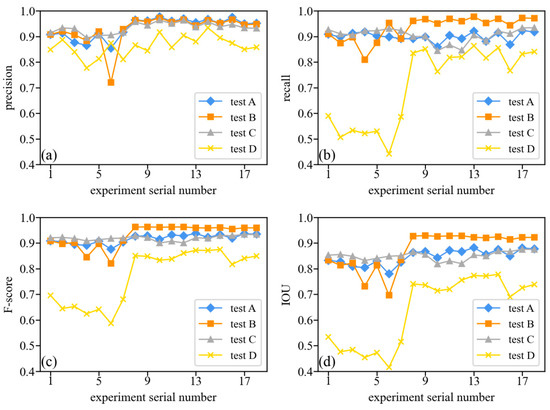
Figure 14.
Evaluation index value of floating raft aquaculture of four test images. (a) Precision. (b) Recall. (c) F-score. (d) IOU.
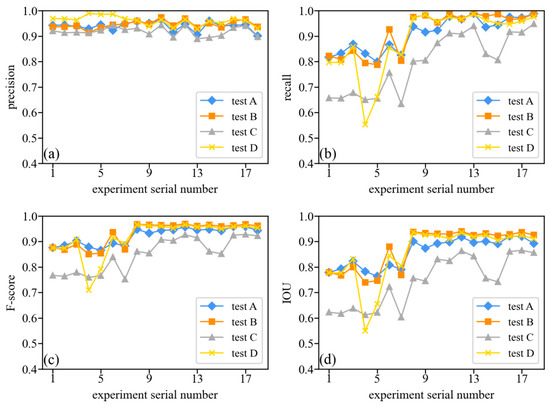
Figure 15.
Evaluation index value of cage aquaculture of four test images. (a) Precision. (b) Recall. (c) F-score. (d) IOU.
From the figures, we can see that:
- U-Net (experiment 8–18) exhibits a relatively good performance in the recognition of the four test images—of both floating raft aquaculture and cage aquaculture—at different times;
- For floating raft aquaculture, the extraction result of test D is relatively poor—as is the extraction result of test C for cage aquaculture.
4. Discussion
4.1. Model Recognition Ability Analysis
According to the results, U-Net has a better recognition ability for marine ranching areas than DeeLab-v3+.
The recognition results of four test images of DeepLab-v3+ experiment 2 are shown in Figure 13c,g,k,o. The results have many broken spots and cage aquaculture areas and floating raft aquaculture areas at early stages that were not extracted effectively, as shown in Figure 16c,g,k,o,s,w.
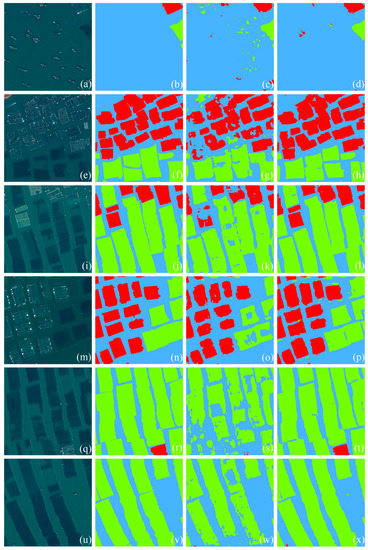
Figure 16.
Local images, labels and extraction results of test data. (a,e,i,m,q,u) Local images. (b,f,j,n,r,v) Labels. (c,g,k,o,s,w) Extraction results of DeepLab-v3+ experiment 2. (d,h,l,p,t,x) Extraction results of U-Net experiment 1.
The recognition results of four test images of U-Net experiment 1 are shown in Figure 13d,h,l,p. Compared with DeepLab-v3+, U-Net can effectively reduce the influence of boats and waves (Figure 16d), and the extraction results of two types of aquaculture areas are both more complete, with a clearer and smoother boundary, less leakage and fewer mistakes, and less salt and pepper noise. In particular, in the floating raft aquaculture areas, although there are some leaked and mistaken extractions, U-Net can extract the floating raft aquaculture areas at an early stage, despite the similar characteristics with seawater, as shown in Figure 16h,l,p,t,x. A small amount of leaked extraction of U-Net was mainly found for floating raft aquaculture areas at the early stage. A small amount of mistaken extraction is mainly due to scattered buildings with bright white colors that are extracted as cage aquaculture areas and shadow parts of mountains that are extracted as floating raft aquaculture areas. These problems can be largely solved by adjusting the composition proportions of aquaculture areas and background in the training set in subsequent studies.
One reason for the low evaluation index value of the floating raft aquaculture recognition results in the test data of August 2020 (Test D) may be because there are fewer floating raft aquaculture areas, and some leakages and mistakes have a greater impact on this value.
By comparing two models, we found that DeepLab-v3+ has two main features: First, the encoder is more complex, and the model is deeper with more parameters. Second, the decoder is simpler. Compared with the multiple feature cascades and transposed convolution of U-Net, DeepLab-v3+ only uses one feature cascade and two bilinear interpolations to complete upsampling. The first feature may lead to a slow model learning rate and difficult convergence in a short time. The second feature may mean upsampling is unable to recover the local details of images enough and degrades the extraction accuracy.
In the extraction results of DeepLab-v3+, there are many “holes” in floating aquaculture areas, which means DeepLab-v3+ fails to extract the aquaculture areas in the early stages. For DeepLab-v3+, the encoder is deeper, and it may cause the extracted feature to be too abstract. For floating raft aquaculture areas, its sample includes a large number of aquaculture areas at the harvest stage and a small part of the sample in the early stages. The highly abstract feature from the encoder of DeepLab-v3+ may take aquaculture areas at the harvest stage as the main feature and ignore the characteristics of aquaculture areas at early stages. Additionally, in the decoder, one low-level feature is too small to recover all the details.
U-Net’s overall structure is simple and symmetrical. This means that the feature from the encoder is not highly abstract and there are corresponding low-level features to recover the details. With multiple feature cascades, U-Net is able to greatly recover local details of floating raft aquaculture areas at both the harvest and early stages.
Compared with two bilinear interpolations of DeepLab-v3+, U-Net uses four transposed convolutions to upsample. This means that U-Net can gradually recover local details and fully take advantage of low-level information. Additionally, for transposed convolution, its parameters are learnable, which helps to reduce loss.
Figure 17 shows the loss of DeepLab-v3+ (Experiments 2 and 3) and U-Net (Experiment 1). Within 100 epochs, the convergence effect of U-Net is better than DeepLab-v3+, which is consistent with the experiment results.
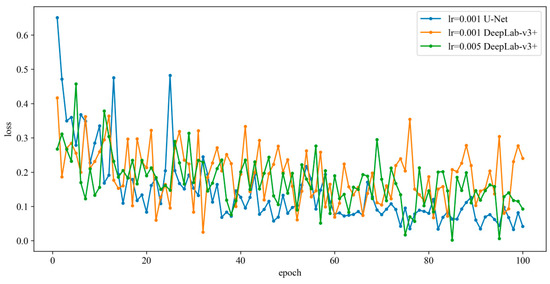
Figure 17.
Loss of U-Net and DeepLab-v3+.
4.2. Model Generalization Ability Analysis
According to the results, U-Net achieved good marine ranching recognition results with multi-temporal test images and its generalization ability is relatively strong. Figure 18 shows the spectral values of the training data and test data after normalization. It can be seen that U-Net can still recognize marine ranching areas of test images at different times even if there are certain differences in spectral features between the test data and training data.
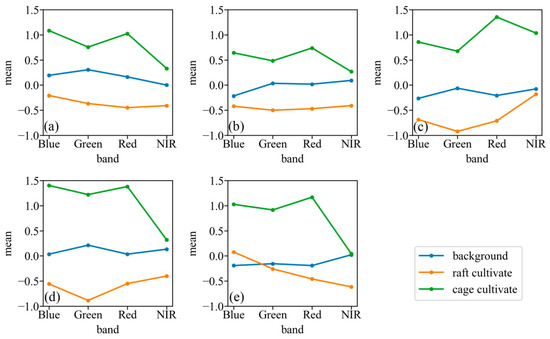
Figure 18.
Spectral value of training data and test data after normalization. (a) Training data. (b) Test A. (c) Test B. (d) Test C. (e) Test D.
Although the generalization ability of U-Net is relatively strong, the identification results of the cage aquaculture areas of the test data in April 2020 (test C) are relatively poor. In the training data, the sample of caged aquaculture only includes the first and second types of caged aquaculture and does not include the third type; test C includes the third type of cage aquaculture. Figure 19 shows the cage aquaculture in the training data, and Figure 20 shows parts of the original images, labels and extraction results of test C. We can find that the color and structure of the cage aquaculture in test C are quite different from those of the training data. In the training data, the cage aquaculture tends to be uniformly light or dark gray and the grid structure inside the cage aquaculture is not obvious. In test C, the colors of some cage aquaculture areas are yellow, green and red, and the internal grid structure is clear. U-Net can extract cage aquaculture areas with different colors and the same structure (Figure 20i,l), but is unable to effectively extract cage aquaculture areas with a grid structure (Figure 20c,f). This means that U-Net has good generalization ability for cage aquaculture areas with different colors and the same structure but has weaker ability in cage aquaculture area with different morphological structures.
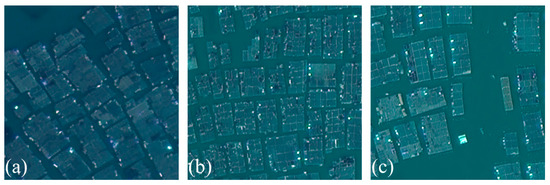
Figure 19.
Training data of cage aquaculture. (a) The first type of cage aquaculture. (b,c) The second type of cage aquaculture.
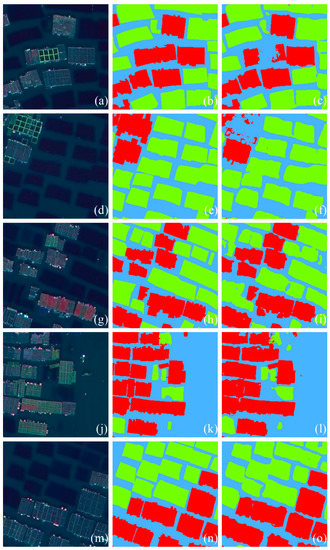
Figure 20.
The local images, labels and extraction results of test C. (a,d,g,j,m) Local images. (b,e,h,k,n) Labels. (c,f,i,l,o) Extraction results of U-Net experiment 5.
For U-Net, multiple feature cascades and four transposed convolutions help to locate and restore image details step by step and fully use multi-level structural information. Because of this reason, U-Net can identify cage aquaculture areas with different colors because they have the same structure as the training data. However, the third type of cage aquaculture area’s spectral features are similar to seawater and its structural features cannot be learned by the model, which means both the spectral features and structural features are not obvious and separable. Because of this, U-Net fails to adequately extract the third type of cage aquaculture.
Although U-Net cannot effectively extract the third type of cage aquaculture with a clear internal grid structure, we may take advantage of the fact that the edge of the third type of cage aquaculture is also rectangular and is morphologically similar to other cage aquaculture areas. In subsequent research, we will consider using transfer learning to extract such aquaculture areas, by adding a small number of training samples of such aquaculture types on the basis of the trained model to fine-tune the model and make full use of the trained model resources to speed up model training.
5. Conclusions
In this paper, we constructed a novel dataset to test the recognition and generalization ability of DeepLab-v3+ and U-Net. Compared with previous studies, the dataset we constructed had two main features. First, it described the complex features of marine ranching. For floating raft aquaculture, it contained three types that correspond to two growing stages. For cage aquaculture, it contained three aquaculture areas with different colors and morphologies. Second, the dataset included multi-temporal remote sensing images which helped to test model generalization ability. Through experiments, we found that:
(1) Compared with DeepLab-v3+, U-Net with a fine decoder structure has a stronger marine ranching recognition ability. U-Net can accurately identify the floating raft aquaculture areas at different culture stages and cage aquaculture areas with different colors but similar morphological characteristics. The F-score of the U-Net results extracted from the multi-temporal test images is basically stable, at more than 90%.
(2) U-Net has a relatively strong generalization ability and demonstrated a high accuracy in marine ranching extraction across multi-temporal test images. It can identify cage aquaculture areas that have different colors to training data; however, it cannot identify cage aquaculture areas that are different from the training data in morphology and structure. Transfer learning and fine-tuning may be considered in the identification of such culture areas in future research.
Compared with previous research, although we did not improve the framework of existing technologies, we further explored the model’s recognition and generalization ability in identifying marine ranching areas with complex features by using a novel dataset, which may provide new and necessary information for model applications and framework improvements.
This paper focuses on the two types of marine ranching aquaculture in the Sandu Gulf of Fujian Province. In the future, the scope of the experimental area can be expanded to marine ranching with different characteristics. The image data used in this paper are of good quality, and it is also significant to address the influence of image quality, considering, for example, cloud cover, in further studies.
Author Contributions
Conceptualization, Y.C. and G.H.; methodology, Y.C. and R.Y.; software, Y.C.; validation, Y.C.; formal analysis, Y.C.; investigation, Y.C.; resources, G.H.; data curation, Y.C., K.Z. and G.W.; writing—original draft preparation, Y.C.; writing—review and editing, G.H.; visualization, Y.C.; supervision, G.H.; project administration, G.H.; funding acquisition, G.H. All authors have read and agreed to the published version of the manuscript.
Funding
This research was funded by the program of the National Natural Science Foundation of China, grant number 61731022; the Strategic Priority Research Program of the Chinese Academy of Sciences, grant number XDA19090300.
Data Availability Statement
Not applicable.
Acknowledgments
Thanks for the support of School of Earth Sciences of Zhejiang University.
Conflicts of Interest
The authors declare no conflict of interest.
References
- Lin, G.; Zheng, C.; Cai, F.; Huang, F. Application of remote sensing technique in marine delimiting. J. Oceanogr. Taiwan Strait 2004, 23, 219–224+262. [Google Scholar]
- Wu, Y.; Zhang, J.; Tian, G.; Cai, D.; Liu, S. A Survey to Aquiculture with Remote Sensing Technology in Hainan Province. Chin. J. Trop. Crops 2006, 27, 108–111. [Google Scholar]
- Ma, Y.; Zhao, D.; Wang, R. Comparative Study of the Offshore Aquatic Farming Areas Extraction Method Based on ASTER Data. Bull. Surv. Mapp. 2011, 26, 59–63. [Google Scholar]
- Lu, Y.; Li, Q.; Du, X.; Wang, H.; Liu, J. A Method of Coastal Aquaculture Area Automatic Extraction with High Spatial Resolution Images. Remote Sens. Technol. Appl. 2015, 30, 486–494. [Google Scholar]
- Cheng, B.; Liu, Y.; Liu, X.; Wang, G.; Ma, X. Research on Extraction Method of Coastal Aquaculture Areas on High Resolution Remote Sensing Image based on Multi-features Fusion. Remote Sens. Technol. Appl. 2018, 33, 296–304. [Google Scholar]
- Wu, Y.; Chen, F.; Ma, Y.; Liu, J.; Li, X. Research on automatic extraction method for coastal aquaculture area using Landsat8 data. Remote Sens. Land Resour. 2018, 30, 96–105. [Google Scholar]
- Wang, J.; Sui, L.; Yang, X.; Wang, Z.; Liu, Y.; Kang, J.; Lu, C.; Yang, F.; Liu, B. Extracting Coastal Raft Aquaculture Data from Landsat 8 OLI Imagery. Sensors 2019, 19, 1221. [Google Scholar] [CrossRef]
- Chen, S. Spatiotemporal dynamics of mariculture area in Sansha Bay and its driving factors. Chin. J. Ecol. 2021, 40, 1137–1145. [Google Scholar] [CrossRef]
- Zhu, C.; Luo, J.; Shen, Z.; Li, J.; Hu, X. Extract enclosure culture in coastal waters based on high spatial resolution remote sensing image. J. Dalian Marit. Univ. 2011, 37, 66–69. [Google Scholar] [CrossRef]
- Xing, Q.; An, D.; Zheng, X.; Wei, Z.; Wang, X.; Li, L.; Tian, L.; Chen, J. Monitoring Seaweed Aquaculture in the Yellow Sea with Multiple Sensors for Managing the Disaster of Macroalgal Blooms. Remote Sens. Environ. 2019, 231, 111279. [Google Scholar] [CrossRef]
- Zhou, X.; Wang, X.; Xiang, T.; Jiang, H. Method of Automatic Extracting Seaside Aquaculture Land Based on ASTER Remote Sensing Image. Wetl. Sci. 2006, 4, 64–68. [Google Scholar] [CrossRef]
- Xie, Y.; Wang, M.; Zhang, X. An Object-oriented Approach for Extracting Farm Waters within Coastal Belts. Remote Sens. Technol. Appl. 2009, 24, 68–72+136. [Google Scholar]
- Wang, M.; Cui, Q.; Wang, J.; Ming, D.; Lv, G. Raft Cultivation Area Extraction from High Resolution Remote Sensing Imagery by Fusing Multi-Scale Region-Line Primitive Association Features. ISPRS J. Photogramm. Remote Sens. 2017, 123, 104–113. [Google Scholar] [CrossRef]
- Xu, S.; Xia, L.; Peng, H.; Liu, X. Remote Sensing Extraction of Mariculture Models Based on Object-oriented. Geomat. Spat. Inf. Technol. 2018, 41, 110–112. [Google Scholar]
- Ren, C.; Wang, Z.; Zhang, Y.; Zhang, B.; Chen, L.; Xi, Y.; Xiao, X.; Doughty, R.B.; Liu, M.; Jia, M.; et al. Rapid Expansion of Coastal Aquaculture Ponds in China from Landsat Observations during 1984–2016. Int. J. Appl. Earth Obs. Geoinf. 2019, 82, 101902. [Google Scholar] [CrossRef]
- Liu, Y.; Wang, Z.; Yang, X.; Zhang, Y.; Yang, F.; Liu, B.; Cai, P. Satellite-Based Monitoring and Statistics for Raft and Cage Aquaculture in China’s Offshore Waters. Int. J. Appl. Earth Obs. Geoinf. 2020, 91, 102118. [Google Scholar] [CrossRef]
- Wang, Z.; Yang, X.; Liu, Y.; Chen, L. Extraction of Coastal Raft Cultivation Area with Heterogeneous Water Background by Thresholding Object-Based Visually Salient NDVI from High Spatial Resolution Imagery. Remote Sens. Lett. 2018, 9, 839–846. [Google Scholar] [CrossRef]
- Wang, J.; Yang, X.; Wang, Z.; Ge, D.; Kang, J. Monitoring Marine Aquaculture and Implications for Marine Spatial Planning—An Example from Shandong Province, China. Remote Sens. 2022, 14, 732. [Google Scholar] [CrossRef]
- Kang, J.; Sui, L.; Yang, X.; Liu, Y.; Wang, Z.; Wang, J.; Yang, F.; Liu, B.; Ma, Y. Sea Surface-Visible Aquaculture Spatial-Temporal Distribution Remote Sensing: A Case Study in Liaoning Province, China from 2000 to 2018. Sustainability 2019, 11, 7186. [Google Scholar] [CrossRef]
- Chu, J.; Zhao, D.; Zhang, F. Wakame Raft Interpretation Method of Remote Sensing based on Association Rules. Remote Sens. Technol. Appl. 2012, 27, 941–946. [Google Scholar]
- Wang, F.; Xia, L.; Chen, Z.; Cui, W.; Liu, Z.; Pan, C. Remote sensing identification of coastal zone mariculture modes based on association-rules object-oriented method. Trans. Chin. Soc. Agric. Eng. 2018, 34, 210–217. [Google Scholar]
- Chu, J.; Shao, G.; Zhao, J.; Gao, N.; Wang, F.; Cui, B. Information extraction of floating raft aquaculture based on GF-1. Sci. Surv. Mapp. 2020, 45, 92–98. [Google Scholar] [CrossRef]
- Xu, Y.; Hu, Z.; Zhang, Y.; Wang, J.; Yin, Y.; Wu, G. Mapping Aquaculture Areas with Multi-Source Spectral and Texture Features: A Case Study in the Pearl River Basin (Guangdong), China. Remote Sens. 2021, 13, 4320. [Google Scholar] [CrossRef]
- Geng, J.; Fan, J.; Wang, H. Weighted Fusion-Based Representation Classifiers for Marine Floating Raft Detection of SAR Images. IEEE Geosci. Remote Sens. Lett. 2017, 14, 444–448. [Google Scholar] [CrossRef]
- Liu, Y.; Yang, X.; Wang, Z.; Lu, C. Extracting raft aquaculture areas in Sanduao from high-resolution remote sensing images using RCF. Haiyang Xuebao 2019, 41, 119–130. [Google Scholar]
- Shi, T.; Xu, Q.; Zou, Z.; Shi, Z. Automatic Raft Labeling for Remote Sensing Images via Dual-Scale Homogeneous Convolutional Neural Network. Remote Sens. 2018, 10, 1130. [Google Scholar] [CrossRef]
- Cui, B.; Fei, D.; Shao, G.; Lu, Y.; Chu, J. Extracting Raft Aquaculture Areas from Remote Sensing Images via an Improved U-Net with a PSE Structure. Remote Sens. 2019, 11, 2053. [Google Scholar] [CrossRef]
- Sui, B.; Jiang, T.; Zhang, Z.; Pan, X.; Liu, C. A Modeling Method for Automatic Extraction of Offshore Aquaculture Zones Based on Semantic Segmentation. ISPRS Int. J. Geo-Inf. 2020, 9, 145. [Google Scholar] [CrossRef]
- Cheng, B.; Liang, C.; Liu, X.; Liu, Y.; Ma, X.; Wang, G. Research on a Novel Extraction Method Using Deep Learning Based on GF-2 Images for Aquaculture Areas. Int. J. Remote Sens. 2020, 41, 3575–3591. [Google Scholar] [CrossRef]
- Liang, C.; Cheng, B.; Xiao, B.; He, C.; Liu, X.; Jia, N.; Chen, J. Semi-/Weakly-Supervised Semantic Segmentation Method and Its Application for Coastal Aquaculture Areas Based on Multi-Source Remote Sensing Images—Taking the Fujian Coastal Area (Mainly Sanduo) as an Example. Remote Sens. 2021, 13, 1083. [Google Scholar] [CrossRef]
- Zhang, Y.; Wang, C.; Ji, Y.; Chen, J.; Deng, Y.; Chen, J.; Jie, Y. Combining Segmentation Network and Nonsubsampled Contourlet Transform for Automatic Marine Raft Aquaculture Area Extraction from Sentinel-1 Images. Remote Sens. 2020, 12, 4182. [Google Scholar] [CrossRef]
- Ronneberger, O.; Fischer, P.; Brox, T. U-Net: Convolutional Networks for Biomedical Image Segmentation. arXiv 2015, arXiv:1505.04597. [Google Scholar] [CrossRef]
- Chen, L.-C.; Zhu, Y.; Papandreou, G.; Schroff, F.; Adam, H. Encoder-Decoder with Atrous Separable Convolution for Semantic Image Segmentation. In Proceedings of the Computer Vision—ECCV 2018, Munich, Germany, 8–14 September 2018; Ferrari, V., Hebert, M., Sminchisescu, C., Weiss, Y., Eds.; Springer International Publishing: Cham, Switzerland, 2018; pp. 833–851. [Google Scholar]
- Chen, L.-C.; Papandreou, G.; Kokkinos, I.; Murphy, K.; Yuille, A.L. Semantic Image Segmentation with Deep Convolutional Nets and Fully Connected CRFs. arXiv 2014, arXiv:1412.7062. [Google Scholar] [CrossRef]
- Chen, L.-C.; Papandreou, G.; Kokkinos, I.; Murphy, K.; Yuille, A.L. DeepLab: Semantic Image Segmentation with Deep Convolutional Nets, Atrous Convolution, and Fully Connected CRFs. IEEE Trans. Pattern Anal. Mach. Intell. 2018, 40, 834–848. [Google Scholar] [CrossRef]
- Chen, L.-C.; Papandreou, G.; Schroff, F.; Adam, H. Rethinking Atrous Convolution for Semantic Image Segmentation. arXiv 2017, arXiv:1706.05587. [Google Scholar] [CrossRef]
- Liu, K.; Fu, J.; Li, F. Evaluation Study of Four Fusion Methods of GF-1 PAN and Multi-spectral Images. Remote Sens. Technol. Appl. 2015, 30, 980–986. [Google Scholar]
- Long, J.; Shelhamer, E.; Darrell, T. Fully Convolutional Networks for Semantic Segmentation. arXiv 2015, arXiv:1411.4038. [Google Scholar] [CrossRef]
- Chollet, F. Xception: Deep Learning with Depthwise Separable Convolutions. arXiv 2017, arXiv:1610.02357. [Google Scholar] [CrossRef]
- Dumoulin, V.; Visin, F. A Guide to Convolution Arithmetic for Deep Learning. arXiv 2018, arXiv:1603.07285. [Google Scholar] [CrossRef]
Publisher’s Note: MDPI stays neutral with regard to jurisdictional claims in published maps and institutional affiliations. |
© 2022 by the authors. Licensee MDPI, Basel, Switzerland. This article is an open access article distributed under the terms and conditions of the Creative Commons Attribution (CC BY) license (https://creativecommons.org/licenses/by/4.0/).