1. Introduction
Modern small satellites are having a significant impact on our world today, as they are being introduced in education, commercial applications, and institutions from developing countries, due to the incorporation of Commercial off-the-Shelf (COTS) components and rapid development cycles [
1,
2,
3]. The physical limitation of pico/nano/microsatellites has not been an impediment to the development of missions for technology demonstration, science, communication, and Earth observation [
4,
5,
6,
7,
8]. Earth observation is one of the main applications of these modern small satellites [
8,
9,
10]. The first demonstrations of small satellites for Earth observation occurred around the year 2000, and their commercial viability was achieved with the formation of constellations that increased the temporal resolution and were possible due to their low cost [
1]. The low cost was achieved after hardware miniaturization promoted the development of Earth observation payloads for CubeSats with characteristics ranging from panchromatic to hyperspectral images, depending on the physical limitations of volume and weight [
10,
11]. Small satellites are used for wildfire detection, deforestation monitoring, ship detection, land use, surface water mapping, among other applications using optical sensors. The combination of different bands can highlight features that can be easily recognized. However, cloud-covered images limit most of these applications because clouds tend to block the visible wavelength. Although cloudy images are useful for studying the Earth cloud system, these images can be a problem for many Earth observation applications.
The physical dimensions of small satellites limit the communication link and the available power, making it difficult to download or process all the generated data. Many downloaded images are useless because they are covered by clouds, whereas more images are captured and a high volume of data is generated in orbit. One way to address this problem is to download reduced size versions of images (thumbnails) to inspect the utility of the image, as carried out by the FACSAT-1 mission [
12]. In this case, it is common to spend more than five minutes downloading a thumbnail and evaluating whether it is worthwhile to download the entire image according to the cloud coverage percentage. Considering that the communication window is around 10 min, the operator spends 50% of the operating time on this. Another way to address the problem is to automate the on-board processing of the image for cloud coverage calculation using artificial intelligence (AI). However, the application of AI in modern small satellites is limited by the processing speed and power consumption of the on-board computers.
Recently, the application of artificial intelligence (AI) to the edge in space systems has attracted the interest of researchers [
13]. The application of machine learning (ML) in resource-constrained environments has promoted the development of hardware platforms and frameworks to enable Deep Learning techniques such as Convolutional Neural Networks (CNN) in small computers [
14]. For example, CNN applications to cloud segmentation in multispectral data was proposed using GPU [
15]. Most of the hardware solutions for Deep Learning in edge processing are based on Application-Specific Integrated Circuit (ASIC), Graphics Processing Unit (GPU) or Field Programmable Gate Arrays (FPGA) [
16], which are high-processing tools that require high power. Therefore, these hardware solutions are not common on CubeSats or other small satellites due to their limited power capabilities.
To enable AI on-board CubeSat, recent efforts have focused on implementing Deep Learning for traditional microcontrollers. A scheme based on Deep Learning for on-board ship detection was proposed in [
17]. The application of on-board processing using CNN for selecting an image to download has been proposed in [
18]. Another application of CNN for wildfire image classification on board CubeSat is presented in [
19]. However, the accuracy of these implementations is usually lower than that of the implementation in specific hardware solutions due to quantization and pruning techniques that enable edge in space systems.
In order to implement satellite on-board processing, a CNN for cloud detection in hyperspectral images, CloudScout, was tested on a Vision Processing Unit (VPU), a COTS hardware accelerator for Deep Learning [
20]. CloudScout uses three bands to categorize the images as cloudy or non-cloudy. Interest in applying CNN on board small satellites has encouraged optimization techniques and model simplification to demonstrate its suitability for COTS low-power hardware. The combination of image compression and a lightweight version of U-net [
21], LU-net, was proposed to detect clouds using four bands (R,G,B and nearIR); this was tested on the Raspberry Pi platform (ARMv8 CPU) [
22]. A variant of U-net, RS-Net, was proposed and evaluated with different combinations of bands available in Landsat 8 images [
23]. It achieved a significant performance using only the RGB image, which is of great relevance for nanosatellites without a multispectral sensor with low power and computation capabilities. With this approach, a reduced version of RS-net, NU-Net, was proposed for cloud segmentation using RGB images and was tested on an ARM-Cortex M4 microcontroller, which was used for image priorization [
24].
This paper details an automatic image priorization system based on cloud coverage which can be installed on-board a small spacecraft such as Cubesat—pico/nano/microsatellites. The implementation of this system can detect the cloud coverage in an RGB image; in this way, during the operation it is not necessary to download the thumbnail image to evaluate the cloud coverage. The system can be used to provide the cloud coverage index of a set of images, which can be ordered accordingly. Cloud detection was obtained by a Convolutional Neural Network running on a microcontroller and was trained by using a dataset from Sentinel-2 which was divided into training and test datasets. The accuracy obtained with the test dataset of 100 images was 0.91 and the F1-score was 0.83. It is known that CNN has some problems with unseen domains. A change in the imager or the orbit of the satellite changes the domain of the images. For this reason, we also tested the system with a dataset from an Earth observation 3U CubeSat.
The main contributions reported in this paper are the following:
A proposal for an autonomous system to be used on board small satellites to prioritize images according to cloud coverage;
Demonstration of CNN-based cloud detection on a COTS-based embedded system not optimized for Deep Learning and using an open source framework;
Evaluation of the effect of quantization of CNN performance by comparing the results of the embedded system against the PC;
Demonstration of CNN performance in the unseen domain by testing the systems with a dataset from a different imager—the images obtained from a CubeSat mission.
2. Methods and Materials
To detect the cloud coverage of images on board CubeSats, we proposed a module capable of detecting the clouds and quantifying the percentage of cloud coverage. The module can be connected to a master device, and it receives the image and returns the cloud coverage calculated from a cloud mask generated by a CNN. The cloud coverage is used to order the image accordingly during image prioritization. In order to develop this module we required a CNN architecture that processes the image to detect the cloud, a cloud coverage calculation, a dataset to train and test the CNN, and the implementation of the module on an embedded device suitable for CubeSats. All these elements are described in this section along with the evaluation process to verify the module.
2.1. Cloud Detection Using the CNN
Cloud detection is the core of the module and is based on the specific CNN architecture, NU-Net, proposed by Park [
24]. This architecture was chosen because its potential for cloud detection in RGB images was demonstrated in [
24] by comparing it against several Deep Learning approaches such LU-net [
22], RS-Net [
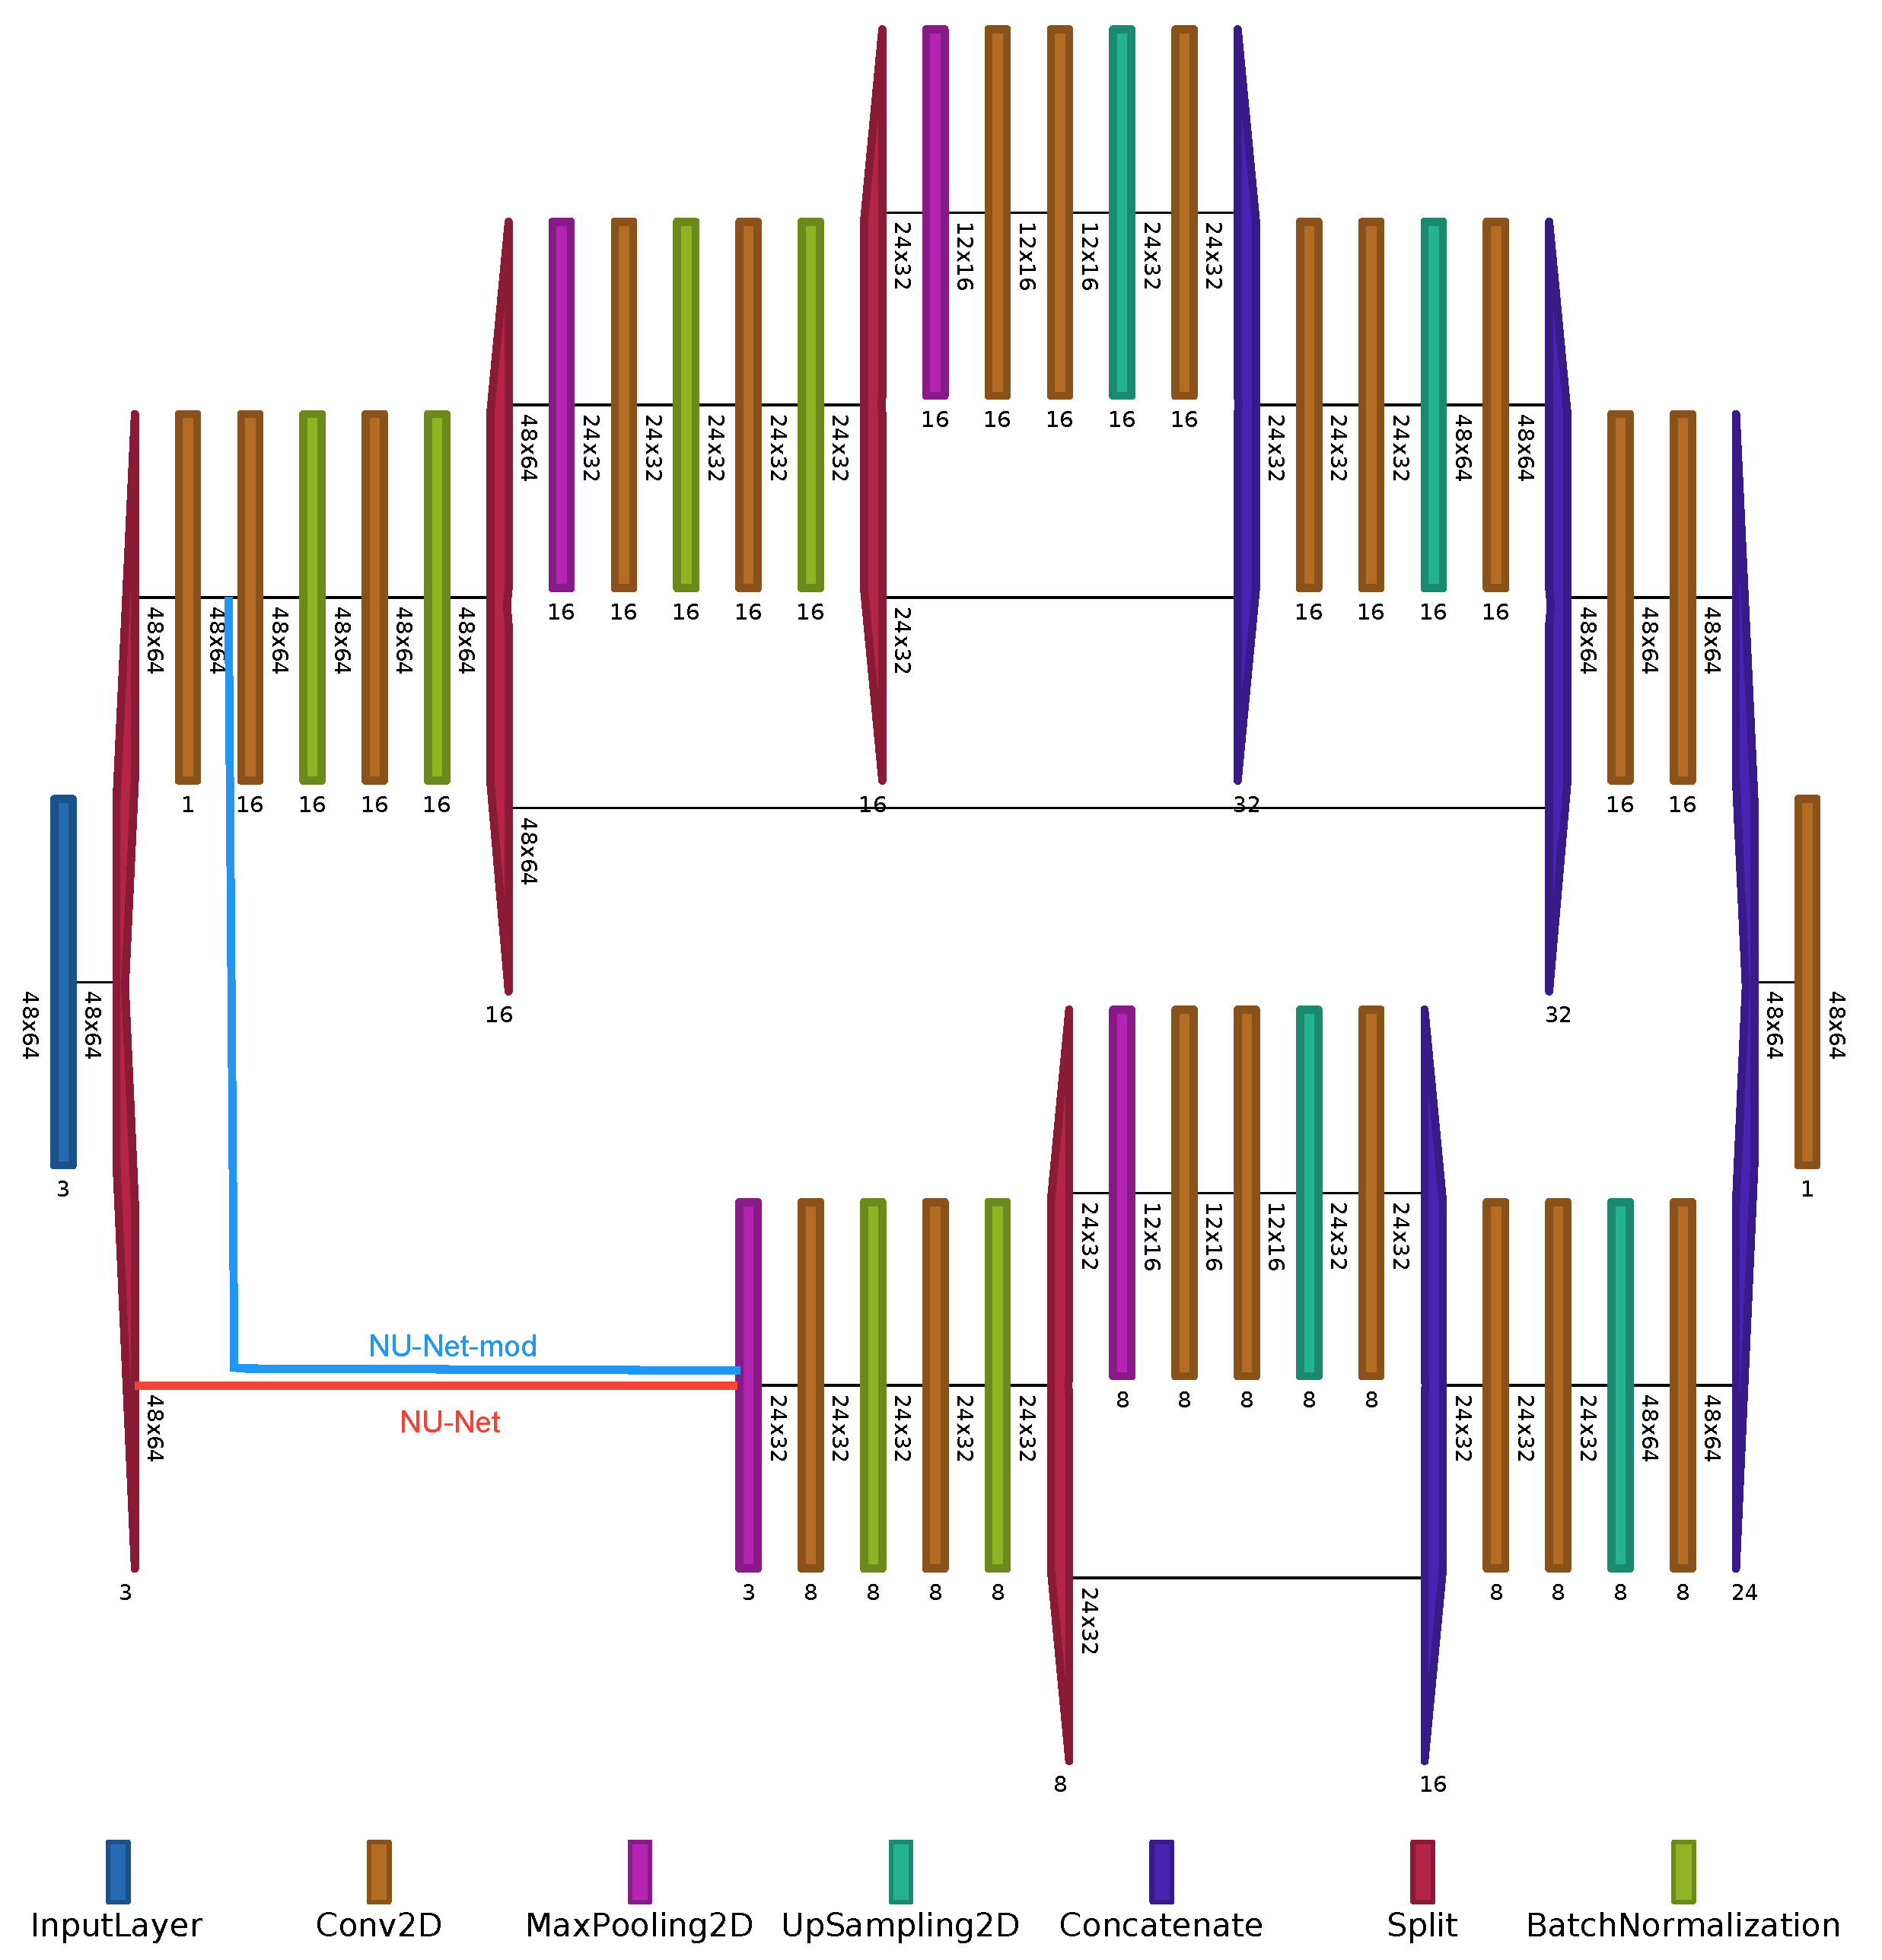
23] and classical techniques such as Random Forest Classifier (RFC), Gradient Boosting Classifier (GBC) and Support Vector Machine (SVM), as well as its suitability to be implemented in a microcontroller. This architecture for segmentation tasks was selected over a purely regression architecture because it states in a clearer way, making it pixel-wise. NU-Net is a CNN based on RS-Net that is a simplified version of U-Net. NU-Net consists of a multistream architecture with a reduced number of kernels to make the networks suitable for microcontrollers [
24]. The two streams are a single-band stream and a multi-band stream. The single-band stream is focused on extracting spatial features with a larger network than the multi-band stream; both networks are concatenated at the end of the network to obtain an image of the same size of the input image as shown in
Figure 1. More details of NU-Net can be found in Park [
24]. In this work, we have explored a variation of this architecture, NU-Net-mod. With this variation, we were looking for a reduction in the size of the network by decreasing the number of weights. To achieve this objective, we maintained the multistream approach; however, both streams were single band, and the input image was transformed into a single band image before splitting, as shown in
Figure 1.
2.1.1. Dataset Description
Two datasets from different satellites were used as follows:
The first dataset, used for the NU-Net training and test, consisted of 600 RGB images in true color and low resolution (60 m) from Sentinel-2B that were resized to 64 × 48 pixels and 8-bits. There was a cloud mask for each image of the same dimensions (64 × 48 pixels), and it was divided into a training dataset and a test dataset with 300 images each, as explained by Park [
24]. This dataset resembles the kind of image acquired by nanosatellites and contains the labels required for training the CNN. This dataset was downloaded from the supplementary material provided by [
24].
The second dataset, used only for evaluation under unseen domain, was made up of a set of thumbnail images acquired by the FACSAT-1 nanosatellite. The thumbnail images in this dataset are RGB images of 640 × 480 pixels which were resized to 64 × 48 pixels to match with the train dataset. As described in the Introduction, these are the images used by the operators of the nanosatellite to evaluate the cloud coverage of the image in order to download a higher-resolution image. There is no label for this dataset; however, these images were useful for evaluating the generalization of the CNN and its performance for an unseen domain because these images were acquired by a different imager. The method of qualitative evaluation using this dataset is explained at the end of this section.
2.1.2. Training Setup and Evaluation Metrics for the CNN
The architecture of NU-net was created with Python using Tensorflow and the Keras Deep Learning framework. CNN was trained on a PC using 100 randomly selected images from the training dataset and data augmentation was used to obtain a more generalized model and reduce overfitting. The data augmentation was performed with the parameters listed in
Table 1.
For the training process, the selected parameters are listed in
Table 2.
To evaluate the performance of NU-Net, quantitative metrics were calculated using the first dataset, which contained the cloud mask used for label. Accuracy, precision, recall, and
F1 were calculated based on the confusion matrix on all pixels in the dataset as proposed by Jepppensen [
23]. Using the four metrics, misinterpretations were avoided due to imbalanced classes in the distribution of the dataset. The following describes how each metric was calculated:
where
,
,
, and
are true positive, true negative, false positive and false negative, respectively.
In addition to the metrics that evaluated the performance of the CNN pixel-wise, the Spearman rank correlation coefficient was calculated for evaluating the predicted priority ranking against the true priority rank. The ranking was ordered according to the cloud coverage calculated on each image. The predicted priority ranking used the output of NU-Net while the true priority rank used the image label of the test dataset.
2.1.3. Cloud Coverage Calculation
The cloud coverage was calculated from the NU-Net segmentation result by evaluating the ratio of the cloud pixels and the total number of pixels of the image:
This equation was implemented as follows:
where
a and
b are the width and height of the image, respectively, and
p the value of pixels that can be 0 or 1 as a result of the classification. In this way, the cloud coverage went from 0.0 when the image was fully clear to 1.0 when it was fully cloudy.
2.2. Cloud Coverage under Unseen Domain
CNN’s cloud detection was also evaluated in the unseen domain. For this evaluation, the second dataset containing thumbnail images from FACSAT-1 was used. These images were not used during training and were acquired by a different sensor. While the training dataset contained Sentinel-2B images, this evaluation dataset contained CubeSat images that were obtained from a different imager. In addition, the size and resolution of this dataset were different from the training dataset.
Table 3 summarizes the main differences of the two missions (Sentinel-2 and FACSAT).
The thumbnail images of the second dataset were resized to 64 × 48 pixels to match the NU-Net input. This process degraded the resolution, which is another challenge that must be overcome by a trained CNN. However, it is worth recalling that the images in the training dataset were also resized to 64 × 48 pixels as mentioned in
Section 2.1.1.
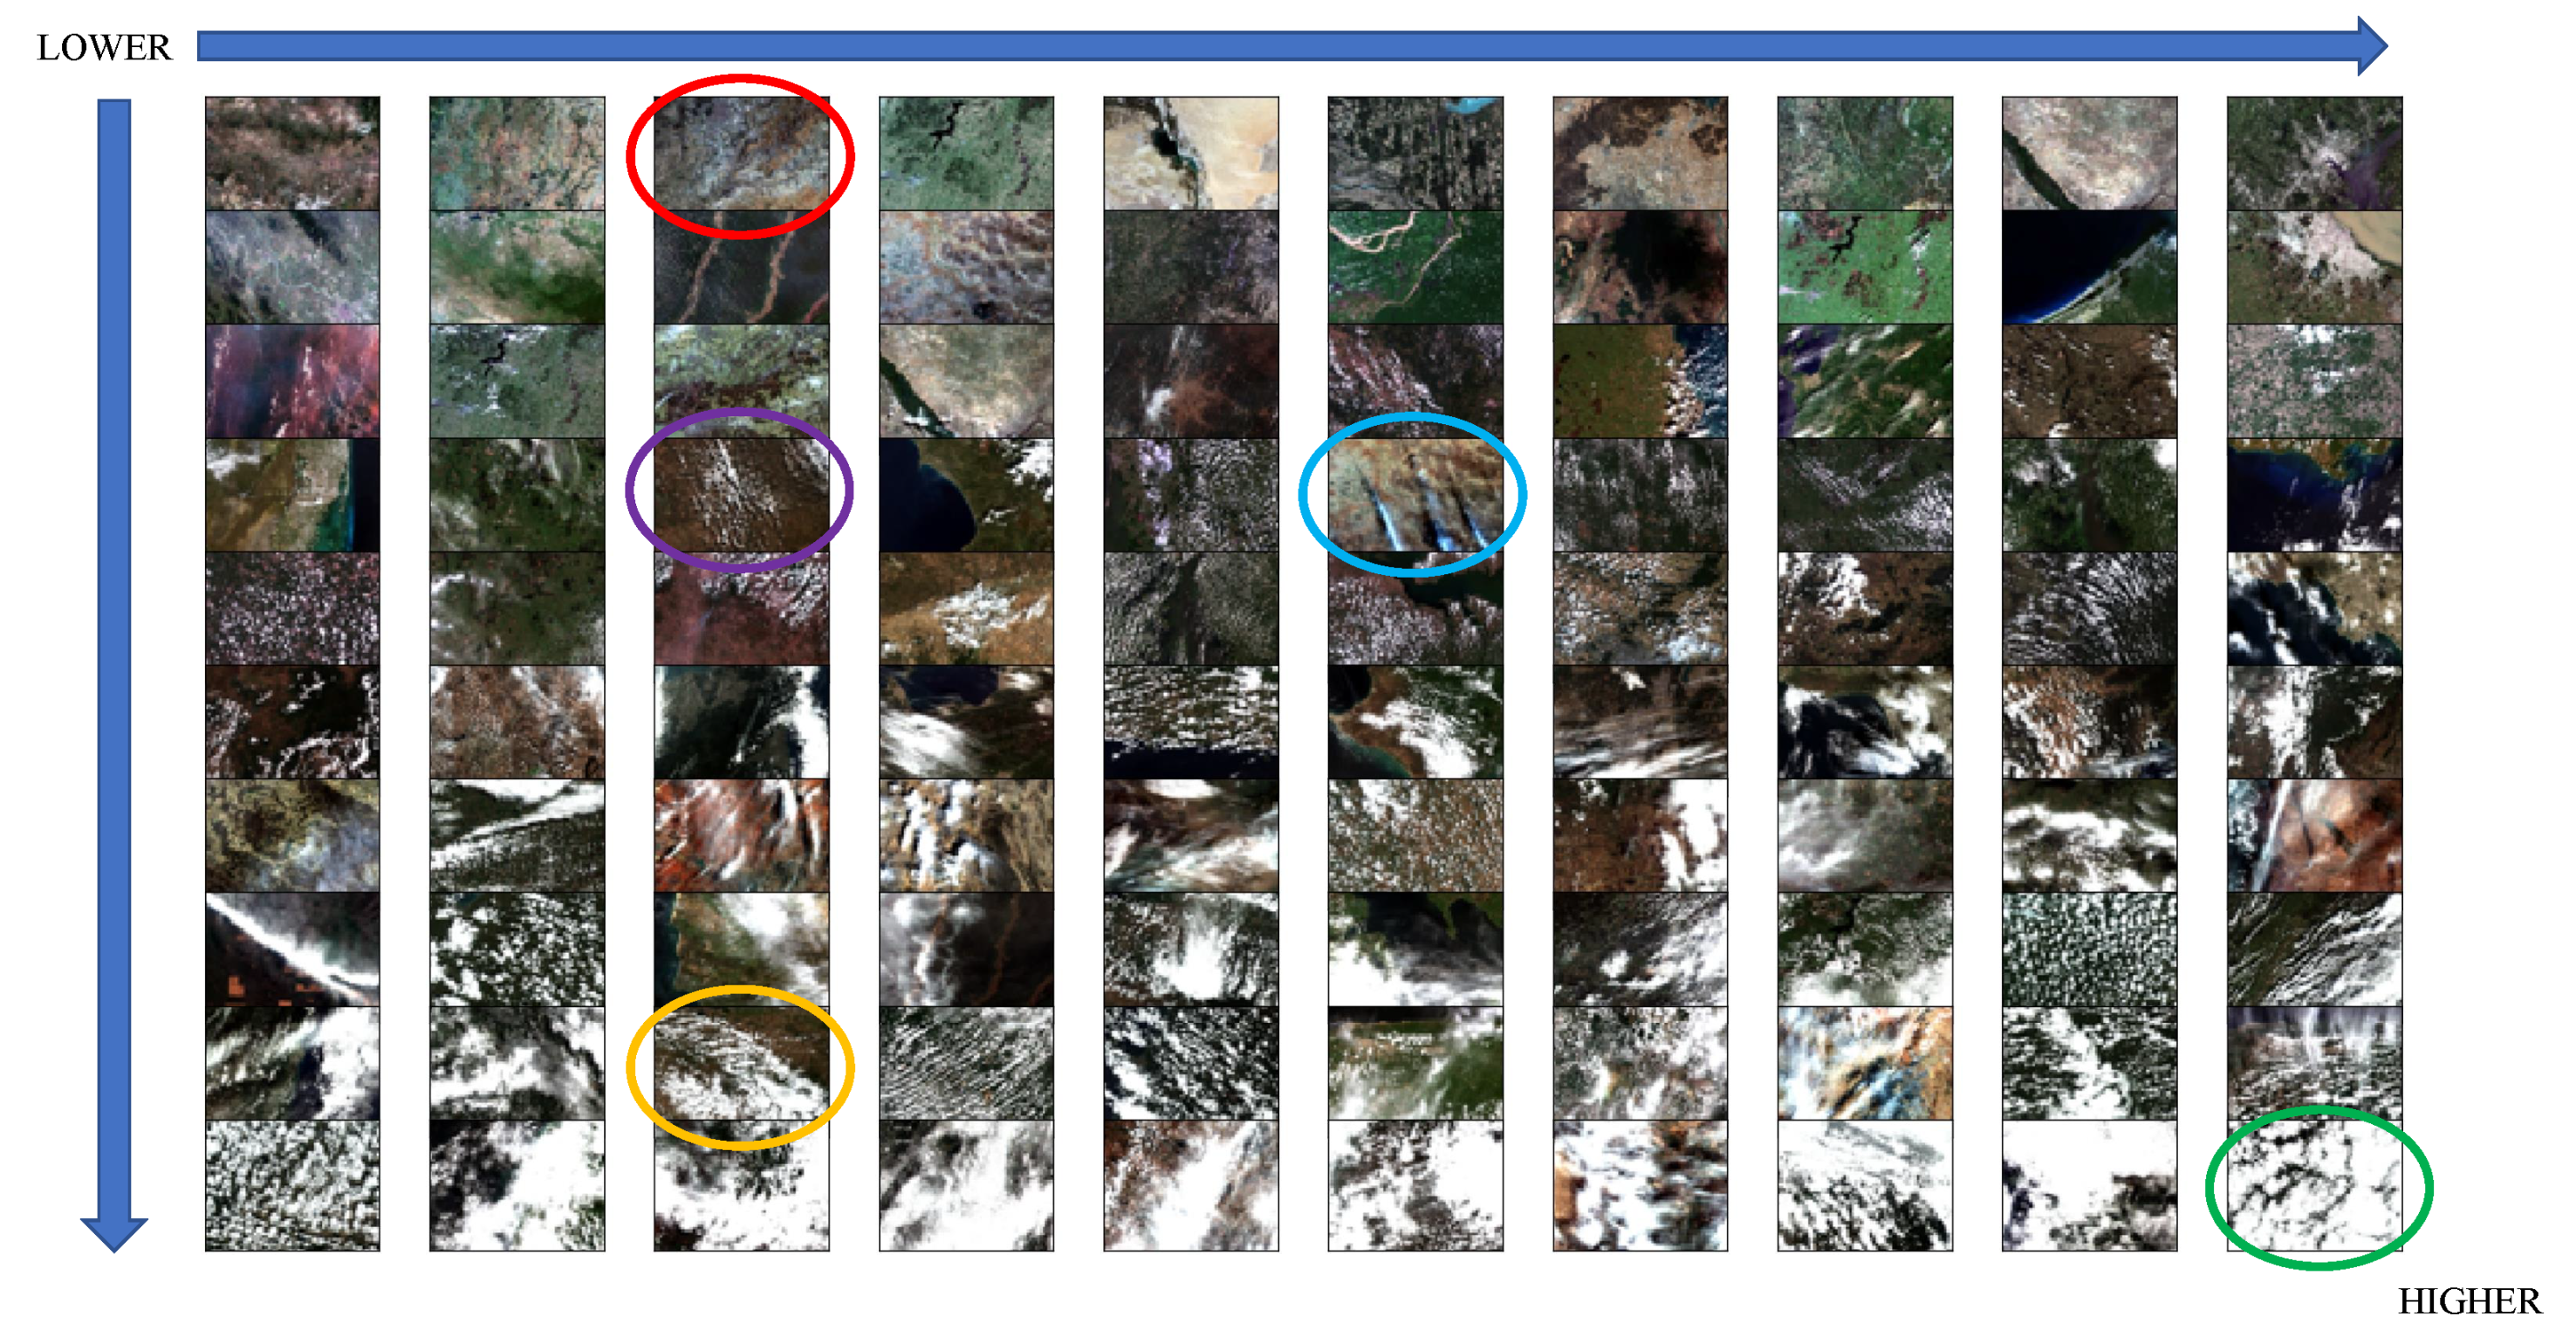
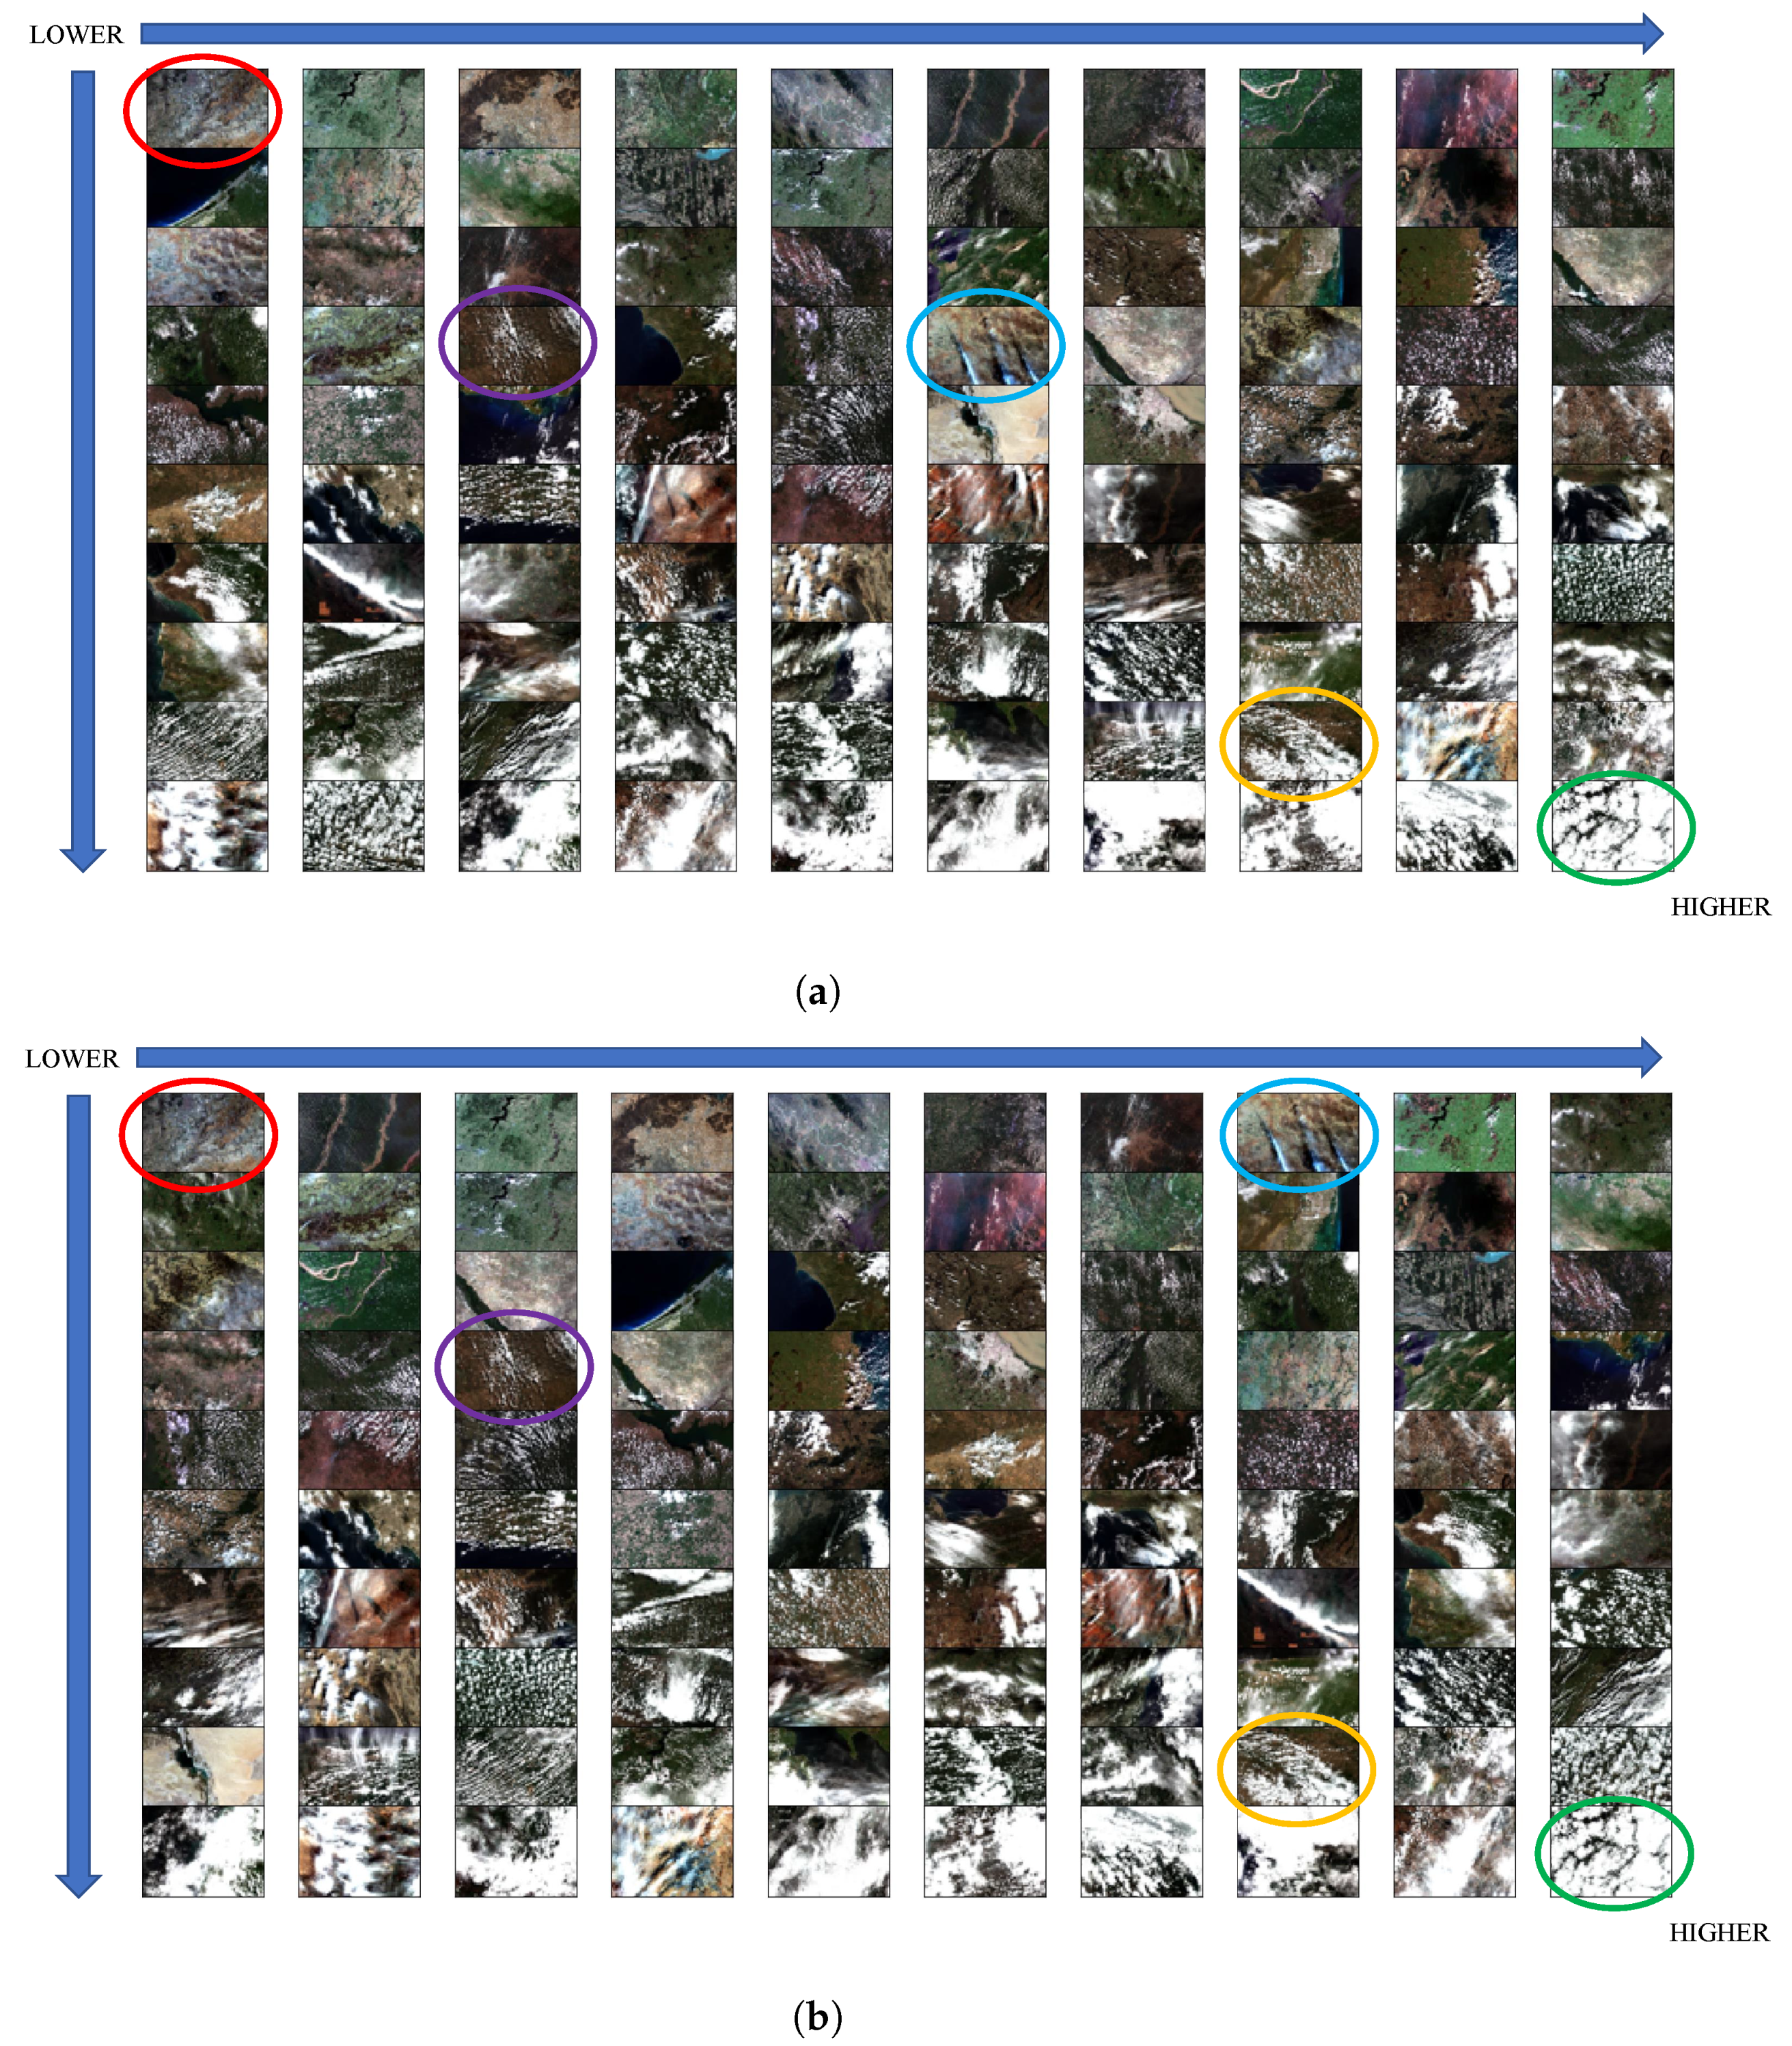
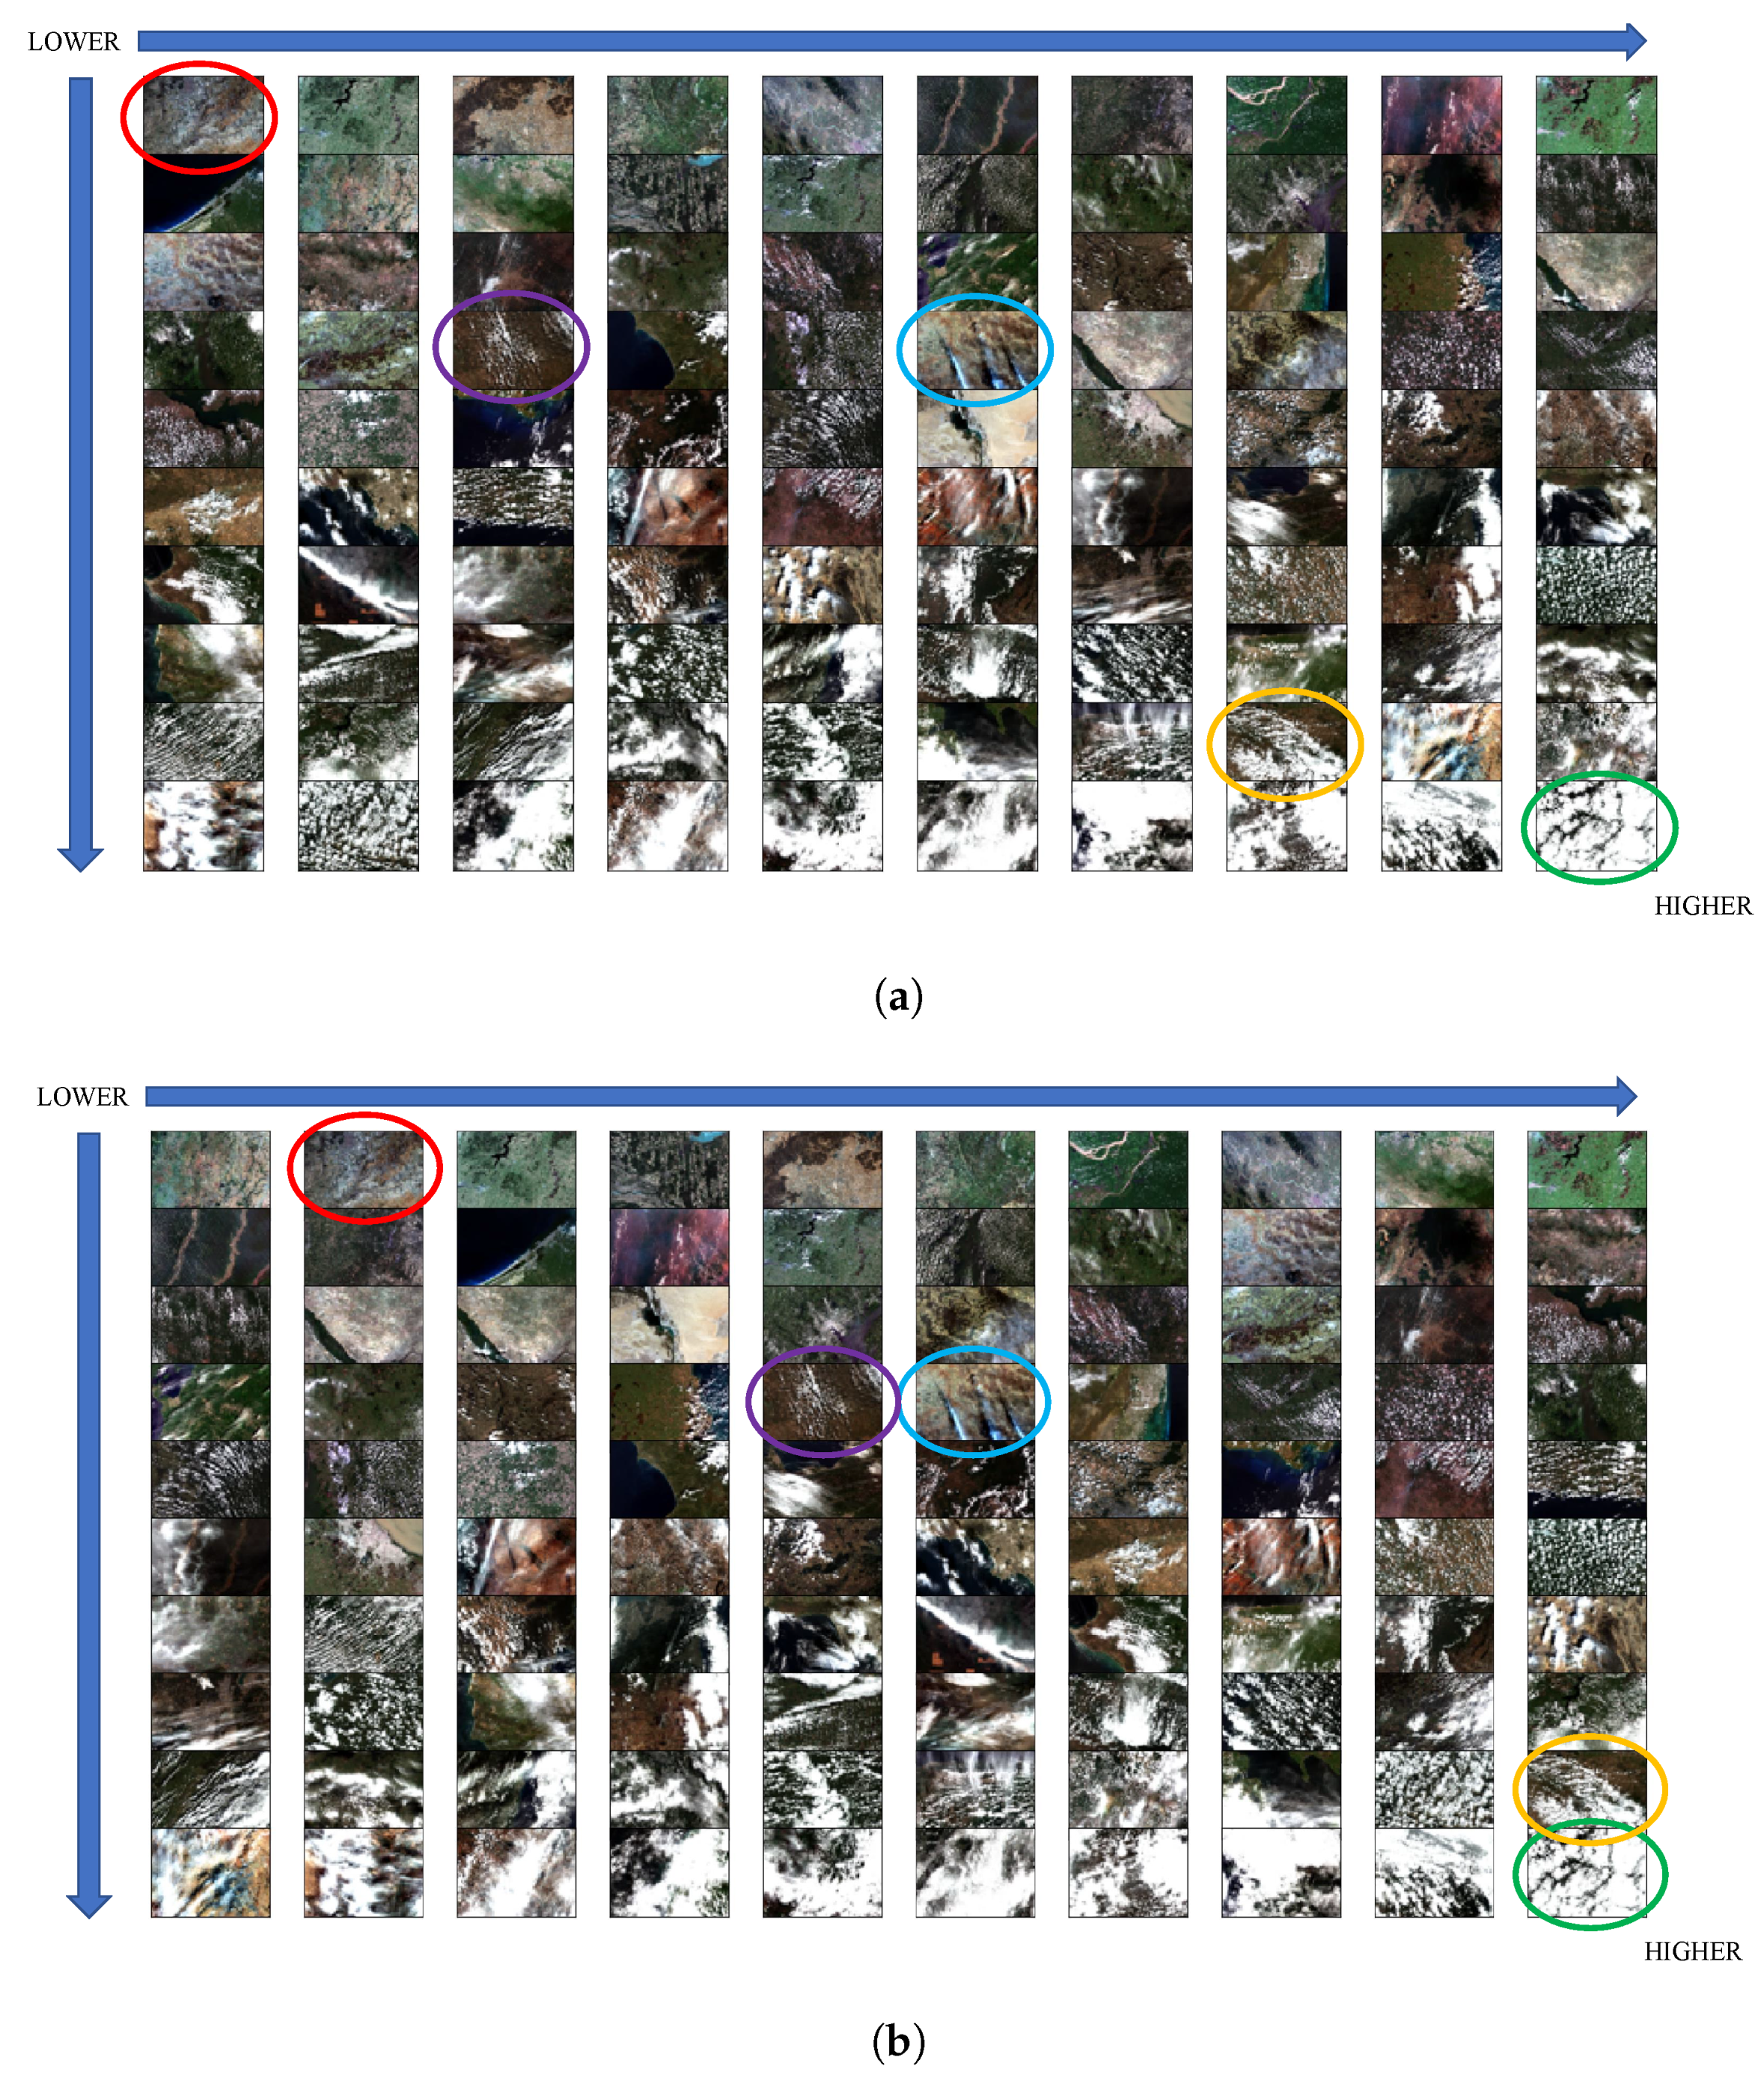
Evaluation of the NU-Net with the second dataset was qualitative because these images did not have a corresponding label with a cloud mask. Qualitative evaluation was performed by visual comparison of the output of the NU-Net. All images in the dataset were visualized, and the same images were also visualized after ordering according to the cloud coverage.
2.3. Cloud Detection System on the COTS Embedded Device and Open-Source Framework
On-board cloud detection requires the implementation of the CNN on an embedded system. Even though most of the hardware applications of CNN are based on ASIC, GPU or FPGA, the NU-Net runs on a Microcontroller Unit (MCU) over micropython through the TinyML framework. MCU are cheaper, easier to acquire, and require a lower power than optimized hardware for CNN. Once the micropython was installed on the MCU, it could operate a reduced model of NU-Net which was obtained using TensorflowLite to convert the Keras model to the TinyML version. The selected COTS microcontroller was the ESP32, which is a 32 bits, 240 MHZ, 520 kB RAM single-core device. This was selected because it supports the micropython version with the TinyML framework. The module was implemented and tested using the ESP32-CAM development board that includes an external RAM of 4 MB.
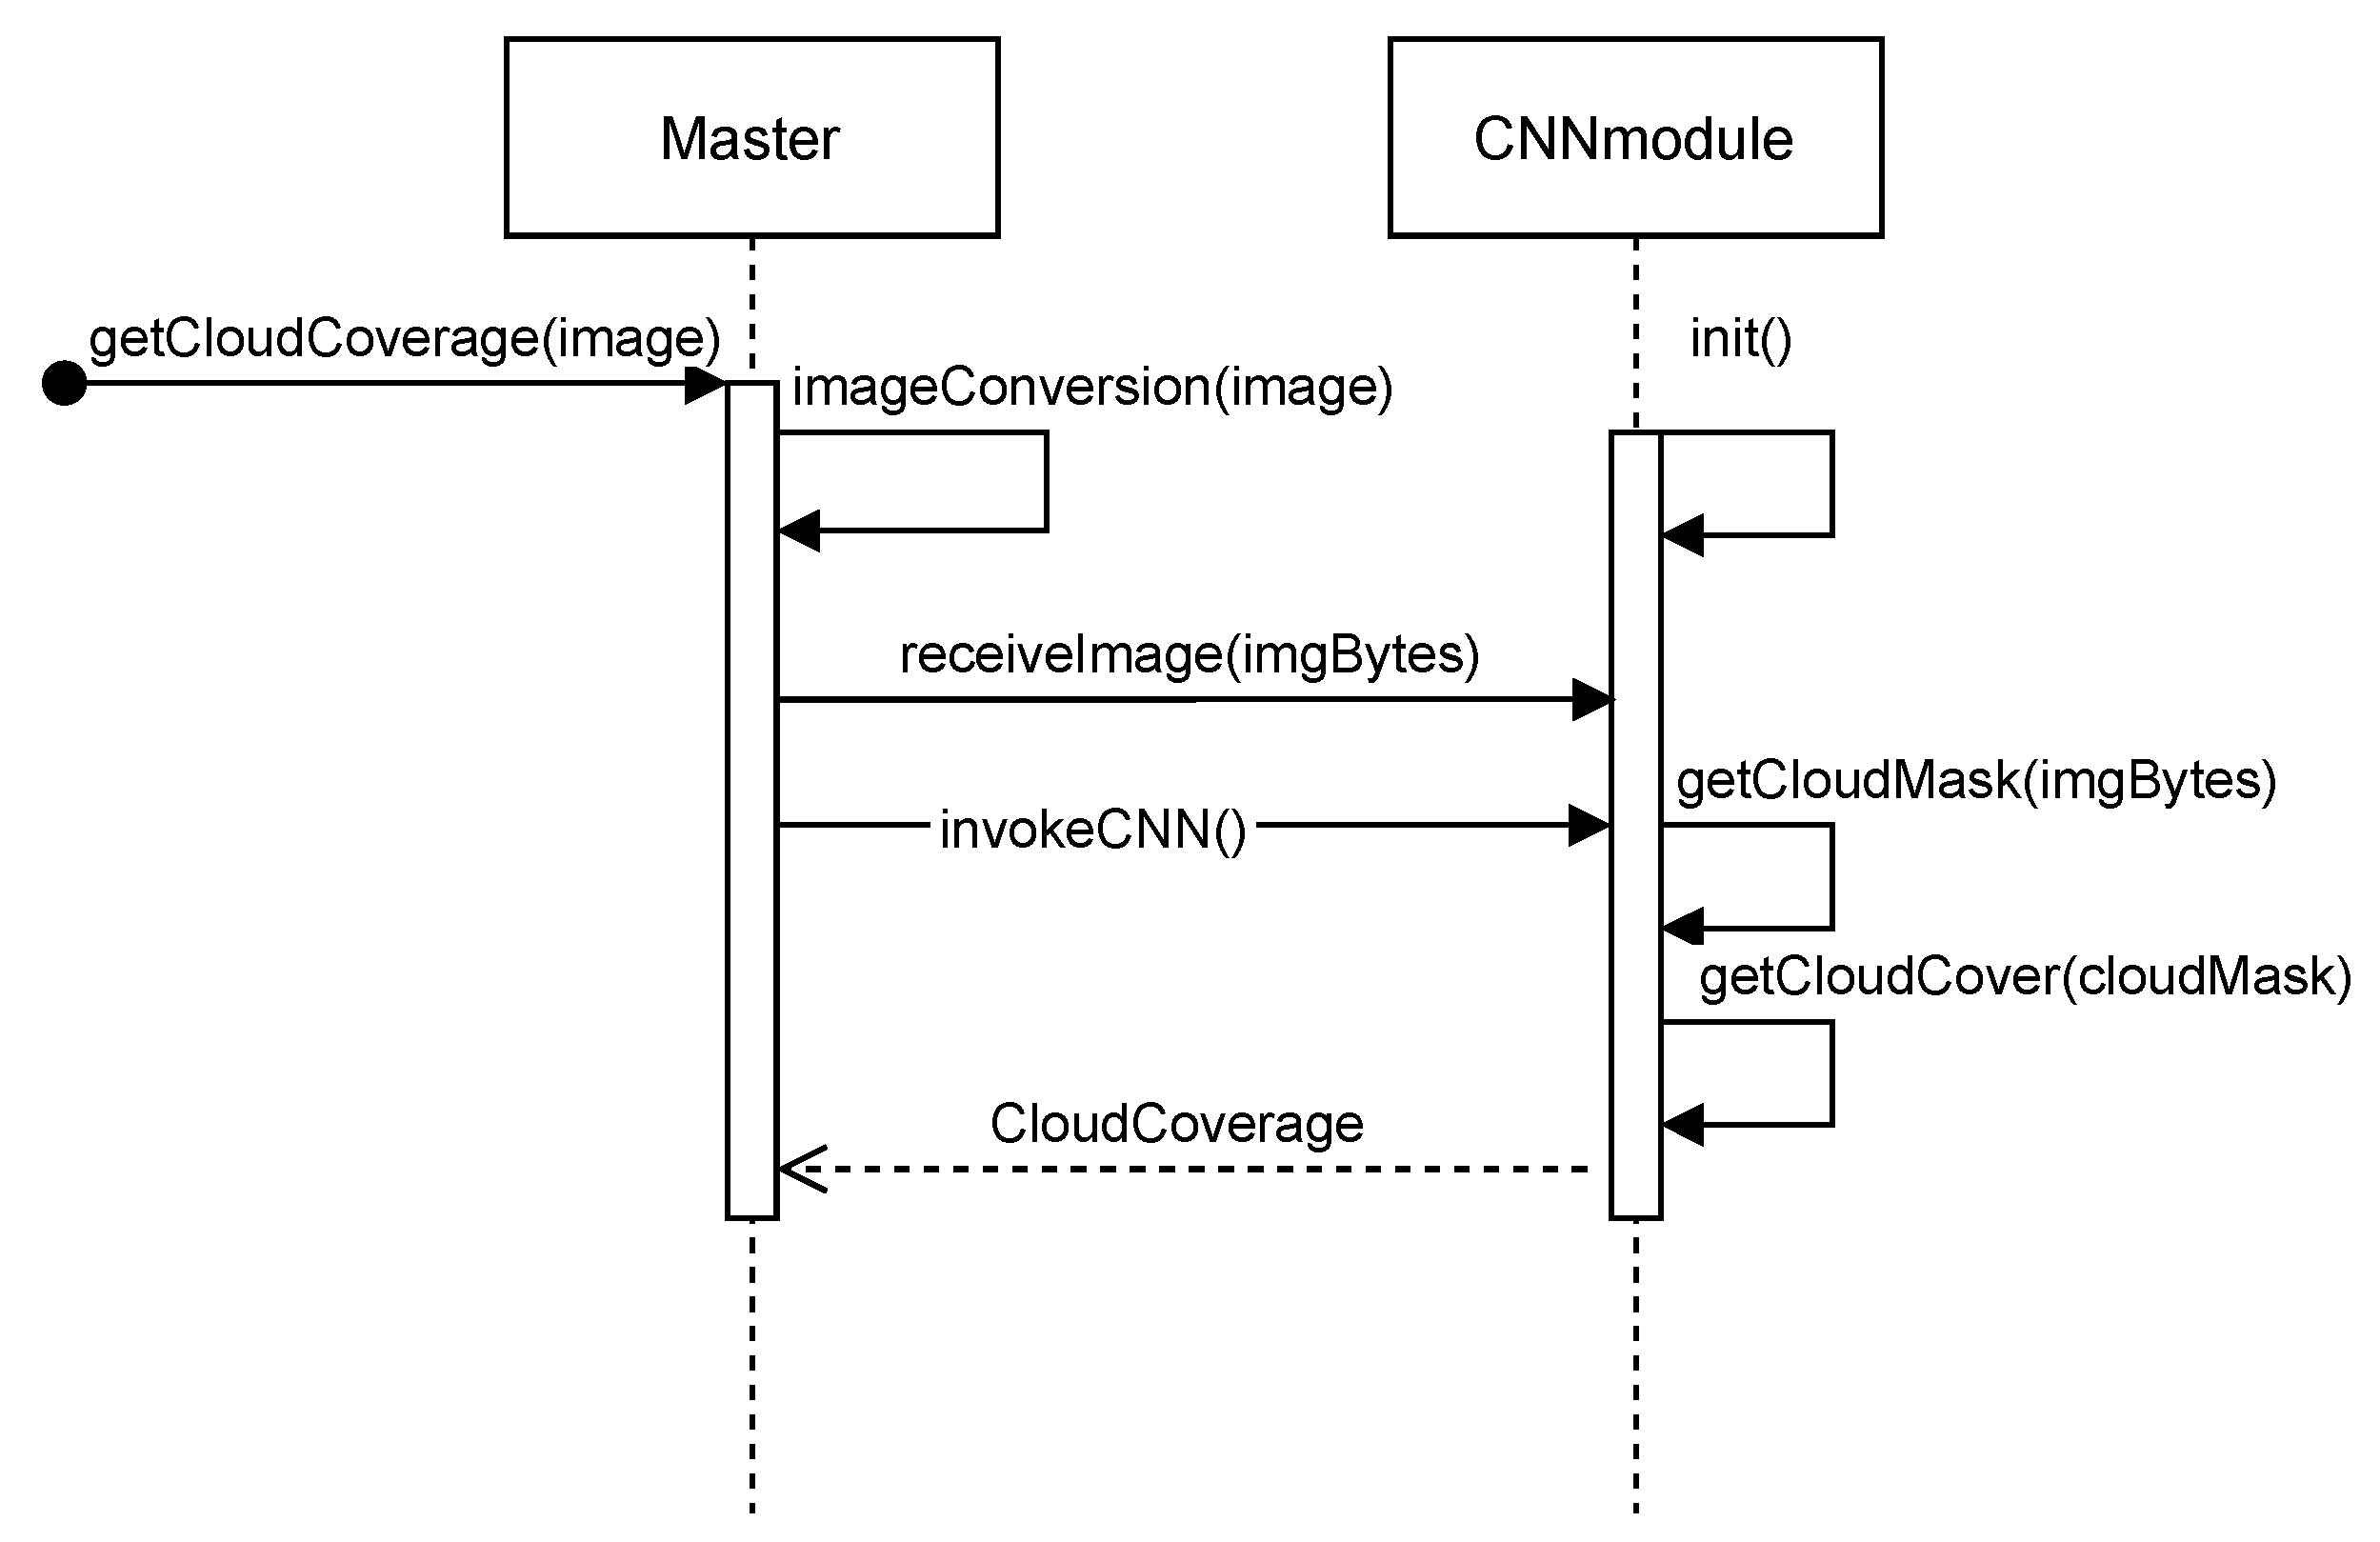
The proposed systems consists of an MCU running the NU-Net model, pre-trained to detect clouds in the image and programmed to calculate the cloud coverage from the image output of the NU-Net. The MCU works as a module that can receive an image and return the corresponding cloud coverage. Therefore, a master CPU sends the image and receives the cloud coverage to add this parameter and order the images accordingly. This CPU can be the main processor of the imager or the on-board computer of the small satellite. To work independently of the master, the MCU was programmed with a communication protocol through UART at 115,200 bps. Using this communication protocol, the master indicated that an image would be sent to the MCU, then a command to process the image was also sent, and finally the cloud coverage value was received
Figure 2.
Performance of NU-Net under Unseen Domain
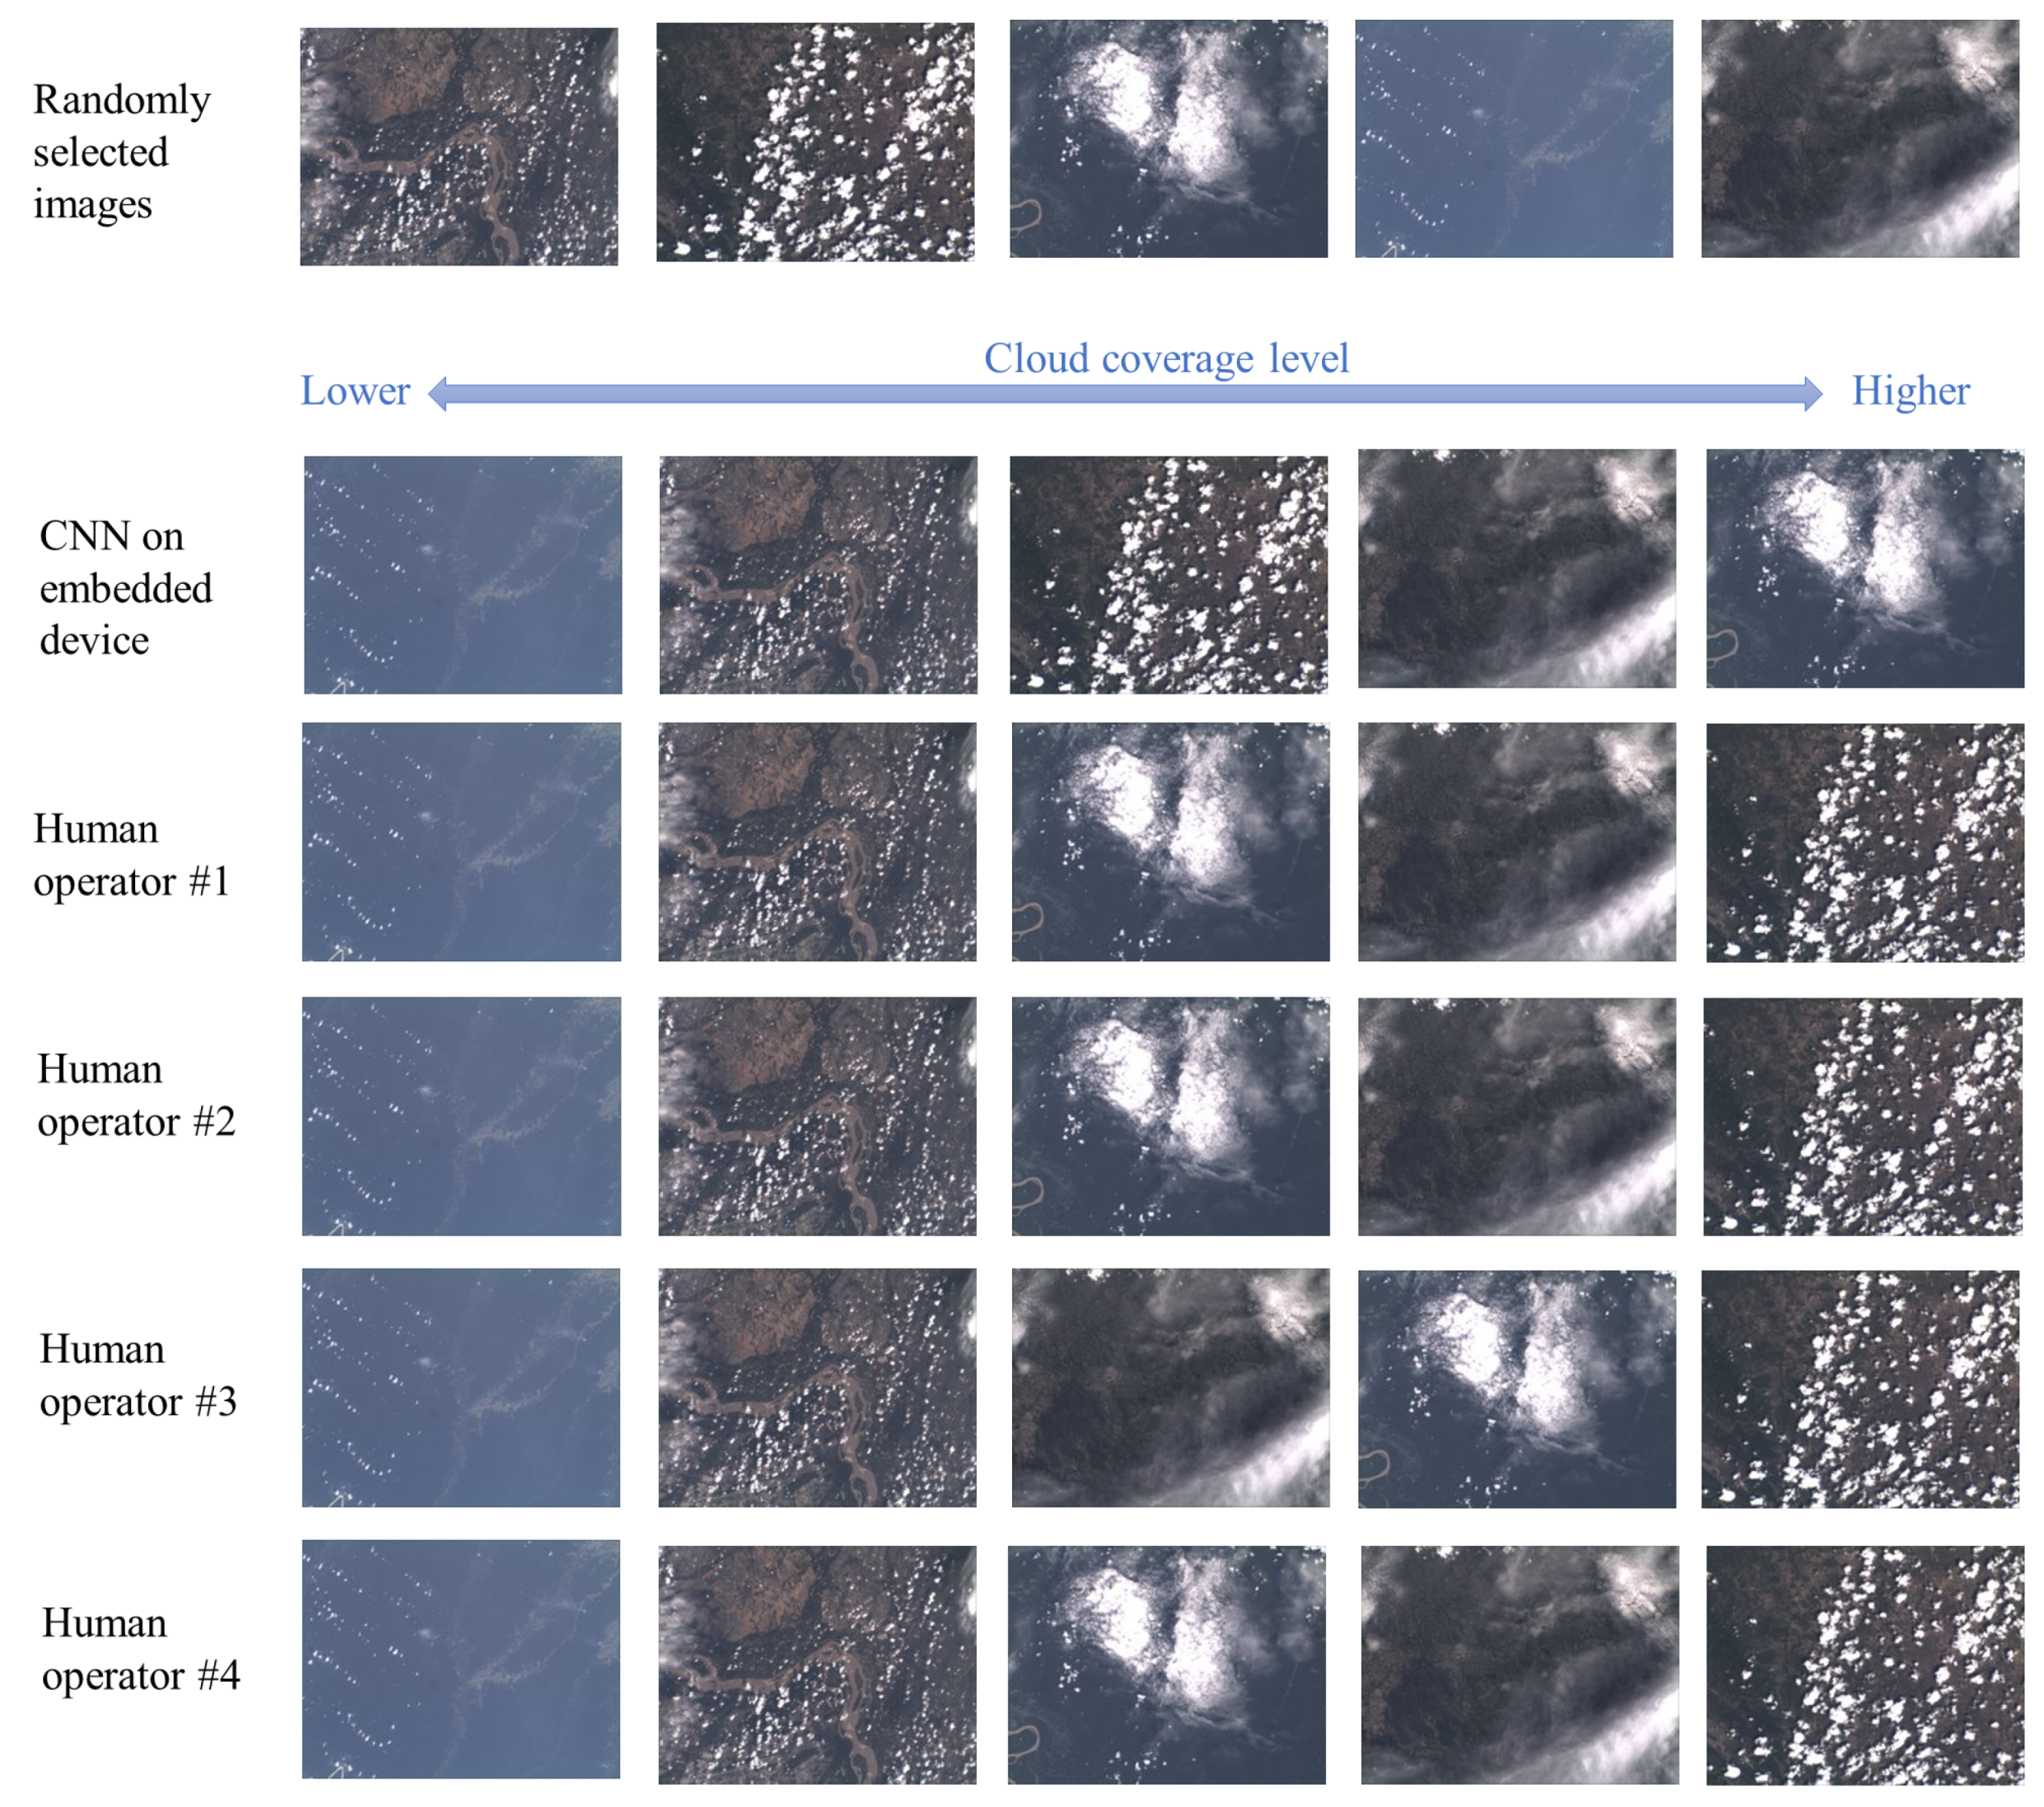
As explained above, NU-Net was trained using a dataset with Sentinel-2 images with a cloud mask used as a label. In addition, in this work, the performance of NU-Net was also evaluated under conditions given by a dataset from CubeSat images. There was no cloud mask for this dataset; for this reason, the metrics explained above could not be calculated. In this case, a qualitative evaluation was performed based on a visualization of the prioritization of the image. To evaluate the practicality of the proposed approach, the rank obtained by the embedded device was compared against the rank of four independent experts that operated the satellite and ranked the images during the CubeSat operation. In addition, we also compared the prioritization of NU-Net on a PC with the prioritization of NU-Net on MCU.
4. Discussion
The results have shown that both the NU-Net architecture and the variant NU-Net mod are able to detect cloud coverage on thumbnail images. The performance metric indicated an accuracy of more than 0.9 for both architectures; however, the NU-Net-mod performed better on recall, as shown in
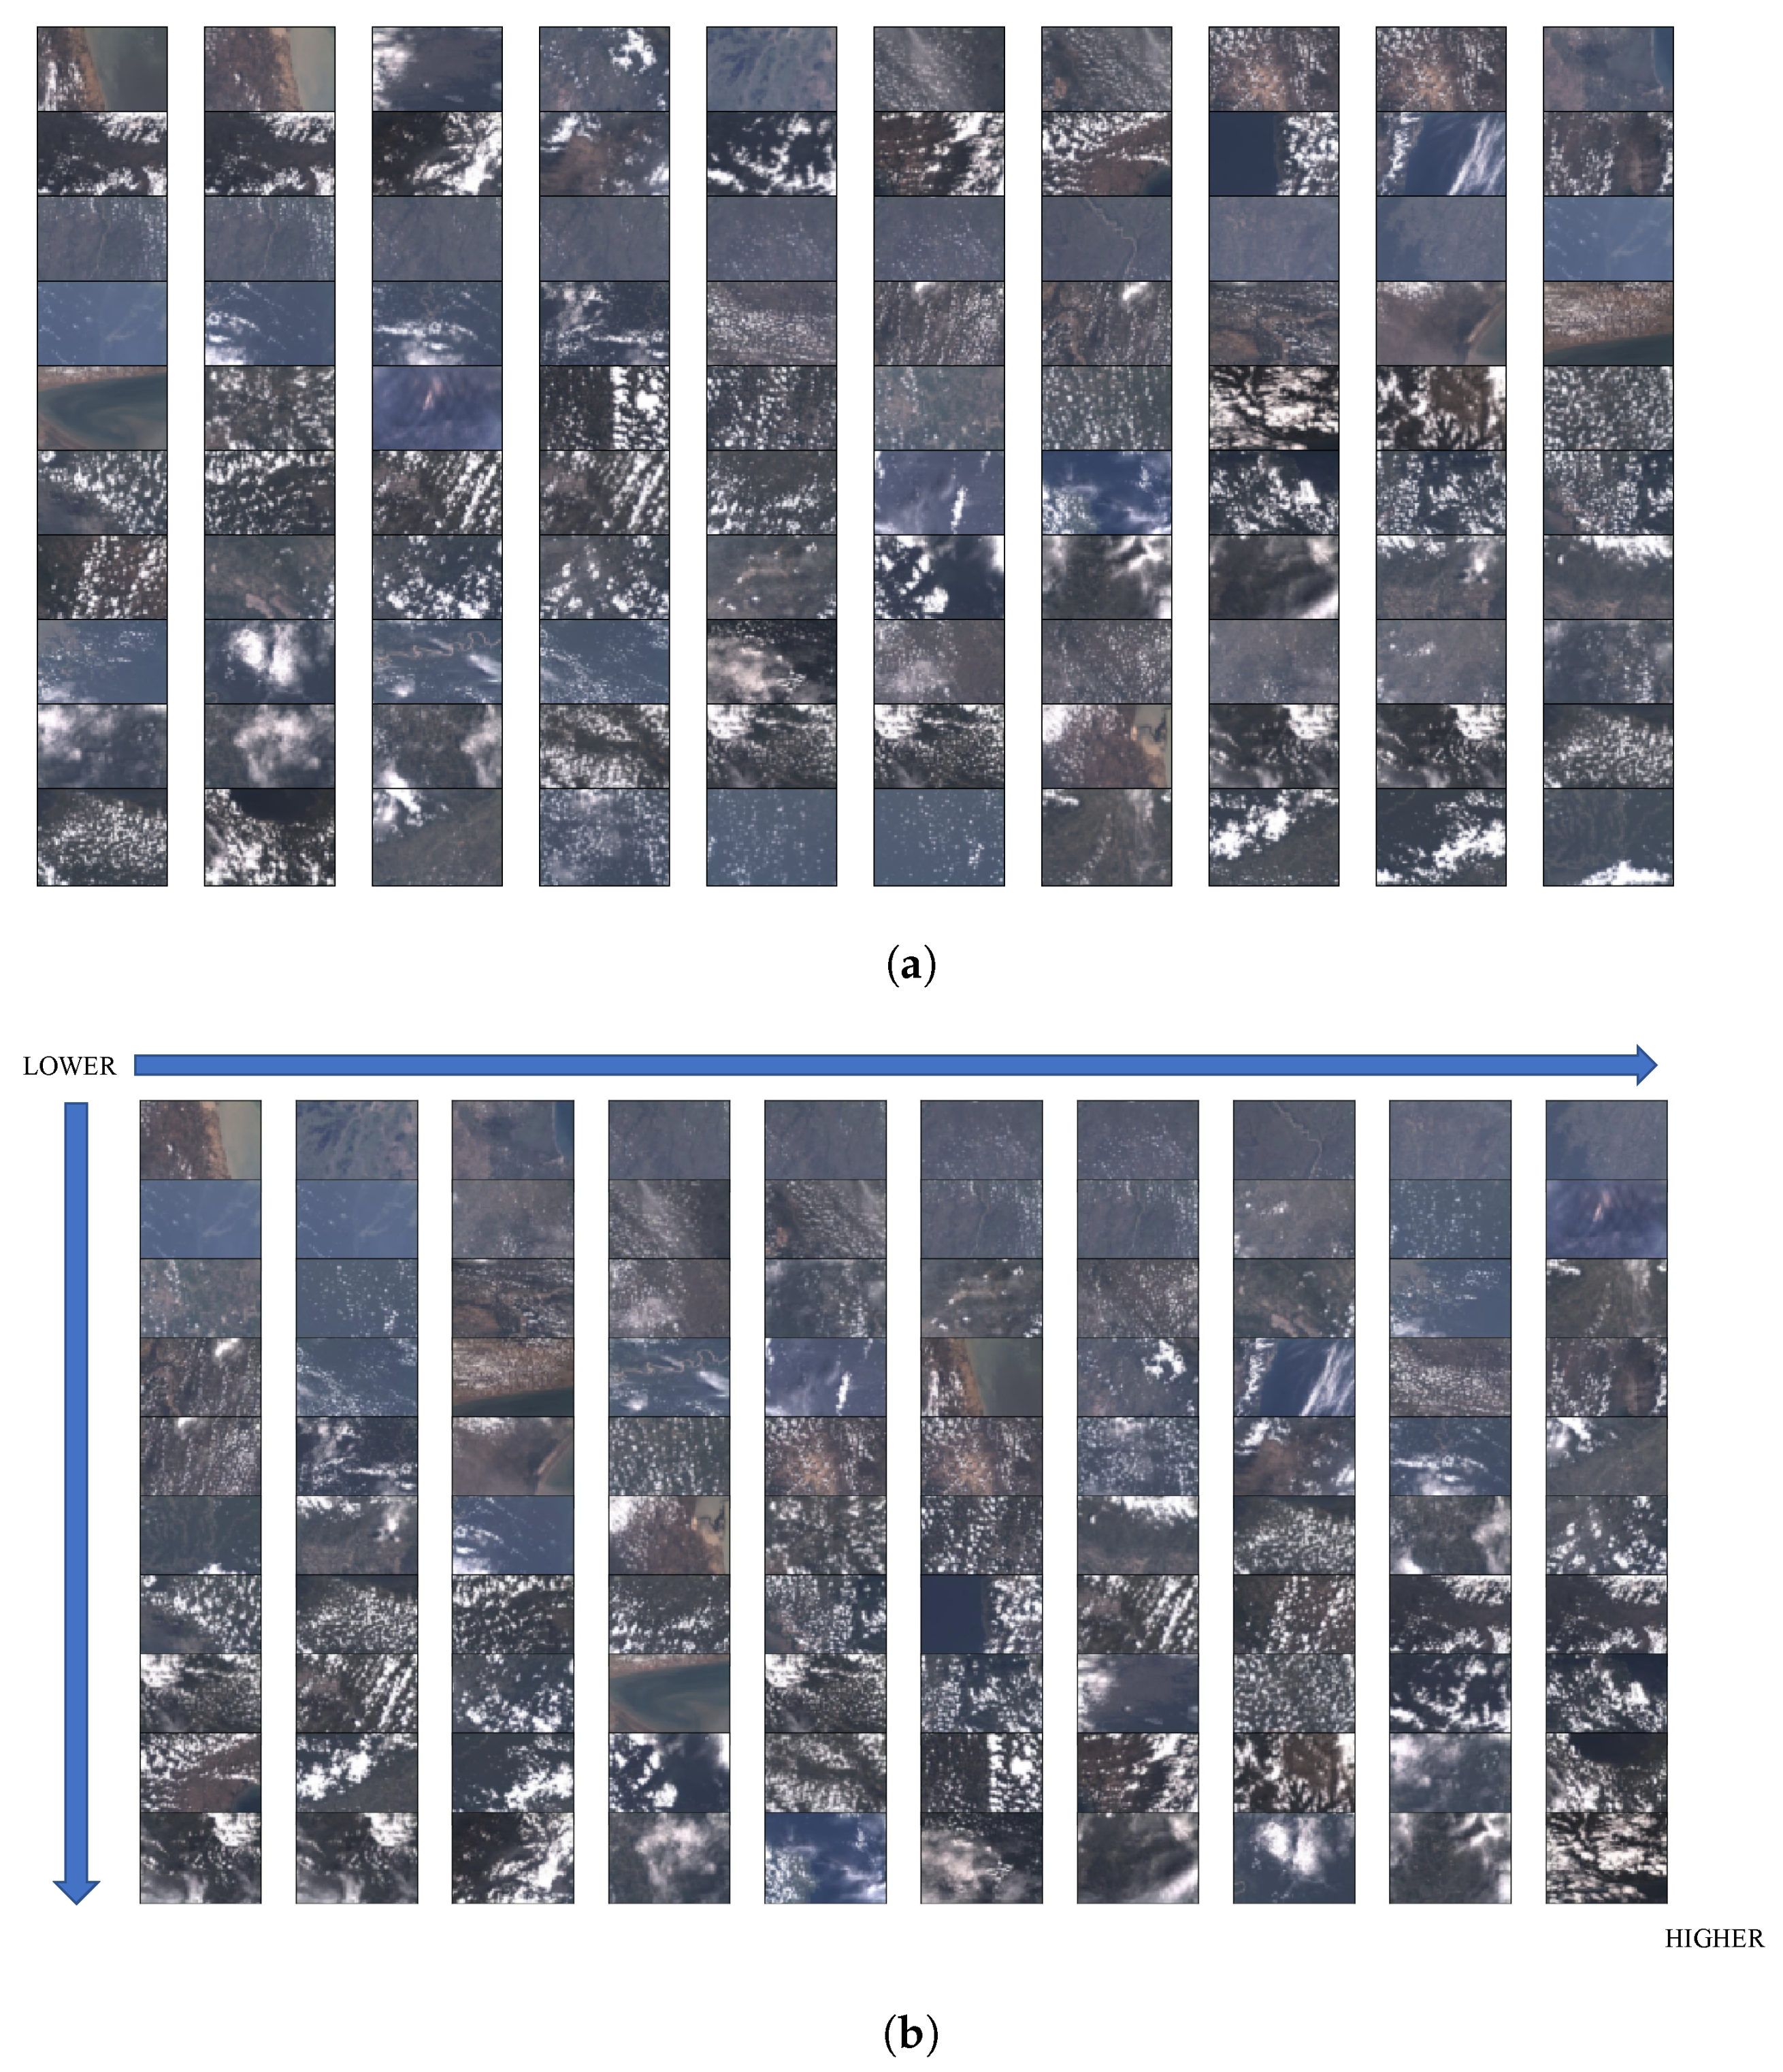
Table 4 in the Results section. A key result of NU-Net-mod is the ability to detect cloud coverage in unseen domain images. When NU-Net-mod is tested with images of a different sensor, the images of FACSAT-1 Cubesat, it can be seen that the cloud coverage was identified and the images in this dataset were ranked according to the cloud level (
Figure 6).
In addition, we demonstrate the good performance of NU-Net-mod on the unseen domain. Another key result of this work is the demonstration of its implementation in an embedded system using COTS components. This result encourages the implementation of CNN on-board small satellites such as Cubesat, nanosatellites, and picosatellites, where power constraints limit the use of AI-optimized processors. The results of
Section 3.3 demonstrated that the trained CNN could be implemented in embedded systems with little effect on performance. The prediction of the embedded system and the PC prediction are practically the same as shown in the comparison of
Figure 9.
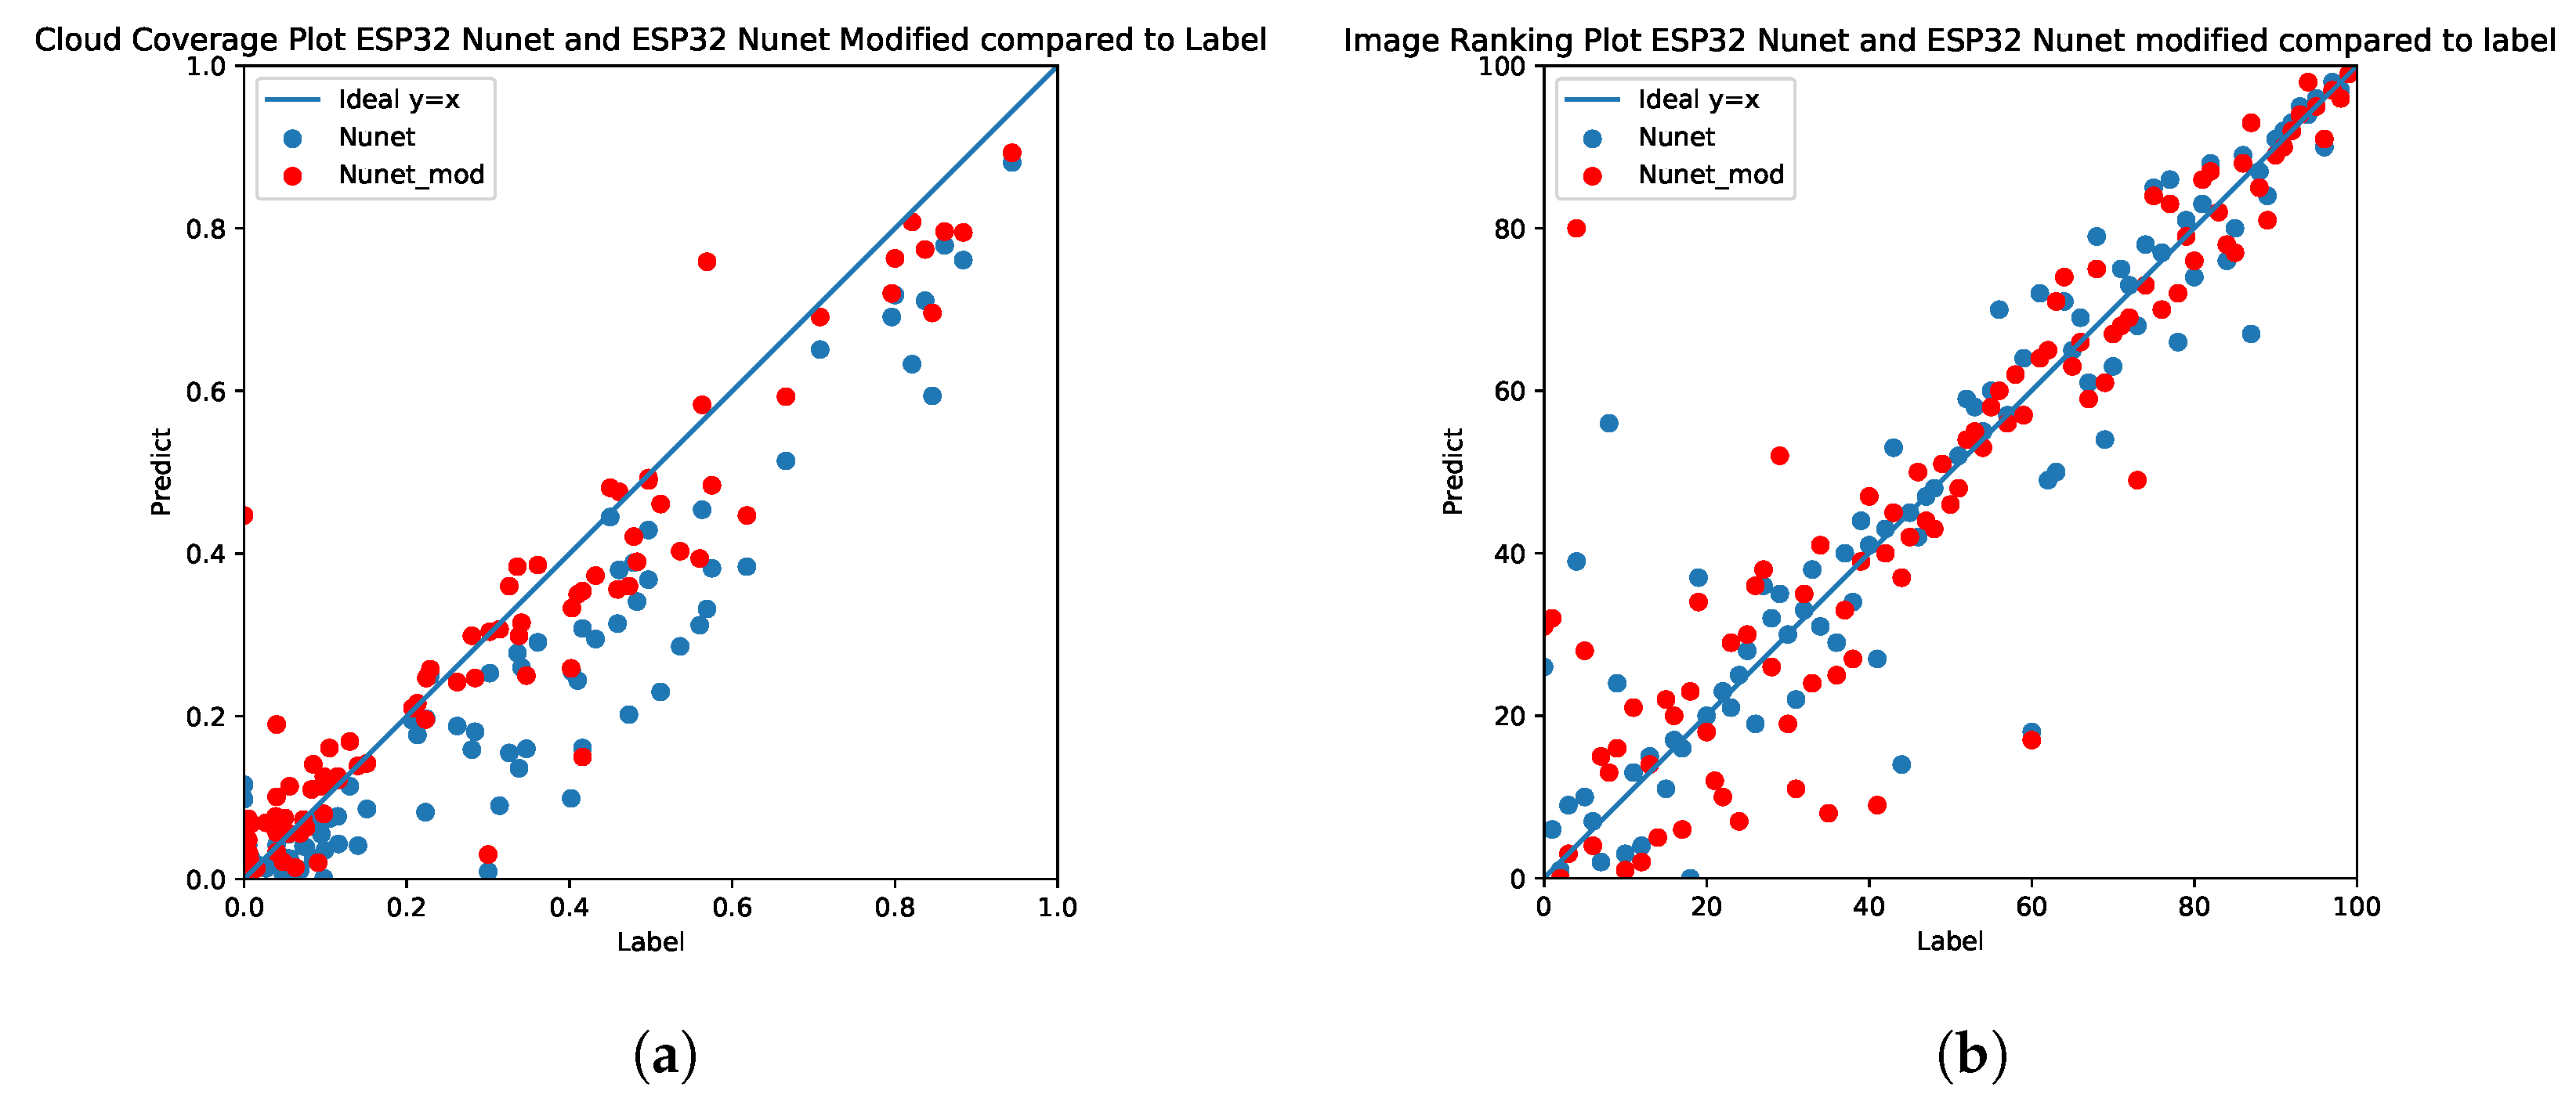
The NU-Net and NU-Net-mod had similar results for both datasets, and both architectures were implemented in the embedded system. However, NU-Net-mod was used for most tests and comparisons against PC results because NU-Net-mod showed slightly better results according to the metrics. However, comparing the prediction of NU-Net-mod with the expected case reveals some outliers (
Figure 3), which can cause errors during image prioritization.
The outliers identified and shown in
Figure 14 correspond to the five figures with the greatest error in calculating the cloud coverage. These images are part of the test dataset that comprises 100 images. The images are identified by the following identification numbers: #25, #76, #79, #83, #94.
The label and the cloud mask predicted by the NU-Net-mod on image #25 are shown in
Figure 15. According to the label cloudless image, the expected cloud coverage is 0.0; however, the calculated cloud coverage was 0.447 and it can be seen that a big area was wrongly classified as cloud. This image had been analyzed by Park [
24] and identified as a bright scene, which presented problems for several methods. It is important to highlight that this image is an outlier for NU-Net-mod but it was correctly evaluated for NU-Net. A similar case is noted with the image #79, whose expected cloud coverage is 0.569 and the calculated value is 0.759. For image #79, the label and the predicted cloud mask are shown in
Figure 16. To improve the performance on bright scenes such as clouds above snow/ice surfaces, thermal bands and geographical or seasonal information must be considered [
24].
The images #76, #83 and #94 are shown with the corresponding labels and predicted cloud mask in
Figure 17,
Figure 18 and
Figure 19, whose expected cloud coverages are 0.416, 0.618 and 0.300, respectively, and the predicted values are 0.15, 0.447 and 0.03. In these images, the cirrus clouds are wrongly classified. For example, the prediction in image #83 is better than the label. This is caused by the inconsistency in the dataset where some cirrus clouds are marked as cloud whereas they do not appear in other images, as explained previously by Park [
24]. If cirrus detection is critical for the application, the proposed approach can be extended by including additional bands at the cost of increasing the computational burden.
5. Conclusions
We proposed an autonomous system to quantify the cloud coverage in RGB images that is based on Machine Learning and is implemented on a COTS microcontroller, which is suitable to be used on board small satellites, CubeSats, and pico/nano/microsatellites. This system receives the image through a serial interface and returns the cloud coverage index after the evaluation. Because of this interface, the system can be connected directly to the imager or to the on-board computer to be used for image prioritization by selecting the images with the lowest cloud coverage to be downloaded.
The proposed system uses a Convolutional Neural Network (CNN) based on the architecture NU-Net, which has been optimized to run on a microcontroller. In this work, the NU-Net architecture and a variant NU-Net-mod were trained using a dataset from Sentinel-2 and a quantized version of CNN was run on a general-purpose COTS microcontroller using TinyML. Both architectures have shown an accuracy greater than 0.9. NU-Net-mod showed slightly better results in recall and accuracy and was less affected by quantization. However, it presented greater errors when tested with bright scenes. NU-Net performed better for this kind of image.
The trained CNN was tested under an unseen domain using a dataset from a different imager. In addition to the Sentinel-2 images that were used for training and testing, a second dataset was also used for the evaluation of NU-Net and NU-Net-mod. The images downloaded from CubeSat were processed by the CNN, and the cloud coverage was quantified. The results demonstrated that the architecture can generalize to an unseen domain of images.
This research demonstrated that cloud coverage estimation can be achieved on a general-purpose microcontroller using an open-source framework without specific preprocessing of the images. Using a serial interface, the proposed systems can be integrated on a CubeSat to quantify the cloud coverage of the images. In this task, autonomous systems can help to save time during satellite operations because images are evaluated prior to download; this way, satellite operators can first request images with low cloud coverage.
