Article

Limb Sounders Tracking Tsunami-Induced Perturbations from the Stratosphere to the Ionosphere

Hubei Subsurface Multi-Scale Imaging Key Laboratory, School of Geophysics and Geomatics, China University of Geosciences, Wuhan 430074, China
*
Author to whom correspondence should be addressed.
Remote Sens. 2022, 14(21), 5543; https://doi.org/10.3390/rs14215543
Submission received: 7 October 2022 / Revised: 31 October 2022 / Accepted: 1 November 2022 / Published: 3 November 2022

Abstract

:
In this study, we employ three types of satellite data from two different limb sounders: the FORMOSAT-3/COSMIC (F3/C) radio occultation (RO) technique and the Sounding of the Atmosphere using Broadband Emission Radiometry (SABER) instrument to study the vertical coupling of the 16-09-2015 Chile tsunami-induced perturbations from the stratosphere to the ionosphere. All three types of datasets, including temperature profiles from 10 to 55 km and 16 to 107 km, and electron density profiles from 120 to 550 km, recognized perturbations of different scales at different heights after the Chile tsunami. The vertical scales identified by the wavelet analysis are from 1–2 km, 5–9 km, and 25–50 km in the stratosphere, mesosphere, and ionosphere, respectively. Meanwhile, as a comparison and validation of the reliability, we also revisited the 11-03-2011 Tohoku earthquake/tsunami-related perturbations from the stratosphere to the ionosphere using the same data. It is believed that the two tsunamis both disturbed the whole atmosphere space, and the scale of these signals gradually increases with the increase in altitude but decreases with time. In addition, the tsunami-related ionospheric gravity wavefronts are examined by the F3/C observations. Another interesting point is that the temperature perturbations recorded by the SABER from 70–100 km altitude are found to arrive earlier than the 2015 tsunami wavefront. The findings in this study suggest that the limb-sounding technique is a useful instrument for detecting the tsunami-coupling gravity wave and benefits the tsunami warning system.

1. Introduction

The sudden dislocation of the Earth’s surface caused by a large earthquake/tsunami is known to induce atmospheric acoustic gravity waves (AGWs), which could propagate upwards through the lower atmosphere into the ionosphere. The AGWs can significantly disturb the electron density through the coupling between the neutral particles, ions, and electrons in the ionosphere, which is often called seismo-traveling ionospheric disturbances (STIDs) [1,2,3]. The development of observations has greatly promoted the study of the lithosphere–atmosphere–ionosphere coupling. A large number of studies have been carried out on the STIDs after larger earthquakes/tsunamis, mainly focusing on ionospheric total electron content (TEC) perturbation by ground-based Global Navigation Satellite Systems (GNSS) observations [4,5,6,7,8], the thermospheric gravity wave patterns in 630 nm and 557.7 nm nightglow from highly sensitive wide-angle camera systems [9,10], and geomagnetic changes recorded by magnetometers [11,12], as well as the in situ sounding of atmospheric density variations by the low Earth orbit (LEO) satellites [13,14,15]. In general, the STIDs can propagate in different forms in the atmosphere and ionosphere [16], including: (1) acoustic gravity waves generated by earthquake rupture, (2) infrasound waves coupled by seismic Rayleigh waves with the atmosphere, (3) internal gravity waves induced by tsunami waves, and (4) acoustic resonance between the solid Earth and the lower atmosphere, which is explained by the normal mode theory [17].
The tsunami-related perturbations of the atmosphere and ionosphere usually persist along with the propagation of the tsunami. For instance, after the 2011 Mw9.0 Tohoku earthquake/tsunami, in addition to the various observations of STIDs in the near field, a series of large-scale and mesoscale gravity waves were observed in the atmosphere and ionosphere as the tsunami spread in the Pacific Ocean [6,7,18,19,20,21,22,23,24]. The waves were recorded over Hawaii (~6000 km from the tsunami epicenter) [9] and even over Argentina (~17,000 km from the epicenter) [10], which indicates that they could eventually spread throughout the Pacific Ocean and beyond. Similarly, observation of tsunami-generated gravity waves was also reported over Hawaii (~10,000 km from the epicenter) caused by the 16-09-2015 Chile–Illapel earthquake [25]. Moreover, the long-lasting tsunami impacts the ionosphere continuously, not only by affecting the nighttime ionospheric electrodynamics to produce the midlatitude nighttime ionospheric irregularities [26] but also by the coupling between reflected tsunami gravity waves and the Perkins instability in the interhemispheric process to generate the conjugate medium-scale traveling ionospheric disturbances (MSTIDs) in the southern hemisphere [27].
Limb-sounding methods provide scientists with the unique opportunity to capture the vertical structure of tsunami-induced AGWs. The GNSS radio occultation (RO) technique is one of the most used limb sounders. Employing the FORMOSAT−3/COSMIC (F3/C) RO sounding, Coïsson et al. [28] reported a 50 km vertical structure identified by a TEC profile after the 2011 Tohoku tsunami. Liu et al. [29] examined the vertical F3/C electron density profiles and observed the fluctuations induced by the 2011 Tohoku tsunami waves and their post-waves with prominent short-wavelength of fewer than 16 km. Yan et al. [30] provided observational evidence for the stable existence of the 2011 Tohoku earthquake/tsunami-excited vertical perturbations both in the stratosphere and ionosphere. Another limb sounder, the Sounding of the Atmosphere using Broadband Emission Radiometry (SABER) instrument, is also useful to track the gravity wave effects from the stratosphere to the mesosphere, generated by topography [31], convection, and tsunami [32]. Yang et al. [32] reported the significant nightglow emission rate perturbations observed by SABER in the mesosphere associated with the 2011 Tohoku tsunami waves.
However, the detectability in the whole atmosphere during the propagation of tsunamis still lacks sufficient understanding. Most of the observations have focused on the thermosphere/ionospheric response, with very few observations in the lower atmosphere and mesosphere. Therefore, the knowledge to recognize the vertical coupling of tsunami waves is still elusive. On the other hand, scientists believe that tsunami wave detection in the atmosphere and ionosphere is beneficial to the tsunami warning system [33], especially due to the fact that some studies have found that there are signals in the atmosphere or ionosphere that predate the arrival of tsunami waves [9]. Whereas, the ”early” perturbations before the ocean waves still need to be verified, since the available coupled tsunami–atmosphere gravity wave models could not reproduce these “early” signals [34,35,36].
In this study, we use satellite data from two different limb sounders: the F3/C RO technique and the SABER instrument, which are complementary with respect to the height intervals, in order to study the vertical coupling of the 16-09-2015 Chile tsunami-induced perturbations from the stratosphere to the ionosphere. Meanwhile, as a comparison and validation of the reliability, we also revisited the 11-03-2011 Tohoku earthquake/tsunami-related perturbations from the stratosphere to the ionosphere using the same data.

2. Data and Methodology

2.1. F3/C LEO-Based GNSS Data

RO is a well-evaluated technique for the earthquake-induced ionospheric disturbances study [8,28,29,30]. An occultation event occurs when an LEO satellite receives a GNSS radio signal after passing through the Earth’s atmosphere below the altitude of the LEO satellite. When the GNSS signal passes through the atmosphere and ionosphere and reaches the LEO satellite at the other end, it will be delayed and bent due to the propagation medium and its gradient. Using this additional delay and bending information, the refractive index of the atmosphere can be retrieved, and the corresponding atmospheric physical parameters including density, temperature, and water vapor, as well as the ionospheric electron density, can be further retrieved under certain approximate conditions [37].
The F3/C is a six microsatellite RO mission. These satellites were successfully launched into circular orbits with an inclination of 72° at 512 km altitude on 15 April 2006. Gradually, the orbits were deployed to the final 800 km [38]. The F3/C data sets used in this study are the altitudinal profiles of temperature and electron density, which are provided at 1 s sampling as level 2 atmPrf and ionPrf files in the COSMIC Data Analysis Archive Center (CDAAC) database (http://cdaac-www.cosmic.ucar.edu/cdaac (accessed on 1 July 2022)).
The atmPrf product gives temperature from the surface to 0.2 hPa (~60 km), by neglecting the water vapor information, so it is suited to study the features of the stratosphere and lower mesosphere. In the middle atmosphere, the effective vertical resolution of the atmPrf product is ~1 km and the corresponding horizontal resolution is about 200–300 km [39]. Das and Pan [39] conclude that this dataset allows a better study of various phenomena in the 100 to 1 hPa (~16–50 km) region. Therefore, the profiles with altitudes from 10 to 55 km are selected, and then the piecewise cubic Hermite interpolating polynomial is used to obtain a uniform height interval of 0.3 km to avoid possible artificial perturbation effects caused by the data gap in the measurement.
The F3/C ionPrf electron density profiles are retrieved with height resolutions of 1–2.5 km for the tangent height at ~90−800 km altitude. Similarly, the profiles with altitudes from 120 to 550 km are selected and interpolated to have a uniform height interval of 2 km.
Note that the uncertainty of the RO observation and geometry between GNSS and LEO satellites have an important impact on the extraction of gravity wave perturbations, which have been discussed in several studies [30,40,41]. First, the measuring error for the atmPrf dataset is relatively large in the lower troposphere (<5 km) and lower mesosphere (>50 km) [42,43]. Then, the capability of the RO technique to properly detect gravity waves depends principally on the relative orientation between the wavefronts and the LOS. Wave amplitudes can be better resolved when the fronts are nearly horizontal or when the angle between the LOS and the horizontal component of the wave vector approaches π/2. Importantly, because of the limb-sounding geometry, the temperature or the slant TEC of the ray path segment around the tangent point has the maximum weight [44]. Therefore, the RO has been suggested as a well-established technique for obtaining gravity wave information with adequate consideration of the uncertainties of the RO observations and observing geometry.

2.2. SABER Measurements

To complete the data gap from the upper stratosphere to the mesosphere, we also employ the temperature profiles from the SABER instrument on board the Thermosphere Ionosphere Mesosphere Energetics and Dynamics (TIMED) satellite [45]. The TIMED satellite was launched on 7 December 2001, into a circular orbit at 625 km with an inclination of 74.1°. The satellite makes about 15 orbits per day with a cycle of 1.6 h, and it takes 60 days to complete a full 24 h cycle in local time. SABER uses a 10-channel broadband limb-scanning infrared radiometer covering the spectral range from 1.27 µm to 17 µm to measure the upper troposphere, stratosphere, mesosphere, and lower thermosphere. In this study, we use kinetic temperature profiles retrieved in version 2.0, which have a vertical resolution of about 2 km and a horizontal resolution of about 400 km. Taking into account the amounts and altitude coverage of profiles, the data from 16–107 km in altitude was intercepted and then interpolated to obtain a uniform height resolution of 0.3 km.

2.3. Method

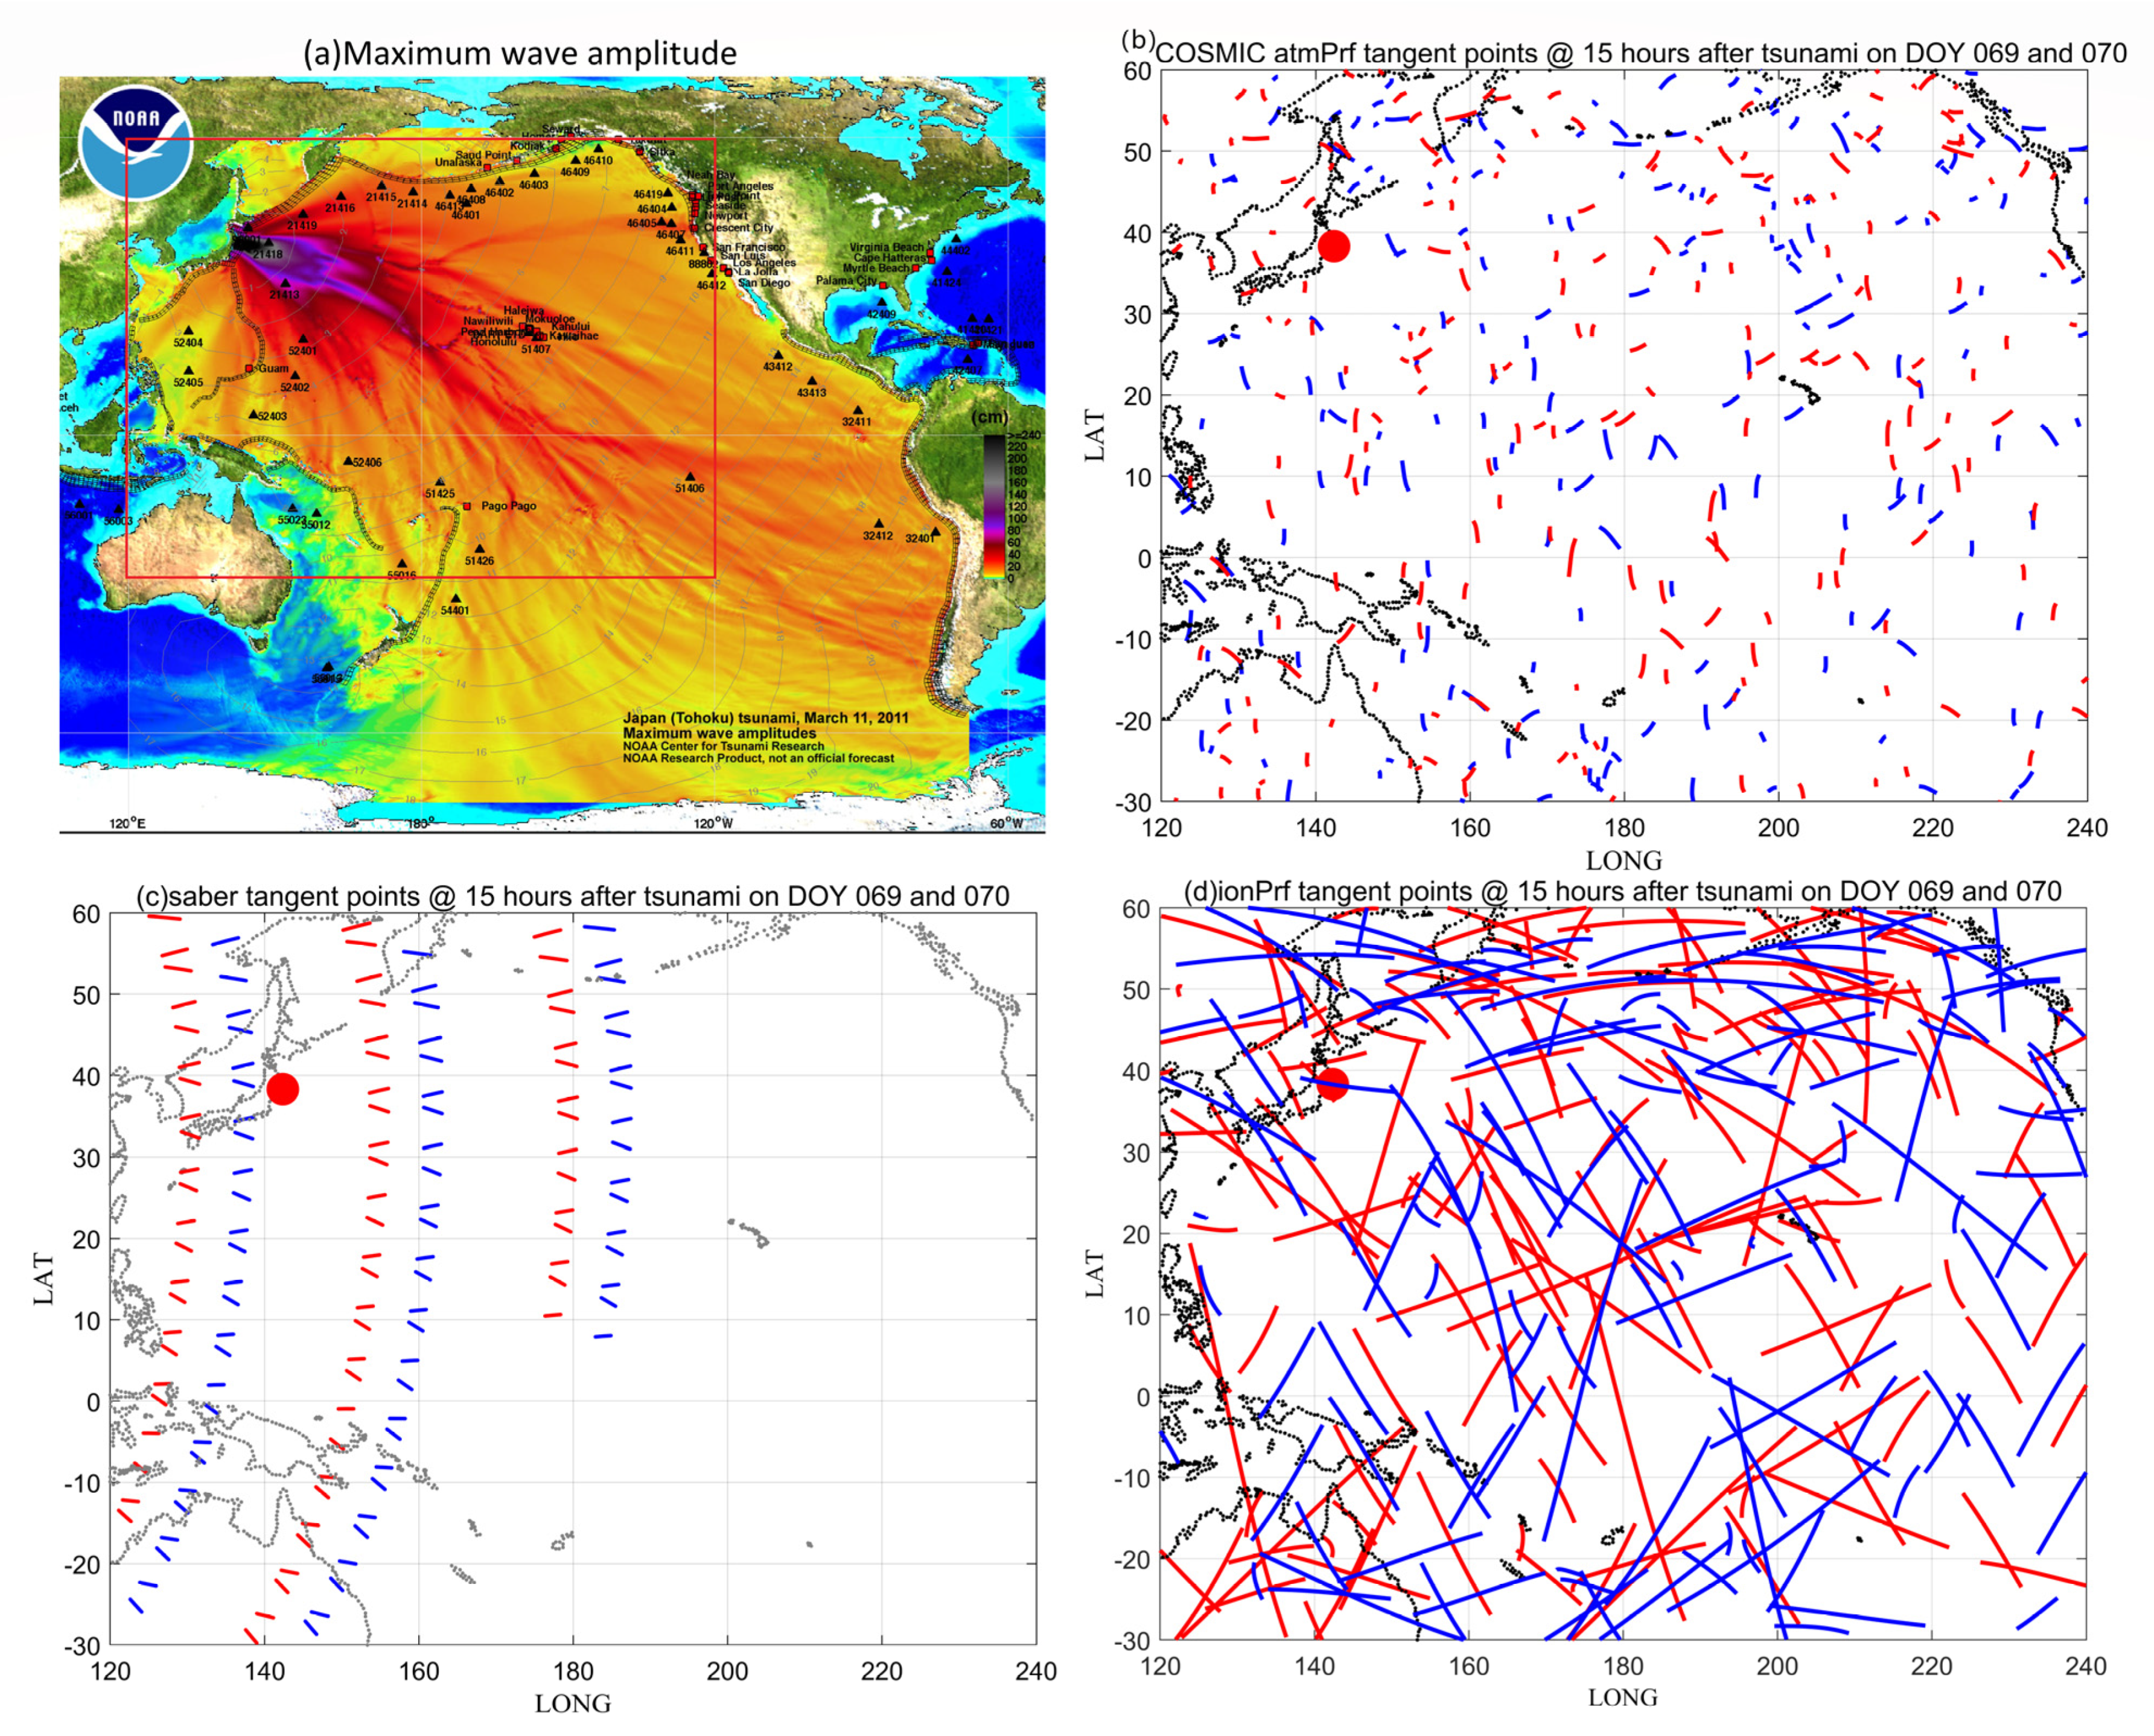
The maximum wave amplitude with travel-time contours of 22:54 UT, 16-09-2015, day of the year (DOY 259) Chile tsunami is shown in Figure 1a, considering the main scope (red rectangular box in Figure 1a) and propagation time of the tsunami, we chose all the F3/C and SABER profiles within the zone limited by latitudes 60°S–30°N and longitudes 180°–310° for 15 h after the tsunami. The data of the same region and time span corresponding to the previous day are considered as background. Figure 1b–d show the projections of the tangent points 15 h after the tsunami for the F3/C atmPrf, SABER, and F3/C ionPrf datasets, respectively. Blue and red curves mark the ground track of the tangent point location on DOY 259 and 260 of 2015, respectively. The data sources regarding the 2011 Tohoku tsunami are shown in Figure 2 similarly. The cover height and the number of profiles for the three datasets in this study are shown in Table 1. The large amount and uniform spatial distribution of data are beneficial for this study. Furthermore, the data cover the stratosphere, mesosphere, and ionosphere which is helpful to identify the vertical coupling of the atmospheric and ionospheric perturbations following this tsunami.
The ratio of perturbation and background temperatures T′/Tb detected by the F3/C and SABER was obtained as follows in each case. For GNSS RO observations, the T profiles were low-pass filtered by a Savitzky–Golay filter [46] with a cutoff wavelength of 12 km, producing a residual altitude series Tb. Since the GNSS RO vertical resolution is about 1 km, the filter was applied again to the difference T − Tb with a cutoff wavelength of 1 km. This process gives a T′ profile with isolated wavelengths between 1 and 12 km. It is known that vertical structures above 5 km are detectable by SABER [47], so we used the same filter to isolate wavelengths between 5 and 15 km in these profiles. The perturbation and background electron density detected by F3/C was similarly obtained with a cutoff scale between 20 and 100 km using the same filter.
In order to analyze the scale of tsunami-induced perturbations, wavelet analysis [48] is carried out in the height–frequency domain. The continuous wavelet transform of a discrete sequence xn is defined as the convolution of xn with a scaled and translated version of ψ 0 ( η ) , W n ( s ) = n N 1 x n ψ [ ( n n ) δ h s ] , where the (*) indicates the complex conjugate, δ h is altitude step, ψ 0 ( η ) = π 1 / 4 e i ω 0 η e η 2 / 2 is a Morlet wavelet function that depends on a nondimensional parameter η, ω0 is the nondimensional frequency. By varying the wavelet scale s and translating along the localized altitude index n, a picture can be constructed showing both the amplitude of any features versus the scale and how this amplitude changes over altitude. Finally, one can define the wavelet power spectrum (WPS) as | W n ( s ) | 2 . The effectiveness of the wavelet has been examined in previous studies [30,32].

3. Results

3.1. The Vertical Perturbations Detected from the Stratosphere to the Ionosphere

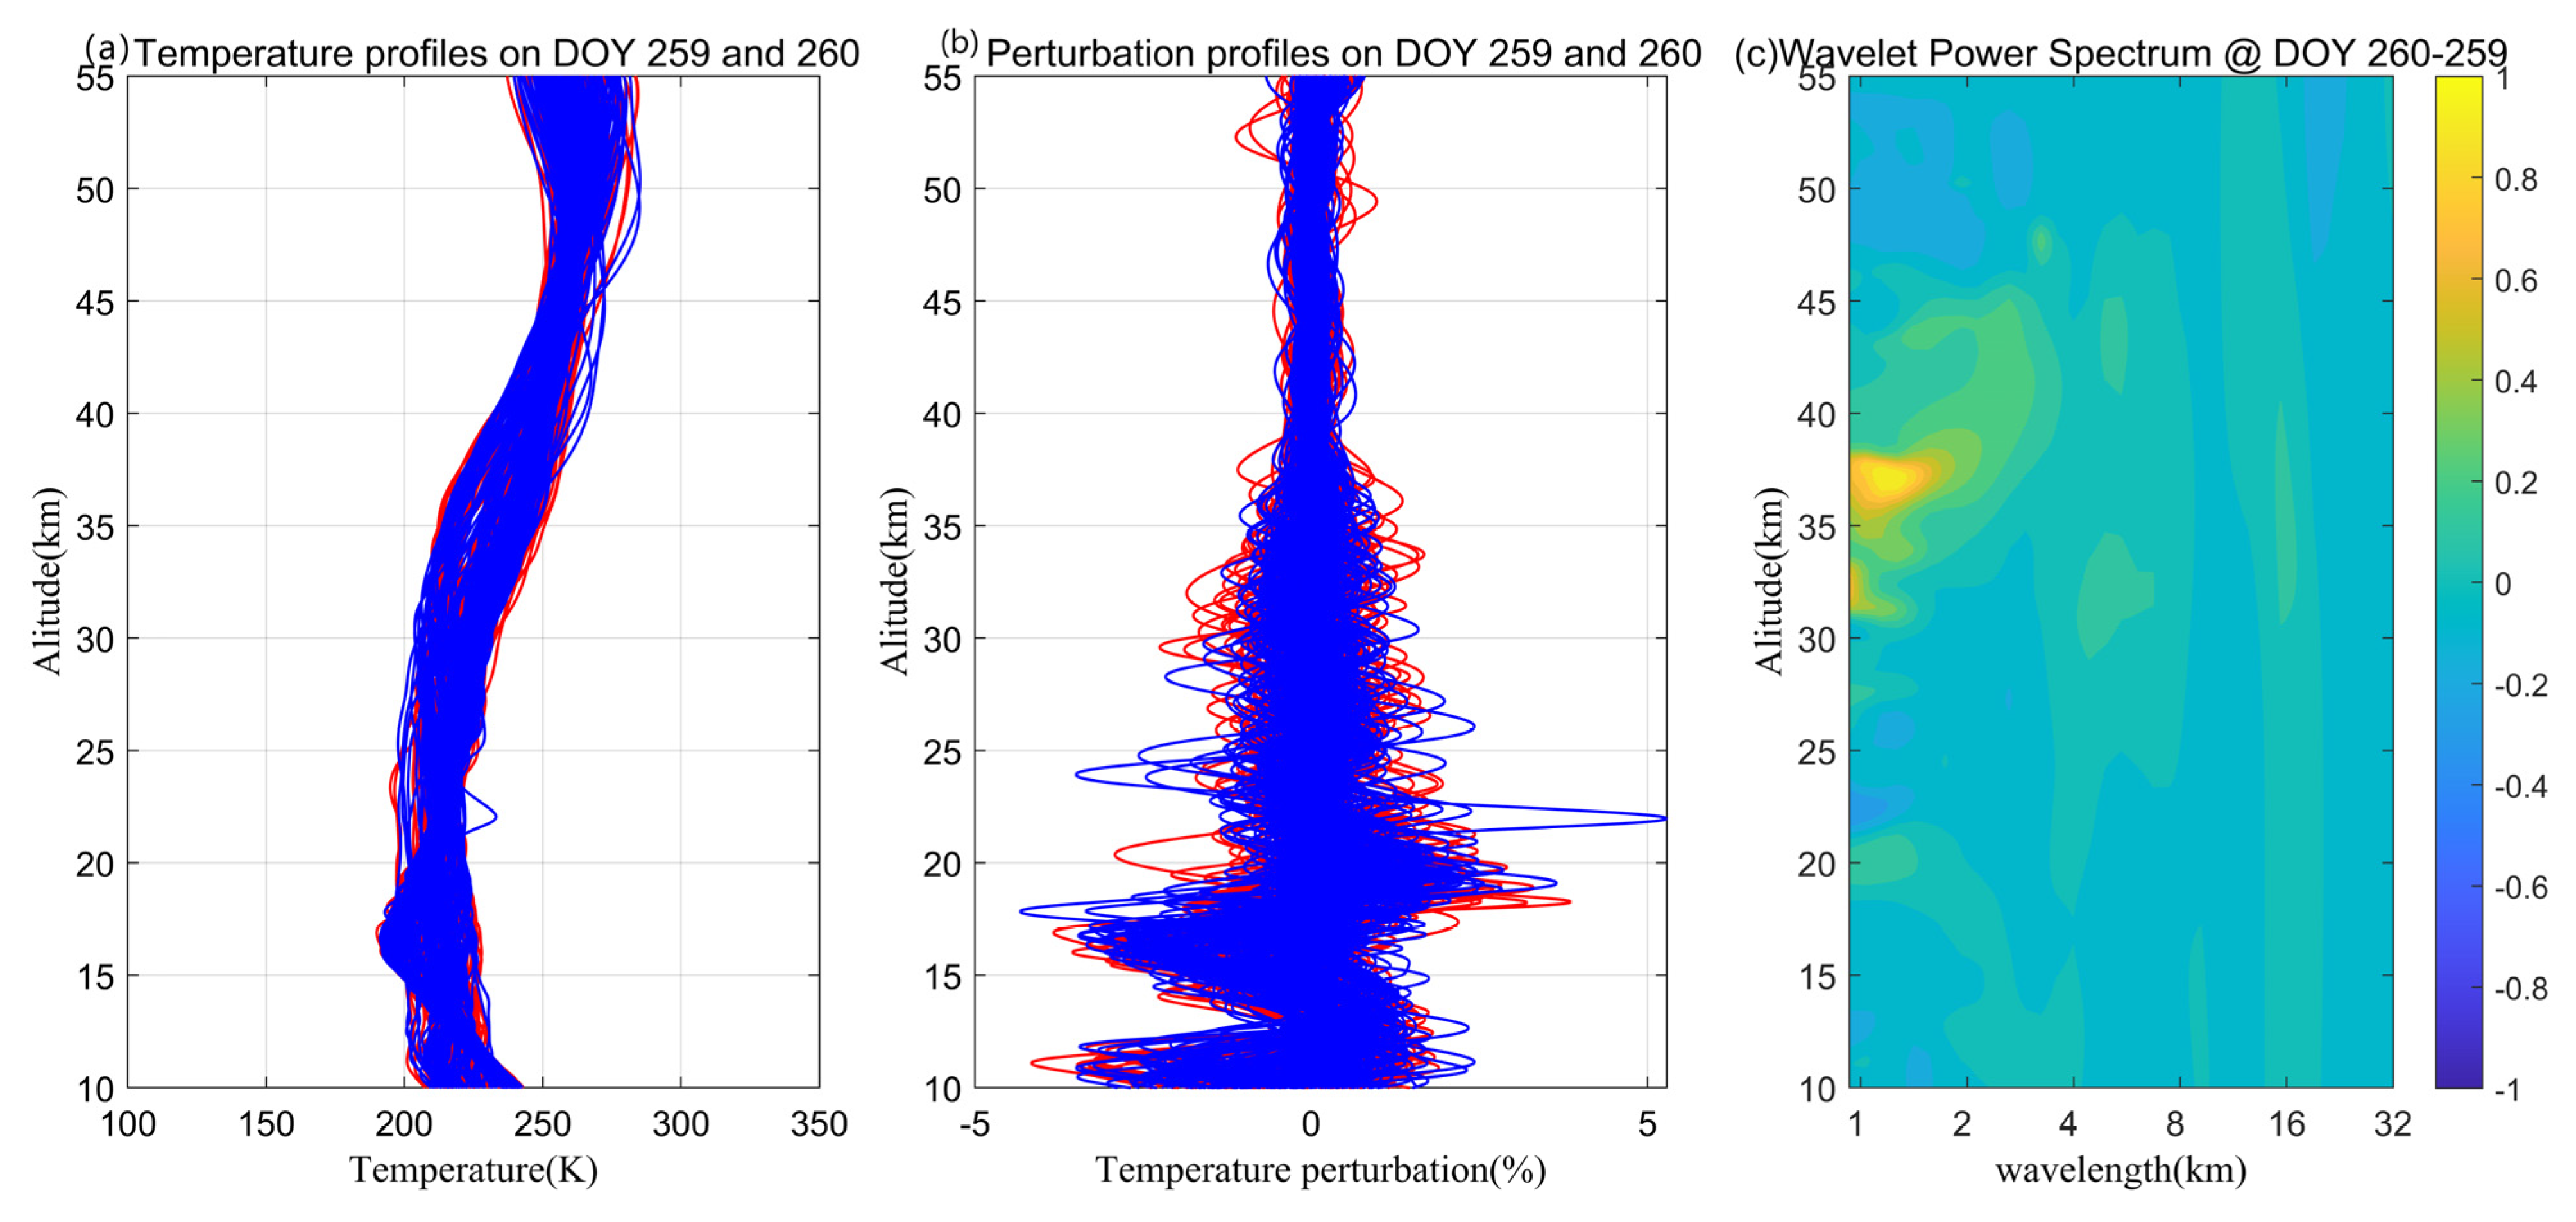
Figure 3 displays the observations of the F3/C RO atmPrf temperature profiles. In Figure 3a, the trends of the temperature profiles after the tsunami (red) and before the tsunami (blue) are basically the same. The filtered profiles (T’/Tb) in Figure 3b show some differences at different heights on these two days. T’/Tb from individual profiles before the tsunami exceeds the post-tsunami data at heights of 20–30 km, while the post-tsunami disturbances are more pronounced at around 30–40 km and 50 km heights. In order to more clearly compare the temperature changes before and after the tsunami, Figure 3c calculates the normalized power spectrum difference between the two days based on wavelet analysis. It can be seen that within the height range of 35–38 km, the perturbation effect after the tsunami is remarkable. The vertical scale of the perturbations is ~1–2 km. In addition, at the height of 38–45 km, there is also an amplitude enhancement with the normalized power spectrum of about 0.2–0.4, corresponding to a scale of ~2–4 km.
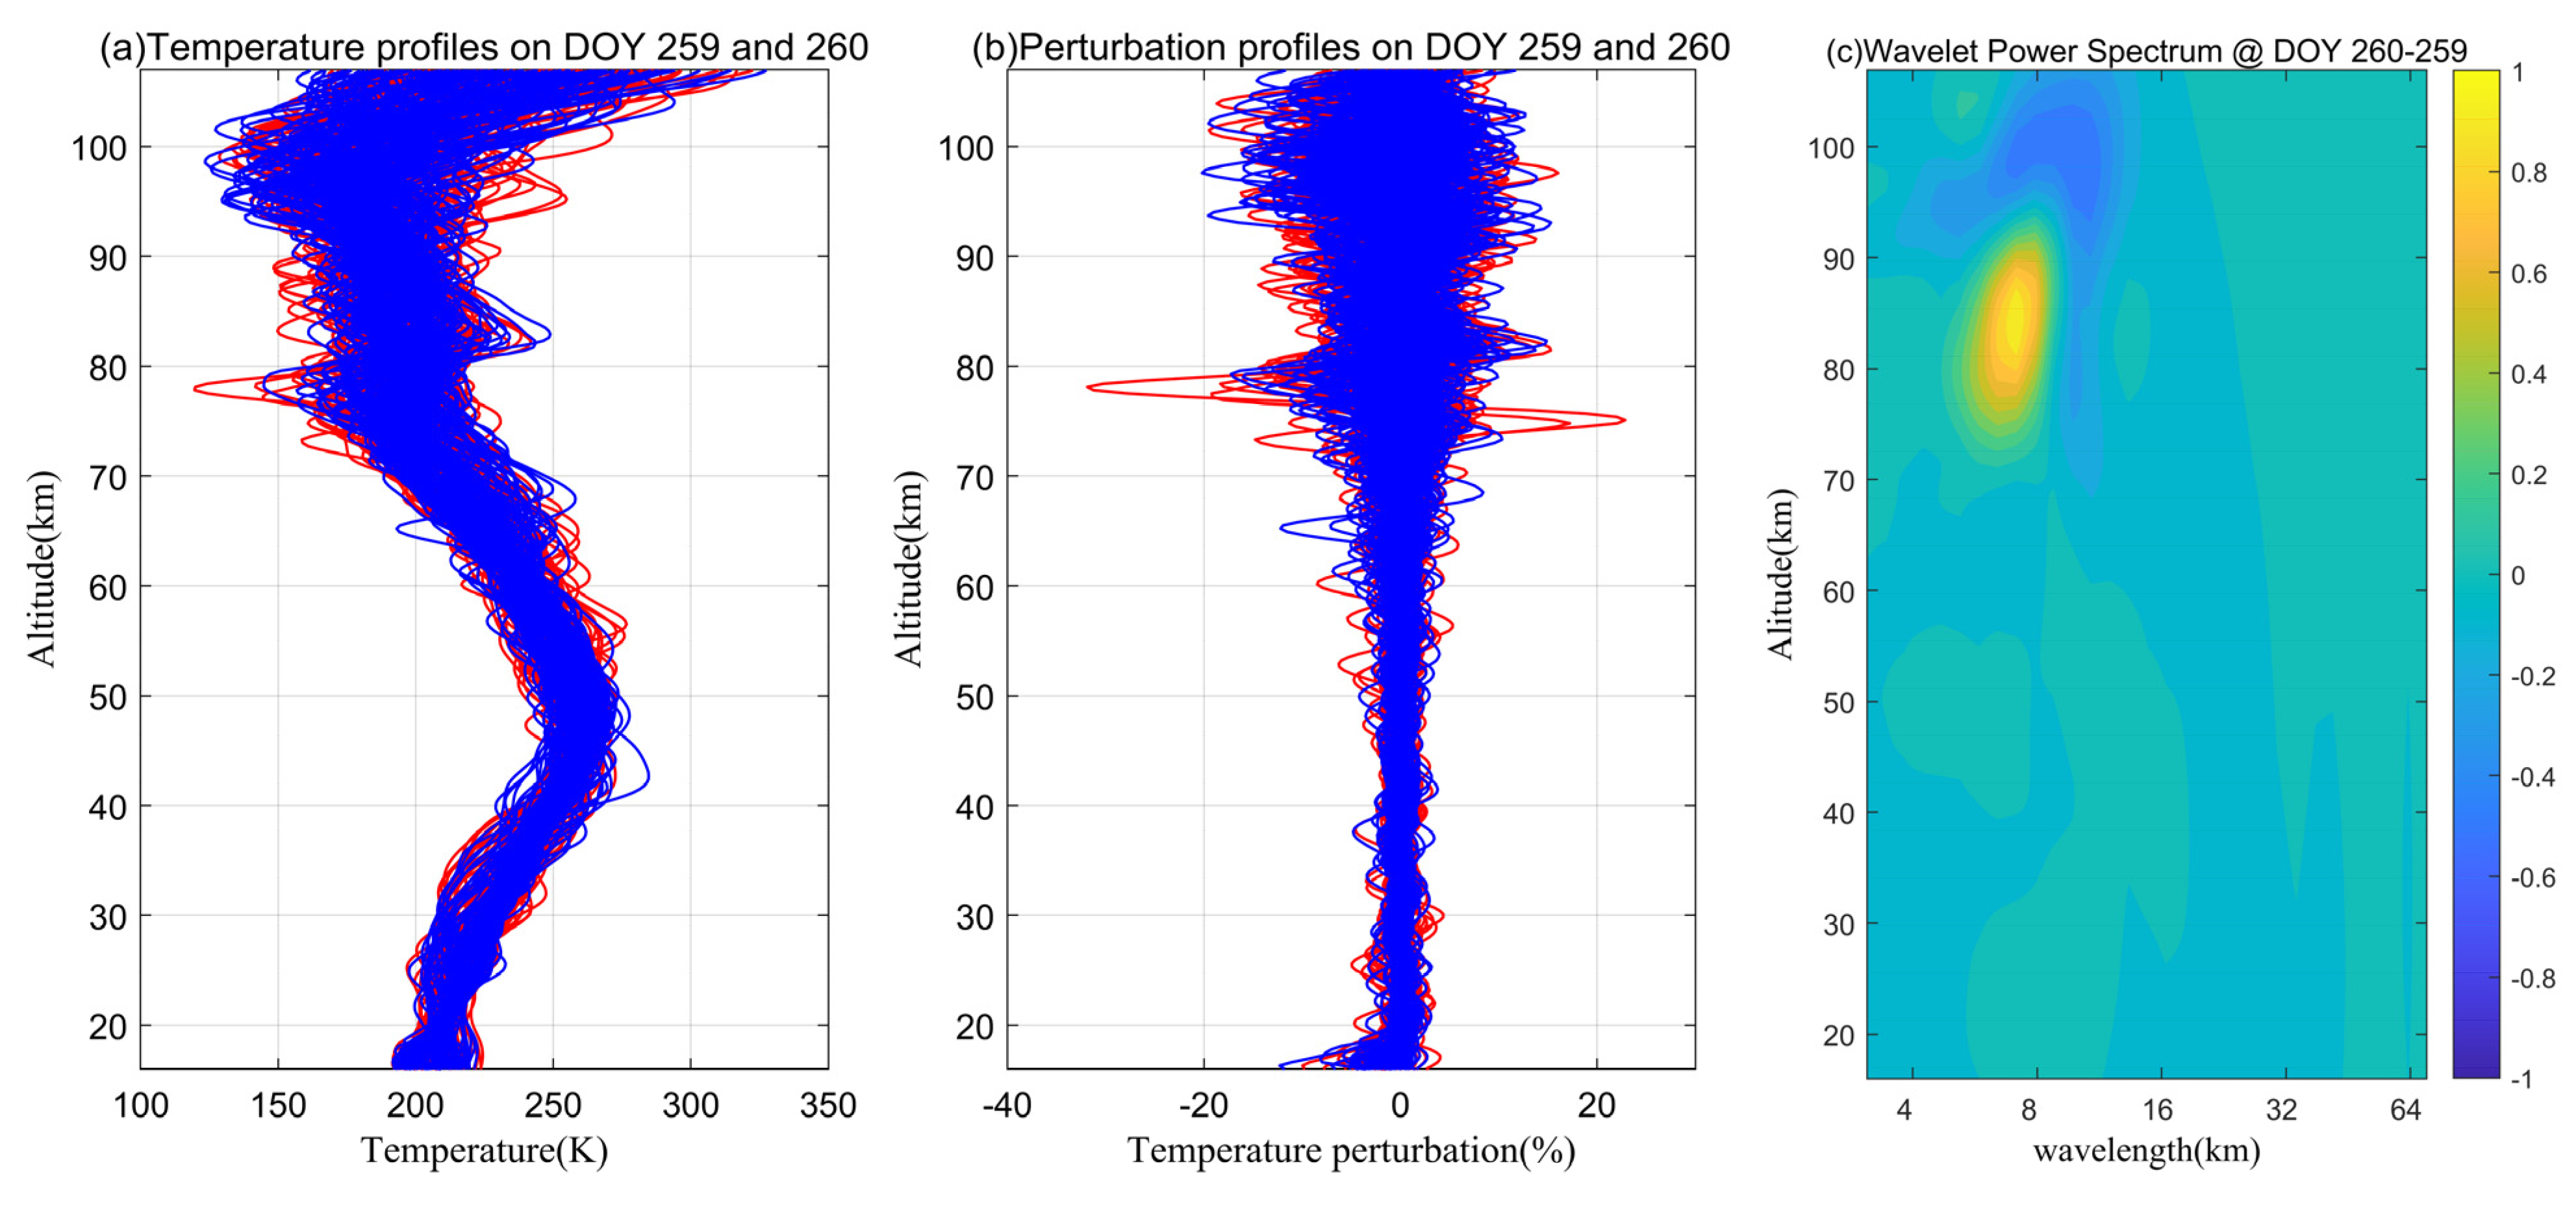
Figure 4 shows the observations of the SABER temperature profiles. In Figure 4a, comparing the temperature profiles after (red) and before the tsunami (blue), it can be seen that the temperature changes more dramatically after the tsunami at ~70–90 km height. Clearly, the perturbations were more pronounced in the filtered profiles (Figure 4b). Similarly, the results of the wavelet analysis are shown in Figure 4c, revealing that there is an obvious disturbance signal in the range of ~75–90 km after the tsunami. The scale is concentrated at ~5–9 km with a peak wavelength of about 7 km. The RO atmPrf and SABER data have the same overlap in altitude between 16 and 55 km, and the trend of the temperature they record is basically the same. However, it should be noted that the vertical resolutions of the two data are different, the former is about 1 km, while the latter is about 2 km. Therefore, the small-scale perturbations recorded by the RO atmPrf at an altitude of 35–38 km (Figure 3) cannot be resolved by SABER.
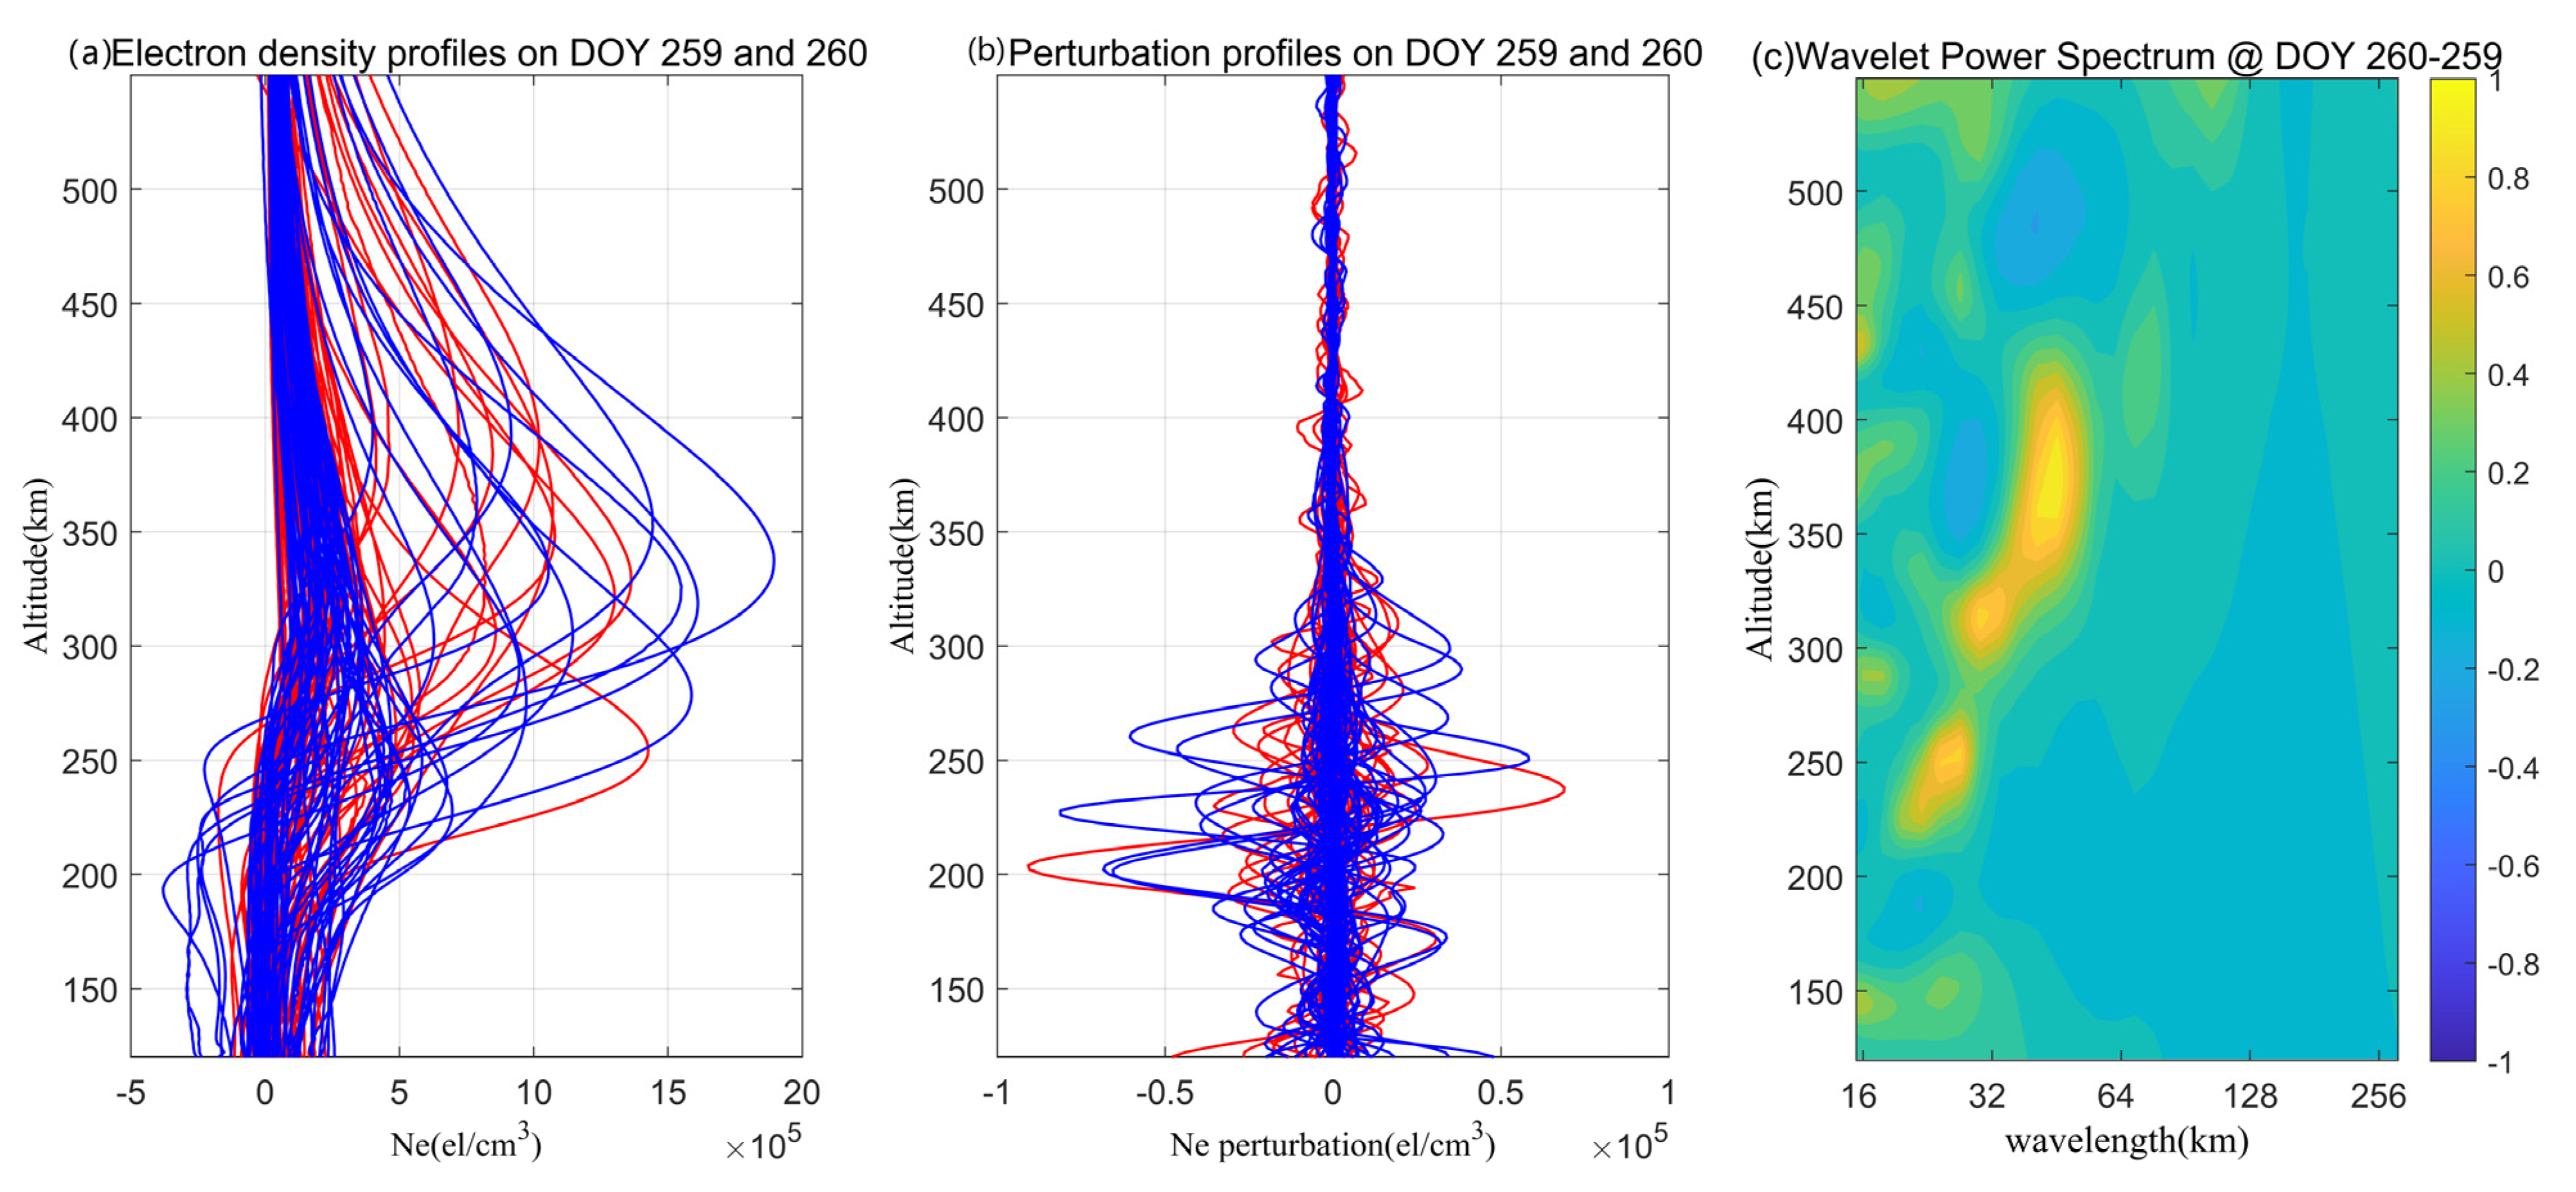
Perturbations in the ionosphere after tsunamis are widely reported and unsurprising. Given the fact that changes in the ionosphere itself are influenced both by solar and geomagnetic activities, as well as by activities in the lower atmosphere. At the same time, there are local time and latitude variations in the ionosphere within the spatiotemporal range covered by this study area. As a result, the effect of the tsunami on the ionosphere usually cannot be identified by directly checking individual electron density profiles (Figure 5a). Meanwhile, large-amplitude disturbances from the filtered profiles in the two days (before and after the tsunami) are ordinary below 300 km (Figure 5b). In Figure 5c, the wavelet analysis is applied to resolve the electron density perturbations in detail. Figure 5c clearly revealed that the perturbations after the tsunami extended from 250 km to 430 km in height, and the vertical wavelength became larger with the increase in altitude, ranging between 25 and 50 km.
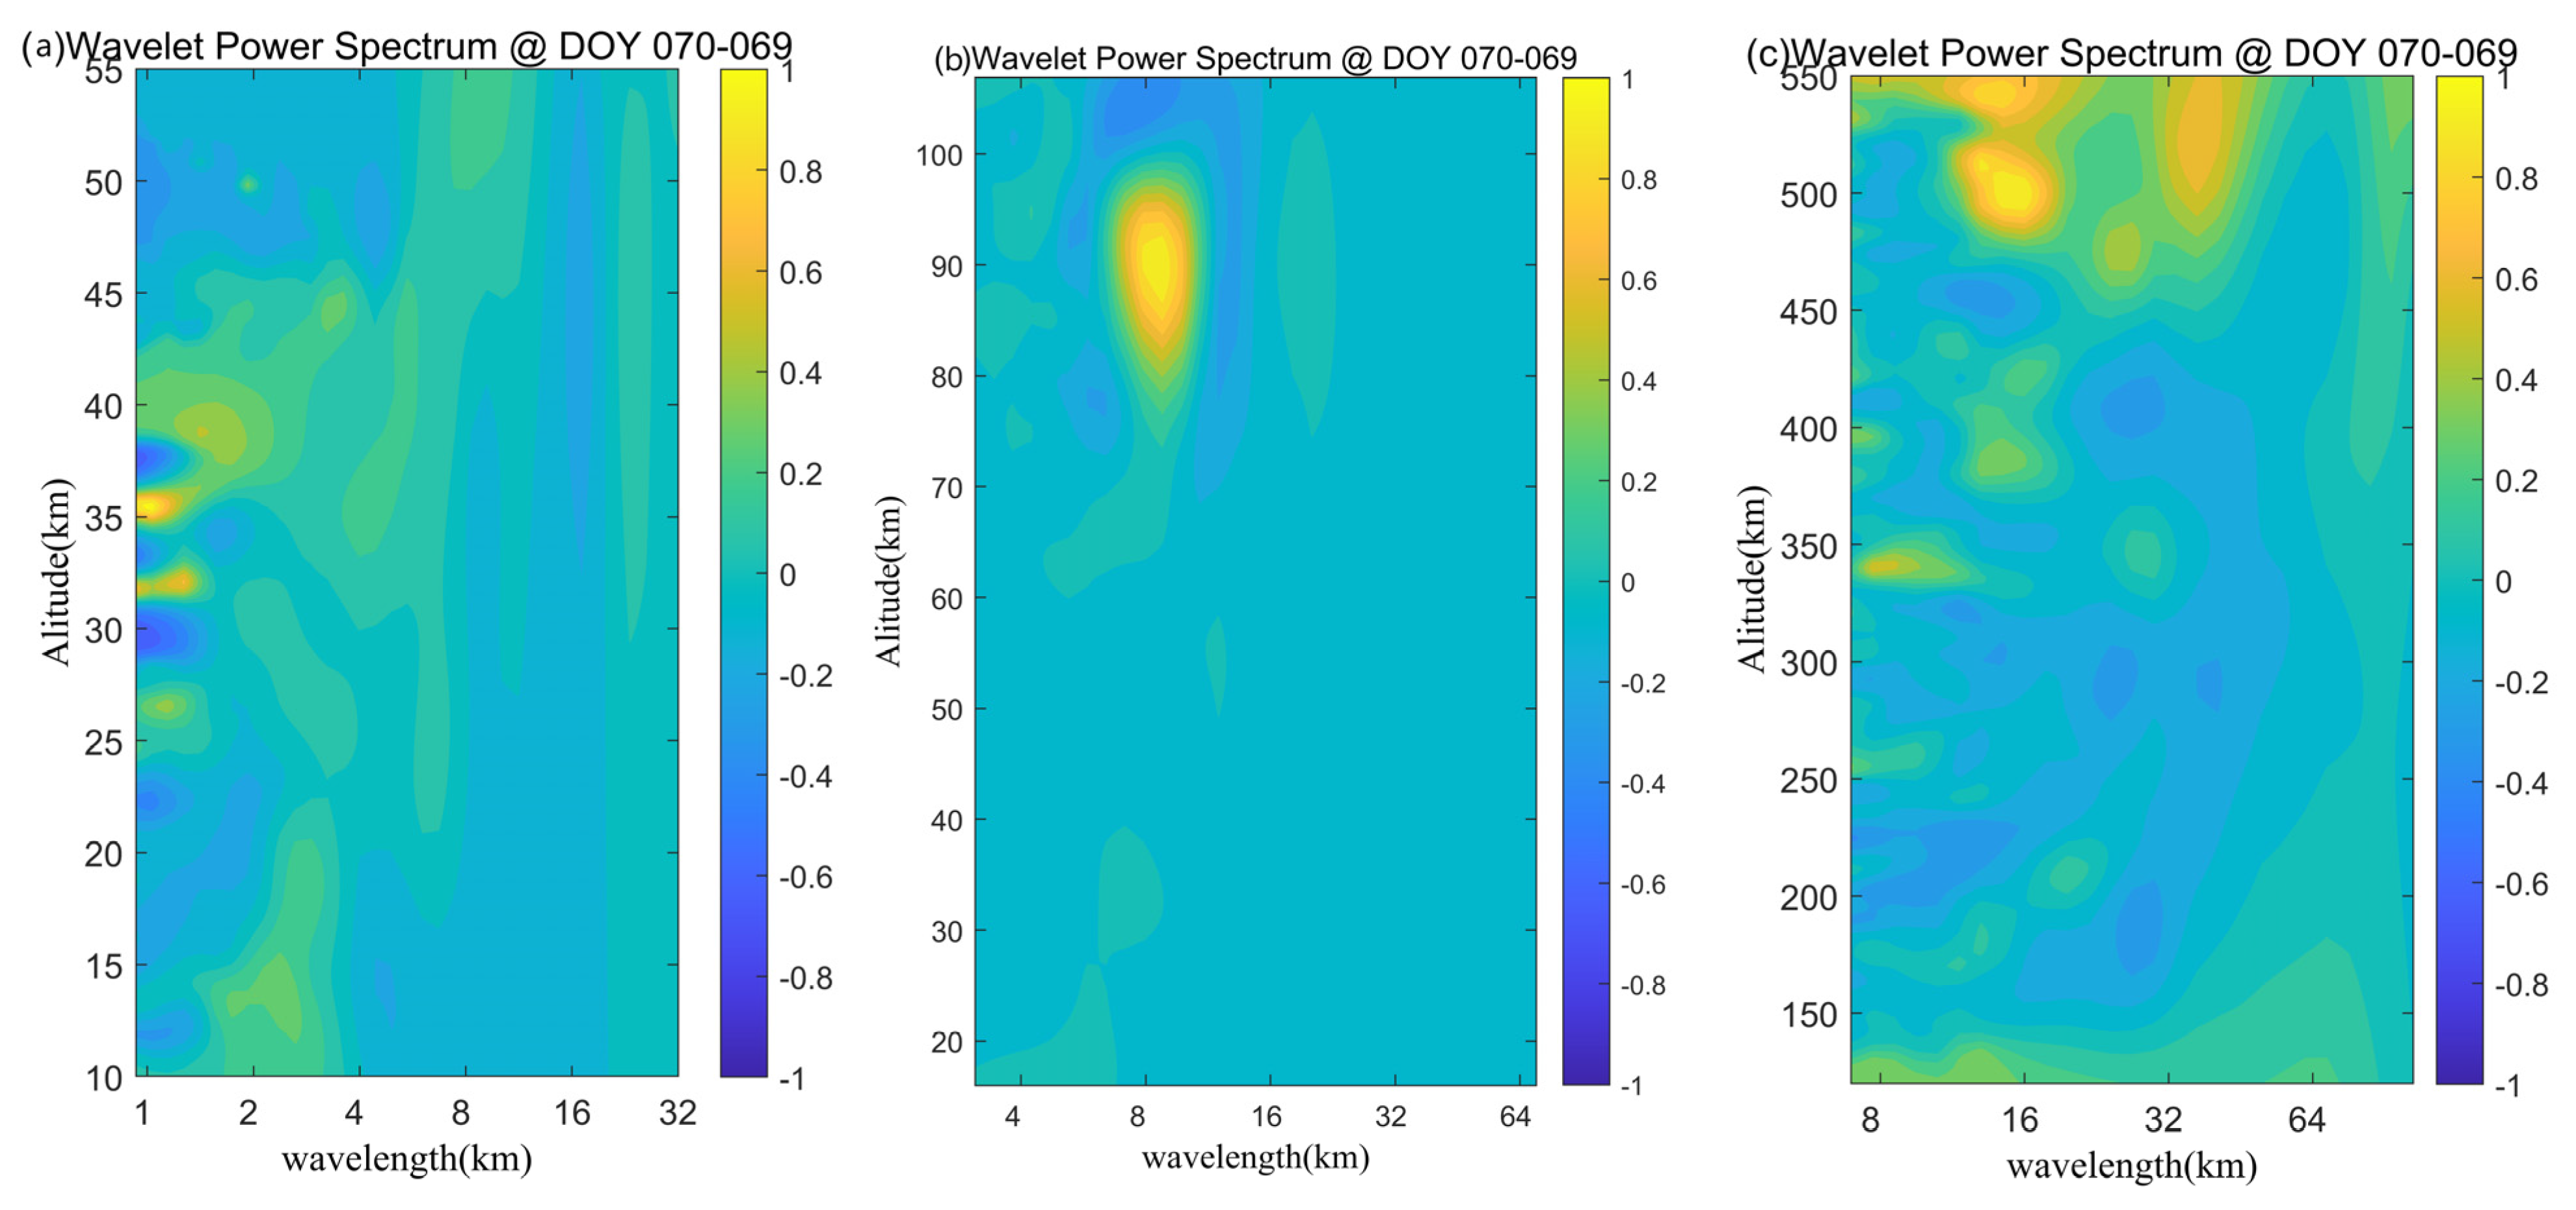
For comparison, we used the same data and methods to identify the perturbations at different heights after the 2011-03-11 Tohoku tsunami, and the results are shown in Figure 6. It can be seen that different scales of perturbation were also recognized from the stratosphere to the ionosphere after the tsunami. Specifically, in the stratosphere shown in Figure 6a, the RO temperature profiles show 1–2 km scales around the height of 35–40 km. In the mesosphere, Figure 6b shows that perturbations from SABER temperature profiles were detected in the altitude range of 80–100 km with vertical scales of ~6–11 km and the peak wavelength is about 10 km. It is worth noting that in Figure 6c, there is no obvious disturbance signal in the ionospheric height below 450 km, while the structure with a scale of more than ten kilometers appears at about 500 km height. Yan et al. [30] have provided observational evidence of the atmospheric oscillation in both the stratosphere and ionosphere within 6 h after this tsunami using RO refractive index and TEC profiles. The results in Figure 6a,c generally agree with the results of Yan et al. [30]. The difference is that the oscillations in the ionosphere after 15 h are significantly weaker than the 6 h reported by Yan et al. [30]. The possible reasons will be discussed in Section 4. In addition, Yang et al. [32] also extracted the perturbations with a dominant scale of about 1–5 km in the mesosphere after this tsunami using SABER data, which is smaller than our result in Figure 6b. However, it should be noted that the validity of SABER data for gravity wave vertical scale identification is considered to be above 5 km [31,47].

3.2. The Tsunami-Induced Gravity Wavefront in the Ionosphere Detected by the RO Sounder

It is not easy to sample the ionosphere in the small time (few minutes) and space window of individual profiles by the F3/C instruments. Coïsson et al. [28] reported a vertical structure of 50 km captured by an F3/C TEC profile after the 2011 Tohoku tsunami, which was considered to be a tsunami-induced gravity wavefront. This gave us the enlightenment to use RO data to track the wavefront after the 2015-09-16 tsunami, although note that the result reported by Coïsson et al. [28] did not exclude the possible impact of a data gap in the filtered measurement (TEC perturbation).
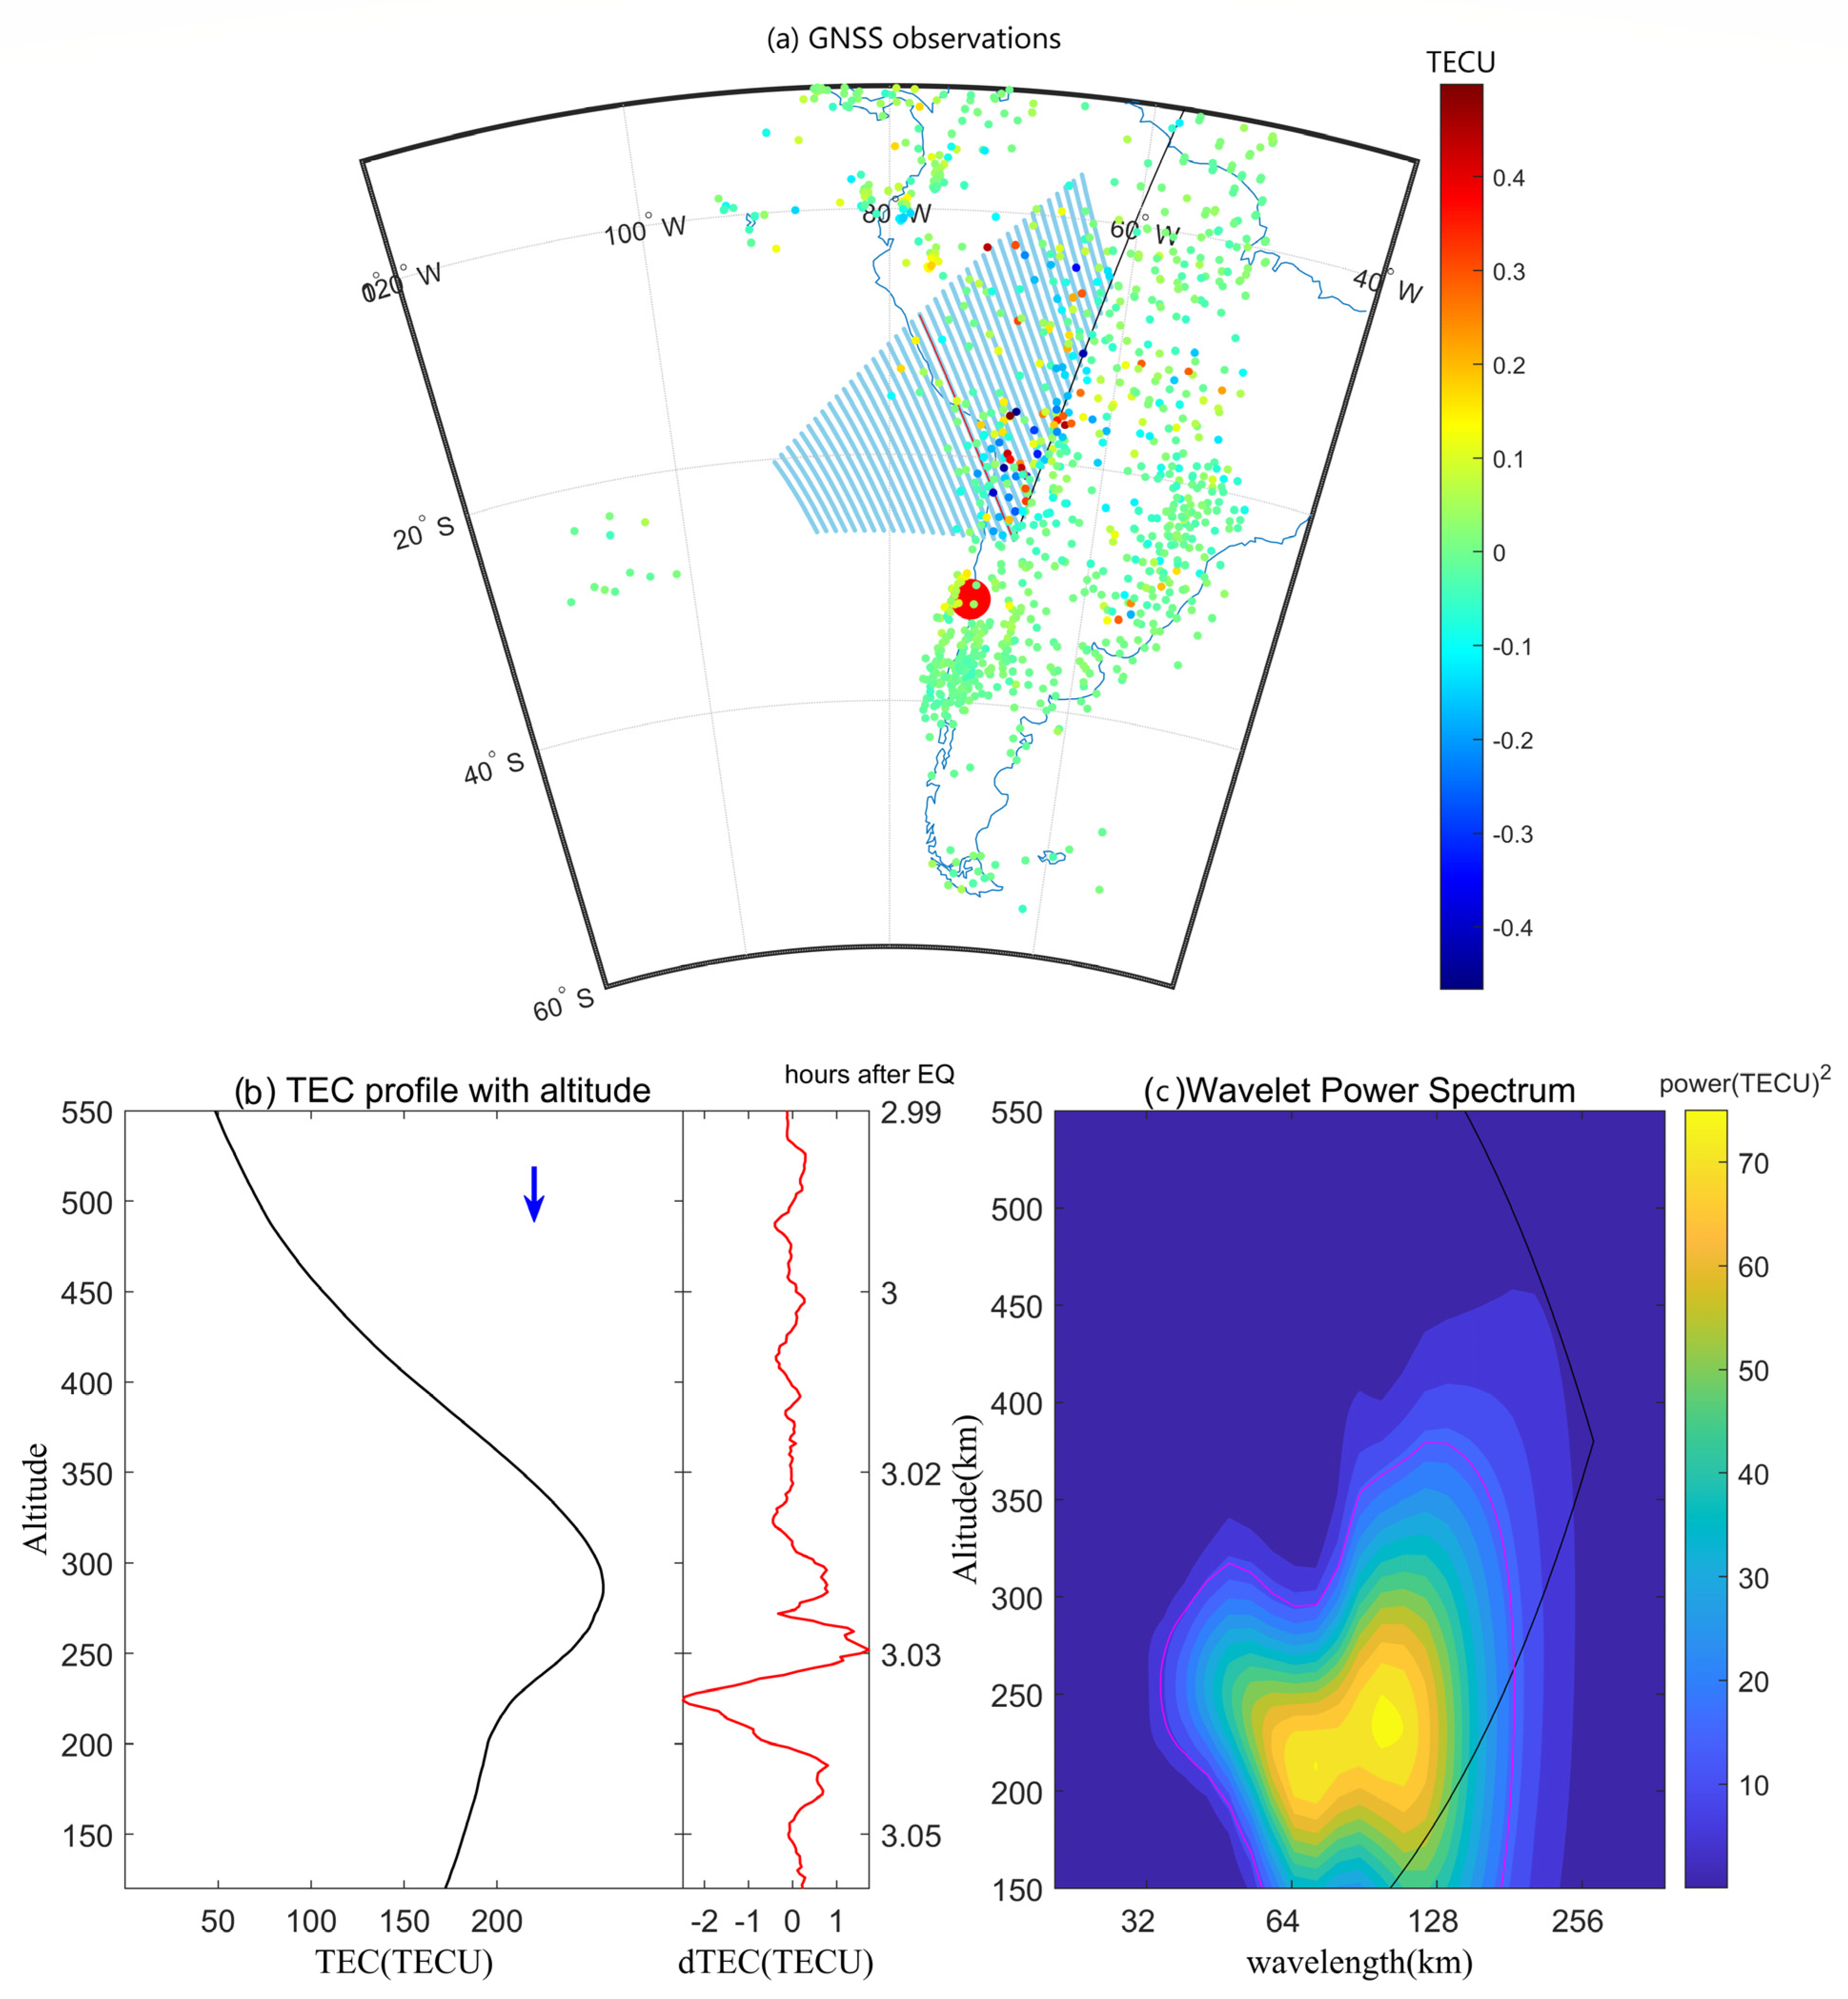
In this study, the RO podTec profiles after the 2015 tsunami were checked to give an example of a possible recorded gravity wavefront. In Figure 7, the pale blue area shows the contributing observation area of an RO podTec profile with the projections of the tangent points marked by the red line. The ground-based GNSS dTEC map at 01:54 UT, 2015-09-17, from SIMuRG (https://simurg.iszf.irk.ru/ (accessed on 22 October 2022)) [49] is employed for comparison. The tangent point gradually decreases from a height of 550 km to 120 km with time (Figure 7b). The red curve in the right panel of Figure 7b shows the detrended TEC profile using the Savitzky–Golay filter. In Figure 7, remarkable ionospheric vertical perturbations can be observed from the detrended TEC profile. To be specific, the vertical perturbation began at ~181 min after the tsunami, which is concentrated around 150–350 km altitude and the maximum amplitude is about 2.5 TECU, while the vertical wavelengths are around 100 km (Figure 7c). It is found that the ground-based GNSS dTEC map also presents a certain degree of disturbance in the effective region of RO observation, and the amplitude of the disturbance is about 0.5 TECU. In view of the maximum contribution of TEC observed by RO at the tangent points, according to the time and space information of the perturbation recorded by this profile, if the epicenter is taken as the origin, the propagation velocity of the disturbance can be estimated to be about 200 m/s, which is in line with the propagation velocity of tsunami gravity waves.
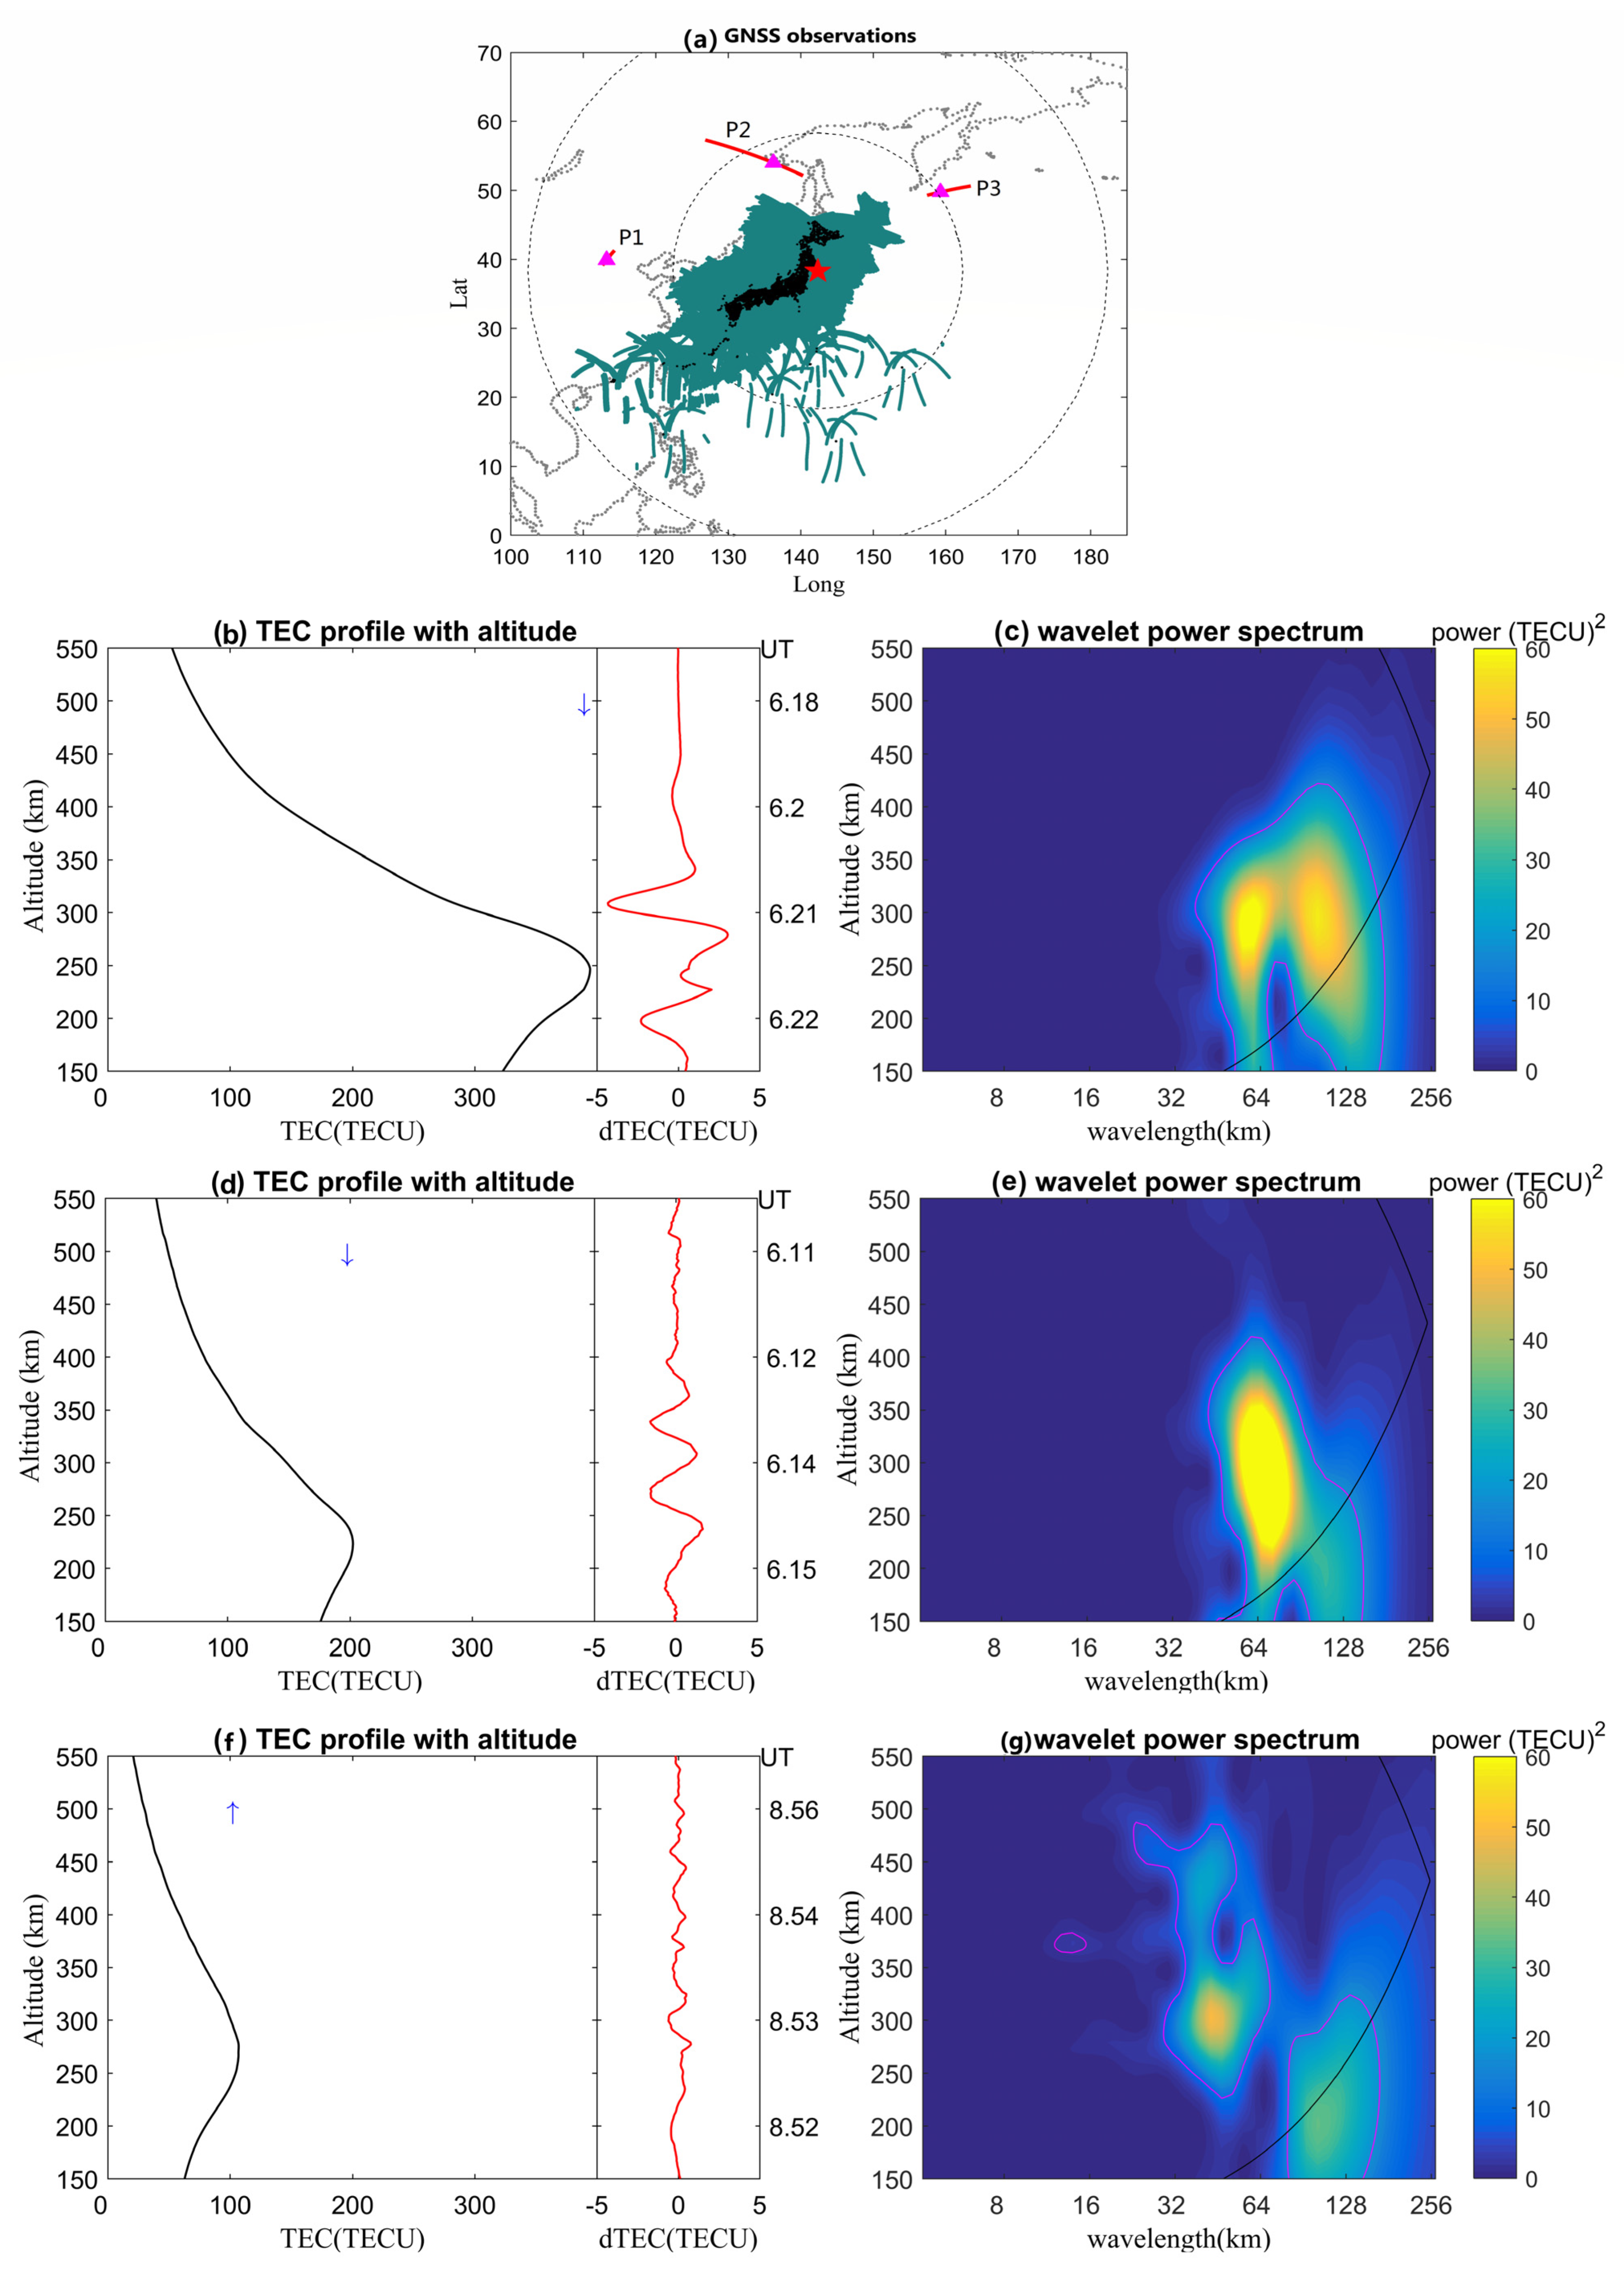
Similarly, for comparison, we also tracked the gravity wavefront signals after the 2011 tsunami. Figure 8a shows the data spatial distribution and the legends in the figure are similar to those in Figure 7. The identified perturbations are shown in Figure 8b–g in the same way as Figure 7b,c. Remarkable ionospheric vertical perturbations with scales from tens to 100 km can be observed from all three TEC profiles. Combining with the travel-time diagram of ionospheric TEC perturbations as a function of distance from the epicenter and time derived from ground-based GNSS observations (see supplementary materials), we consider that the profile P3 is attributed to the gravity wavefront with an estimated speed of ~240 m/s, while the profiles P1 and P2 are regarded as the infrasound waves coupled by seismic Rayleigh waves with the atmosphere with estimated speed ~3.0 km/s.

4. Discussion

4.1. Dependence of Vertical Wavelength on Height and Time

As the tsunami propagates outward from the source region, the gravity waves excited by ocean wave packets propagate upward in the atmosphere and ionosphere, and the average gravity wave periods, wavelengths, and phase speeds show different characteristics with time. Among them, the horizontal propagation behavior has been extensively identified given the high spatial resolution of data [18,19,20,21,22,23,24]. In contrast, the vertical propagation behavior of these gravity waves is not well comprehended. In this study, we focus on the vertical wavelength variation of these gravity waves with the help of two kinds of limb sounders.
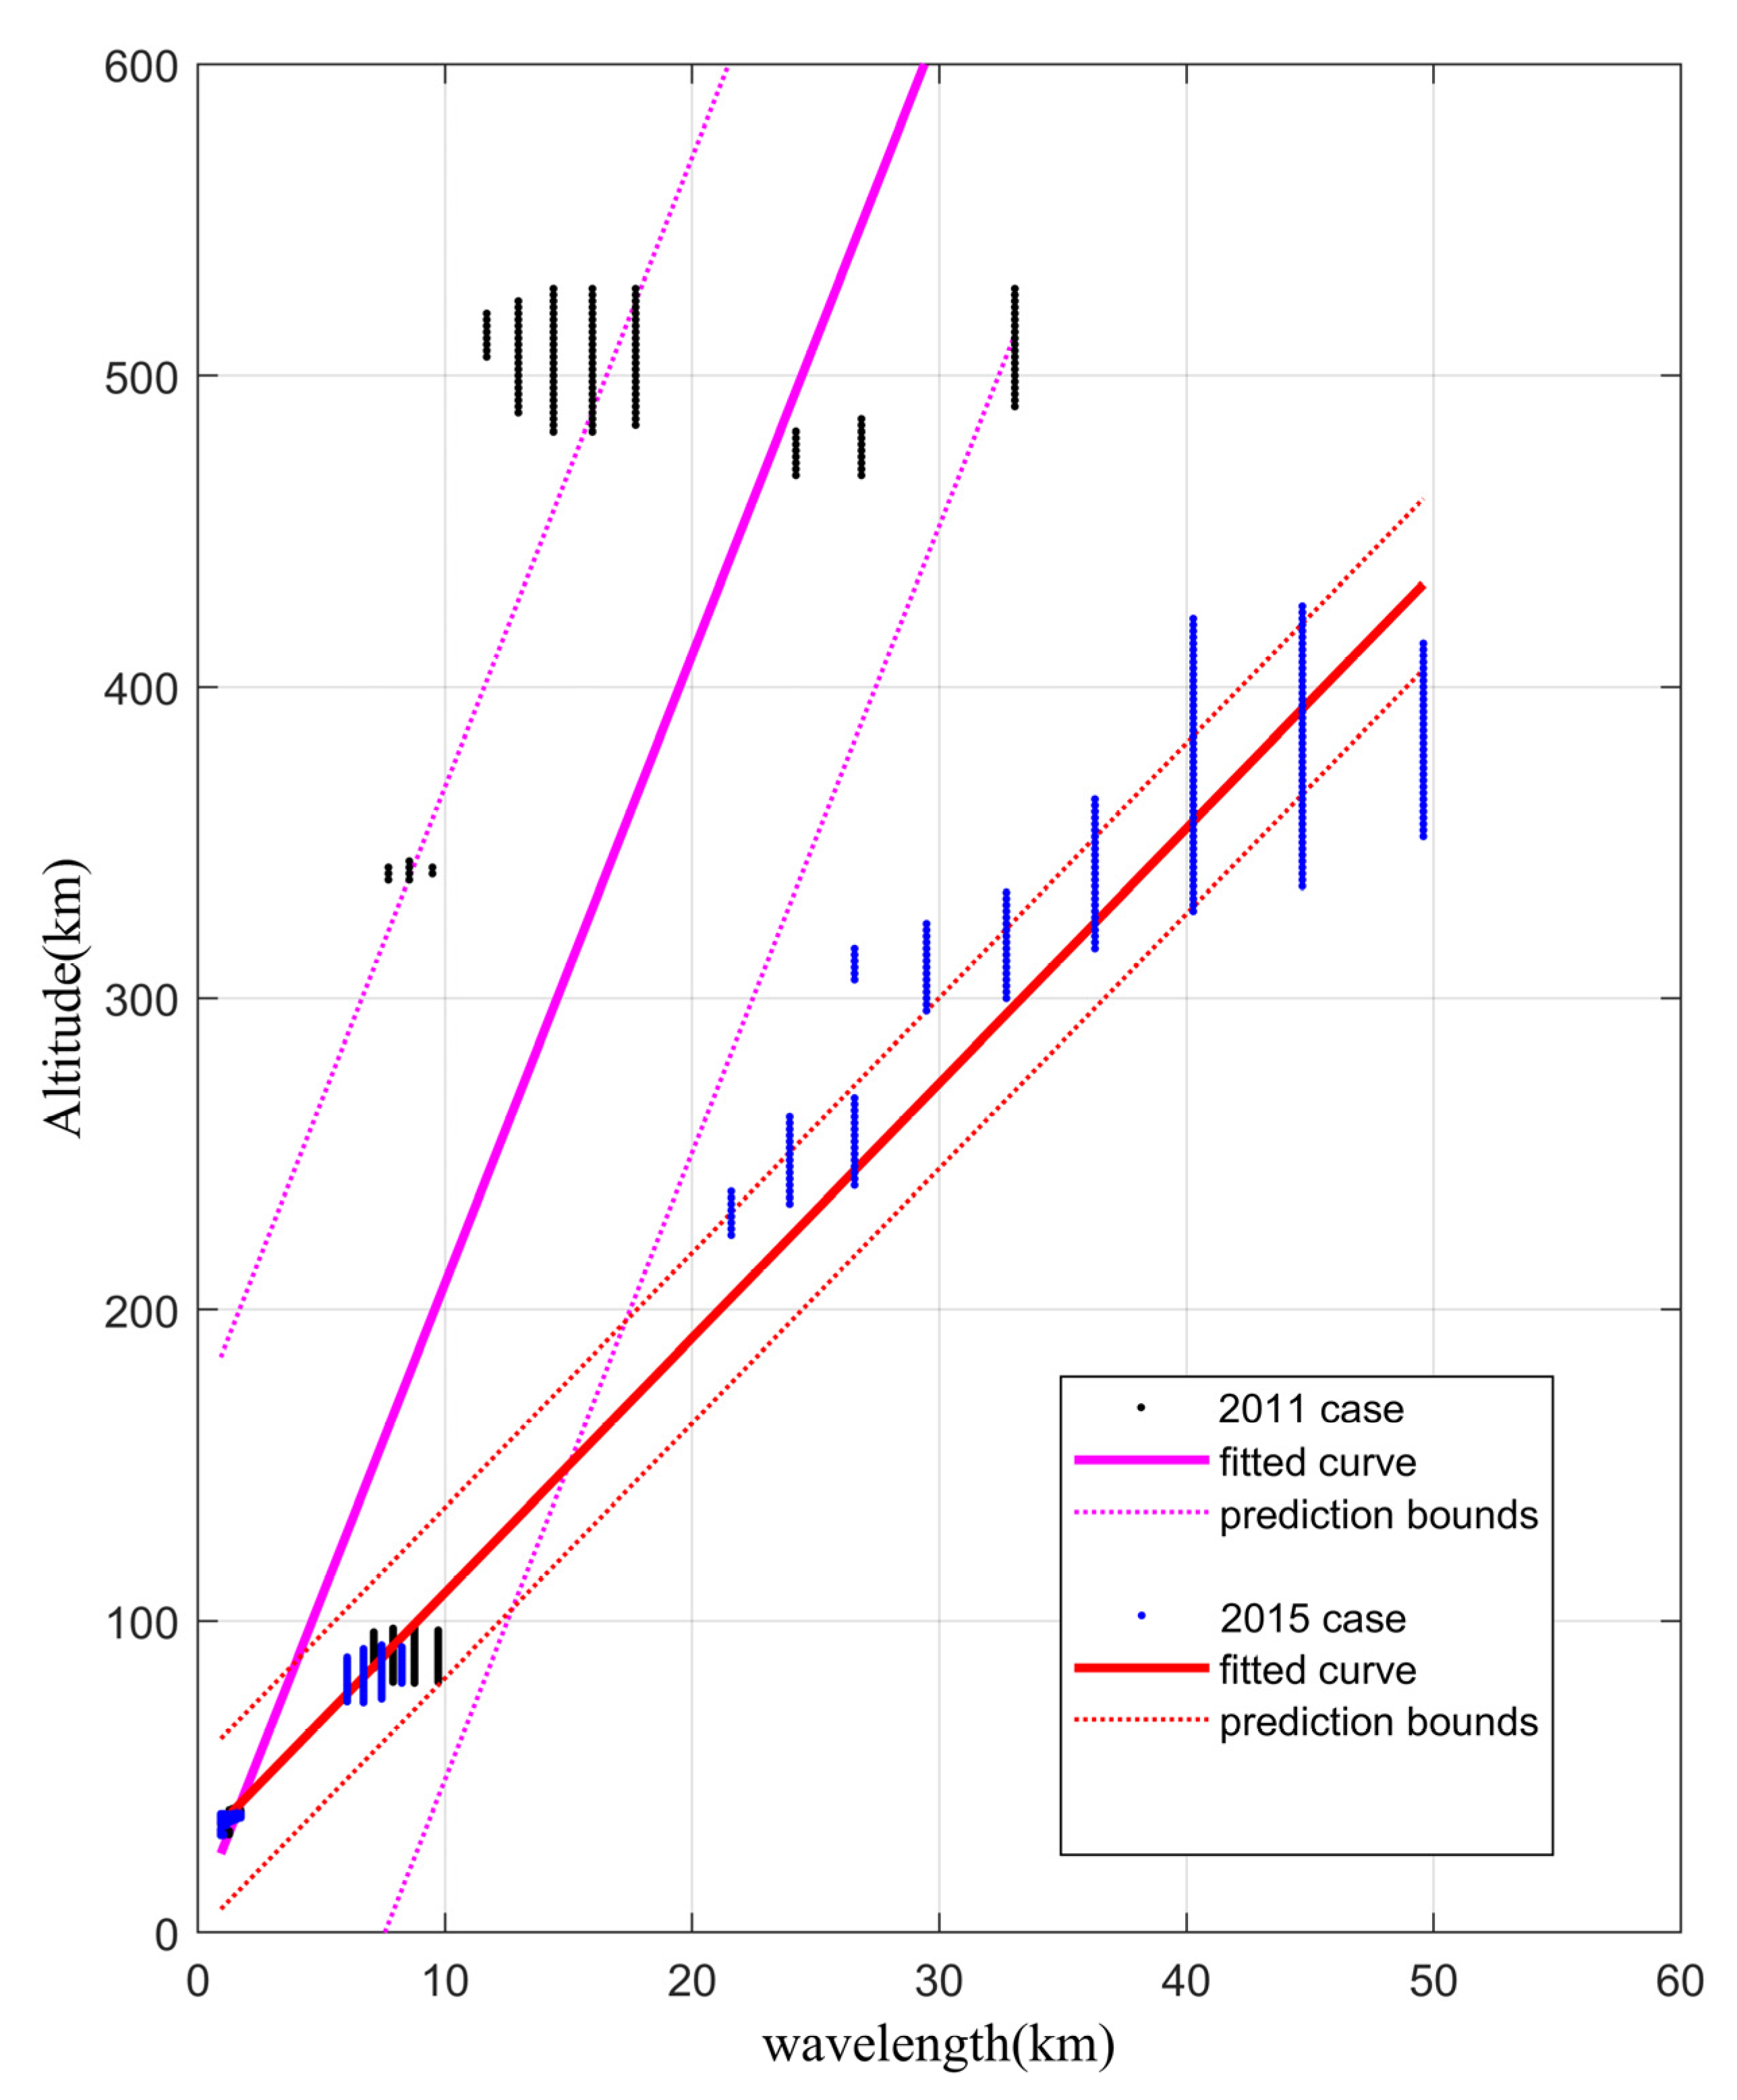
All three types of datasets in this study recognized perturbations of different scales at different heights after both the 2015-09-16 Chile tsunami and the 2011 Tohoku tsunami. The vertical scales identified by the wavelet analysis in Figure 3, Figure 4, Figure 5 and Figure 6 are marked and shown in Figure 9. It is believed that both tsunamis disturbed the whole atmosphere space, and the scale of these signals gradually increases with the increase of altitude.
For the 2015 case, the red line represents the linear fitting curve (f(x) = 8.182 × x + 27.27) with a correlation coefficient R = 0.984, and the red dotted lines mark the 95% confidence prediction bounds. It can be seen that the linear fit is a good representation of the vertical wavelength dependence of height, which is different from the exponential increase of λz as a function of the altitude of thermospheric gravity waves caused by lower atmospheric convection sources [50]. The vertical scales identified by the wavelet analysis are from 1–2 km, 5–9 km, and 25–50 km in the stratosphere, mesosphere, and ionosphere, respectively. They are smaller than the gravity wave generated by convective activities with the vertical wavelength in both the stratosphere [51] and the upper ionosphere [52]. Yan et al. [30] suggested that the short vertical wavelengths are the atmospheric oscillatory tail due to the wavefront of the earthquake/tsunami. From the theoretical simulation [53], the gravity waves propagate into the ionosphere and compress large vertical wavelengths (>100 km) to smaller scales in the 300–500 km altitude region. It supports that gravity waves can propagate to 400 km but change to smaller scales.
For the 2011 case, the pink line marks the linear fitting curve (f(x) = 20.18 × x + 6.602) with a correlation coefficient R = 0.739. Comparing the two events, the observed vertical wavelengths are comparable at different altitudes, especially in the stratosphere and mesosphere, where the vertical wavelengths after the two events are almost equal. The difference is in the ionospheric height. After the event in 2015, there are still disturbances continuously distributed and gradually increasing with the height at the height of 200–450 km, but in the 2011 case, there seem to be some small scales only at the top of the ionosphere. For the 2011 event, Yan et al. [30] performed an analysis (Figure 3c in that study) and concluded that there were clear vertical scales of 10–40 km in the ionosphere at 250–500 km height within 5 h after the tsunami, while in this study, the disturbance signal in the ionosphere was no longer obvious after expanding the time window to 15 h. One possible reason is that the daily ionospheric irregularity, which is active at local nighttime, blunts the effect of tsunamis on the ionosphere during this time.
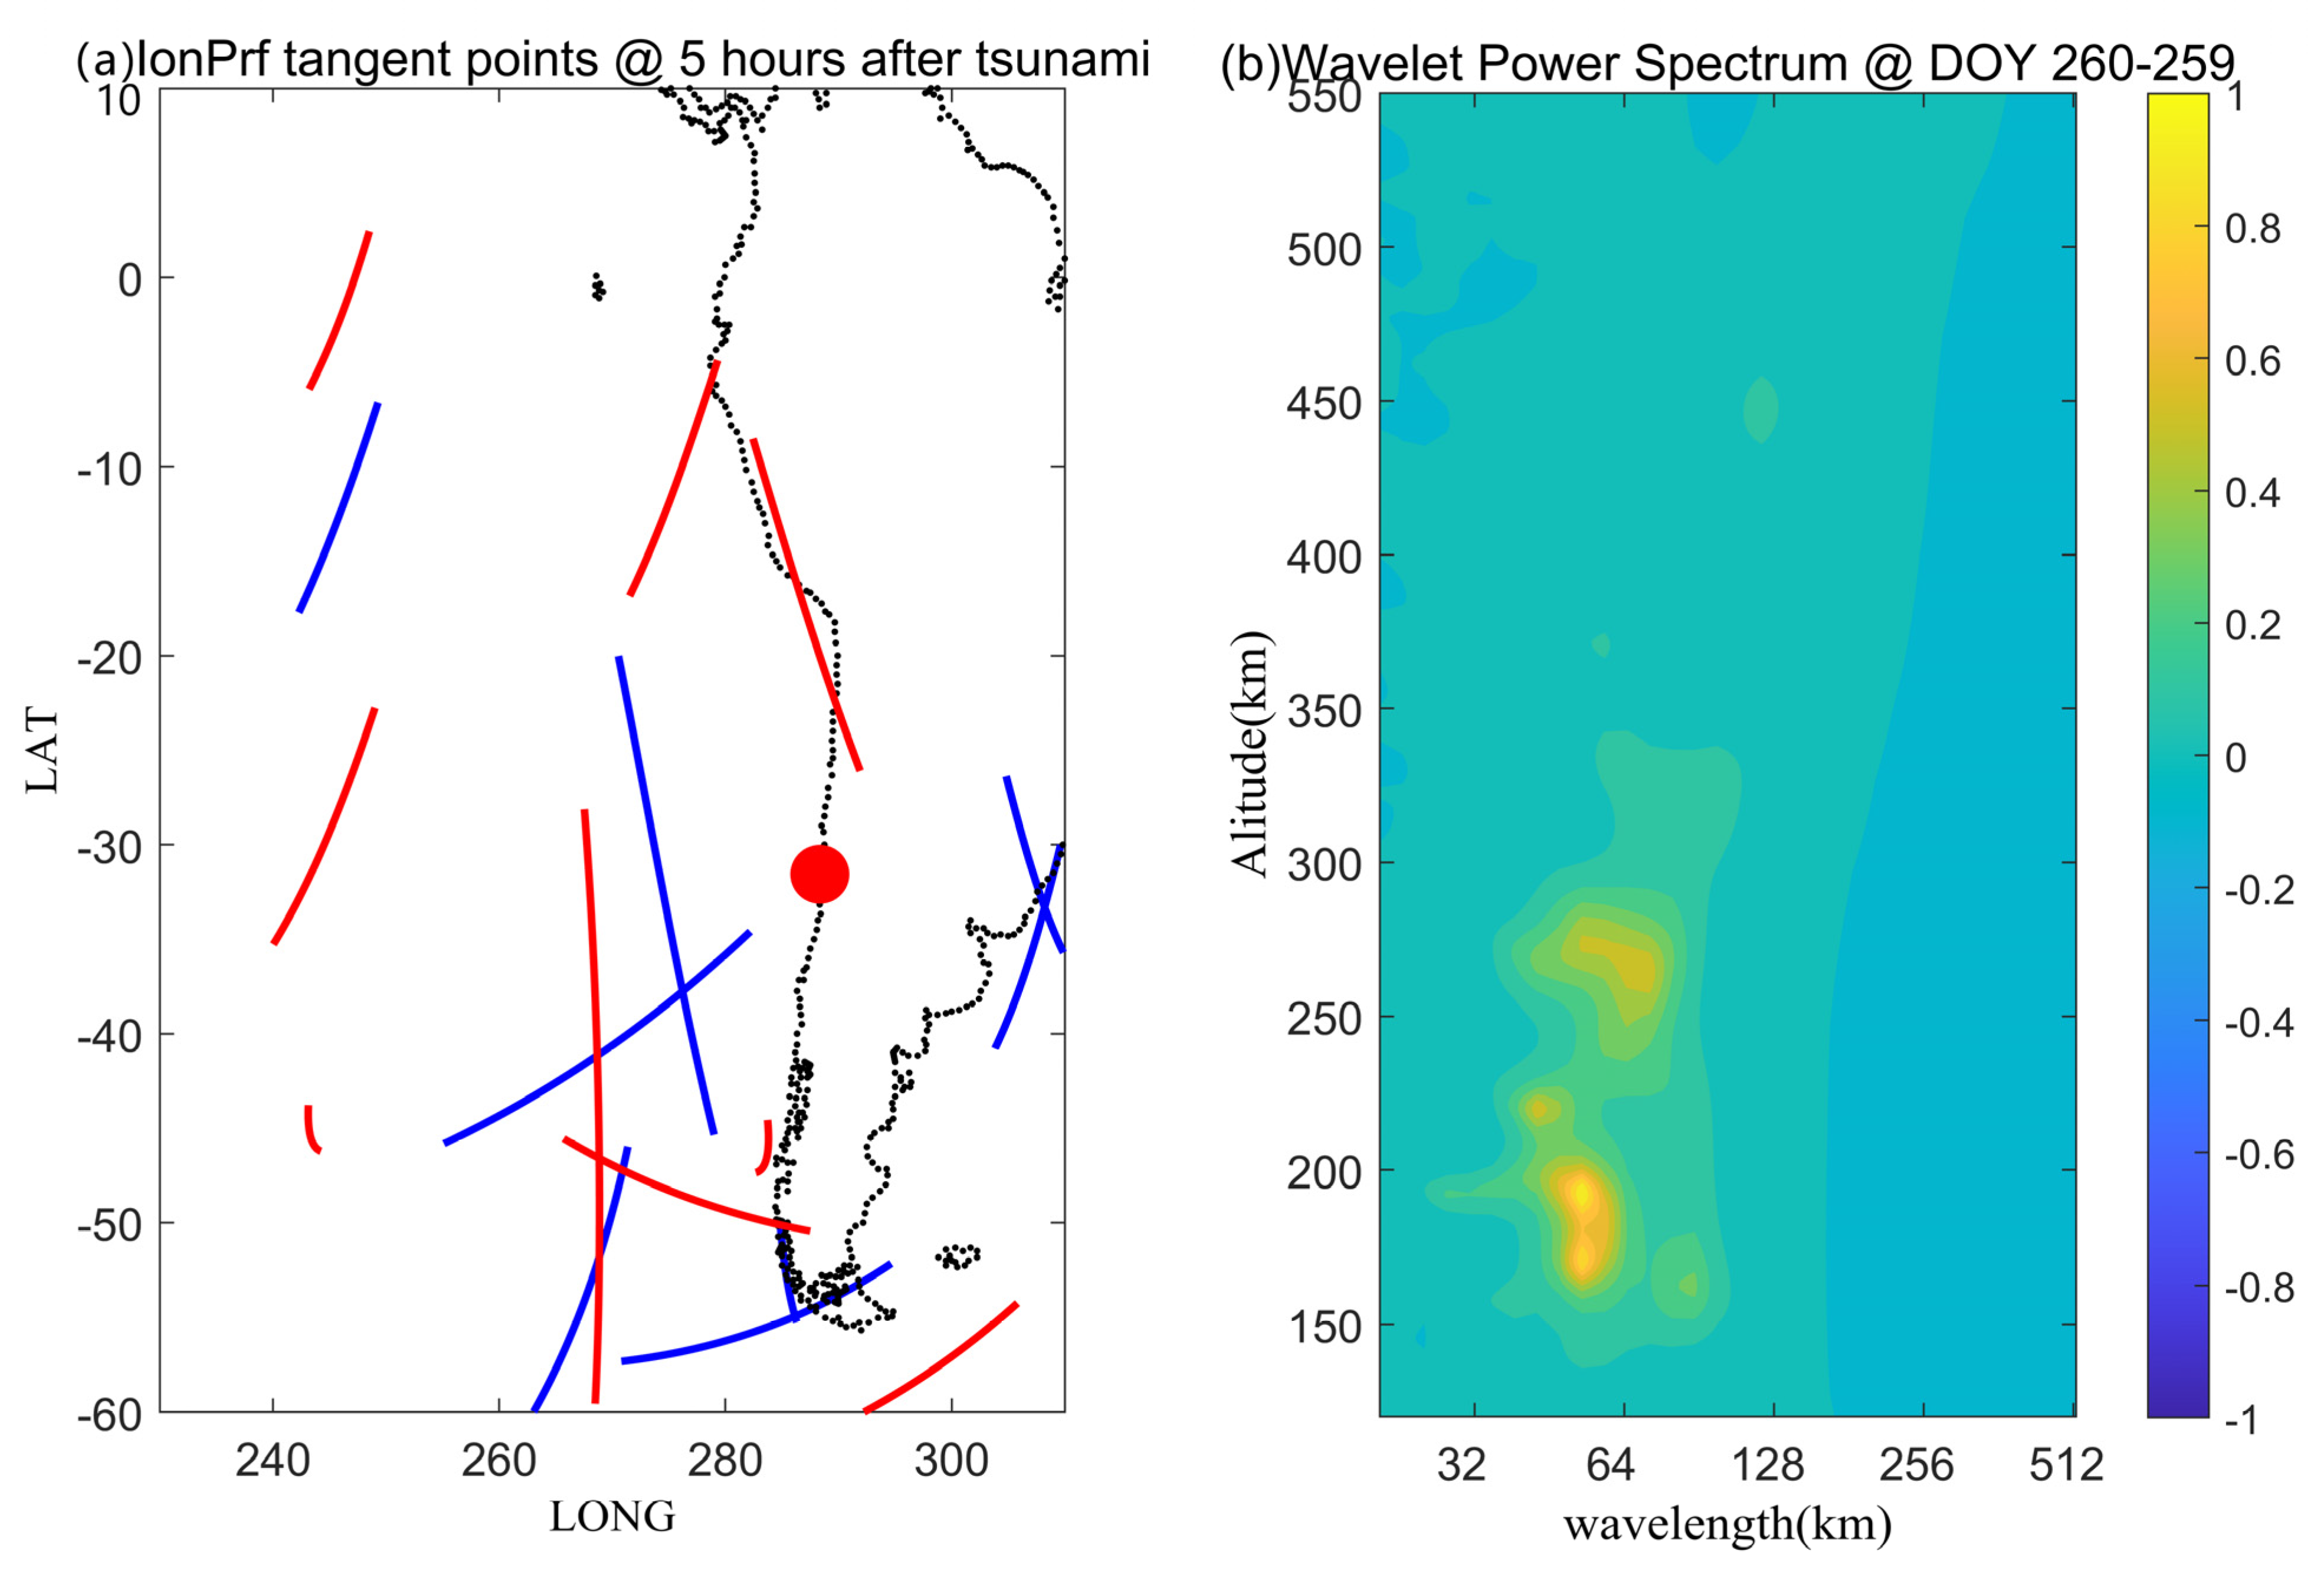
On the other hand, the identification of the time dependence of vertical wavelength is not easy to be captured by instruments because the data cannot satisfy continuous observations in time and space. Here we selected the F3/C ionPrf profiles for the first five hours after the 2015 tsunami (Figure 10a) to estimate the average scale of gravity waves during this period. Meanwhile, we compared the 5-h average scale with the 15-h average scale in Figure 5c to give a rough estimation of the time dependence of the vertical scale. In Figure 10b, the identified vertical wavelengths are in the range of 43–80 km, with a peak wavelength of about 53 km. Comparing Figure 10b and Figure 5c, it can be seen that with the delay of time, the vertical wavelengths of gravity waves reduce to ~25–50 km in the ionosphere, with the wavelengths of ~25 km at 250 km height. Vadas et al. [54] simulated the average vertical wavelength variation of the gravity waves excited by an ocean wave packet with a period of 20 min and a horizontal wavelength of 190 km for five hours after a tsunami at 250 km height in the ionosphere. The results show that the earliest gravity waves have the largest vertical wavelengths ~250 km, and then the wavelengths gradually decrease to ~50 km after 5 h. The observations in Figure 10b generally agree with the above simulation and show the gradual decrease of the vertical wavelengths over time. At the same time, a similar understanding is reached for the 2011 event. By comparing Figure 6c of this study and Figure 3c of Yan et al. [30], the vertical wavelengths of perturbations in the ionosphere gradually decrease or even disappear as the time expands from 5 h to 15 h.

4.2. The “Early” Perturbations before the 2015 Tsunami Wave Packet

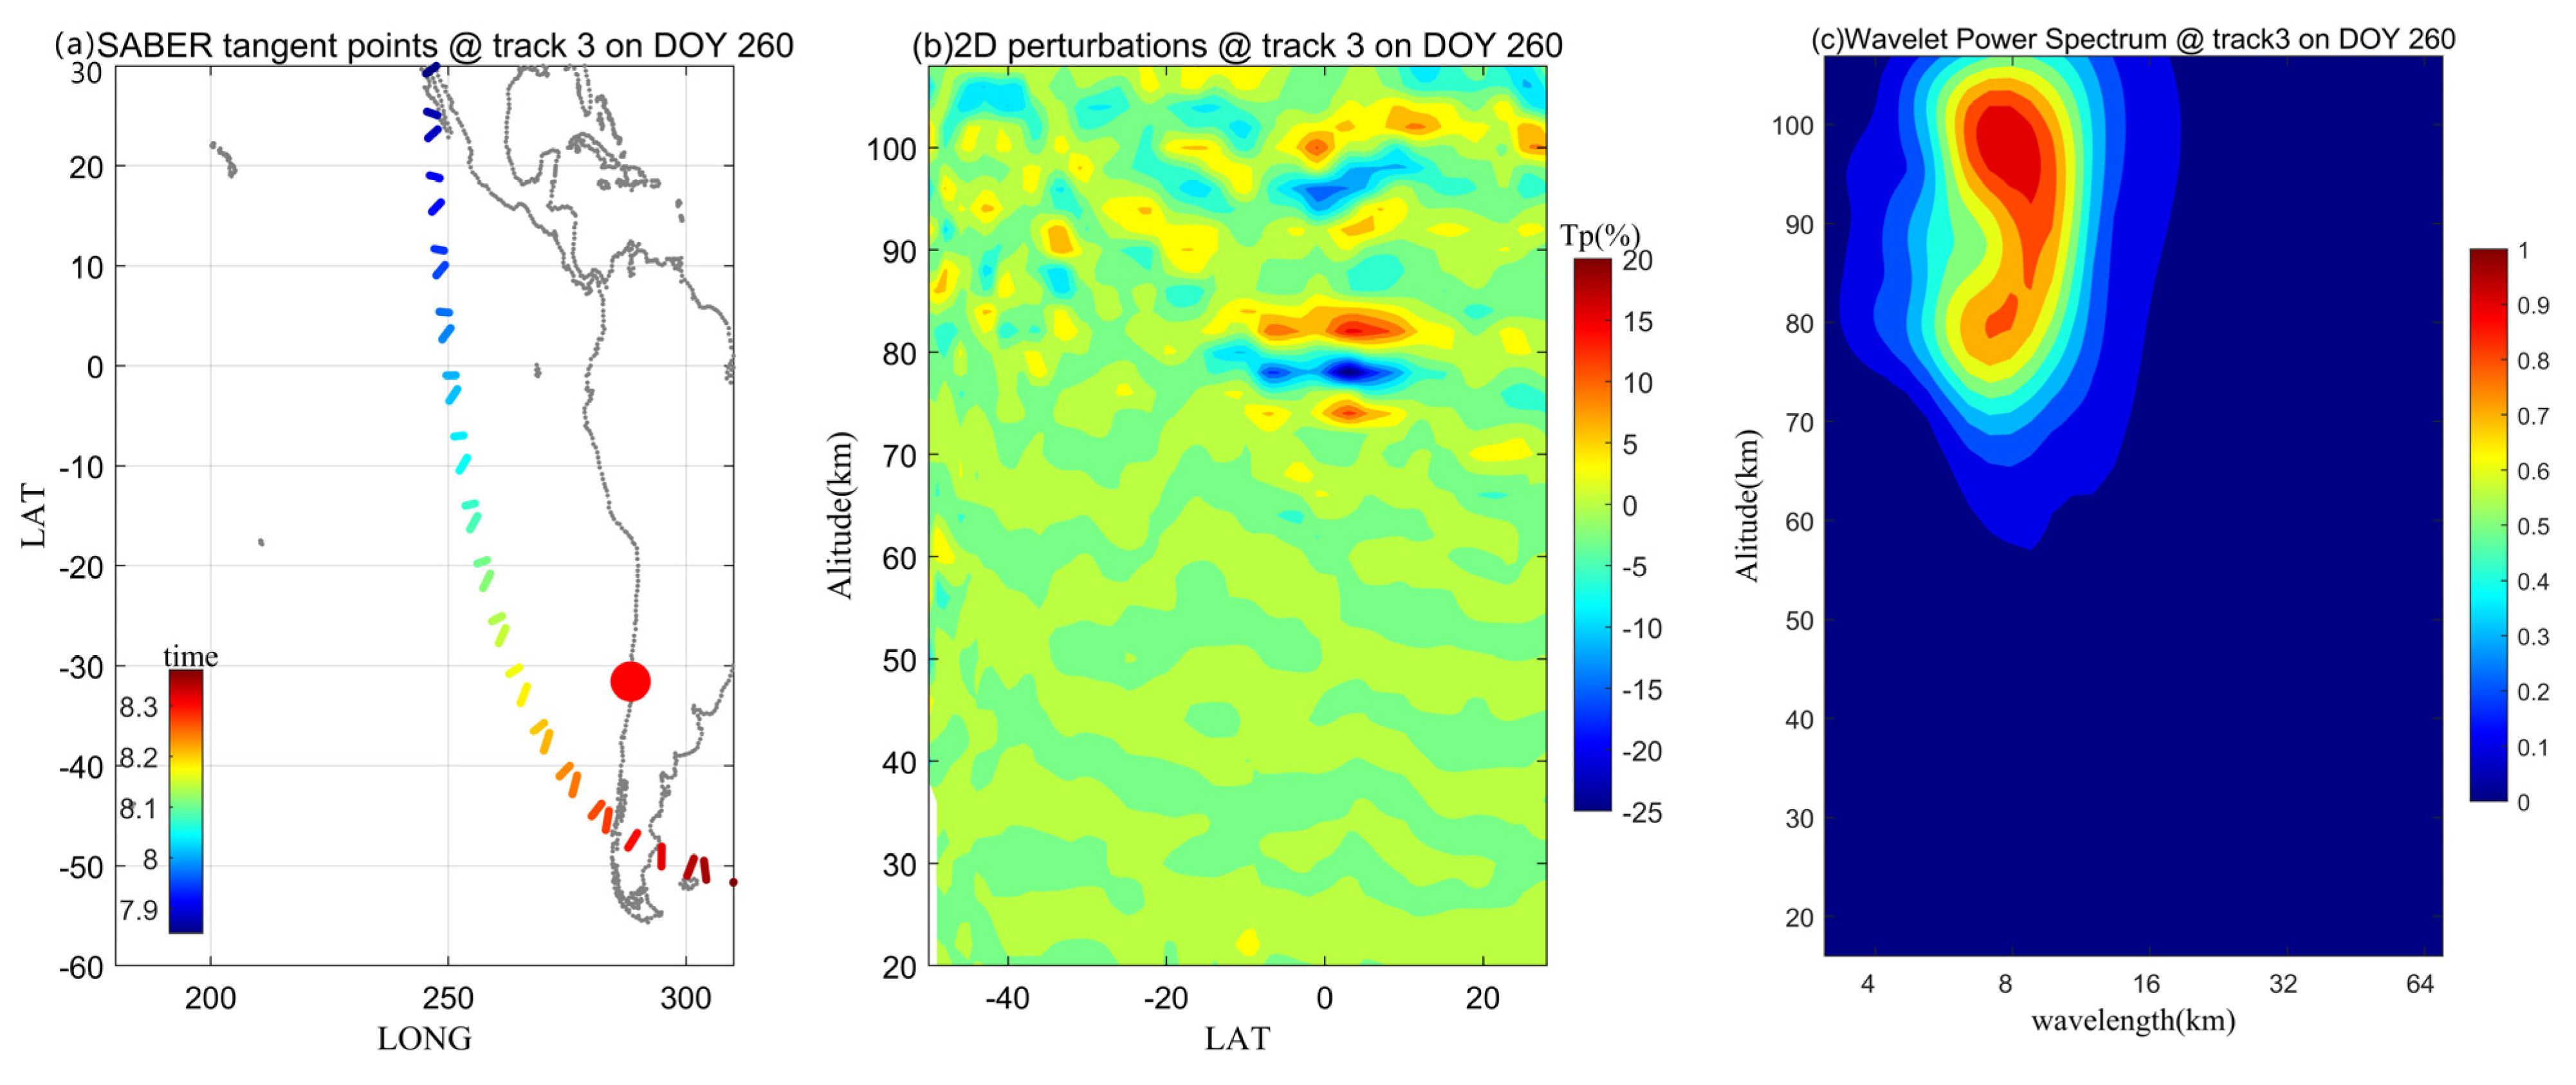
Figure 11 shows the temperature perturbations recorded by track 3 (marked in Figure 1c) of the SABER satellite. It can be seen that in the range of latitude −15° to 15° and height of 75–105 km, remarkable wavelike perturbations are recorded (Figure 11b), and the vertical wavelength is around 5–15 km with the peak scale about 8 km (Figure 11c). If we keep a watchful eye on the observation time in Figure 11a and the arrival time of the tsunami in Figure 1a, the abnormal observation time recorded above is almost the same as the arrival time of the tsunami, so it can be roughly regarded as a wavefront signal of the tsunami-induced gravity wave. Comparing Figure 11c and Figure 4c, we can see that the vertical scale (5–9 km) from all observations within 15 h after the tsunami is slightly smaller than the wavefront scale (6–12 km).
Note that some “early” perturbations in the atmosphere and ionosphere before the tsunami were reported in several studies. Makela et al. [9] found that the first ionospheric signature appeared in the 630 nm airglow layer one hour before the 2011 Tohoku tsunami reached Hawaii. Liu et al. [55] observed that the tsunami-traveling ionospheric disturbances tend to lead the associated ocean waves by about 19 min after the 2004 Sumatra tsunami. Meanwhile, the simulation of gravity waves induced by tsunami wave packets [54] also indicates that if the sum period of a tsunami wave packet is larger than 10–12 min, the excited sum and/or highest-frequency continuum gravity waves are faster than that of the tsunami wave packet. Consequently, the excited gravity waves will arrive at a certain latitude/longitude before the tsunami wave packet [54].
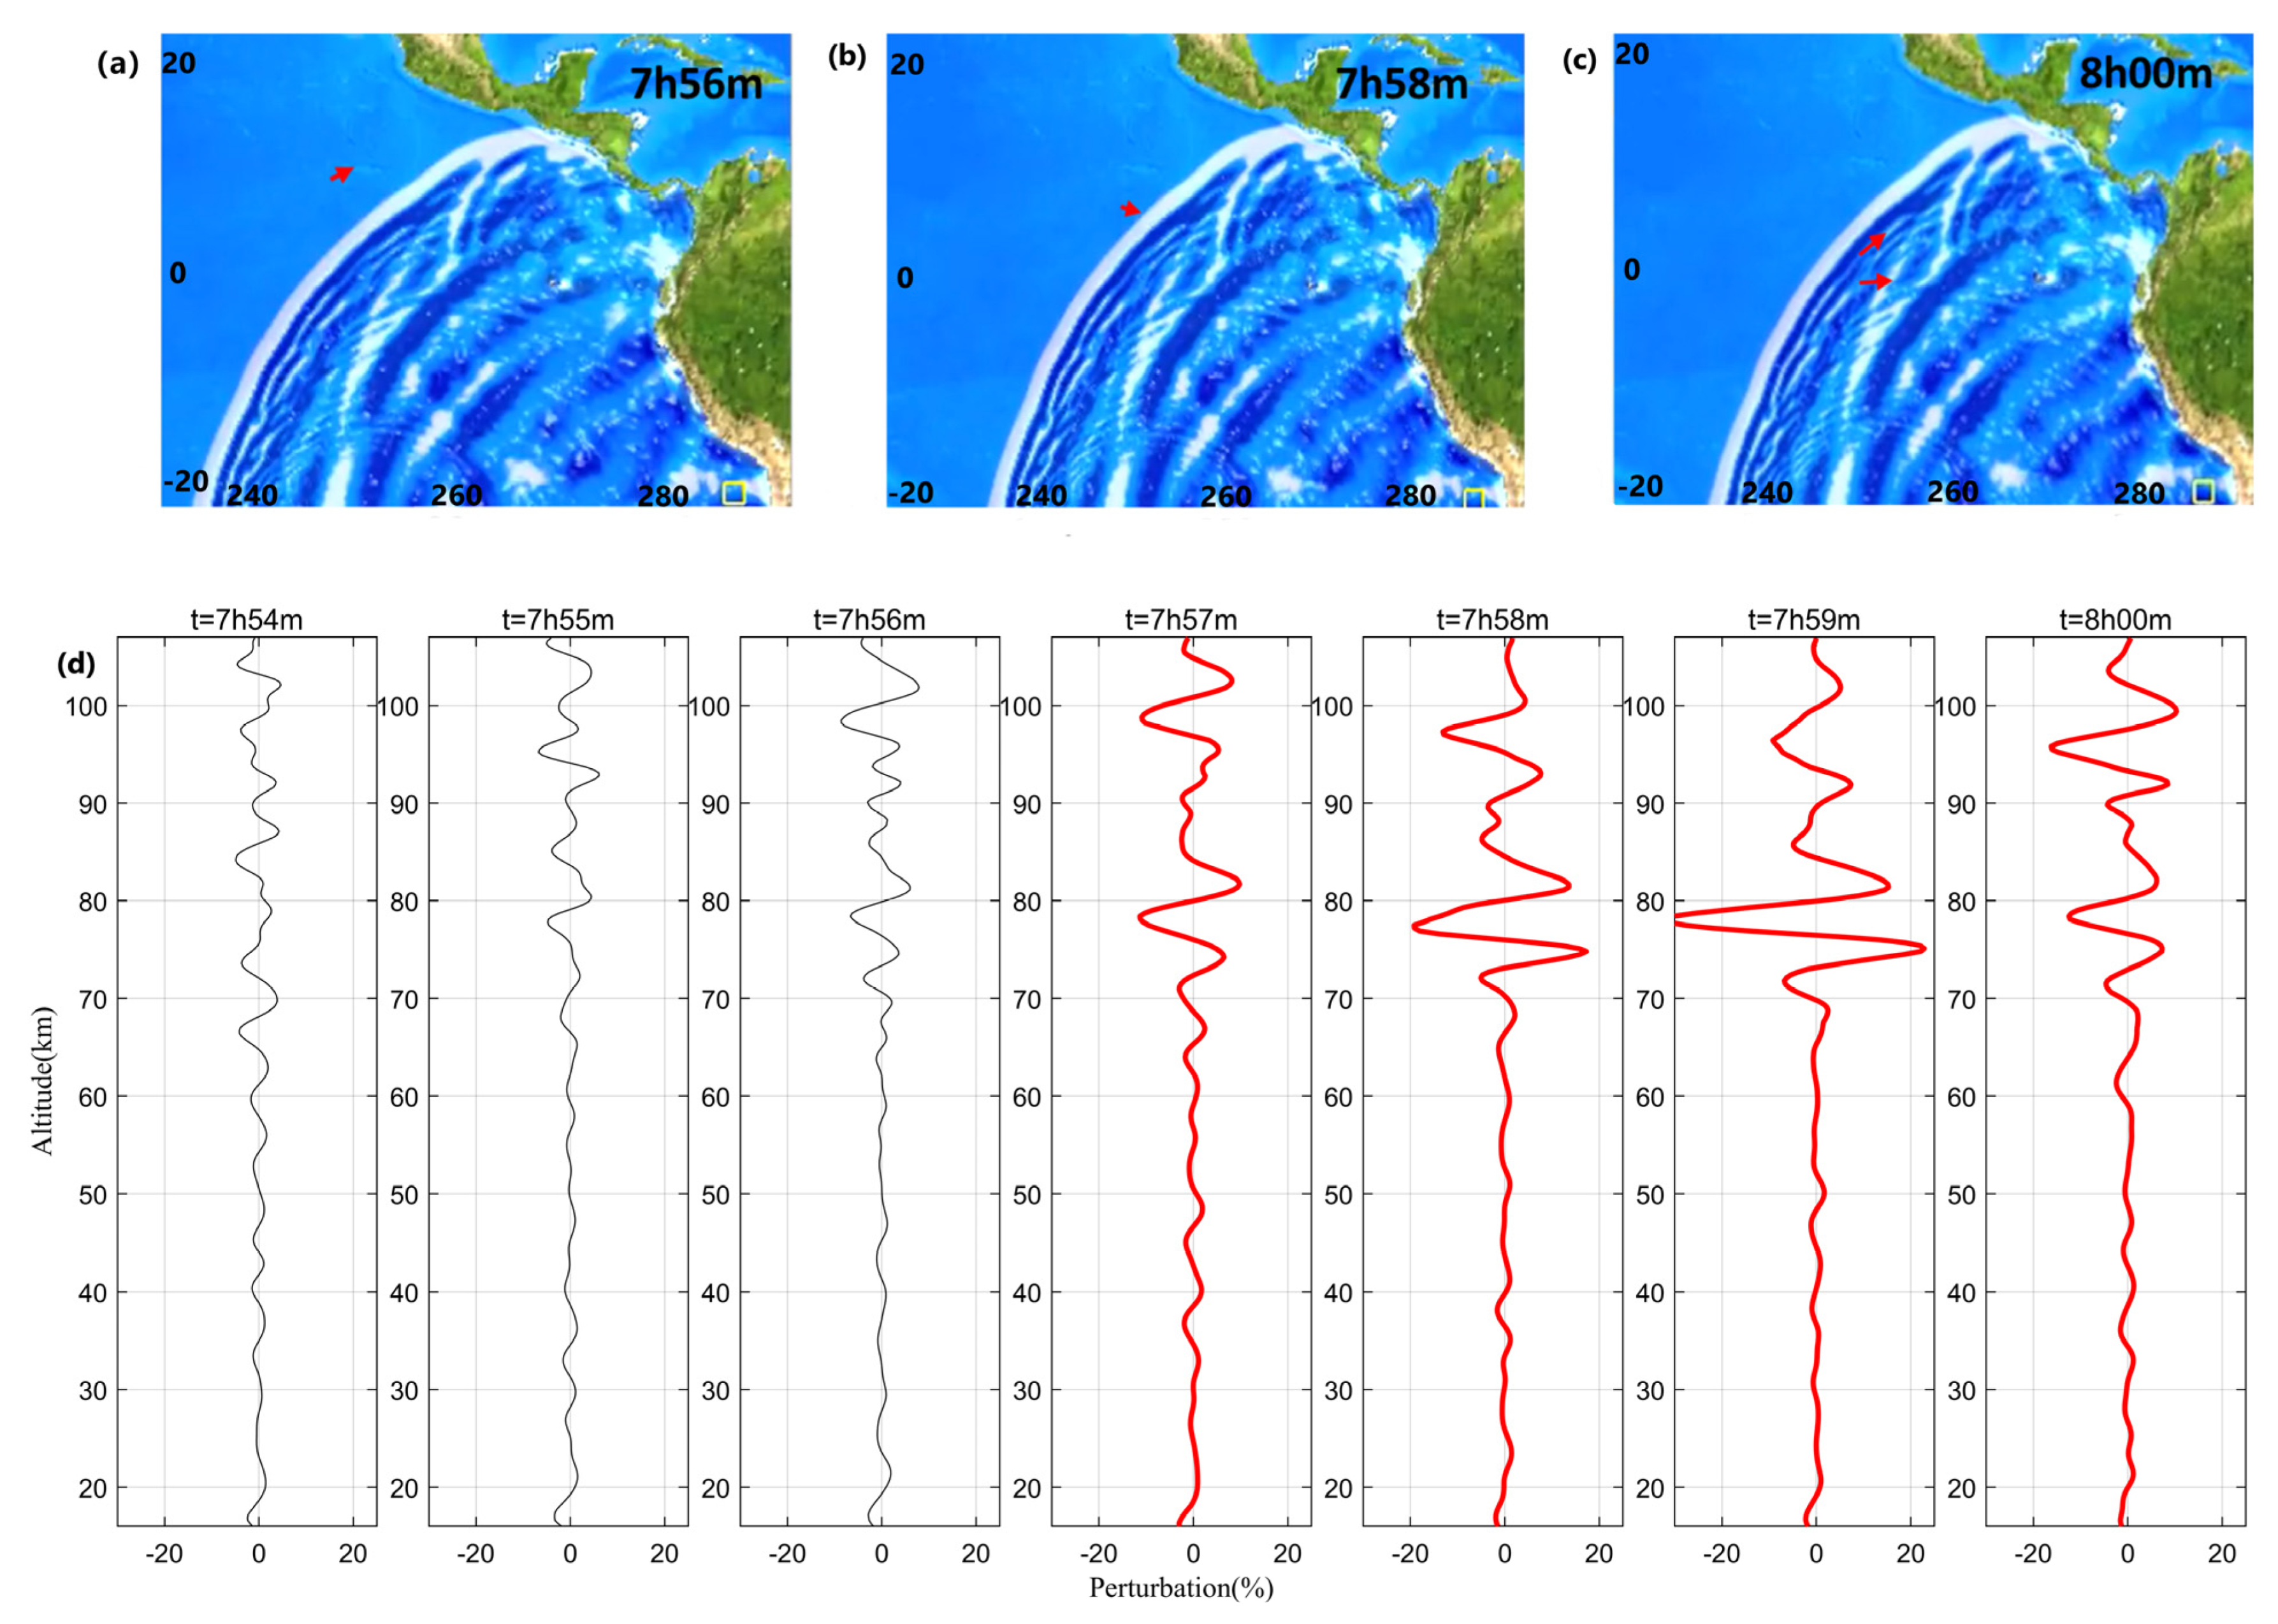
In view of this, we carefully checked the timings of the perturbations recorded in each profile in Figure 11a and then compared them with the arrival times of the tsunami in Figure 1a. The results are shown in Figure 12. Figure 12a–c show the tsunami waves (http://nctr.pmel.noaa.gov/chile20150916/ (accessed on 1 July 2022)) at three adjacent moments (7h56m, 7h58m, and 8h00m), the red arrows represent the four observations (7h57m, 7h58m, 7h59m, and 8h00m) of SABER closest to the above three moments. The temperature perturbations of these four observations are shown by the red curves in Figure 12d, while the black curves in Figure 12d are the observations at 7h54m, 7h54m, and 7h56m, respectively. It can be seen that at 7h57m and 7h58m, SABER began to record obvious temperature perturbations between 70 km and 105 km in altitude, and at this moment the wavefront of the tsunami did not reach the projection of the tangent points, that is, the temperature perturbations in the mesosphere recorded by SABER may be ahead of the tsunami wavefront. After that, the perturbation recorded by SABER at 7h59m is consistent with the tsunami wavefront, and the amplitude of the wavefront is the largest (−32%) at this time.
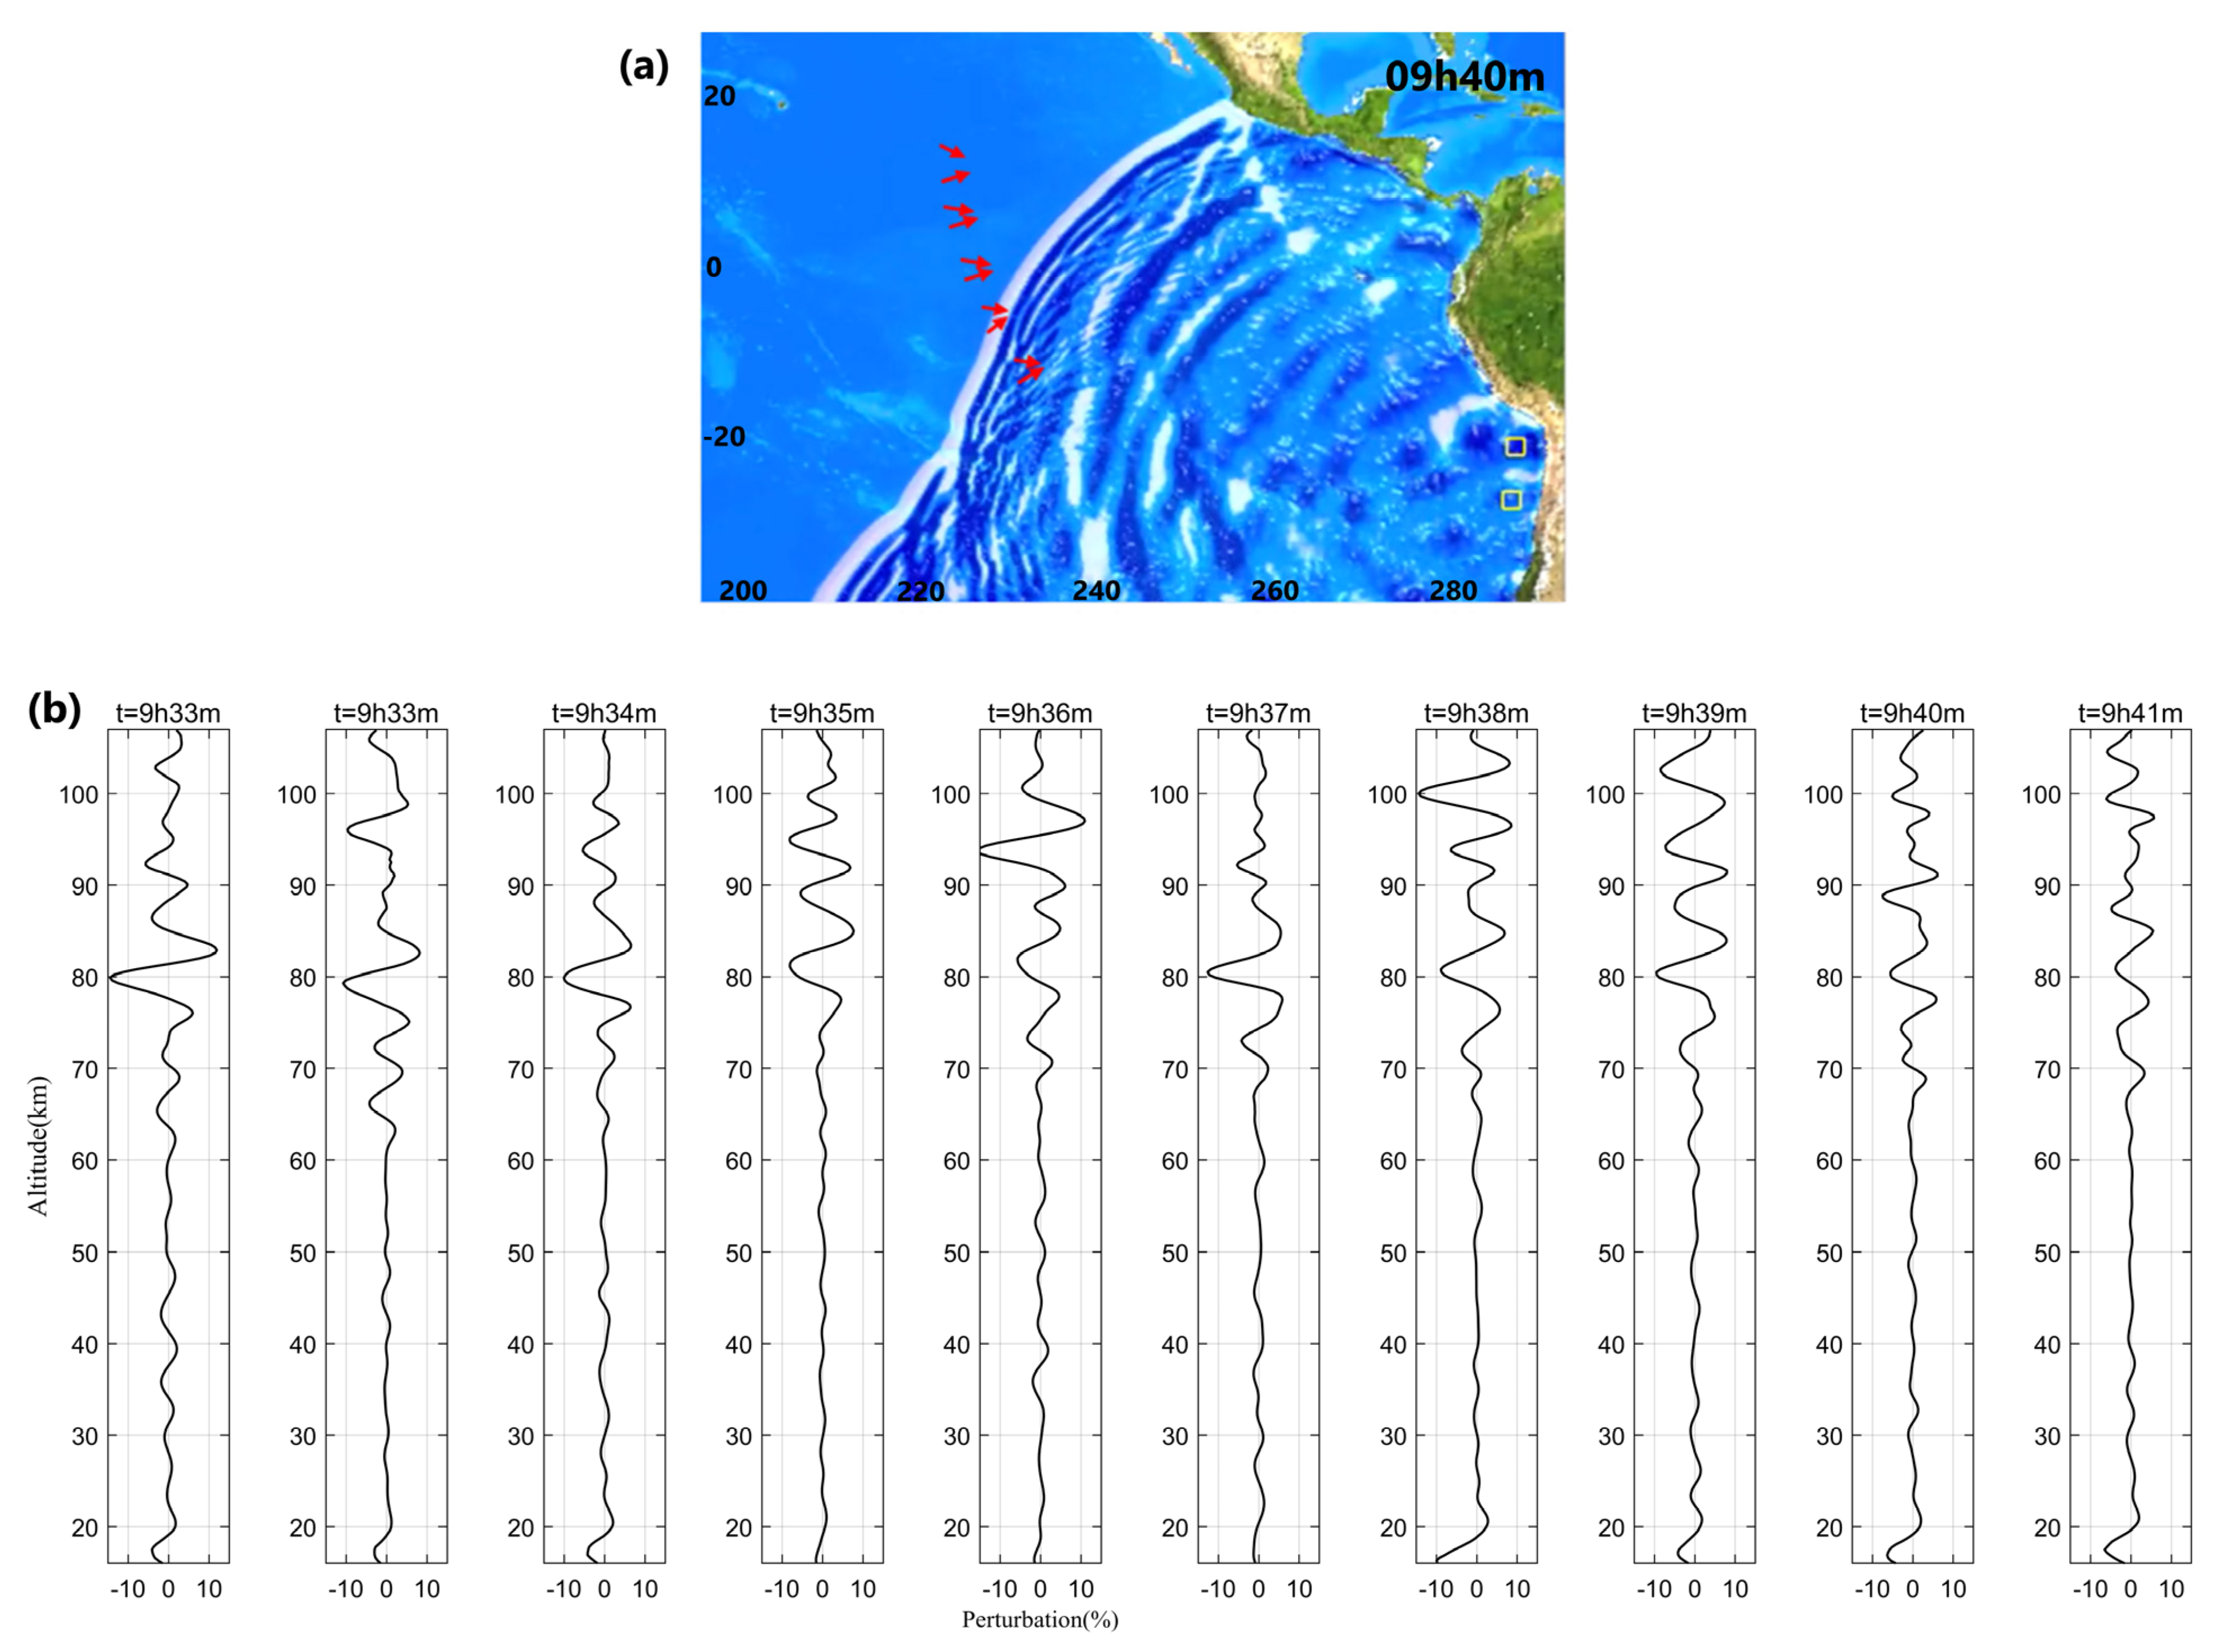
Similarly, the differences in the arrival times of perturbations recorded by track 4 and tsunami wavefronts are shown in Figure 13. Figure 13a displays the tsunami waves (http://nctr.pmel.noaa.gov/chile20150916/ (accessed on 1 July 2022)) at 09h40m, while the red arrows represent the projections of the tangent point of ten observations by SABER around the above moment. The panels from left to right in Figure 13b correspond to the temperature perturbations of the ten observations from top to bottom in Figure 13a. It can be seen that these ten observations all recorded perturbations with varying amplitudes (absolute values in the range of ~5–15%) between 70–100 km height. However, the perturbations recorded in the first eight observations from top to bottom in Figure 13a all arrived earlier than the tsunami wavefront.
Such “early” gravity waves have been discussed in several previous studies [9,54,55,56]. The probable explanations are attributed to the small oscillations seen on the ocean surface [9], the sum and/or higher-frequency continuum gravity waves induced by the tsunami [54], and the difference between tsunamis and tsunami-induced gravity waves propagation speeds caused by the lower bathymetry [56]. Note that datasets from different instruments and/or heights only give parts of the wavelength space due to the instrumental sensitivities and the background atmosphere. Therefore, the causes of such early gravity waves also exist in diversity and complexity. Additionally, the uncertainties of the SABER observations and observing geometry should be considered adequately. Overall, the observations from SEBER in this study once again provide possible examples of the “early” gravity waves, which are thought to be valuable for early tsunami detection.

5. Conclusions

In conclusion, this study shows the availability of two different limb sounders: the FORMOSAT-3/COSMIC (F3/C) radio occultation (RO) technique and the Sounding of the Atmosphere using Broadband Emission Radiometry (SABER) instrument, in identifying the vertical coupling of the tsunami-excited gravity waves. The observations from the limb sounders demonstrate that both the 16-09-2015 Chile tsunami and the 11-03-2011 Tohoku tsunami disturbed the whole atmosphere space from the stratosphere to the ionosphere. The vertical wavelengths gradually increase with the increase of altitude but decrease with the delay of time. The average scales identified within 15 h after the tsunamis are from 1–2 km, 5–9 km, and tens km in the stratosphere, mesosphere, and ionosphere, respectively. We also examined the effectiveness of RO data in tracking the tsunami-related gravity wavefronts of the two cases. Another interesting observation is that the SABER temperature profiles provide possible examples of “early” gravity waves from 70–100 km altitudes. The findings suggest that datasets from different instruments and/or heights may provide complementary observation views of some portions of the whole spectrum of tsunami-induced gravity waves.

Supplementary Materials

The following supporting information can be downloaded at: https://www.mdpi.com/article/10.3390/rs14215543/s1. Figure S1: Traveling time diagram of the TEC perturbation data following the Tohoku earthquake. The color of the scatters represents the amplitude of the TEC perturbation. Scattered dots named P1, P2 and P3 show the F3/C detrended TEC profiles. The black dashed lines are used to fit the propagation velocities of the STIDs. The vertical black line indicates the onset time of the earthquake. Refs. [5,6,7,9,20,23,52,57] are cited in the Supplementary Materials.

Author Contributions

Conceptualization, X.Y. and T.Y.; Funding acquisition, X.Y.; Investigation and methodology, X.Y.; Software, C.X.; Supervision, T.Y.; Writing—original draft, X.Y.; Writing—review and editing, T.Y. and C.X. All authors have read and agreed to the published version of the manuscript.

Funding

This work is supported by the National Natural Science Foundation of China (42074191, 41774164), the Fundamental Research Funds for the Central Universities (Grant No. 2018187, CUG2106343).

Data Availability Statement

The F3/C RO data were obtained by the COSMIC Data Analysis Archive Center (CDAAC) (http://cdaac-www.cosmic.ucar.edu/cdaac/index.html (accessed on 1 July 2022)). The SABER data are from saber.gats-inc.com (accessed on 1 July 2022). The ground-based GNSS dTEC map is from SIMuRG (https://simurg.iszf.irk.ru/(accessed on 22 October 2022)).

Acknowledgments

The authors would like to thank the reviewers for their comments and suggestions.

Conflicts of Interest

The authors declare no conflict of interest.

References

  1. Yuen, P.C.; Weaver, P.F.; Suzuki, R.K.; Furumoto, A.S. Continuous, traveling coupling between seismic waves and the ionosphere evident in May 1968 Japan earthquake data. J. Geophys. Res. 1969, 74, 2256–2264. [Google Scholar] [CrossRef]
  2. Davies, K. Ionospheric Radio; Peter Peregrinus Ltd.: London, UK, 1990; ISBN 64 60061. [Google Scholar]
  3. Liu, J.Y.; Chen, C.H.; Sun, Y.Y.; Chen, C.H.; Tsai, H.F.; Yen, H.Y.; Chum, J.; Lastovicka, J.; Yang, Q.S.; Chen, W.S.; et al. The vertical propagation of disturbances triggered by seismic waves of the 11 March 2011 M9.0 Tohoku earthquake over Taiwan. Geophys. Res. Lett. 2016, 43, 1759–1765. [Google Scholar] [CrossRef] [Green Version]
  4. Calais, E.; Minster, J.B. GPS detection of ionospheric perturbations following the January 17, 1994, Northridge Earthquake. Geophys. Res. Lett. 1995, 22, 1045–1048. [Google Scholar] [CrossRef]
  5. Heki, K.; Ping, J. Directivity and apparent velocity of the coseismic ionospheric disturbances observed with a dense GPS array. Earth Planets Sci. Lett. 2005, 236, 845–855. [Google Scholar] [CrossRef] [Green Version]
  6. Galvan, D.A.; Komjathy, A.; Hickey, M.P.; Stephens, P.; Snively, J.; Tony Song, Y.; Butala, M.D.; Mannucci, A.J. Ionospheric signatures of Tohoku-Oki tsunami of March 11, 2011: Model comparisons near the epicenter. Radio Sci. 2012, 47, 1–10. [Google Scholar] [CrossRef] [Green Version]
  7. Jin, S.; Jin, R.; Li, J.H. Pattern and evolution of seismo-ionospheric disturbances following the 2011 Tohoku earthquakes from GPS observations. J. Geophys. Res. Space Phys. 2014, 119, 7914–7927. [Google Scholar] [CrossRef] [Green Version]
  8. Liu, Y.; Jin, S. Ionospheric Rayleigh Wave Disturbances Following the 2018 Alaska Earthquake from GPS Observations. Remote Sens. 2019, 11, 901. [Google Scholar] [CrossRef] [Green Version]
  9. Makela, J.J.; Lognonné, P.; Hébert, H.; Gehrels, T.; Rolland, L.; Allgeyer, S.; Kherani, A.; Occhipinti, G.; Astafyeva, E.; Cosson, P.; et al. Imaging and modeling the ionospheric airglow response over Hawaii to the tsunami generated by the Tohoku earthquake of 11 March 2011. Geophys. Res. Lett. 2011, 38, 117. [Google Scholar] [CrossRef] [Green Version]
  10. Smith, S.M.; Martinis, C.R.; Baumgardner, J.; Mendillo, M. All-sky imaging of transglobal thermospheric gravity waves generated by the March 2011 Tohoku Earthquake. J. Geophys. Res. A Sp. Phys. 2015, 120, 10992–10999. [Google Scholar] [CrossRef]
  11. Utada, H.; Shimizu, H.; Ogawa, T.; Maeda, T.; Furumura, T.; Yamamoto, T.; Yamazaki, N.; Yoshitake, Y.; Nagamachi, S. Geomagnetic field changes in response to the 2011 off the Pacific Coast of Tohoku Earthquake and Tsunami. Earth Planets Sci. Lett. 2011, 311, 11–27. [Google Scholar] [CrossRef]
  12. Hao, Y.Q.; Xiao, Z.; Zhang, D.H. Multi-instrument observation on co-seismic ionospheric effects after great Tohoku earthquake. J. Geophys. Res. Space Phys. 2012, 117, 1–8. [Google Scholar] [CrossRef] [Green Version]
  13. Garcia, R.F.; Bruinsma, S.; Lognonné, P.; Doornbos, E.; Cachoux, F. GOCE: The first seismometer in orbit around the Earth. Geophys. Res. Lett. 2013, 40, 1015–1020. [Google Scholar] [CrossRef] [Green Version]
  14. Garcia, R.F.; Doornbos, E.; Bruinsma, S.; Hebert, H. Atmospheric gravity waves due to the Tohoku-Oki tsunami observed in the thermosphere by GOCE. J. Geophys. Res. 2014, 119, 4498–4506. [Google Scholar] [CrossRef] [Green Version]
  15. Yang, Y.M.; Meng, X.; Komjathy, A.; Verkholyadova, O.; Langley, R.B.; Tsurutani, B.T.; Mannucci, A.J. Tohoku-Oki earthquake caused major ionospheric disturbances at 450 km altitude over Alaska. Radio Sci. 2014, 49, 1206–1213. [Google Scholar] [CrossRef]
  16. Occhipinti, G. The Seismology of the Planet Mongo: The 2015 Ionospheric Seismology Review. In Subduction Dyn. Mantle Flow Mega Disasters, Geophysical Monograph 211, 1st ed.; American Geophysical Union (AGU): Washington, DC, USA, 2015; pp. 169–182. [Google Scholar]
  17. Lognonné, P.; Clévédé, E.; Kanamori, H. Computation of seismograms and atmospheric oscillations by normal-mode summation for a spherical earth model with realistic atmosphere. Geophys. J. Int. 1998, 135, 388–406. [Google Scholar] [CrossRef] [Green Version]
  18. Chen, C.H.; Saito, A.; Lin, C.H.; Liu, J.Y.; Tsai, H.F.; Tsugawa, T.; Otsuka, Y.; Nishioka, M.; Matsumura, M. Long-distance propagation of ionospheric disturbance generated by the 2011 off the Pacific coast of Tohoku Earthquake. Earth Planets Space 2011, 63, 881–884. [Google Scholar] [CrossRef] [Green Version]
  19. Liu, J.Y.; Chen, C.H.; Lin, C.H.; Tsai, H.F.; Chen, C.H.; Kamogawa, M. Ionospheric disturbances triggered by the 11 March 2011 M9.0 Tohoku earthquake. J. Geophys. Res. Space Phys. 2011, 116, 1–5. [Google Scholar]
  20. Rolland, L.M.; Lognonné, P.; Astafyeva, E.; Kherani, E.A.; Kobayashi, N.; Mann, M.; Munekane, H. The resonant response of the ionosphere imaged after the 2011 off the Pacific coast of Tohoku Earthquake. Earth Planets Space 2011, 63, 853–857. [Google Scholar] [CrossRef] [Green Version]
  21. Tsai, H.-F.; Liu, J.-Y.; Lin, C.-H.; Chen, C.-H. Tracking the epicenter and the tsunami origin with GPS ionosphere observation. Earth Planets Space 2011, 63, 859–862. [Google Scholar] [CrossRef] [Green Version]
  22. Tsugawa, T.; Saito, A.; Otsuka, Y.; Nishioka, M.; Maruyama, T.; Kato, H.; Nagatsuma, T.; Murata, K. Ionospheric disturbances detected by GPS total electron content observation after the 2011 off the Pacific coast of Tohoku Earthquake. Earth Planets Space 2011, 63, 875–879. [Google Scholar] [CrossRef] [Green Version]
  23. Occhipinti, G.; Rolland, L.; Lognonné, P.; Watada, S. From Sumatra 2004 to Tohoku-Oki 2011: The systematic GPS detection of the ionospheric signature induced by tsunamigenic earthquakes. J. Geophys. Res. Space Phys. 2013, 118, 3626–3636. [Google Scholar] [CrossRef]
  24. Kamogawa, M.; Orihara, Y.; Tsurudome, C.; Tomida, Y.; Kanaya, T.; Ikeda, D.; Gusman, A.R.; Kakinami, Y.; Liu, J.Y.; Toyoda, A. A possible space-based tsunami early warning system using observations of the tsunami ionospheric hole. Sci. Rep. 2016, 6, 37989. [Google Scholar] [CrossRef] [PubMed] [Green Version]
  25. Grawe, M.A.; Makela, J.J. Observation of tsunami-generatedionospheric signatures over Hawaiicaused by the 16 September 2015 Illapel earthquake. J. Geophys. Res. Space Phys. 2017, 122, 1128–1136. [Google Scholar] [CrossRef]
  26. Chou, M.-Y.; Cherniak, I.; Lin, C.C.; Pedatella, N.M. The persistent ionospheric responses over Japan after the impact of the 2011 Tohoku earthquake. Space Weather 2000, 18, e2019SW002302. [Google Scholar] [CrossRef] [Green Version]
  27. Chou, M.-Y.; Yue, J.; Lin, C.C.; Rajesh, P.K.; Pedatella, N.M. Conjugate effect of the 2011 Tohoku reflected tsunami-driven gravity waves in the ionosphere. Geophys. Res. Lett. 2022, 49, e2021GL097170. [Google Scholar] [CrossRef]
  28. Coïsson, P.; Lognonné, P.; Walwer, D.; Rolland, L.M. First tsunami gravity wave detection in ionospheric radio occultation data. Earth Sp. Sci. 2015, 2, 125–133. [Google Scholar] [CrossRef]
  29. Liu, J.-Y.; Chen, C.-Y.; Sun, Y.-Y.; Lee, I.-T.; Chum, J. Fluctuations on vertical profiles of the ionospheric electron density perturbed by the March 11, 2011 M9.0 Tohoku earthquake and tsunami. GPS Solut. 2019, 23, 76. [Google Scholar] [CrossRef]
  30. Yan, X.; Sun, Y.; Yu, T.; Liu, J.Y.; Qi, Y.; Xia, C.; Zuo, X.; Yang, N. Stratosphere Perturbed by the 2011 Mw9.0 Tohoku Earthquake. Geophys. Res. Lett. 2018, 45, 10050–10056. [Google Scholar] [CrossRef]
  31. Alexander, P.; de la Torre, A.; Schmidt, T.; Llamedo, P.; Hierro, R. Limb sounders tracking topographic gravity wave activity from the stratosphere to the ionosphere around midlatitude Andes. J. Geophys. Res. Space Phys. 2015, 120, 9014–9022. [Google Scholar] [CrossRef] [Green Version]
  32. Yang, Y.M.; Verkhoglyadova, O.; Mlynczak, M.G.; Mannucci, A.J.; Meng, X.; Langley, R.B.; Hunt, L.A. Satellite-based observations of tsunami-induced mesosphere airglow perturbations. Geophys. Res. Lett. 2017, 44, 522–532. [Google Scholar] [CrossRef]
  33. Astafyeva, E. Ionospheric detection of natural hazards. Rev. Geophys. 2019, 57, 1265–1288. [Google Scholar] [CrossRef]
  34. Occhipinti, G.; Lognonné, P.; Kherani, E.A.; Hébert, H. Three-dimensional waveform modeling of ionospheric signature induced by the 2004 Sumatra tsunami. Geophys. Res. Lett. 2006, 33, L20104. [Google Scholar] [CrossRef] [Green Version]
  35. Occhipinti, G.; Kherani, A.; Lognonné, P. Geomagnetic dependence of ionospheric disturbances induced by tsunamigenic internal gravity waves. Geophys. J. Int. 2008, 173, 753–765. [Google Scholar] [CrossRef]
  36. Kherani, E.A.; Lognonné, P.; Kamath, N.; Crespon, F.; Garcia, R. Response of the ionosphere to the seismic triggered acoustic waves: Electron density and electromagnetic fluctuations. Geophys. J. Int. 2009, 176, 1–13. [Google Scholar] [CrossRef] [Green Version]
  37. Yue, X.; Schreiner, W.S.; Hunt, D.C.; Rocken, C.; Kuo, Y.H. Quantitative evaluation of the low Earth orbit satellite based slant total electron content determination. Sp. Weather 2011, 9, S09001. [Google Scholar] [CrossRef] [Green Version]
  38. Anthes, R.A.; Bernhardt, P.A.; Chen, Y.; Cucurull, L.; Dymond, K.F.; Ector, D.; Healy, S.B.; Ho, S.P.; Hunt, D.C.; Kuo, Y.H.; et al. The COSMIC/Formosat-3 mission: Early results. Bull. Am. Meteorol. Soc. 2008, 89, 313–333. [Google Scholar] [CrossRef]
  39. Das, U.; Pan, C.J. Validation of FORMOSAT-3/COSMIC level 2 "atmPrf" global temperature data in the stratosphere. Atmos. Meas. Tech. 2014, 7, 731–742. [Google Scholar] [CrossRef] [Green Version]
  40. Alexander, P.; de la Torre, A.; Llamedo, P. Interpretation of gravity wave signatures in GPS radio occultations. J. Geophys. Res. Atmos. 2008, 113, 27. [Google Scholar] [CrossRef] [Green Version]
  41. Faber, A.; Llamedo, P.; Schmidt, T.; De La Torre, A.; Wickert, J. On the determination of gravity wave momentum flux from GPS radio occultation data. Atmos. Meas. Tech. 2013, 6, 3169–3180. [Google Scholar] [CrossRef] [Green Version]
  42. Kursinski, E.R.; Hajj, G.A.; Leroy, S.S.; Herman, B. The GPS radio occultation technique. Terr. Atmos. Ocean. Sci. 2000, 11, 53–114. [Google Scholar] [CrossRef] [Green Version]
  43. Sokolovskiy, S.; Rocken, C.; Schreiner, W.; Hunt, D. On the uncertainty of radio occultation inversions in the lower troposphere. J. Geophys. Res. Atmos. 2010, 115, 56. [Google Scholar] [CrossRef]
  44. Hocke, K.; Tsuda, T. Gravity waves and ionospheric irregularities over tropical convection zones observed by GPS/MET radio occultation. Geophys. Res. Lett. 2001, 28, 2815–2818. [Google Scholar] [CrossRef] [Green Version]
  45. Mlynczak, M.G. Energetics of the mesosphere and lower thermosphere and the SABER experiment. Adv. Space Res. 1997, 20, 1177–1183. [Google Scholar] [CrossRef]
  46. Savitzky, A.; Golay, M.J.E. Smoothing and Differentiation of Data by Simplified Least Squares Procedures. Anal. Chem. 1964, 36, 1627–1639. [Google Scholar] [CrossRef]
  47. John, S.R.; Kumar, K.K. TIMED/SABER observations of global gravity wave climatology and their interannual variability from stratosphere to mesosphere lower thermosphere. Clim. Dyn. 2012, 39, 1489–1505. [Google Scholar] [CrossRef]
  48. Torrence, C.; Compo, G.P. A Practical Guide to Wavelet Analysis. Bull. Am. Meteorol. Soc. 1998, 79, 61–78. [Google Scholar] [CrossRef]
  49. Yasyukevich, Y.V.; Kiselev, A.V.; Zhivetiev, I.V.; Edemskiy, I.K.; Syrovatskiy, S.V.; Maletckii, B.M.; Vesnin, A.M. SIMuRG: System for Ionosphere Monitoring and Research from GNSS. GPS Solut. 2020, 24, 69. [Google Scholar] [CrossRef]
  50. Vadas, S.L. Horizontal and vertical propagation and dissipation of gravity waves in the thermosphere from lower atmospheric and thermospheric sources. J. Geophys. Res. 2007, 112, A06305. [Google Scholar] [CrossRef]
  51. Yue, J.; Hoffmann, L.; Joan Alexander, M. Simultaneous observations of convective gravity waves from a ground-based airglow imager and the AIRS satellite experiment. J. Geophys. Res. Atmos. 2013, 118, 3178–3191. [Google Scholar] [CrossRef] [Green Version]
  52. Astafyeva, E.; Lognonné, P.; Rolland, L. First ionospheric images of the seismic fault slip on the example of the Tohoku-oki earthquake. Geophys. Res. Lett. 2011, 38, 1–6. [Google Scholar] [CrossRef] [Green Version]
  53. Kherani, E.A.; Abdu, M.A.; Fritts, D.C.; de Paula, E.R. The Acoustic Gravity Wave Induced Disturbances in the Equatorial Ionosphere. In Aeronomy of the Earth’s Atmosphere and Ionosphere; IAGA Special Sopron Book Series; Springer: Dordrecht, The Netherlands, 2013; Volume 2, pp. 141–162. [Google Scholar] [CrossRef]
  54. Vadas, S.L.; Makela, J.J.; Nicolls, M.J.; Milliff, R.F. Excitation of gravity waves by ocean surface wave packets: Upward propagation and reconstruction of the thermospheric gravity wave field. J. Geophys. Res. Space Phys. 2015, 120, 9748–9780. [Google Scholar] [CrossRef]
  55. Liu, J.Y.; Lin, C.Y.; Tsai, Y.L.; Liu, T.C.; Hattori, K.; Sun, Y.Y.; Wu, T.R. Ionospheric GNSS Total Electron Content for Tsunami Warning. J. Earthq. Tsunami 2019, 13, 1941007. [Google Scholar] [CrossRef]
  56. Occhipinti, G.; Coïsson, P.; Makela, J.J.; Allgeyer, S.; Kherani, A.; Hébert, H.; Lognonné, P. Three-dimensional numerical modeling of tsunami-related internal gravity waves in the Hawaiian atmosphere. Earth Planets Space 2011, 63, 847–851. [Google Scholar] [CrossRef] [Green Version]
  57. Klobuchar, J.A. Ionospheric Time-Delay Algorithm for Single-Frequency GPS Users. IEEE Trans. Aerosp. Electron. Syst. 1987, AES-23, 325–331. [Google Scholar] [CrossRef]
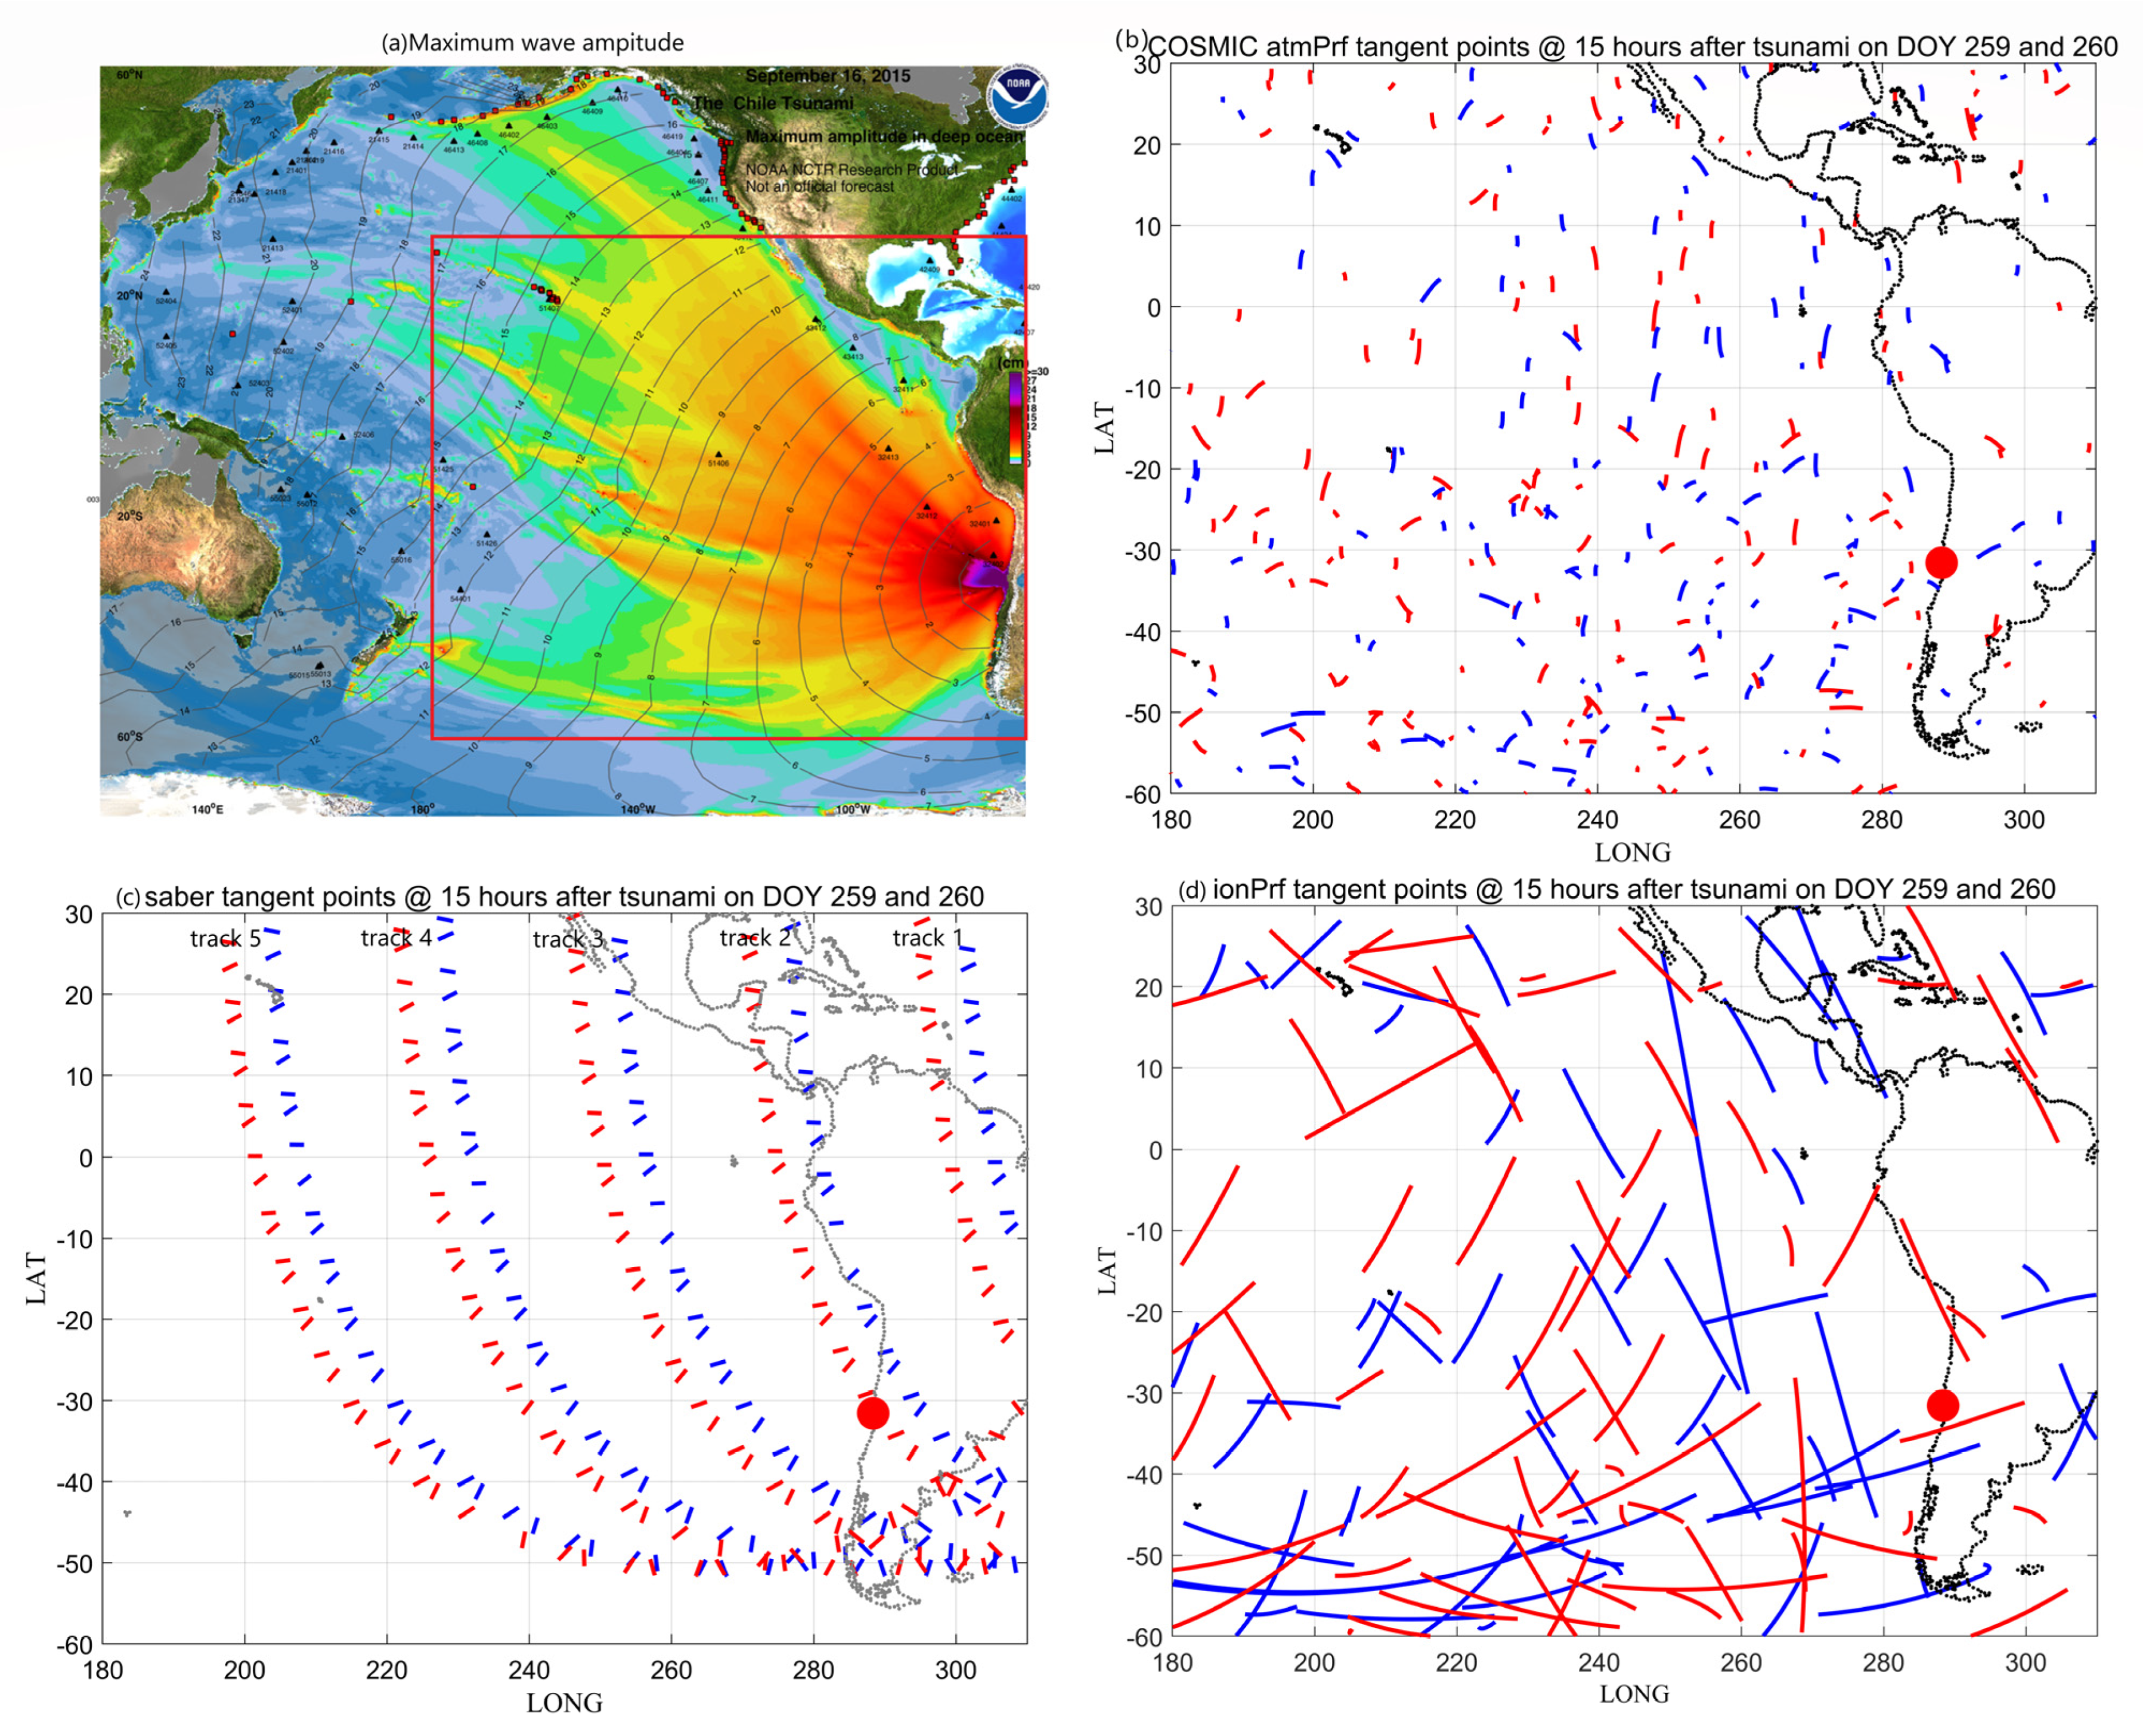
Figure 1. Data sources of the 16-09-2015 Chile tsunami. (a) Maximum wave amplitude with travel-time contours of the tsunami. Filled colors show the maximum computed tsunami amplitude in cm during 24 h of wave propagation (https://nctr.pmel.noaa.gov/chile20150916/ (accessed on 1 July 2022)). The red rectangular box marks the main focus area of this study. (bd) The projections of the tangent points 15 h after the tsunami for the F3/C atmPrf, SABER, and F3/C ionPrf datasets, respectively. Blue and red curves mark the ground track of the tangent point location on DOY 259 and 260 of 2015, respectively. The thick red point shows the epicenter.
Remotesensing 14 05543 g001
Figure 2. Same as Figure 1 but for the 11-03-2011 Tohoku tsunami. The maximum wave amplitude with travel-time contours of the tsunami in (a) is from https://nctr.pmel.noaa.gov/honshu20110311/ (accessed on 1 July 2022).
Remotesensing 14 05543 g002
Figure 3. (a) Temperature profiles detected by the F3/C atmPrf datasets on DOY 259 (blue) and 260 (red) of 2015. (b) The corresponding temperature perturbation profiles. (c) The corresponding wavelet power spectrum differences between DOY 259 and 260 of 2015.
Remotesensing 14 05543 g003
Figure 4. (a) Temperature profiles detected by the SABER datasets on DOY 259 (blue) and 260 (red) of 2015. (b) The corresponding temperature perturbation profiles. (c) The corresponding wavelet power spectrum differences between DOY 259 and 260 of 2015.
Remotesensing 14 05543 g004
Figure 5. (a) Electron density profiles detected by the F3/C ionPrf datasets on DOY 259 (blue) and 260 (red) of 2015. (b) The corresponding electron density perturbation profiles. (c) The corresponding wavelet power spectrum differences between DOY 259 and 260 of 2015.
Remotesensing 14 05543 g005
Figure 6. The wavelet power spectrum differences between DOY 69 and 70 of 2011 of (a) temperature profiles detected by the F3/C atmPrf datasets, (b) temperature profiles detected by the SABER datasets, and (c) electron density profiles detected by the F3/C ionPrf datasets.
Remotesensing 14 05543 g006
Figure 7. (a) Ground-based GNSS dTEC map at 01:54 UT, 17−09−2015. The TEC data is provided by SIMuRG (https://simurg.iszf.irk.ru/ (accessed on 22 October 2022)) [49]. The pale blue area marks the contributing observation area of an RO podTec profile, which is used to track the wavefront after the 2015-09-16 earthquake/tsunami. Red curves represent the projections of the tangent points for the podTec profile. (b) The TEC profile in (a) with height probed by the F3/C. The blue arrow indicates a descending or ascending scan. The red curve shows the detrended TEC using a Savitzky–Golay filter. The Y-axis scale on the right panel indicates the hours after the tsunami. (c) The corresponding WPS. The magenta contour is at the 95% confidence level. The regions outside the black curve are the “cone of influence”, where edge effects become important.
Remotesensing 14 05543 g007
Figure 8. (a) Data used to track the wavefront after the 2011-03-11 earthquake/tsunami. Red curves represent the projections of the tangent points for F3/C profiles P1, P2, and P3, respectively. The magenta triangles mark the tangent points at a height of 300 km. See details about the ground-based GNSS data observations in the supplementary materials. Panels (b,d,f) show the TEC profiles P1, P2, and P3 with height probed by the F3/C, respectively. Panels (c,e,g) show the corresponding WPS for the three TEC profiles, respectively. The legends in the figure are similar to those in Figure 7.
Remotesensing 14 05543 g008
Figure 9. The observed vertical perturbation scales (blue dots mark the 2015 case and black dots mark the 2011 case) and the fitted curve (red line marks the 2015 case and pink line marks the 2011 case) with 95% confidence bounds (dashed lines).
Remotesensing 14 05543 g009
Figure 10. (a) The projections of the tangent points 5 h after the tsunami for the F3/C ionPrf dataset. Blue and red lines mark the ground track of the tangent point location on DOY 259 and 260 of 2015, respectively. The thick red point shows the epicenter. (b) The corresponding wavelet power spectrum differences between DOY 259 and 260 of 2015.
Remotesensing 14 05543 g010
Figure 11. (a) The projection of the tangent points of track 3 on DOY 260 of 2015. The color denotes the observation time. (b) SABER temperature perturbations that are made by a 2−D cubic interpolation in altitude and latitude over the coherent variations of limb scans of track 3. (c) The corresponding wavelet power spectrum of track 3.
Remotesensing 14 05543 g011
Figure 12. (ac) The tsunami waves (http://nctr.pmel.noaa.gov/chile20150916/ (accessed on 1 July 2022)) at three adjacent moments (7h56m, 7h58m, and 8h00m), the red arrows represent the four observations (7h57m, 7h58m, 7h59m, and 8h00m) of SABER closest to the above three moments. (d) Panels from left to right record the temperature perturbations at seven different moments, respectively.
Remotesensing 14 05543 g012
Figure 13. (a) The tsunami waves (http://nctr.pmel.noaa.gov/chile20150916/ (accessed on 1 July 2022)) at 09h40m, the red arrows represent the projections of the tangent point of ten observations by SABER around the above moment. (b) Panels from left to right correspond to the temperature perturbations of the ten observations from top to bottom in (a), respectively.
Remotesensing 14 05543 g013
Table 1. The cover height and the numbers of profiles for the three datasets in this study.
atmPrfSABERionPrf
10–55 km16–107 km120–550 km
16-09-2015 eventDOY 260DOY 259DOY 260DOY259DOY 260DOY 259
1691571531416562
11-03-2011 eventDOY 070DOY 069DOY 070DOY 069DOY 070DOY 069
2081946669141130
Publisher’s Note: MDPI stays neutral with regard to jurisdictional claims in published maps and institutional affiliations.