Abstract
Bistatic synthetic aperture radar (BiSAR) has drawn increasing attention in recent studies benefiting from its ability for forward-looking imaging, its capability of receiver radio silence and its resistance to jamming. However, the motion trajectory error compensation of BiSAR is a challenging task due to multiple error sources and complex effects. In this paper, an estimation and compensation method for three-dimensional (3D) motion trajectory error of BiSAR is proposed. In this method, the Doppler error of multiple scattering points is estimated firstly by using the time–frequency analysis method. Next, a local autofocus process is introduced to improve the Doppler error estimation accuracy. Then, the 3D trajectory error of BiSAR is estimated by solving a series of linear equations of the trajectory error and the Doppler error with the least squares method, and a well-focused BiSAR image is produced by using the corrected 3D trajectories. Finally, simulation and experiment results are presented to demonstrate the effectiveness of the proposed method.
1. Introduction
Bistatic synthetic aperture radar (SAR) systems, whose transmitters and receivers are installed on different spatial-separated platforms, have many advantages, such as the ability of forward-looking imaging, the capability of receiving platform radio silence and resistance to jamming [1,2,3], and have been receiving increasing attention in recent studies. However, this spatial separation brings new challenges, such as problems of bistatic SAR (BiSAR) motion error compensation [1,2,3].
Compared with monostatic SAR (MonoSAR) systems, every moving platform of BiSAR may deviate from their expected trajectories. As a result, amplitude of bistatic range error introduced by BiSAR motion error could noticeably exceed the system range resolution cells, and both envelope error (cross-cell range cell migration (RCM) error) and phase error could be introduced [4,5,6,7]. Moreover, affected by the bistatic geometry configuration, the spatial variance of BiSAR motion error is relatively more severe than MonoSAR [8], especially under forward-looking [9,10] or translational-variant [6,11] conditions.
In ideal circumstances, BiSAR motion error could be compensated for by using the positioning data acquired from the motion sensors [12,13], such as inertial measurement instruments [14] or satellite positioning equipment [15]. However, the accuracy of these instruments is limited in real practice, and it is difficult to use them to meet the requirement of SAR imaging quality [6,7]. Moreover, high-cost or heavy positioning instruments are unlikely to be carried in many cases, such as SAR mounted on UAV platforms [16,17]. Hence, data-driven motion error compensation methods, which are usually called as autofocus methods, are needed to enhance the quality of BiSAR images [18,19].
Several studies on autofocus have recently been presented to compensate for the motion error [18], such as the map drift (MD) methods [20], phase gradient autofocus (PGA) methods [21,22] or methods that find the azimuth phase error (APE) under the criteria of optimizing a particular image quality function [23] (such as sharpness [24,25], contrast [26,27] or entropy [28,29]). However, these methods cannot compensate for the cross-cell RCM error or spatial-variant motion error, and their performance will be especially affected when the motion error is severe or the bistatic geometry configuration is complex [10,18].
In some studies, the cross-cell RCM error induced by a SAR motion error is termed as non-systematic RCM (NsRCM) [4,5,6]. Some studies compensate for this kind of error in the middle of the SAR imaging procedure, such as methods combined with the time-domain algorithms [6], wavenumber-domain algorithms [30,31] or frequency-domain algorithms [4]. However, during the SAR imaging process, NsRCM could be affected or amplified, and this kind of error may noticeably exceed the range resolution cells, even if the actual magnitude of the SAR motion error is slight. As a result, the intrinsic NsRCM in the original BiSAR echo, as well as the NsRCM additionally induced by the BiSAR imaging process, have to be taken into account by these motion error compensation methods. To overcome this problem, some studies compensate for the NsRCM before the imaging process, and the cross-cell RCM error could be eliminated from the raw BiSAR echo [7,32]. However, two-dimensional (2D) spatial variance of the BiSAR motion error has not been fully considered.
To compensate for the spatial variance of motion error, several studies have been published. For range-variant motion error, the improved conventional autofocus methods [33,34] and the two-step methods [35,36,37] have been developed, but these methods are difficult to apply for the compensation of the azimuth-variance of motion error [18]. To cope with this problem, a cubic-order process was introduced in [8], but a complicated high-dimensional data matrix is required. Sub-aperture or sub-image methods were introduced in [38,39], but alignment and the splicing problem need to be handled carefully. Studies in [11,40] deduced the relationship between the one-dimensional (1D) phase error, residual RCM and 2D phase error in wavenumber-domain imaging algorithms, but a second-order Taylor series expansion would limit the compensation accuracy.
Another kind of method is to directly estimate the three-dimensional (3D) trajectory error, and both the 2D spatial-variant RCM and phase error could be deduced directly from the estimated error trajectories. Meanwhile, the error trajectories estimated by this kind of method could be directly applied to correct the 3D trajectories used in conventional imaging algorithms. Studies in [41] estimated monostatic SAR 3D trajectory error by solving equations of the position error and local phase error of multiple local subimages. However, since the local phase error is estimated through conventional autofocus methods, the linear terms of phase error, which usually do not affect the focusing quality of SAR images, may not be precisely estimated [19].
In this paper, a bistatic SAR motion trajectory error estimation and compensation method is proposed. Firstly, the Doppler error of a number of scattering points is estimated by using the time–frequency analysis method. Next, a local autofocus process is introduced to improve the Doppler error estimation accuracy. Then, more accurate positions of selected scatters are estimated through local motion compensation and imaging process. Finally, the 3D trajectory error of bistatic SAR is estimated by solving a series of linear equations of trajectory error and all previous estimation results with the least squares method, and a well-focused BiSAR image can be achieved by correcting the 3D trajectories.
This paper is arranged as follows. In Section 2, the relationship between the BiSAR Doppler error and the BiSAR 3D trajectory error is given. In Section 3, an estimation and compensation method for BiSAR motion trajectory error is presented in detail. In Section 4, simulation and experiment results and corresponding discussions are illustrated for verifying the effectiveness of this study. Finally, a summary of this paper is provided in Section 5.
2. Trajectory Error in BiSAR
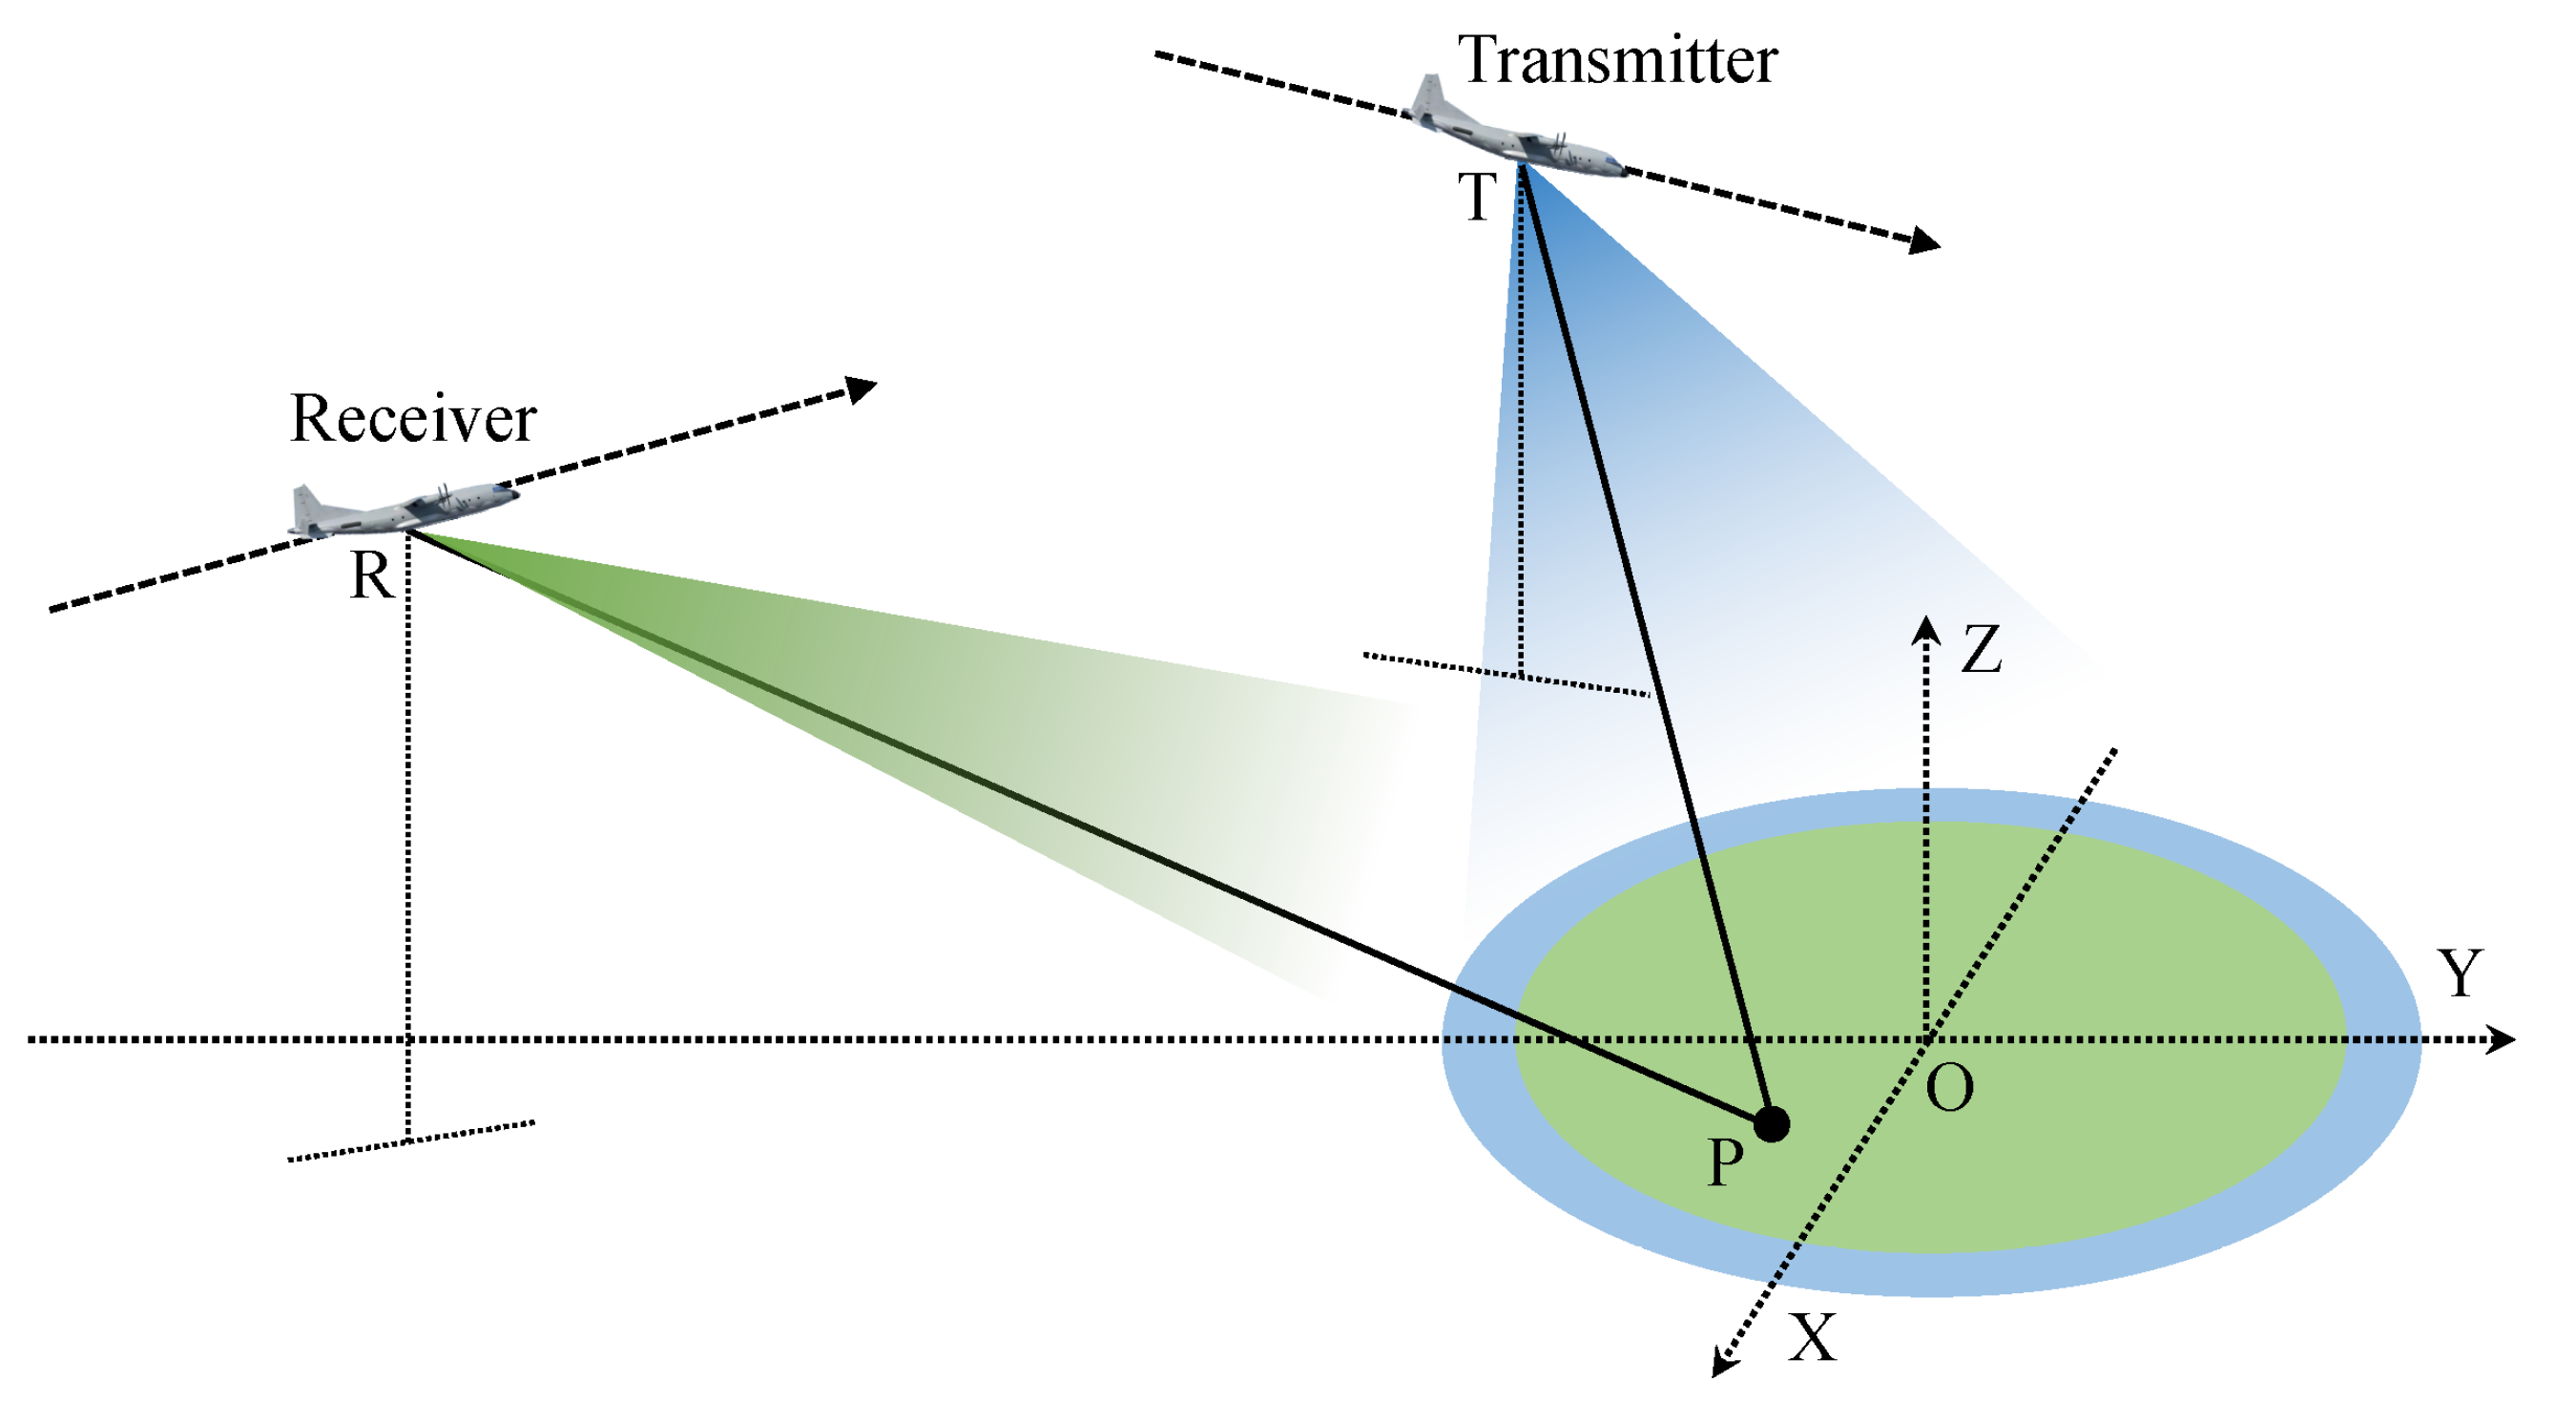
The general geometry of BiSAR is illustrated in Figure 1. Setting the slow time (azimuth time) variable as , the ideal position vectors without motion error of transmitter and receiver could be represented as and , respectively. For a random point target in the image scene, the ideal instant slant range from this point to the transmitter and receiver without motion error could be represented as and , respectively. The instant two-way range of this point can be written as .
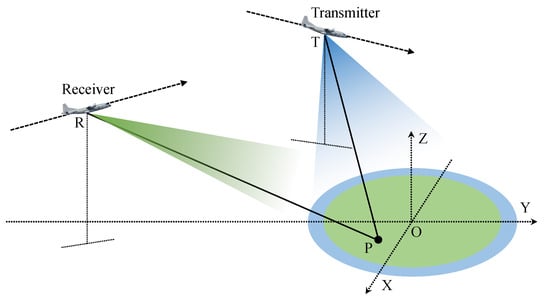
Figure 1.
General BiSAR geometry.
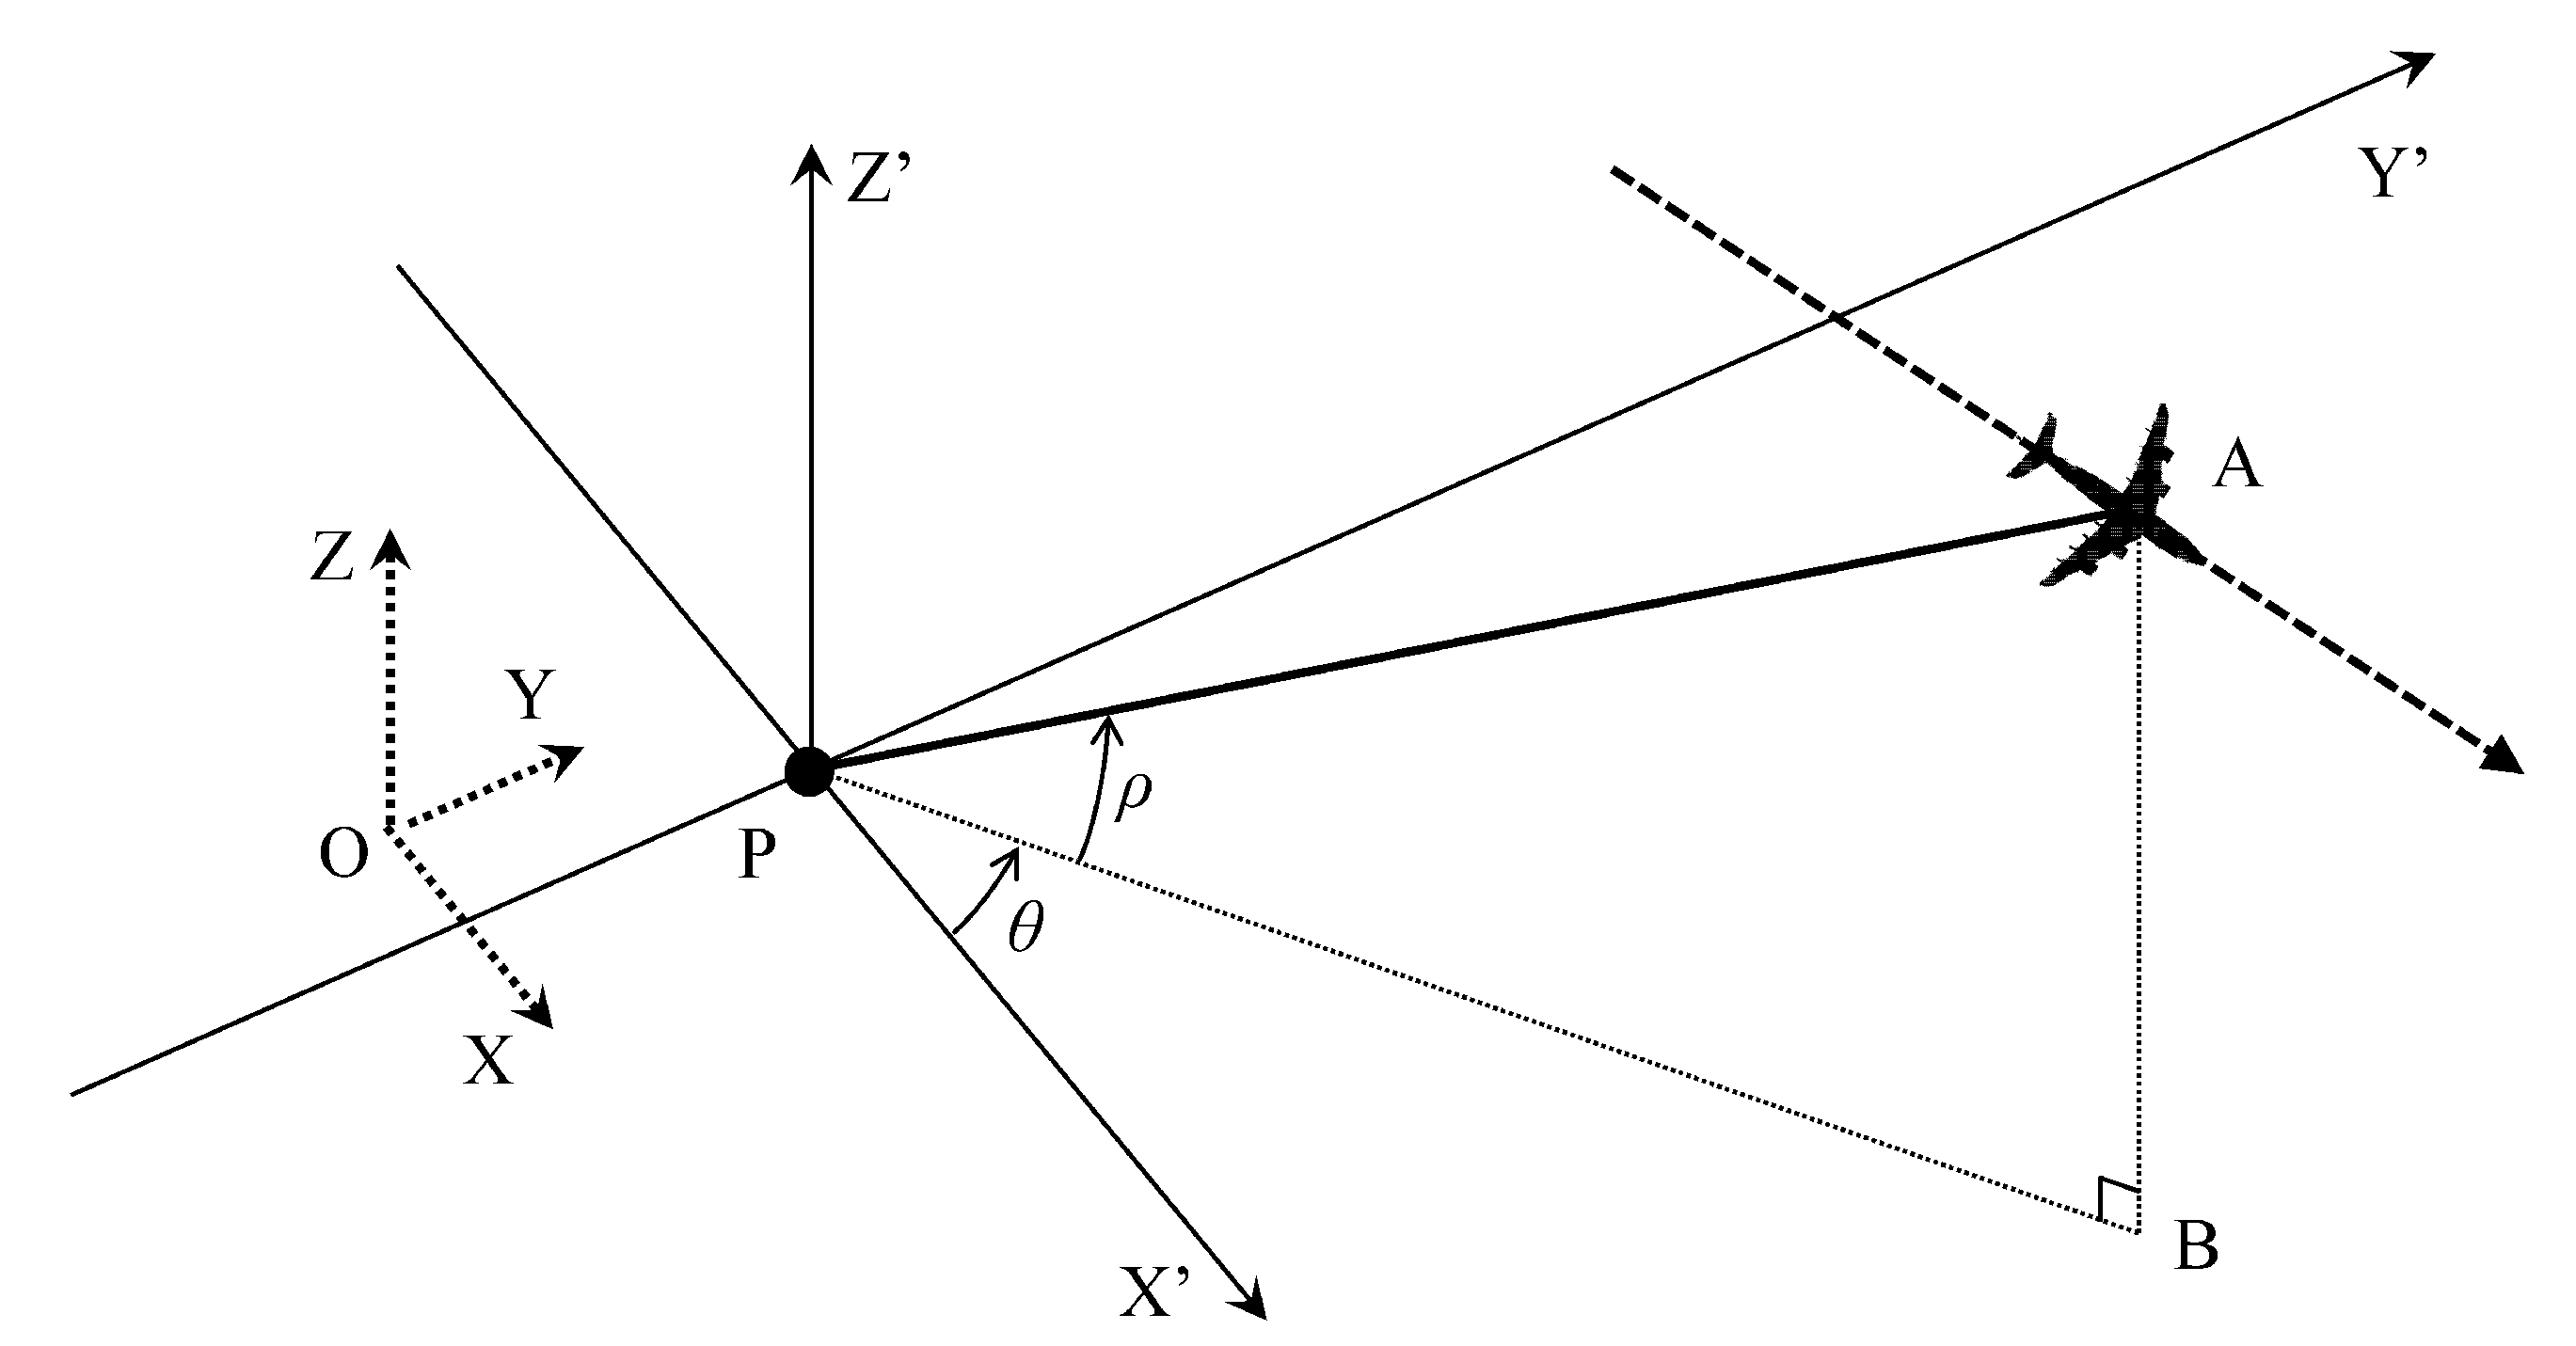
Letting be the carrier frequency of the transmitted BiSAR signal and c the speed of light, the instant Doppler at slow time of target P can be expressed as , where and refer to the projection velocities along the line-of-sight (LOS) directions from point P to the transmitter and receiver, respectively. Notice that and . For a better explanation of the geometry relationship, one arbitrary station of transmitter and receiver is taken as an example, and its geometry is shown in Figure 2. The LOS vector of point P is . The projection of onto horizontal plane is . The angle between and x direction is defined as , and the elevation angle between and horizontal plane is defined as . For transmitter and receiver, these two angles are defined as , and , , respectively. Setting the instant velocity of the transmitter and the receiver as and , the LOS velocity of the target P to the transmitter and receiver could be calculated as:
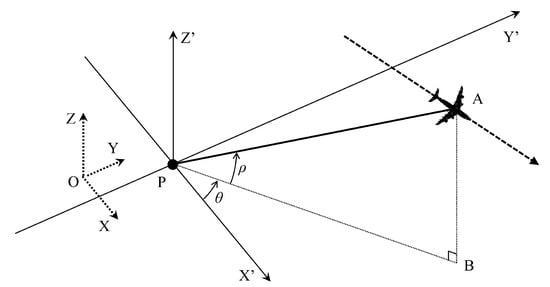
Figure 2.
Geometry of one arbitrary station of BiSAR.
Under practical conditions, motion error is inevitable in bistatic SAR system. The position error vectors of transmitter and receiver could be represented as and , and the corresponding velocity error vectors could be represented as and , respectively. Considering the bistatic SAR echo of point P, the instant Doppler frequency error of which can be derived as:
Considering multiple point target , at azimuth time , the relationship between the Doppler frequency error of the bistatic SAR echo of each point and the bistatic velocity error could be represented as a linear equation as:
where
Notice that angle in (4) are variables of azimuth time .
From the above analysis, the relationship between the 3D velocity error and the Doppler error of BiSAR could be presented as linear equations, where the BiSAR 3D velocity error is the derivative of the BiSAR 3D trajectory error.
3. Method of Trajectory Error Estimation and Compensation
From the analysis of the previous section, if the Doppler error of the BiSAR echo could be estimated, the 3D velocity error at every azimuth time of transmitter and receiver could then be estimated by solving the linear Equation (3), and the 3D trajectory error of the transmitter and the receiver could be estimated by integrating the 3D velocity error estimation result. Based on this idea, the detailed procedures of the bistatic trajectory error estimation and compensation method is discussed in this section.
3.1. Azimuth Signal Extraction
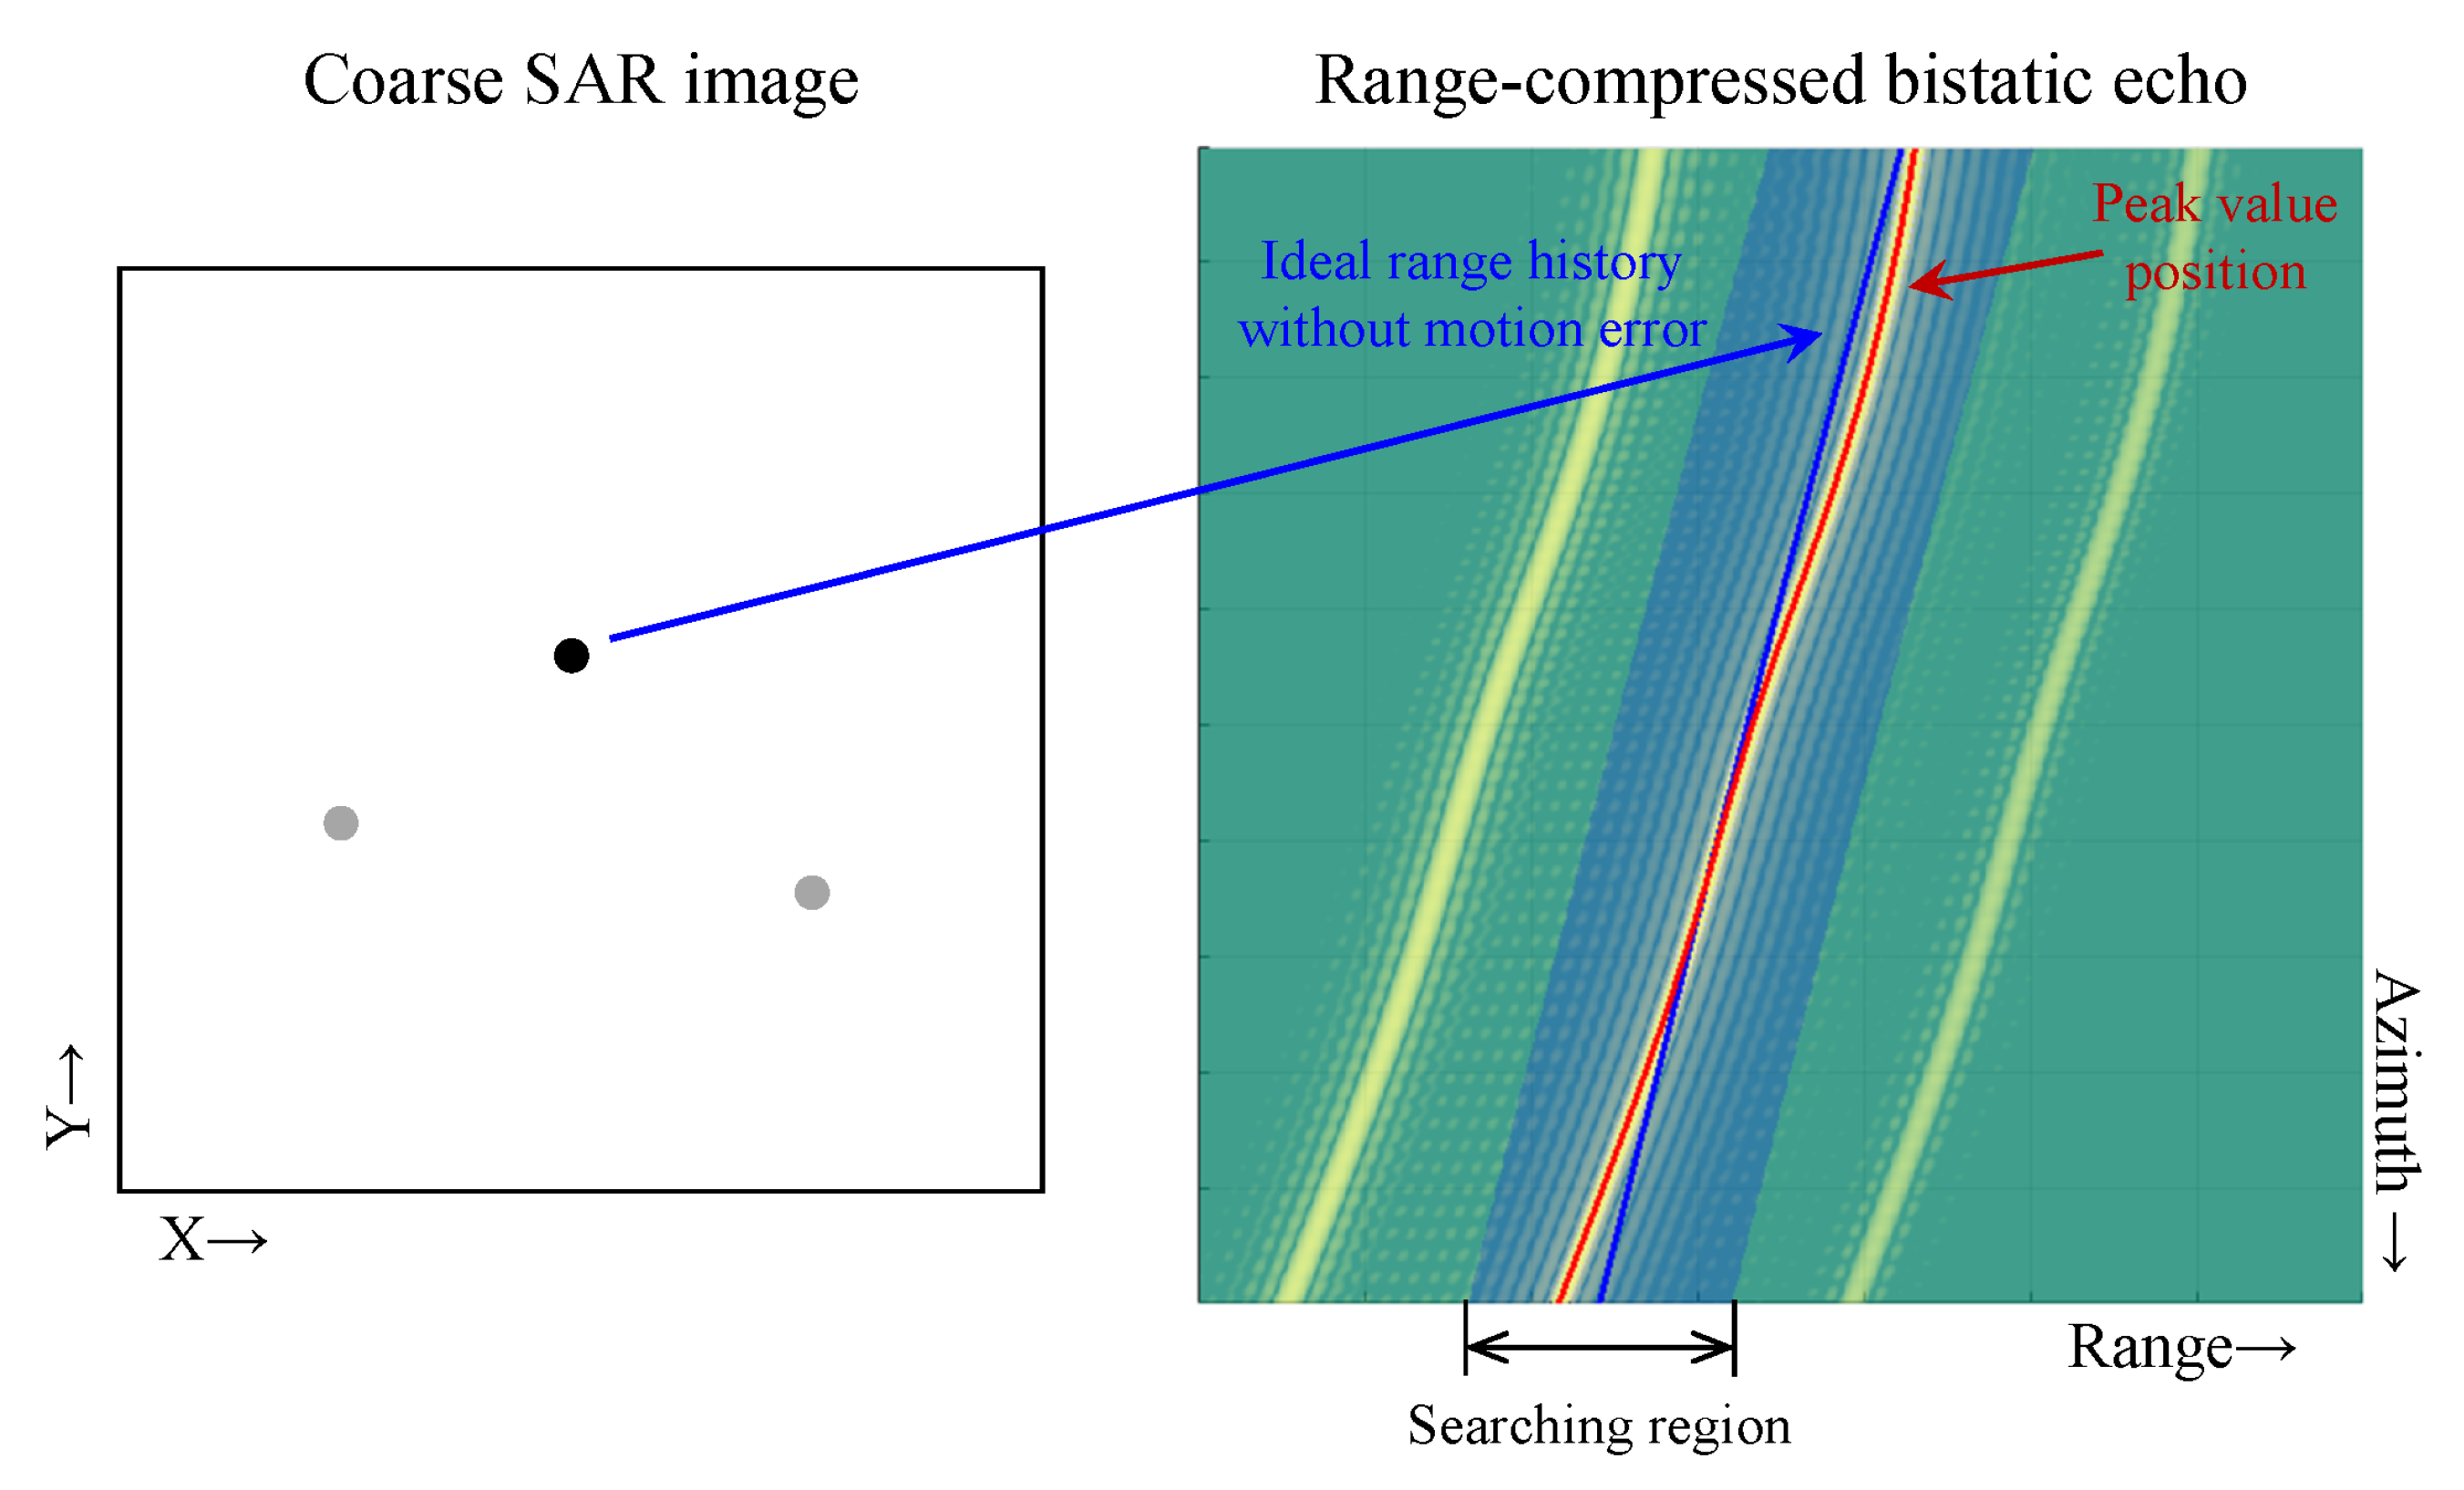
For estimating the Doppler error of a scattering point, the azimuth signal of this scatter should be extracted at first. This could be achieved by extracting the data from the peak positions of this scattering point along the RCM trajectory from the range-compressed bistatic SAR echo , where refers to the fast time (range time) variable. For the implementation of azimuth signal extraction, an inverse backprojection (IBP) procedure is introduced in this subsection, which is illustrated in Figure 3.
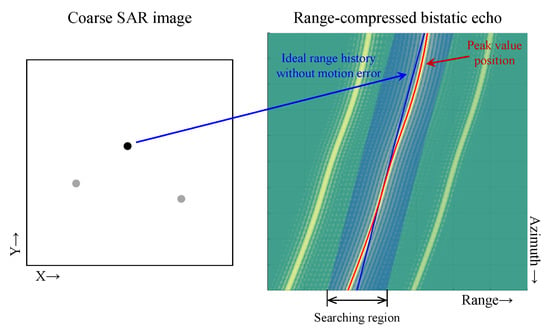
Figure 3.
Azimuth signal extraction by IBP.
Firstly, a coarse bistatic SAR image without motion compensation could be acquired by using conventional imaging algorithms, and the position of n-th scattering point could be coarsely estimated from the x-y coordinate of the peak position in the coarse bistatic SAR image. Assuming that the estimated coarse position vector of n-th scattering point is , the bistatic range history without motion error of n-th scattering point could be coarsely calculated from the preset system geometry parameters as (5), which is shown as the blue line in Figure 3.
Secondly, the actual RCM trajectory affected by the BiSAR motion error could be extracted by finding the peak positions of every azimuth bin near the ideal RCM trajectory within the preset searching region. The preset searching region is shown as the blue area, and the peak trajectory is illustrated as the red line in Figure 3. Extracting the range-compressed data along the peak trajectory, the azimuth signal of n-th scattering point could be acquired as , where is the corresponding range history of the peak trajectory.
Similarly, performing the proposed steps to all the selected scattering points, the azimuth signal of multiple scattering points could be extracted for subsequent procedures. Moreover, the criteria of scatter selection should be considered in real practice. The strong scattering points are recommended to be chosen for guaranteeing the signal-to-noise ratio (SNR) of the extracted azimuth signal, which is important for the subsequent Doppler error estimation using the Morlet wavelet transform and the maximum sharpness autofocus. Meanwhile, the relative location of the selected strong scattering points should be distributed over a wide range of scenes to ensure the uncorrelation of the coefficient matrix in (3). In general, the widely distributed strong point targets are recommended to be selected for estimation.
3.2. Doppler Error Estimation
To estimate the Doppler error of each scattering point from the azimuth signal, a straightforward approach is using time–frequency analysis methods. One of the best-known methods is the short-time Fourier transform (STFT) [7]; however, STFT has inherent contradictions between the frequency resolution and the time resolution, and the accuracy of Doppler frequency estimation by STFT is limited [42]. Another widely used time–frequency analysis method is the Wigner–Ville distribution (WVD) [43]. However, motion error of bistatic SAR is usually random and the corresponding Doppler error is multi-component. Under this condition, the result of the WVD will be affected by severe cross-items [7]. Some other methods are proposed to suppress the cross-items, such as the Zhao–Atlas–Marks (ZAM) distribution and the Choi–Williams distribution (CWD) [42], but the performance is limited.
In this subsection, the Morlet wavelet transform is introduced to estimate the Doppler error of each scattering point, which could achieve better resolution than STFT and will not suffer from cross items [44]. The Morlet wavelet transform is defined as:
where is the input signal, and s and u refer to the scale and translation parameters, which reflect the frequency and time properties of the input signal, respectively. The transformation relationship from the Morlet wavelet transform result to the time–frequency domain can be found in wavelet transform textbooks [44]. Here, refers to the mother wavelet of the Morlet wavelet transform. Setting the central frequency of the mother wavelet as , is written as [44]:
By performing the Morlet wavelet transform to the azimuth signal of the n-th scattering point extracted in the previous step, the Doppler history of the n-th scattering point could be estimated as .
According to (5), the Doppler history of the n-th scattering point without the SAR motion error could be computed from the pre-set system parameters as:
and the Doppler error of the n -th scattering point induced by the bistatic motion error could be estimated as:
Similarly, performing the proposed steps to all the selected scatters, the Doppler error of every scatter could be estimated for subsequent procedures.
3.3. Cascading Autofocus for Further Doppler Error Estimation
To enhance the performance of the Doppler error estimation of each scatter, an additional autofocus process is introduced after the estimation procedure of the Morlet wavelet transform in this subsection. The autofocus method is independently performed for every local image of the small neighbourhood areas around the selected scattering points, where the spatial-variant effect of the BiSAR motion error could be neglected in each local image.
Before performing each local autofocus procedure, the cross-cell RCM error and a majority part of the APE could be compensated for by using the Doppler error estimated by the Morlet wavelet transform. Based on the Doppler error estimated in (9), the range error of the n-th scattering point induced by the bistatic motion error could be estimated as:
For each local image around the n-th selected scattering point, the cross-cell RCM error could be compensated for by multiplying a series of linear phase terms to every azimuth bin of the range-frequency domain BiSAR echo. Setting the range-frequency variable as , these phase terms could be deduced as (11). This process is similar to the time-domain RCM correction (RCMC) process used in some studies [45].
Next, the APE could be compensated for by multiplying (12) to the 2D time-domain BiSAR echo along the slow-time (azimuth) direction:
After the cross-cell RCM error and APE compensation by using the estimation result of the Morlet wavelet transform, the residual APE could be estimated by performing APE-estimation-based autofocus methods in the small neighbourhood area around the position of the selected scatter. In this subsection, an autofocus method based on iterative image sharpness optimization [25] is used. Since the majority part of the APE has been compensated for by using the estimation result of the Morlet wavelet transform, this maximum sharpness autofocus with a single iteration could achieve decent results in most cases. In addition, since the linear phase error will not visibly affect the image quality, the maximum sharpness autofocus method is insensitive to the linear term of APE, and the estimation result of this term is unreliable [19,41]. As a result, the linear term of the APE estimation result should be removed in this step. This could be achieved by performing a linear fitting operation to the unwrapped phase error estimation result and subtracting the fitted linear term from the phase error estimation result.
Setting the linear-term-removed residual APE of the n-th scattering point estimated by maximum sharpness autofocus as , the residual Doppler error of the n-th scattering point estimated by maximum sharpness autofocus could be deduced as:
and a more accurate BiSAR Doppler error estimation result of the n-th scattering point can be written as:
The in (3) at slow-time could be estimated as:
3.4. Scatter Position Estimation
Since the bistatic SAR image will defocus when there is a motion error, the x-y positions of scattering points obtained by finding the peak position in a bistatic SAR image without motion compensation are not accurate. As a result, the angle of every scattering point in (3) cannot be estimated precisely. To solve this problem, a series of local spatial-invariant motion compensations and imaging process for the small areas around the coarse positions of every scattering point could be introduced, and more accurate position estimation of every scattering point could be achieved by finding the peak position in each small image.
For estimating the accurate position of the n-th selected scatter, setting the pixels in the local small image around the coarse position of the corresponding scattering point as and the position vector of each pixel as , the range history calculated from the preset bistatic trajectories with motion error neglected for each pixel during conventional BP process could be represented as:
In the conventional BP process, the values of each pixel in the bistatic SAR image could be represented as:
Since the image area used for position estimation is small, the spatial variance of the BiSAR motion error can be basically neglected. By compensating for the bistatic range history used in conventional BP process with the estimation result of Morlet wavelet transform and autofocus process, both the RCM error and the phase error could be removed.
The bistatic range error of the n-th scattering point induced by the BiSAR motion error could be estimated as:
and the imaging result of the small area around the coarse position of the n-th selected scattering point through a modified BP process could be written as:
Since the imaging result of the modified BP process (19) is on the x-y plane, the position of the n-th scattering point could be estimated by searching the peak position in the local small image. Setting the position estimation result of the n-th scattering point as , the angle of the n-th scattering point of the transmitter and the receiver at slow-time could be estimated as:
where is the four-quadrant inverse tangent function [46]. Substituting (20) into (4), the in (3) at azimuth time could be estimated as .
3.5. 3D Trajectory Error Estimation
After all the above steps, the and in linear Equation (3) at azimuth time have been estimated. Since linear Equation (3) has six unknowns, at least the Doppler error of the six scattering points needs to be estimated. Meanwhile, the more samples of Doppler error of scattering points used, the better the estimation result of 3D velocity error will be. As a result, linear Equation (3) is a well-posed or over-determined equation, and the lease squares method is the most common method to solve this kind of equations [47]. The least squares problem could be written as:
The solution of this least squares problem could be written as [47]:
and the 3D velocity error of the transmitter and the receiver at every azimuth time could be estimated. The 3D trajectory error of the transmitter and the receiver could be estimated by integrating the 3D velocity error estimation results, which could be written as:
By correcting the bistatic SAR 3D trajectories of the transmitter and the receiver with the estimated trajectory error, a well-focused BiSAR image could be achieved by performing imaging algorithms which are suitable for arbitrary motion, such as time-domain imaging algorithms [48,49] or generalized wavenumber-domain imaging algorithms [50,51].
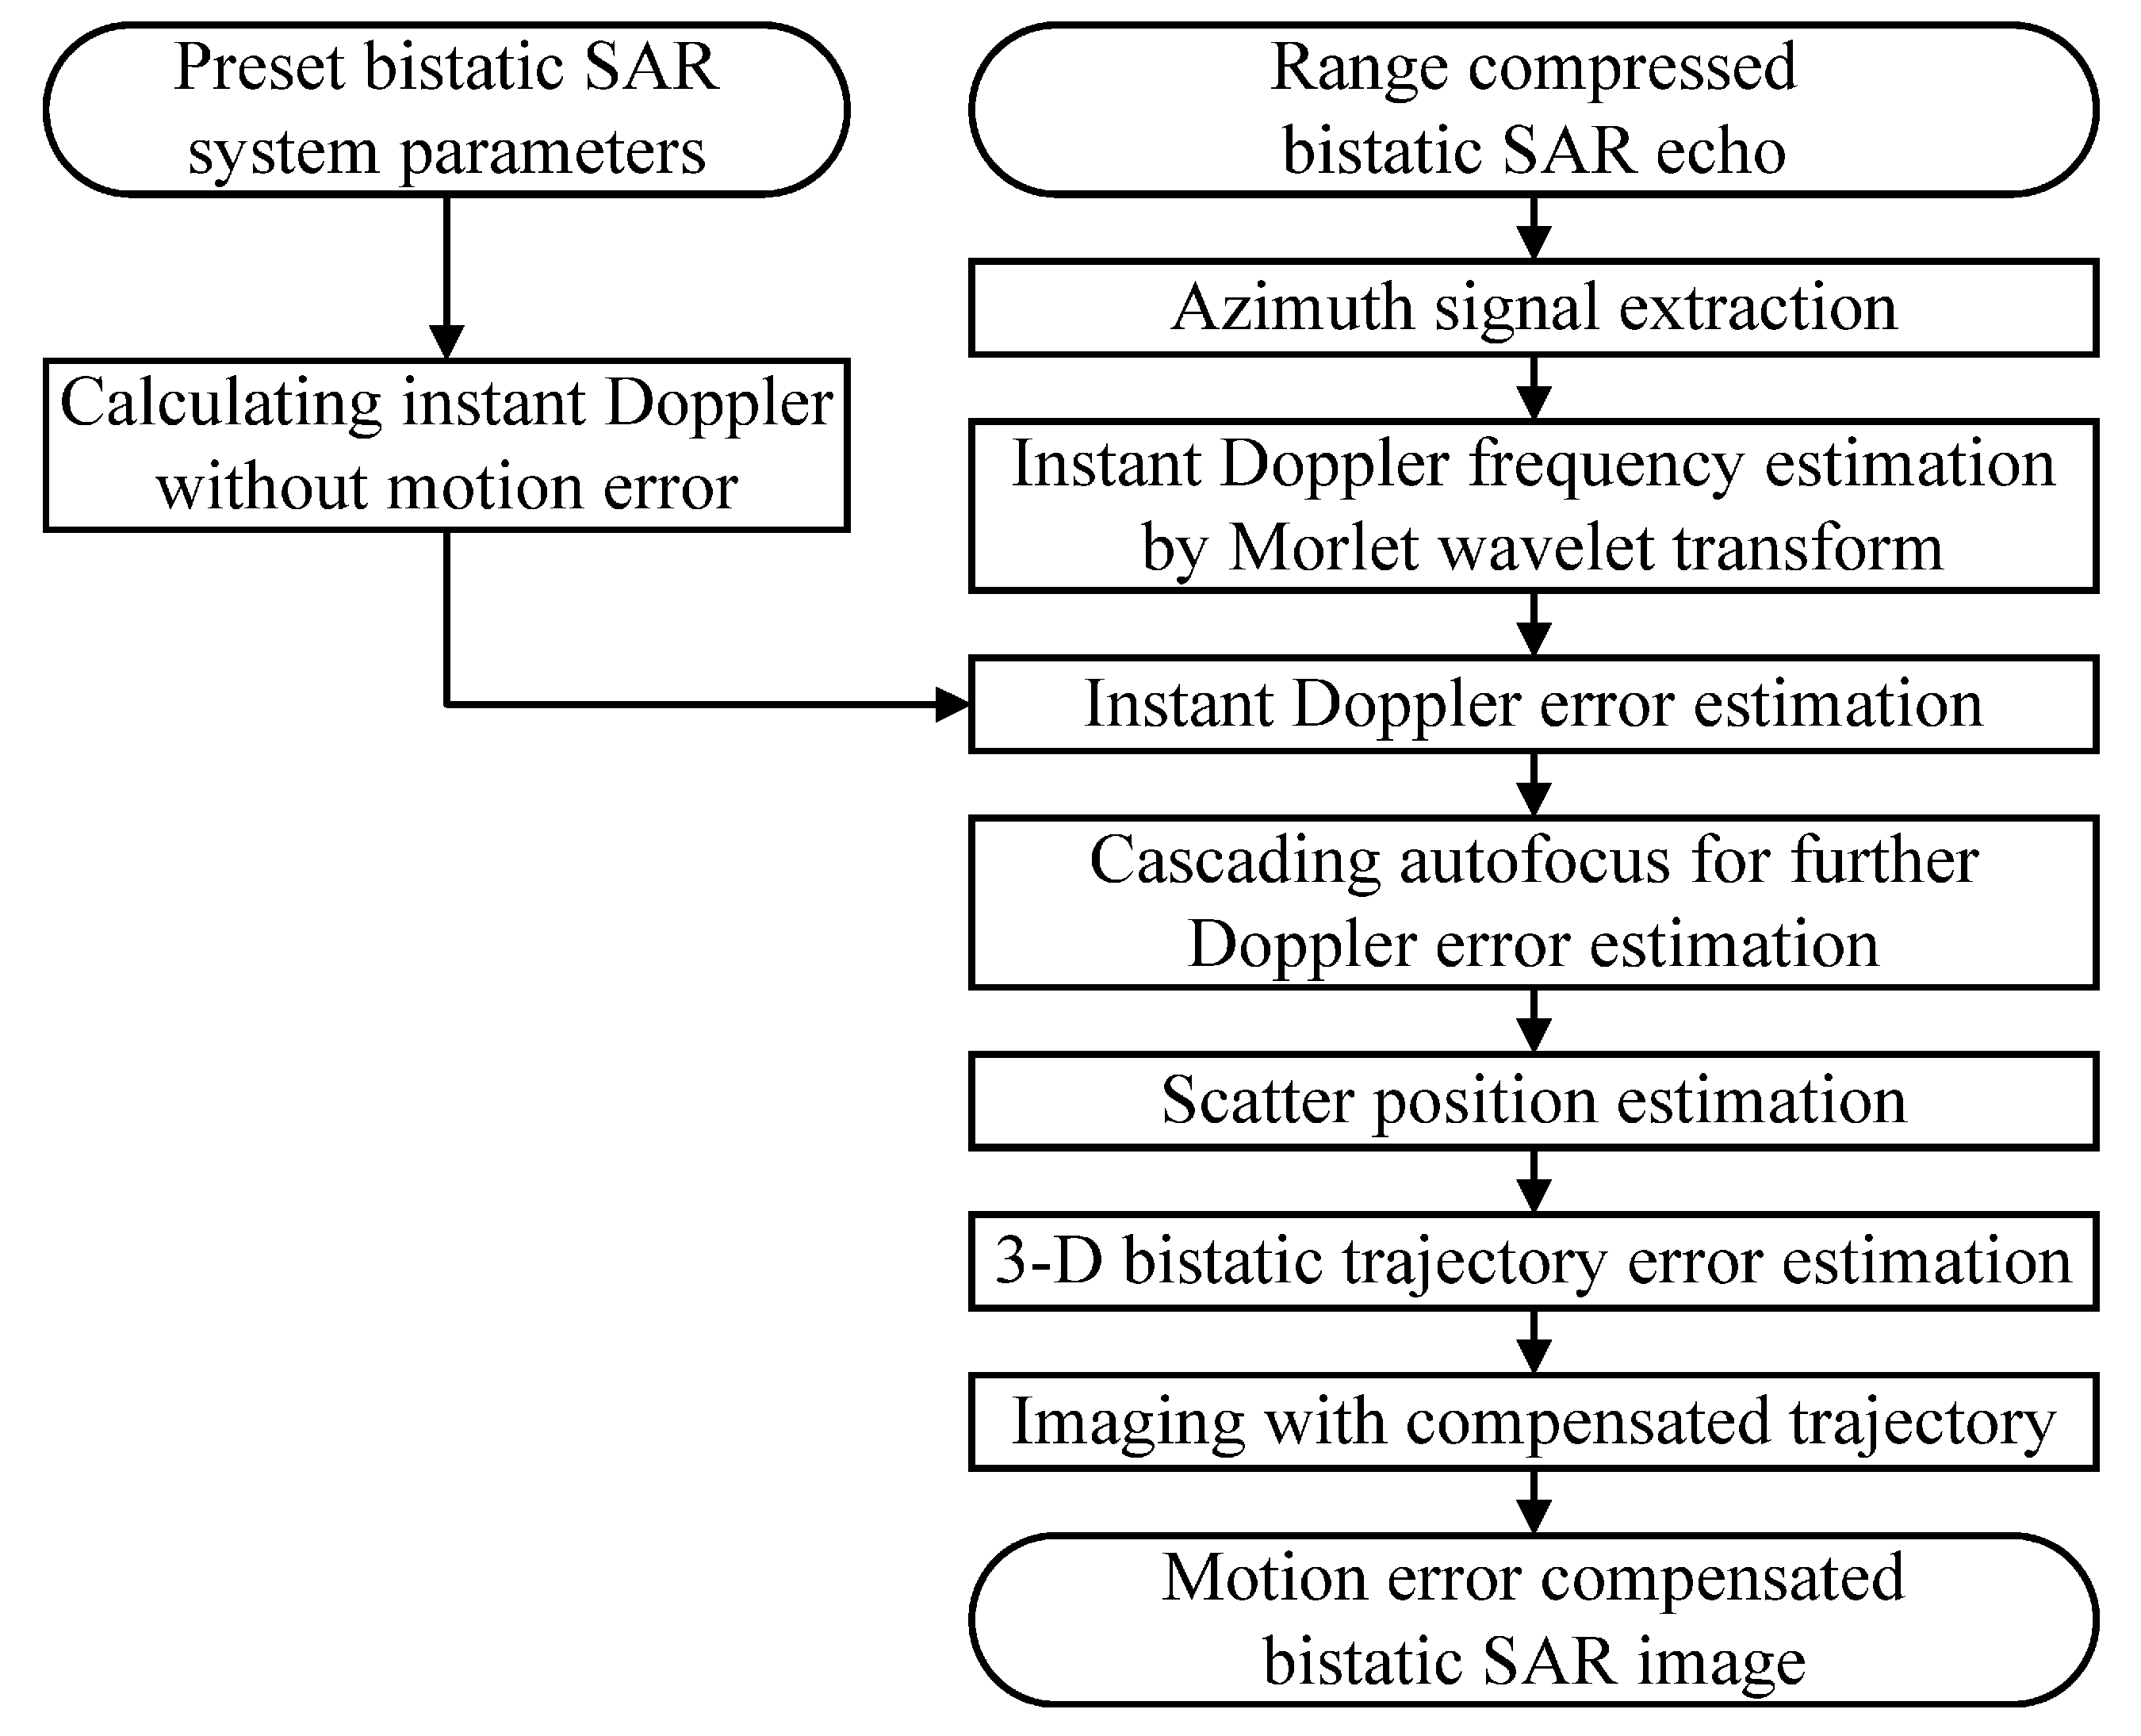
Depending on the descriptions above, the procedure of the proposed method in this paper is shown Figure 4.
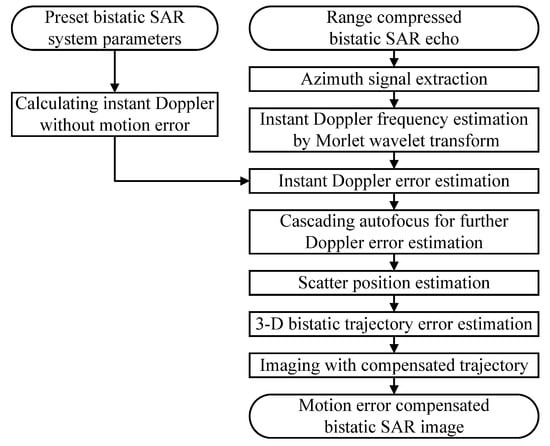
Figure 4.
Procedure of the proposed bistatic SAR trajectory error estimation and compensation method.
4. Simulation and Experiment Results
In this section, the simulation and experiment results are presented for demonstrating the effectiveness of the method proposed in this paper.
4.1. Simulation Results and Discussion
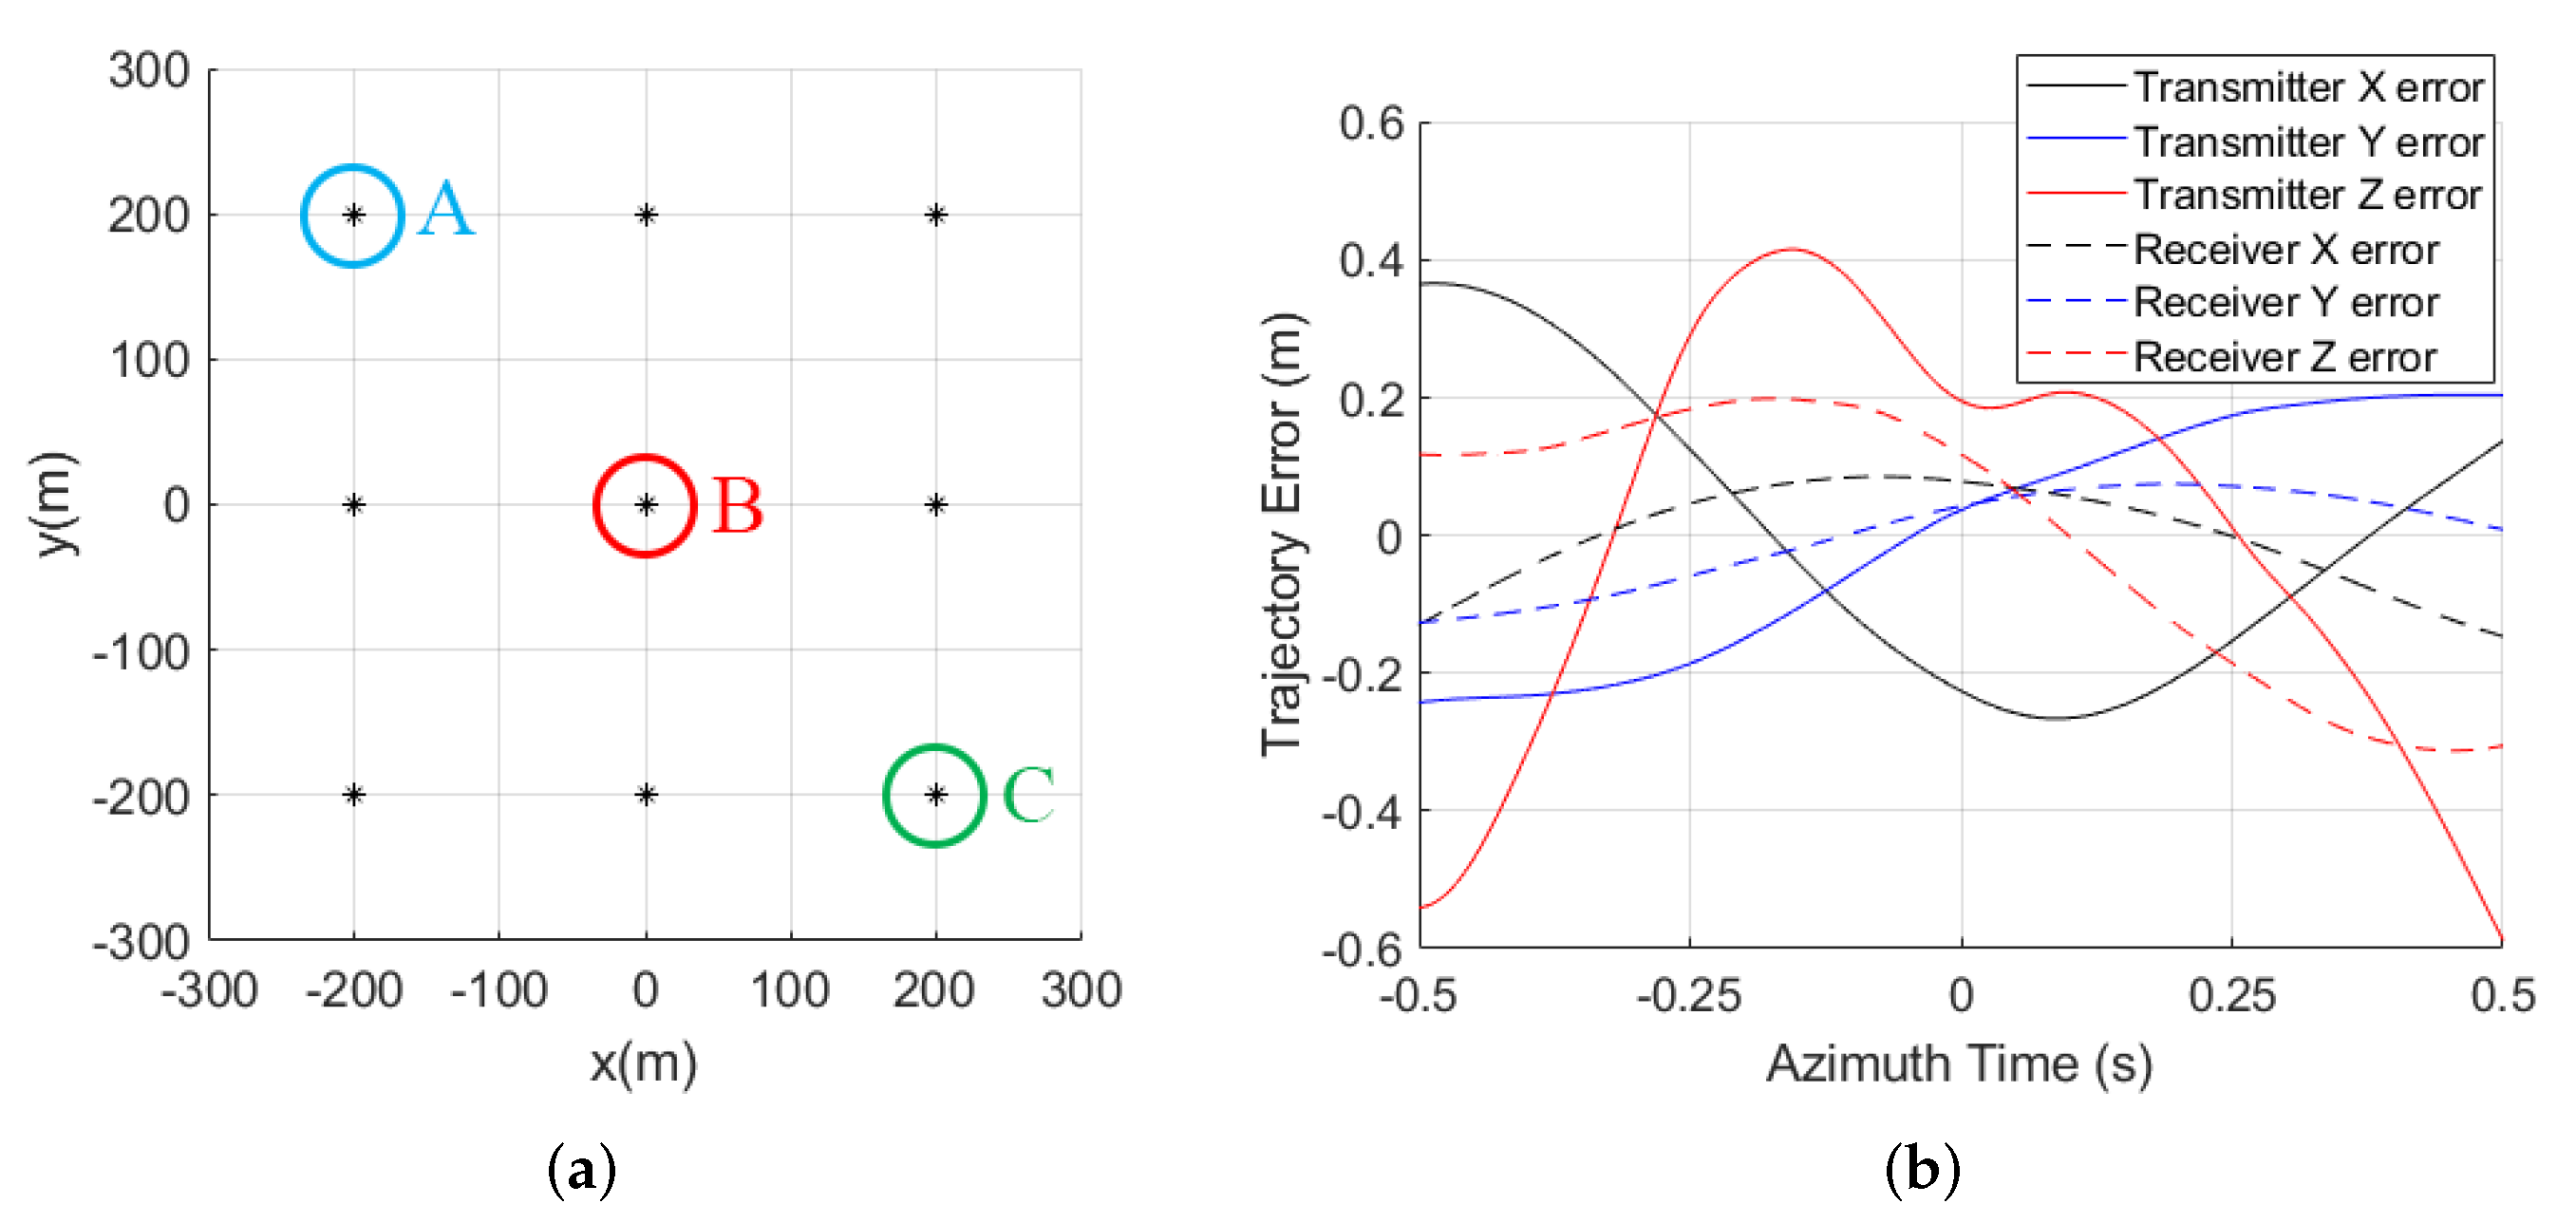
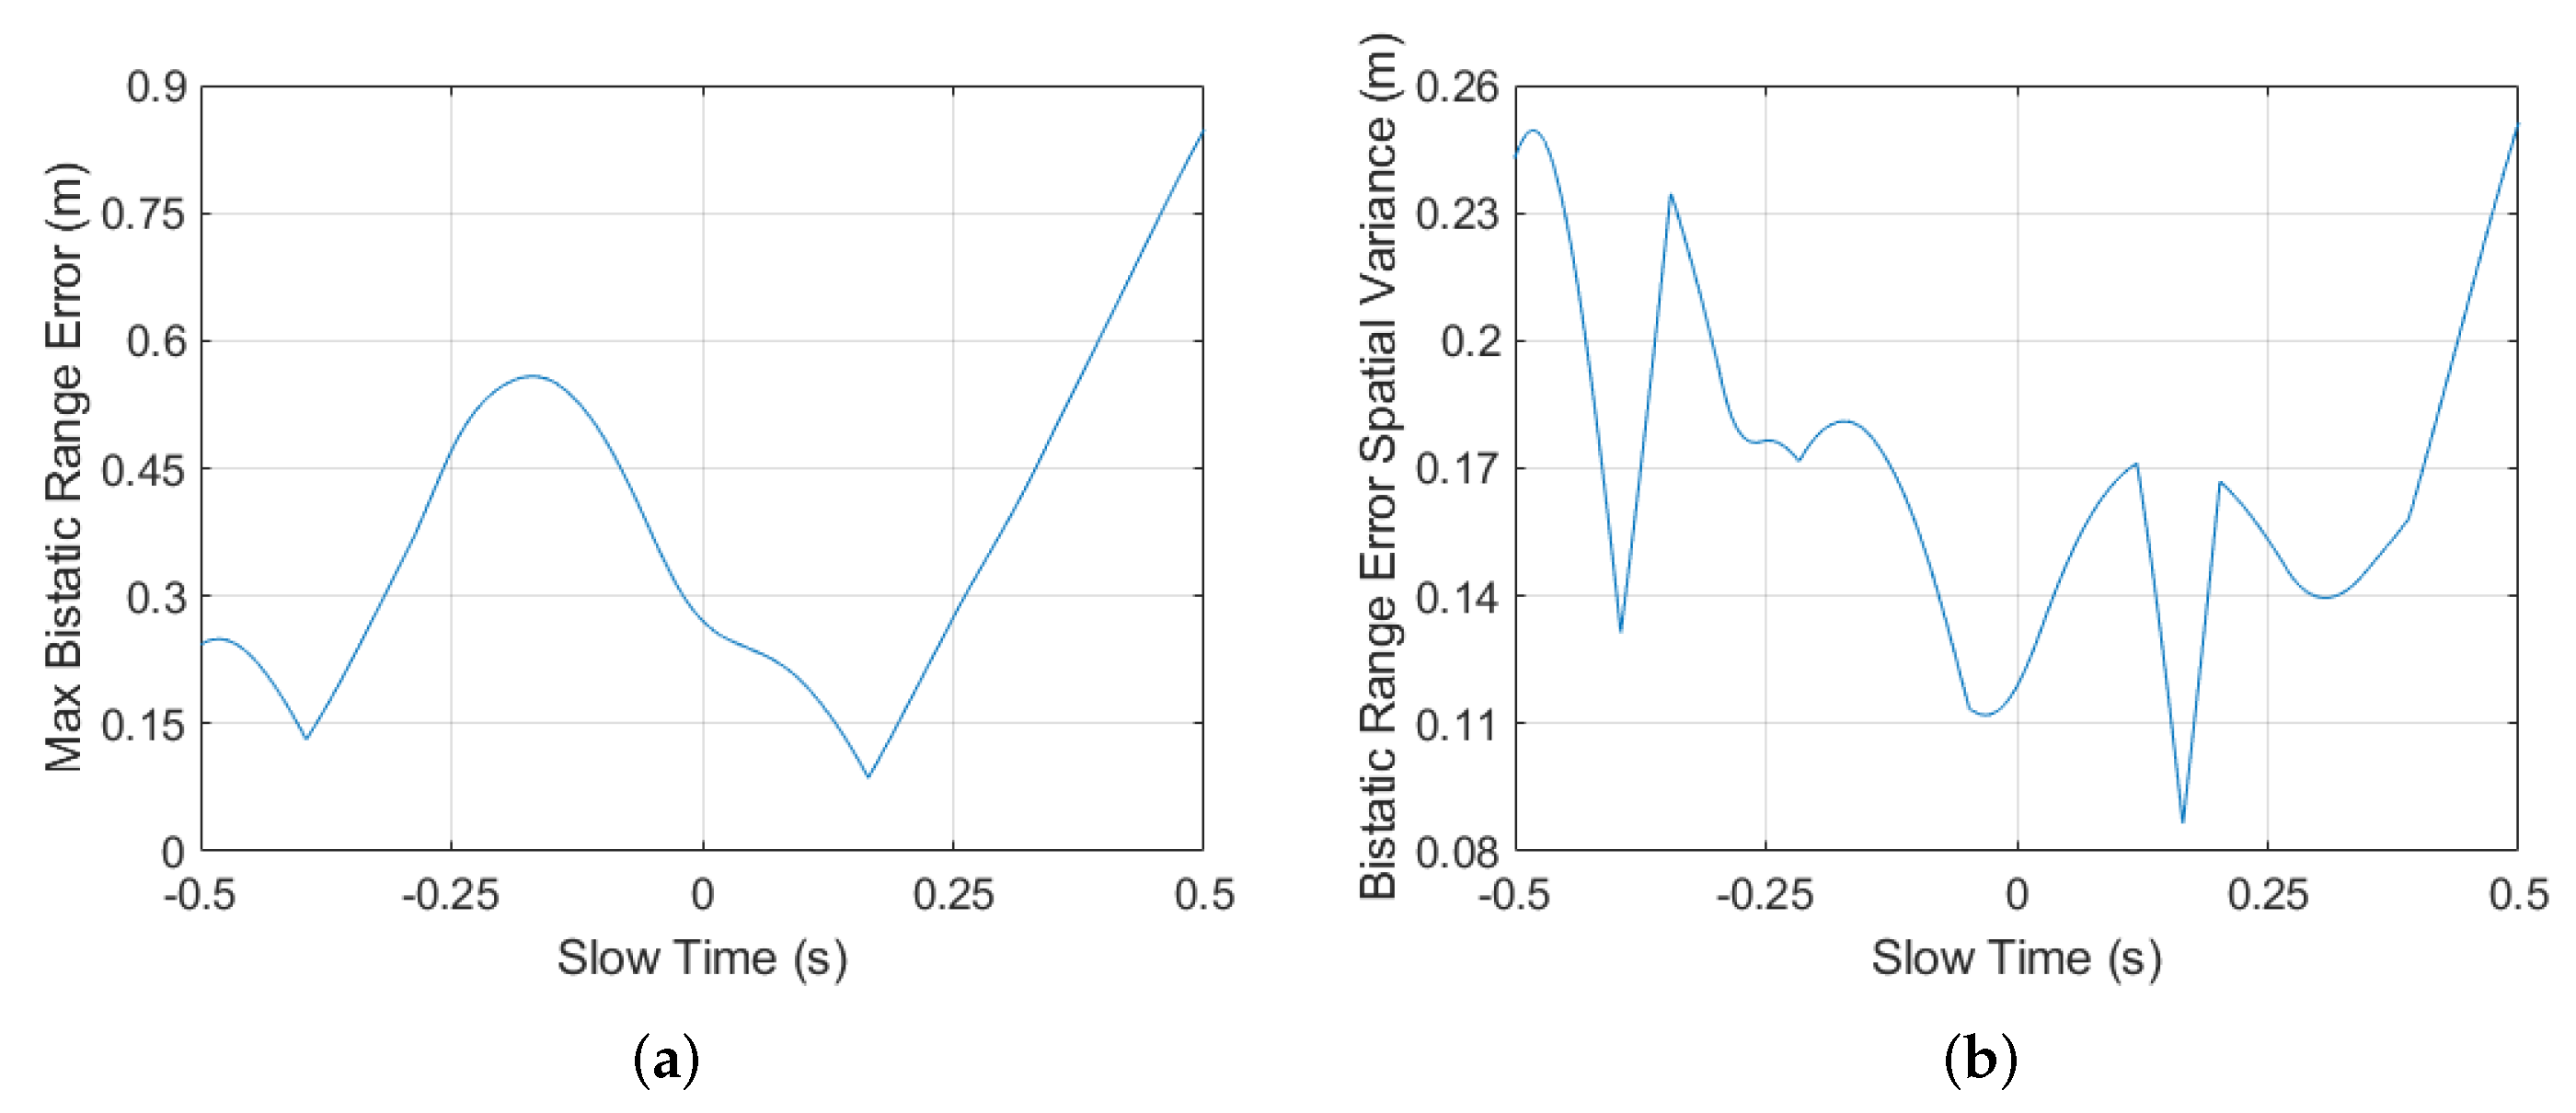
The simulation results of the proposed method are given in this subsection. In this simulation, the BiSAR parameters are listed in Table 1. The scenario is simulated as a uniformly distributed 3 × 3 array of scattering points, and the distances between each other along the x,y directions are all 200 m, which is shown in Figure 5a. The bistatic trajectory error is simulated based on motion sensor data acquired from our previous UAV-borne experiments, and it is given in Figure 5b. The maximum bistatic range error of every azimuth bin caused by the simulated motion error in the 600 m × 600 m area around the image center is illustrated in Figure 6a. The max range error is about 0.85 m, which exceeds the system resolution along the bistatic-range direction (0.75 m). Meanwhile, the spatial variance of the bistatic range error of every azimuth bin is shown in Figure 6b, where the max variance is about 0.26 m. The corresponding max spatial variance of APE could be calculated as rad, which significantly exceeds the boundary of rad.

Table 1.
Simulation parameters.
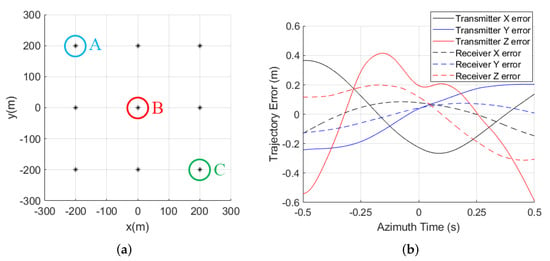
Figure 5.
Simulation parameters: (a) simulation scene and scatters selected for analysis; (b) simulated bistatic SAR motion error.
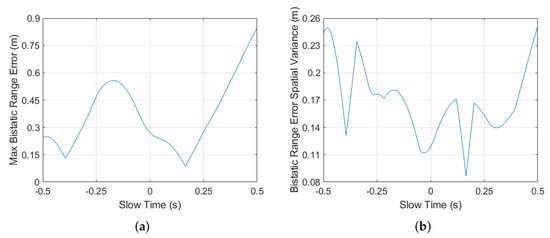
Figure 6.
Properties of simulated bistatic SAR motion error: (a) cross-cell properties; (b) spatial variance properties.
The bistatic SAR echo after range compression is presented in Figure 7, where the three selected prominent scatters points indicated in Figure 5a are given, and the figures are zoomed for clear demonstration. The blue lines indicate the RCM trajectory without motion error, and the red lines indicate the trajectories of the searched peak positions. The azimuth signal of prominent scattering points could be acquired by extracting the data along their peak trajectories, which are the red lines in Figure 7. Due to the existence of a cross-cell RCM error caused by motion error, the blue lines and red lines in each figure are not overlapped.

Figure 7.
Azimuth signal extraction: (a) point A; (b) point B; (c) point C.
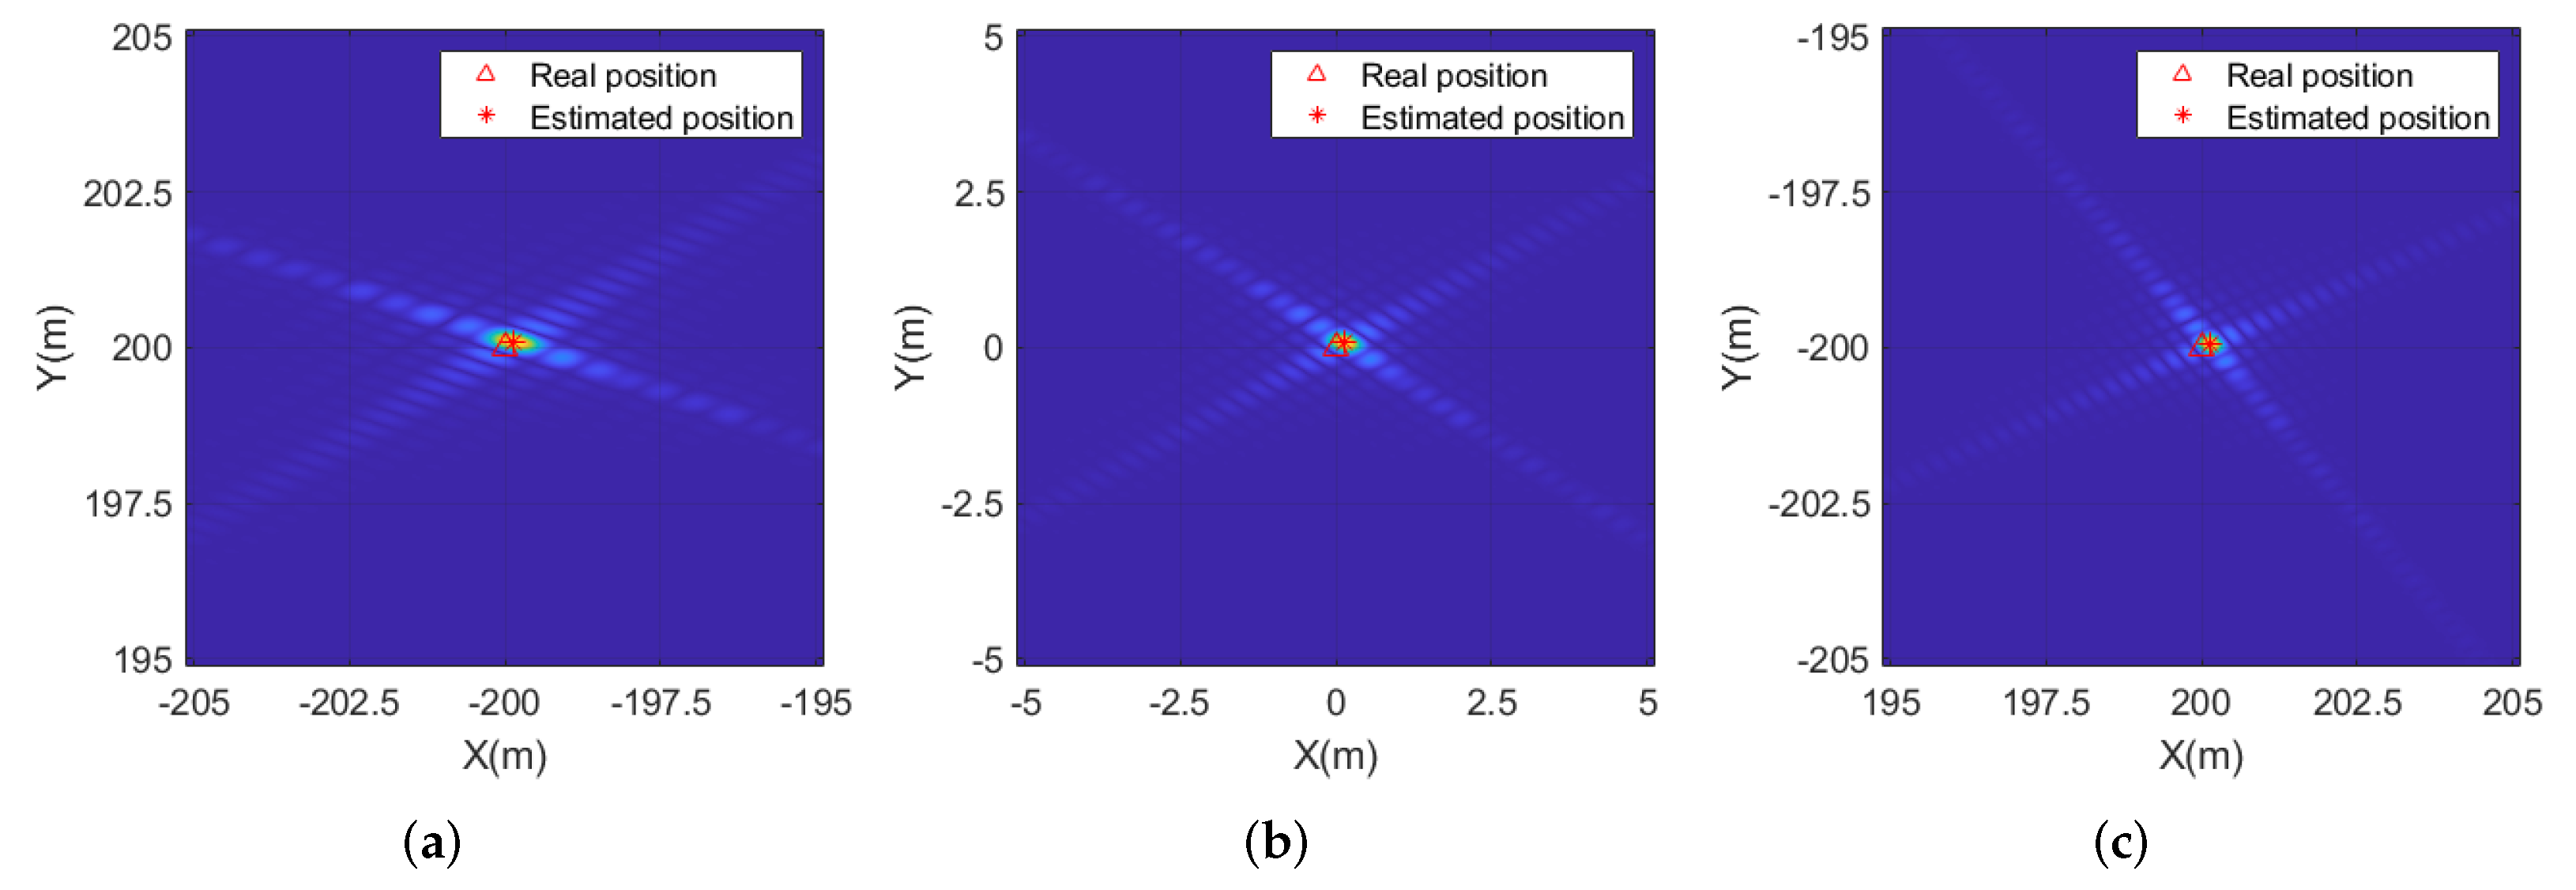
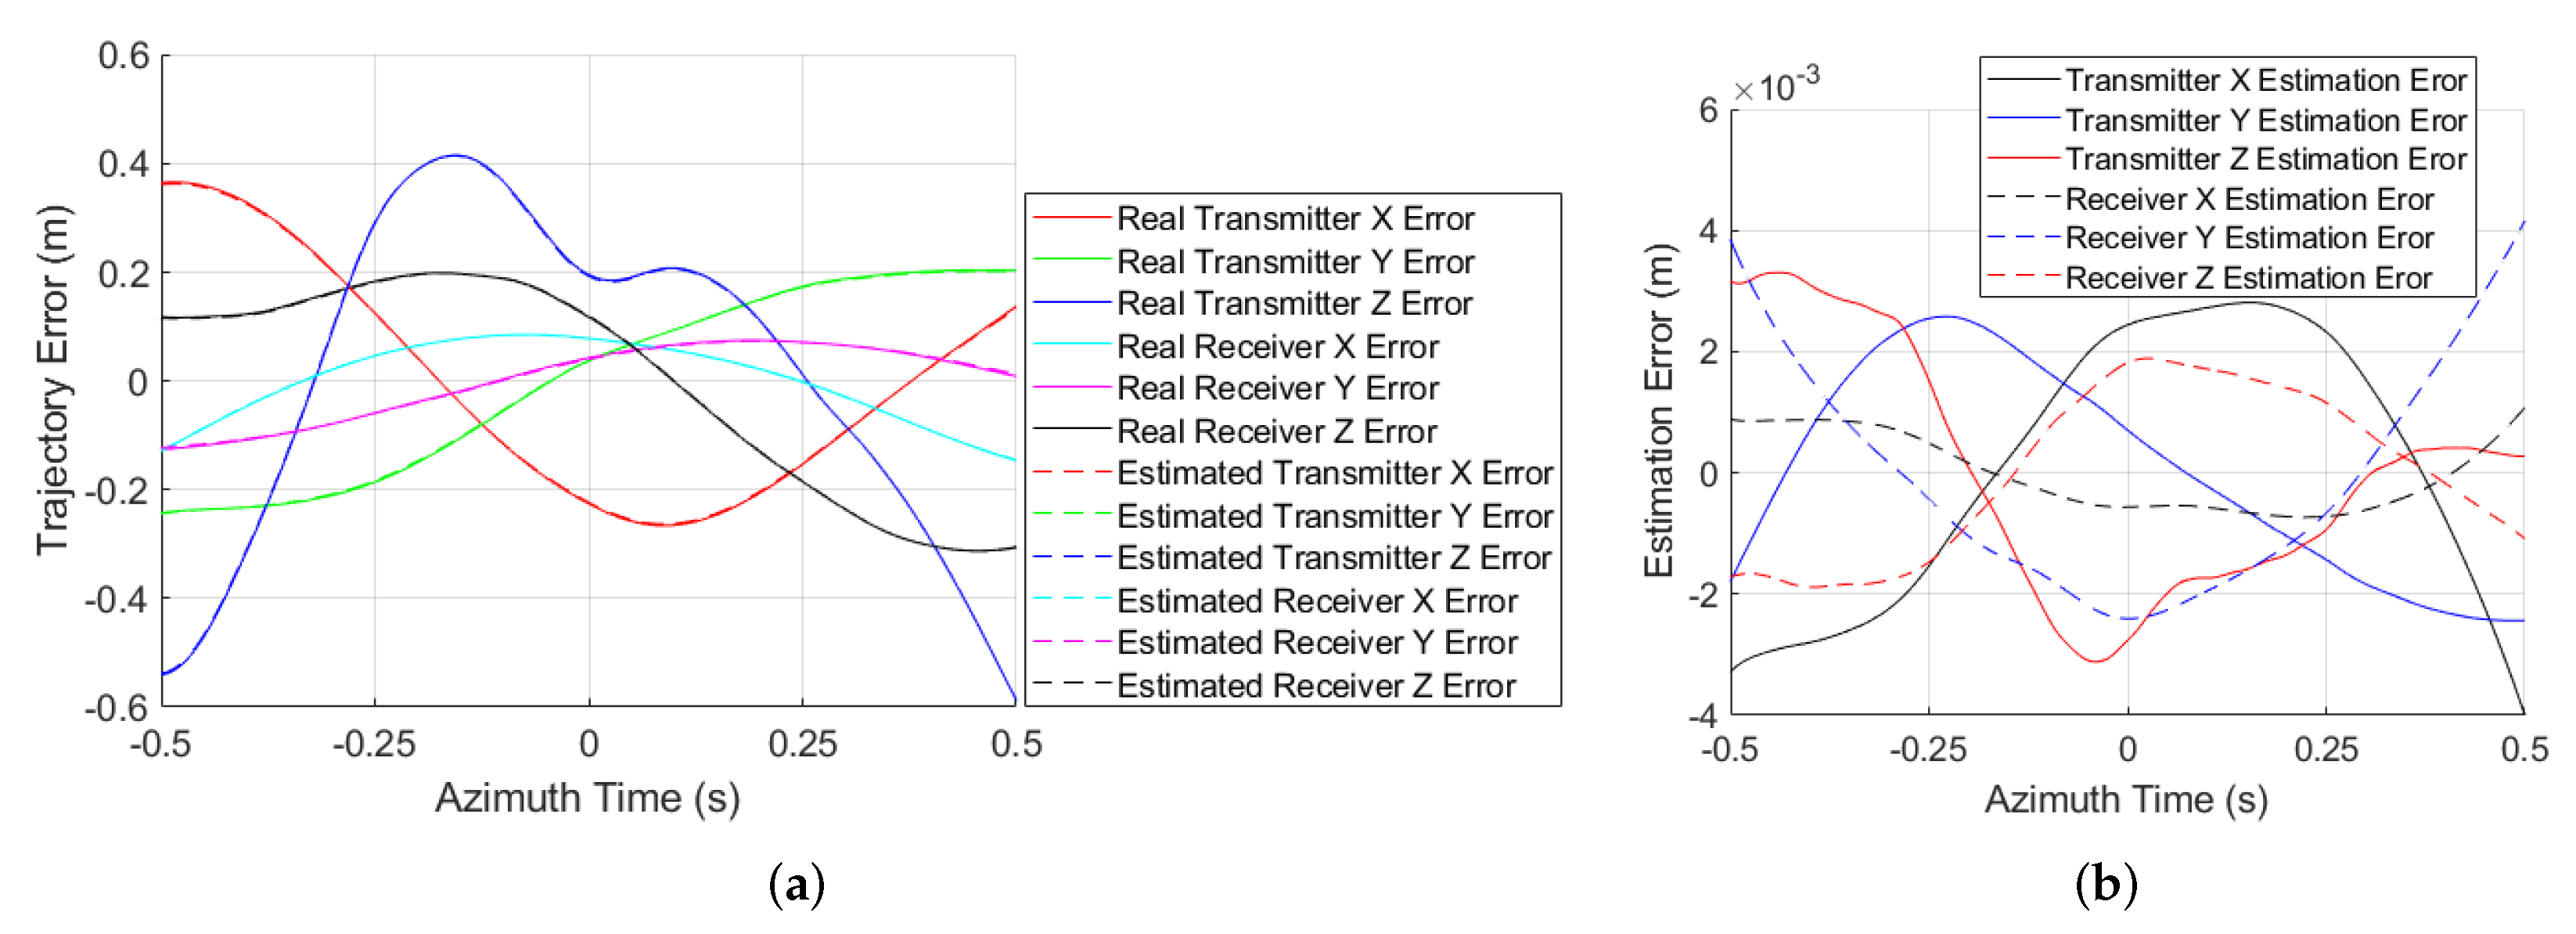
By performing the Morlet wavelet transform, the Doppler history of the three scattering points are shown in Figure 8, where the Doppler variation can be clearly observed, and there is obvious Doppler difference for the different targets. After removing the ideal Doppler history and cascading the additional autofocus, the Doppler error estimation results of the three prominent scatters are shown in Figure 9, where the Doppler estimation accuracy is better than 1Hz. The position information of the prominent scatters obtained from local images is shown in Figure 10, where the estimated positions are close to the true values. At last, the bistatic trajectory error estimation results are presented in Figure 11, where the accuracy of trajectory error estimation of proposed method is about m level, which could basically satisfy the requirement of BiSAR imaging [9].

Figure 8.
Morlet wavelet transform of the azimuth signal: (a) point A; (b) point B; (c) point C.

Figure 9.
Doppler error estimation results of proposed method: (a) point A; (b) point B; (c) point C.
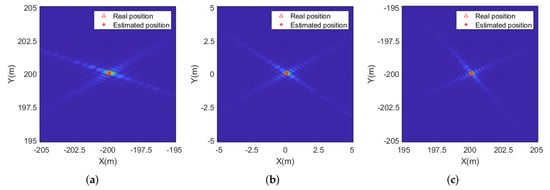
Figure 10.
Scatter position estimation results: (a) point A; (b) point B; (c) point C.
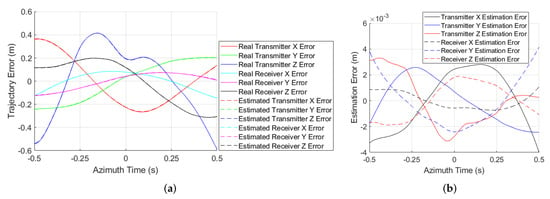
Figure 11.
Trajectory error estimation performance: (a) trajectory error estimation results; (b) error of trajectory error estimation.
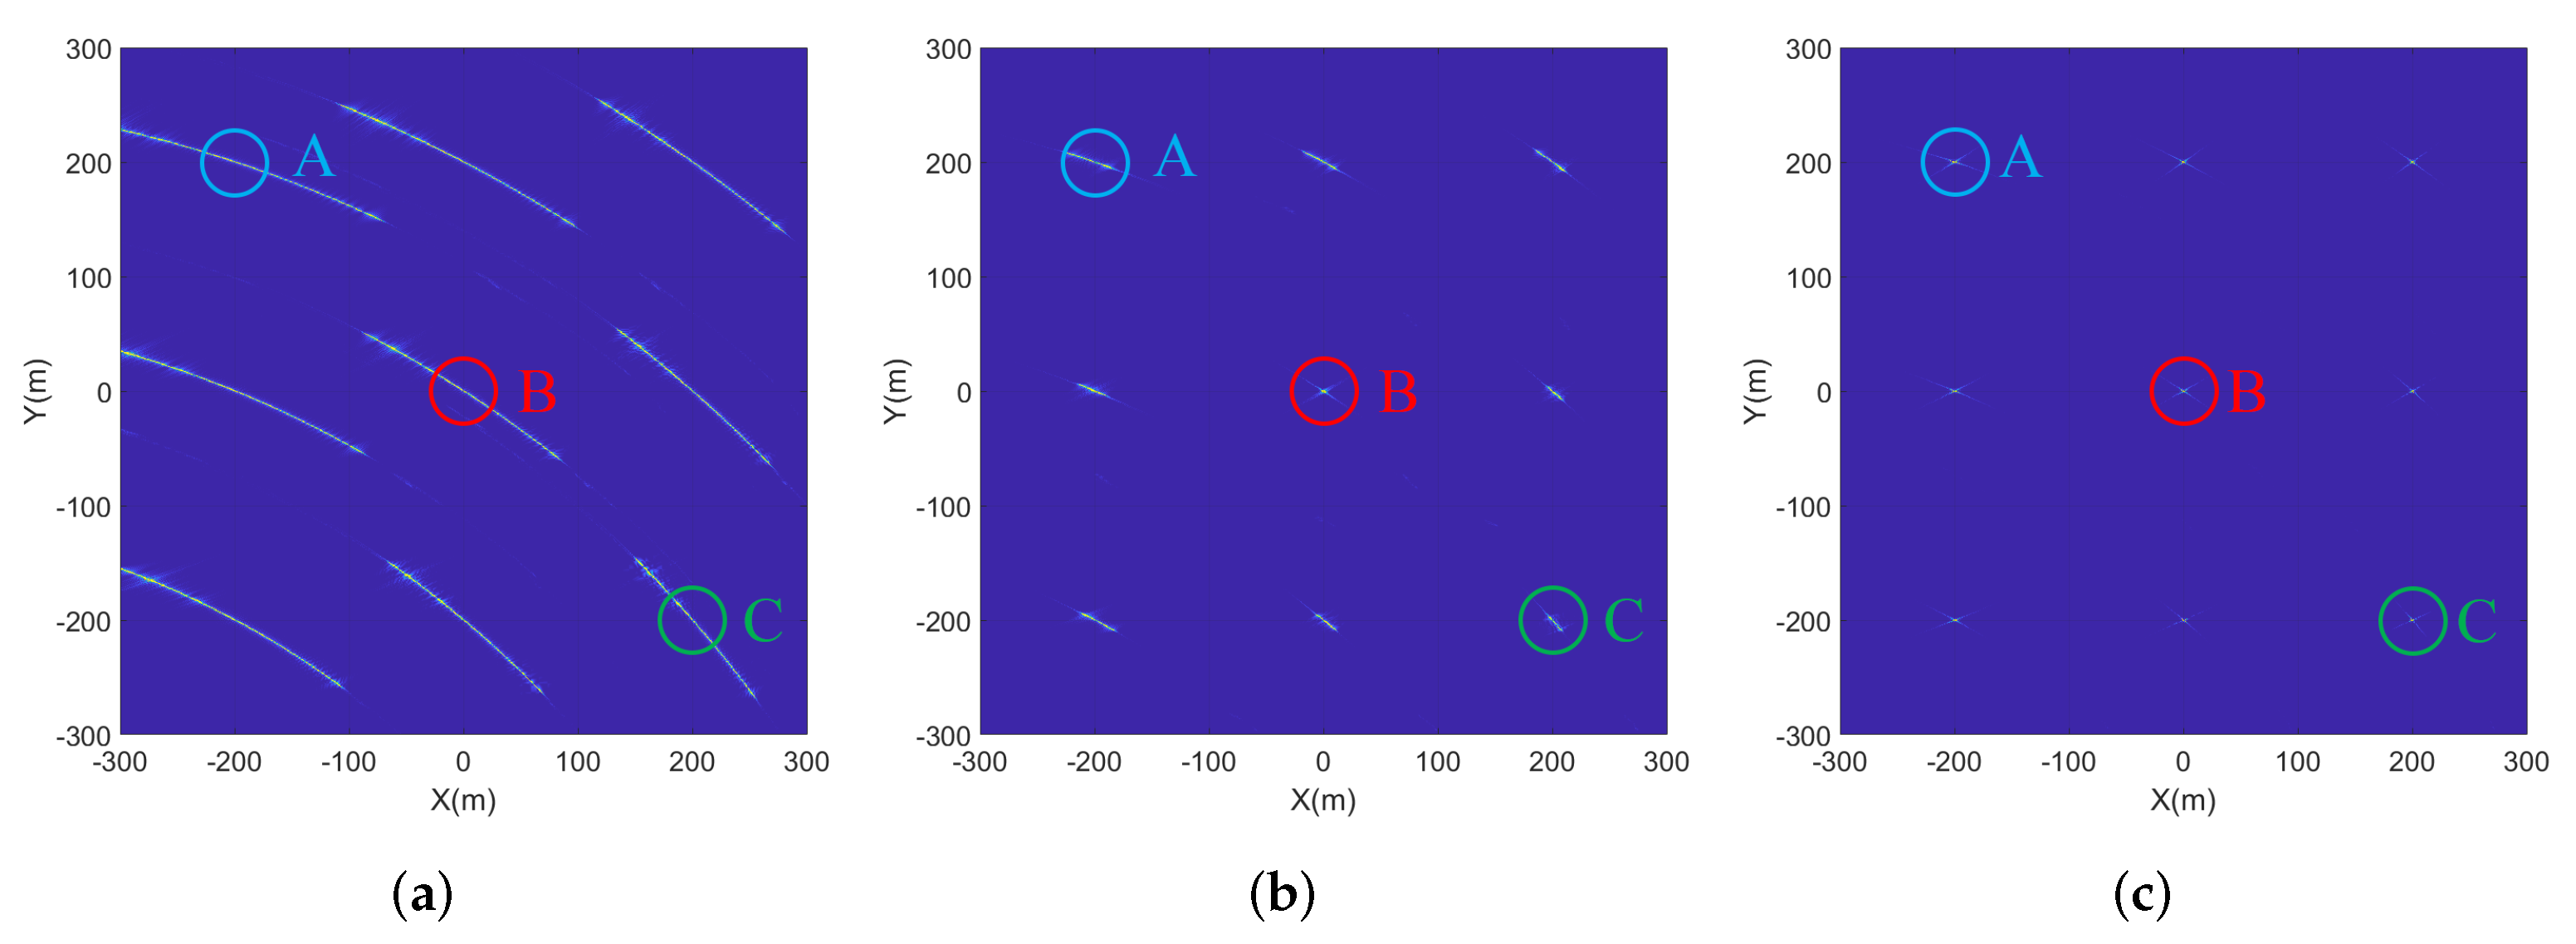
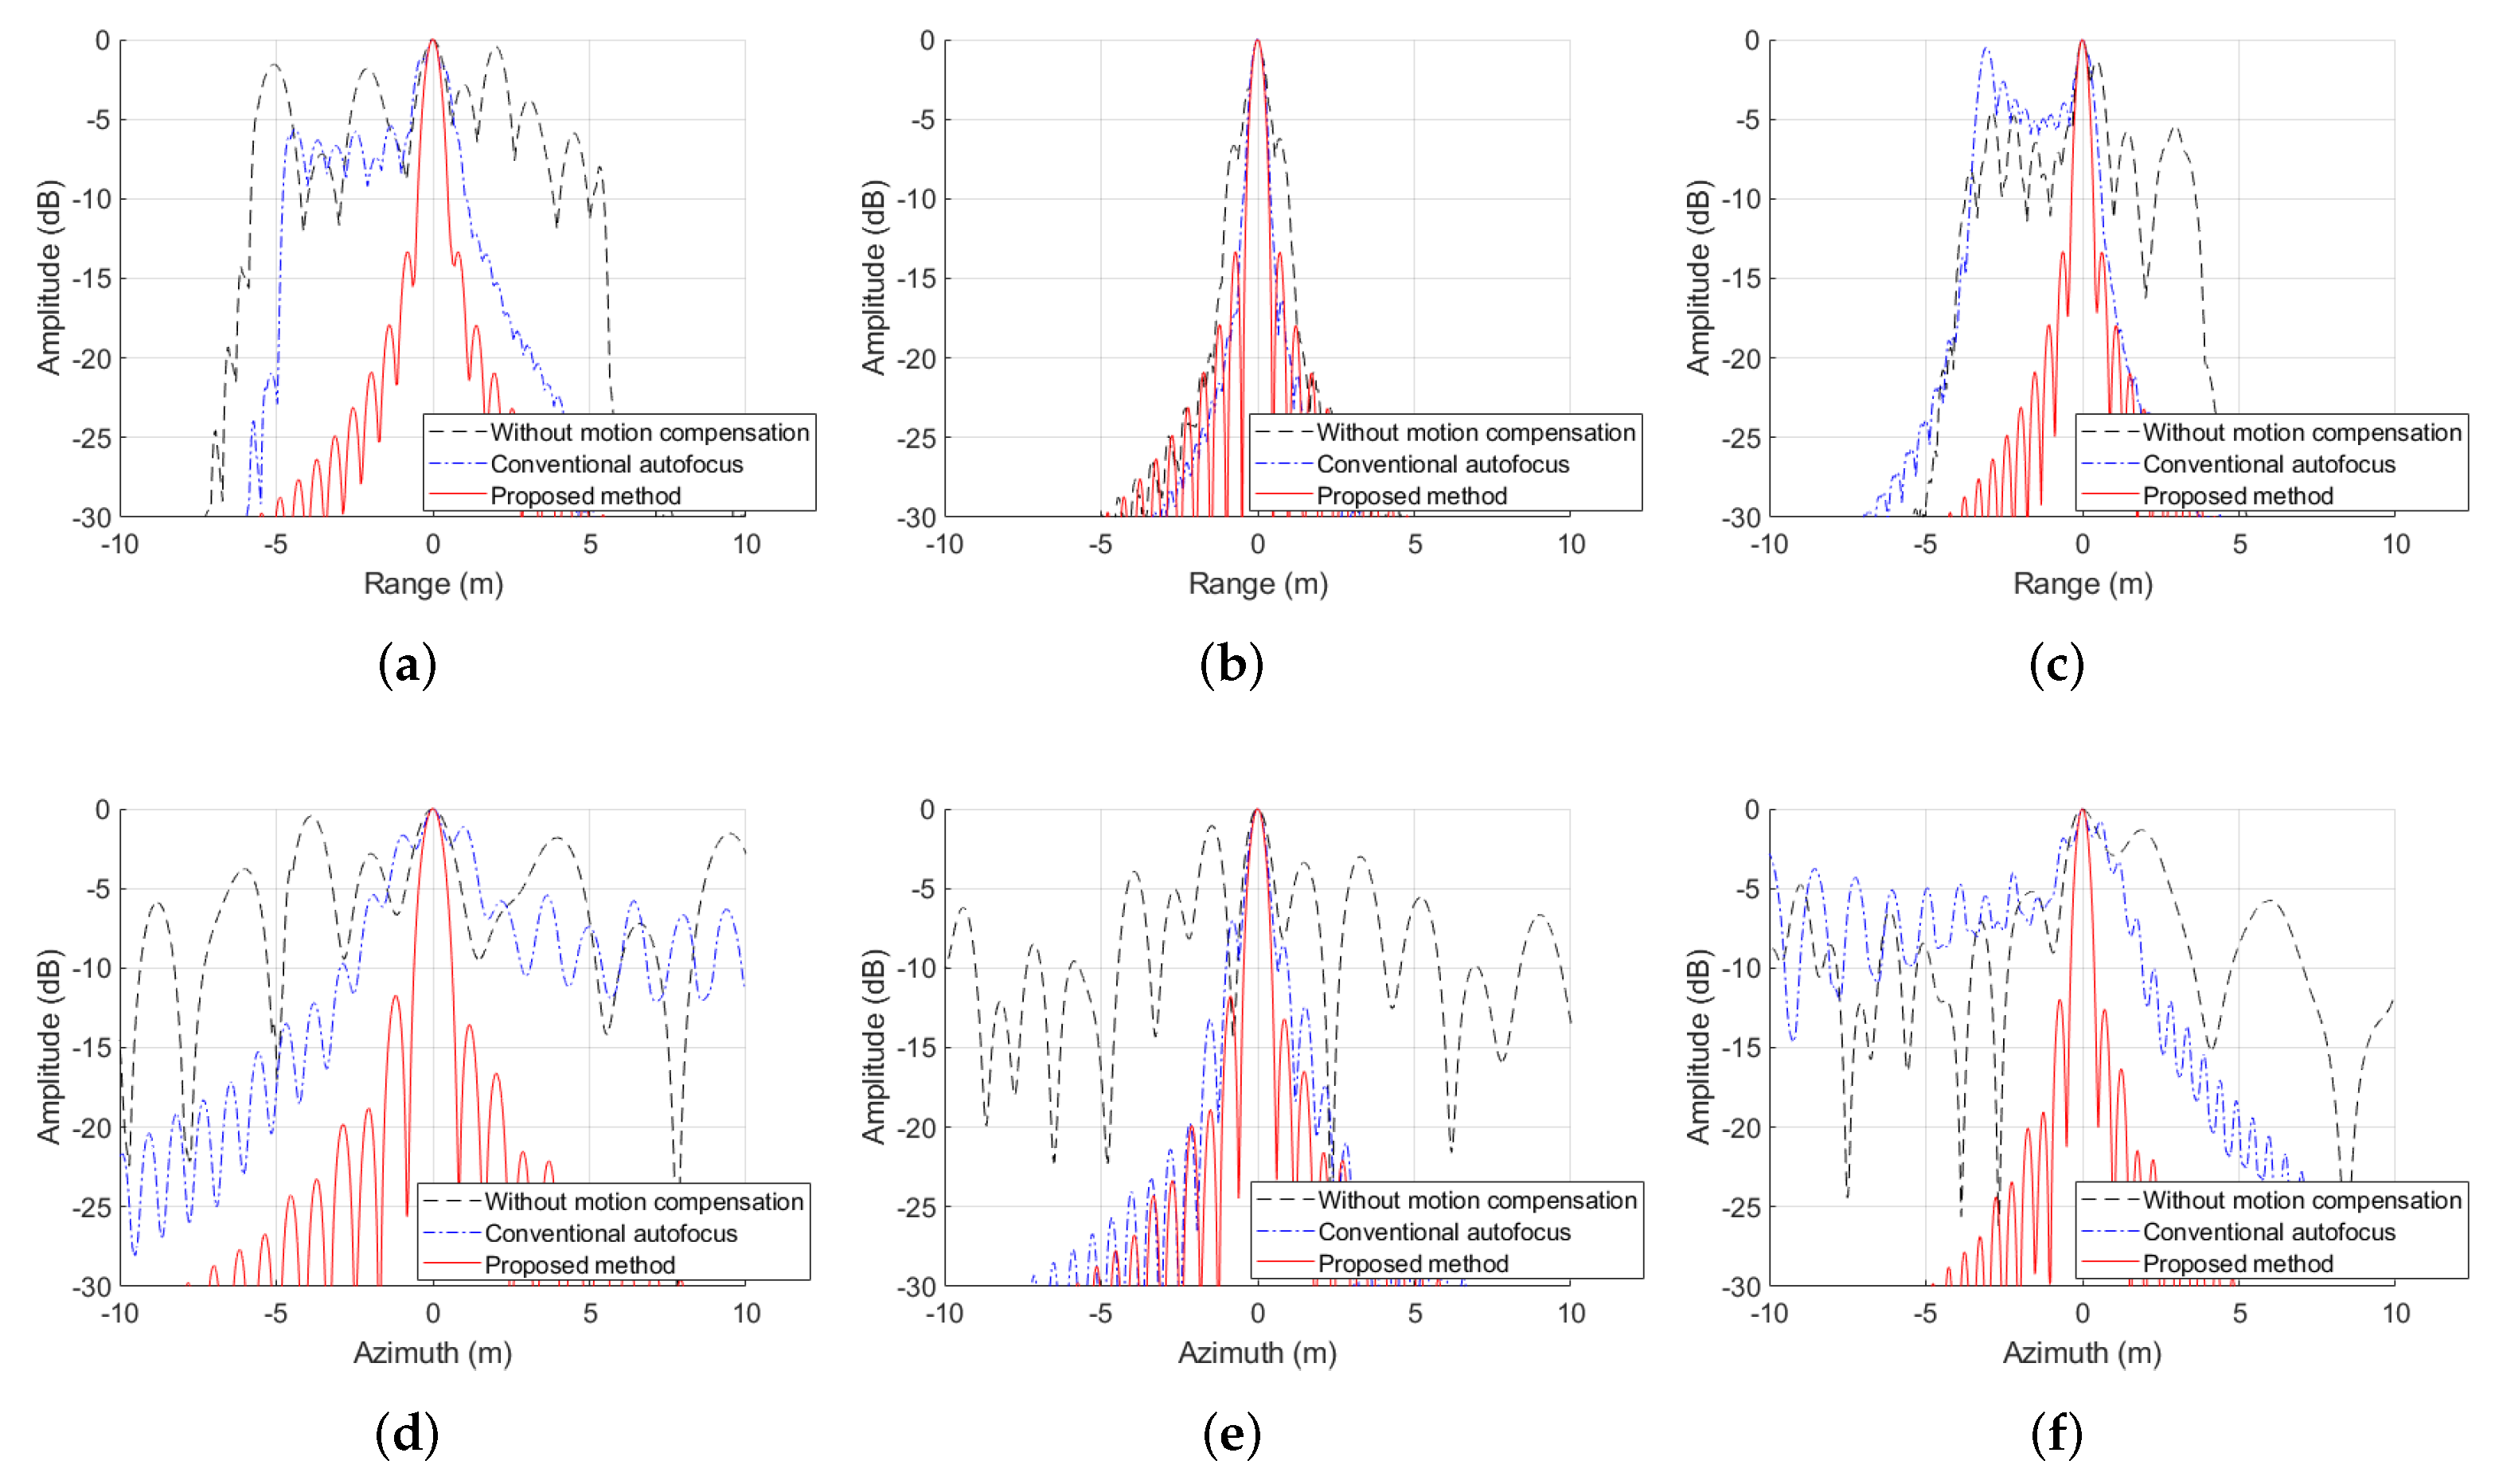
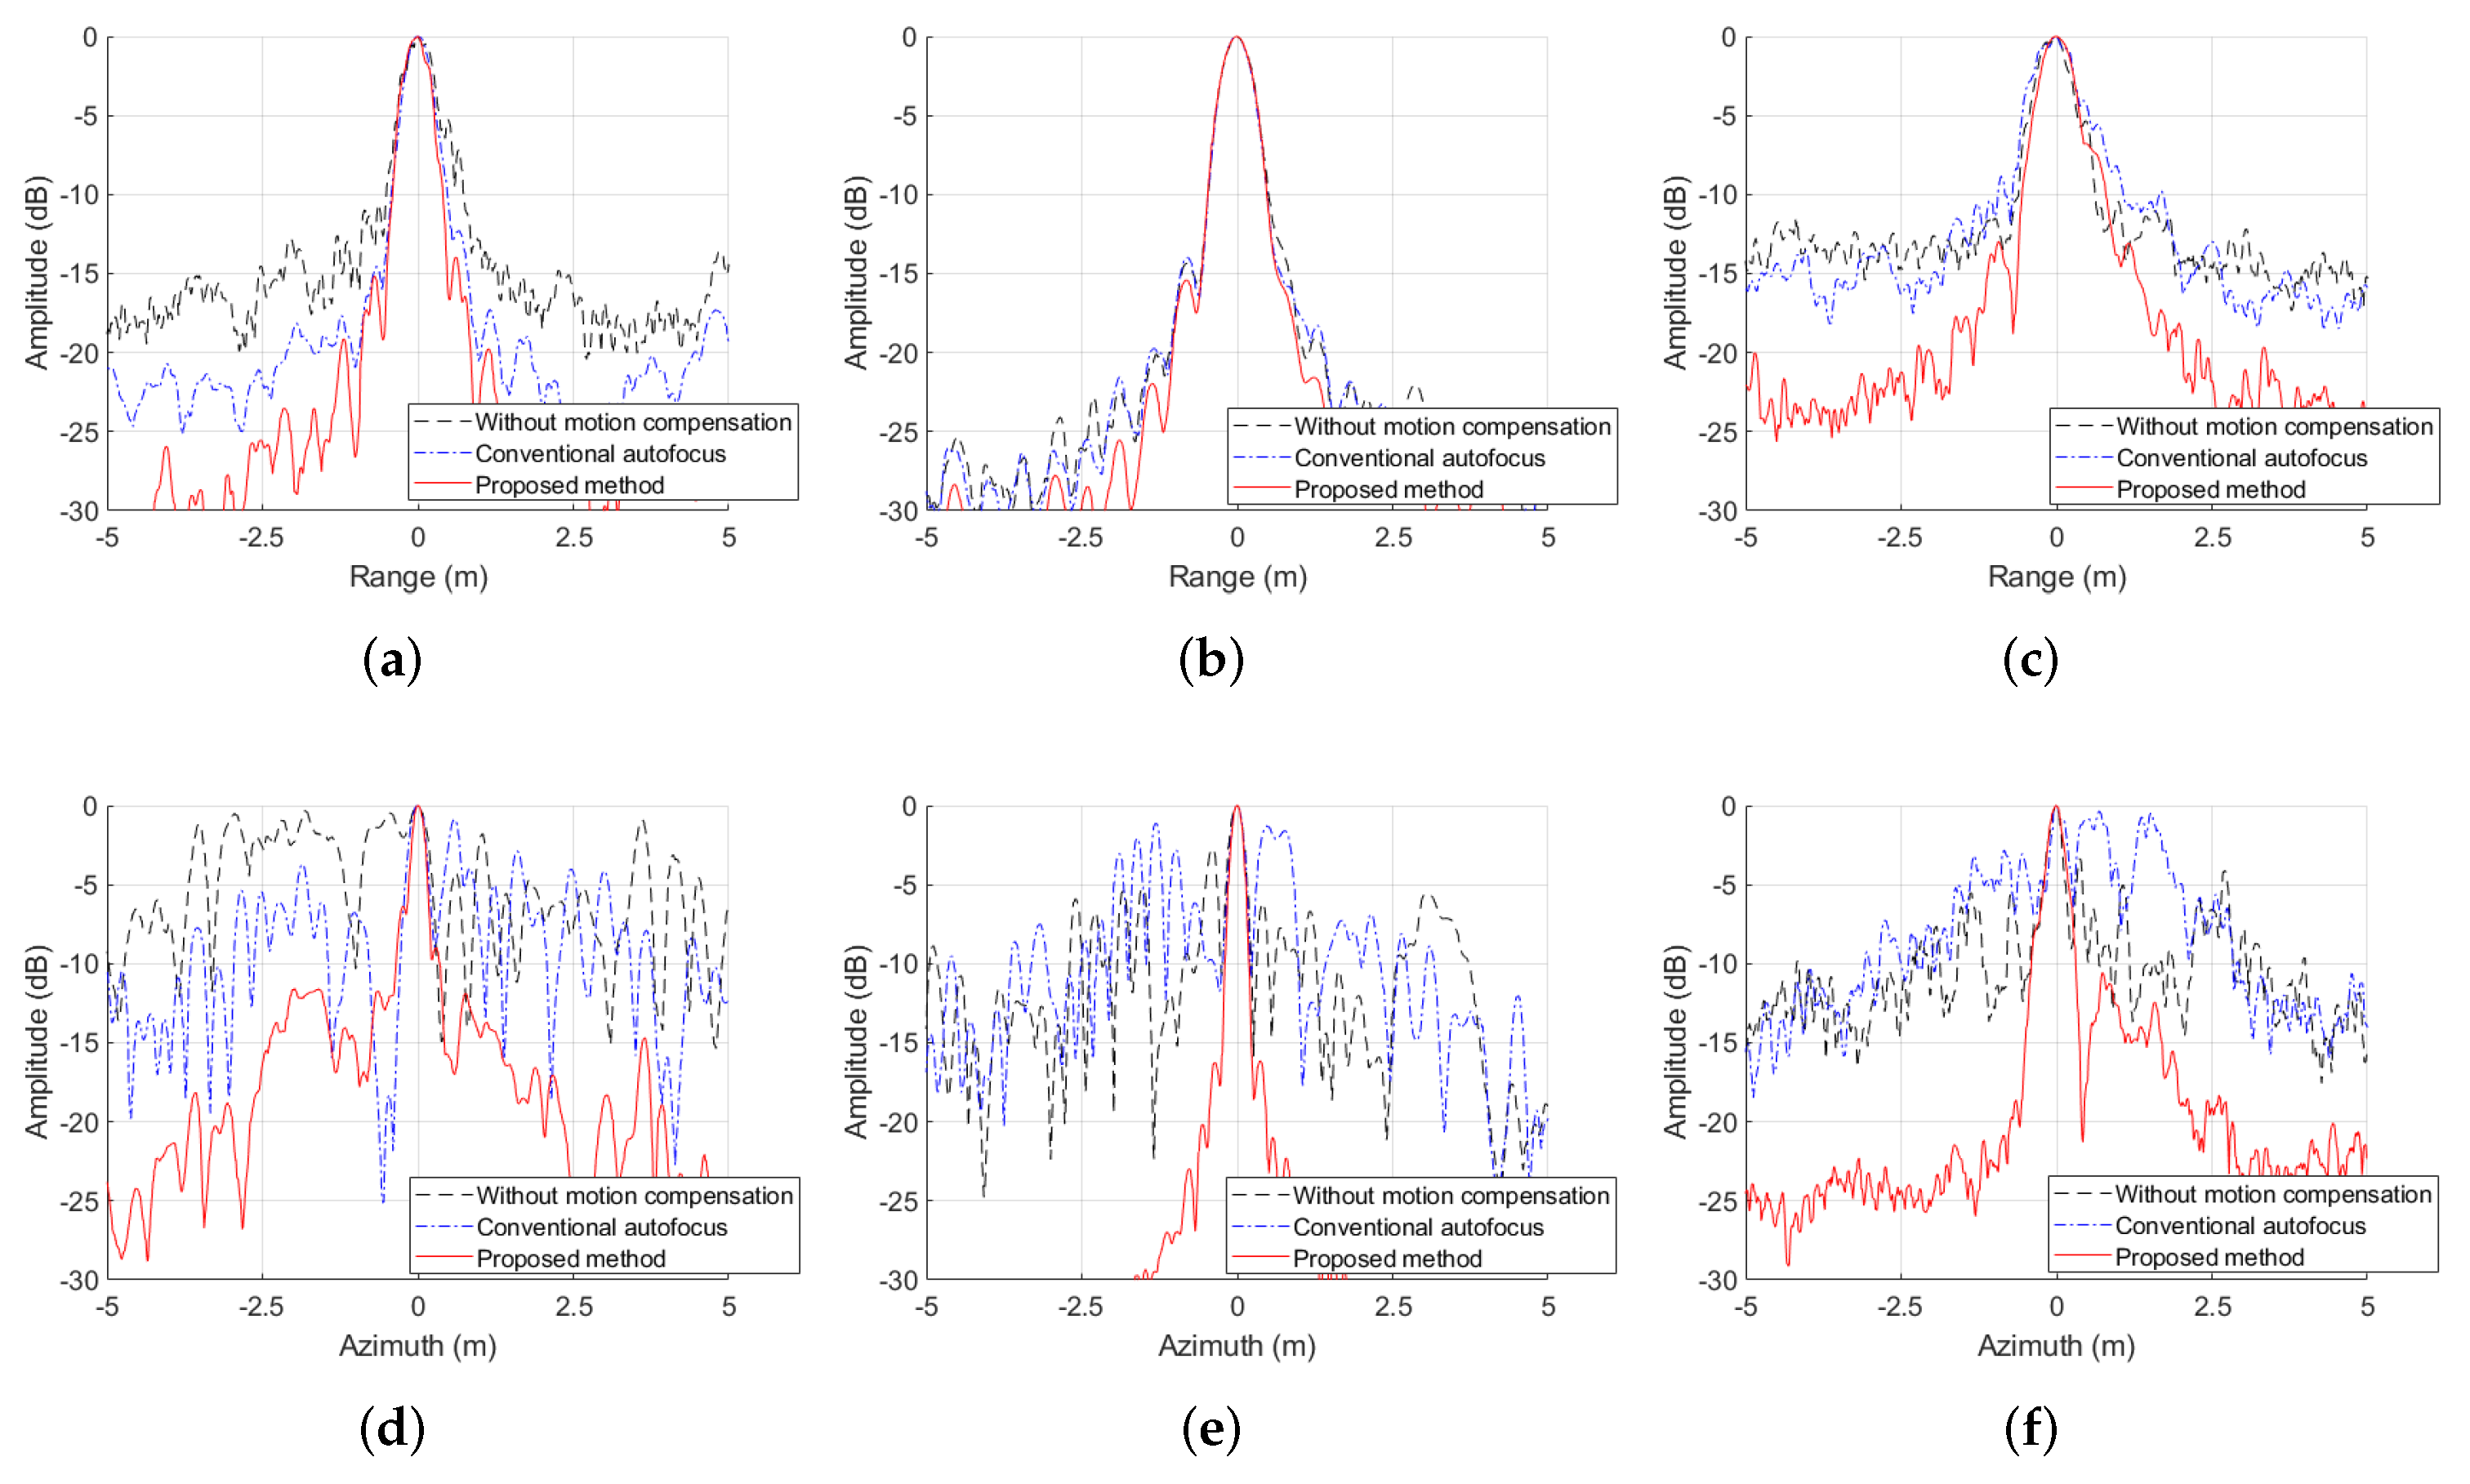
The imaging result without motion error compensation is given in Figure 12a, which suffers noticeable defocusing. The imaging results using the conventional autofocus [25] is presented in Figure 12b, and the range and azimuth profiles of selected scattering points are illustrated in Figure 13, where the image quality is improved. However, due to the existence of cross-cell RCM error and the spatial variance of the BiSAR motion error, there are still different degrees of defocus in the imaging results of conventional autofocus. In contrast, the imaging result using the bistatic trajectory estimated through the proposed method is given in Figure 12c, and the profiles of selected scattering points are shown in Figure 13. It can be observed that although the sidelobes are slightly asymmetric because the trajectory error estimation results shown in Figure 11 slightly deviate from the true values, the effect of the cross-cell RCM error and the influence of spatial-variant BiSAR motion error have basically been compensated for, and all scattering points in the image scene have basically been well-focused.
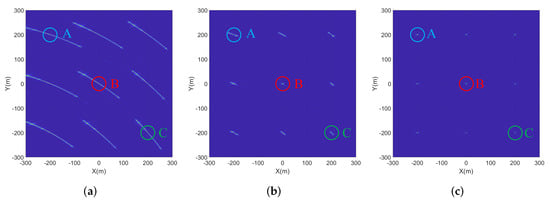
Figure 12.
Simulation results: (a) image without motion error compensation; (b) image with conventional autofocus [25]; (c) image with the trajectories estimated by the proposed method.
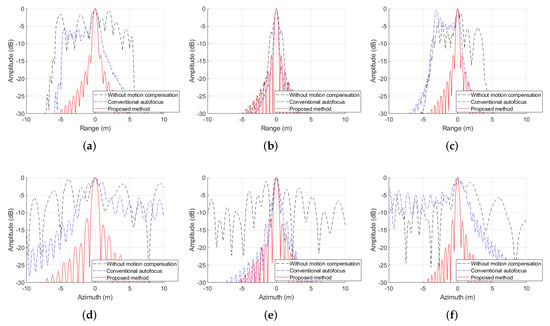
Figure 13.
Profile properties of simulation results: (a) range profiles of A; (b) range profiles of B; (c) range profiles of C; (d) azimuth profiles of A; (e) azimuth profiles of B; (f) Azimuth profiles of C.
For quantitatively comparing the performance of different methods, image entropy (the lower the better) [28], contrast (the higher the better) [26] and sharpness (the higher the better) [24] of the final BiSAR images are listed in Table 2. The 3 dB impulse response width (IRW), peak side lobe ratio (PSLR) and integrated side lobe ratio (ISLR) of selected scattering points labelled in Figure 12 are also listed in Table 2. It can be observed that although the PSLR and ISLR are slightly inferior to the theoretical values, the best values of quantitative quality indexes could be achieved by using the BiSAR trajectory estimated through the proposed method when performing BiSAR imaging process.

Table 2.
Simulation performance.
4.2. Results on Experimental Data
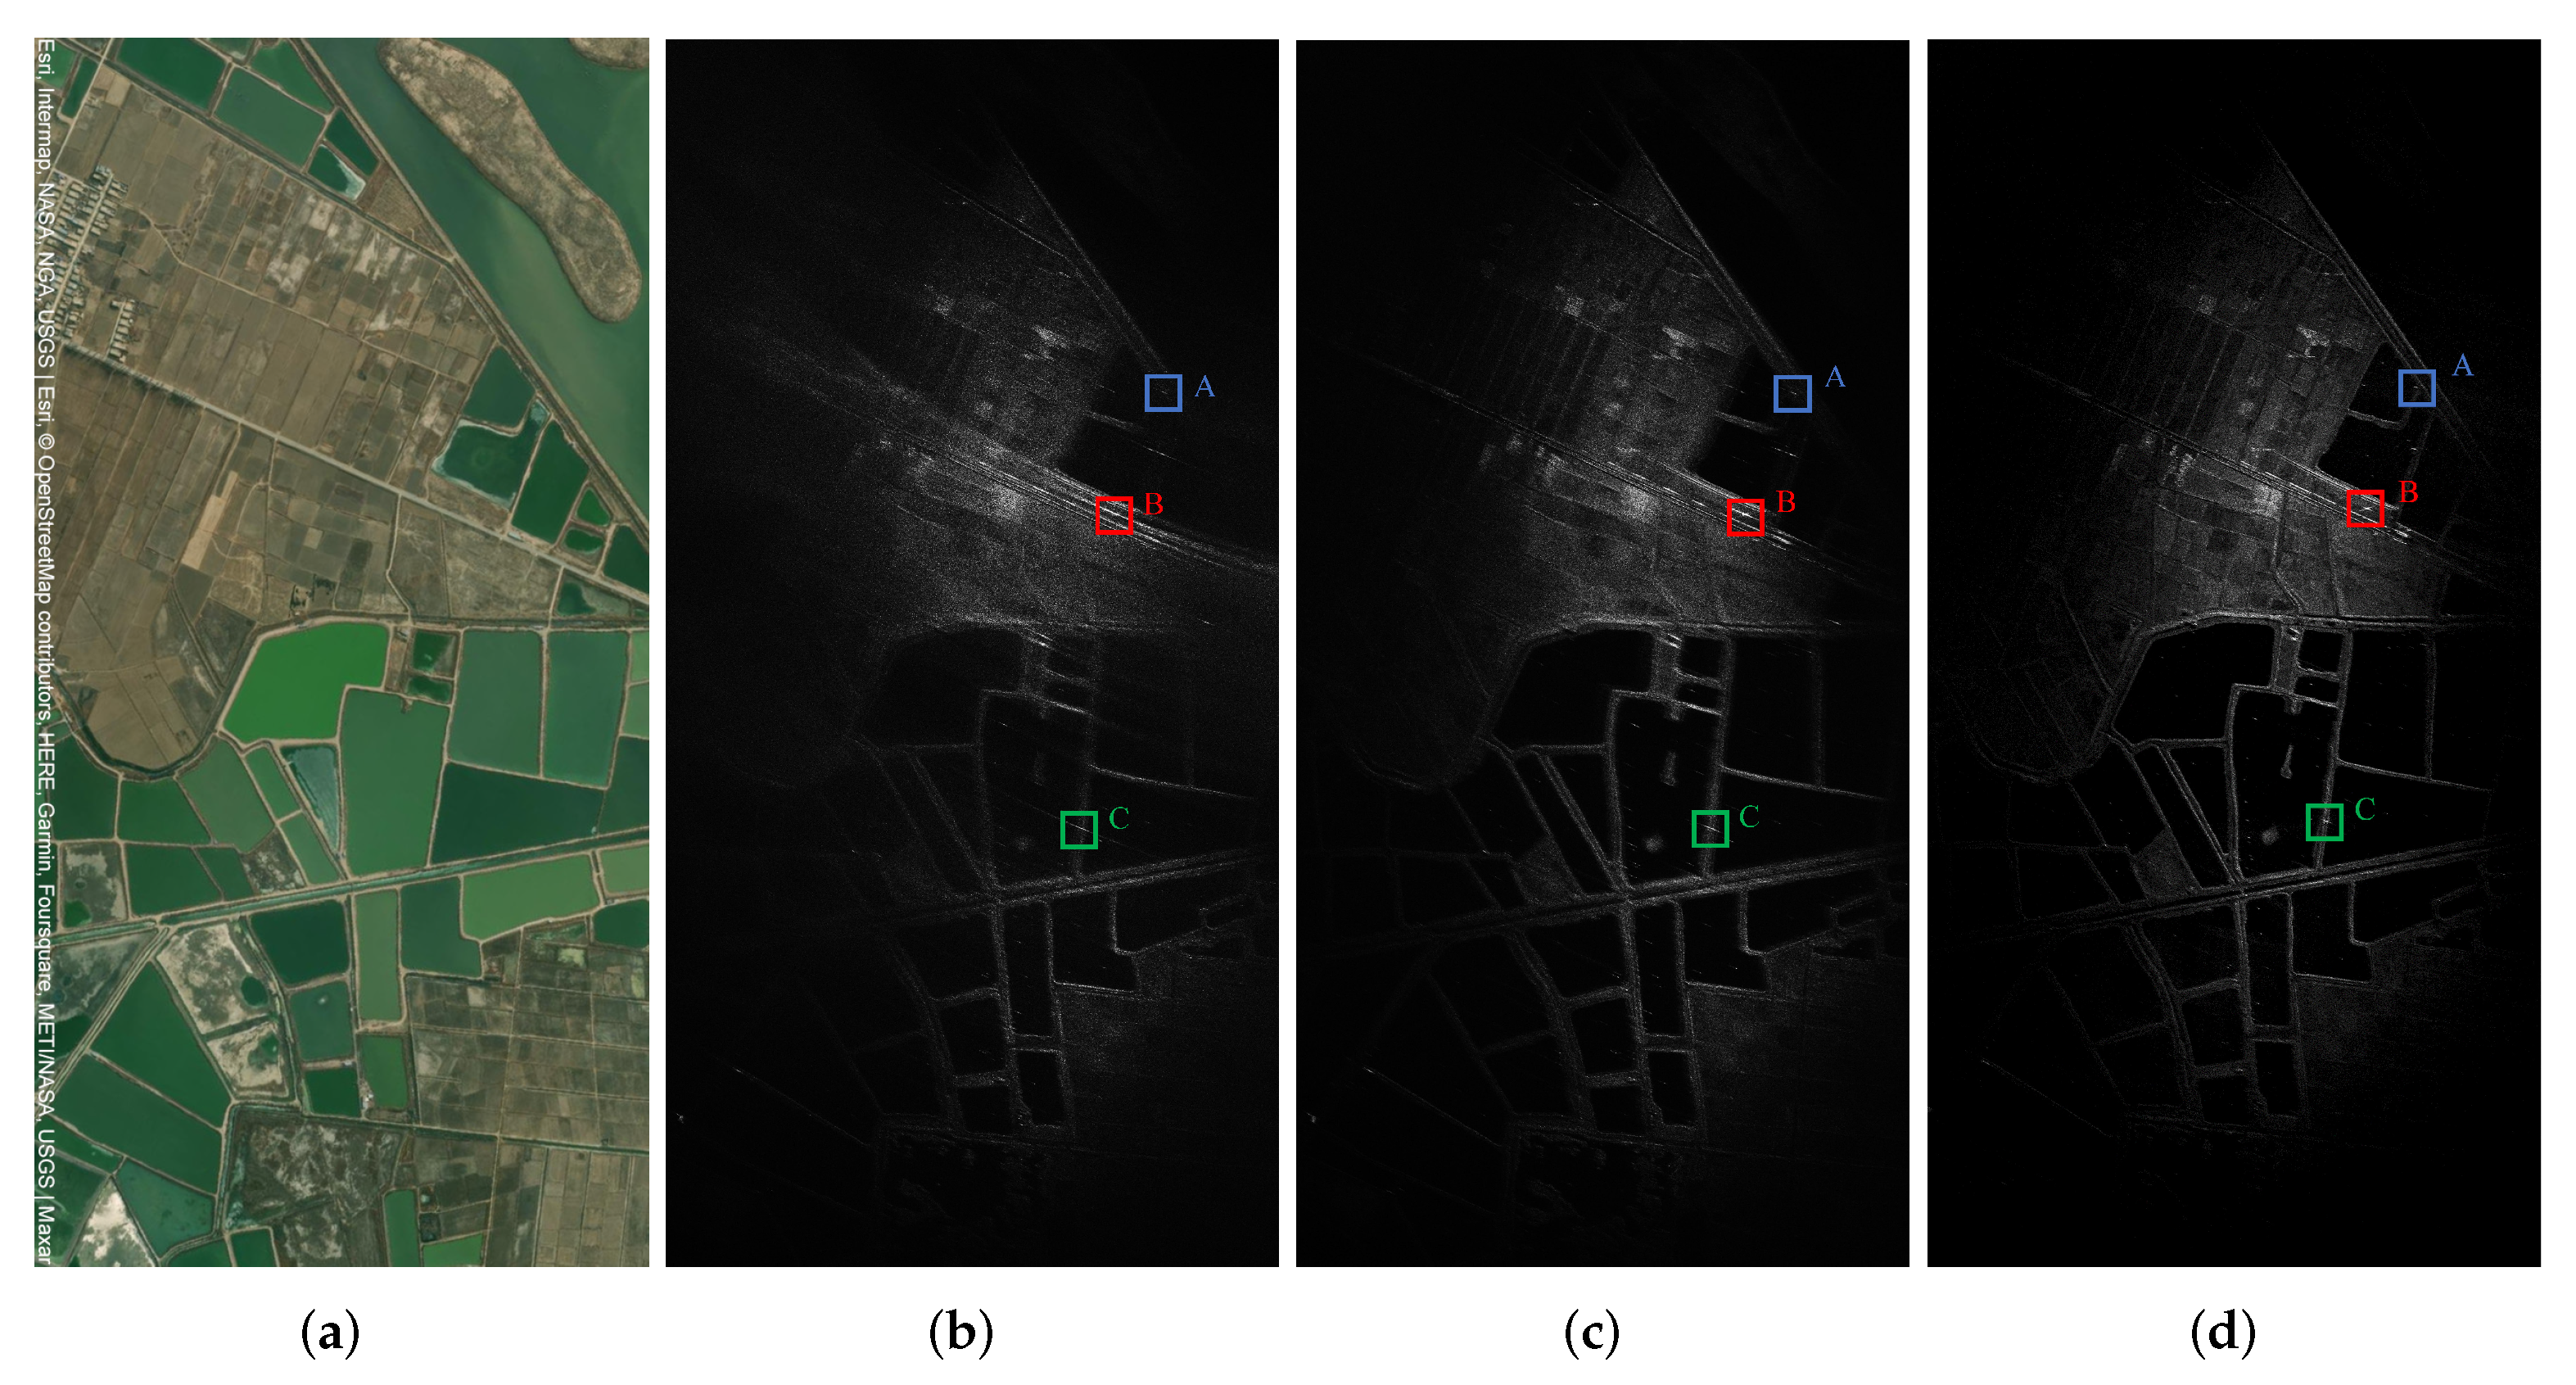
In this subsection, the performance and effectiveness of the BiSAR trajectory error estimation and compensation method proposed in this paper is further demonstrated by processing the experimental data, which is acquired by an X-band BiSAR system installed on two Cessna 208 planes [52]. In this experiment, the transmitter of the BiSAR system was configured as the squint-looking mode, and the receiver of this system was configured as the forward-looking mode. The system parameters are listed in Table 3. Figure 14a gives the optical image of the scenario acquired from the ArcGIS Online World Imagery [53]. Notice that the optical image was not taken on the same day of the experiment, so the landscape of the optical image may not be totally the same as the experiment results.

Table 3.
Experiment parameters.
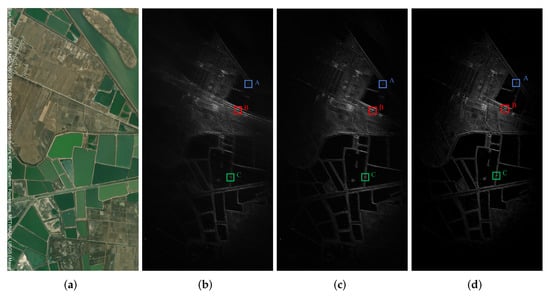
Figure 14.
Processing results on the experimental data and scatters selected for analysis: (a) optical image of the scenario [53]; (b) imaging result without motion compensation; (c) imaging result with conventional autofocus [25]; (d) imaging result with the trajectories estimated by the proposed method.
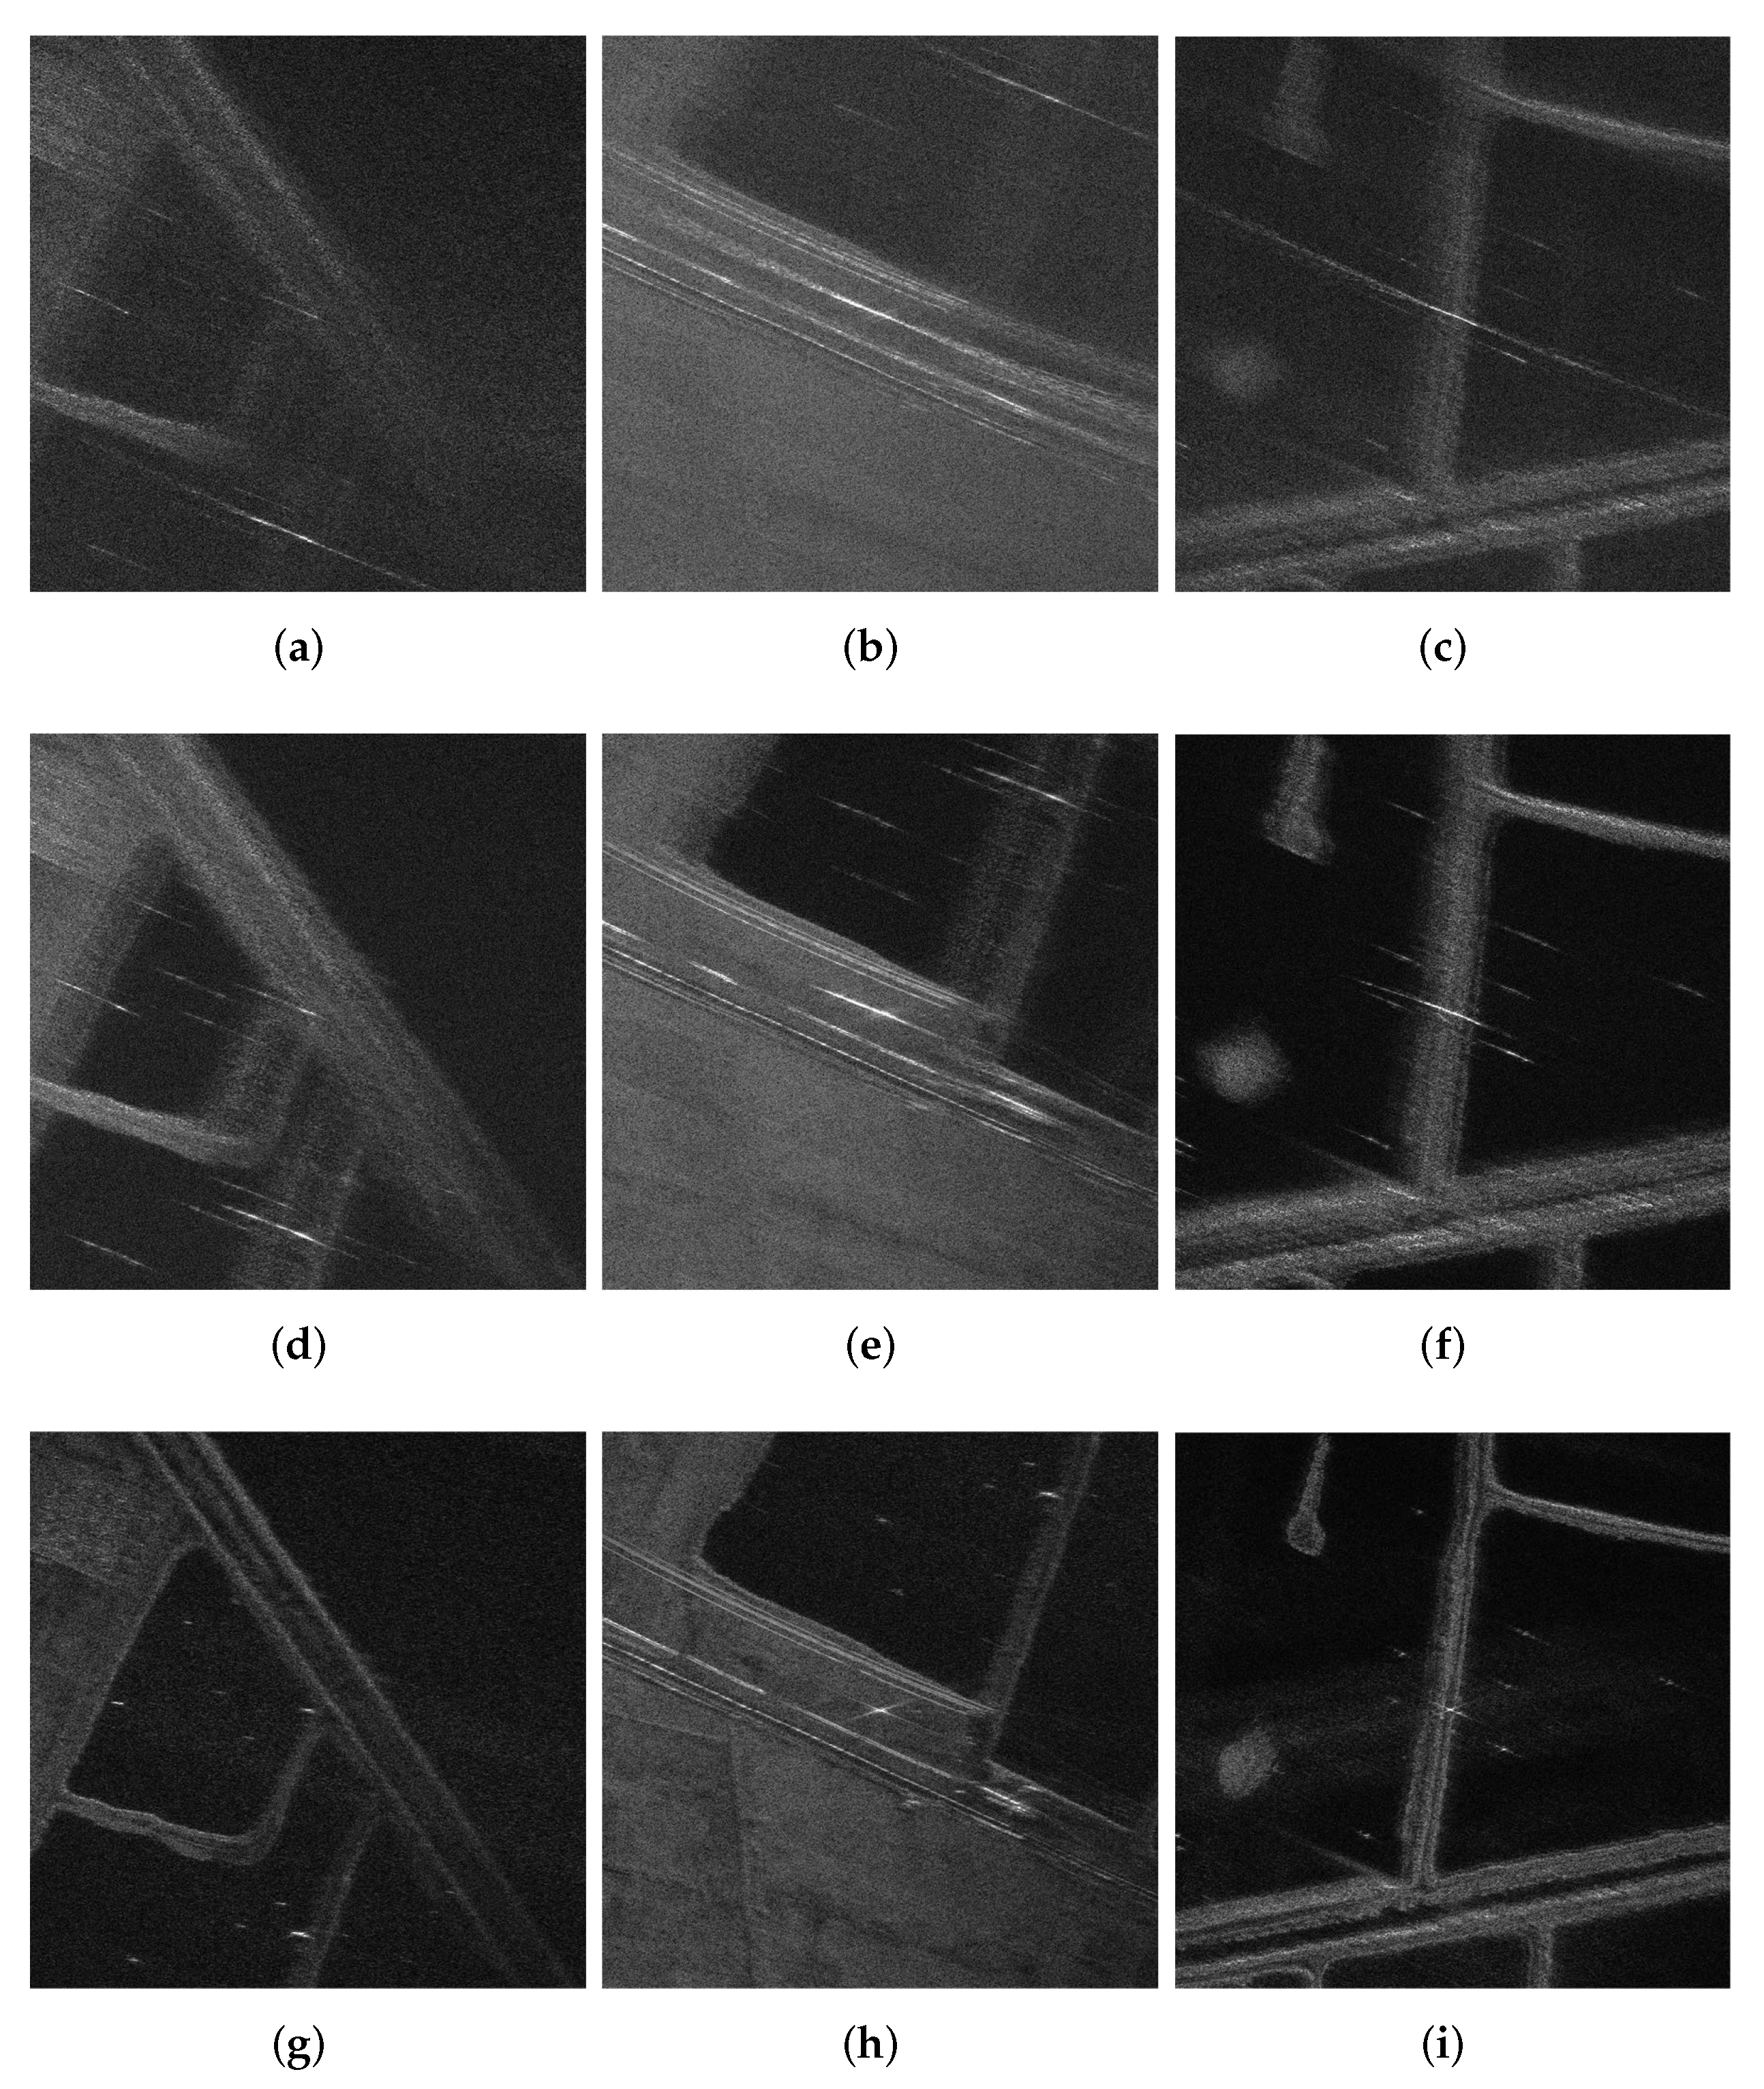
By using the time-domain imaging algorithm, the bistatic SAR imaging results are given in Figure 14. Figure 14b shows the bistatic SAR imaging result without motion compensation, which is noticeably defocused. Figure 14c presents the imaging result with conventional autofocus [25], where the focusing quality is improved. Figure 14d illustrates the imaging result with the bistatic trajectories estimated by the proposed method, where the focusing quality is clearly better than the imaging result with conventional autofocus. Meanwhile, the enlarged images acquired by different methods of the small regions around the scattering points labelled in Figure 14 are shown in Figure 15, and the range and azimuth profiles of these scatters are shown in Figure 16, where the best performance could be achieved by using the proposed method. For quantitatively evaluating the performance of different imaging schemes, the image entropy, contrast and sharpness of the final images on the experimental data, and the IRW, PSLR and ISLR of selected scattering points are presented in Table 4. It can be observed that the best values of quantitative quality indexes can be achieved by using the proposed method.
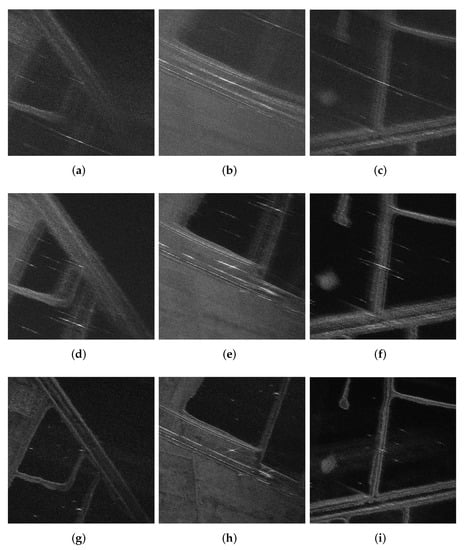
Figure 15.
Local images without motion compensation around point (a) A, (b) B, and (c) C. Local images with conventional autofocus around point (d) A, (e) B, and (f) C, and local images with the proposed method around point (g) A, (h) B, and (i) C.
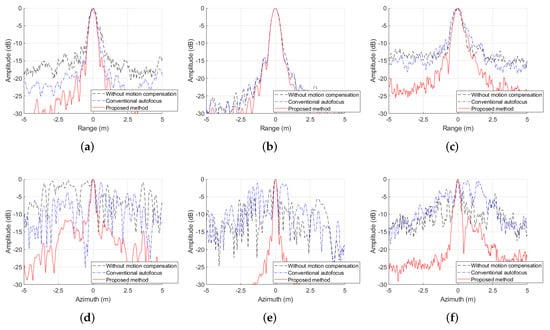
Figure 16.
Profile properties of the processing results on the real experimental data: (a) range profiles of A; (b) range profiles of B; (c) range profiles of C; (d) azimuth profiles of A; (e) azimuth profiles of B; (f) azimuth profiles of C.

Table 4.
Processing performance on the experimental data.
5. Conclusions
In this paper, the 3D trajectory error of BiSAR is estimated and compensated for by estimating the Doppler error with wavelet transform and the autofocus method and solving linear equations with the least squares method. With the proposed method, both the cross-cell RCM error and the spatial variance of motion error could be compensated for, and a well-focused BiSAR image could be obtained by using the estimated trajectories. Simulation and experiment results demonstrated that the BiSAR trajectory error could be effectively corrected by the proposed method. The capability of fully automatic processing of the proposed method will be studied in the future, where detection and recognition algorithms may be additionally involved.
Author Contributions
Conceptualization, Y.L.; Methodology, Y.L. and J.W.; Writing—original draft, Y.L. and W.L.; Writing—review and editing, Z.S. and H.S.; Project administration, W.L. and J.W.; Funding acquisition, W.L. and J.W.; Supervision, J.Y. All authors have read and agreed to the published version of the manuscript.
Funding
This research was funded by the National Natural Science Foundation, No. 62171107.
Conflicts of Interest
The authors declare no conflict of interest.
References
- Qiu, X.; Ding, C.; Hu, D. Bistatic SAR Data Processing Algorithms; Wiley: Singapore, 2013. [Google Scholar]
- Wang, R.; Deng, Y. Bistatic SAR System and Signal Processing Technology; Springer: Singapore, 2018. [Google Scholar]
- Yang, J. Bistatic Synthetic Aperture Radar; Elsevier: Amsterdam, The Netherlands, 2022. [Google Scholar]
- Pu, W.; Wu, J.; Huang, Y.; Wang, X.; Yang, J.; Li, W.; Yang, H. Nonsystematic Range Cell Migration Analysis and Autofocus Correction for Bistatic Forward-looking SAR. IEEE Trans. Geosci. Remote Sens. 2018, 56, 6556–6570. [Google Scholar] [CrossRef]
- Bao, M.; Zhou, S.; Yang, L.; Xing, M.; Zhao, L. Data-Driven Motion Compensation for Airborne Bistatic SAR Imagery Under Fast Factorized Back Projection Framework. IEEE J. Sel. Top. Appl. Earth Obs. Remote Sens. 2021, 14, 1728–1740. [Google Scholar] [CrossRef]
- Xu, G.; Zhou, S.; Yang, L.; Deng, S.; Wang, Y.; Xing, M. Efficient Fast Time-Domain Processing Framework for Airborne Bistatic SAR Continuous Imaging Integrated With Data-Driven Motion Compensation. IEEE Trans. Geosci. Remote Sens. 2022, 60, 1–15. [Google Scholar] [CrossRef]
- Li, Y.; Li, W.; Sun, Z.; Wu, J.; Li, Z.; Yang, J. An Autofocus Scheme of Bistatic SAR Considering Cross-Cell Residual Range Migration. IEEE Geosci. Remote Sens. Lett. 2022, 19, 1–5. [Google Scholar] [CrossRef]
- Pu, W.; Wu, J.; Huang, Y.; Li, W.; Sun, Z.; Yang, J.; Yang, H. Motion Errors and Compensation for Bistatic Forward-Looking SAR With Cubic-Order Processing. IEEE Trans. Geosci. Remote Sens. 2016, 54, 6940–6957. [Google Scholar] [CrossRef]
- Pu, W.; Wu, J.; Huang, Y.; Du, K.; Li, W.; Yang, J.; Yang, H. A Rise-Dimensional Modeling and Estimation Method for Flight Trajectory Error in Bistatic Forward-Looking SAR. IEEE J. Sel. Top. Appl. Earth Obs. Remote Sens. 2017, 10, 5001–5015. [Google Scholar] [CrossRef]
- Pu, W.; Wu, J.; Huang, Y.; Yang, J.; Yang, H. Fast Factorized Backprojection Imaging Algorithm Integrated With Motion Trajectory Estimation for Bistatic Forward-Looking SAR. IEEE J. Sel. Top. Appl. Earth Obs. Remote Sens. 2019, 12, 3949–3965. [Google Scholar] [CrossRef]
- Mao, X.; Shi, T.; Zhan, R.; Zhang, Y.D.; Zhu, D. Structure-Aided 2D Autofocus for Airborne Bistatic Synthetic Aperture Radar. IEEE Trans. Geosci. Remote Sens. 2021, 59, 7500–7516. [Google Scholar] [CrossRef]
- Chim, M.C.; Perissin, D. Motion compensation of L-band SAR using GNSS-INS. In Proceedings of the 2017 IEEE International Geoscience and Remote Sensing Symposium (IGARSS), Fort Worth, TX, USA, 23–28 July 2017; pp. 3433–3436. [Google Scholar]
- Song, J.; Xu, C. A SAR motion compensation algorithm based on INS and GPS. In Proceedings of the IET International Radar Conference (IET IRC 2020), Chongqing, China, 4–6 November 2020; pp. 576–581. [Google Scholar]
- Wang, B.; Xiang, M.; Chen, L. Motion compensation on baseline oscillations for distributed array SAR by combining interferograms and inertial measurement. IET Radar Sonar Navig. 2017, 11, 1285–1291. [Google Scholar] [CrossRef]
- Li, Z.; Huang, C.; Sun, Z.; An, H.; Wu, J.; Yang, J. BeiDou-Based Passive Multistatic Radar Maritime Moving Target Detection Technique via Space-Time Hybrid Integration Processing. IEEE Trans. Geosci. Remote Sens. 2022, 60, 1–13. [Google Scholar] [CrossRef]
- Li, N.; Wang, R.; Deng, Y.; Yu, W.; Zhang, Z.; Liu, Y. Autofocus Correction of Residual RCM for VHR SAR Sensors With Light-Small Aircraft. IEEE Trans. Geosci. Remote Sens. 2017, 55, 441–452. [Google Scholar] [CrossRef]
- Wang, Z.; Liu, F.; Zeng, T.; Wang, C. A Novel Motion Compensation Algorithm Based on Motion Sensitivity Analysis for Mini-UAV-Based BiSAR System. IEEE Trans. Geosci. Remote Sens. 2022, 60, 1–13. [Google Scholar] [CrossRef]
- Chen, J.; Xing, M.; Yu, H.; Liang, B.; Peng, J.; Sun, G.C. Motion Compensation/Autofocus in Airborne Synthetic Aperture Radar: A Review. IEEE Geosci. Remote Sens. Mag. 2021, 10, 185–206. [Google Scholar] [CrossRef]
- Zhang, T.; Liao, G.; Li, Y.; Gu, T.; Zhang, T.; Liu, Y. An Improved Time-Domain Autofocus Method Based on 3D Motion Errors Estimation. IEEE Trans. Geosci. Remote Sens. 2022, 60, 1–16. [Google Scholar]
- Samczynski, P.; Kulpa, K.S. Coherent MapDrift Technique. IEEE Trans. Geosci. Remote Sens. 2010, 48, 1505–1517. [Google Scholar] [CrossRef]
- Evers, A.; Jackson, J.A. A Generalized Phase Gradient Autofocus Algorithm. IEEE Trans. Comput. Imaging 2019, 5, 606–619. [Google Scholar] [CrossRef]
- Miao, Y.; Wu, J.; Yang, J. Azimuth Migration-Corrected Phase Gradient Autofocus for Bistatic SAR Polar Format Imaging. IEEE Geosci. Remote Sens. Lett. 2021, 18, 697–701. [Google Scholar] [CrossRef]
- Fienup, J.R.; Miller, J.J. Aberration correction by maximizing generalized sharpness metrics. J. Opt. Soc. Am. A 2003, 20, 609–620. [Google Scholar] [CrossRef]
- Ash, J.N. An Autofocus Method for Backprojection Imagery in Synthetic Aperture Radar. IEEE Geosci. Remote Sens. Lett. 2012, 9, 104–108. [Google Scholar] [CrossRef]
- Hu, K.; Zhang, X.; He, S.; Zhao, H.; Shi, J. A Less-Memory and High-Efficiency Autofocus Back Projection Algorithm for SAR Imaging. IEEE Geosci. Remote Sens. Lett. 2015, 12, 890–894. [Google Scholar]
- Berizzi, F.; Corsini, G. Autofocusing of inverse synthetic aperture radar images using contrast optimization. IEEE Trans. Aerosp. Electron. Syst. 1996, 32, 1185–1191. [Google Scholar] [CrossRef]
- Jungang, Y.; Xiaotao, H.; Tian, J.; Guoyi, X.; Zhimin, Z. An Interpolated Phase Adjustment by Contrast Enhancement Algorithm for SAR. IEEE Geosci. Remote Sens. Lett. 2011, 8, 211–215. [Google Scholar] [CrossRef]
- Kragh, T. Monotonic Iterative Algorithm for Minimum-Entropy Autofocus. In Proceedings of the Adaptive Sensor Array Processing (ASAP) Workshop, Lexington, MA, USA, 6–7 June 2006. [Google Scholar]
- Xiong, T.; Xing, M.; Wang, Y.; Wang, S.; Sheng, J.; Guo, L. Minimum-Entropy-Based Autofocus Algorithm for SAR Data Using Chebyshev Approximation and Method of Series Reversion, and Its Implementation in a Data Processor. IEEE Trans. Geosci. Remote Sens. 2014, 52, 1719–1728. [Google Scholar] [CrossRef]
- Yang, L.; Xing, M.; Wang, Y.; Zhang, L.; Bao, Z. Compensation for the NsRCM and Phase Error After Polar Format Resampling for Airborne Spotlight SAR Raw Data of High Resolution. IEEE Geosci. Remote Sens. Lett. 2013, 10, 165–169. [Google Scholar] [CrossRef]
- Mao, X.; Zhu, D.; Zhu, Z. Autofocus Correction of APE and Residual RCM in Spotlight SAR Polar Format Imagery. IEEE Trans. Aerosp. Electron. Syst. 2013, 49, 2693–2706. [Google Scholar] [CrossRef]
- Yang, Q.; Guo, D.; Li, Z.; Wu, J.; Huang, Y.; Yang, H.; Yang, J. Bistatic Forward-Looking SAR Motion Error Compensation Method Based on Keystone Transform and Modified Autofocus Back-Projection. In Proceedings of the 2019 IEEE International Geoscience and Remote Sensing Symposium IGARSS, Yokohama, Japan, 28 July–2 August 2019; pp. 827–830. [Google Scholar]
- Ran, L.; Liu, Z.; Li, T.; Xie, R.; Zhang, L. Extension of Map-Drift Algorithm for Highly Squinted SAR Autofocus. IEEE J. Sel. Top. Appl. Earth Obs. Remote Sens. 2017, 10, 4032–4044. [Google Scholar] [CrossRef]
- Chen, J.; Liang, B.; Zhang, J.; Yang, D.G.; Deng, Y.; Xing, M. Efficiency and Robustness Improvement of Airborne SAR Motion Compensation With High Resolution and Wide Swath. IEEE Geosci. Remote Sens. Lett. 2022, 19, 1–5. [Google Scholar] [CrossRef]
- Chen, J.; Liang, B.; Yang, D.G.; Zhao, D.J.; Xing, M.; Sun, G.C. Two-Step Accuracy Improvement of Motion Compensation for Airborne SAR With Ultrahigh Resolution and Wide Swath. IEEE Trans. Geosci. Remote Sens. 2019, 57, 7148–7160. [Google Scholar] [CrossRef]
- Liang, Y.; Dang, Y.; Li, G.; Wu, J.; Xing, M. A Two-Step Processing Method for Diving-Mode Squint SAR Imaging With Subaperture Data. IEEE Trans. Geosci. Remote Sens. 2020, 58, 811–825. [Google Scholar] [CrossRef]
- Zhu, D.; Xiang, T.; Wei, W.; Ren, Z.; Yang, M.; Zhang, Y.; Zhu, Z. An Extended Two Step Approach to High-Resolution Airborne and Spaceborne SAR Full-Aperture Processing. IEEE Trans. Geosci. Remote Sens. 2021, 59, 8382–8397. [Google Scholar] [CrossRef]
- Lin, H.; Chen, J.; Xing, M.; Chen, X.; You, D.; Sun, G. 2D Frequency Autofocus for Squint Spotlight SAR Imaging With Extended Omega-K. IEEE Trans. Geosci. Remote Sens. 2022, 60, 1–12. [Google Scholar]
- Lin, H.; Chen, J.; Xing, M.; Chen, X.; Li, N.; Xie, Y.; Sun, G.C. Time-Domain Autofocus for Ultrahigh Resolution SAR Based on Azimuth Scaling Transformation. IEEE Trans. Geosci. Remote Sens. 2022, 60, 1–12. [Google Scholar] [CrossRef]
- Mao, X.; He, X.; Li, D. Knowledge-Aided 2D Autofocus for Spotlight SAR Range Migration Algorithm Imagery. IEEE Trans. Geosci. Remote Sens. 2018, 56, 5458–5470. [Google Scholar] [CrossRef]
- Ran, L.; Liu, Z.; Zhang, L.; Li, T.; Xie, R. An Autofocus Algorithm for Estimating Residual Trajectory Deviations in Synthetic Aperture Radar. IEEE Trans. Geosci. Remote Sens. 2017, 55, 3408–3425. [Google Scholar] [CrossRef]
- Chen, V.; Ling, H. Time–Frequency Transforms for Radar Imaging and Signal Analysis; Artech House: Norwood, MA, USA, 2002. [Google Scholar]
- Li, Z.; Zhang, X.; Yang, Q.; Xiao, Y.; An, H.; Yang, H.; Wu, J.; Yang, J. Hybrid SAR-ISAR Image Formation via Joint FrFT-WVD Processing for BFSAR Ship Target High-Resolution Imaging. IEEE Trans. Geosci. Remote Sens. 2022, 60, 1–13. [Google Scholar] [CrossRef]
- Akujuobi, C. Wavelets and Wavelet Transform Systems and Their Applications; Springer: Cham, Switzerland, 2022. [Google Scholar]
- Li, Z.; Li, S.; Liu, Z.; Yang, H.; Wu, J.; Yang, J. Bistatic Forward-Looking SAR MP-DPCA Method for Space-Time Extension Clutter Suppression. IEEE Trans. Geosci. Remote Sens. 2020, 58, 6565–6579. [Google Scholar] [CrossRef]
- Li, Z.; Wang, S.; Jiang, J.; Yu, Y.; Yang, H.; Liu, W.; Zhang, P.; Liu, T. Orthogonal phase demodulation system with wide frequency band response based on birefringent crystals and polarization technology. In Proceedings of the SPIE 11901, Advanced Sensor Systems and Applications XI, 119010Q, Nantong, China, 9 October 2021. [Google Scholar]
- Lyche, T. Numerical Linear Algebra and Matrix Factorizations; Springer: Cham, Switzerland, 2020. [Google Scholar]
- Li, Y.; Xu, G.; Zhou, S.; Xing, M.; Song, X. A Novel CFFBP Algorithm With Noninterpolation Image Merging for Bistatic Forward-Looking SAR Focusing. IEEE Trans. Geosci. Remote Sens. 2022, 60, 1–16. [Google Scholar] [CrossRef]
- Sun, H.; Sun, Z.; Chen, T.; Miao, Y.; Wu, J.; Yang, J. An Efficient Backprojection Algorithm Based on Wavenumber-Domain Spectral Splicing for Monostatic and Bistatic SAR Configurations. Remote Sens. 2022, 14, 1885. [Google Scholar] [CrossRef]
- Miao, Y.; Wu, J.; Li, Z.; Yang, J. A Generalized Wavefront-Curvature-Corrected Polar Format Algorithm to Focus Bistatic SAR Under Complicated Flight Paths. IEEE J. Sel. Top. Appl. Earth Obs. Remote Sens. 2020, 13, 3757–3771. [Google Scholar] [CrossRef]
- Miao, Y.; Yang, J.; Wu, J.; Sun, Z.; Chen, T. Spatially Variable Phase Filtering Algorithm Based on Azimuth Wavenumber Regularization for Bistatic Spotlight SAR Imaging Under Complicated Motion. IEEE Trans. Geosci. Remote Sens. 2022, 60, 1–15. [Google Scholar] [CrossRef]
- Li, Z.; Ye, H.; Liu, Z.; Sun, Z.; An, H.; Wu, J.; Yang, J. Bistatic SAR Clutter-Ridge Matched STAP Method for Nonstationary Clutter Suppression. IEEE Trans. Geosci. Remote Sens. 2022, 60, 1–14. [Google Scholar] [CrossRef]
- Esri. “Imagery” [Basemap]. Scale Not Given. “World Imagery”. 2022. Available online: https://www.arcgis.com/home/item.html?id=10df2279f9684e4a9f6a7f08febac2a9 (accessed on 9 September 2022).
Publisher’s Note: MDPI stays neutral with regard to jurisdictional claims in published maps and institutional affiliations. |
© 2022 by the authors. Licensee MDPI, Basel, Switzerland. This article is an open access article distributed under the terms and conditions of the Creative Commons Attribution (CC BY) license (https://creativecommons.org/licenses/by/4.0/).

