1. Introduction
This work is devoted to the study of the features of the influence of the ionosphere on the propagation of P-band radio waves (430 MHz) and numerical simulation of the rotation of the polarization vector in the ionospheric plasma. The relevance of the work is determined by the problems of remote sensing of the Earth’s surface with space antennas with a synthesized aperture [
1], as well as the problems of reconstructing the profile of the electron concentration of the ionospheric plasma by radio tomography methods [
2,
3]. In [
4,
5,
6], we studied the influence of the ionosphere without considering the curvature of the Earth on the parameters of radio signals, the magnitude of the Faraday rotation angle and phase incursion. In particular, in [
4], we considered a high-latitude daytime two-layer model of the Earth’s ionosphere, which does not contain local inhomogeneities. In [
5,
6], a high-latitude model of the Earth’s nighttime ionosphere and a mid-latitude model of the daytime ionosphere are considered. The influence of horizontal electron concentration gradients in the vicinity of the wave channel between the
F and
E layers was studied. However, the influence of local inhomogeneities was not considered in these works. In this paper, we consider spherical models of the ionosphere and possible large-scale inhomogeneities of the plasma along the propagation path of the radio signals. The paper compares two cases: when the vector of the magnetic field strength is in the plane perpendicular to the plane of propagation, and the case when this vector lies in the plane of propagation. Particular attention is paid to the study of the polarization coefficients, which was not carried out in previous work [
4,
5,
6].
The P-band of electromagnetic waves, in contrast to the higher-frequency C-, S- and L-bands [
7,
8,
9], is interesting in that it has an increased penetrating ability into vegetation, soil and snow covers and allows both surface and subsurface sounding. Aircraft SARs of the P-band are actively used in Russia, Germany, France, Sweden and other countries for the study of earth resources [
10,
11,
12,
13]. In Russia, a multifrequency polarimetric aviation radar complex “IMARK” [
10] was created, consisting of four SARs, installed on a TU-134 aircraft and operating simultaneously in the X, L, P and VHF frequency bands. In Germany and France, RSA systems PolSAR and (Pol-)InSAR [
11,
12,
13] are used, which are installed on relatively small aircraft. Much attention is paid to remote sensing in the P-band for studying soil moisture, biometric and moisture characteristics of forests, crops, sea ice, snow cover, etc. The P-band is highly informative for studying forests. A detailed analysis of the radar image shows the seasonal variability of the backward radar reflection, its dependence on the type and age of trees, the moisture regime of vegetation and forest canopy, biomass, etc.
When studying earth covers on a global scale, it is necessary to carry out radar sounding from platforms located in space. In the next few years, for the first time, space experiments (SE) with P-band SAR are planned: in Russia, the project was named “MKS-RSA (P)” [
14,
15], and in the European Space Agency (ESA), “BIOMASS” [
16,
17]. Difficulties in conducting FE in the P range are associated with the strong influence of the ionosphere during the passage of electromagnetic radiation [
18,
19]. In this sense, the ionosphere is a complex filter, and passing through it changes the amplitude, phase and polarization of electromagnetic waves. In addition, spatio-temporal inhomogeneities are observed in the ionosphere, and its characteristics depend on latitude and solar activity.
In an abbreviated form, the results of the work were presented at the 13th European Conference on Synthetic Aperture Radar (EUSAR-2021) [
20].
2. Models of the Electron Concentration of the Ionosphere
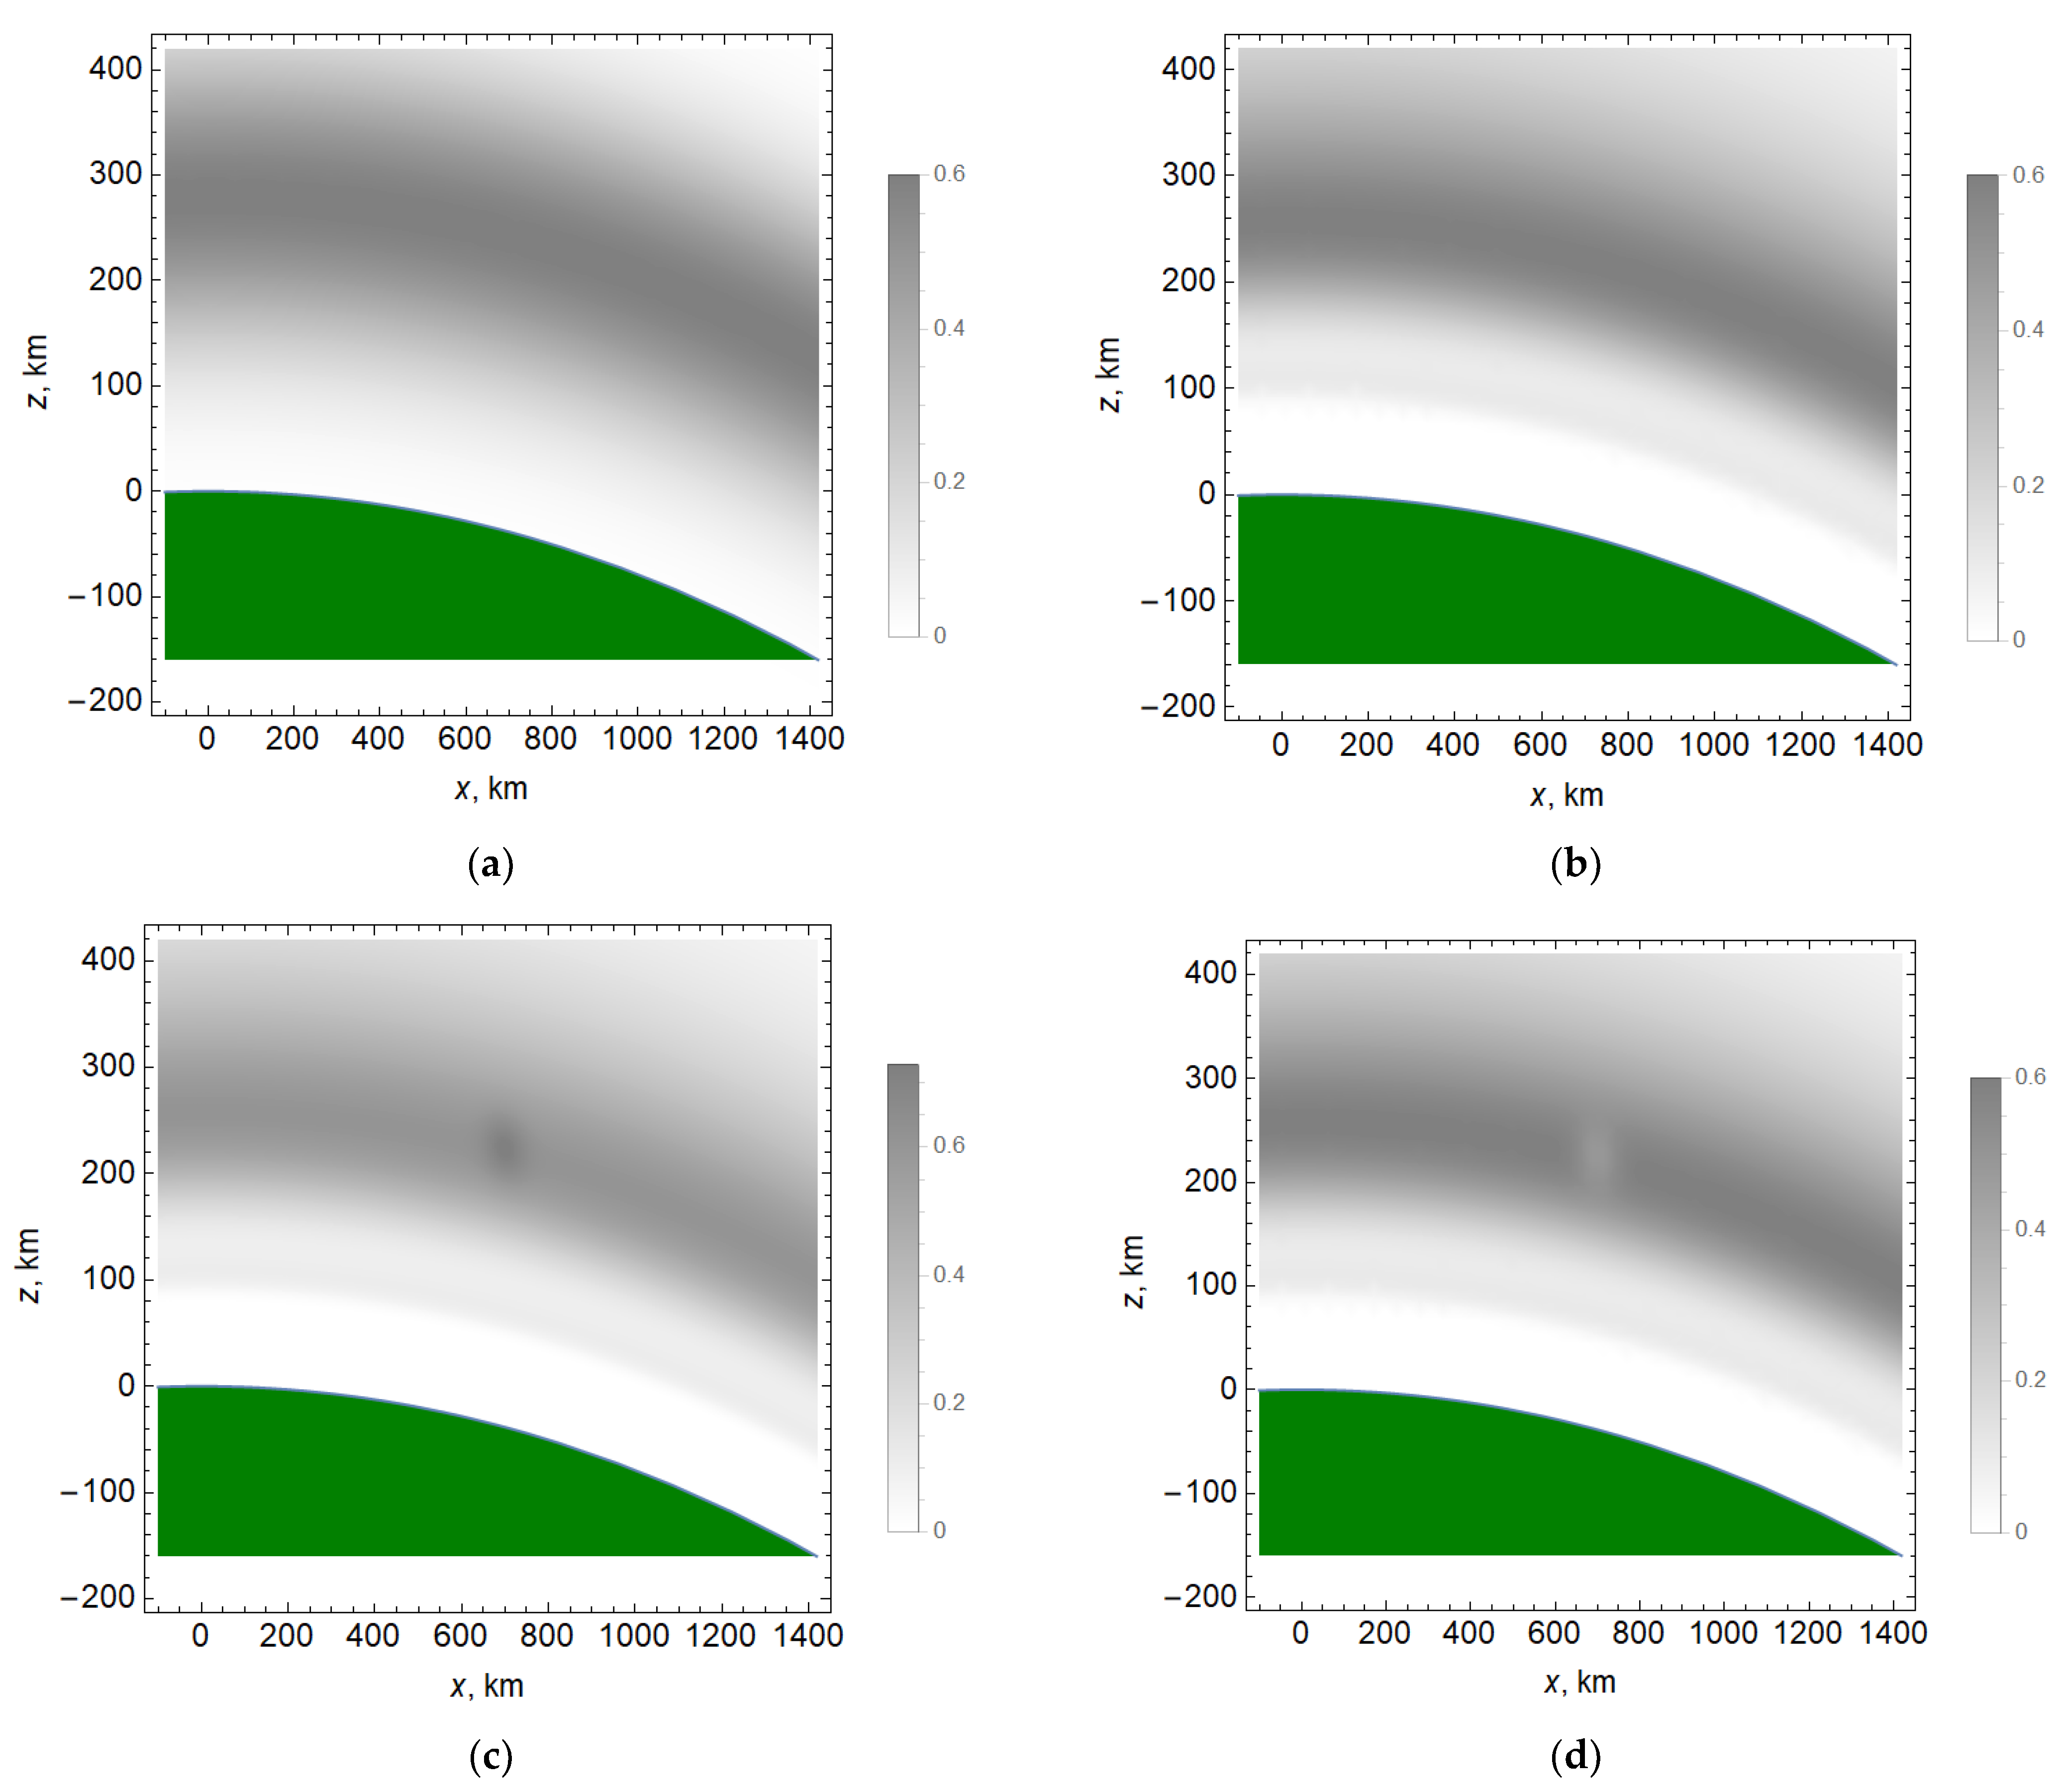
Four models of electron concentration are considered (
Figure 1a–d): an exponential model (1), a two-layer model (2), a two-layer model with local inhomogeneity with increased electron concentration (3) and a two-layer model with local inhomogeneity with reduced electron concentration (4). The distribution of the electron concentration in the ionosphere is shown in gray. Darker regions correspond to a higher electron concentration. Background values are shown so that one unit corresponds to 10
6 cm
–3. Green indicates the surface of the Earth. These models are consistent with the daytime ionospheric plasma model (12 h) relative to the point with coordinates 40 degrees north latitude, 30 degrees east longitude. Disturbances in models 3 and 4 are located at the maximum of the F layer of the ionosphere.
To calculate the electron concentration in model 1, the following formula was used:
where
z0 = 280 km,
zm = 140 km,
N0 = 6.1 × 10
5 cm
−3 and
ρ is the distance from the Earth’s surface to the observation point along the ray connecting the center of the Earth with the observation point.
z0 is the height of the ionospheric layer maximum,
N0 is the value of the electron density at the ionospheric layer maximum and
zm is the height distance from the layer maximum at which the electron density decreases by a factor of
e.
To calculate the electron concentration in models 2, 3 and 4, a formula was used containing three exponentials and a perturbation as an additional term:
In Formula (2), z01 = 196 km, zm1 = 40 km, N01 = 7.025 104 cm−3; z02 = 263 km, zm2 = 55 km, N02 = 5.618 × 105 cm−3; and z03 = 108 km, zm3 = 12.5 km, N03 = 1.046 105 cm−3.
Parameters z01, z02 and z03 characterize the height of three ionospheric layers (F (F1, F2) and E), and parameters zm1, zm2 and zm3 characterize, to some extent, the width of each layer (Chapman layer). The values N01, N02 and N03 are the maximum values of the electron concentration for each layer.
The disturbance parameters were chosen as follows: xΔ = 700 km, yΔ = 0 km, zΔ = 300 km; xm = 50 km, ym = 50 km, zm = 30 km. The parameters xΔ, yΔ and zΔ describe the position of the center of inhomogeneity, and the parameters xm, ym and zm describe its size.
In , Rz is the Earth’s radius and XT = 700 km.
The parameter β shows the proportion of additional maximum ionization (or recombination) compared to the value of the electron density in the maximum of the ionospheric layer in model (1). If the parameter β = 0, we obtain model 2; if β = 0.2, we obtain model 3; if β = −0.2, we obtain model 4.
The ionospheric model (Formula (2)) is built based on experimental data [
21]. They reflect the undisturbed state of the mid-latitude daytime ionosphere. Model (1) is constructed in such a way that the maximum and width of the maximum electron concentration of the layer
F, obtained by Formulas (1) and (2), more or less coincide. Finally, the perturbation of the electron density (Formula (3)) is a “ball” located above the observation point (receiver) on the Earth’s surface at the maximum of the
F layer.
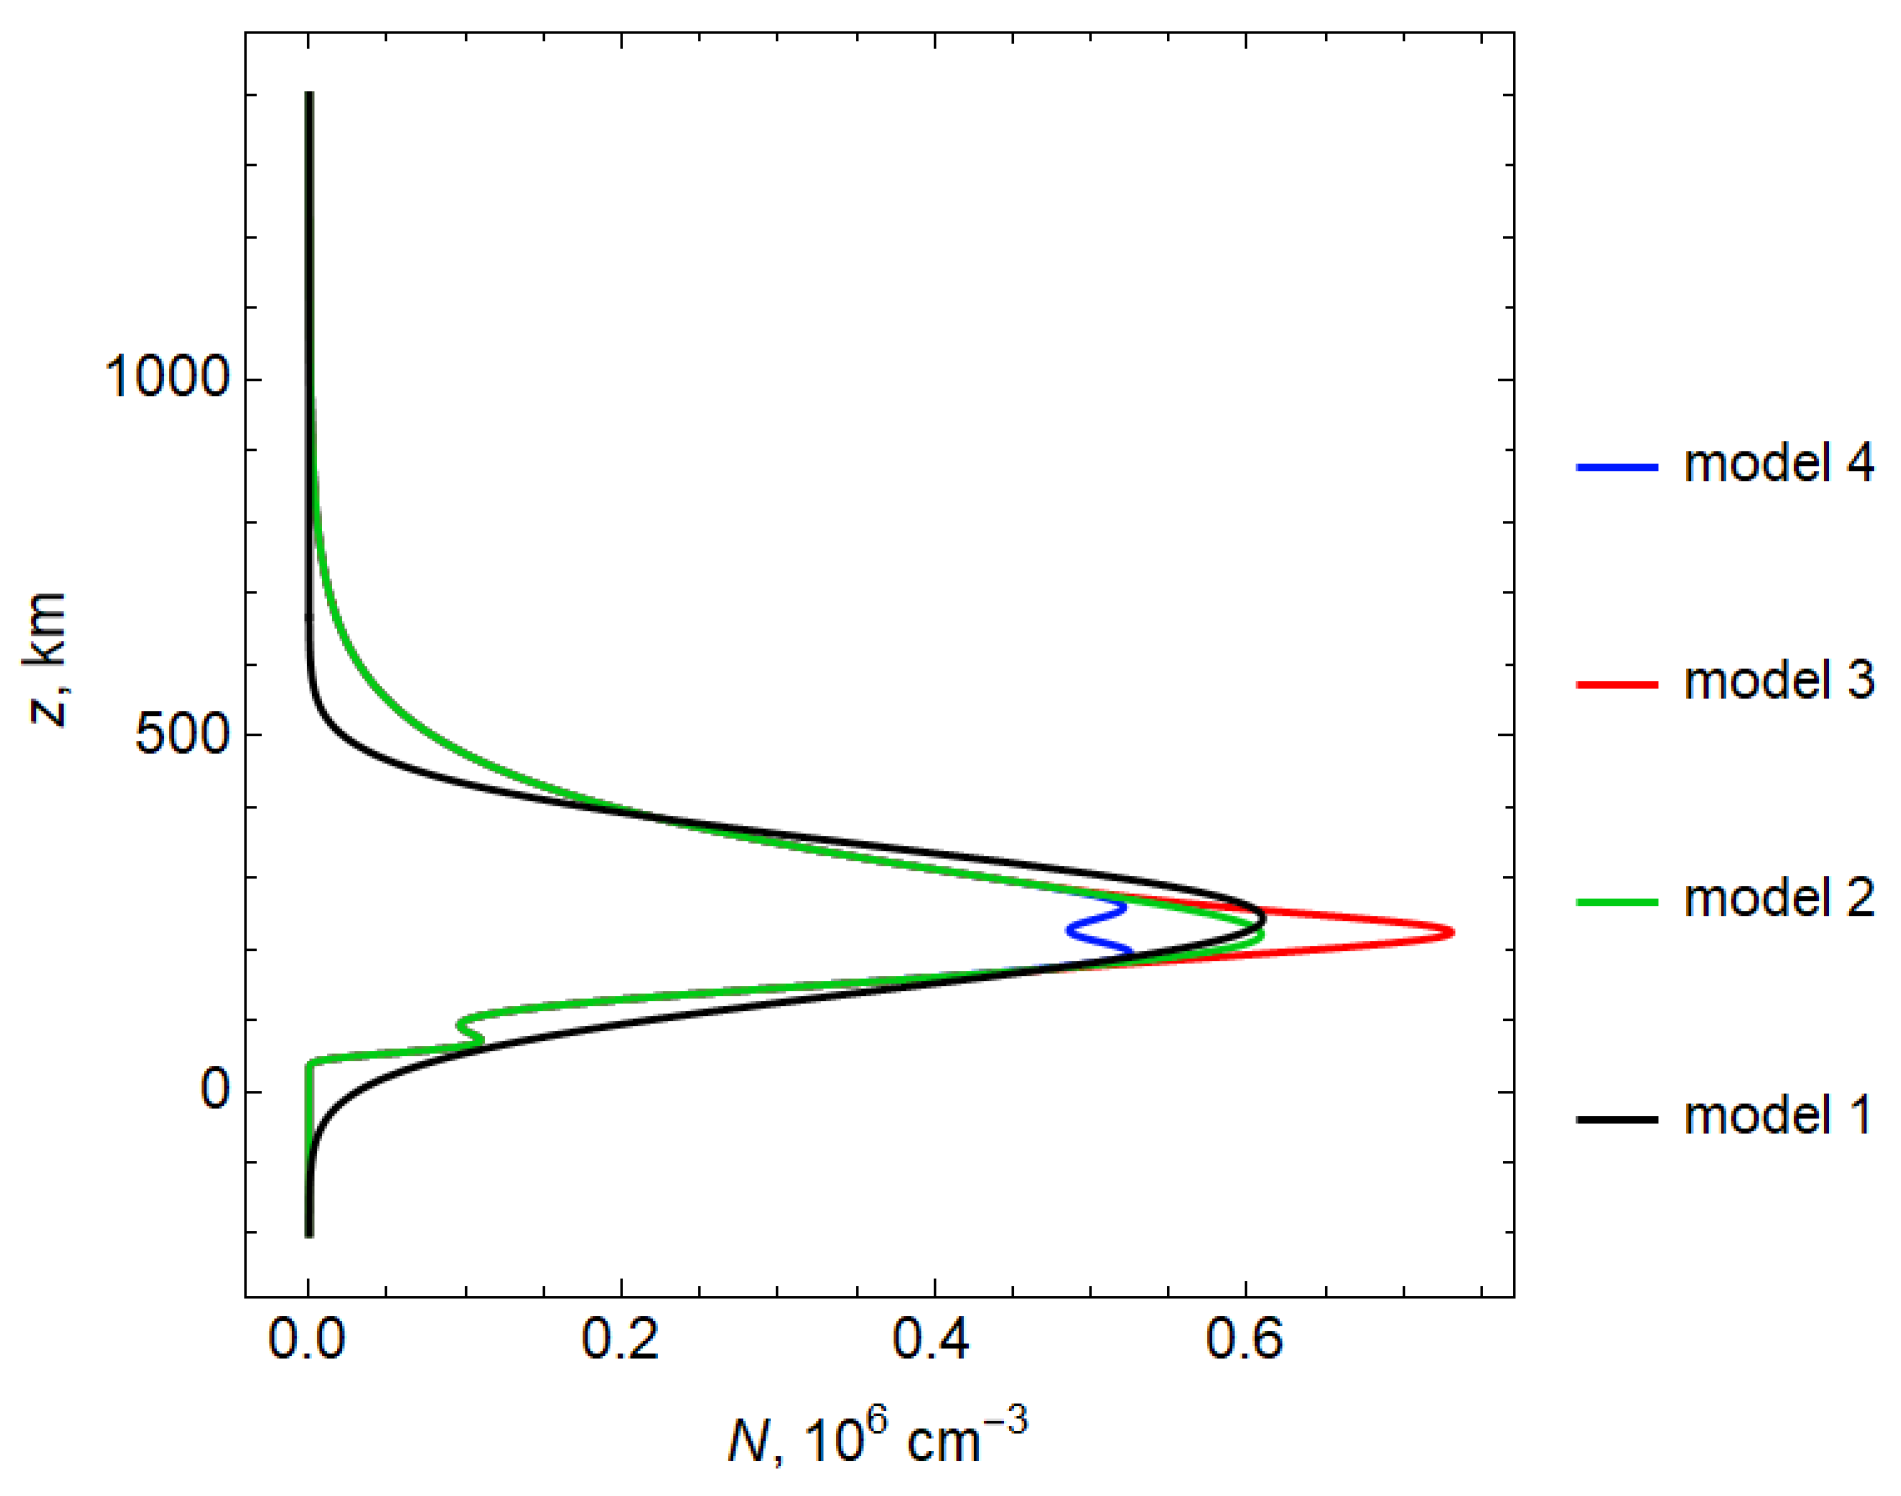
Figure 2 shows the dependence of the electron concentration on altitude for the observation point with the coordinate
x = 700 km, relative to which all further calculations were carried out.
Here and in other figures, model 1 is represented in black, model 2 in green, model 3 in red and model 4 in blue. Exponential model 1 is chosen to correspond to two-layer model 2 in the vicinity of the maximum of the ionospheric layer F.
3. Calculation Methods
Let
ω = 2π
f be the circular radiation frequency,
f the working frequency,
the wave vector,
the coordinates of the observation point and
t the group time. The Appleton–Hartree (Lassen) formula is valid for the effective dielectric constant [
22,
23]:
where
ν is the ratio of the square of the circular plasma frequency
ωp to the square of the operating circular frequency
ω,
and the parameter
u is the ratio of the square of the gyromagnetic circular frequency
ωH to the square of the circular frequency
ω:
In Formulas (5) and (6), e is the electron charge, me is the mass of the electron, n is the electron concentration at a fixed point and H0 is the magnitude of the strength of the Earth’s magnetic field. The “+” sign in Formula (4) corresponds to an ordinary wave, and the “−” sign corresponds to an extraordinary one.
Since the circular radiation frequency, the frequency in this problem, is much higher than the plasma frequency
ωp, we assume that effective permittivity of the propagation medium has the form:
To determine the ray paths in the work, a bicharacteristic system of equations [
24,
25,
26]
with the Hamiltonian
was used. The initial wave vector
depends parametrically on the ray exit angle α
0.
c is the speed of light.
Performing differentiation in system (8), taking into account the Hamiltonian (9), we obtain:
5. Phase Variations
Consider the influence of the ionosphere on the phase variation along the ray. The derivative of the phase with respect to group time is determined by the formula [
4,
5,
6,
27]:
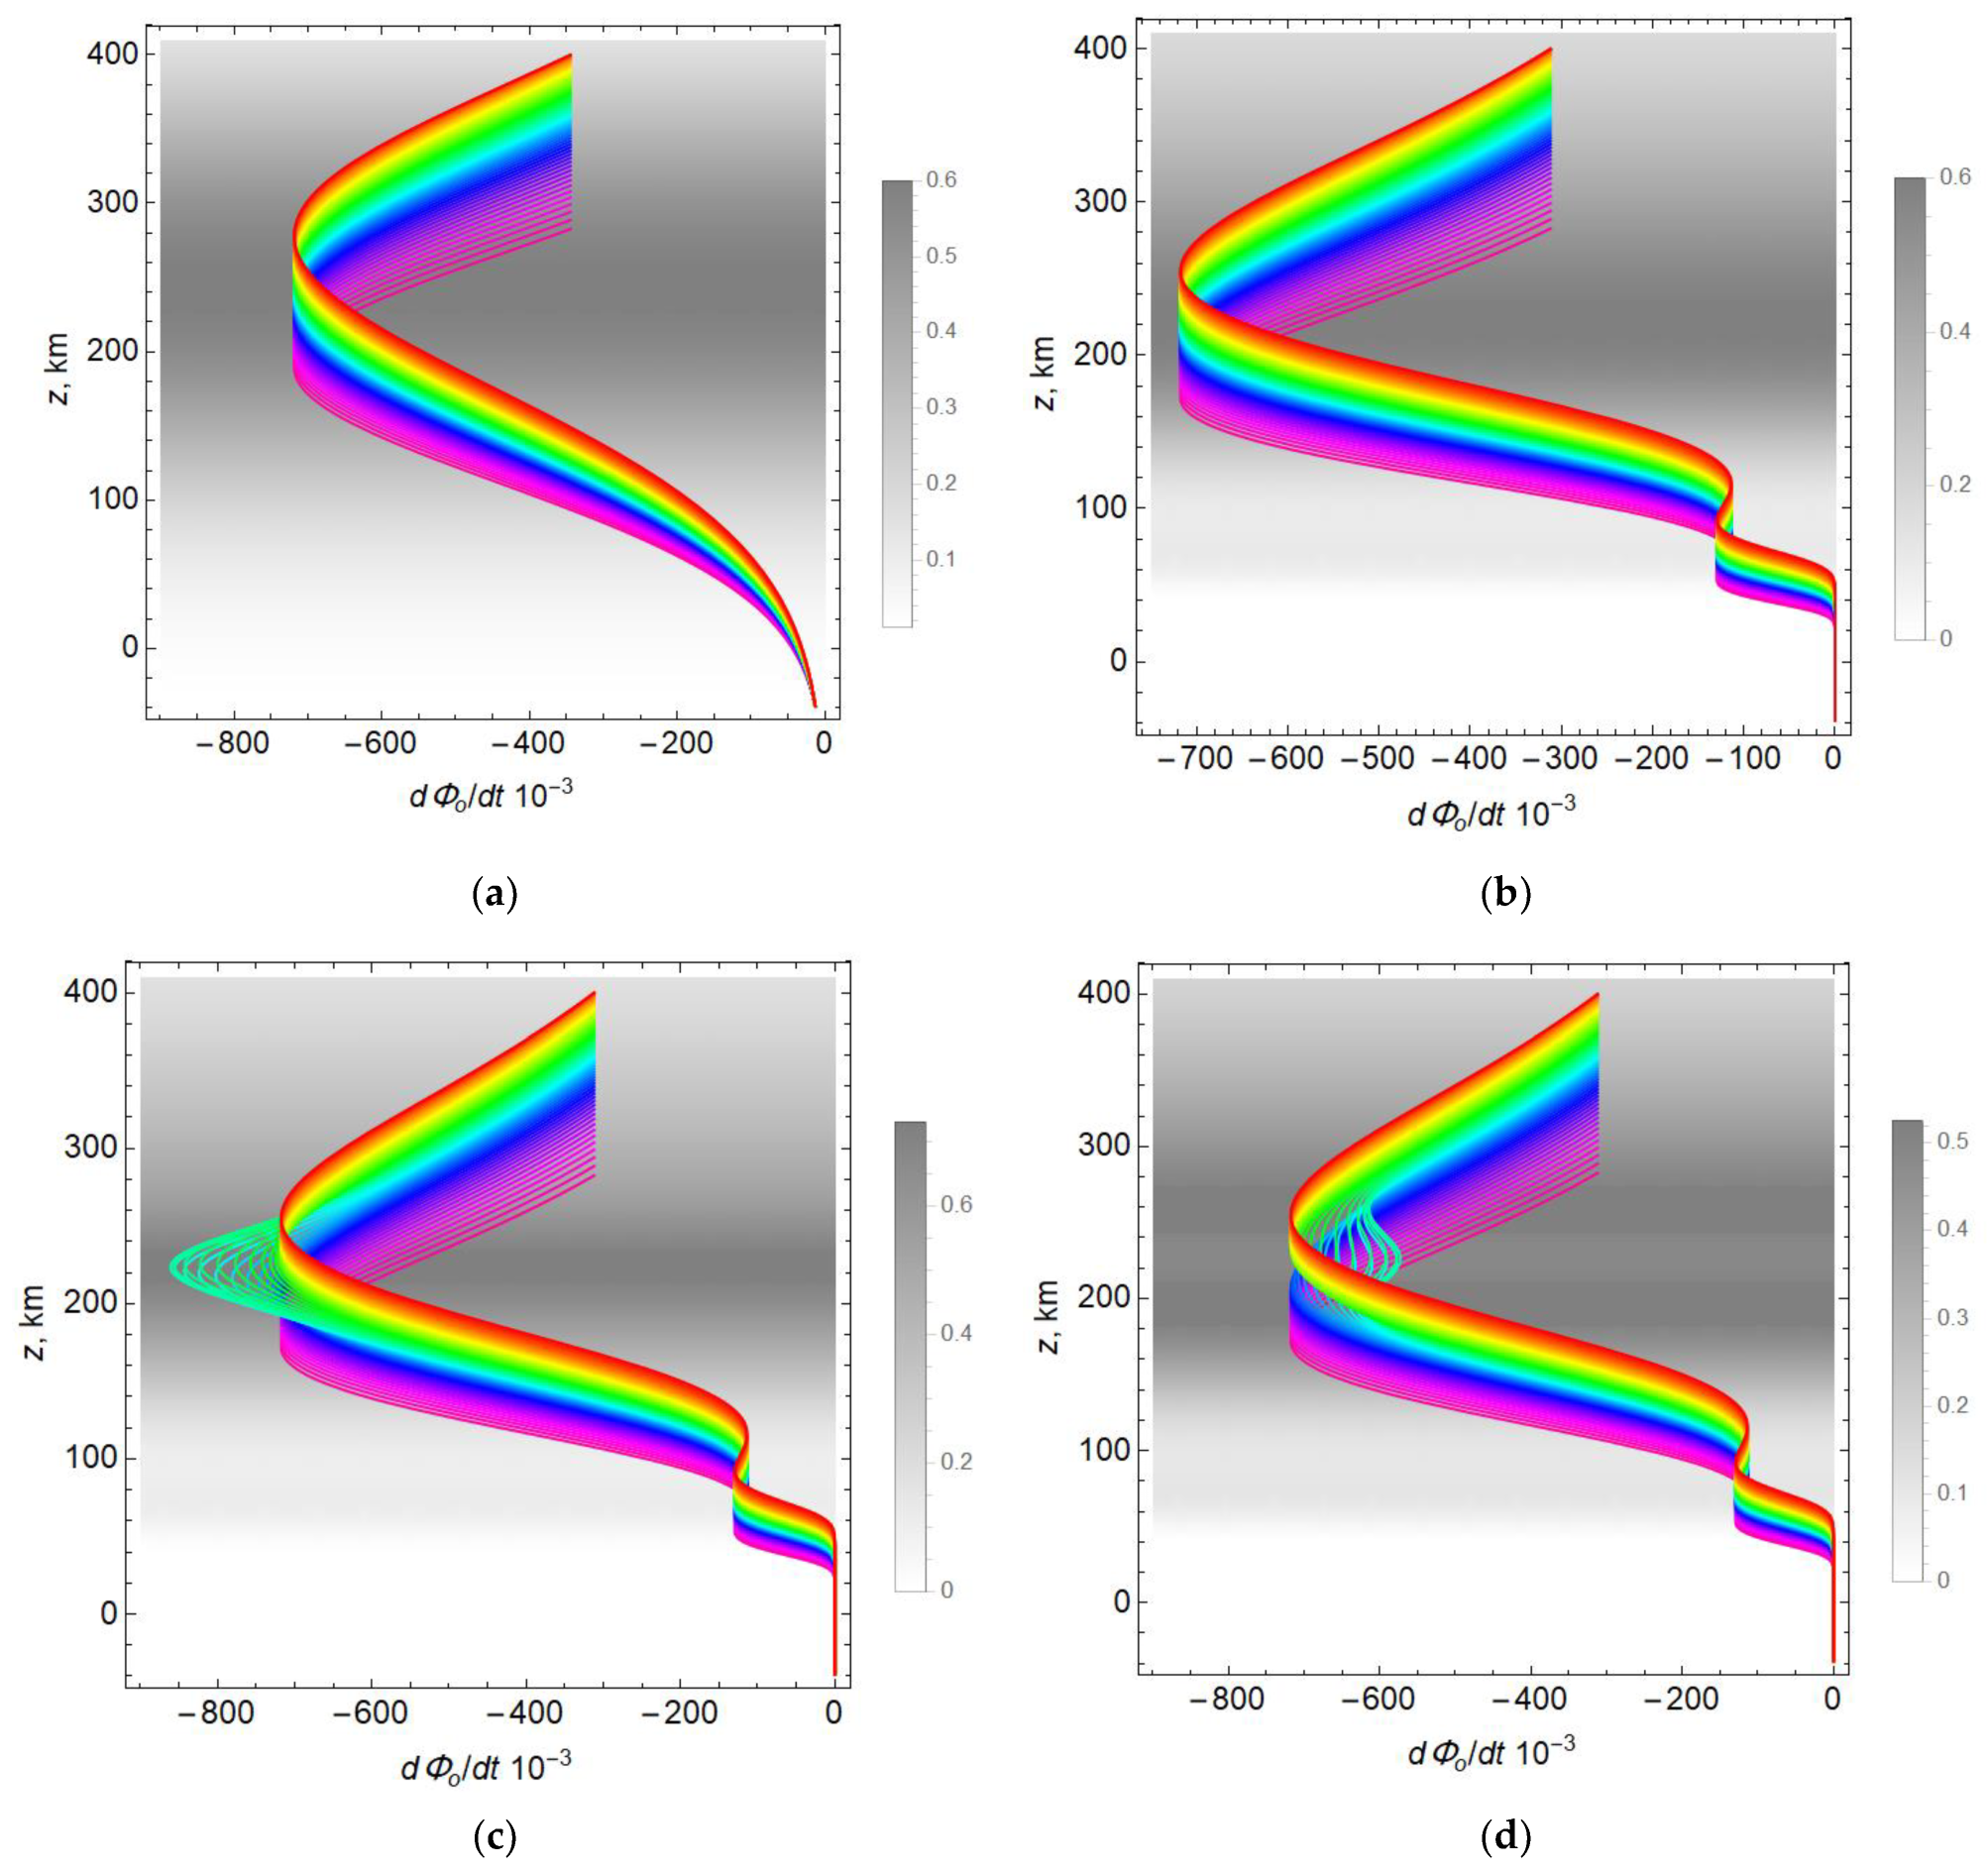
The dependence of the relative rate of phase change on height is shown in
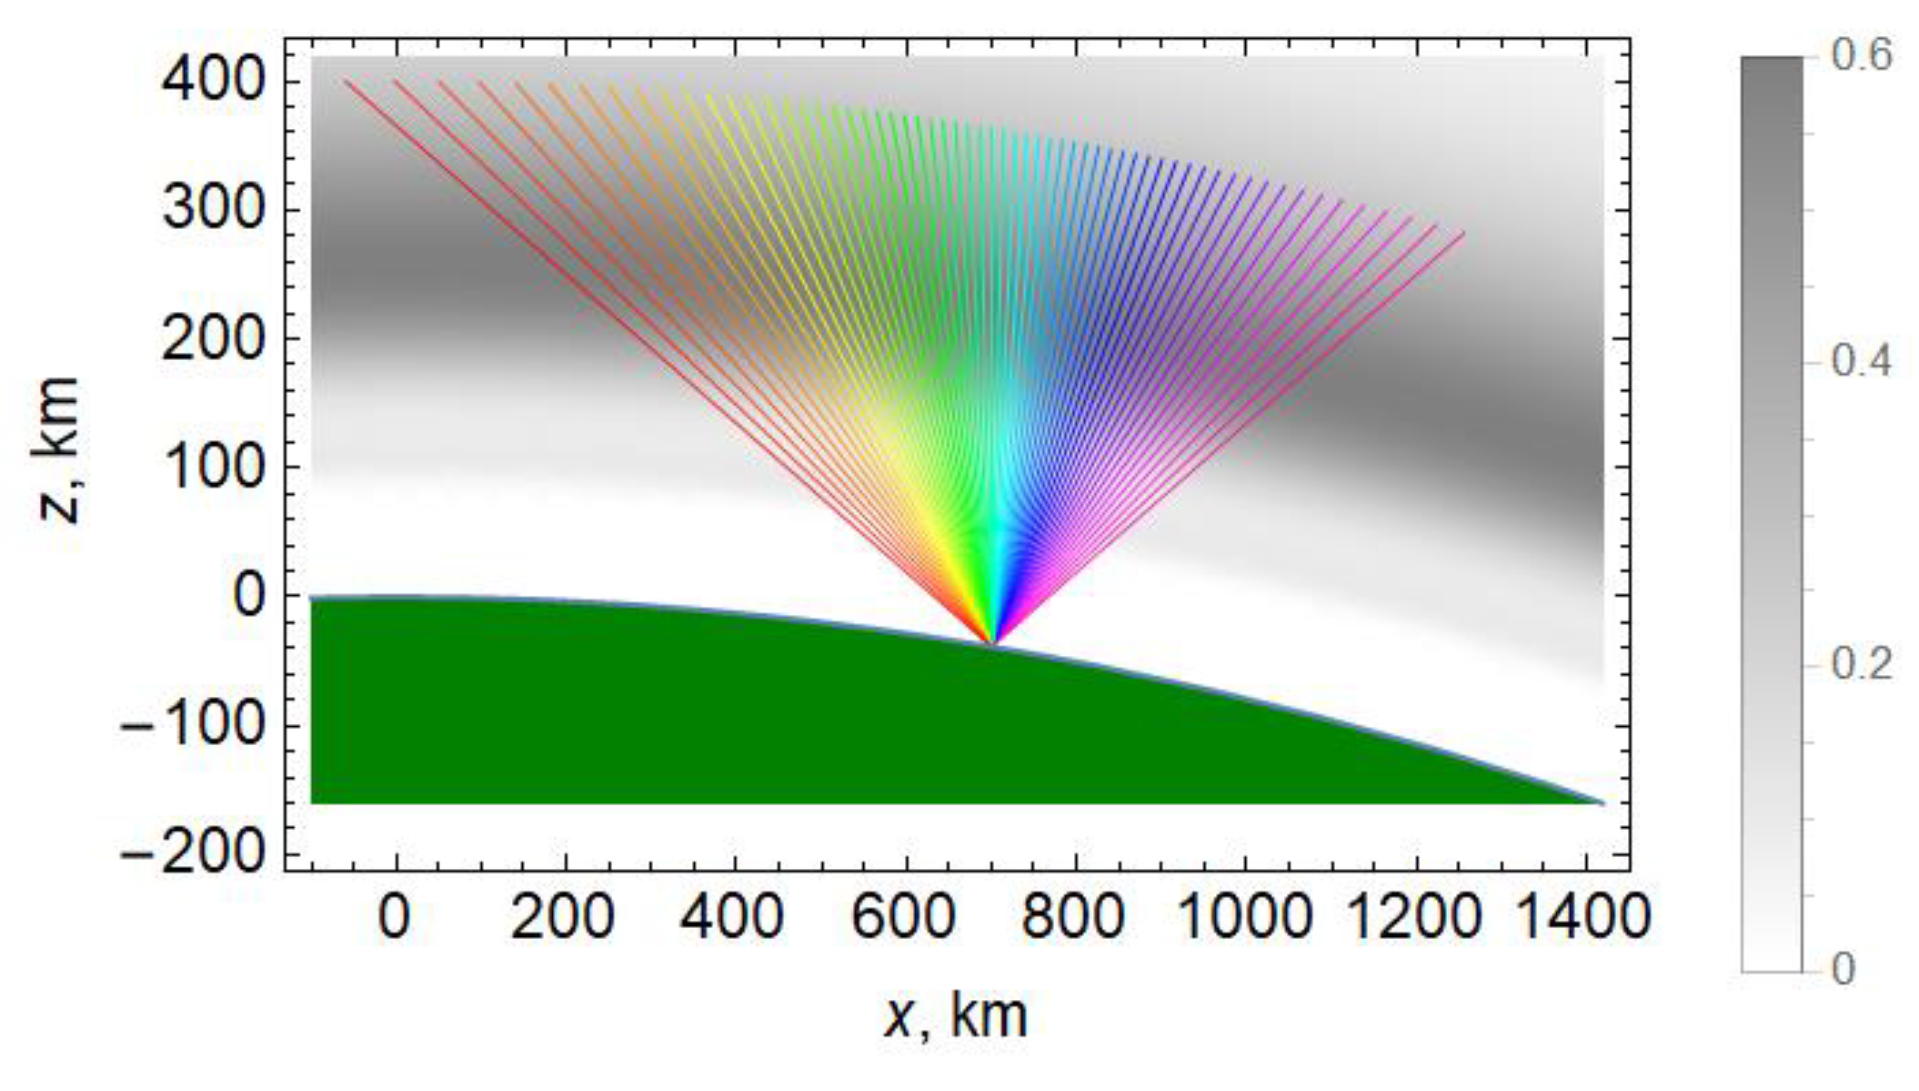
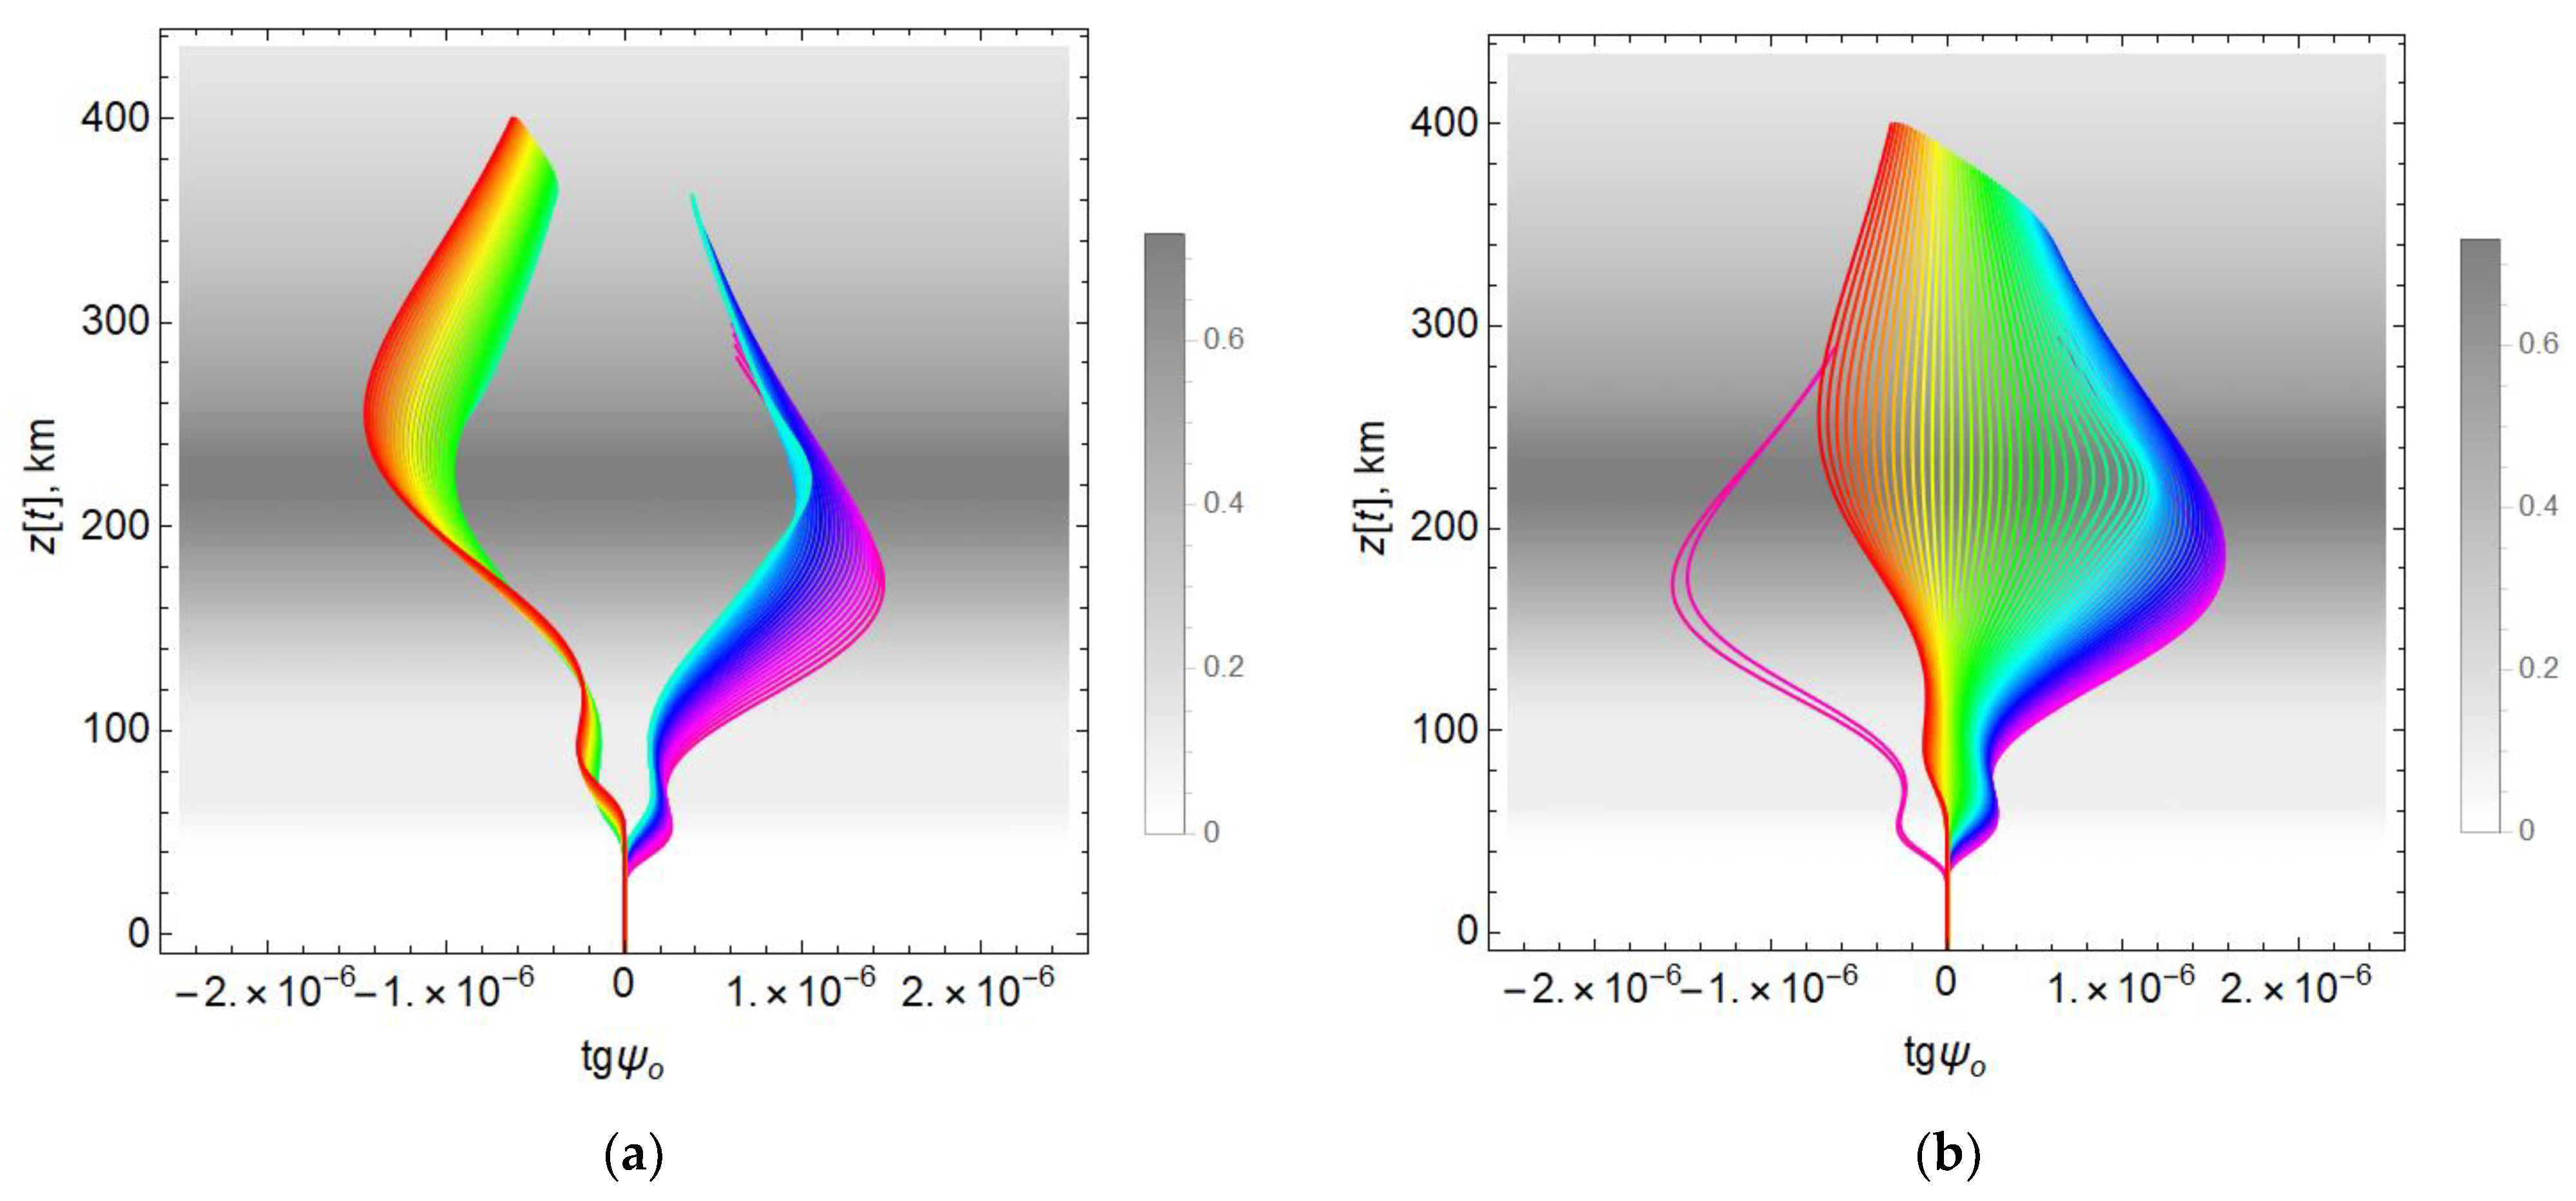
Figure 5a–d. In this figure and the following, the coloring of the lines corresponds to the coloring of the rays in
Figure 3.
The shape of the curves is virtually independent of the orientation of the magnetic field. The minima of the curves with respect to the vertical axis correspond to the positions of the maxima of the ionospheric layers. In
Figure 5a, there is one minimum, since model 1 is a single-layer model. In
Figure 5b, corresponding to the two-layer model 2, an additional minimum appears below, the origin of which is explained by layer
E, and a maximum that corresponds to the interlayer valley. The upper minimum corresponds to the
F layer of the ionosphere.
In models 3 and 4, characteristic emission on the rays occurs in the region of the main maximum of the electron concentration (layer F2), where there is an inhomogeneity with an increased (model 3) or reduced (model 4) electron concentration. The rays passing through these inhomogeneities are shown in light green in
Figure 5c,d.
Figure 6 shows the dependence of the phase deviation ΔΦ on the group time
t at the signal receiving point. The phase deviation ΔΦ was found as
,
where and
ωR/
c is the ray phase in the vacuum along the straight line connecting the source and receiver, and t is the signal delay (see
Figure 4).
In the case of model 1 (black color), the dependence is linear. For the two-layer model 2 (green color), the curve is linear too, but shifted to the right. In the case of perturbed models, loops are formed at the end of the line, lying on opposite sides of the unperturbed line (model 3—red color, model 4—blue color). In all cases, the ionosphere makes a significant contribution to the magnitude of the phase.
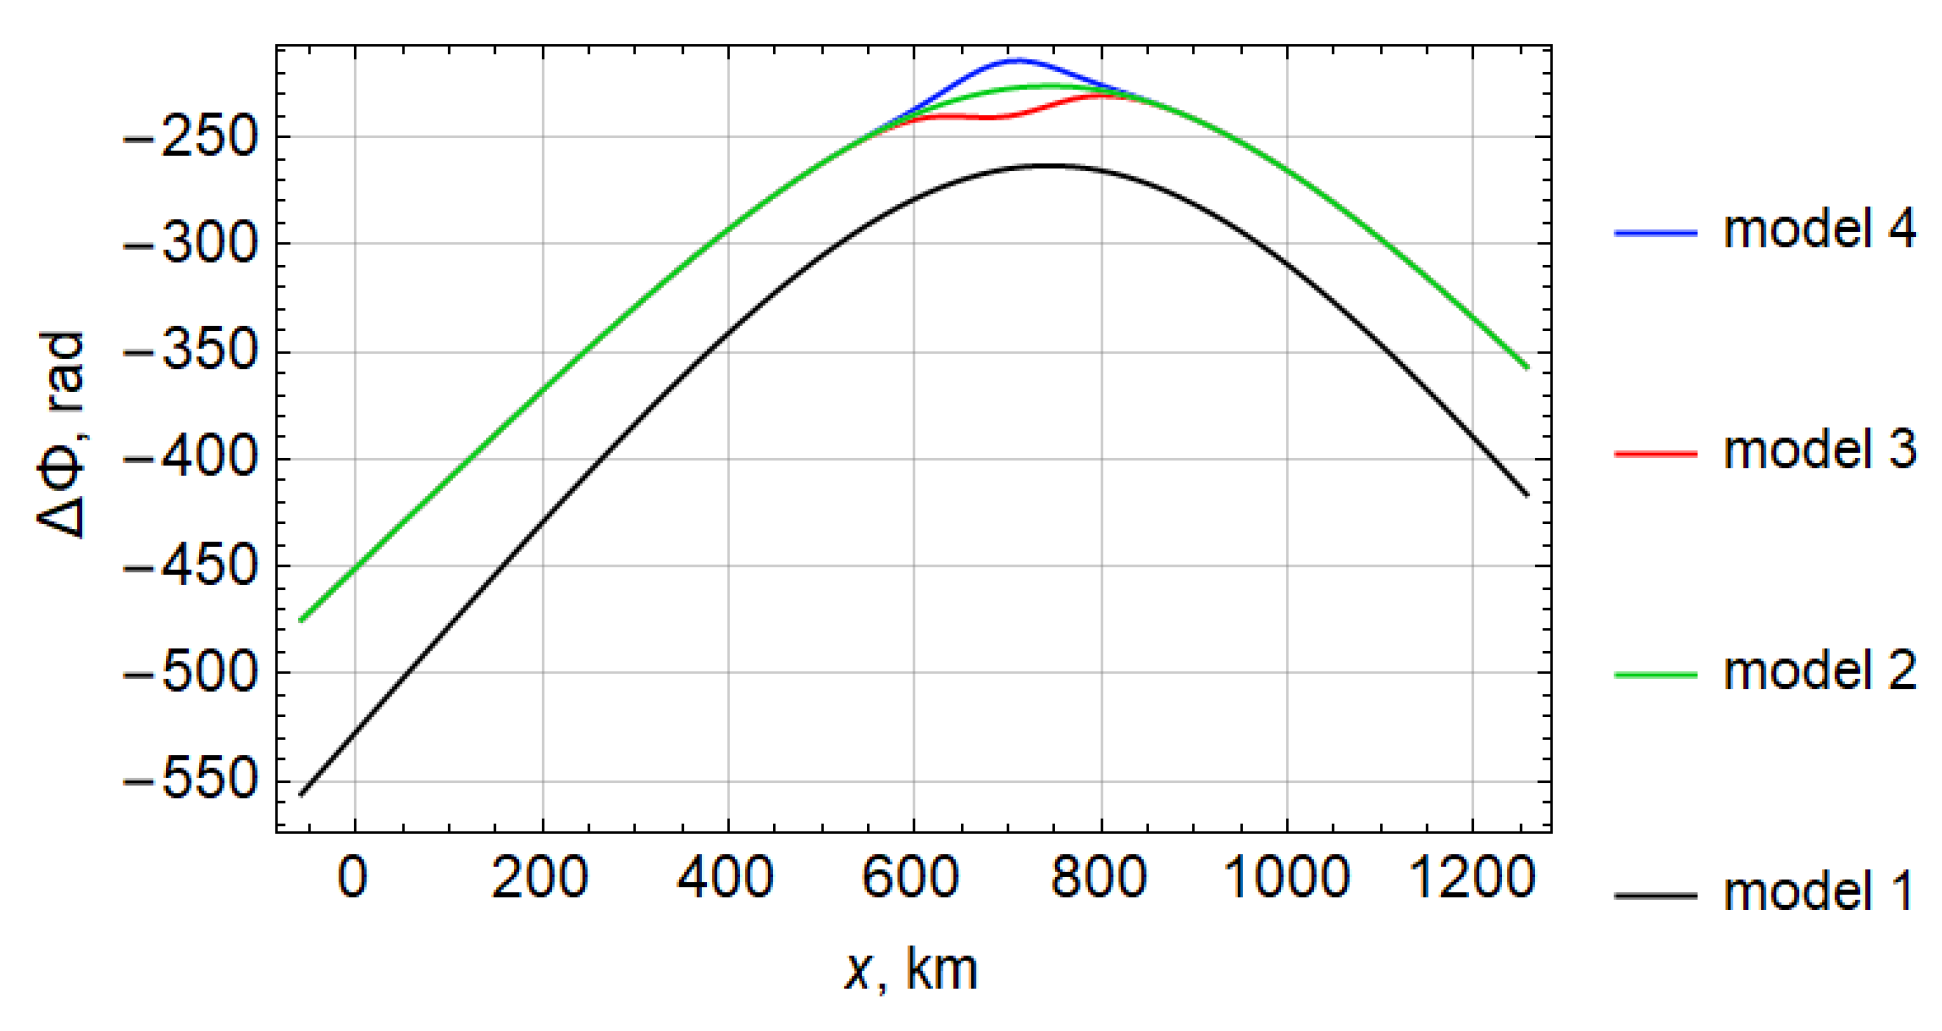
Figure 7 shows the dependence of the phase deviation on the Cartesian horizontal coordinate
x of the ray exit.
For the simplest model 1 and in the case of model 2, the curve has a quasi-parabolic shape (black color). In the case of a disturbance with a reduced electron concentration (model 4), an additional elevation appears on the curve, and in the case of a disturbance with a higher electron concentration (model 3), a small dip occurs. Thus, disturbances in the electron concentration in the vicinity of the main maximum of the ionospheric layer, in contrast to the lower layer E, lead to a violation of the expected monotonicity of the dependences ΔΦ(t) and ΔΦ(x), and can be recorded.
In
Figure 8, the graphs of the dependence of the total electron concentration (
TEC) on the
x coordinate are shown. To calculate the
TEC in TECU along the trajectories, the following formula was applied:
where
η is the current time.
It can be seen that
Figure 7 and
Figure 8 have much in common. In both cases, the dependence is parabolic. However, the curves in
Figure 7, corresponding to models 1 and 2, are convex upward, and for TEC (
Figure 8), they are convex downward. As for the perturbed models 3 and 4, the effects of perturbations are opposite in nature. However, if we consider the moduli of these quantities, we can see that the absolute values for model 3 are increasing, and for model 4 they are decreasing. Thus, measurements of the total electron content along the beam make it possible to judge the effect of large-scale ionospheric irregularities on the phase deviation.
6. Faraday Rotation of the Plane of Polarization
The Faraday rotation of the plane of polarization can have a significant impact on the operation of space-based surface sensing systems with synthesized aperture radars. At a frequency of 420 MHz, we can assume that the ordinary and extraordinary waves propagate along the same radial path. Then, the angle of the Faraday rotation is determined by the formula (see [
4,
22,
27,
28]):
where
is the difference in the refractive indices of the ordinary and extraordinary waves.
In expression (15),
θ is the angle between the vector of the external magnetic field strength
and the wave vector
. If the medium is quasi-isotropic, then we can assume that
In the calculations, it was assumed that the amplitude of the magnetic field is constant, and the orientation of the magnetic field relative to the local coordinate system is given by the angles
γ and
φ [
4,
5,
6,
27]:
H0 = 0.465 Oe,
γ = −57°,
φ = 90° or 0°.
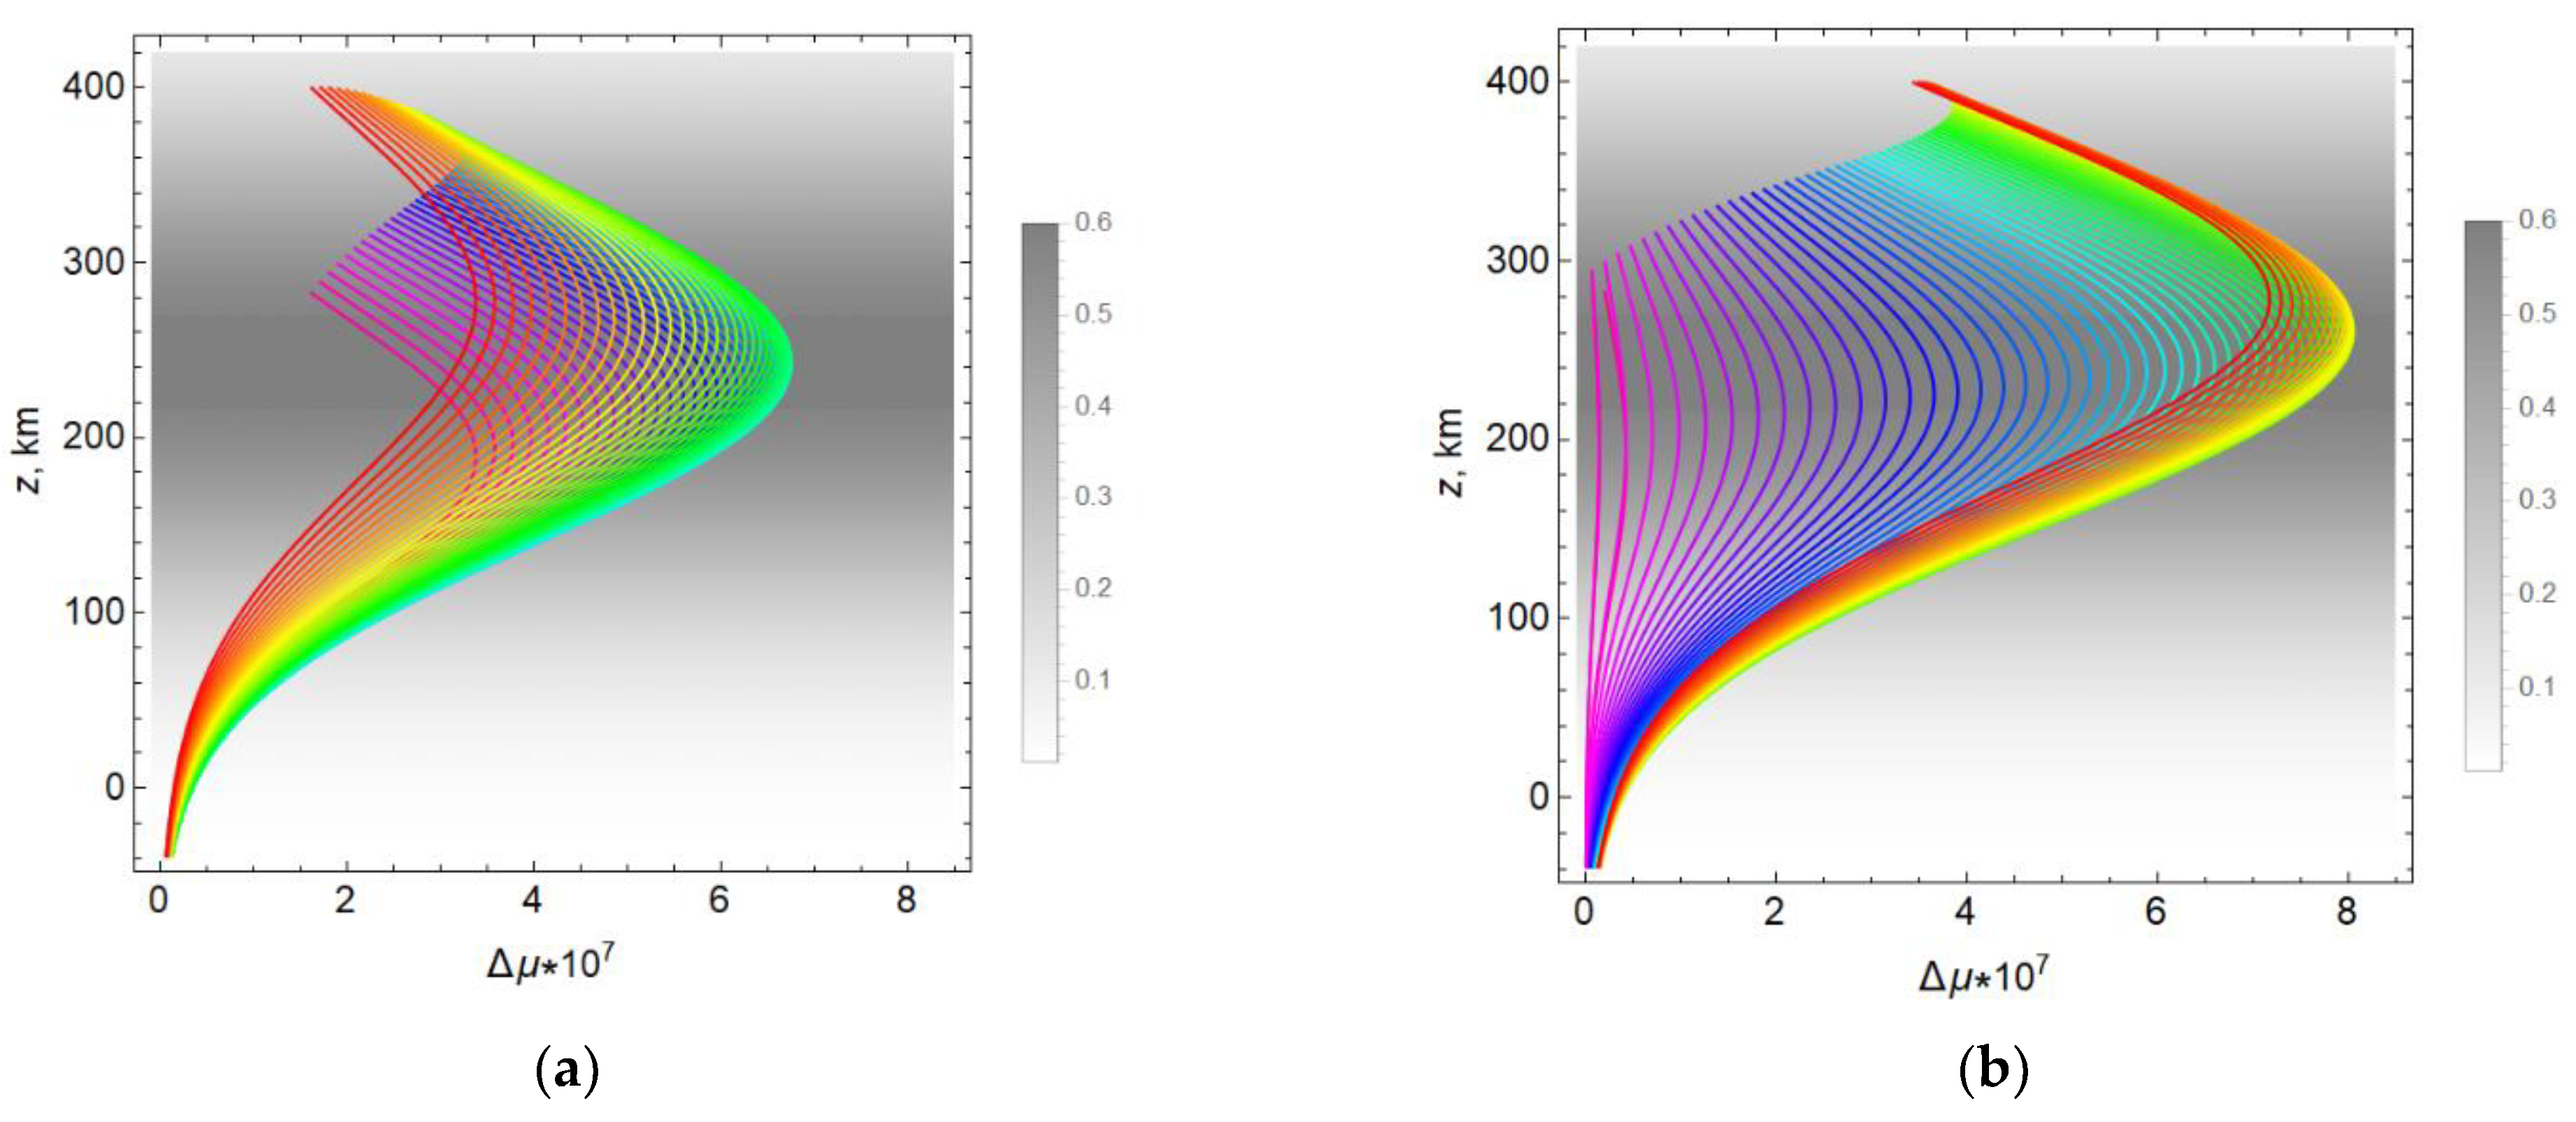
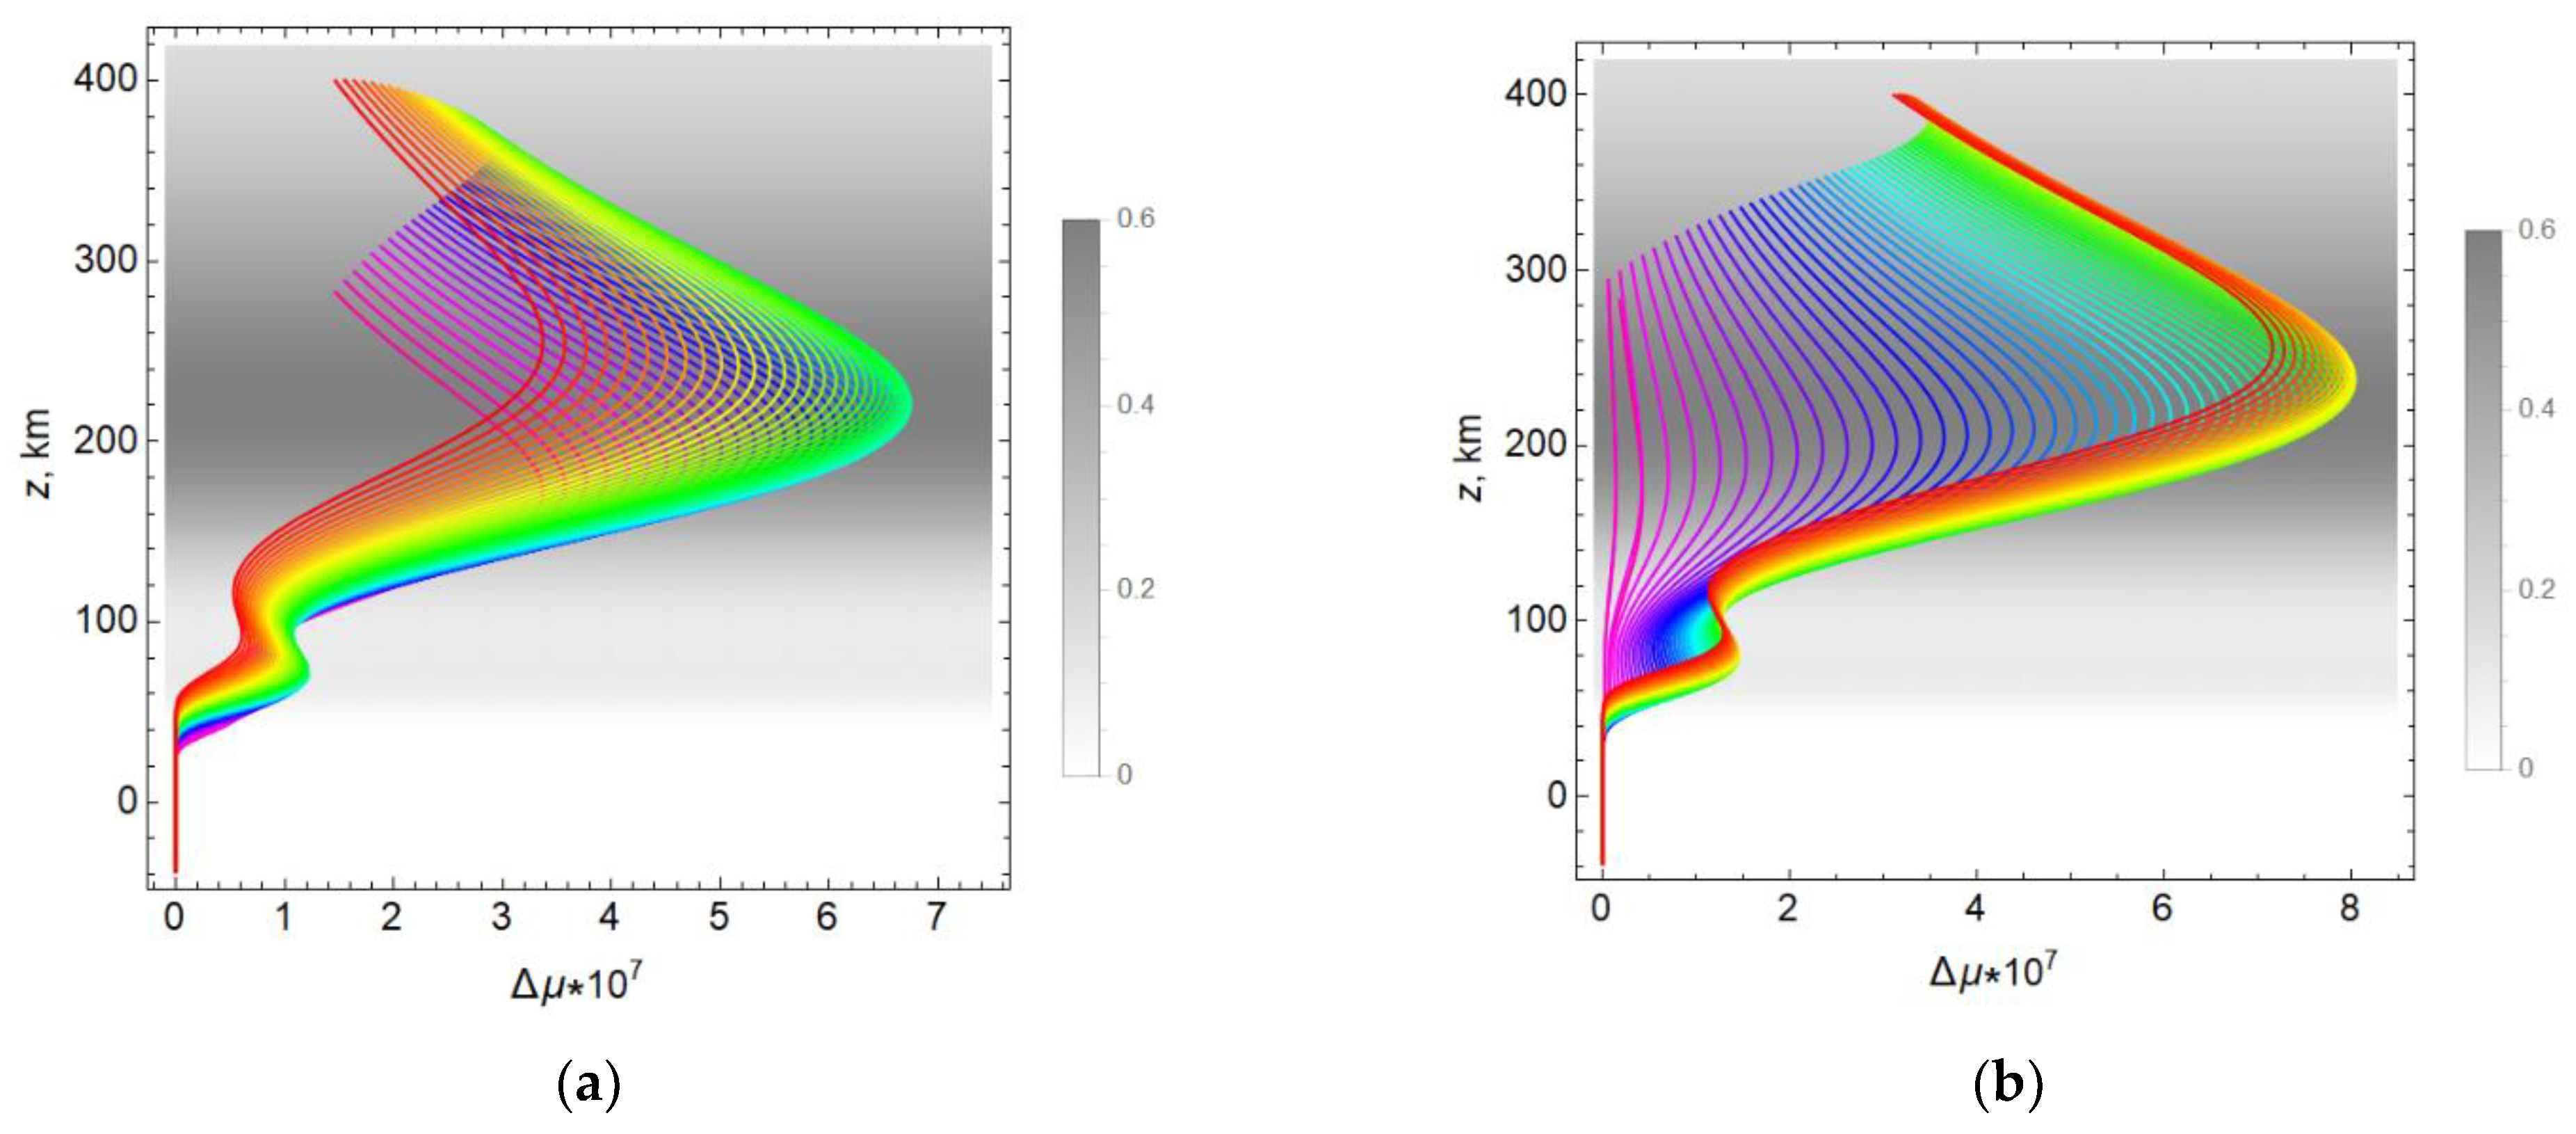
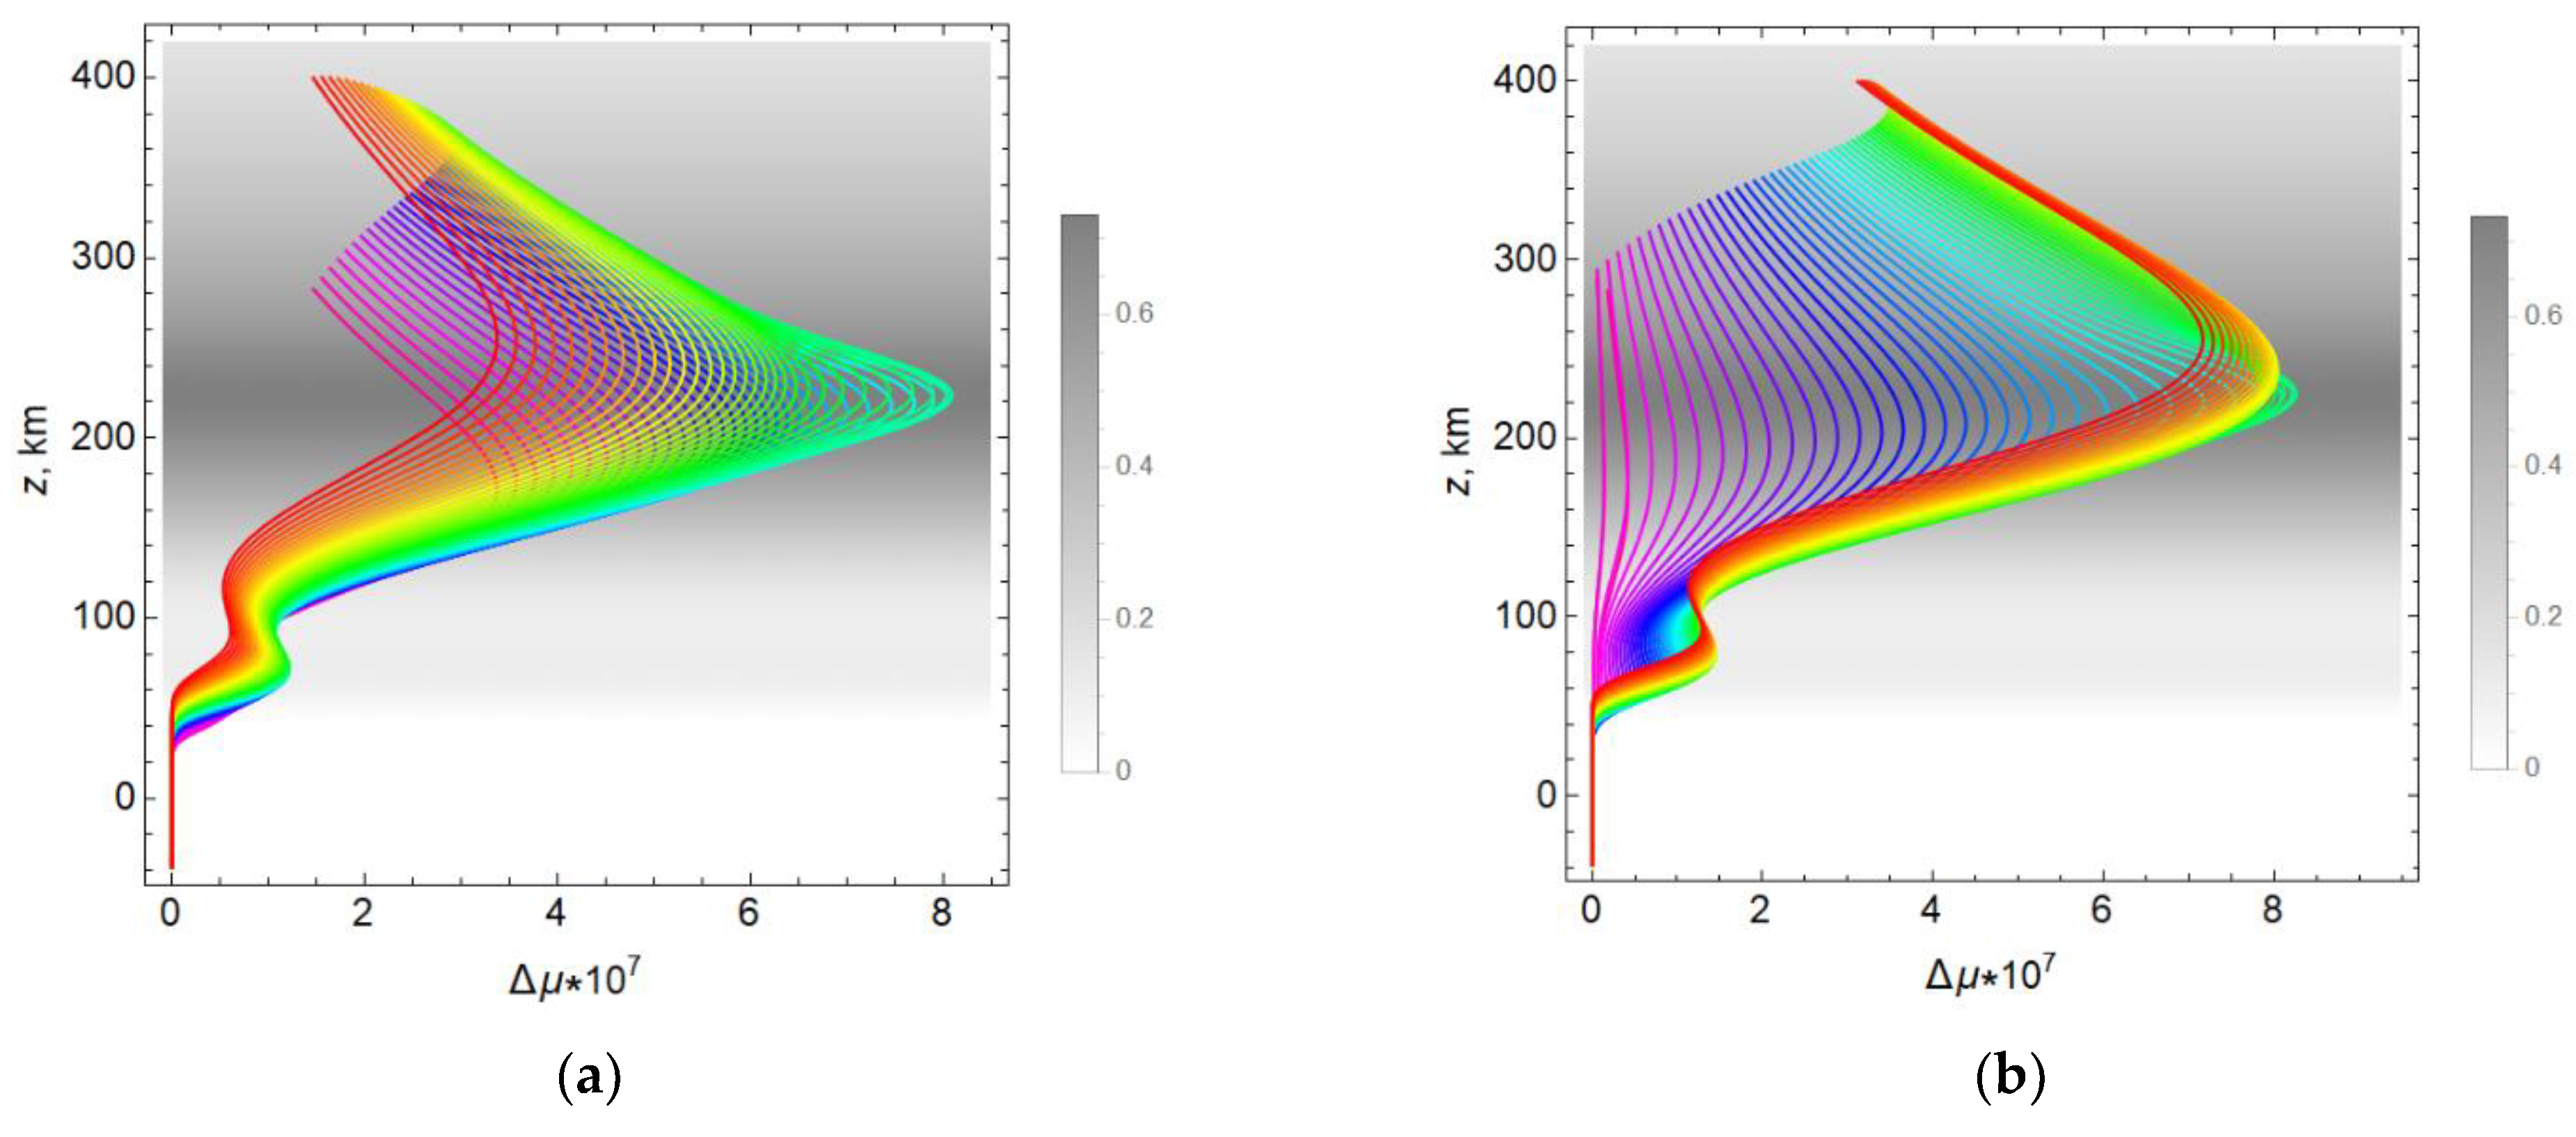
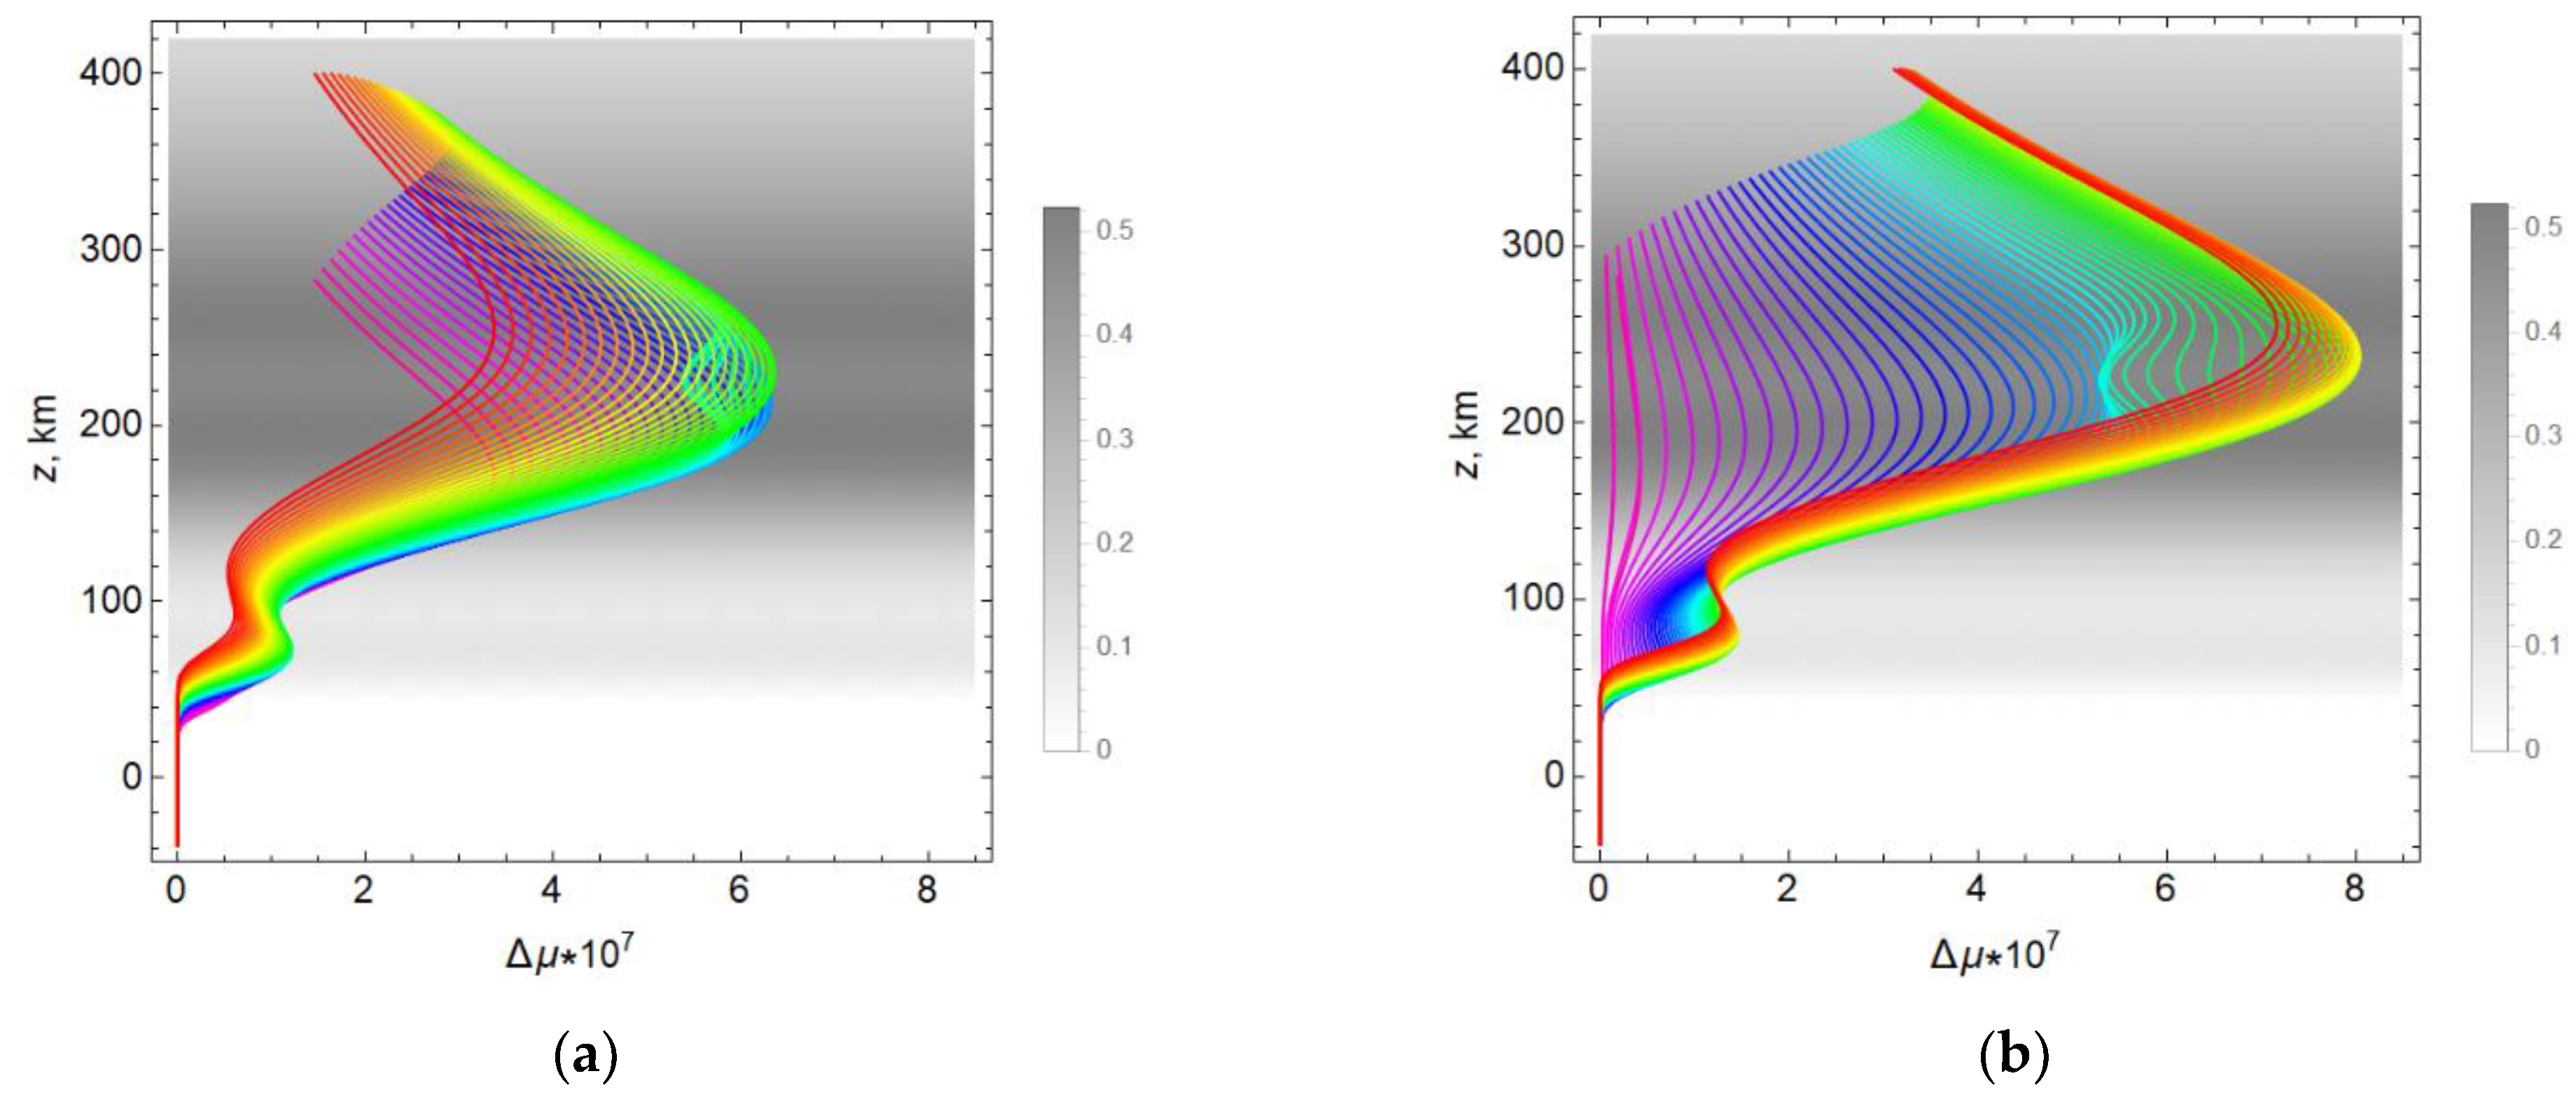
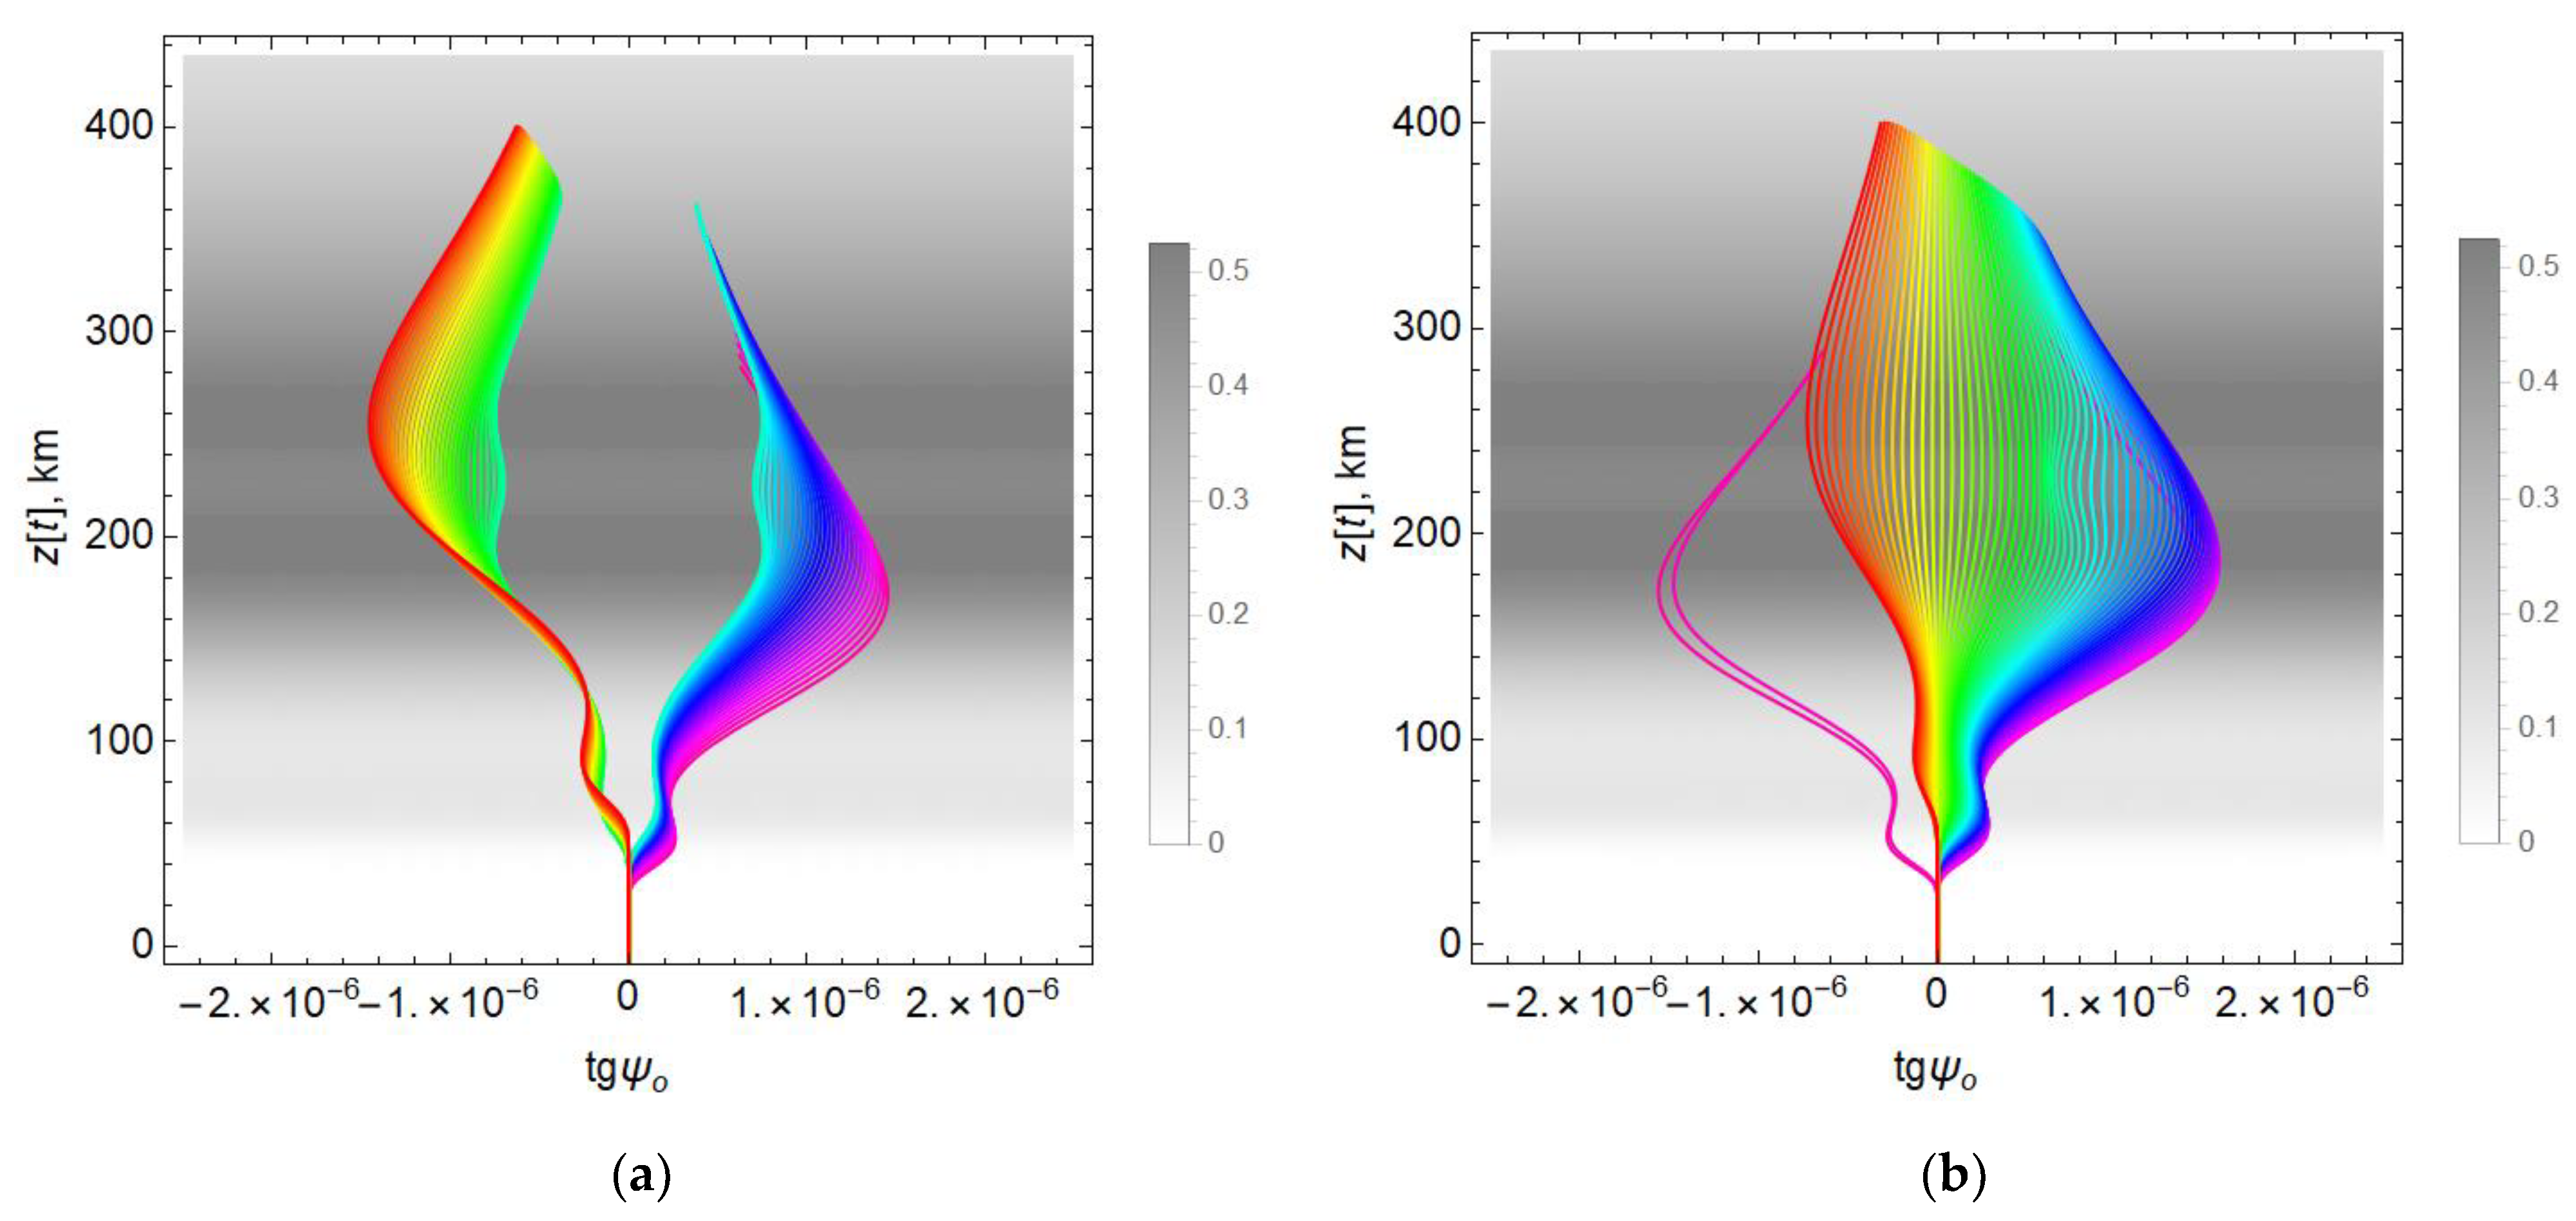
Figure 9a,
Figure 10a,
Figure 11a and
Figure 12a correspond to the case when the field strength vector lies in the plane perpendicular to the propagation plane (φ = 90°), and
Figure 9b,
Figure 10b,
Figure 11b and
Figure 12b correspond to the case when the field strength vector lies in the plane, the very plane of propagation (
φ = 0°). The behavior of the curves in
Figure 9,
Figure 10,
Figure 11 and
Figure 12 is similar to the behavior of the curves in
Figure 5. The shape of each curve follows the electron concentration profile. In the perturbed case (
Figure 11 and
Figure 12), the behavior of part of the light green ray trajectories deviates from the general tendency characteristic of other rays: in model 3, they form the main strongly elongated maximum, and in the case of model 4, the light green rays form a minimum against the background of other rays.
Comparing
Figure 9a,b, describing different orientations of the vector of the strength of the Earth’s magnetic field, we see that the main maximum is already formed by different groups of rays. For the case
φ = 90°, these are light green, and for the case
φ = 0°, they are yellow (see also
Figure 3). This means that the maximum value of the difference in refractive indices Δ
μ has shifted from green to yellow rays propagating to the left.
Comparing
Figure 10a,b, plotted for
φ = 90° and
φ = 0°, respectively, we see that there is a significant difference in the behavior of curves of the same color (and, therefore, with the same exit angles) in the vicinity of the lower layer E.
Comparing
Figure 11a,b, it is easy to find that a change in the position of the strength of the Earth’s magnetic field relative to the plane of propagation leads to the splitting of the main maximum at
φ = 0° (
Figure 11b).
For model 4 (
Figure 12a,b), it can be seen that after the transition from
φ = 90° to
φ = 0°, the local minimum in the vicinity of the maximum of the ionospheric layer forms no longer green rays but blue rays.
Thus, the value of the angle φ, and, consequently, the angle θ, which depends on the angle φ, significantly affects the difference between the refractive indices of the ordinary and extraordinary waves Δμ, and the square of the cosine of the angle θ is essential, since it is this value that is entered into Formula (15).
Figure 13a shows the dependence of the square of the cosine of the angle between the wave vector and the vector of the strength of the Earth’s magnetic field when this vector is in the plane perpendicular to the plane of propagation (
φ = 90°).
All lines in
Figure 13a are straight lines, since within the framework of the model, the angle
θ retains its value along each ray. The range of values
does not include 0 and 1, which becomes clear if we recall the geometry of the problem. With this configuration, both quasi-longitudinal and quasi-transverse propagation are absent.
For comparison,
Figure 13b shows the dependence on the height
z in the case when this vector of the strength of the Earth’s magnetic field lies in the plane of propagation (
φ = 0°).
The entire color spectrum is represented. When moving from the red to the violet region of the spectrum (from left to right in
Figure 6), the value
first increases from 0.8 to unity (yellow lines), which means that the angle tends to zero (quasi-longitudinal propagation). Then,
begins to decrease, and for the violet rays, there is a quasi-transverse propagation (~90°).
Let us now consider the angle of rotation Ω of the plane of polarization (angle of Faraday rotation) on the surface of the Earth at the point of reception.
Figure 14a shows the dependence of the angle of the Faraday rotation Ω on group time at the point of signal reception for the angle
φ = 90°. It should be noted that layer
E practically does not affect the smoothness of the curve. This can be seen from a comparison of the black line (model 1) and the green line (model 2). However, local perturbations of the maximum layer (models 3 and 4) lead to significant deviations or “loops” on opposite sides of the green curve.
Figure 14b shows the dependence of the Faraday rotation angle on the group time for the angle
φ = 0°.
Comparing
Figure 14a,b, it can be seen that in the latter case, the angle of rotation of the plane of polarization Ω reaches 85° (model 1), while for
φ = 90°, it is almost twice as small (~45°, model 1).
On the other hand, if for the case
φ = 90° (
Figure 14a) the differences in the angle Ω for the disturbed models 3 and 4 from model 2 are significant (red and blue), then in the case of
φ = 0°, these differences are hardly noticeable.
The dependence of the Faraday rotation angle Ω on the
x coordinate is shown in
Figure 15a in the case of
φ = 90°. For a case
φ = 0°, the dependence of the Faraday rotation angle on the x coordinate is shown in
Figure 15b.
Unperturbed curves behave like smooth parabolas, and the effect of layer E is negligible (compare the black and green curves). Perturbations lead to deviations from the green curve, and in contrast to
Figure 13, which shows the dependence of the phase difference ΔΦ on the horizontal distance, the region with increased electron concentration now creates a maximum (red line), and that with a lower one creates a minimum (blue line). In the case of case
φ = 0°, deviations from the green curve caused by disturbances are much smaller (
Figure 14b). With distance, the value of the Faraday rotation angle decreases (see also
Figure 14b) and is equal to 0° when the angle is
θ = 90° (
x~1200 km).
Thus, we see that the value of the Faraday rotation angle significantly depends on the orientation of the path with respect to the Earth’s magnetic field [
22].
7. Investigation of Polarization Coefficients
The relationships between the components of the electric field strength vector
along the ray path determine the polarization coefficients [
22,
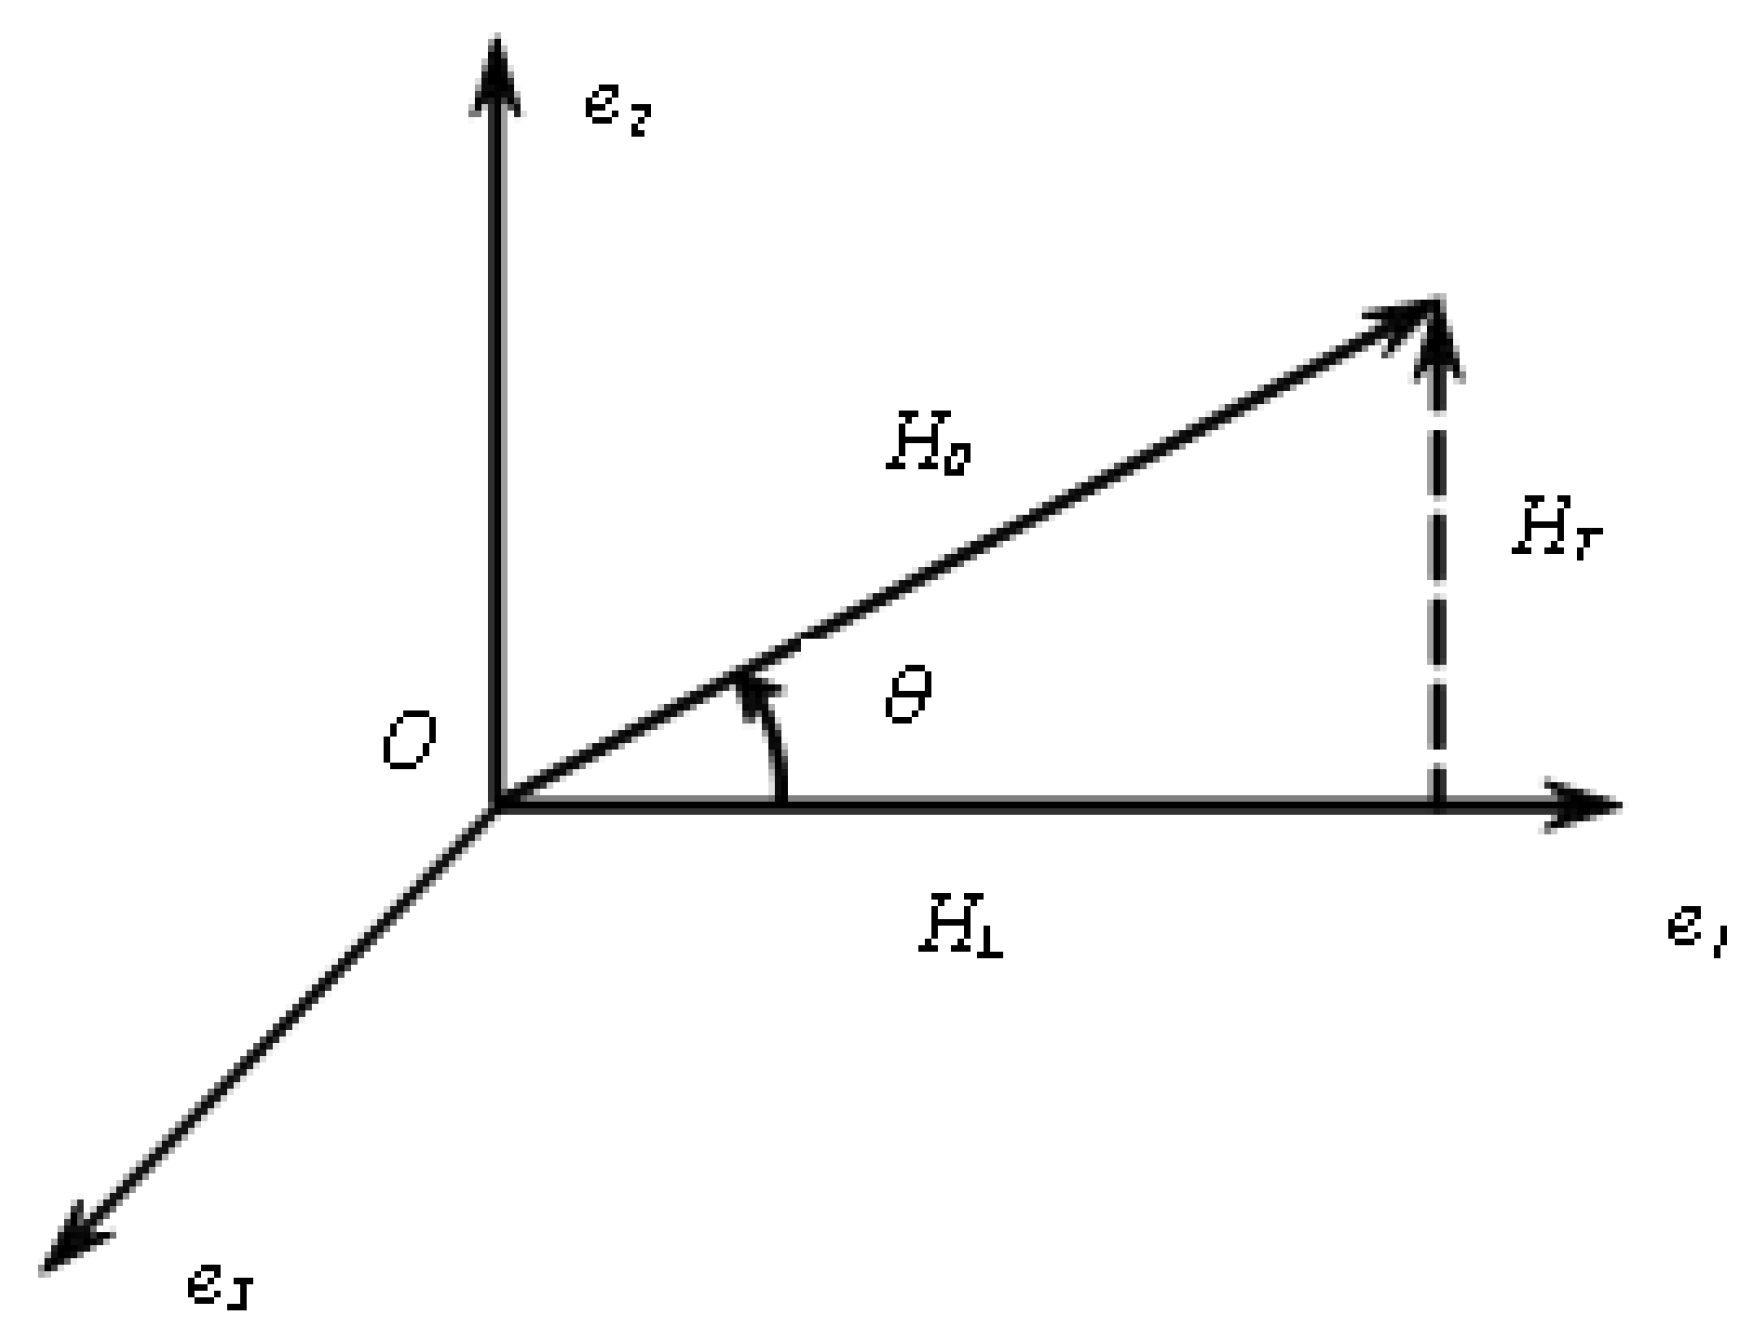
23]. Let us introduce an additional coordinate system associated with the ray path. Let the component
E1 of the electric field strength vector
of the wave be directed along the wave vector
, and the component
E2 of the vector
lie in the plane formed by the vector of the strength of the Earth’s magnetic field
and the wave vector. Then, the component
E3 is orthogonal to the components
E1 and
E2 and forms a right-handed triple with them (
Figure 16).
The quantities R− and R+ are the polarization coefficients of the ordinary and extra-ordinary waves. Since these are imaginary quantities, in what follows, we use their real analogues Ro and Rx, which we also call the polarization coefficients.
It is known from [
22] that:
In Formula (17), the “+” sign corresponds to an extraordinary wave, the “−” sign corresponds to an ordinary wave, and
If the wave, for example, is linearly polarized, then it can be decomposed into two components, an ordinary wave (o-wave) and an extraordinary wave (x-wave), and each wave will have its own polarization coefficient.
Figure 17 shows the polarization coefficient for the cases
φ = 90° and
φ = 0°. The distribution of the electron concentration for model 4 and a distance of 700 km along the
x axis was chosen as a background.
For all rays, these are straight lines, and in
Figure 17a, half of the spectrum obscures the other. For
φ = 90°, all values are grouped near −1, which indicates that the o-wave has an almost circular polarization [
22].
Let us now consider the case when
φ = 0°. Here, we have two limiting cases:
Ro =−1 and
Ro = 1 (
Figure 17b). There are still many rays in the vicinity of
Ro = −1 (see
Figure 17c, which is a fragment of
Figure 17b). There are few rays in the vicinity of
Ro = 1. These are violet rays and therefore correspond to an angle
close to 90°. The area between
Ro = −1 and
Ro = 1 is generally poorly filled. Hence, it follows that the range of values of the angles of exit of the rays, for which the ordinary wave has an elliptical polarization, significantly different from the circular one, is small and can hardly be recorded experimentally at these frequencies.
Similar reasoning can be applied to an extraordinary wave.
Figure 18 shows the polarization coefficient for the cases
φ = 90° and
φ = 0°.
Figure 18a shows the polarization factor for the case of
φ = 90°. It looks like
Figure 17a, with the only difference being that now the rays are grouped in the vicinity of not −1, but 1.
Figure 18b shows the polarization factor for the case
φ = 0°. This figure is symmetrical with respect to
Figure 17b. Now, the lines are grouped mainly in the vicinity of
Rx = 1 (see the fragment in
Figure 18c), and in the vicinity of
Rx = −1, we see two lonely lines. Thus, it is easy to verify that the same conclusions are valid for an extraordinary wave as for an ordinary one: with the exception of a small region, the wave has practically circular polarization.
It is known that
(see [
22]), which is confirmed by direct calculations. This is easy to verify by comparing
Figure 17 and
Figure 18.
In addition to the transverse field components in the electromagnetic wave, there is also a longitudinal component; that is, the plane of polarization is somewhat inclined.
The ratio of the longitudinal electric component of the wave field to the transverse one determines the ratio Formula (20) [
22]:
Consider first the value
for an ordinary wave. The dependence
on the height
z along the rays for model 1 is shown in
Figure 19a in the case of
φ = 90° and in
Figure 19b in the case of
φ = 0°.
We see that in
Figure 19a, the families of curves form two “petals” (see
Figure 13a), since the angle
first decreases, reaches its limiting value and then begins to increase. The asymmetry of the right and left petals is related to the geometry of the problem. Each curve has one extremum because model 1 is a one-layer exponential model.
Let us compare
Figure 19a,b. In
Figure 19b, most of the rays form a single family, and only two violet rays, for which the angle
is close to 90°, stand out from the crowd.
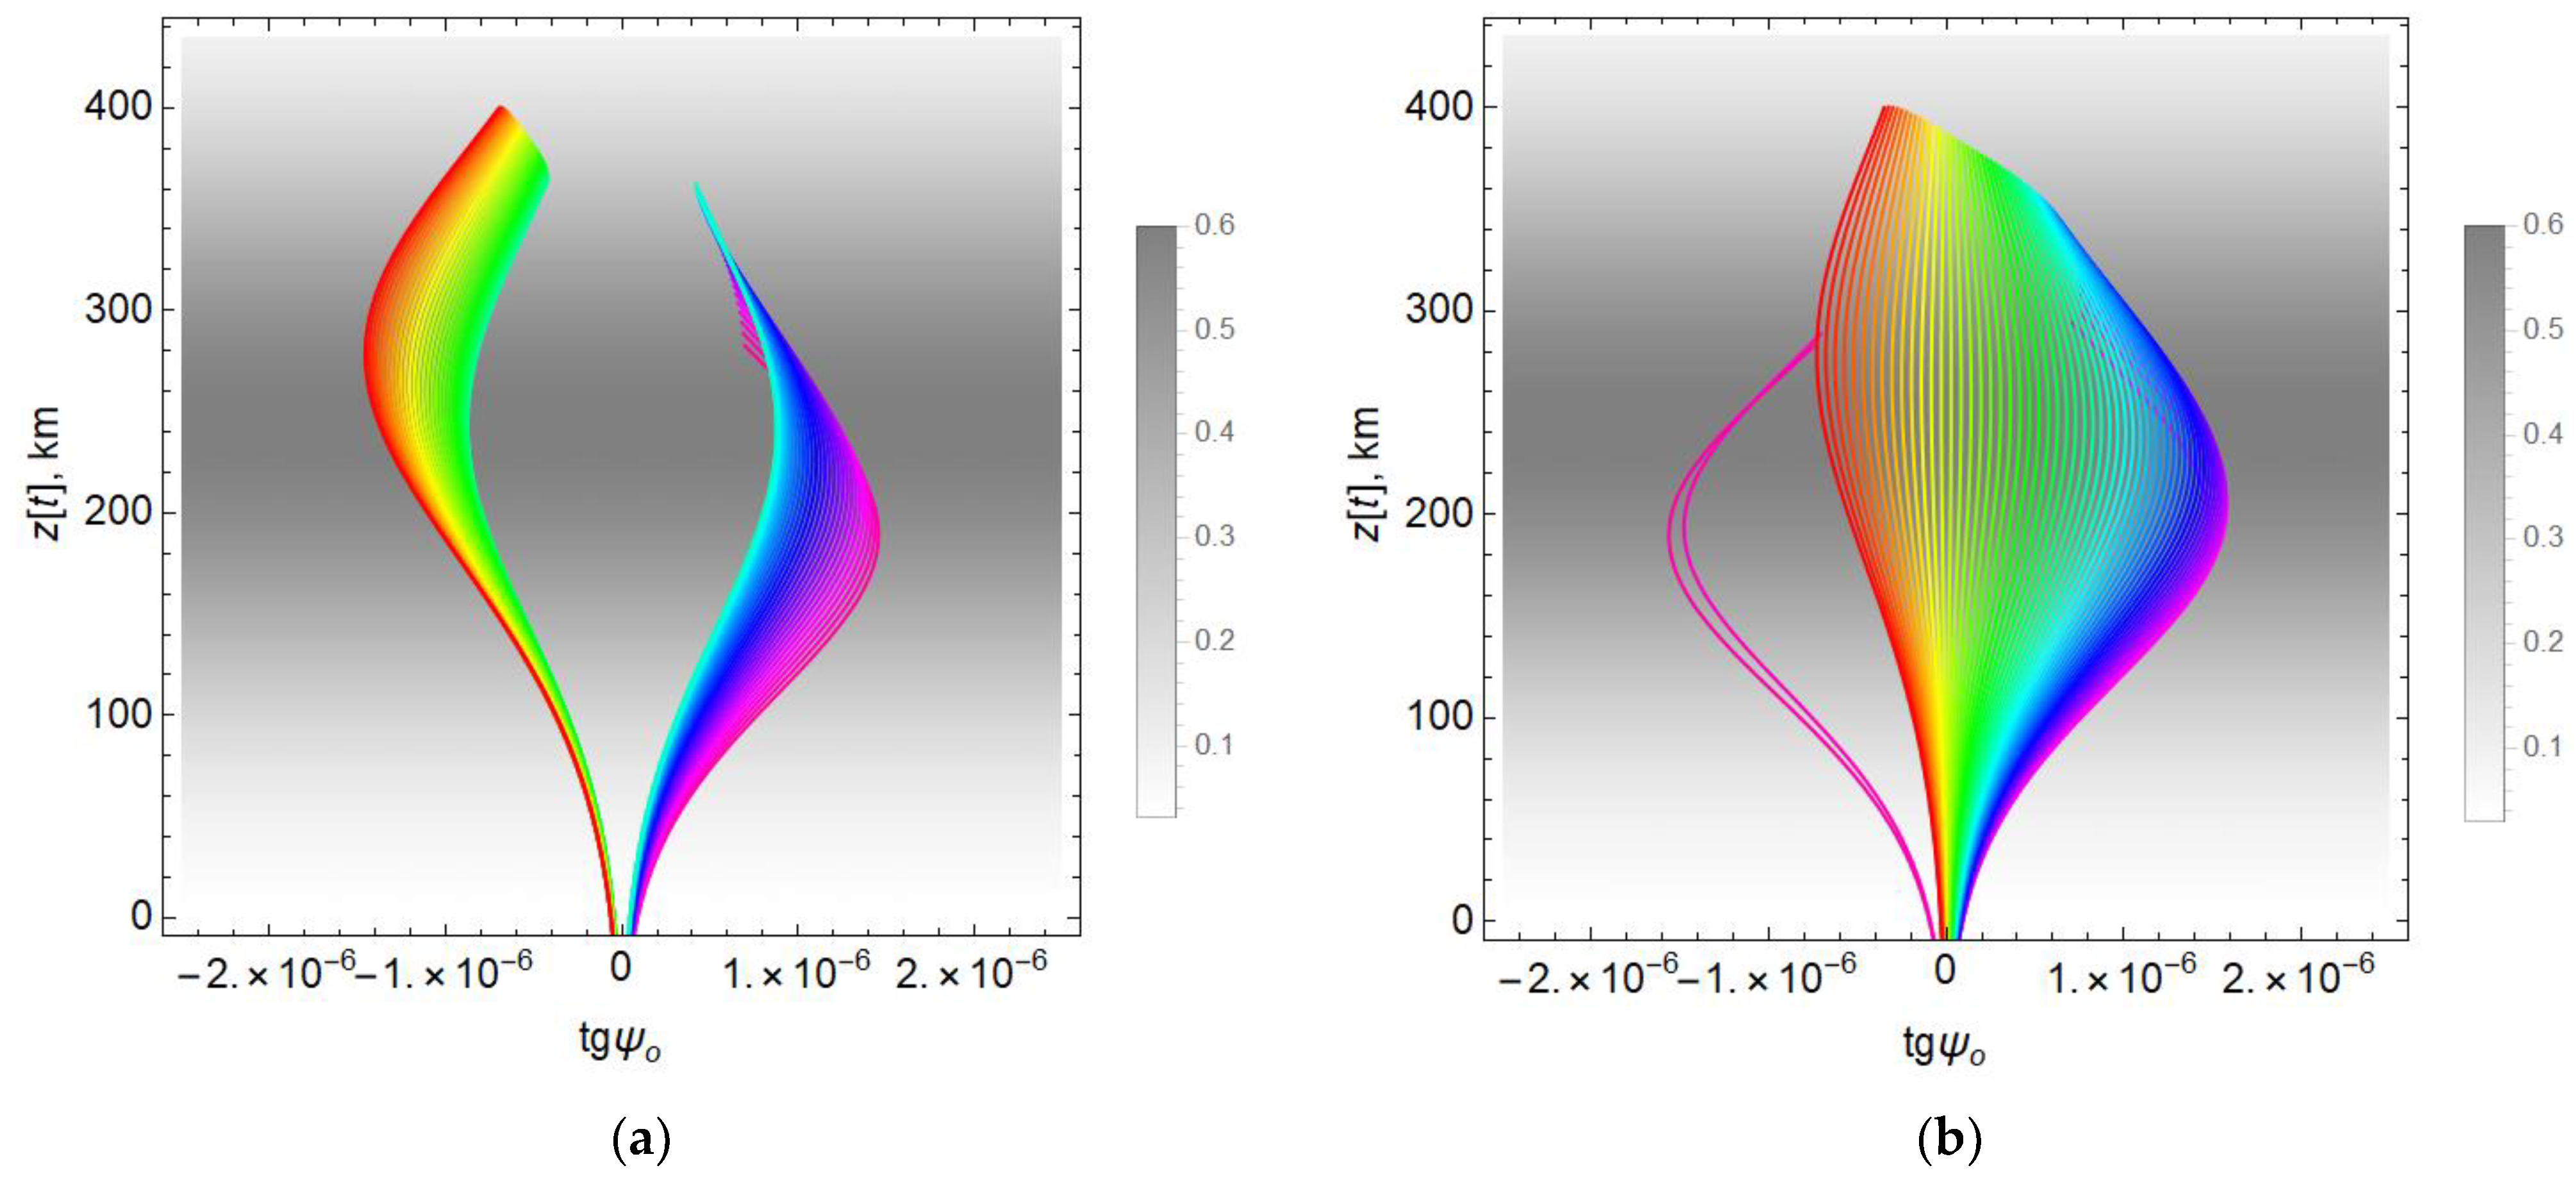
Figure 20a,b show the dependences
on the height
z along the rays for the two-layer model 2. The case φ = 90° is shown in
Figure 20a, and the case
φ = 0° in
Figure 20b.
In contrast to model 1, the figures show two extremums: the upper one corresponds to the
F layer, and the lower one to the
E layer. It should be noted that in
Figure 20a,b, the rays merge into one line at an altitude of about 40 km, while those in
Figure 19a,b do not. The reason is that the electron concentration in model 2 decreases much faster when approaching the Earth than in model 1 (see
Figure 5).
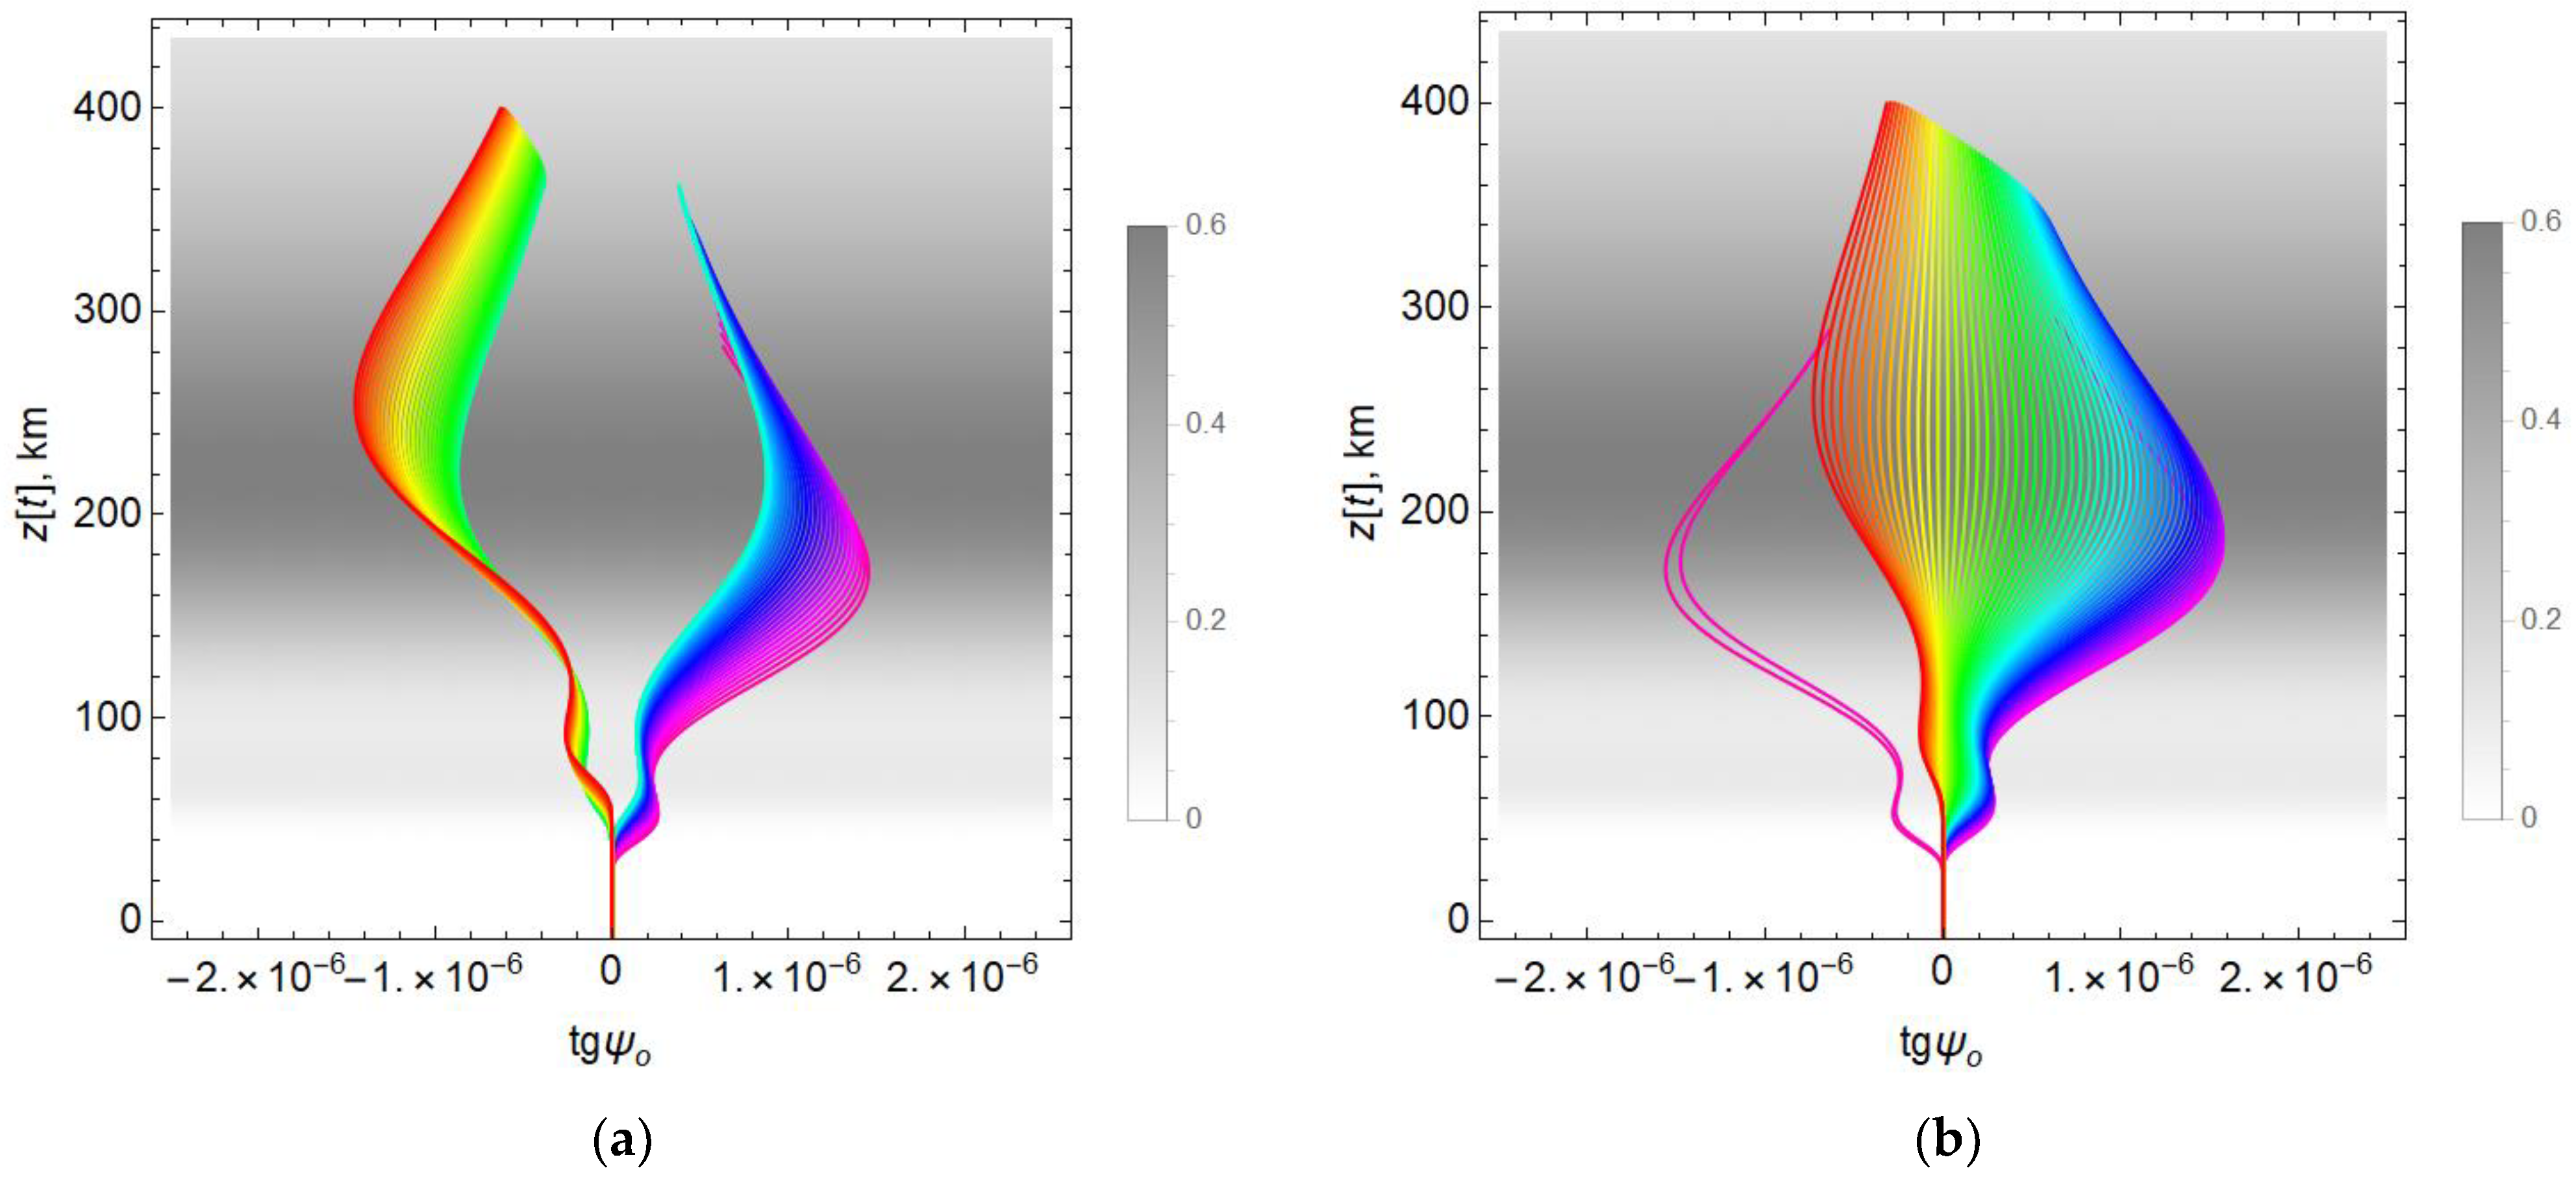
Figure 21a,b shows the dependences
on the height
z along the rays for the two-layer model 3, which contains an inhomogeneity with an increased electron concentration at the maximum of the ionospheric layer. A comparison of
Figure 20a,b
Figure 21a,b, and
Figure 21b shows that the differences are insignificant, but they exist. Green lines in
Figure 21a form a bulge that is absent in the analogous curves in
Figure 20a. The blue curves also differ. In
Figure 21b, the blue curves form a thickening area that is absent in
Figure 20b.
More significant differences are observed between model 2 and model 4, which contains an inhomogeneity with a lowered electron concentration at the maximum of the ionospheric layer. Comparing
Figure 20a and
Figure 22a, we see that the blue and green rays have significant bulges, and in
Figure 22b, the area of thickening of green rays is clearly visible, which is absent in
Figure 20b.
Similar calculations performed by us for the dependence
on height in the case of φ = 90° and φ = 0° showed, as one would expect, that the resulting graphs are symmetrical about the vertical axis compared to
Figure 19,
Figure 20,
Figure 21 and
Figure 22 calculated for
.
It follows from all the figures that the value of the longitudinal component of the electric field is small.
8. Conclusions
Using the bicharacteristics method, we considered the features of the influence of the Earth’s ionosphere on the propagation of P-band radio waves (430 MHz). Four spherical models were compared: a single-layer model of the ionosphere without disturbances, a two-layer model of the ionosphere without disturbances, a two-layer model with local formation with increased electron concentration in the vicinity of the maximum of the
F2 layer and a two-layer model with local formation with lowered electron concentration in the vicinity of the maximum of the
F2 layer. The values of phase variations and the angle of the Faraday rotation of the plane of polarization, arising due to the influence of the ionosphere, were determined. We have established that the angle of the Faraday rotation in the case of a spherical model of the daytime mid-latitude ionosphere can reach 40°. The value of the Faraday rotation angle essentially depends on the orientation of the trajectory and the magnitude and direction of the Earth’s magnetic field, and the estimation of this value cannot be reduced to the calculation of the total electron density. It is also extremely important to estimate the phase deviation of the hundreds of radians component. Thus, when processing the SAR results, it is necessary to consider the influence of the ionosphere at least at the level of the IRI model [
29,
30,
31], which is currently the main tool for predicting the parameters of the Earth’s ionospheric plasma. There are models based on the consideration of physical processes occurring in the atmosphere of the type TIEGCM [
32] and SAMI3 [
33]. However, at present, for the problems under consideration, it is more expedient to use adaptive models of the type IRTAM [
34] and NequickG [
35].
It should be noted that although, as shown by our calculations, the contribution of local inhomogeneities is relatively small, it reaches several degrees and cannot be taken into account using preliminary modeling. Therefore, space experiments in the P-band should be carried out simultaneously with the restoration of ionospheric parameters along the path in real time, such as with the method of radiotomography. On the other hand, the analysis of polarization coefficients showed that many problems are removed if circular polarization is used in the experiment, although the problem of phase deviation remains.
