Article

A Comparison of Analytical Approaches for the Spectral Discrimination and Characterisation of Mite Infestations on Banana Plants

1
Applied Agricultural Remote Sensing Centre, School of Science and Technology, University of New England, Armidale, NSW 2351, Australia
2
Remote Sensing Research Centre, School of Earth and Environmental Sciences, University of Queensland, St. Lucia, QLD 4072, Australia
3
Food Agility Cooperative Research Centre Ltd., Pitt Str., Sydney, NSW 2001, Australia
4
Precision Agriculture Research Group, University of New England, Armidale, NSW 2351, Australia
5
Hydrology, Agricultural and Land Observation Group, Water Desalination and Reuse Center, King Abdullah University of Science and Technology, Thuwal 23955-6900, Saudi Arabia
*
Author to whom correspondence should be addressed.
Remote Sens. 2022, 14(21), 5467; https://doi.org/10.3390/rs14215467
Submission received: 12 September 2022 / Revised: 13 October 2022 / Accepted: 26 October 2022 / Published: 30 October 2022

Abstract

:
This research investigates the capability of field-based spectroscopy (350–2500 nm) for discriminating banana plants (Cavendish subgroup Williams) infested with spider mites from those unaffected. Spider mites are considered a major threat to agricultural production, as they occur on over 1000 plant species, including banana plant varieties. Plants were grown under a controlled glasshouse environment to remove any influence other than the imposed treatment (presence or absence of spider mites). The spectroradiometer measurements were undertaken with a leaf clip over three infestation events. From the resultant spectral data, various classification models were evaluated including partial least squares discriminant analysis (PLSDA), K-nearest neighbour, support vector machines and back propagation neural network. Wavelengths found to have a significant response to the presence of spider mites were extracted using competitive adaptive reweighted sampling (CARS), sub-window permutation analysis (SPA) and random frog (RF) and benchmarked using the classification models. CARS and SPA provided high detection success (86% prediction accuracy), with the wavelengths found to be significant corresponding with the red edge and near-infrared portions of the spectrum. As there is limited access to operational commercial hyperspectral imaging and additional complexity, a multispectral camera (Sequoia) was assessed for detecting spider mite impacts on banana plants. Simulated multispectral bands were able to provide a high level of detection accuracy (prediction accuracy of 82%) based on a PLSDA model, with the near-infrared band being most important, followed by the red edge, green and red bands. Multispectral vegetation indices were trialled using a simple threshold-based classification method using the green normalised difference vegetation index (GNDVI), which achieved 82% accuracy. This investigation determined that remote sensing approaches can provide an accurate method of detecting mite infestations, with multispectral sensors having the potential to provide a more commercially accessible means of detecting outbreaks.

1. Introduction

Worldwide, banana (Musa spp.) cultivation is vital to economies, having an estimated value of 31 billion USD and export value of 8 billion USD with the majority of production based in Asia, Latin America and Africa [1]. The largest producers are India and China, with annual production of 29 and 11 million tonnes, respectively [2]. Aside from their commercial importance, bananas are also considered the third most important starchy food source with approximately 85% sourced from subsistence agriculture and providing 25% of calorific intake in rural production areas [3,4,5]. Although minor in comparison, commercial banana cropping is an important industry in Australia with bananas being the most purchased fruit with a wholesale value (fresh supply) of 723 million AUD annually [6].
In many banana cropping regions, mites Tetranychus lambi and Tetranychus urticae (Trombidiformes: Tetranychidae) are considered a major pest [7]. Mite damage occurs on the underside of leaves where much of their lifecycle is focused. Mites’ piercing mouthparts are used to penetrate the leaf mesophyll layer to feed on chloroplasts. Damage to plant cells varies depending on plant species [8] with undisturbed feeding causing cell destruction and loss of photosynthetic capacity with some plants reported to alter chemical makeup as a defensive response [9,10]. In banana plants, the early stages of leaf damage are characterized by rusty necrotic patches that spread to leaf veins as outbreaks worsen. Left unchecked, entire leaves become grey or brown, wilt and collapse with eventual sunburn, leaf loss and reduction in plant growth [7]. Severe outbreaks can also lead to superficial fruit damage making fruit less marketable domestically and significantly impacting exports that often have strict quality standards [11].
Traditional treatments rely on chemical pesticide application at regular intervals. This ‘blanket’ application is inefficient, tying up labour and resources and leads to pesticide overuse, causing potential pest resistance, residue on produce, negative environmental effects [12] and inadvertent loss of natural predators [7]. To reduce pesticide application, crop monitoring is recommended followed by a more targeted treatment. Due to mites’ short life cycle and high mobility, it is recommended that regular (fortnightly at minimum) monitoring be undertaken as mite infestations are quick to establish during favourable conditions (hot dry weather) [7,13]. Current industry guidelines recommend monitoring based on visual appraisal and treatment either triggered during the early stages of infestation, particularly during conditions that are favourable to growth or through the use of action thresholds that are triggered based on percentage coverage of physical mites or mite damage to plants [13]. Early treatment reduces the potential for damage in plants as infestation is rapid and density is directly related to worsened leaf damage [14,15]. Mite infestation monitoring can be labour-intensive and success relies on visual appraisal which can be subjective with recommended monitoring and triggers varying based on jurisdiction [7,13,16]. Improvements in monitoring efficiency that can provide greater consistency would therefore be beneficial.
Damage to crops caused by spider mites is considered substantial and affects over 1000 plant species [17] prompting the investigation of remote sensing for the detection and monitoring of mites in different crops such as cotton [15,18], strawberry [19], peppers, beans [20], peach trees [21] and cucumber [22]. Many of these studies utilized chemometric analysis techniques on gathered hyperspectral data of leaves to identify mite infestation. Analysis techniques such as partial least squares discriminant analysis (PLSDA), K-nearest neighbour (KNN), support vector machines (SVM), and neural networks are well suited as they are able to distinguish patterns in datasets comprising thousands of spectral bands and create models for prediction and discrimination [23,24]. Based on these studies, remote sensing has been found to provide good results in detecting leaf spectral changes associated with mite damage. The application of remote sensing has several advantages over traditional forms of monitoring, providing repeatable, timely and quantifiable monitoring with greater efficiencies [25,26].
Often only specific portions of the spectrum provide discrimination between treatments, so in the interests of simplifying classification models, variable selection methods can be used to identify more correlated wavelengths within hyperspectral data for classification. The ability to reduce the number of variables whilst providing high levels of classification accuracy has computational benefits by simplifying model structures, and addressing issues associated with collinearity [27]. Additionally, the identification of key spectral regions as opposed to the full spectral response may allow the use of more simplistic sensors such as multispectral, reducing analysis complexity, are more affordable and have greater commercially availability, a major consideration if this technology is to be adopted on-farm. Examples of variable selection methods include competitive adaptive reweighted sampling (CARS), a method that has been used for nitrogen content estimation in apple trees [28] and walnut variety identification [29] Sub-window permutation analysis (SPA) has also been used for the detection of powdery mildew on wheat [30], while random frog (RF) has been applied to determine polyphenols in tea [31] and wheat grain variety identification [32].
There is much interest in the application of unoccupied aerial vehicles (UAV) also referred to as drones, unmanned aerial vehicles or remotely piloted aerial systems for use in precision agriculture for their ability to provide high spatial and temporal resolution imagery in a relatively cost-effective manner [33,34,35,36]. The increasing affordability and availability of UAV multispectral sensors, often specifically designed for plant and agricultural applications provide the potential for monitor of mite infestations. Successful detection of mites on cotton plants using a UAV near-infrared (NIR), red and green multispectral camera provided an overall accuracy of 0.95 using a neural network classification [37].
As discussed by Herrmann et al. [20] leaf structure and the biochemical response to mite attack differ between plants, resulting in differences in spectral response and detection success. Therefore, an investigation into the spectral characterization and detection of mite damage provides important information on the ability to detect infestations of mites, specific to banana plants. Few remote sensing studies exist on the detection of pests in banana crops. Roderick et al. [38] examined the potential link between canopy leaf area index and the presence and population size of nematodes. Selvaraj et al. [39] detected banana corm weevil presence from images of cut corms (in a destructive process) using neural network object detection. In contrast, disease detection has had far greater focus, with pest detection being an important element in the development of a holistic precision agriculture applications in banana crops. Understanding the spectral response to mite attack fills an important knowledge gap in pest and disease detection methods.
This study investigates the capability of proximal remote sensing to detect spider mite infestations in banana plant crowns. A benchmark of different classification methods, including PLSDA, KNN, SVM and back propagation neural network (BPNN), and a combination of variable selection methods including CARS, SPA and RF, was carried out on hyperspectral data captured during infestations to determine classification efficacy and identify sensitive wavelengths for detection. Included in the investigation was the potential use of a common off-the-shelf UAV-based multispectral sensor to determine suitability for detecting mite outbreaks in banana crops.

2. Materials and Methods

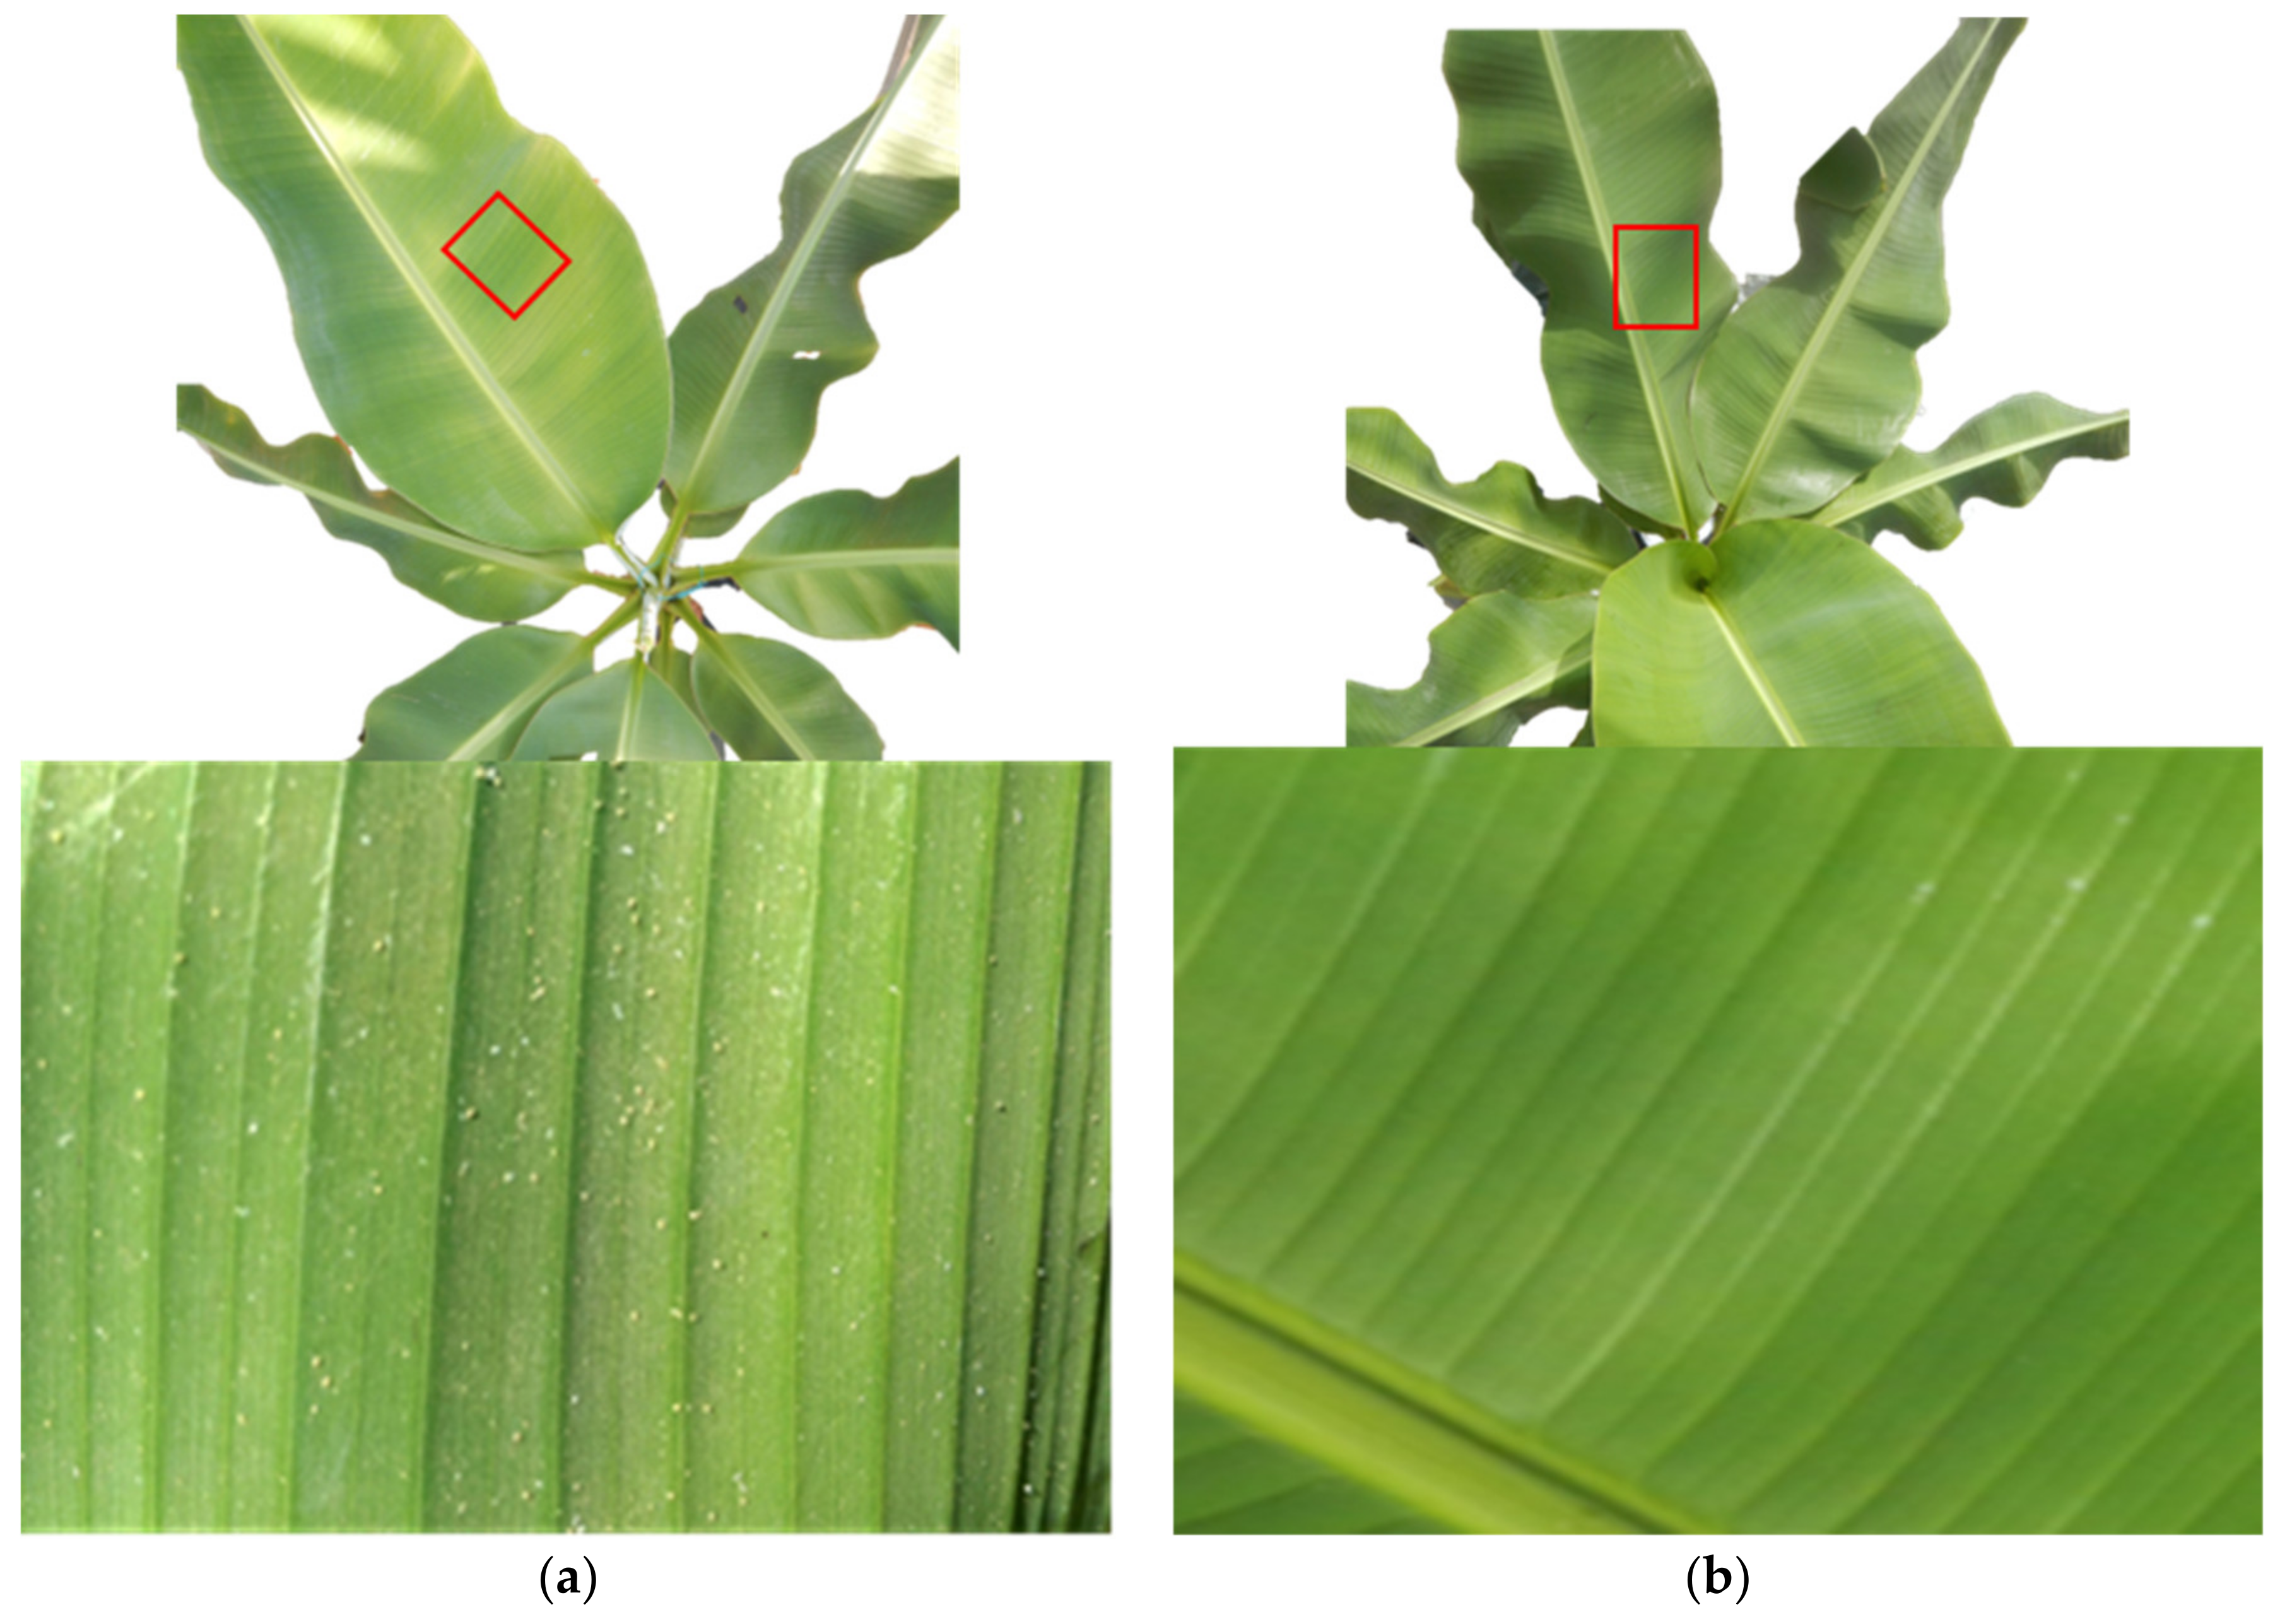
2.1. Experimental Design

Musa AAA (Cavendish subgroup Williams) bananas were received as lab-grown tissue culture plantlets with established roots (N = 42) from Queensland Government (Nambour, Queensland). The plants were transferred to seedling trays for acclimatization and primary hardening under growth lights in a temperature-controlled environment for 2 months [40]. Plants were then repotted into 200 mm ANOVATM pots using UQ23 potting media consisting of 70% composted pine bark (0–5 mm) and 30% coco peat and provided with on-demand watering and fertilization (Grow Force Ltd., Macquarie Park, Australia., Flowfeed EX7; Nitrogen (N) (20.8%), Phosphorus (P) (3.3%), and Potassium (K) (17.4%) to ensure constant availability and reduce nutrient or water-related stress [41,42]. Plants were split randomly into two groups (21 plants per treatment) and placed in separate, adjacent evaporatively cooled and heated glasshouses at the University of Queensland (UQ), St. Lucia campus. Glasshouse temperatures ranged from 17–35 °C, with the photoperiod dictated by natural sunlight. Plant location and density were adjusted according to size to minimize adjacent plant leaf overlap with plant location randomly assigned on a weekly basis within each treatment [42].
Following five months of growth, at which time banana plants had an approximate height of 110 cm and the length of the first fully unfurled leaf was approximately 70 cm, 21 of the plants in a single glasshouse were exposed to mite outbreaks. Glasshouse protocol requires immediate pest control when mite infestations exceed approximately 10% leaf coverage of each plant. Monitoring was based on daily visual assessment of both the upper and lower surface of leaves to estimate if mites were present on 10% or more of each plant, with initial assessment carried out by glasshouse staff and follow-up assessment confirmation and approval to carry out treatment by the glasshouse facility manager (qualified horticulturalist). In general, at the 10% density levels, mite colonies were often encountered in the upper crown leaves with damage considered to be low [7], and prior to the appearance of rusty necrotic patches described in the introduction. The early damage presented predominantly as faintly visible light green to light brown interveinal stippling discolouration, typically varying in size from whole portions of the leaf to localised patches, compared to healthy green leaves (Figure 1). Due to the short life cycle of mites and high mobility, regular (daily) monitoring was carried out as mite infestations are quick to establish during favourable conditions (hot dry weather) [7,13] with the glasshouse conditions allowing mites to double population every four days (Personal communication).

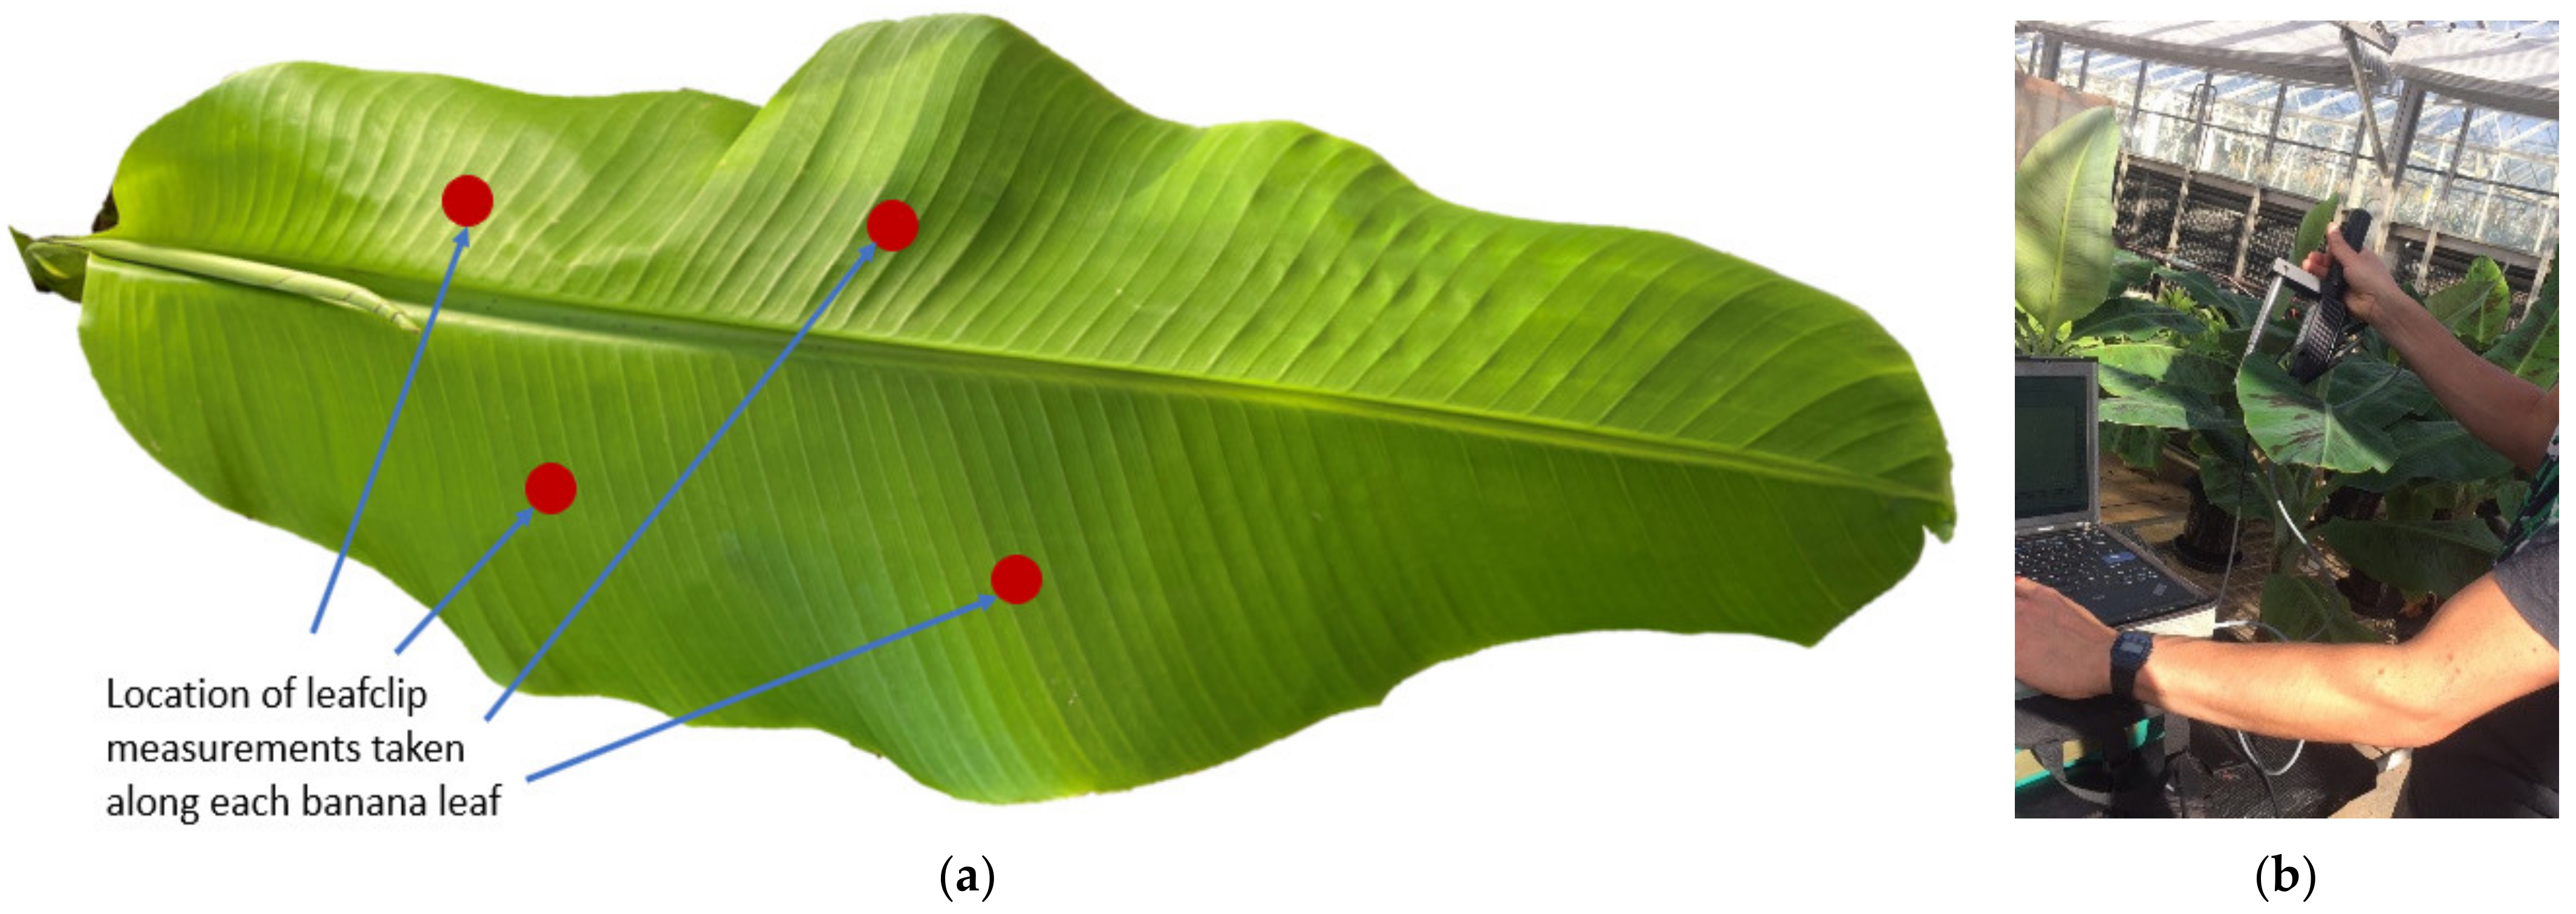
2.2. Spectral Data Collection and Pre-Processing

Prior to treatment, in situ glasshouse spectral reflectance measurements were captured on 1 November 2017, 17 December 2017 and 9 January 2018 between 11 a.m.–1 p.m. using an ASD Fieldspec 4 (Analytical Spectral Devices, Boulder, CO, USA) spectrometer with a spectral range of 350 nm to 2500 nm and spectral resolution of 3 nm Full-Width-Half-Maximum (ASD, Colorado). Following a device warm-up of at least 20 min for spectral reading stability, measurements were collected from the uppermost seven fully unfurled leaves at four locations along the lamina of each leaf (See Figure 2a) from both healthy (1736 readings) and mite-affected plants (1372 readings). Sampling and sample locations were intentionally designed to be consistent and repeatable. In this way measurements were not specific or targeted toward the presence of mite damage. Targeting only mite damaged portions of leaves was not considered to provide an effective mite detection method for banana plants as mites are not uniformly distributed over the crown, particularly at densities considered to trigger management actions. Measurements were collected using an ASD leaf clip accessory equipped with its own light source (4.5 W halogen lamp) and 2 cm field of view, providing standardization of measurements (Figure 2b). Use of the leaf clip allowed in situ sampling and ensured that measurements were not subject to ambient light variability that may be caused by shadow or atmospheric conditions (e.g., cloud cover, glass roof, etc.). This standardization was considered necessary for measurement consistency to reduce plant disturbance and ensure stable environmental conditions throughout the entirety of the sampling events [24]. Measurements were made with minimal interruption between treatment groups to reduce any potential for variation in reflectance caused by diurnal photosynthetic processes and temperature. Spectral optimization and calibrations were carried out every 5–7 min, i.e., approximately every 3rd plant measurement (21 leaves) [43,44].
Glasshouse gathered spectral reflectance data were processed and exported using the ASD ViewSpecPro software. From these reflectance measurements, plant averages were calculated and wavelengths associated with water absorption (1350–1420 nm, 1770–1965 nm, 2450–2500 nm), as well as wavelength regions known to be noisy were removed (350–450 nm) [24,45]. Screening for potential outliers was based on Hotelling T2 and Q residuals calculated from principal component analysis with spurious measurements removed. Varied pre-processing data treatments commonly used to account for systematic noise, light source variation or scattering and for rectifying baseline drift were trialled to improve model development and separability between classes [29,46]. These included mean centering and combinations of multiplicative scatter correction (MSC), standard normal variate (SNV), and first order and second order Savitzky-Golay derivatives. Pre-treatment, classification model analysis and variable selection were conducted in Matlab 2017 (The MathWorks, Natick, Ma, USA.) using the classification toolbox [47], libPLS [48] and the eigenvector PLS-toolbox (Eigenvector, Wenatchee, WA, USA).

2.3. Classification Models

Four classification models were trialled, including PLSDA, KNN, SVM and BPNN (Figure 3). Prior to analysis, a calibration dataset and independent prediction dataset was created using Kennard-Stone sampling to create an 80/20 data split [49]. All calibration data models had Venetian blinds cross-validation (10 splits) applied, the results of which aided model optimization decisions. Venetian blinds cross-validation is a commonly used cross-validation method [20,29,50] that carries out systematic sample selection based on the selected number of splits to create test sets from which cross-validation is carried out. The sampling pattern was repeated across the entire dataset until all split combinations had been tested [47]. Constructed models were then tested using the discrete prediction data and performance was measured based on classification accuracy on calibration, cross-validation and prediction outputs calculated according to Equation (1):
accuracy = correctly predicted samples/total number of samples
PLSDA is commonly used for the analysis of hyperspectral data for its ability to handle large, often highly correlated (collinear) datasets consisting of thousands of wavelengths (X-variables). Partial least squares regression reduces the data by using a series of iterative processes to create a smaller number of latent variables (or components) from which categorical classification can be carried out. The addition of discriminant analysis to PLSDA incorporates categorical classification analysis by splitting variables into categorical variables and maximising the distance between variables (e.g., pest vs. no pest) [51,52].
The KNN classifier is a non-parametric supervised classifier that works based on grouping samples with similar features together and assumes sample groupings belong to the same class. Based on similarity, samples that are clustered can be assigned to a class based on a proximity measure to reference samples in a non-linear fashion [29,53]. For this study, Euclidean distance was used as the measure to group samples, and models were optimized based on K values between 3–15.
SVM provides classification by placing sample data into a projection space and constructs hyperplanes designed to provide maximum separation between classes. To improve classification performance, a radial basis function was applied to the hyperplane and optimized using a grid search procedure to improve class separability commonly used for close or overlapping sample classes not able to be easily separated [27,28,54].
BPNN is a commonly used neural network comprising a feed-forward neural network that uses backward propagation of error to adaptively fine-tune weights during network training [55,56]. Training networks in such a manner provides more efficient learning and greater reliability [56]. BPNN for this study was based on a single hidden layer. Combinations of network architectures trialled included changes to the number of neurons, learning rate, number of iterations and alpha/learning weight.

2.4. Variable Selection of Key Spectral Wavelengths

Trials of different variable selection methods were used to reduce the hyperspectral data to key wavelengths most relevant for classification and to reduce data redundancy. Advantages of reducing spectral dimensionality include greater computational efficiency and the potential for better classification results [27]. Variable selection methods used include CARS, RF and SPA. Classification model accuracy based on CARS, RF and SPA were calculated (Equation (1)) and the performance was compared, between models based on selected wavelengths as opposed to all available spectral bands from the hyperspectral dataset.
The CARS variable selection approach uses Monte Carlo sampling (MCS) to select subsets of variables used to create a series of PLS (partial least squares) models. The variables in these models that have the largest regression coefficient are selected in a competitive manner, using “survival of the fittest”, while variables providing less contribution are iteratively removed using a combination of exponential decay and adaptive reweighted sampling to further refine the number of variables. Final variables from these reduction steps are selected based on the lowest root mean square error (RMSE) obtained from cross-validation of the dataset [57].
As described by Li et al. [58] RF uses a selection method inspired by reverse jump Markov chain Monte Carlo (RJMCMC) methods to iteratively build models from which important variables are selected. Consisting of a series of steps starting with the construction of PLS models based on a random variable subset selected using MCS, from the results of the initial model performance, additional variable subsets are selected and tested. The number of iteration runs is based on user-defined criteria and selection based on their ability to fulfil probability criteria. Based on the success of the models created, the most important variables are determined [58].
SPA variable selection is designed to calculate the most suitable complementary variable combinations aiding detection. SPA determines the most important variables by comparing the distribution of normal prediction error (NPE) based on a comparison of randomly created PLS models of training and test data subsets to results obtained using variable permutations of the test set data (permutated prediction error (PPE)). Comparing NPE to PPE scores determines which variables provide improvement to the model. Variable importance is able to be measured using a conditional synergetic score (COSS), a logarithmic transformed P value calculated from a Mann–Whitney U test of NPE and PPE’s [48,59].

2.5. UAV Multispectral Discrimination

To determine the utility of a UAV-mounted multispectral sensor for the detection of mite outbreaks on banana leaves, hyperspectral reflectance data were resampled using the hsdar package (version 1.0.3) in Rstudio (Version 1.4.1717, Boston, MA, USA) to match the approximate spectral band-pass functions, (e.g., Table 1, centre band ± FWHM/2) of the Parrot Sequoia® multispectral camera (Parrot Drone SAS, Paris, France). The Parrot Sequoia is a common off-the-shelf UAV sensor marketed for monitoring agriculture, acquiring data in green (G), red (R), red edge (RE) and near-infrared (NIR) bands (details provided in Table 1). Determination of detection accuracy (Equation (1)) of mite damage using Parrot Sequoia data was carried out using a PLSDA model and the most effective band(s) for detection were ranked based on the amount of explained variance each band contributed [20].
Several common broad band vegetation indices (VI’s) identified to detect mite damage were created including the normalised difference vegetation index (NDVI) (Equation (2)), the green NDVI (GNDVI) (Equation (3)), the red edge NDVI (REGNDVI), and NIR red edge NDVI (NRENDVI) (Equation (5)) [20]. In addition, to determine the potential use of only visible bands for mite detection, the green-red vegetation index (GRVI) (Equation (6)) was included [36,60]. To determine if VI’s are able to provide separation between treatment groups a two-class t-test was used, to determine detection success a threshold was created based on the mean score between the highest VI value of the infested class and the lowest VI value for the non-infested class [61]. Individual VI detection accuracies based on these thresholds were provided using Equation (1).
NDVI = (NIR − Red)/(NIR + Red)
GNDVI = (NIR − Green)/(NIR + Green)
REGNDVI = (NIR − Red edge)/(NIR + Red edge)
NRENDVI = (NIR − Red edge)/(NIR + Red edge)
GRVI = (Green − Red)/(Green + Red)

3. Results and Discussion

A general visual comparison of spectral reflectance curves of banana plants with mite presence and absence shows some spectral separability in the visible portion of the spectrum with infested plants having slightly higher reflectance in the blue and green portions of the spectrum (450–550 nm) followed by more obvious separation in green through to early red portion (550–650 nm) (Figure 4). In addition, separation between treatments can be observed in the red edge portion of the spectrum (680–730 nm) with the infested plants having higher reflectance toward shorter wavelengths. Increased reflectance can also be observed for some infested plants in the near-infrared region (760–1300 nm) and adjacent water absorption bands around 1500–1750 nm and 1965–2150 nm.

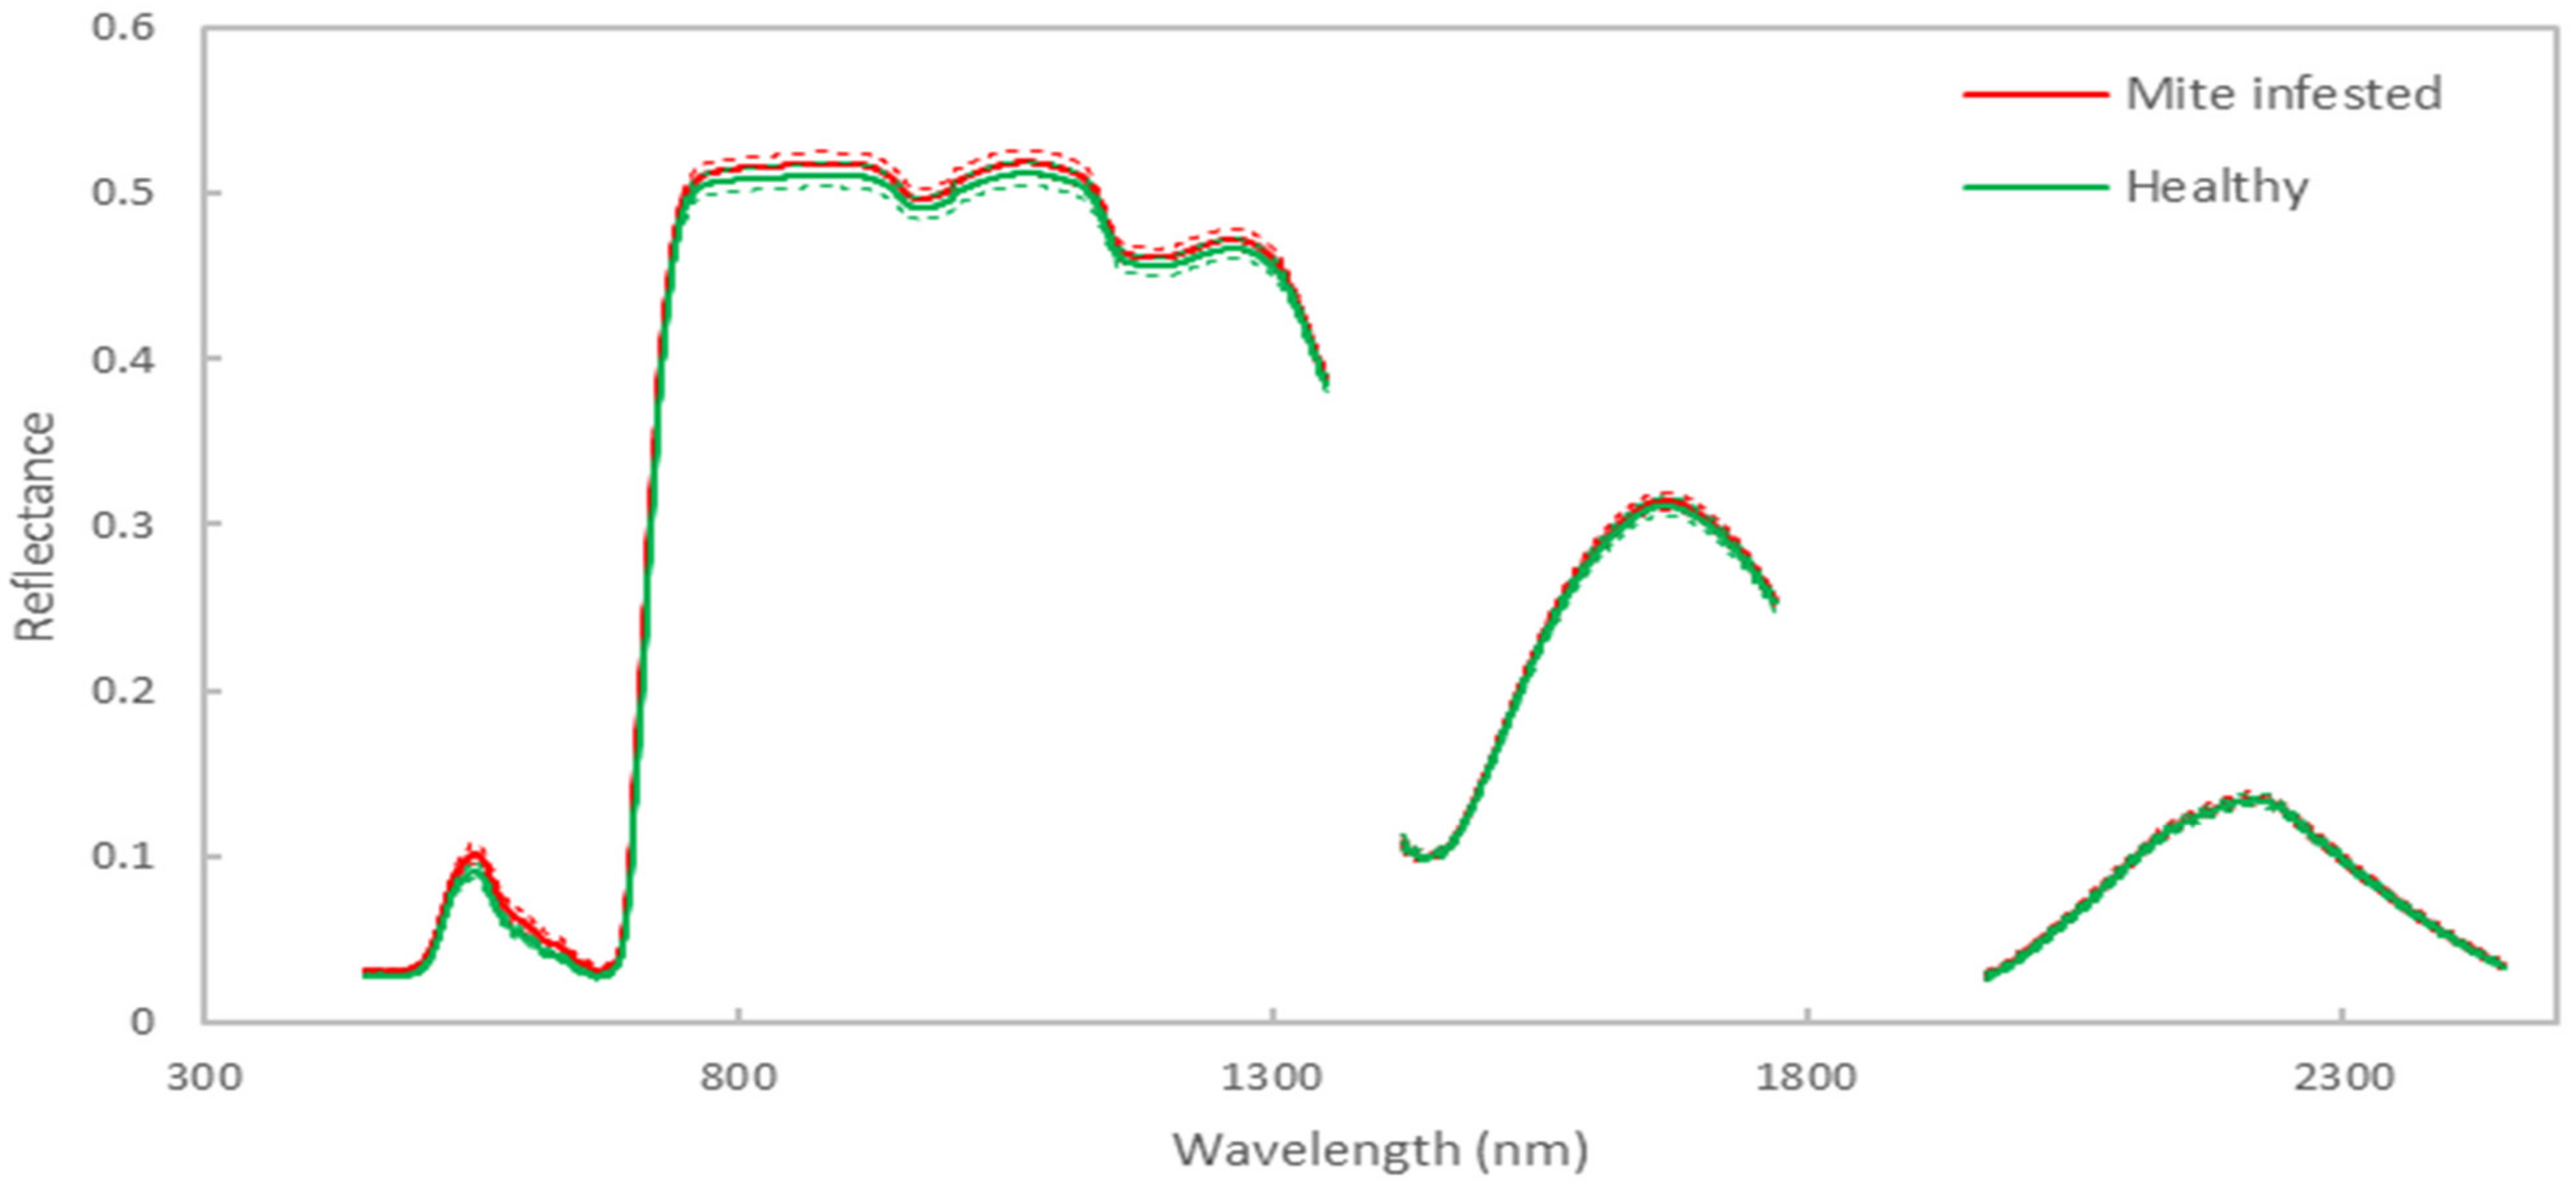
3.1. Classification Model Results for Discriminating between Infested and Healthy Plants

Classification models based on full spectra (1733 spectral bands) provided high levels of classification accuracy across all models trialled, indicating mite damage to banana leaves causes distinct spectral change able to be modelled during the earlier stages of mite infestation (Table 2). Across all modelling methods, the most consistently accurate classifications used pre-processing consisting of Savitzky-Golay 1st Derivative and SNV. With similar classification model results for calibration, validation and prediction data sets supporting model validity and indicating minimal model overfit. The use of a Savitzky-Golay derivative smooths data to remove unwanted random noise and uses differentiation to reduce low-frequency additive and multiplicative effects in spectra for signal enhancement. SNV applies a correction factor to adjust baseline shifts and reduce additive and multiplicative scatter effects [46]. Light scattering and path length differences can be attributed to illumination and leaf structure. Whilst leaf surface irregularities may influence reflectance, most wavelengths and in particular infrared are altered by scattering and diffusion caused by internal structure and content. The architecture of the internal cell structure (cuticle, mesophyll, epidermis, etc.) and density of cell walls, pigment contents and air cavities all contribute to wavelength scattering based on structural elements and refractive differences [62,63]. Differences in reflectance influenced by scattering between different leaf locations and between plants are cause for variation in spectral data and common, well-established data pre-processing methods improve classification model results by reducing unwanted sample variability and are considered vital to most spectroscopic modelling [46].
Of the models, KNN (K = 10) provided the least accurate result (0.76 calibration and 0.81 prediction) but despite a reduction in accuracy compared to other models it still provided a reasonable result with the advantage of being the fastest to implement due to its simple architecture and reduced complexity compared to other models. Similarly high levels of accuracy were achieved for PLSDA (LV: 4), SVM (cost 100, gamma 0.1, SV 45) and BPNN (iterations 1000, learning rate 0.1, alpha 0.1) with PLSDA providing a slightly better result in the prediction set of 0.91 (Table 2). For this experiment, PLSDA was able to provide a high level of classification accuracy based on a low complexity model with few classes. In situations where datasets have high levels of noise and variability, linear models (such as PLSDA) are considered less robust and have greater sensitivity to dataset variance. In these circumstances non-linear models such as SVM and BPNN are considered to outperform linear models and provide greater levels of accuracy with established non-linear models having greater repeatability across datasets [28]. Many contemporary comparisons of classification models consider neural networks to provide superior results, particularly where spectral change is less distinct and involve multiple classes [28,32]. Neural networks generally require greater computation, training time and user input, than the alternative methods investigated. In cases of linear datasets containing easily separable classes, models can be at risk of overfitting [56]. For the application of BPNN in this study, it was discovered that attempts to generalize calibration models through changes to network architecture led to a reduction in the accuracy of the validation and prediction models. Therefore, similar to Wang et al. [23] a greater level of overfitting was retained in the calibration model to provide greater model accuracy in the validation and independent prediction dataset.
To confirm experimental validity and potential for sample bias, the created models were applied to hyperspectral data gathered 9 days prior to infestation events using an identical sampling protocol to that described in Section 2.2. Model results determined that both treatment groups were classified as undamaged prior to investigation. This was an important exercise due to the limited number of samples and the potential that the spectral variations between the treatments may have been unrelated to the presence and absence of mites, i.e., from other biotic or abiotic constraints.

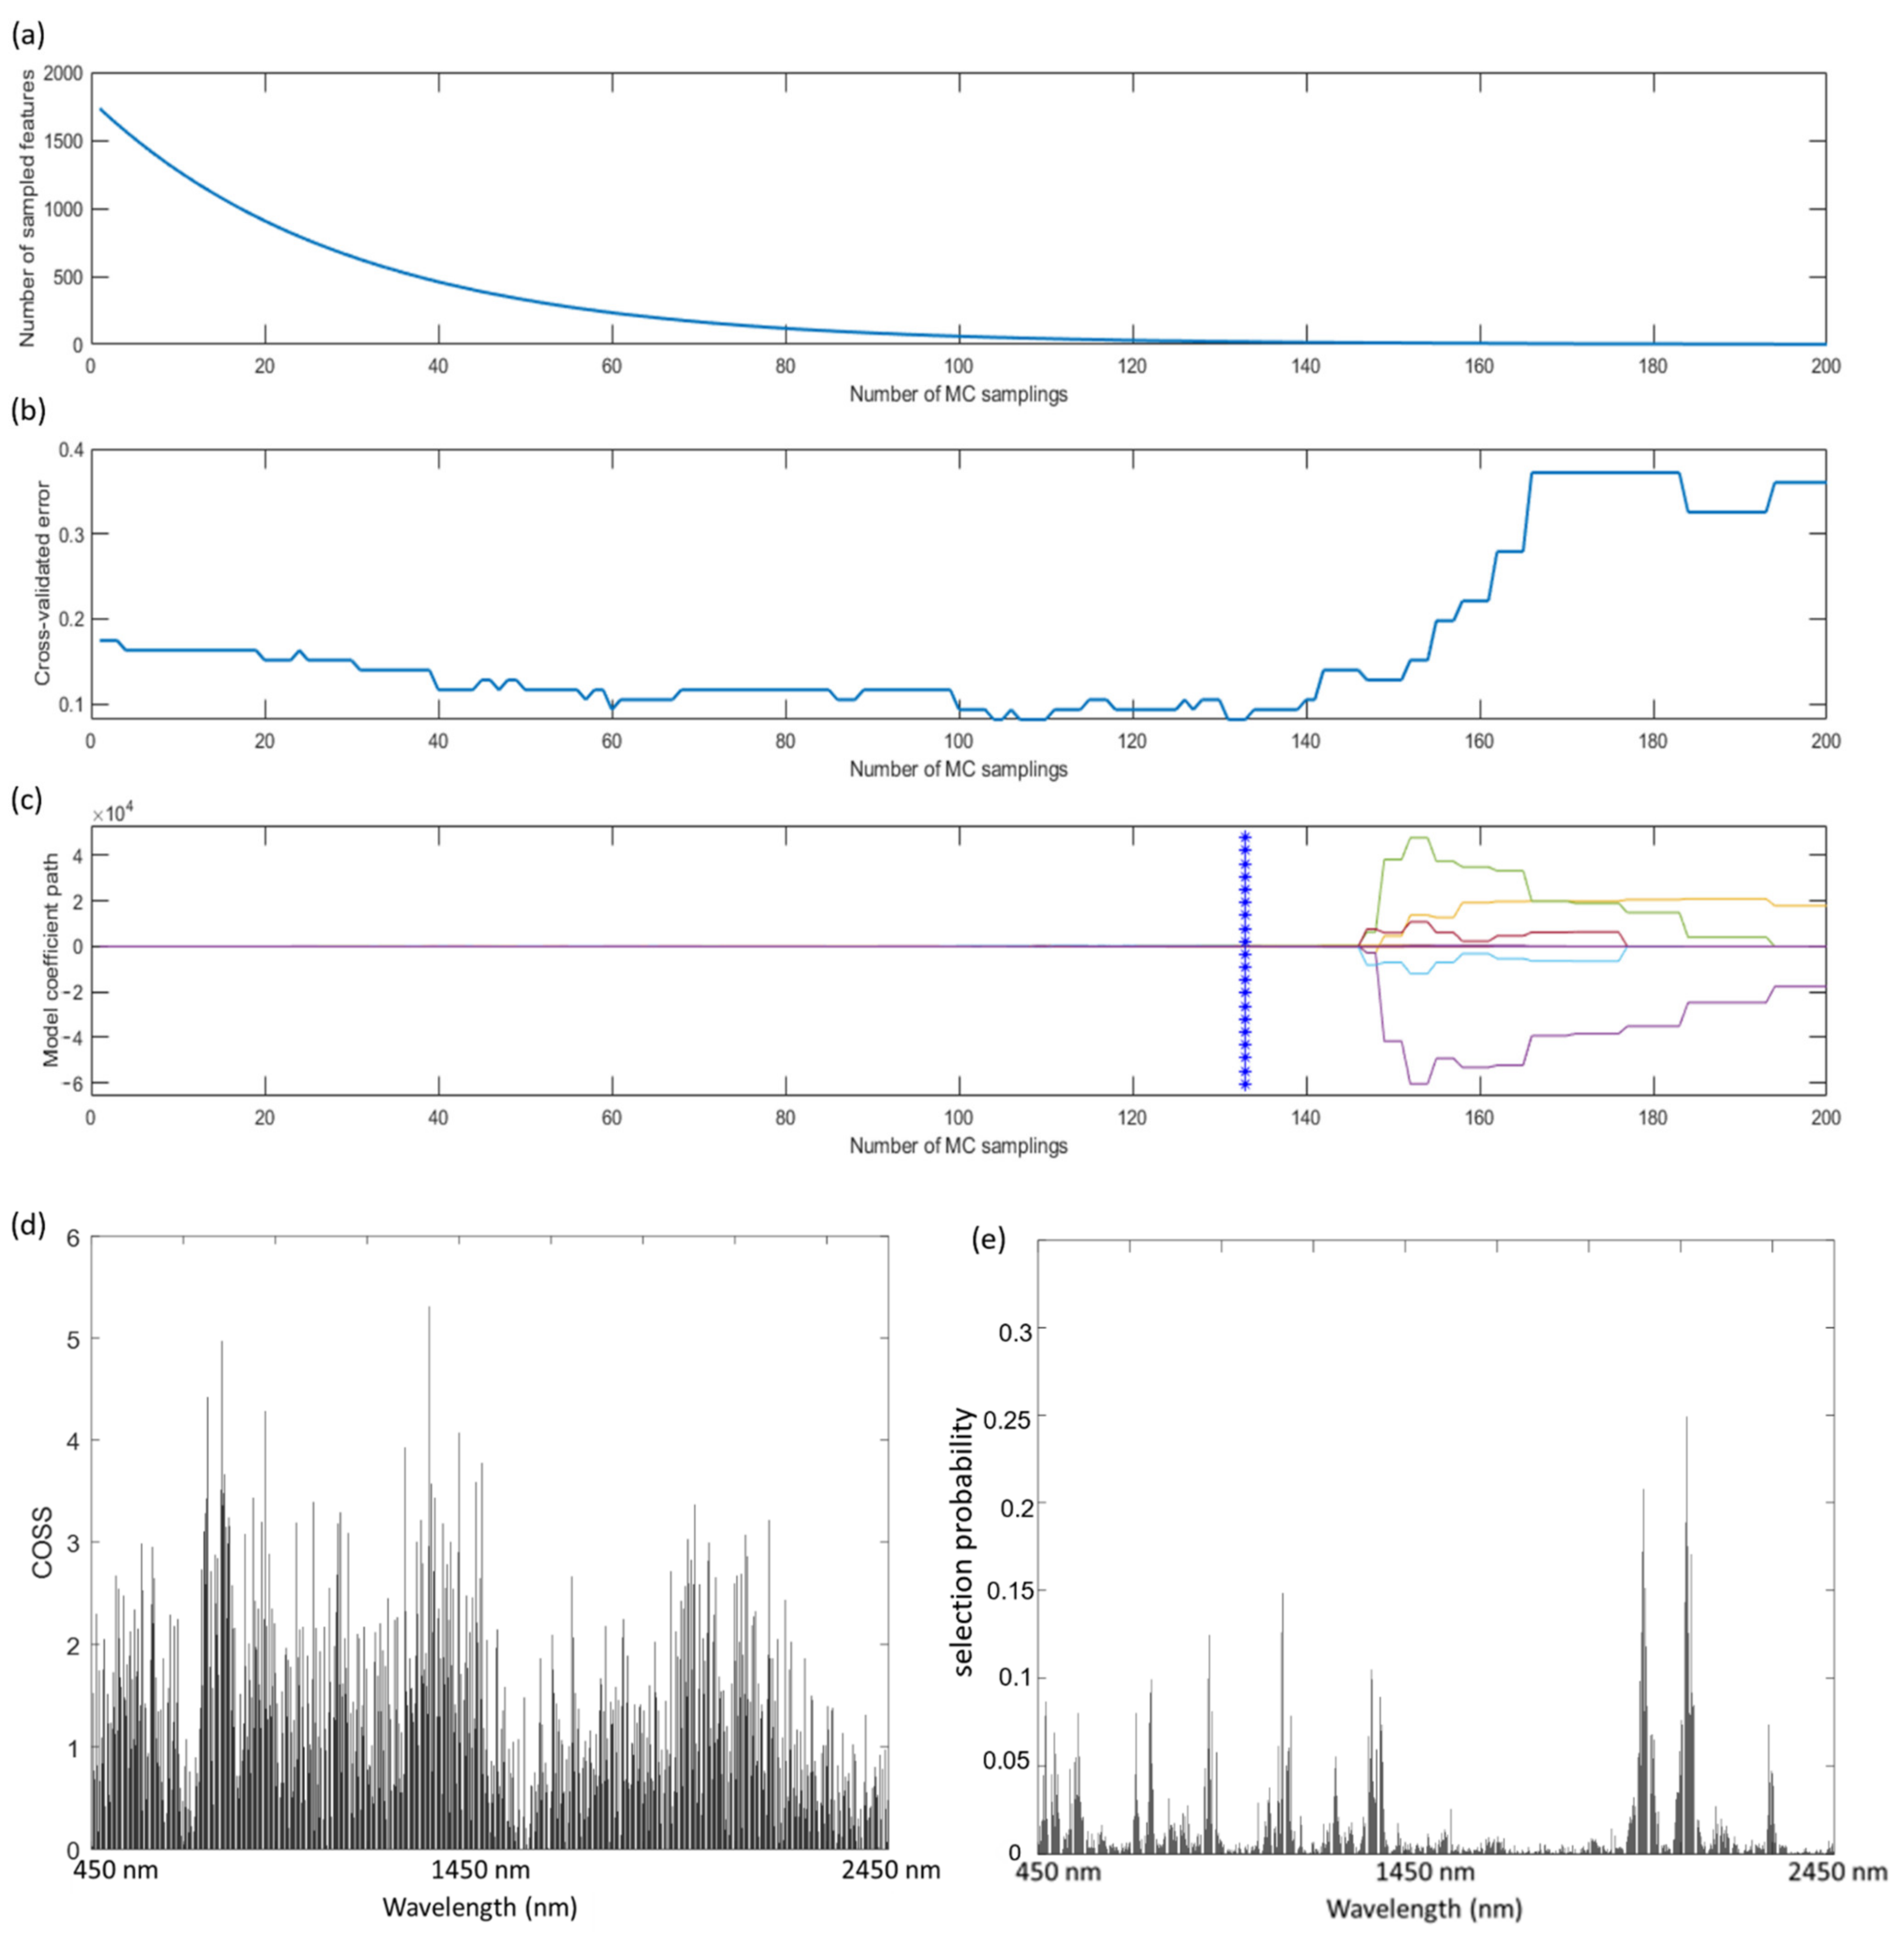
3.2. Key Wavelength Selection

Prior to modelling, key wavelengths were selected using CARS, SPA and RF to reduce spectral data dimensionality using operations discussed in Section 2.4 to select the most important wavelengths for use in models for discrimination between healthy banana plants and mite-infested banana plants. Wavelengths selected varied between each of these methods, a reflection of the different mathematic operations used for selection. This section discusses wavelength selection output results for CARS, SPA and RF.
Wavelength selection by CARS was based on 200 iterations and ten-fold cross-validation with optimal cross-validation based on 20 latent variables. From the graphical representation of the CARS selection process, the top panel trendline (Figure 5a) indicates an initial rapid pace of fast selection based on the elimination of poor-performing variables through the exponential decreasing function. Flattening and slowing of the slope indicates the refined selection process focusing on the remaining, most competitive variables. Figure 5b indicates that a minimum RMSE was reached after 133 sampling runs during which 1713 redundant wavelengths were removed. The upward inflection in the cross-validated error indicates that some useful variables were omitted after this point with models returning worse RMSE scoring. Figure 5c provides a graphical representation of the regression coefficient recorded for each wavelength (represented by individual coloured lines) throughout the different sampling runs and provides an indication of how different wavelengths influence the RMSE based on their addition to and removal from the sampling run. Ranking of the 20 most selected variables indicates that spectra in the visible blue portion were most important followed by green, red to red edge, followed by groupings of similar spectra in near-infrared and shortwave infrared (SWIR), with the highest representation of variables from the red edge portion of the spectrum (Table 3). SPA variable selection based on 2000 iterations determined 20 ranked variables as expressed from a plot of COSS values (Figure 5d). Selected wavelengths (Table 3) feature high representation in the red edge and near-infrared part of the spectrum. RF variable selection based on 10,000 iterations suggested variables predominantly in the SWIR portion of the spectrum (Figure 5e and Table 3), with the addition of blue and near-infrared portions of the spectrum. The reduced number of wavelengths selected based on CARS, SPA and RF, for the classification models (Section 3.3), provide a decreased spectral dimensionality with greater computational efficiency and potential for better classification results due to reduced noise, and overfitting [27].
The CARS and SPA selected wavelengths (Table 3) are similar to those identified as important for modelling mite infestations in other crops, including green-yellow and most prevalent, the red edge bordering near-infrared portions of the spectrum with individual wavelengths falling between 497–580 nm and 680–744 nm for cotton [15], peach trees [21], strawberries [19], peppers and beans [20]. Other identified wavelengths, although less commonly identified in other studies shared with RF, SPA and CARS are the upper values of NIR to SWIR for strawberries (800–1300 nm) [19] and peach (1405–2500 nm) [21]. Not commonly associated with other studies is the inclusion of blue (466 nm) in CARS and RF. However, violet-blue (365 nm) has been identified as important for peach trees [21]. It should be noted that most studies identified used visible and near-infrared sensors rather than the full range which could explain a reduced representation in the upper NIR and SWIR parts of the spectrum.
Mite infestation is rapid with increasing density directly related to leaf damage, because of this it is important to detect and treat infestations rapidly as sustained or high-density predation alters both chemical and structural properties of leaves, causing plant stress, reduced photosynthesis and dehydration [9,14,15]. Initial physical damage is caused by mites accessing the leaf mesophyll layer to feed on chloroplasts. This mechanical damage and draining of cells alter internal leaf structure changing leaf turgidity changing internal refraction of various cells and reflectance, particularly in the infrared portion of the spectrum [63]. Sustained feeding on chloroplasts causes additional damage through alteration to pigment composition and eventual loss of internal leaf structure integrity [20,64]. Pigment alteration caused by parasitism and also the plant’s defensive response result in spectral change [14,65] that spans the visible portions of the spectrum to the initial portions of near-infrared (380–810 nm). The spectral regions identified in the study include blue (450–550 nm) represented by chlorophyll and carotenoids and blue to green (450–550 nm) portions of the spectrum, influenced by the pigments beta-carotene, chlorophyll (predominantly chlorophyll b) and anthocyanins. Visible green to early red (550–650 nm), are also representative of anthocyanins and chlorophyll b and red edge (680–730 nm) of chlorophyll and anthocyanins. Changes to near-infrared (760–1300 nm) can represent chlorophyll b and anthocyanins in the early portions (<810 nm) [66] but are generally influenced by internal leaf structure and thickness. Portions of SWIR (1500–1700 nm and 1750–2150 nm) could indicate changes in leaf water content related to dehydration [19,67]. Although the mechanics and habits of feeding by mites are well understood [64], further investigation is warranted into detecting changes in leaf pigment, water content and cell structure in response to mite damage to further understand the drivers behind the spectral change in banana plants.

3.3. Key Wavelength Classification Model Accuracy

In general, a comparison of models built on CARS and SPA variable selection methods provided similar accuracies to that of full spectra models and even provided greater accuracy when applied to KNN models (0.86 and 0.82 prediction accuracy respectively). However, RF reduced the performance by close to 20% compared to the highest performing model of the CARS prediction data set (Table 4). Comparing variable selection methods, CARS provided the greatest consistency and accuracy across models with identical prediction accuracies of 0.86 for KNN, SVM and BPNN. In practice using KNN and SVM based on CARS-selected wavelengths provided greater implementation efficiency than that of BPNN making these combinations a potentially more suitable choice whilst maintaining accuracy.
Model accuracy performance of CARS, SPA and RF can be attributed to differences in the selection of different wavelength bands. For RF, only a small selection of wavelengths were based in the visible (blue) and near-infrared parts of the spectrum with 70% of the bands located in the SWIR portion. In contrast, SPA had little SWIR representation with wavelengths located predominantly in the red edge and NIR parts of the spectrum, whereas CARS selected wavelengths over a much larger spectral range with a larger inclusion of the visible portion of the spectrum (blue, green and red), in addition to the red edge, NIR and SWIR regions identified in the RF and SPA selections. A notable portion of the spectrum omitted by the lower performing RF but included in SPA and CARS were the portions bordering the red edge and early near-infrared wavelengths, which have also been identified as suitable for mite detection in cotton [15], peach trees [21], strawberries [19], peppers and beans [20].
The wavelengths chosen using the SPA variable selection may be related to its mechanism of selecting combinations of variables that collectively aid detection while aiming to reduce collinearity, with an overall reduction in the number of variables selected in potentially useful portions of the spectrum [28,59]. This ability to only select combinations of variables ensures low redundancy although it may not select optimal variables [68]. In contrast, the lack of a mechanism to select complementary variable combinations such as those featured in SPA and reliance on MCS in the RF and CARS methods can lead to non-optimal variable selection. One potential approach to take advantage of the inherent features of each method is to combine selection methods such as CARS-SPA [68]. Despite the possible shortcomings of the different methods, their ability to reduce the number of variables by over 90% and provide similarly high accuracies to the full spectrum data demonstrates the effectiveness of variable selection with CARS providing the highest accuracy results. Considering that a very high level of classification success was possible using a significantly reduced number of variables supports the common use of less complex and more affordable sensors for detection.

3.4. UAV Multispectral Discrimination of Healthy and Mite-Infested Banana Plants

Classification results of hyperspectral reflectance matching attributes of a Parrot Sequoia® multispectral camera indicated calibration accuracy result of 0.82, validation accuracy of 0.78 and prediction result of 0.82 using PLSDA (LV:3). Based on the amount of explained variance that each spectral band contributed to the model, the ranking of band importance was near-infrared (790 nm), red edge (735 nm), green (550 nm) with red (660 nm) providing the lowest contribution. VI’s created using Parrot Sequoia band combinations determined that VI’s incorporating NIR, or red edge provided significant separation between treatment groups with GNDVI, REGNDVI, NRENDVI and NDVI all able to separate mite-infested plants to a very high level of significance (p < 0.01). Likewise, those same VI’s containing RE or NIR provided high levels of accuracy based on threshold classification with GNDVI (0.82) providing the best result. Classification accuracy (Table 5) determined that the visible wavelength VI GRVI was unable to provide significant separation (p > 0.05) and poor accuracy (0.52). A. A similarly poor outcome was found in cotton using a green and red VI observing that NIR was essential to detection success [69].
Successful detection of mites using multispectral data has been reported in cotton using red (660 nm) and NIR (770 nm) wavelengths [18]. In a separate study, two bands were identified as sensitive to mite damage using variable selection within late red edge to NIR (758–773 nm) and NIR (1120–1131 nm) wavelengths with both studies applying the bands to difference vegetation indices [61].
Similarly, multispectral data was successful in the detection of mites in pepper plants with comparable levels of detection accuracy to that of hyperspectral data. Interestingly in the same study, bands considered most important to the PLS model were dependent on leaf damage. Initial stages of infestation were best detected using green (540–580 nm) and red (656–676 nm) parts of the spectrum, whereas at greater levels of damage red edge (710–720 nm) and NIR (770–810 nm) were found to be more important. In contrast to this, the same authors found that multispectral data only provided moderate detection success in beans with red edge and green bands being important for low levels of damage while no distinct band importance was identified at higher levels of damage, whereas hyperspectral data was able to provide a high level of accuracy [20]. Classification success based on multispectral sensors is therefore influenced by vegetation types with spectral differences influenced by leaf structure but also biochemical pigment reaction to mite attack and feeding patterns on leaves [20,21,65].
The application of a multispectral VI threshold for classification used in our study was based on a method developed for mite detection in cotton in which a difference VI was created from bands based on variable selection of hyperspectral data (758–773 nm and 1120–1131 nm). When applied the resultant VI threshold classification outperformed SVM and random forest-based classification in cotton [61]. Although our study used common VI’s created from an off-the-shelf multispectral sensor a similar threshold creation method provided a high level of accuracy. Similar to Huang et al. [61] it is considered that this threshold classification methods ease of use compared to that of statistical analysis methods is important to enabling widespread use by ordinary farmers. The process and ease of threshold creation would allow replication of similar methods over a range of bioregions and spectral variance related to crop differences, influenced by varying biotic and abiotic factors.
From other UAV-based multispectral remote sensing studies, the use of bands located in the NIR (800 nm), red (650 nm) and green (550 nm) parts of the spectrum provided similarly high levels of detection success in cotton plants to that of ground-based multispectral sensors [37]. However, spectral changes due to leaf and canopy structure need to be considered, and so too does the sensor platform and collection method, which influence detection success [18,21]. For example, a study by Luedeling et al. [21] identified that spectral regions sensitive to mite damage differed between data gathered above canopy using an aircraft-based sensor and at canopy leaf level. Reporting that aerial data had significant wavelength regions in the blue (390 nm) and red (651 nm) parts of the spectrum compared to canopy level comprised of blue (356 nm), green (497 nm), red (687 nm), red edge (744 nm) and SWIR (1405 nm, 1888 nm and 2500 nm) light. Further, aerial NIR reflectance data of mite-damaged canopies had greater reflectance compared to that of healthy canopies, whereas at the canopy level NIR reflectance displayed an opposite trend with Luedeling et al. considering atmospheric absorption and diffuse radiation impacted spectral outputs. Such atmospheric effects have a reduced influence on lower-flying UAVs. However, it is important to consider such influences on collected data as well as other identified considerations relating to UAV data captures [70].
Hyperspectral and multispectral datasets provided detection of mite infestations on Cavendish banana plants to a high level of accuracy, and it is considered that multispectral sensors could play an important role in detection and could also provide other precision agricultural applications for banana crop management. This investigation was conducted under glasshouse conditions to allow control over environmental factors and minimize variables to provide a result removed from biotic and abiotic factors encountered in the field-grown bananas. Therefore, future investigation should consider the effects of other biotic and abiotic factors such as pests and disease, banana varietal type, crop growth stages that potentially influence the spectral response, and sensor and platform attributes that may affect mite detection.

4. Conclusions

This study demonstrated in a specific set of study conditions that proximal remote sensing methods provide a high level of accuracy for the detection of mite infestations in banana plants. The ability to detect mite infestations in the early stages is vital to ensure outbreaks can be controlled to minimize damage without the need for rudimentary scheduled blanket insecticide treatment. Exploration of various pre-processing steps, variable selection and modelling methods determined that PLSDA, KNN, SVM and BPNN provided high levels of detection accuracy and through variable selection, the number of wavelengths required could be greatly reduced while still delivering high levels of detection accuracy. Tests of a commonly available UAV multispectral sensor (Parrot Sequoia) provided a high level of detection accuracy with the classification based on a vegetation index threshold able to simplify the detection process. These results indicate that high throughput detection of mites in glasshouse environments may be possible with further refinement and testing of commonly available multispectral sensors and setting of appropriate thresholds or developed models. The addition of field testing should also be used to determine the potential application of these approaches for in-field based precision agriculture.

Author Contributions

Conceptualization, A.A., A.R., S.P., D.W.L. and K.J.; Methodology, A.A., S.P., A.R. Software, A.A, S.P., A.R.; Validation, A.A.; Formal Analysis, A.A.; Investigation, A.A.; Resources, A.A., A.R., S.P., D.W.L. and K.J.; Data Curation, A.A.; Writing—Original Draft Preparation, A.A.; Writing—Review and Editing, A.A., A.R., S.P., D.W.L. and K.J.; Visualization, A.A.; Supervision, A.A., A.R., S.P., D.W.L. and K.J.; Project Administration, S.P. and A.R.; Funding Acquisition, A.R. and S.P. All authors have read and agreed to the published version of the manuscript.

Funding

This research was funded by Horticulture Innovation and the Department of Agriculture and Water Resources, Australian Government as part of its Rural R&D for Profit Program’s subproject “Multi-Scale Monitoring Tools for Managing Australia Tree Crops—Industry Meets Innovation” (grant RnD4Profit-14-01-008).

Data Availability Statement

The data presented in this study is available on request from the corresponding author.

Acknowledgments

The authors would like to acknowledge the support from University of Queensland Glasshouse staff for project assistance. D.W.L. acknowledges the support of Food Agility CRC Ltd., funded under the Commonwealth Government CRC Program. The CRC Program supports industry-led collaborations between industry, researchers, and the community.

Conflicts of Interest

The authors declare no conflict of interest.

References

  1. Scott, G.J. A review of root, tuber and banana crops in developing countries: Past, present and future. Int. J. Food Sci. Technol. 2021, 56, 1093–1114. [Google Scholar] [CrossRef] [PubMed]
  2. FAO. Banana Facts and Figures. Available online: https://www.fao.org/economic/est/est-commodities/oilcrops/bananas/bananafacts/en/ (accessed on 10 October 2022).
  3. FAO. Banana Market Review February 2020 Snapshot. Available online: http://www.fao.org/3/ca9212en/ca9212en.pdf (accessed on 30 November 2020).
  4. Picq, C.; Fouré, E.; Frison, E.A. Bananas and Food Security; Bioversity International: Rome, Italy, 1999. [Google Scholar]
  5. FAO. Banana Market Review: Preliminary Results 2021. Available online: https://www.fao.org/3/cb9411en/cb9411en.pdf (accessed on 1 September 2022).
  6. Horticulture Innovation. Australian Horticulture Statistics Handbook; Hort Innovation: Sydney, Australia, 2020. [Google Scholar]
  7. Pinese, B.; Piper, R. Bananas: Insect & Mite Management; Queensland, Department of Primary Industries: Brisbane, Australia, 1994.
  8. Campbell, R.; Randolph, G.; Marini, R. Surface and Ultrastructural Feeding Injury to Strawberry Leaves by the Twospotted Spider Mite. HortScience 1990, 25, 948–951. [Google Scholar] [CrossRef] [Green Version]
  9. Kielkiewicz, M. Ultrastructural cell modification in tomato (Lycopersicon esculentum) leaf tissue in response to the carmine spider mite (Tetranychus cinnabarinus) feeding. In Ecology and Evolution of the Acari, Proceedings of the 3rd Symposium of the European Association of Acarologists, Amsterdam, The Netherlands, 1–5 July 1996; Bruin, J., van der Geest, L.P.S., Sabelis, M.W., Eds.; Springer: Dordrecht, The Netherlands, 1999; pp. 603–615. [Google Scholar]
  10. Agut, B.; Pastor, V.; Jaques, J.A.; Flors, V. Can Plant Defence Mechanisms Provide New Approaches for the Sustainable Control of the Two-Spotted Spider Mite Tetranychus urticae? Int. J. Mol. Sci. 2018, 19, 614. [Google Scholar] [CrossRef] [PubMed] [Green Version]
  11. Robinson, J.C.; Saúco, V.G. Bananas and Plantains; Cabi: Wallingford, UK, 2010; Volume 19.
  12. Lindsay, S.; Campagnolo, D.; Daniells, J.; Lemin, C.; Goebel, R.; Pinese, B.; Peterson, R.; Evanas, D.; Pattison, T. Tropical Banana Information Kit; Department of Primary Industries, Queensland Horticulture Institute: Brisbane, Australia, 1998.
  13. Queensland Department of Agriculture Fisheries and Forestry [QDAFF]. A-Z List of Horticultural Insect Pests. Available online: https://www.daf.qld.gov.au/business-priorities/agriculture/plants/fruit-vegetable/insect-pests (accessed on 10 May 2022).
  14. Alatawi, F.; Margolies, D.; Nechols, J. Aesthetic damage thresholds for twospotted spider mites (Acari: Tetranychidae) on impatiens: Effect of plant age and level of infestation. J. Econ. Entomol. 2007, 100, 1904–1909. [Google Scholar] [CrossRef] [PubMed]
  15. Lan, Y.; Zhang, H.; Hoffmann, W.; Lopez, J.J.D. Spectral response of spider mite infested cotton: Mite density and miticide rate study. Int. J. Agric. Biol. Eng. 2013, 6, 48–52. [Google Scholar]
  16. Hort Innovation. Australian Banana Best Practice. Available online: https://www.horticulture.com.au/globalassets/hort-innovation/resource-assets/ba13004-banana-spider-mites-pdf.pdf (accessed on 10 May 2022).
  17. Migeon, A.; Nouguier, E.; Dorkeld, F. Spider Mites Web: A comprehensive database for the Tetranychidae. In Trends in Acarology; Springer: Berlin, Germany, 2010; pp. 557–560. [Google Scholar]
  18. Martin, D.; Latheef, M. Remote Sensing Evaluation of Two-spotted Spider Mite Damage on Greenhouse Cotton. J. Vis. Exp. 2017, 122, e54314. [Google Scholar] [CrossRef] [Green Version]
  19. Fraulo, A.B.; Cohen, M.; Liburd, O.E. Visible/Near Infrared Reflectance (Vnir) Spectroscopy for Detecting Twospotted Spider Mite (Acari: Tetranychidae) Damage in Strawberries. Environ. Entomol. 2009, 38, 137–142. [Google Scholar] [CrossRef] [Green Version]
  20. Herrmann, I.; Berenstein, M.; Paz-Kagan, T.; Sade, A.; Karnieli, A. Spectral assessment of two-spotted spider mite damage levels in the leaves of greenhouse-grown pepper and bean. Biosyst. Eng. 2017, 157, 72–85. [Google Scholar] [CrossRef]
  21. Luedeling, E.; Hale, A.; Zhang, M.; Bentley, W.J.; Dharmasri, L.C. Remote sensing of spider mite damage in California peach orchards. Int. J. Appl. Earth Obs. Geoinf. 2009, 11, 244–255. [Google Scholar] [CrossRef]
  22. Uygun, T.; Ozguven, M.M.; Yanar, D. A new approach to monitor and assess the damage caused by two-spotted spider mite. Exp. Appl. Acarol. 2020, 82, 335–346. [Google Scholar] [CrossRef]
  23. Wang, J.; Shen, C.; Liu, N.; Jin, X.; Fan, X.; Dong, C.; Xu, Y. Non-Destructive Evaluation of the Leaf Nitrogen Concentration by In-Field Visible/Near-Infrared Spectroscopy in Pear Orchards. Sensors 2017, 17, 538. [Google Scholar] [CrossRef] [PubMed]
  24. Sinha, P.; Robson, A.; Schneider, D.; Kilic, T.; Mugera, H.K.; Ilukor, J.; Tindamanyire, J.M. The potential of in-situ hyperspectral remote sensing for differentiating 12 banana genotypes grown in Uganda. ISPRS J. Photogramm. Remote Sens. 2020, 167, 85–103. [Google Scholar] [CrossRef]
  25. Usha, K.; Singh, B. Potential applications of remote sensing in horticulture—A review. Sci. Hortic. 2013, 153, 71–83. [Google Scholar] [CrossRef]
  26. Weiss, M.; Jacob, F.; Duveiller, G. Remote sensing for agricultural applications: A meta-review. Remote Sens. Environ. 2020, 236, 111402. [Google Scholar] [CrossRef]
  27. Zhao, J.; Fang, Y.; Chu, G.; Yan, H.; Hu, L.; Huang, L. Identification of Leaf-Scale Wheat Powdery Mildew (Blumeria graminis f. sp. Tritici) Combining Hyperspectral Imaging and an SVM Classifier. Plants 2020, 9, 936. [Google Scholar] [CrossRef] [PubMed]
  28. Chen, S.; Hu, T.; Luo, L.; He, Q.; Zhang, S.; Li, M.; Cui, X.; Li, H. Rapid estimation of leaf nitrogen content in apple-trees based on canopy hyperspectral reflectance using multivariate methods. Infrared Phys. Technol. 2020, 111, 103542. [Google Scholar] [CrossRef]
  29. Jiang, H.; Ye, L.; Li, X.; Shi, M. Variety Identification of Chinese Walnuts Using Hyperspectral Imaging Combined with Chemometrics. Appl. Sci. 2021, 11, 9124. [Google Scholar] [CrossRef]
  30. Khan, I.H.; Liu, H.; Cheng, T.; Tian, Y.; Cao, Q.; Zhu, Y.; Cao, W.; Yao, X. Detection of wheat powdery mildew based on hyperspectral reflectance through SPA and PLS-LDA. Int. J. Precis. Agric. Aviat. 2020, 3, 13–22. [Google Scholar]
  31. Wei, L.; Guozhu, F.; Wentao, D.; Hailiang, Z.; Baishao, Z.; Liu, X. Non-destructive determination of four tea polyphenols in fresh tea using visible and near-infrared spectroscopy. Infrared Phys. Technol. 2022, 123, 104037. [Google Scholar]
  32. Bao, Y.; Mi, C.; Wu, N.; Liu, F.; He, Y. Rapid Classification of Wheat Grain Varieties Using Hyperspectral Imaging and Chemometrics. Appl. Sci. 2019, 9, 4119. [Google Scholar] [CrossRef] [Green Version]
  33. Torres-Sánchez, J.; López-Granados, F.; Serrano, N.; Arquero, O.; Peña, J.M. High-throughput 3-D monitoring of agricultural-tree plantations with unmanned aerial vehicle (UAV) technology. PLoS ONE 2015, 10, e0130479. [Google Scholar] [CrossRef] [PubMed] [Green Version]
  34. Maes, W.H.; Steppe, K. Perspectives for remote sensing with unmanned aerial vehicles in precision agriculture. Trends Plant Sci. 2019, 24, 152–164. [Google Scholar] [CrossRef] [PubMed]
  35. Wu, D.; Johansen, K.; Phinn, S.; Robson, A.; Tu, Y.-H. Inter-comparison of remote sensing platforms for height estimation of mango and avocado tree crowns. Int. J. Appl. Earth Obs. Geoinf. 2020, 89, 102091. [Google Scholar] [CrossRef]
  36. Dlamini, S.N.; Beloconi, A.; Mabaso, S.; Vounatsou, P.; Impouma, B.; Fall, I.S. Review of remotely sensed data products for disease mapping and epidemiology. Remote Sens. Appl. Soc. Environ. 2019, 14, 108–118. [Google Scholar] [CrossRef]
  37. Huang, H.; Deng, J.; Lan, Y.; Yang, A.; Deng, X.; Zhang, L.; Wen, S.; Jiang, Y.; Suo, G.; Chen, P. A two-stage classification approach for the detection of spider mite-infested cotton using UAV multispectral imagery. Remote Sens. Lett. 2018, 9, 933–941. [Google Scholar] [CrossRef]
  38. Roderick, H.; Mbiru, E.; Coyne, D.; Tripathi, L.; Atkinson, H. Quantitative Digital Imaging of Banana Growth Suppression by Plant Parasitic Nematodes. PLoS ONE 2012, 7, e53355. [Google Scholar] [CrossRef]
  39. Selvaraj, M.G.; Vergara, A.; Ruiz, H.; Safari, N.; Elayabalan, S.; Ocimati, W.; Blomme, G. AI-powered banana diseases and pest detection. Plant Methods 2019, 15, 92. [Google Scholar] [CrossRef] [Green Version]
  40. Robinson, J.C.; Sáuco, V.G. Nursery hardening of in vitro-produced banana plants. Fruits 2009, 64, 383–392. [Google Scholar] [CrossRef]
  41. Hunter, M.; Scattini, W. The ANOVApot® and Twinpot reduce root escape and save water. In Proceedings of the XXIX International Horticultural Congress on Horticulture: Sustaining Lives, Livelihoods and Landscapes (IHC2014), Brisbane, Australia, 17–22 August 2014; Volume 1112, pp. 23–30. [Google Scholar]
  42. Poorter, H.; Fiorani, F.; Stitt, M.; Schurr, U.; Finck, A.; Gibon, Y.; Usadel, B.; Munns, R.; Atkin, O.K.; Tardieu, F.; et al. The art of growing plants for experimental purposes: A practical guide for the plant biologist. Funct. Plant Biol. 2012, 39, 821–838. [Google Scholar] [CrossRef] [Green Version]
  43. Hatchell, D.C. ASD Technical Guide; Analytical Spectral Devices, Inc.: Boulder, CO, USA, 1999; Volume 5335. [Google Scholar]
  44. ASD Inc. FieldSpec 4™ User Manual; ASD Inc.: Boulder, CO, USA, 2008. [Google Scholar]
  45. Hennessy, A.; Clarke, K.; Lewis, M. Hyperspectral Classification of Plants: A Review of Waveband Selection Generalisability. Remote Sens. 2020, 12, 113. [Google Scholar] [CrossRef] [Green Version]
  46. Rinnan, Å; Berg, F.V.D.; Engelsen, S.B. Review of the most common pre-processing techniques for near-infrared spectra. TrAC Trends Anal. Chem. 2009, 28, 1201–1222. [Google Scholar] [CrossRef]
  47. Ballabio, D.; Consonni, V. Classification tools in chemistry. Part 1: Linear models. PLS-DA. Anal. Methods 2013, 5, 3790–3798. [Google Scholar] [CrossRef]
  48. Li, H.-D.; Xu, Q.-S.; Liang, Y.-Z. libPLS: An integrated library for partial least squares regression and linear discriminant analysis. Chemom. Intell. Lab. Syst. 2018, 176, 34–43. [Google Scholar] [CrossRef]
  49. Kennard, R.W.; Stone, L.A. Computer aided design of experiments. Technometrics 1969, 11, 137–148. [Google Scholar] [CrossRef]
  50. Pérez-Roncal, C.; López-Maestresalas, A.; Lopez-Molina, C.; Jarén, C.; Urrestarazu, J.; Santesteban, L.G.; Arazuri, S. Hyperspectral imaging to assess the presence of powdery mildew (Erysiphe necator) in cv. Carignan Noir grapevine bunches. Agronomy 2020, 10, 88. [Google Scholar] [CrossRef] [Green Version]
  51. Barker, M.; Rayens, W. Partial least squares for discrimination. J. Chemom. A J. Chemom. Soc. 2003, 17, 166–173. [Google Scholar] [CrossRef]
  52. Lee, L.C.; Liong, C.-Y.; Jemain, A.A. Partial least squares-discriminant analysis (PLS-DA) for classification of high-dimensional (HD) data: A review of contemporary practice strategies and knowledge gaps. Analyst 2018, 143, 3526–3539. [Google Scholar] [CrossRef]
  53. Taunk, K.; De, S.; Verma, S.; Swetapadma, A. A brief review of nearest neighbor algorithm for learning and classification. In Proceedings of the 2019 International Conference on Intelligent Computing and Control Systems (ICCS), Madurai, India, 15–17 May 2019; pp. 1255–1260. [Google Scholar]
  54. Cortes, C.; Vapnik, V. Support-vector networks. Mach. Learn. 1995, 20, 273–297. [Google Scholar] [CrossRef]
  55. Rumelhart, D.E.; Hinton, G.E.; Williams, R.J. Learning representations by back-propagating errors. Nature 1986, 323, 533–536. [Google Scholar] [CrossRef]
  56. Wythoff, B.J. Backpropagation neural networks: A tutorial. Chemom. Intell. Lab. Syst. 1993, 18, 115–155. [Google Scholar] [CrossRef]
  57. Li, H.; Liang, Y.; Xu, Q.; Cao, D. Key wavelengths screening using competitive adaptive reweighted sampling method for multivariate calibration. Anal. Chim. Acta 2009, 648, 77–84. [Google Scholar] [CrossRef] [PubMed]
  58. Li, H.-D.; Xu, Q.-S.; Liang, Y.-Z. Random frog: An efficient reversible jump Markov Chain Monte Carlo-like approach for variable selection with applications to gene selection and disease classification. Anal. Chim. Acta 2012, 740, 20–26. [Google Scholar] [CrossRef]
  59. Mehmood, T.; Sæbø, S.; Liland, K.H. Comparison of variable selection methods in partial least squares regression. J. Chemom. 2020, 34, e3226. [Google Scholar] [CrossRef]
  60. Tucker, C.J. Red and photographic infrared linear combinations for monitoring vegetation. Remote Sens. Environ. 1979, 8, 127–150. [Google Scholar] [CrossRef] [Green Version]
  61. Huang, H.; Deng, J.; Lan, Y.; Yang, A.; Jiang, Y.; Suo, G.; Chen, P. Automatic difference vegetation index generator for spider mite-infested cotton detection using hyperspectral reflectance. Int. J. Precis. Agric. Aviat. 2020, 3, 83–88. [Google Scholar] [CrossRef]
  62. Knipling, E.B. Physical and physiological basis for the reflectance of visible and near-infrared radiation from vegetation. Remote Sens. Environ. 1970, 1, 155–159. [Google Scholar] [CrossRef]
  63. Karabourniotis, G.; Liakopoulos, G.; Bresta, P.; Nikolopoulos, D. The Optical Properties of Leaf Structural Elements and Their Contribution to Photosynthetic Performance and Photoprotection. Plants 2021, 10, 1455. [Google Scholar] [CrossRef]
  64. Adar, E.; Inbar, M.; Gal, S.; Issman, L.; Palevsky, E. Plant cell piercing by a predatory mite: Evidence and implications. Exp. Appl. Acarol. 2015, 65, 181–193. [Google Scholar] [CrossRef]
  65. Fürstenberg-Hägg, J.; Zagrobelny, M.; Bak, S. Plant Defense against Insect Herbivores. Int. J. Mol. Sci. 2013, 14, 10242–10297. [Google Scholar] [CrossRef] [Green Version]
  66. Huang, J.; Wei, C.; Zhang, Y.; Blackburn, G.A.; Wang, X.; Wei, C.; Wang, J. Meta-analysis of the detection of plant pigment concentrations using hyperspectral remotely sensed data. PLoS ONE 2015, 10, e0137029. [Google Scholar] [CrossRef] [Green Version]
  67. Gausman, H.; Allen, W. Optical parameters of leaves of 30 plant species. Plant Physiol. 1973, 52, 57–62. [Google Scholar] [CrossRef] [PubMed]
  68. Li, P.; Ma, J.; Zhong, N. Fourier transform near-infrared spectroscopy coupled with variable selection methods for fast determination of salmon fillets storage time. J. Mol. Struct. 2022, 1264, 133223. [Google Scholar] [CrossRef]
  69. Reisig, D.; Godfrey, L. Spectral response of cotton aphid–(Homoptera: Aphididae) and spider mite–(Acari: Tetranychidae) infested cotton: Controlled studies. Environ. Entomol. 2014, 36, 1466–1474. [Google Scholar] [CrossRef]
  70. Tu, Y.-H.; Phinn, S.; Johansen, K.; Robson, A. Assessing Radiometric Correction Approaches for Multi-Spectral UAS Imagery for Horticultural Applications. Remote Sens. 2018, 10, 1684. [Google Scholar] [CrossRef]
Figure 1. Example of mite infestation and damage to banana plant leaf (a) and a healthy banana plant leaf (b) red insets provide indicative areas of interest for each treatment.
Remotesensing 14 05467 g001
Figure 2. Location of the four hyperspectral leaf clip measurements taken along each leaf (a), using an ASD Fieldspec 4 spectrometer fitted with leaf clip accessory to make in situ spectral measurements of banana leaves (b).
Remotesensing 14 05467 g002
Figure 3. Flowchart of key steps for testing spectral discrimination modelling approaches and variable selection methods (wavelength reduction) for the detection of mite infestations on banana plants.
Remotesensing 14 05467 g003
Figure 4. Averaged reflectance spectra for healthy banana plants and mite-infested banana plants gathered from mite outbreaks at the University of Queensland glasshouses on 1 November 2017, 17 December 2017 and 9 January 2018. Solid lines indicate the average and dash lines indicate ± standard deviation.
Remotesensing 14 05467 g004
Figure 5. Competitive adaptive reweighted sampling (CARS) variable selection with top panel (a) indicating the number of Monte Carlo (MC) samples and rate of selection. The middle panel (b) indicates cross-validated error based on progression of the selection process, while the bottom panel (c) indicates trends in regression coefficients of individual wavelengths over the course of the sampling runs with each wavelength represented by a coloured line and the asterisk line indicating the subset with the lowest root mean square error (RMSE) of cross-validation identified after 133 sampling runs. (d) Sub-window permutation analysis (SPA) variable selection chart of conditional synergetic score (COSS) values with the most important wavelengths having higher scores. (e) Random frog (RF) selection probability with higher scores indicating the most important wavelengths.
Remotesensing 14 05467 g005
Table 1. Parrot Sequoia multispectral camera attributes.
BandCentre (nm)FWHM (nm)
Green55040
Red66040
Red edge73510
Near-infrared79040
Table 2. Accuracy performance of classification models based on full spectra.
Modelling Method Accuracy
Calibration SetValidation SetPrediction Set
PLSDANone0.890.820.90
SG + SNV0.920.840.91
KNNNone0.770.770.86
SG + SNV0.760.770.81
SVMNone0.990.830.82
SG + SNV1.000.880.86
BPNNNone1.000.880.79
SG + SNV1.000.890.85
PLSDA: partial least squares discriminant analysis; KNN: K-nearest neighbour; BPNN: back propagation neural network; SG: Savitzky-Golay derivative; SNV: Standard Normal Variate. Model calibration and validation sets are based on 80% of samples. Model calibration based on the full dataset with validation accuracy results based on Venetian blinds 10-fold cross-validation of dataset. The remaining 20% of plant spectral average samples were used as a prediction set for model verification.
Table 3. Variable selection by competitive adaptive reweighted sampling (CARS), sub-window permutation analysis (SPA) and random frog (RF) of the most suitable wavelengths for the classification of mite infestation on banana plants. Wavelength selection ranked in order of importance for SPA and RF.
Variable Selection MethodWavelength (nm)
CARS466, 532, 662, 695, 820, 982, 983, 993, 1088, 1176, 1193, 1194, 2034, 2035, 2036, 2037, 2128, 2129, 2130, 2316
SPA822, 695, 1232, 1204, 701, 1185, 839, 733, 1176, 697, 719, 837, 702, 693, 747, 827, 2033, 870, 1249, 760
RF466, 983, 2129, 2034, 465, 2128, 2130, 2127, 2031, 824, 2042, 2126, 2123, 979, 2039, 2035, 2137, 2033, 1176, 2038
Underlined values indicate commonly shared wavelengths for all variable selection methods; red values indicate shared wavelengths for CARS and SPA; blue values indicate shared wavelengths for CARS and RF; green values indicate shared wavelengths for SPA and RF.
Table 4. Accuracy performance based on a combination of classification models and variable selection methods.
Modelling MethodAccuracy
Calibration SetValidation SetPrediction Set
CARS + PLSDA0.870.860.82
CARS + KNN0.830.860.86
CARS + SVM0.840.840.86
CARS + BPNN0.990.870.86
SPA + PLSDA0.830.790.82
SPA + KNN0.810.790.82
SPA + SVM0.840.790.86
SPA + BPNN1.000.700.73
RF + PLSDA0.800.720.68
RF + KNN0.720.680.60
RF + SVM0.700.670.68
RF + BPNN1.000.720.71
CARS: competitive adaptive reweighted sampling; SPA: sub-window permutation analysis; RF: random frog (RF). Model calibration set accuracy based on 80% of samples. Validation set accuracy based on Venetian blinds 10-fold cross-validation testing of calibration dataset. The remaining 20% of the plant spectral average dataset was used as a prediction set for model verification.
Table 5. Significant results obtained based on a t-test to determine separation between mite-infested and healthy banana plants using vegetation indices and accuracy performance based on threshold classification using vegetation indices.
Vegetation IndexSignificance (p-Value)Accuracy
NDVI<0.010.79
GNDVI<0.010.82
REGNDVI<0.010.80
NRENDVI<0.010.79
GRVI>0.050.52
NDVI: normalised difference vegetation index; GNDVI: green NDVI; REGNDVI: red edge NDVI; NRENDVI: NIR red edge NDVI; GRVI: green-red vegetation index.
Publisher’s Note: MDPI stays neutral with regard to jurisdictional claims in published maps and institutional affiliations.

