Abstract
High-resolution remote sensing (HRRS) images have few spectra, low interclass separability and large intraclass differences, and there are some problems in land cover classification (LCC) of HRRS images that only rely on spectral information, such as misclassification of small objects and unclear boundaries. Here, we propose a deep learning fusion network that effectively utilizes NDVI, called the Dense-Spectral-Location-NDVI network (DSLN). In DSLN, we first extract spatial location information from NDVI data at the same time as remote sensing image data to enhance the boundary information. Then, the spectral features are put into the encoding-decoding structure to abstract the depth features and restore the spatial information. The NDVI fusion module is used to fuse the NDVI information and depth features to improve the separability of land cover information. Experiments on the GF-1 dataset show that the mean OA (mOA) and the mean value of the Kappa coefficient (mKappa) of the DSLN network model reach 0.8069 and 0.7161, respectively, which have good applicability to temporal and spatial distribution. The comparison of the forest area released by Xuancheng Forestry Bureau and the forest area in Xuancheng produced by the DSLN model shows that the former is consistent with the latter. In conclusion, the DSLN network model is effectively applied in practice and can provide more accurate land cover data for regional ESV analysis.
1. Introduction
Ecological service value (ESV) assessment is an important basis of decision-making for ecological environmental protection [1]. Land cover is a crucial factor in the global ecological environment and has an important impact on ESV [2,3]. LUCC can cause changes in ecosystem structure and function, which can further lead to changes in ESV [4]. It is of great significance to the change in ESV to optimize the land cover classification (LCC) method to obtain more accurate LUCC data. High-resolution remote sensing (HRRS) images can obtain more detailed land cover information, and LCC methods based on HRRS images have been widely studied by many scholars [5,6]. However, the more detailed shape and structure information of ground objects provided by HRRS images also have the characteristics of high intraclass variability and low interclass separability, which brings new challenges to optimizing LCC methods [7,8]. The high intraclass variability means that in LCC, different spatial and temporal distributions of the same type and different imaging conditions will cause the same type of object to show different characteristics during imaging. This can lead to a large variance in the features presented within the class. Low interclass separability means that in LCC, different types of images have different distribution shapes and features, but some types of objects have similar characteristics, which increases the difficulty of classification. For example, there are some similarities in the characteristics between shrub and forest, and between residential land and industrial land.
According to different feature acquisition methods, LCC methods can be divided into artificial feature-based methods, machine learning methods and deep learning methods. Among machine learning methods, the random forest method is one of the more popular methods of LCC [9,10]. Manual feature-based methods can be further divided into pixel-based classification methods and object-oriented methods according to different processing units [11,12,13]. The pixel-based classification methods mainly use the image texture and spectral information of the pixel for classification, but the rich spatial and geometric features in the image are often not considered, which causes “fragmented” classification results, especially in urban areas with strong heterogeneity [14,15,16]. The object-oriented classification method, which considers the spectral characteristics and the spatial shape and texture characteristics of the image, can effectively improve the shortcomings of low pixel-based classification accuracy [17]. Object-oriented classification methods are mainly used in HRRS images and have strong advantages in land cover information extraction [18]. However, object-oriented classification methods lack a unified standard for optimal threshold setting [19]. Choosing different segmentation thresholds may adversely affect the classification results of images [20], and there are also problems, such as a lack of contextual semantic information [21,22].
Deep learning methods have the advantages of high efficiency and strong plasticity [23,24,25]. They can not only extract spectral and spectral–spatial features but also automatically learn contextual semantic information that is critical to the accuracy of HRRS image interpretation. In fully convolutional neural networks (FCNs), LCC can be performed on remote sensing images without additional manual intervention, which has efficiency advantages and has been widely used in LCC [26]. To further improve LCC accuracy of the FCN network, in view of the problem of spatial information loss in the FCN network, SegNet [27] adopts a structure that preserves spatial information instead of the down-sampling process, and DeepLab [28] uses dilated convolution to obtain more detailed spatial information and improve the accuracy of classification. Yao et al. [29] introduced coordinate convolution into a deep convolutional neural network structure to improve the boundary extraction accuracy of HRRS images and verified that coordinate convolution has a positive effect on the improvement of LCC accuracy. Wambugu et al. [30] expanded the receptive field, strengthened the extraction of contextual information, reduced the loss of feature information, and improved the overall classification accuracy. Shan and Wang [31] proposed a deep fusion network based on DenseNet for LCC, which uses two fusion units to fuse the contextual semantic information to improve the segmentation effect of complex and tortuous boundary regions. Zuo et al. [32] proposed DCNs to alleviate the limitation of geometric transformation, enhance local perception, effectively improving the classification accuracy, and reducing the loss of boundary information. In addition, they postulated that for the practical application of regional LCC, attention should be given not only to the accuracy of the method but also to the computational complexity and operating efficiency required by the model. To further improve efficiency, more computationally efficient LCC methods have been proposed, such as RS-DCNN [33] and SRGDN [34]. MONet [35] utilizes a small amount of training data to trade off weak semantics and strong feature representations at different adjacent scales and introduces GEOBIA as an auxiliary module to reduce the computational load during prediction and thereby optimize the classification boundary. The COCNN [36] method reasonably and effectively refers to multi-scale segmentation algorithms, object-oriented and deep learning methods, effectively solving the problem of inaccurate classification of typical features; and the classification accuracy is better than simply using CNN. The OODLB [37] is an image classification method based on the combination of object-oriented and deep learning, which improves the geometric boundary problem from the lack of fine-grained feature types which is commonly encountered in deep learning, and provides a good method for LCC of large scenes. In terms of the applicability of the model in temporal and spatial distribution, Zhang et al. [38] used the improved U-Net network to complete their research on LCC of multi-source data and achieved an improvement of classification accuracy. The LCC in the study is not detailed enough. Tong et al. [39] not only created a large-scale and large-coverage detailed land cover classification dataset based on GF-2 images, but also proposed a transferable deep learning method for unlabeled high-resolution multi-source remote sensing images. The effective classification of land cover was achieved, but the application of the method to multi-temporal HRRS images of land cover needed to be further studied [39]. In general, although many deep learning methods for LCC based on HRRS images have a good performance in classification accuracy, the HRRS images have few spectra, low interclass separability and intraclass differences. Therefore, there are still problems in LCC, such as misclassification of small objects, unclear boundaries, and limited applicability of network models in temporal and spatial distribution.
The NDVI is often applied in remote sensing image classification in order to reflect the growth and distribution of vegetation [40,41,42]. The biophysical properties of NDVI are inextricably linked to land cover types, which can enhance the characteristic differences between land cover types, thereby improving the effect of LCC [43,44,45]. In some studies, time series NDVI information has been combined with machine learning methods for LCC to achieve a good performance [46,47,48]. There are also studies [49] that use the NDVI feature information as an additional feature, in addition to the image band feature information, to create a dataset, and using the Two-Branch FCN-8S network to train the model, they have achieved good results in the fine classification of forest types in high spatial resolution remote sensing images. Therefore, to enhance the interclass differences in land cover, the current problems, and the accuracy of LCC should be improved. We propose a deep learning fusion network that effectively utilizes NDVI, called the Dense-Spectral-Location-NDVI network (DSLN). In DSLN, we first extract spatial location information from the NDVI data at the same time as the remote sensing image data to enhance the boundary information. Then, the spectral features are put into the encoding-decoding structure to abstract the depth features and restore the spatial information. The NDVI fusion module is used to fuse the NDVI information and depth features to improve the separability of the land cover information. In this paper, we not only discuss the impact of different NDVI fusion and utilization methods on LCC differences but also verify the applicability of the DSLN model in terms of the temporal and spatial distribution. At the same time, based on the DSLN network model, we have obtained Southern Anhui Mountains and Hills Ecological Region (SAHMHER) land cover data from 2015 and 2020 and have performed ESV change analysis of SAHMHER.
The main contributions of this paper are as follows: (1) We realize the production of a large-area GF-1 image dataset. The dataset covers more than 10,000 km2 and reflects the real distribution of ground objects. Compared with other datasets, it has the characteristics of wider spatial coverage and rich diversity, which can provide data to support regional land cover research. (2) We propose a deep learning fusion network that effectively utilizes NDVI. The network realizes the fusion of NDVI information and deep features, and improves the effectiveness of LCC. (3) This article proposes a network that can be applied to LCC in practice. The DSLN model has good applicability in spatial and temporal distribution and achieves consistency with the officially published results from specific regional research.
2. Data and Preprocessing
The Gaofen-1 satellite is equipped with two 2 m resolution panchromatic/8 m resolution multispectral cameras and four 16 m resolution multispectral cameras. This breaks through the optical remote sensing technology by combining high spatial resolution, multi-spectral and high temporal resolution, multi-load image stitching and fusion technology, and high-precision and high-stability attitude control technology. The combination of high resolution and large width is achieved on a single satellite at the same time, and the 2 m high resolution achieves an imaging width greater than 60 km. Therefore, the GF-1 satellite can provide clearer image coverage of ground objects.
The GF-1 satellite image can provide better applications in many fields, such as geographic national conditions surveys, ecological environment monitoring, and disaster monitoring and analysis. In this paper, the fifteen GF-1 images were used to cover the 15 km spatial range along the Yangtze River (Anhui section), and they were used as the dataset for model training. In addition, we also selected two GF-1 images from Guizhou and Zhejiang and two GF-2 images from Henan and Tianjin. The image information is shown in Table 1.

Table 1.
Related information on reference data.
First, the image is preprocessed by atmospheric correction, geometric correction, panchromatic and multispectral fusion to obtain a true color image with a resolution of 2 m. The NDVI was extracted from the image using the band information. NIR and Red bands were used for band calculation to obtain an NDVI information image. According to the different characteristics of various ground object types on the image, the land cover types were classified into forest, shrub, meadow, wetland, farmland, residential land, road, industrial land, special land, and other land. Forest mainly includes broad-leaved forest, coniferous forest, mixed coniferous and broad-leaved forest, sparse forest. Shrub mainly includes broad-leaved shrubs, coniferous shrubs, and sparse shrubs. Grassland mainly includes meadows, grasslands, grasses, and sparse grasslands. Wetland mainly includes swamps, lakes, and rivers. Farmland mainly includes cultivated land and garden land. Residential land mainly includes rural residential buildings, urban residential buildings, shopping malls, schools, libraries and other places for residents’ leisure, and entertainment. Industrial land mainly includes industrial facilities, construction sites and other industrial factories, and mining sites. Special land mainly refers to the land with special purpose such as military facilities, cemeteries, religious areas, prisons, etc. Other land mainly includes permanent glacial snow, desert, and sparsely vegetated land. We visually interpreted the fifteen GF-1 images from 2015 and 2020 to create the training model and obtain the visual interpretation results corresponding to the remote sensing images.
The fifteen images in this article cover an area of more than 12,000 km2. The dataset consists of images, NDVI and visual interpretation results and is divided into two parts: training images and test images. Due to the different image sizes, all images are segmented into small patches of size 512 × 512 based on the limited memory of the GPU and the large number of training samples obtained. Therefore, we can obtain 24,556 images for training the network. The training dataset and validation dataset are divided in a 4:1 ratio. However, for testing, we selected another 10 images that were not part of the training images and six test images of size 1025 × 1025 and four 3073 × 3073 images to evaluate the extraction effect.
3. Methodology
3.1. Structure of the DSLN
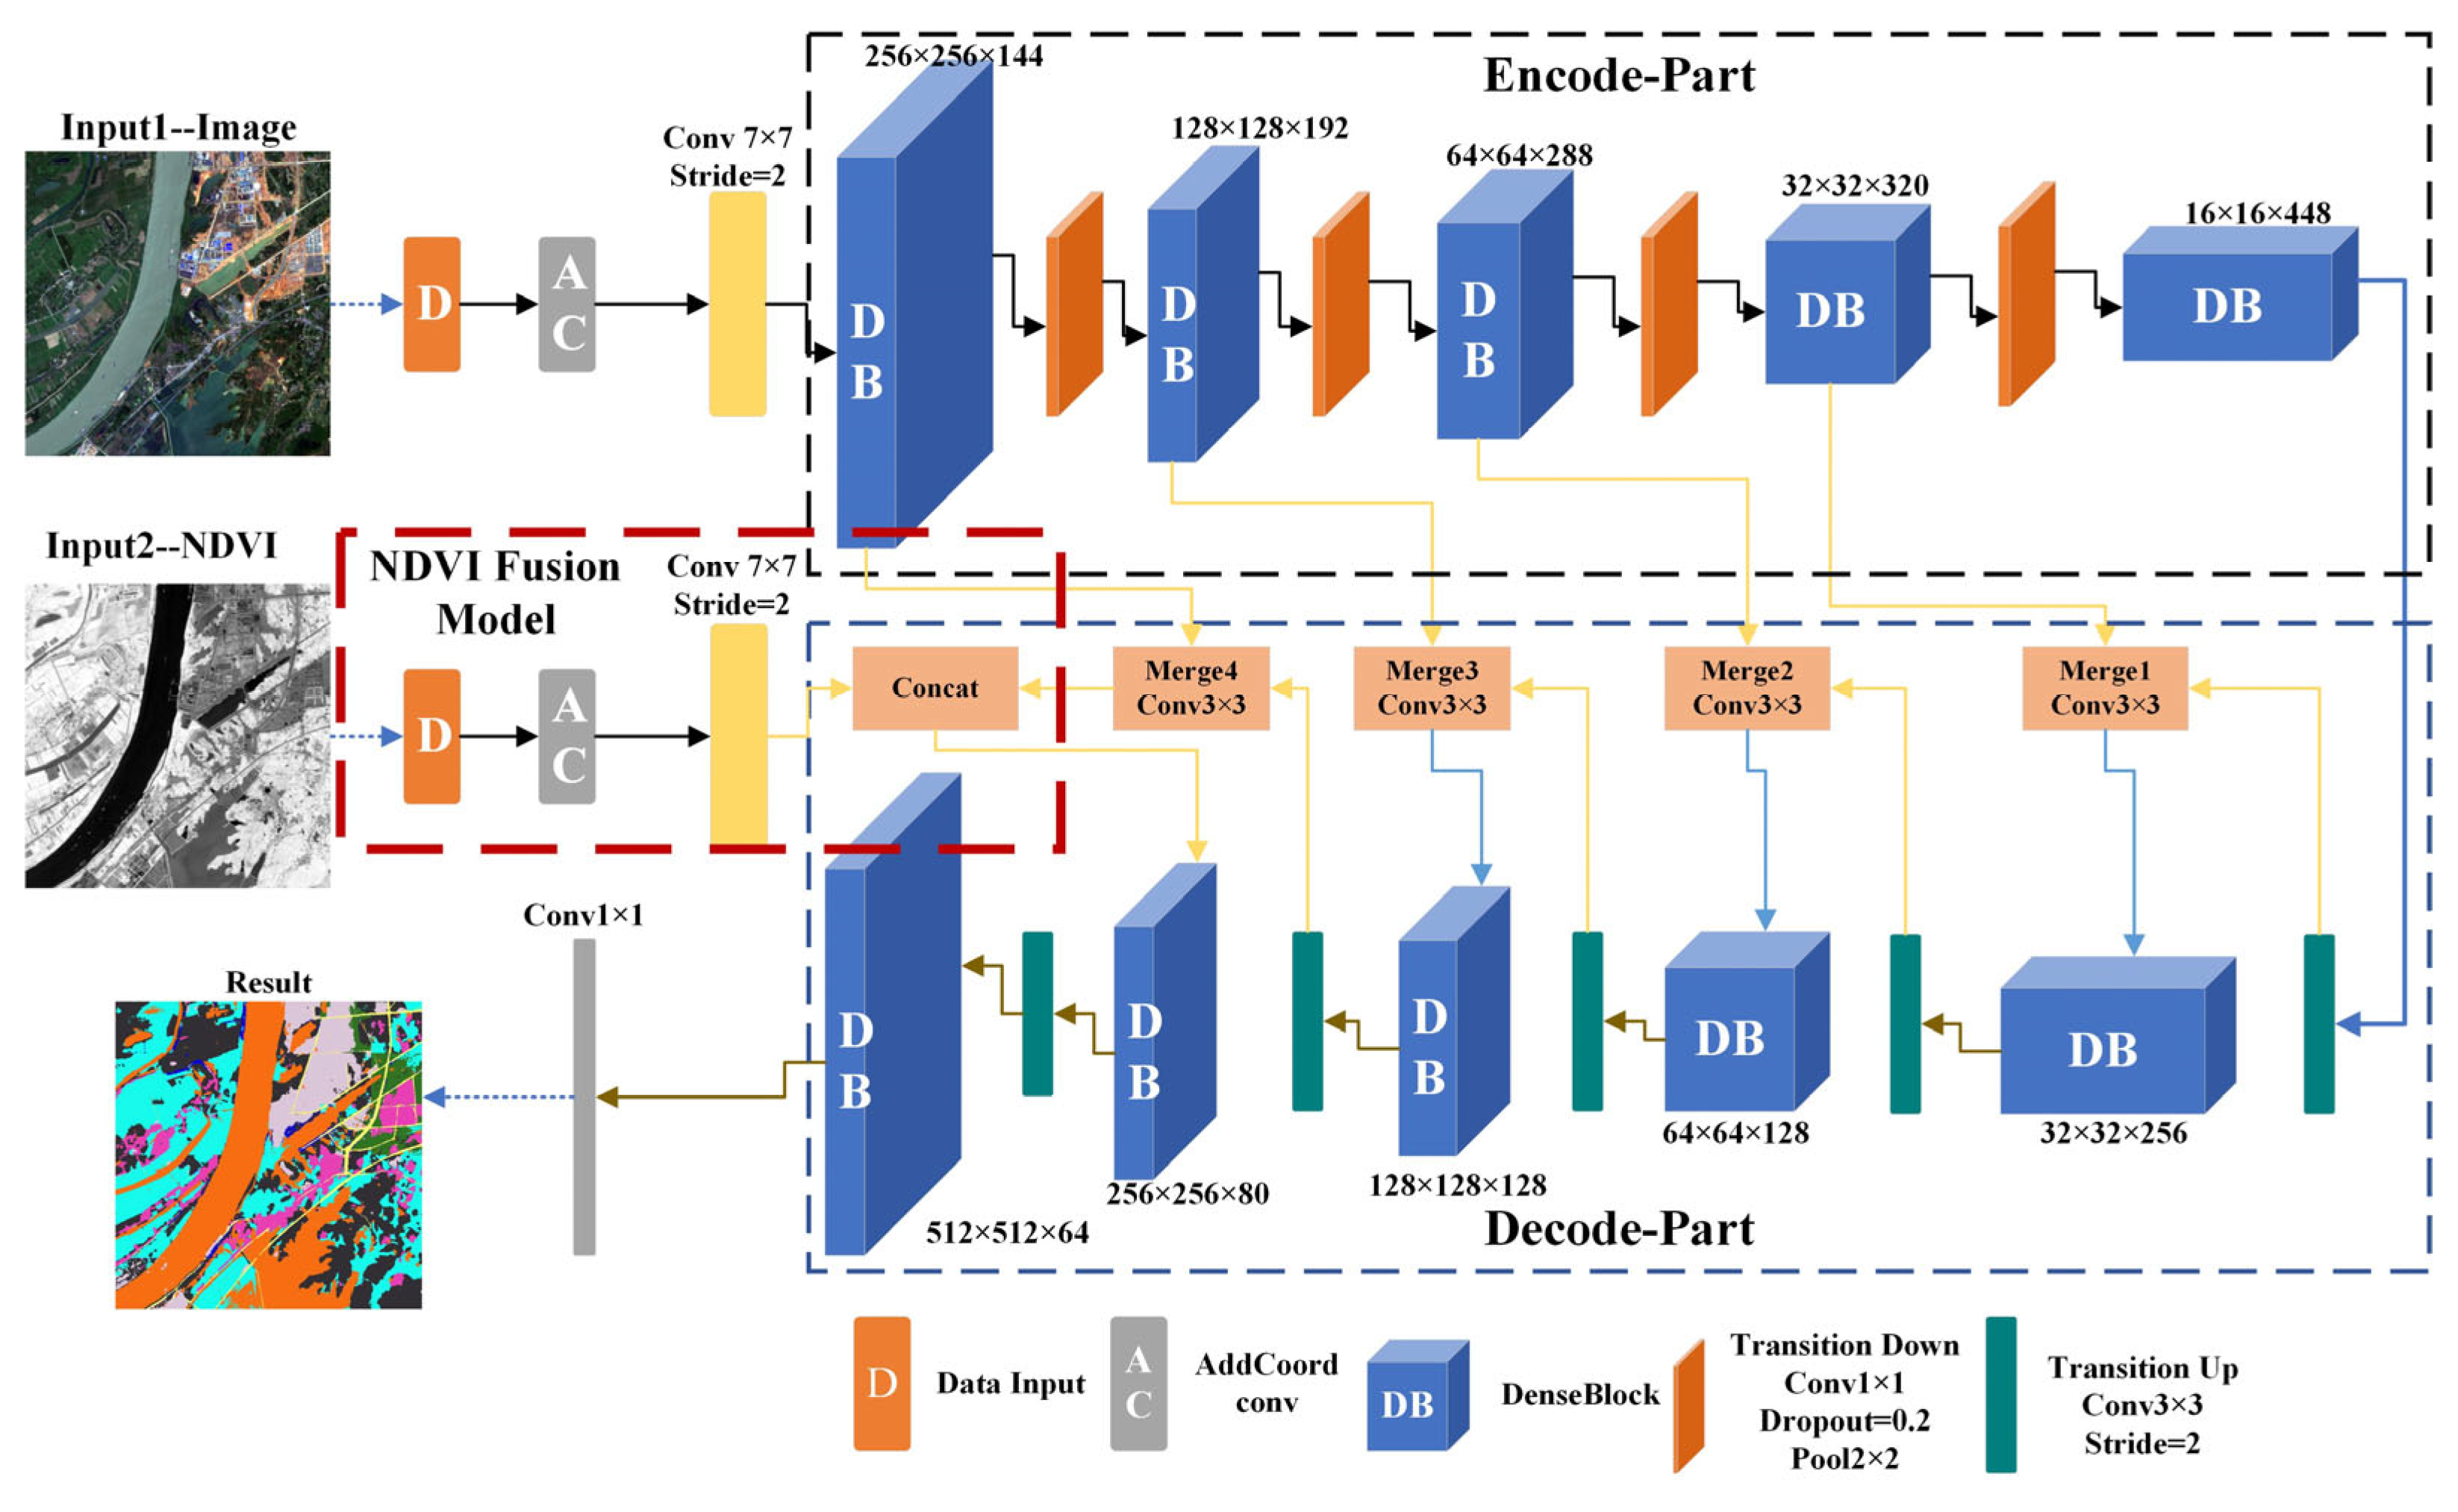
The networks that adopt an encoding-decoding structure [29], perform better in LCC, so DSLN also adopts an encoding-decoding structure. The DSLN structure is shown in Figure 1. Our proposed DSLN contains two data inputs. At the top layer of the network, the input space location information and boundary information are obtained. We introduce coordinate convolution, which can highlight spatial detail information, reduce feature loss, and strengthen boundary information. The encoding structure contains five DenseBlocks, four transition down layers, and one group normalization [50] (GN) layer for high-level information extraction. The decoding structure contains five DenseBlock layers to extract features and five transition up layers to restore features, one concat layer and four merge layers to combine high-level and low-level information in order to achieve effective use of features, reduce the number of parameters, make network training easier, and effectively improve network performance. The NDVI fusion module does not directly fuse the NDVI feature information. It includes one convolution layer and one concat layer, mainly to obtain more effective NDVI information, and in the ninth DenseBlock, the convolutional NDVI and extracted the spectrum feature information, spectrum–spatial feature information fusion. We utilized the fifth transition up layer and transmitted it to the last DenseBlock. The classification map is output after the 1 × 1 convolutional layer at the end of the network.
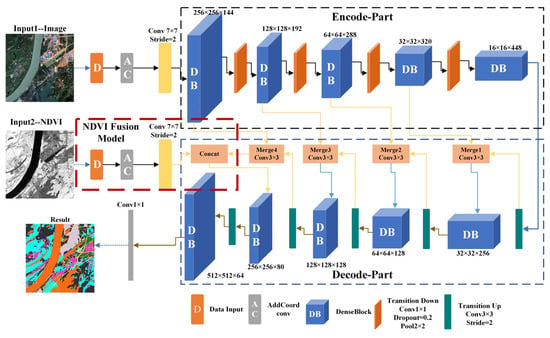
Figure 1.
Architecture of DSLN.
3.2. NDVI Fusion Module
In fact, when the deep learning network learns the feature information between near-infrared and infrared bands hidden in remote sensing images, many accurate samples are required. However, it is difficult to obtain many accurate samples in practice. In our proposed DSLN, we did not take advantage of the direct fusion of NDVI because the spectral reflectance of remote sensing images is inconsistent with the NDVI dimension. The NDVI value ranges from −1 to 1, and the spectral reflectance value of the image is much higher than the value range of NDVI. If direct splicing and fusion are used, the NDVI value will be too small, and the NDVI features will be directly ignored when training the model, resulting in the phenomenon of invalid fusion. As shown in Figure 2, the NDVI fusion module integrates the NDVI information with the extracted spectral, spectral space and context semantic information mainly through convolution processing. The two complement each other’s advantages and achieve better LCC results. Considering that the NDVI fusion module is placed at the front end to extract feature information, it will result in a large loss of information, weaken the model effect, and require a large amount of computation. We set the NDVI fusion module in the ninth DenseBlock layer of the decoding layer. The NDVI fusion module preliminarily extracts the space and feature information existing in NDVI data by using coordinate convolution and a 7 × 7 convolution and then enters the concat layer and the transition down process in the network encoding structure and the obtained spectral feature information fusion. We input the feature information obtained by the NDVI fusion module into the 9th DenseBlock for convolution to obtain more effective NDVI feature information. Based on the NDVI fusion module, we realized that NDVI feature information plays an active auxiliary role in the improvement of the existing problems of LCC and an improvement in the overall accuracy.

Figure 2.
Structure of NDVI fusion module.
3.3. Implementation Details of the DSLN
Our proposed DSLN contains two data inputs, reading image and NDVI data. The detailed structure of the network is shown in Figure 1. Before applying the first DenseBlocks, we added X and Y channels to the input data via coordinate convolution. We design a 7 × 7 convolutional layer with stride 2 to extract features from remote sensing images and NDVI initial input. At each transition down layer, we set a convolutional layer of size 1 × 1 and a dropout layer with dropout = 0.2, followed by an average pooling layer of size 2 × 2. Each merge layer contains a convolutional layer of size 3 × 3. Each transition-up layer contains a convolutional layer of size 3 × 3 with stride 2. DenseBlock is the basic module of DenseNet [51], mainly for multi-category feature extraction. DenseBlock generally uses batch normalization [52] (BN), but the reliability of the batch normalization calculation is too correlated with batch_size, and there are strict requirements for batch_size. Due to factors such as different classification requirements, various input image dimensions, and computer memory limitations, batch_size is generally set to a small value, which will lead to a rapid increase in the normalization error rate, which in turn will weaken the model performance. The GN has a wide range of applicability and has more stable accuracy in the case of different batch_size settings; simultaneously, it plays a positive role in the improvement of network training speed and generalization. Therefore, BN is replaced by GN to form an improved DenseBlock.
3.4. Experimental Implementation Details
To better meet the needs of network training, we set the following settings: batch_size set to 4, 80 epochs, and 4912 training batches per epoch. Meanwhile, the initial learning rate was set to 0.001. To better train the model, the initial learning rate was automatically adjusted as the training epoch increases. When the epoch reached 20, 35, 50, 60, the learning rate was reduced by a factor of 10. In addition, the DSLN used the cross-entropy function as the loss function. At the same time, we used the Adam optimizer to speed up the network convergence. The software and hardware configurations for network model training are shown in Table 2.

Table 2.
The Hardware and Software Configurations.
3.5. Comparison Method and Evaluation Metrics
To evaluate the effect of different deep learning methods on the multi-classification of GF-1 images, we chose four deep learning networks to compare with the DSLN network, namely, DeepLabV3+ [53], SegNet [27], U-Net [54], and DCCN [29]. In this way, the effect of different deep learning methods on multi-classification of GF-1 images could be evaluated. DeepLabV3+, U-Net, and SegNet are widely used in LCC from optical images and have good performance in different research directions. Among them, U-Net, DCCN, and DSLN are similar in overall network structure. SegNet is a deep network proposed by Cambridge to solve image semantic segmentation of autonomous driving and intelligent robots. We use the best models trained using the above five networks to identify and evaluate the accuracy of six 1025 × 1025 and four 3073 × 3073 images. At the same time, to ensure the rationality of the comparison of different deep learning networks, all deep learning networks were set the same learning rate and batch size when training the models.
To evaluate the DSLN, based on the same dataset, we use the Kappa coefficient (Kappa), overall accuracy (OA), producer’s accuracy (PA), and user’s accuracy (UA) for evaluation. Accuracy evaluation of all classified pixels except the background in the classification result on the image. Pii is the correct number of pixels predicted for each class; N is the total number of pixels; Nit is the total number of pixels that predict all classes as class i; Nip is the total number of pixels that predict class i as all classes; and n is the number of classes.
Kappa is used to verify the consistency between the predicted LCC and the ground truth. OA is the accuracy of the correct classification. PA is the ratio of the number of correctly classified pixels in the i-th class to the total number of pixels classified into the j class, (i, j∈n, including i = j). UA is the ratio of the number of pixels that are correctly classified in the i-th category to the total number of pixels divided into category i. The value range of the above four indicators is 0–1, and the larger the value is, the better the classification effect.
4. Results and Analysis
4.1. Comparison of Results with Other Models
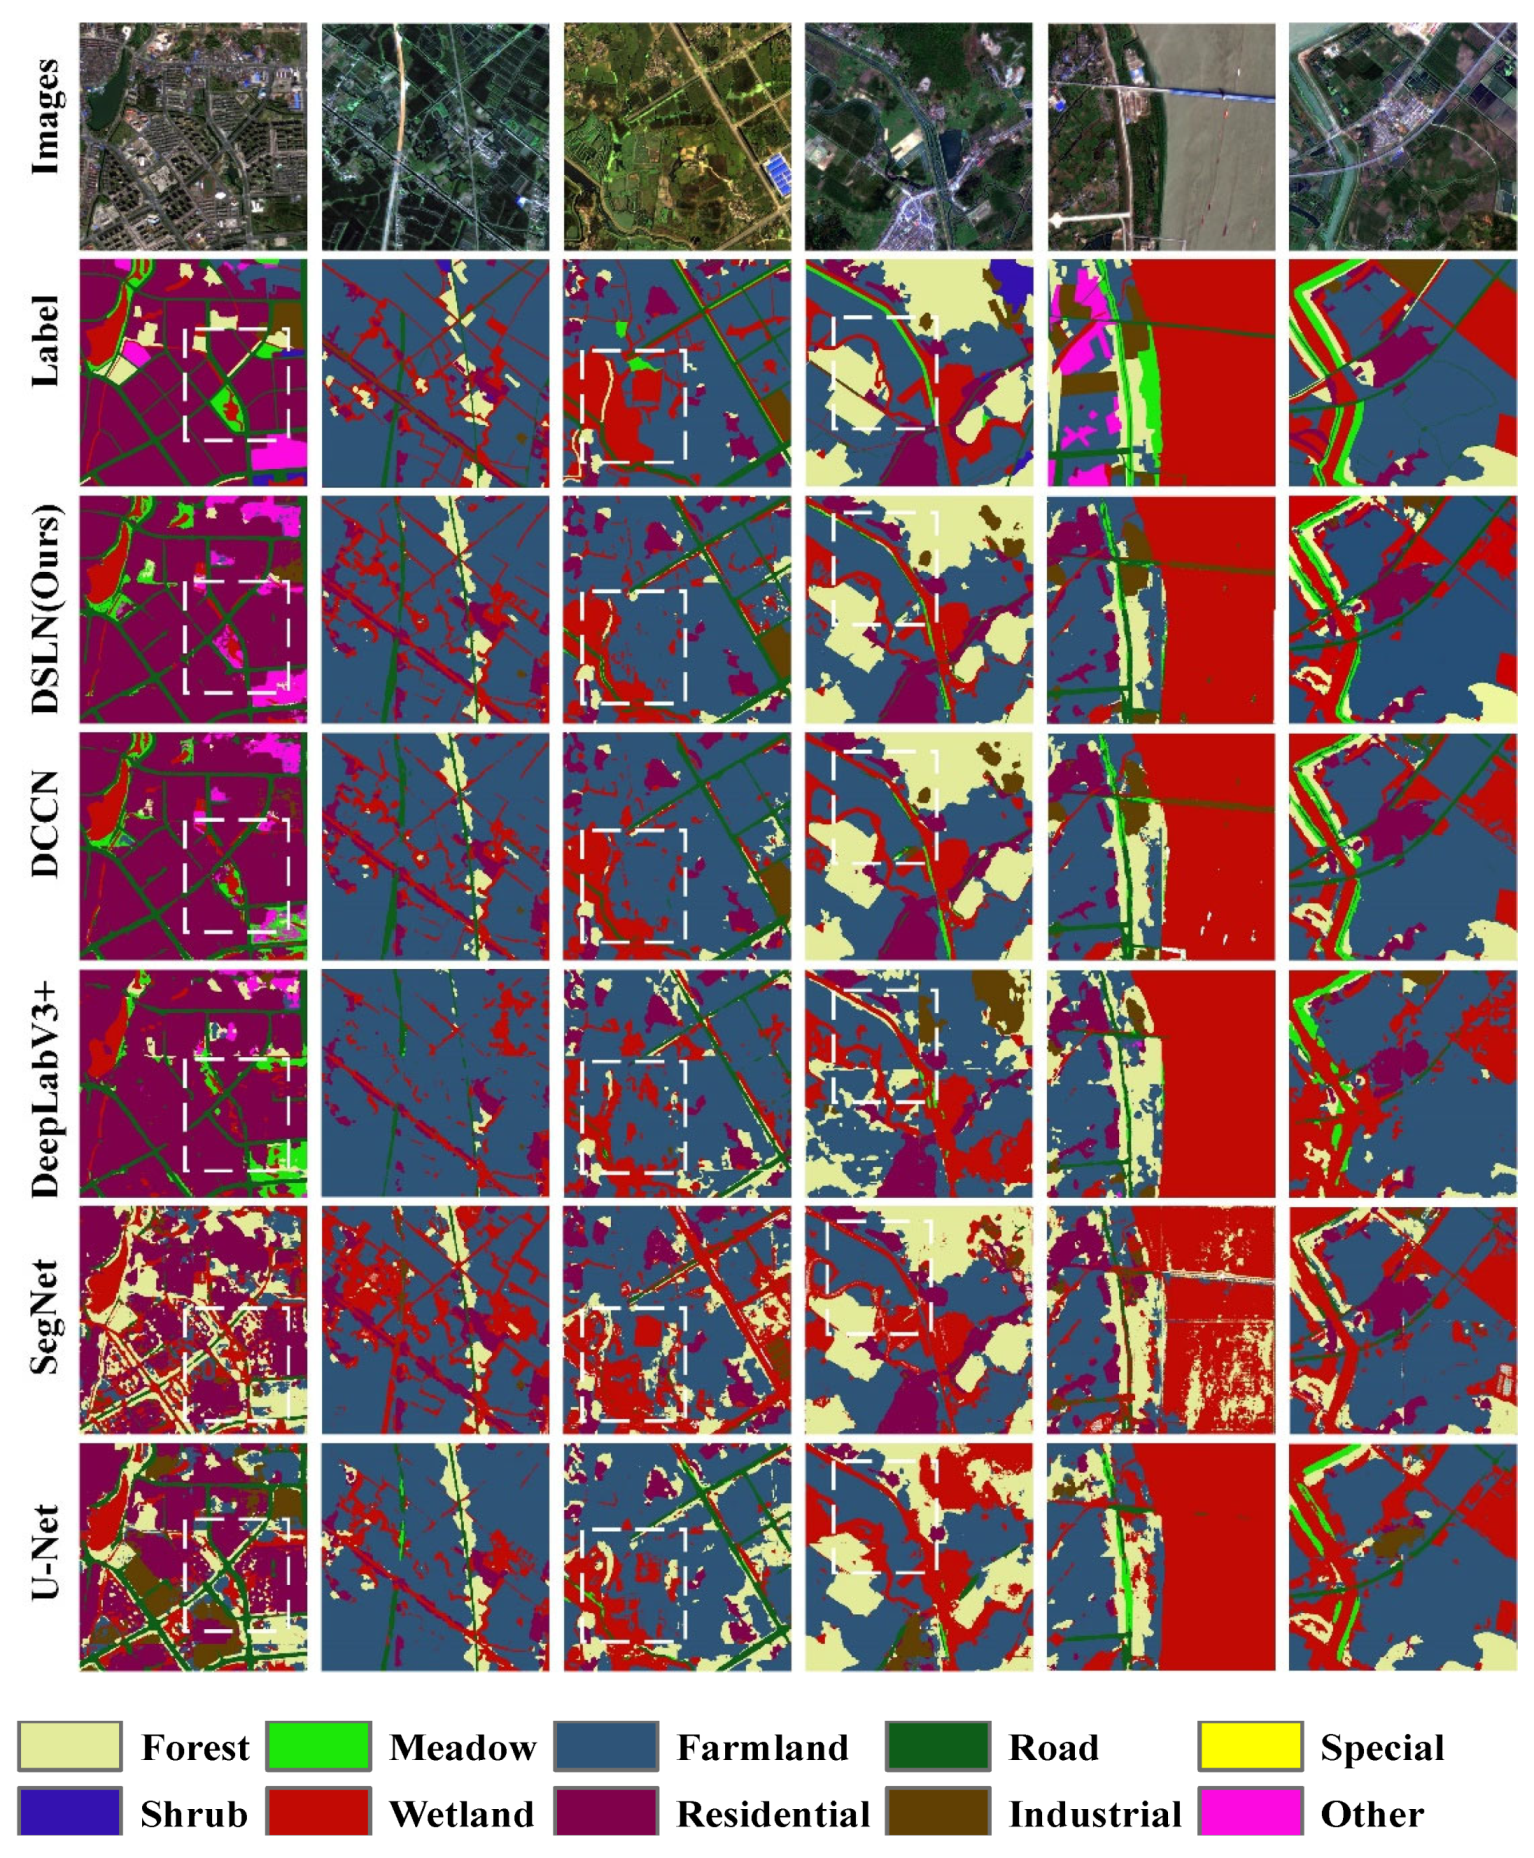
From Figure 3, we can see the LCC effect of the five network models. As seen from the details marked by the dotted line in the figure, the classification and recognition effect of our proposed DSLN model has a good performance in both the overall land cover and the extraction of detailed information, reducing the loss of detailed information and enhancing the boundaries. The extraction of information makes the extraction results more complete. It has better detail in the extraction of roads and meadows. For the land cover types with a small proportion of roads, meadows, and others, the DSLN has less loss and clearer boundaries than the DCCN network model.
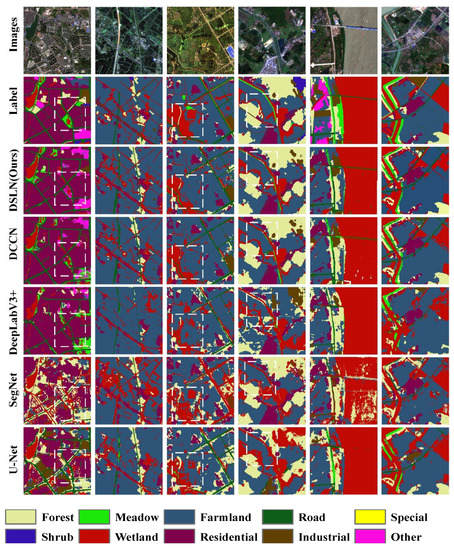
Figure 3.
Prediction results of the DSLN, DCCN, DeepLabV3+, SegNet and U-Net.
The LCC effect of various network models has obvious advantages, but there are still some problems in the classification effect between some types with similar characteristics. In Figure 3, there are problems that shrub types are divided into forests, grassland and other types are divided into farmland. It may be because in our classification system, the proportion of grassland, shrubs, special and other types of samples is small, and there is similar feature information between shrubs, forests, grasslands, and farmland, which makes the DSLN network in the training model. The lack of feature information learning of shrubs, grasslands, and other types results in insufficient classification accuracy of the DSLN network model for shrubs, grasslands, special, and other types, and the classification accuracy is not significantly improved.
According to the classification accuracy analysis of different methods of all test images in Table 3, when DCCN, DeepLabV3+, U-Net and SegNet only input image data, DCCN is better than the other three network models in LCC. The average OA (mOA) of our proposed DSLN network model for the 10 image tests reach 0.8069, and the average Kappa coefficient (mKappa) is 0.7161, which is higher than the accuracy of the DCCN model and is a significant improvement over the other three network models. Among them, in the ten image tests, the maximum value of OA is 0.8555, corresponding to a Kappa coefficient of 0.7913. The minimum value of OA is 0.7204, corresponding to a Kappa coefficient of 0.6422. The overall classification accuracy of U-Net is higher than that of SegNet and DeepLab3+, but the accuracy of the DSLN model is significantly better compared with that of U-Net. Overall, our proposed DSLN model fused with NDVI was more effective than the other three deep learning network models for multi-classification test of land cover based on the model trained on the same dataset. The main reason for this phenomenon is that in the DSLN model, we introduce the NDVI fusion module and GN, which realized the efficient use of feature information and enhanced the applicability of the model.

Table 3.
Comparison of LCC Accuracy of Different Methods.
In addition, to analyze the impact of different network models on different classifications, the accuracy of a single classification result was evaluated using a confusion matrix, as shown in Table 4. From the values of the single classification accuracy evaluation indices PA and UA in Table 4, we can see that the DSLN model we proposed can achieve better performance for the main land cover types, such as forest, wetland, farmland, residential land, road, and industrial land, in this study. The classification effect is better, especially for the extraction of wetland and road information, and the extraction of edge information was more complete. However, the classification accuracy of shrubland, meadow, road, special land, and other land cover types that account for a small proportion in the training dataset was not significantly improved.

Table 4.
PA and UA of Various Land Cover Types of DSLN Methods.
4.2. Impact of Network Structure Adjustment
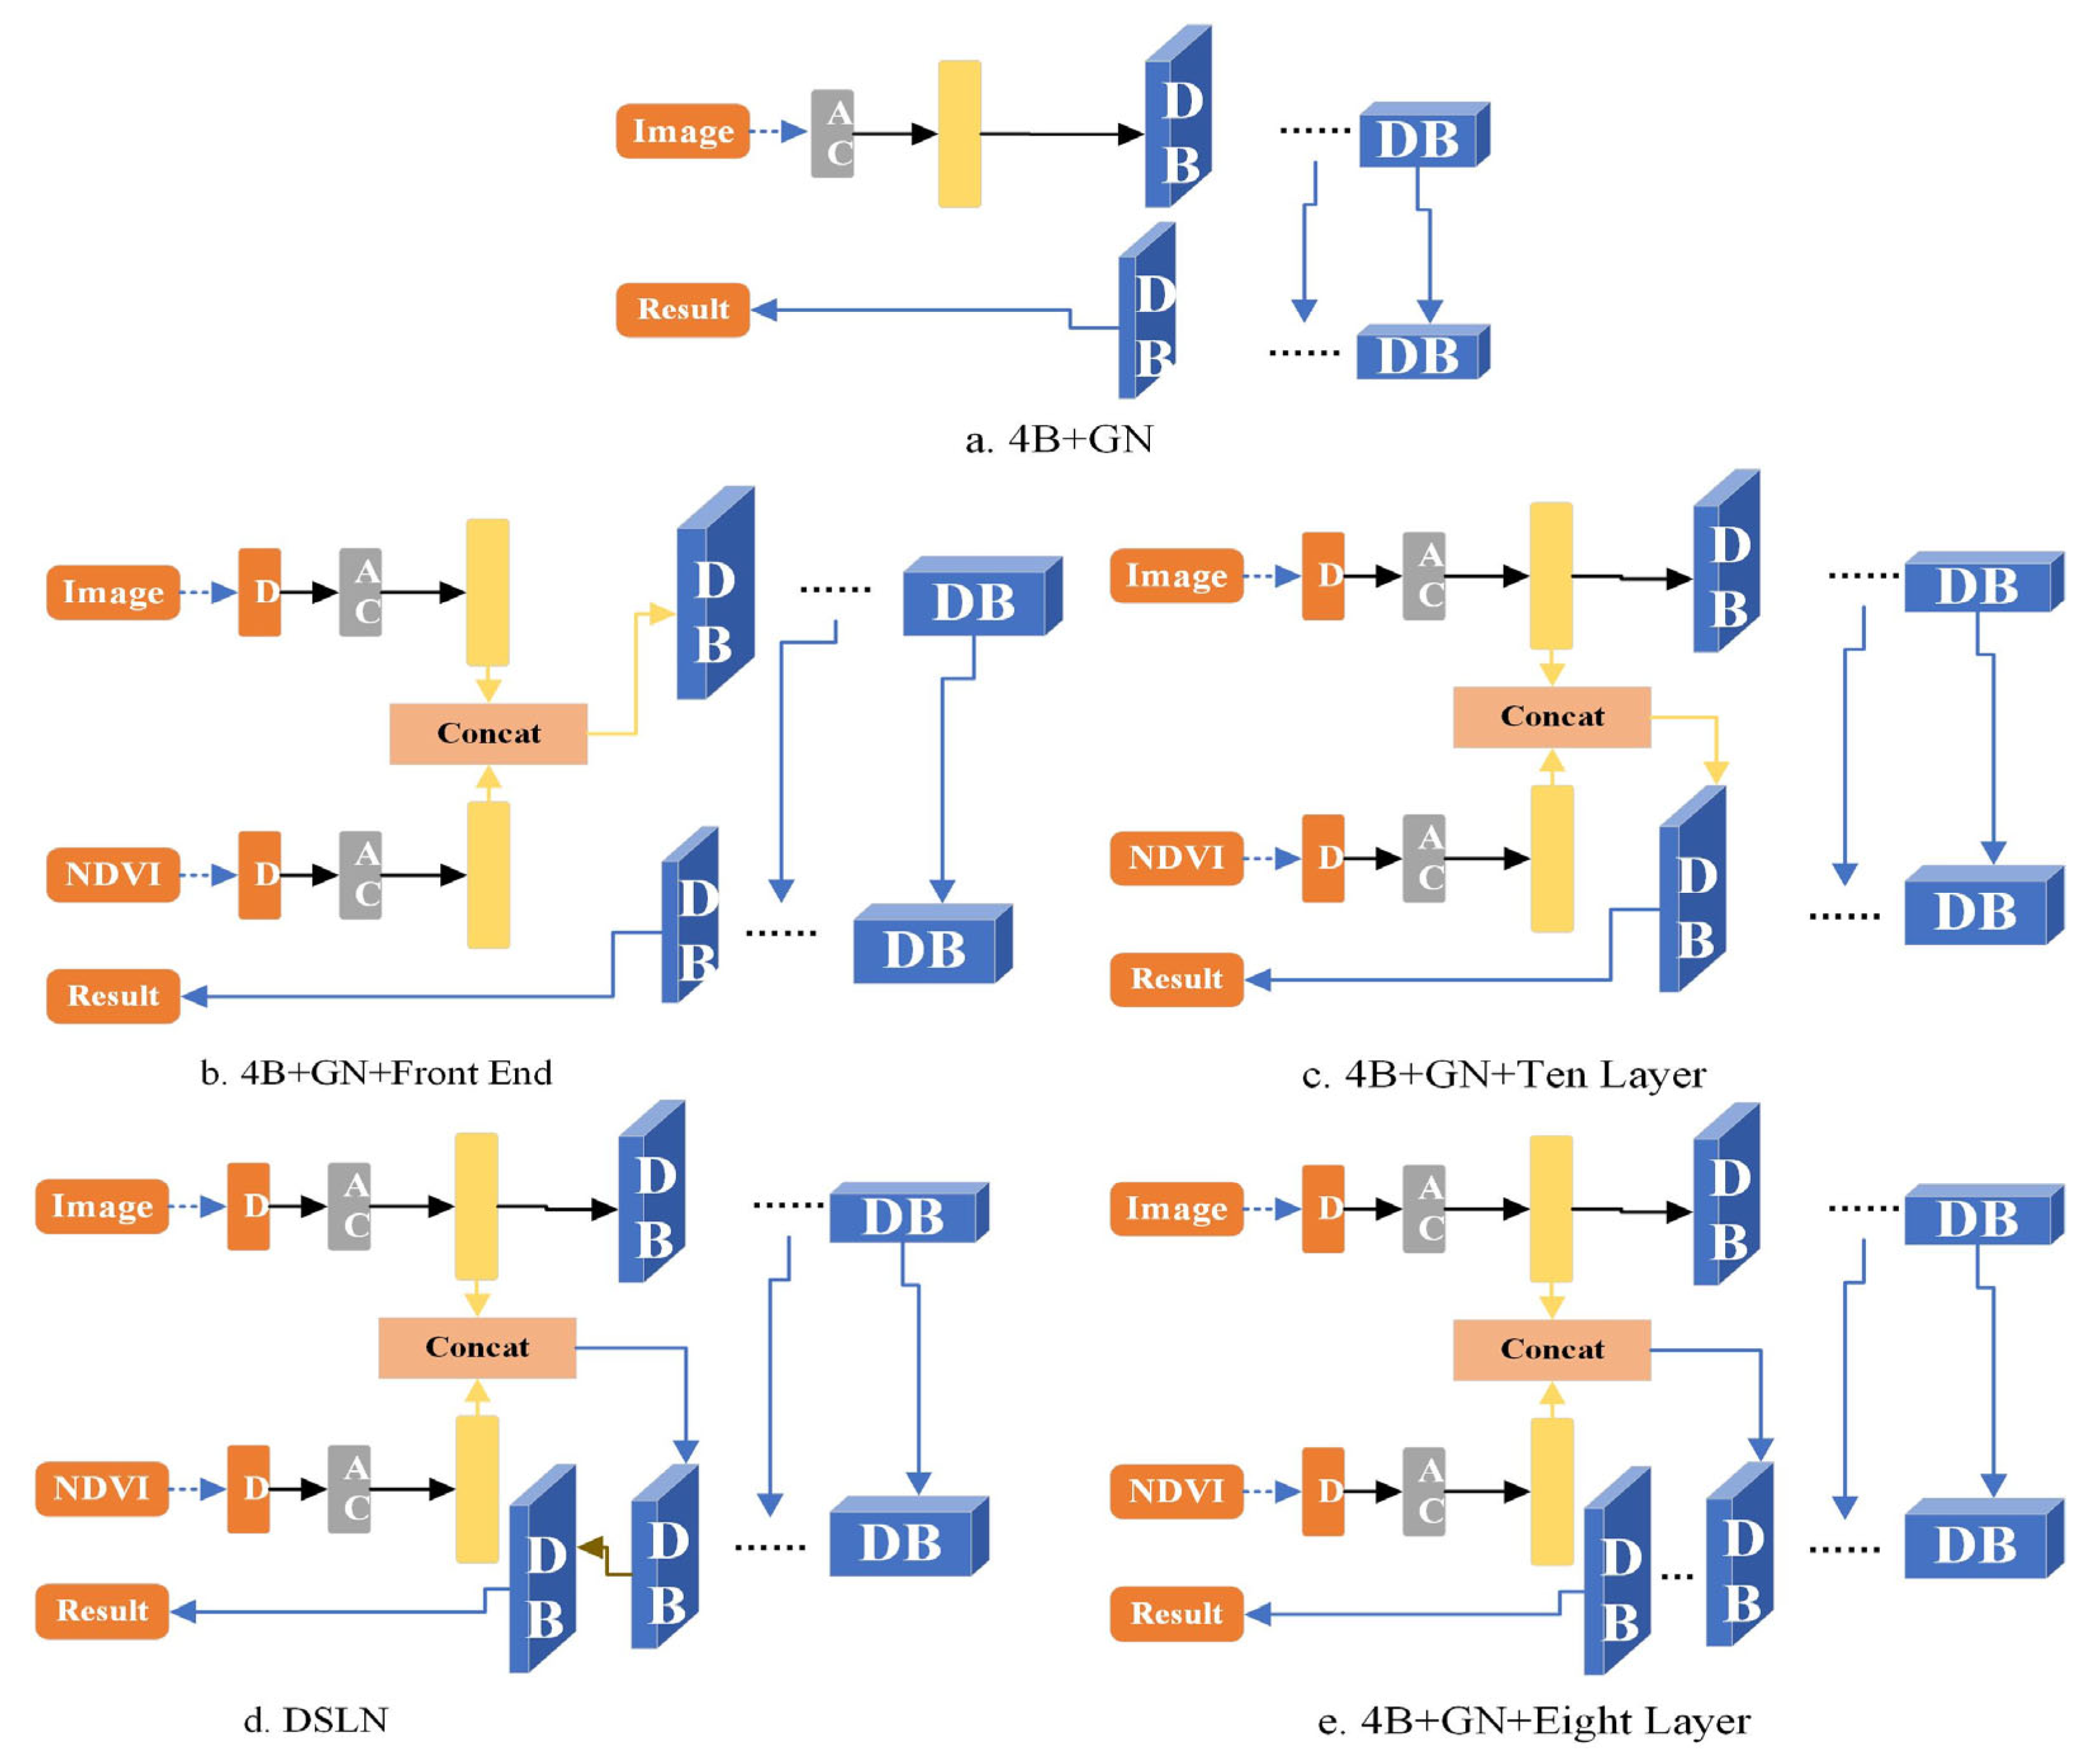
To better highlight the different roles of the NDVI fusion and utilization method in the network, we used the network without NDVI as the baseline, which is called “4B+GN” (4B is the four bands of GF-1 remote sensing image). The network where NDVI is integrated and utilized in the front end is called”4B+GN+Front End”. The network used by NDVI fusion at the end is called the “4B+GN+Ten Layer”. The network that integrates NDVI at the ninth DenseBlock layer is called “DSLN”. The network that integrates NDVI in the eighth DenseBlock layer is called the “4B+GN+Eight Layer”. Their structures are shown in Figure 4. In addition, to better highlight the impact of network structure adjustment, we conducted experimental comparisons on the network adjustment to discuss and analyze the effect of the normalization method and NDVI fusion method on the overall multi-classification effect. The test results based on the same image dataset are shown in Table 5.
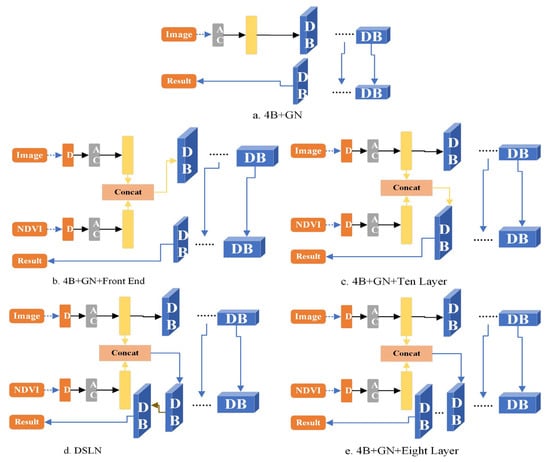
Figure 4.
Different ways to realize NDVI fusion and utilization in the network.

Table 5.
Comparison of OA and Kappa with Different Adjustments.
4.2.1. Comparison of Classification Results of Different Normalization Methods
We can see from Table 5 that due to the influence of the batch_size setting, the normalization method had a higher impact on the LCC effect of the model. The LCC accuracies of the “4B+BN” and “4B+GN” network models were quite distinct. The latter is better than the former. In the test accuracy evaluation of the “4B+GN” model for ten test images, the mOA was 0.0715 higher than that of the “4B+BN” model, and the mKappa was 0.0712 higher than that of the “4B+GN” model. Therefore, when batch_size is set to four, GN plays a more active role in the LCC network model than BN.
4.2.2. Comparison of Classification Results for Different NDVI Fusion Methods
We have attempted to verify that NDVI from different methods of the network and the information extracted from the network have different effects on LCC using the experimental comparison and analysis of the four NDVI fusion methods of “4B+GN+Front End”, “4B+GN+Eight Layer”, “DSLN” and “4B+GN+Ten Layer”. It is found that when NDVI is fused in the ninth DenseBlock layer, it has a good effect on LCC. Compared with the best “4B+GN+Ten Layer” in other fusion methods, the mOA and mKappa were improved by 0.0285 and 0.0528, respectively. The reason NDVI appears to be fused in the ninth DenseBlock layer and has a better effect on LCC may be as follows: NDVI feature information is calculated by image bands, and it has different degrees of correlation with many types of ground objects. In LCC, NDVI is often used as auxiliary information to enhance the feature information of ground objects, which in turn plays a positive role in improving the accuracy of LCC.
Different NDVI fusion methods have different effects on LCC accuracy. Compared with “4B+GN”, the two NDVI fusion methods of “4B+GN+Front End” and “4B+GN+Eight Layer” have the phenomenon of weakening the model. NDVI in “4B+GN+Front End” and “4B+GN+Eight Layer” is fused into the network, and the feature information is extracted from the encoding-decoding part such that the NDVI feature information has different degrees of loss of effective information after multiple convolutions. At the same time, the integration of NDVI in the front part of the network will continuously increase the weight of NDVI feature information in the process of network training but reduce the weight of spectral and spectral-spatial feature information, texture, shape, and other semantic information learned by the network itself. In general, the above two aspects have a negative effect on the improvement of model accuracy. In “4B+GN+Ten Layer”, NDVI is fused into the network from the bottom of the network. After the feature restoration layer of the decoding part, the NDVI feature information is convolutionally fused and fused to directly perform feature restoration. The network cannot fully learn the NDVI feature information. Therefore, the phenomenon of reducing the accuracy of the model occurs after the fusion is used. In “DSLN”, NDVI merges into the network from the ninth DenseBlock layer. After the convolution of the decoding part, the feature is restored. The network can learn the NDVI feature information to an appropriate degree, and the accuracy of the model is improved. Therefore, when using a deep learning network and integrating NDVI information, choosing an appropriate NDVI information fusion and utilization method is critical to the effect of LCC.
4.3. Model Suitability Verification
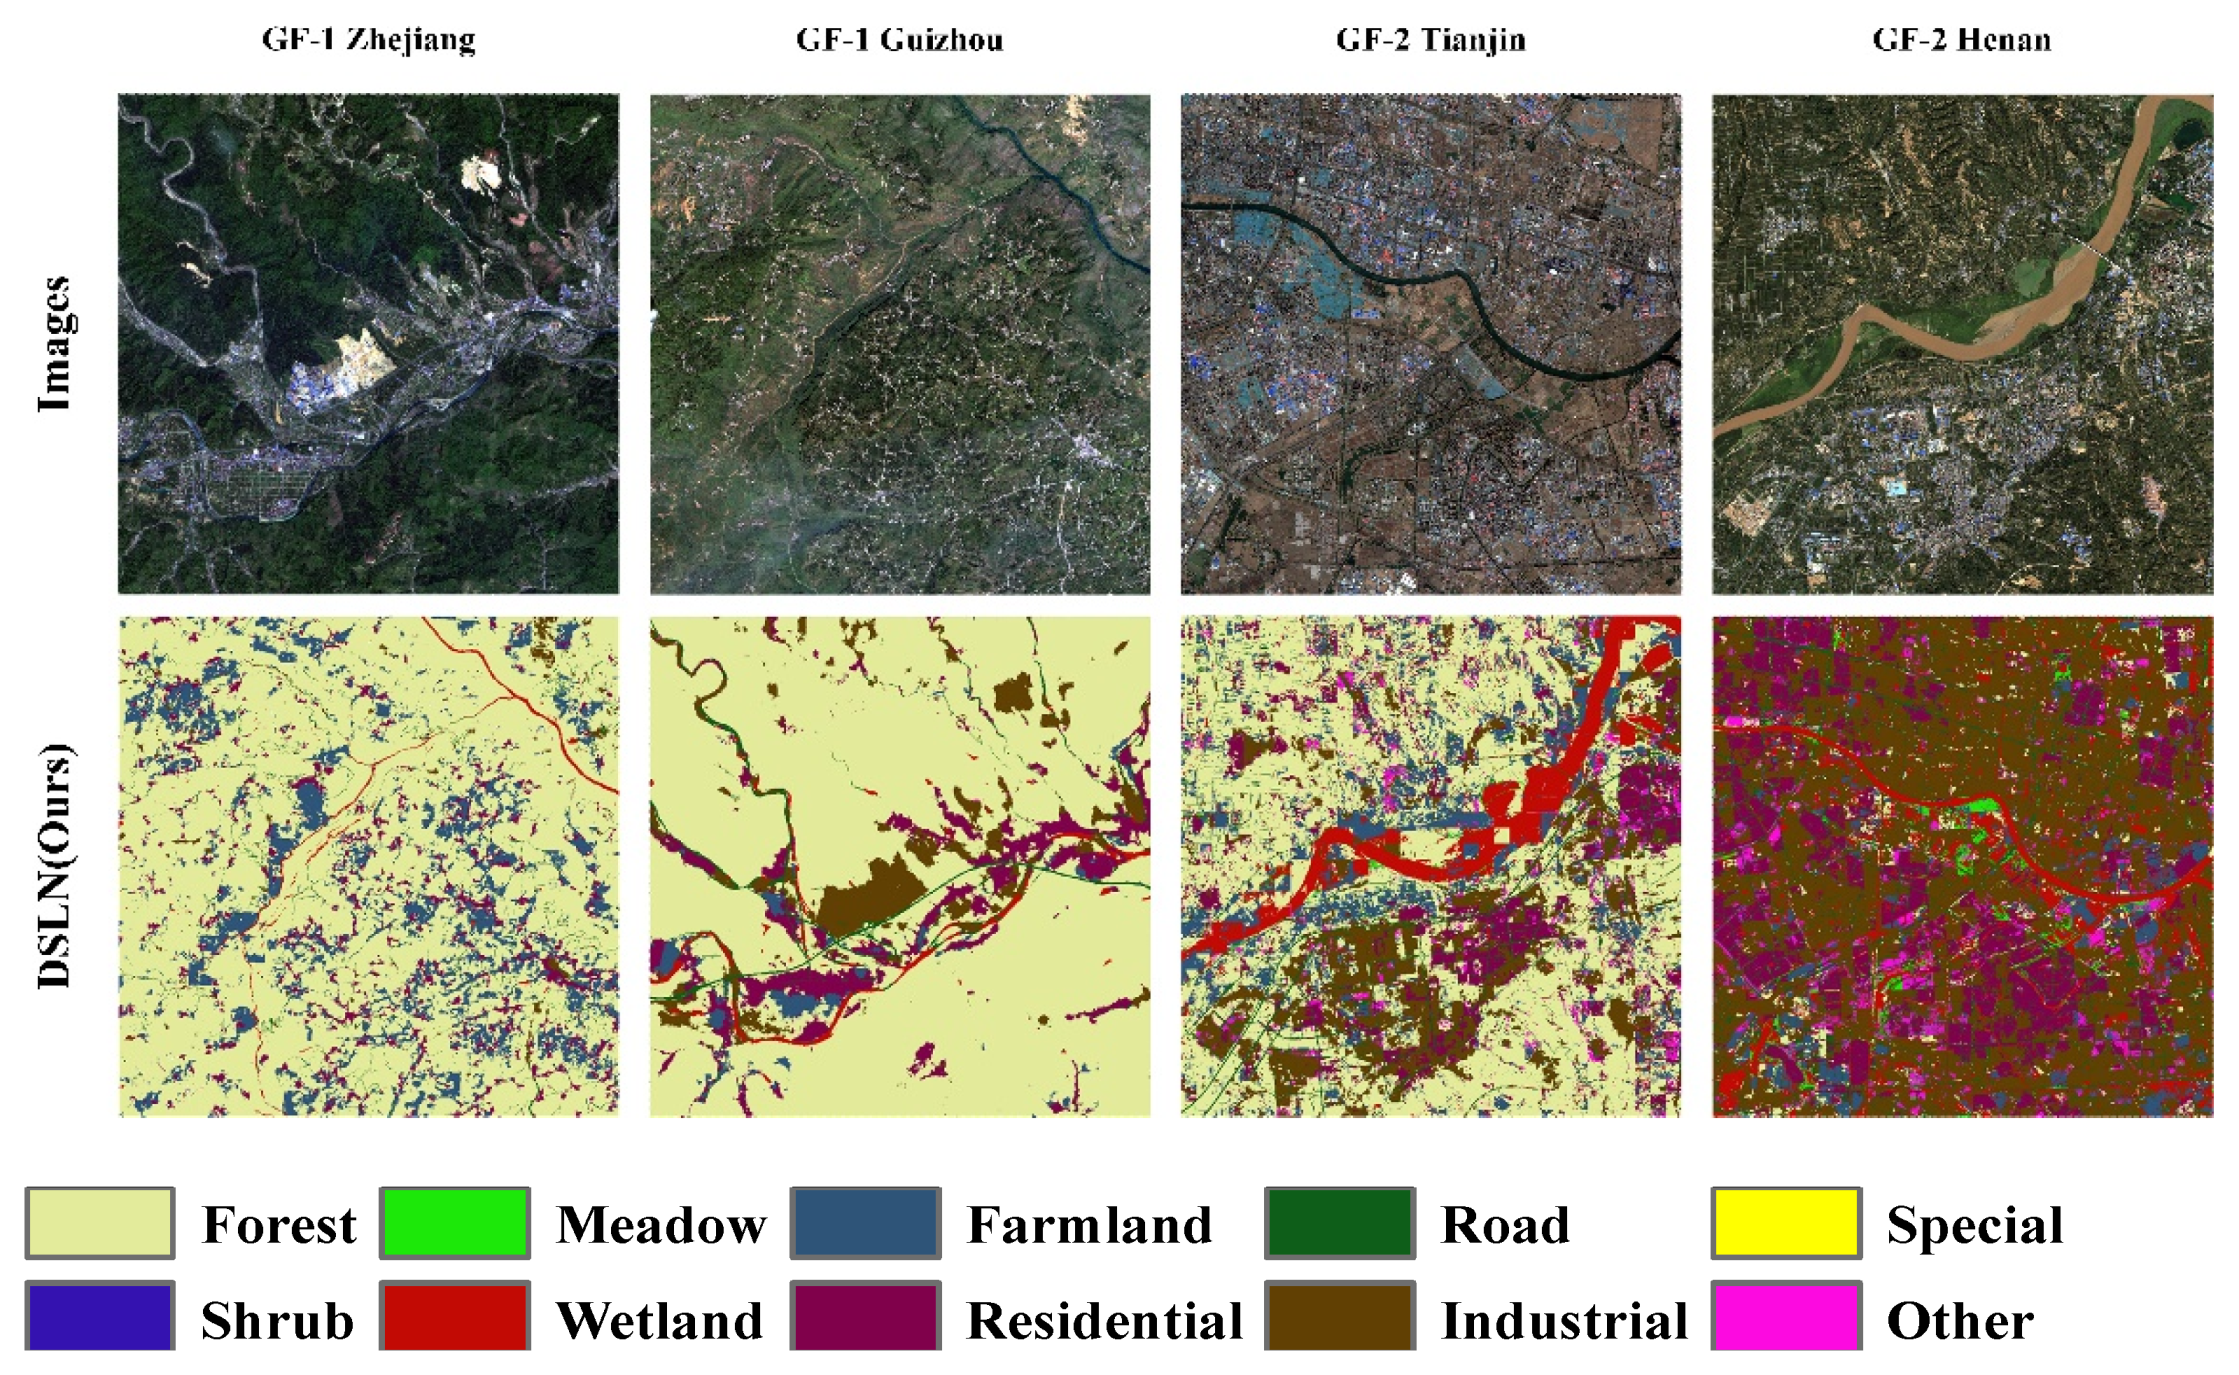
To verify the applicability of the model in different practical applications scenarios, we selected GF-1 images of two scenes in Guizhou (2018, year) and Zhejiang (2015, year) and GF-2 images of two scenes in Henan (2020, year) and Tianjin (2019, year) to discuss and analyze the applicability of the model in large scenes. Among them, the GF-1 image of Zhejiang Province has 7301 × 6748 pixels, covering an area of 194.98 km2. There are 17,296 × 18,157 pixels in Guizhou Province, covering an area of 752.03 km2. The GF-2 image of Henan Province has 17,756 × 17,541 pixels, covering an area of 305.23 km2. There are 18,488 × 18,103 pixels in Guizhou Province, covering an area of 322.01 km2. In order to verify the accuracy of the applicability of the model, we selected some regions for accuracy evaluation. The results of LCC based on the same model are shown in Figure 5.
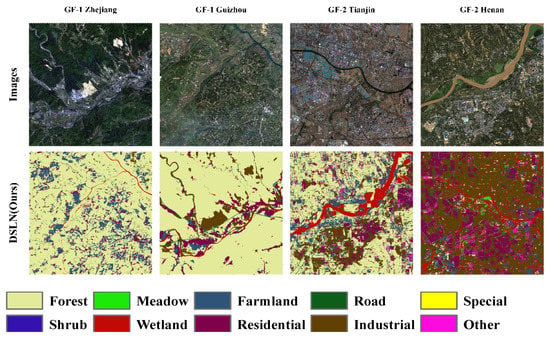
Figure 5.
Predictions on different space, different sensor images.
From the visual analysis in Figure 5, we can see that the DSLN model can effectively classify land cover in the application of GF-1 images. In terms of temporal distribution, we realized the LCC of four different years of HRRS images. In terms of spatial distribution, we can effectively classify the land cover of Zhejiang and Guizhou HRRS images of the same sensor. In terms of HRRS images of different sensors, we have achieved effective LCC for GF-2 images in Tianjin. However, the LCC effect of GF-2 images in Henan Province has problems such as obvious patch boundary lines. The application on the GF-2 image verifies the problem that the DSLN model has an issue of a poor classification effect due to spatial differences in the application of remote sensing images across sensors. The application of the network model trained by the sample dataset in a specific area has a certain degree of limitation in the spatial distribution, so that the DSLN network model can only be effectively applied within a certain spatial range.
4.4. Practical Application Verification of the DSLN Network Model on ESV
4.4.1. Model Application Area
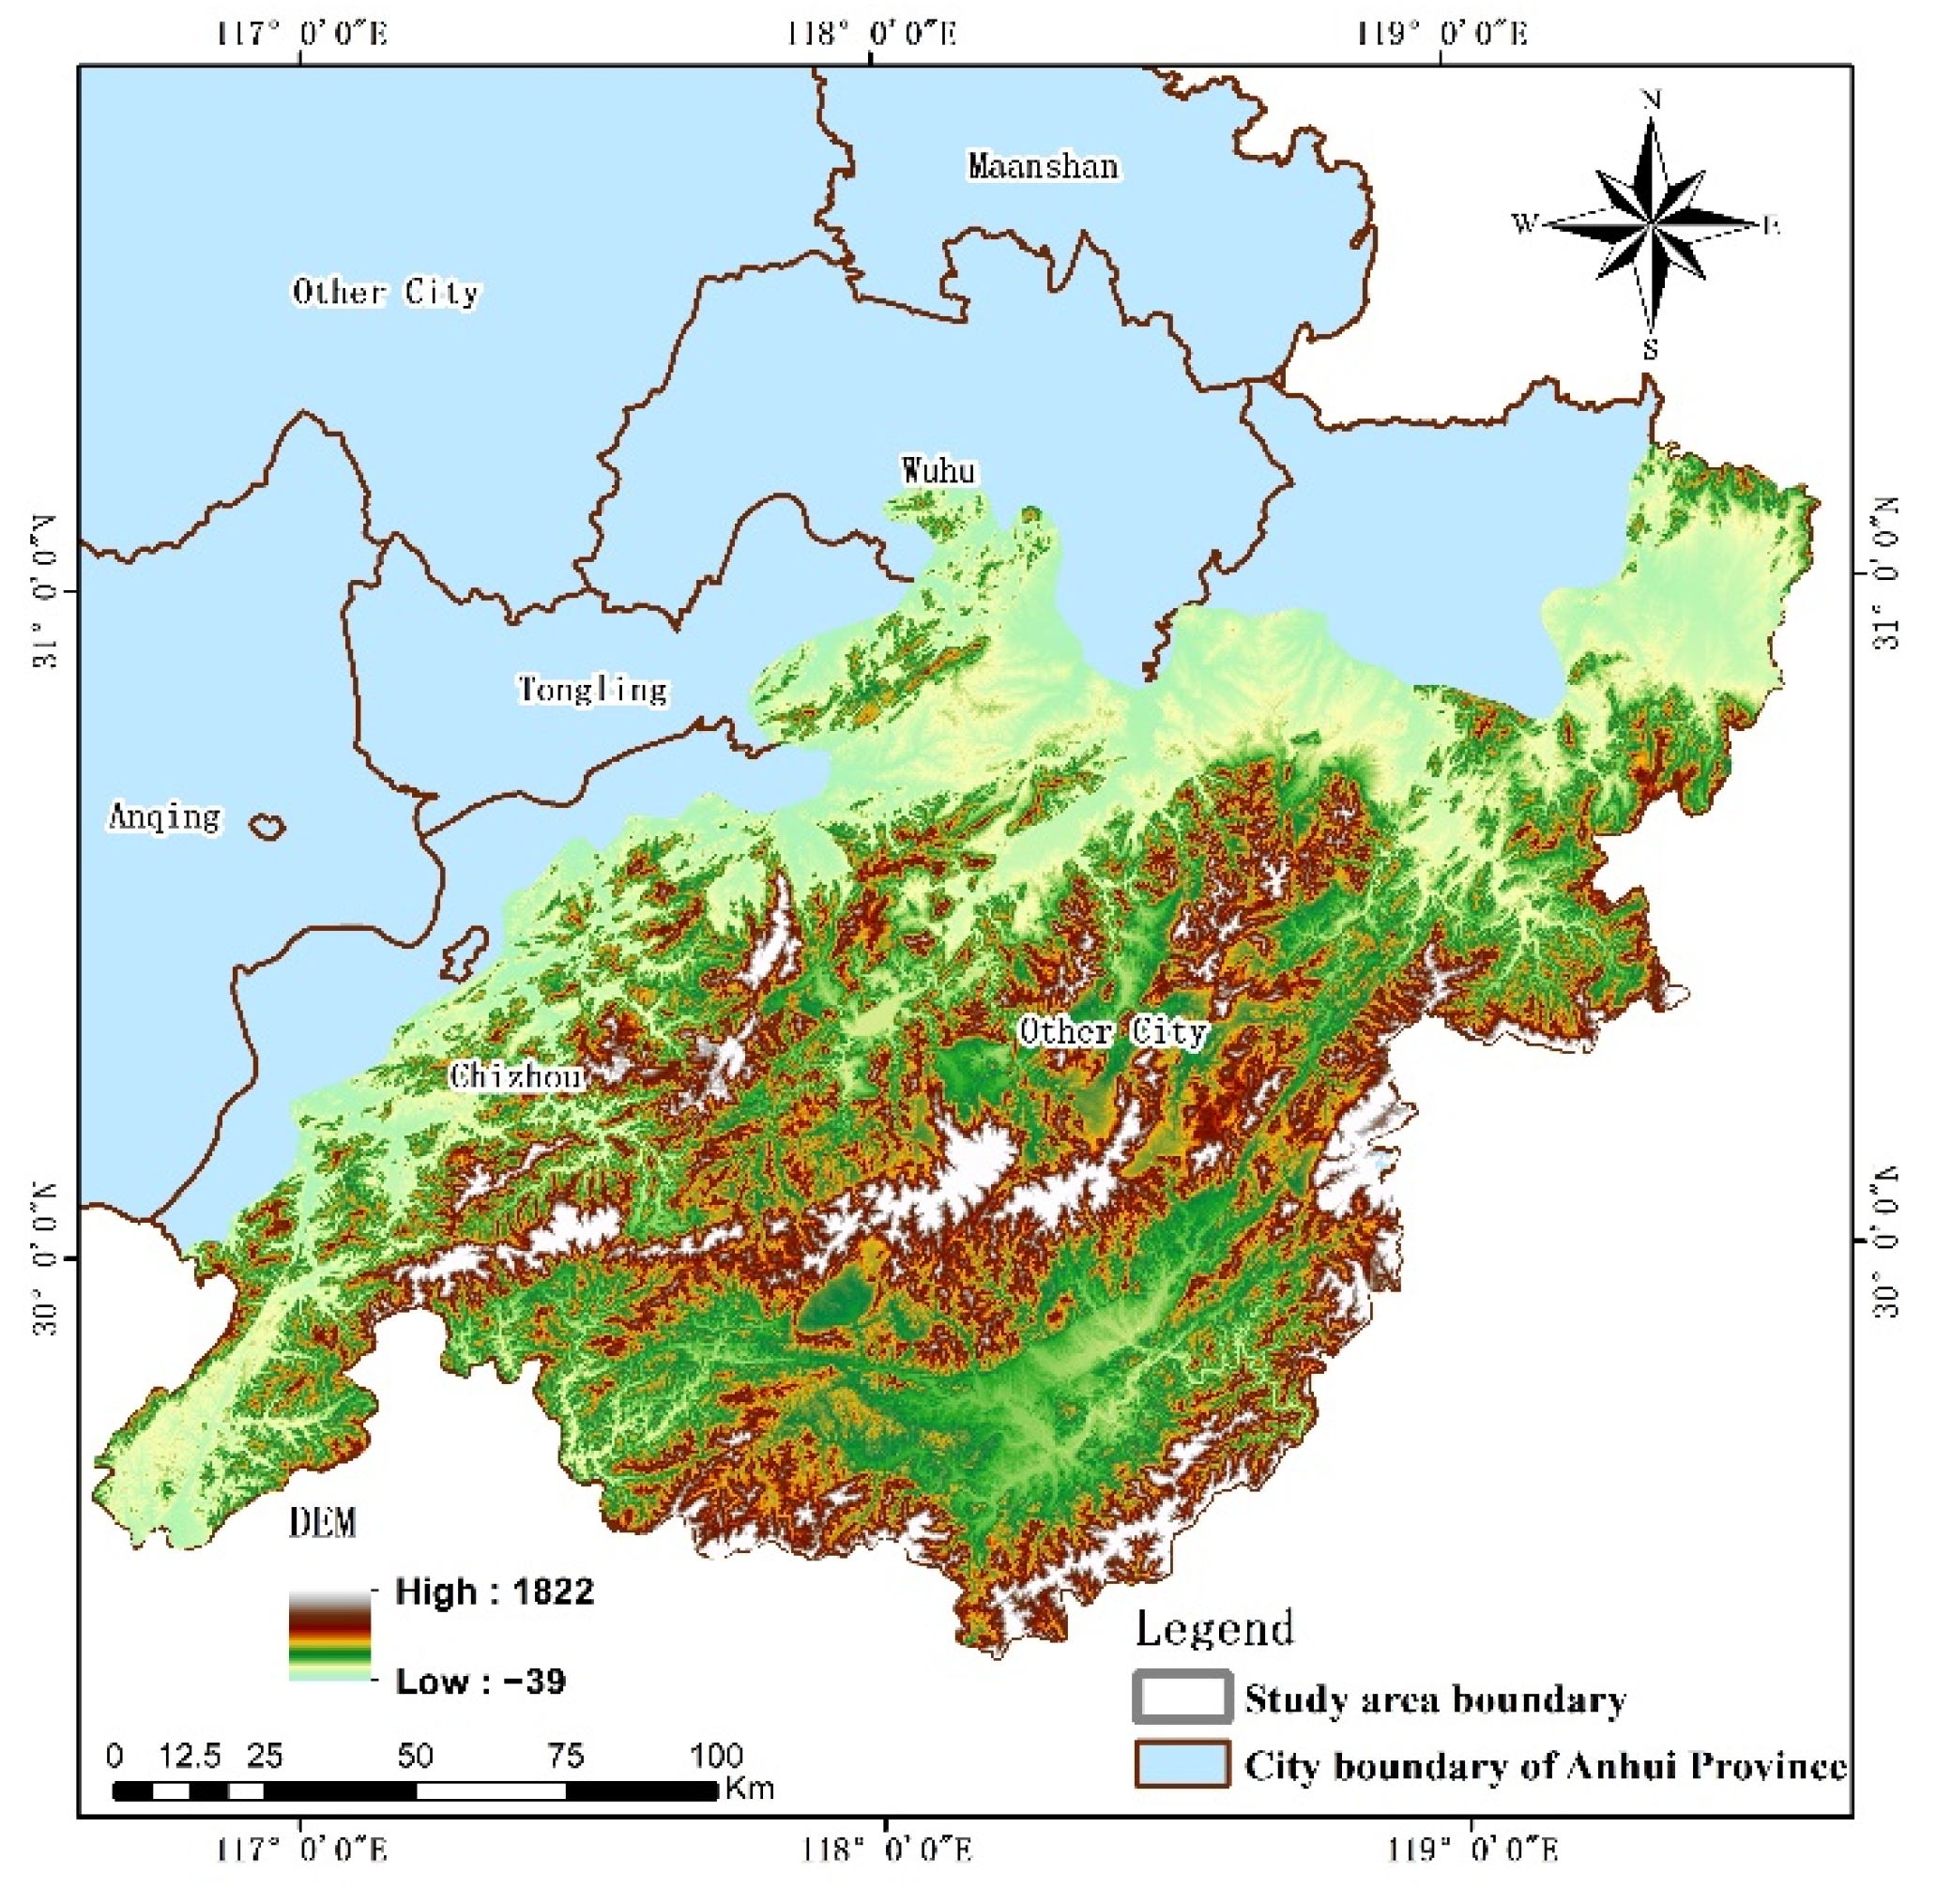
SAHMHER is located at 116°38′–119°38′E and 29°23′–31°12′N (Figure 6), with an area of 2.76 × 10⁴ km2, accounting for 19.7% of the provincial area. SAHMHER has a subtropical humid monsoon climate with abundant precipitation, the average annual temperature is 15.4–16.3 °C, the average annual precipitation is 1200–1700 mm, and the average annual evaporation is 1200~1400 mm. The topography is dominated by the Huangshan Mountains and the Tianmu Mountains and their surrounding low mountains and hills. The vegetation zone is mainly subtropical evergreen broad-leaved forest, and in the hilly areas, it is mainly mixed forest of evergreen and deciduous broad-leaved forest. Among the forestland cover types, coniferous forest is widely distributed. It is the most popular tourist resource in Anhui Province. National and provincial nature reserves and forest parks are all over the place, making it one of the hotspots for biodiversity conservation in Anhui Province and even China.
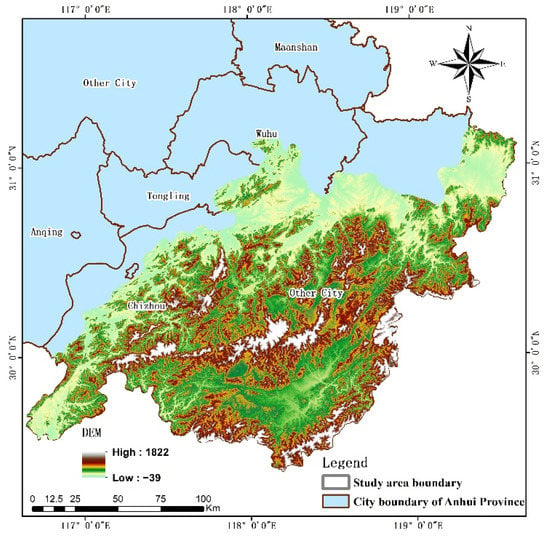
Figure 6.
The location of the SAHMHER in Anhui Province.
4.4.2. Change in ESV
We used the DSLN optimal model to classify the land cover of the GF-1 images in SAHMHER from 2015 and 2020. We referred to the “2015–2020 National Ecological Status Change Remote Sensing Survey and Evaluation Implementation Plan” and considered the basic provincial conditions of Anhui Province. We merged the land cover types in SAHMHER into farmland, forest, meadow, shrub, wetland, residential land, and other, for a total of seven types. Scholars have taken the net profit of food production per unit area of farmland ecosystem as a standard equivalent factor of ESV [55] (E, Ұ/hm2). The food production value of the farmland ecosystem has been mainly calculated based on the three main food products of rice, wheat, and corn.
According to the 2016–2021 “Anhui Statistical Yearbook” (http://tjj.ah.gov.cn/ (accessed on 14 June 2022)), the average sown areas of rice, wheat, and corn in Anhui Province from 2015 to 2020 were 2,398,700 hm2 (39.64%), 2,638,800 hm2 (43.51%), and 1,028,700 hm2 (16.85%), respectively. Combined with the 2016–2021 “National Agricultural Product Cost and Benefit Data Compilation” (https://www.yearbookchina.com/ (accessed on 17 June 2022)), the average net profit per unit area of rice, wheat, and corn in Anhui Province from 2015 to 2020 was 11,061.95 Ұ/hm2, 1040.60 Ұ/hm2, and −552.25 Ұ/hm2, respectively. We obtained an E value of 4744.43 Ұ/hm2 from Anhui Province. We adopted the equivalent value of ecosystem services per unit area in Anhui Province [56] and calculated the value of ecosystem services per unit area in Anhui Province in 2017, as shown in Table 6. At the same time, we further obtained the ESV value of SAHMHER by using the data mentioned above and the proposed calculation method.

Table 6.
The ESV per Unit Area of LULC in the SAHMHER. (Ұ/hm2.a).
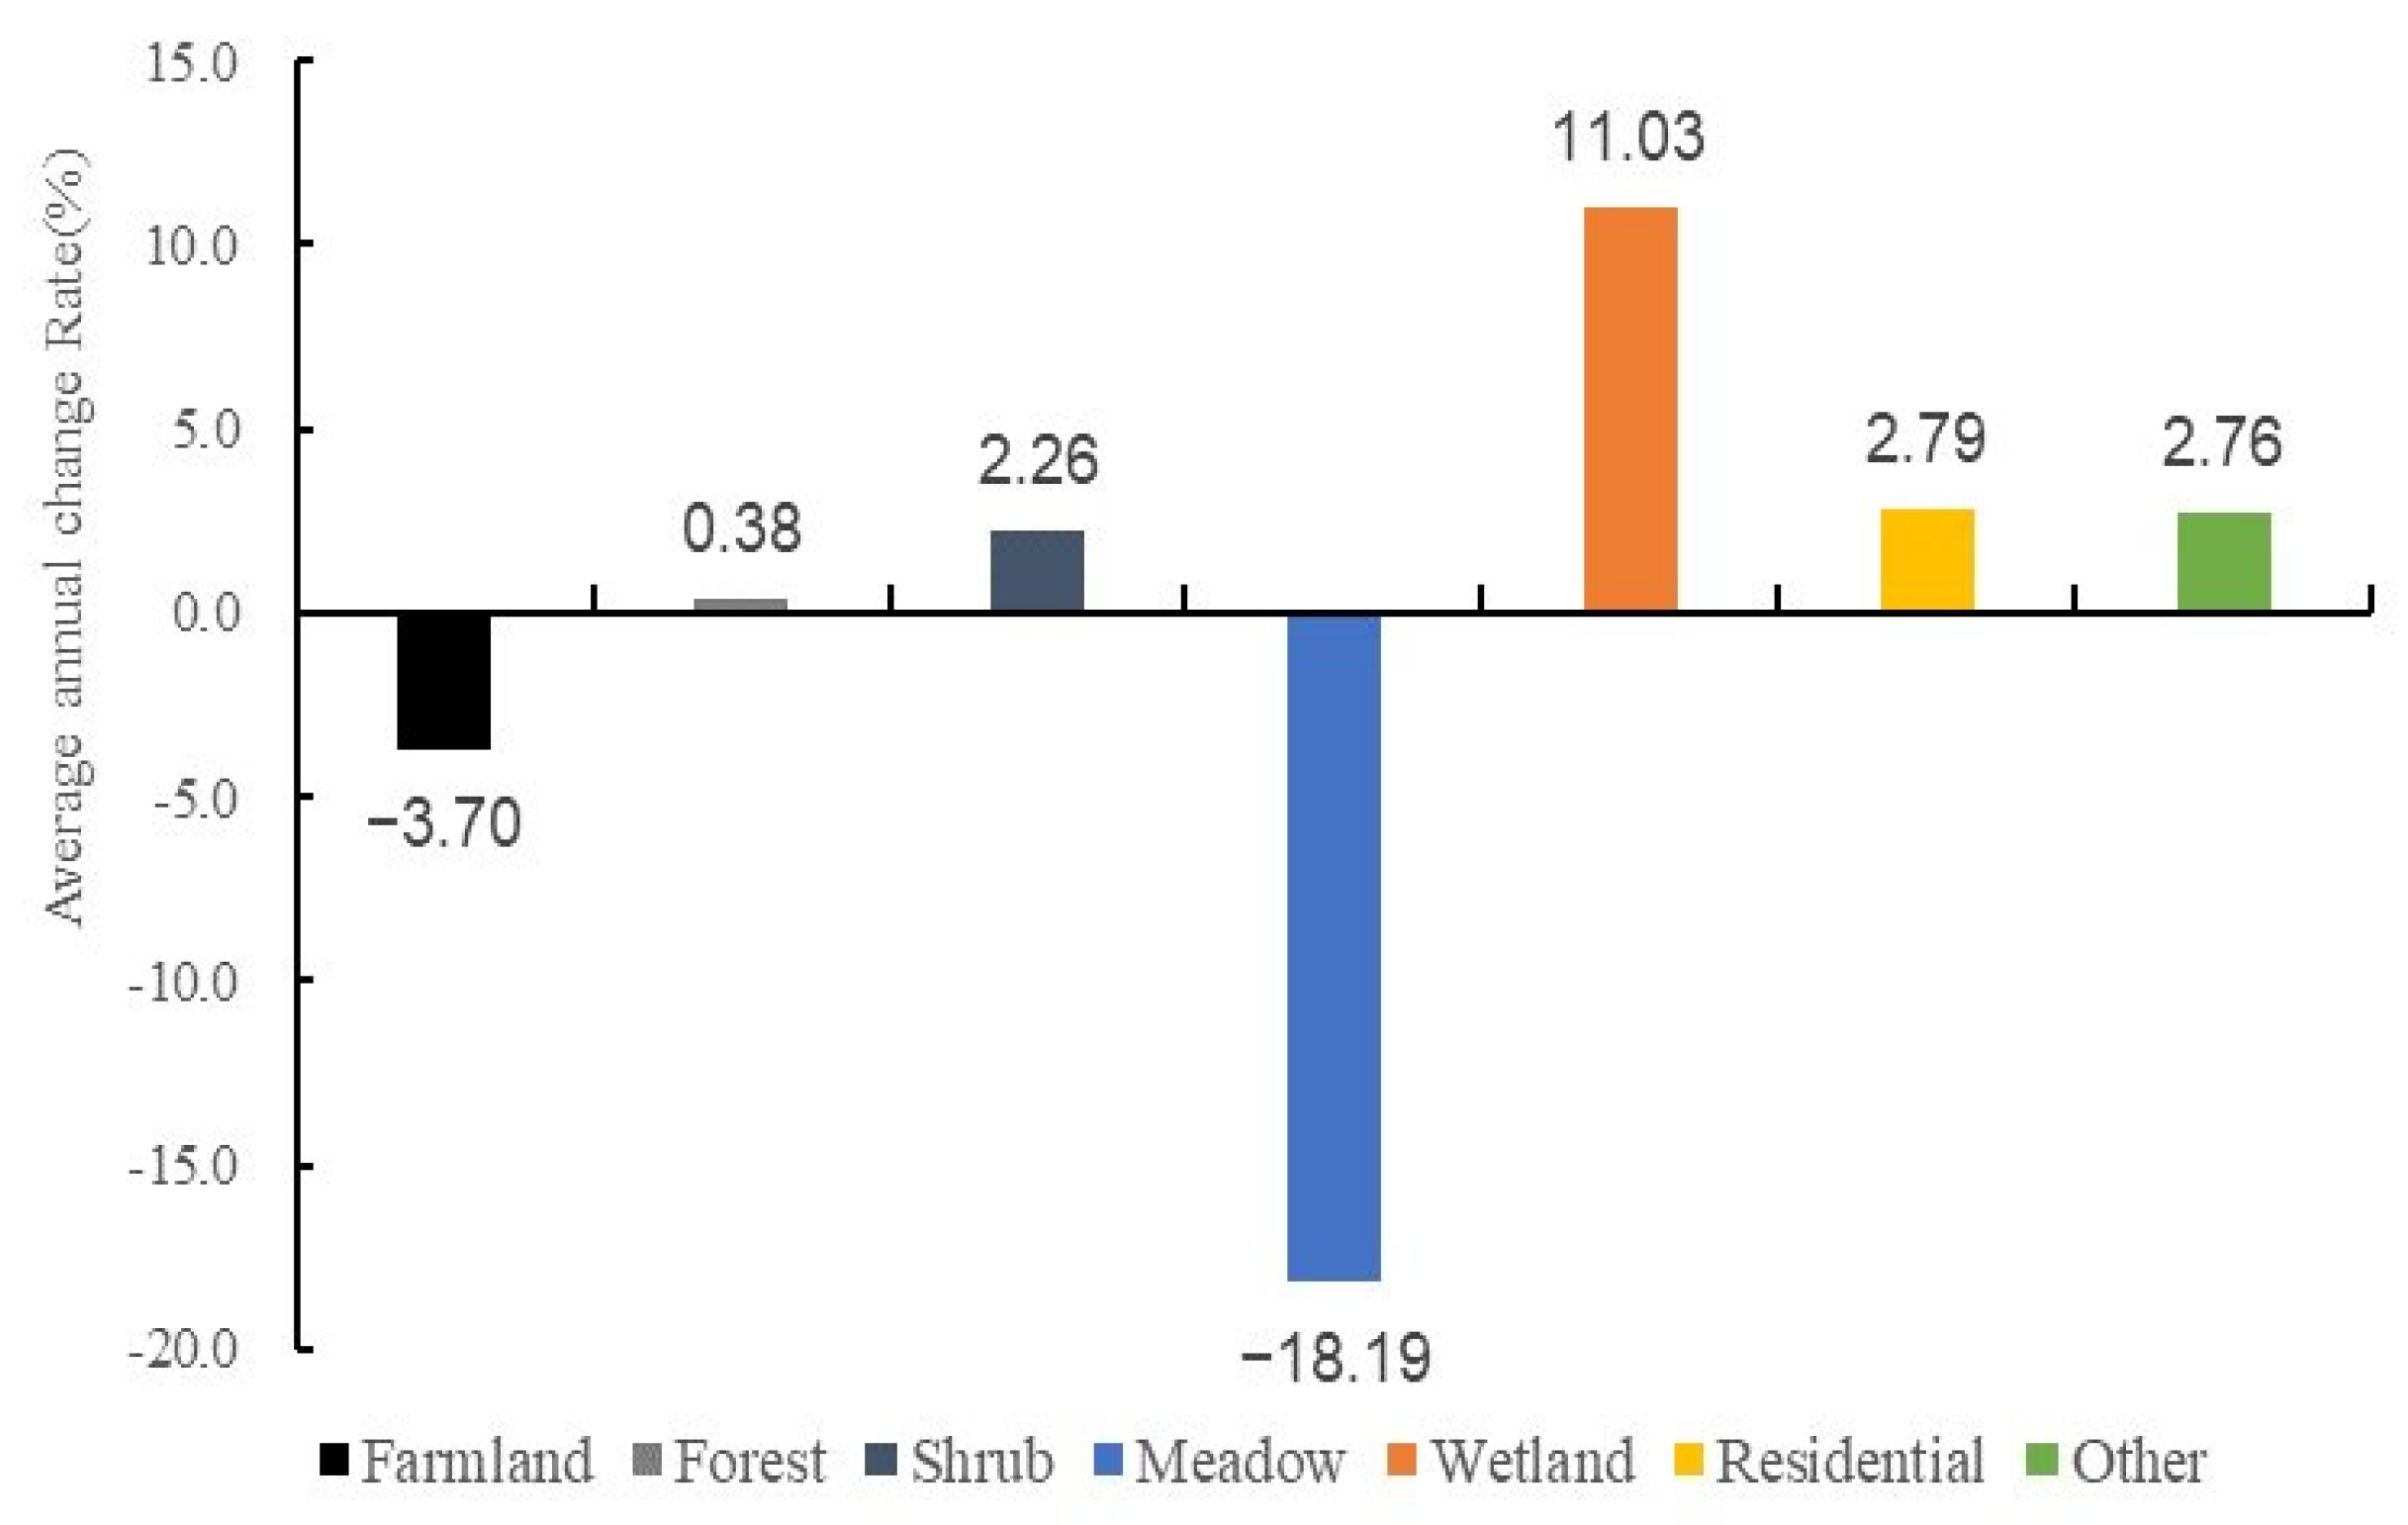
The area and ESV of major land cover types in SAHMHER in 2015 and 2020 are shown in Table 6. The average annual rate of change of the area of different land cover types is shown in Figure 7. During the five years, the forest, wetland, residential, shrub, and other land cover areas show an increasing trend, with average annual change rates of 0.38%, 11.03%, 2.79%, 2.26%, and 2.76%, respectively. The land coverage area of farmland and meadow show a decreasing trend, with average annual change rates of 3.70% and 18.19%, respectively.
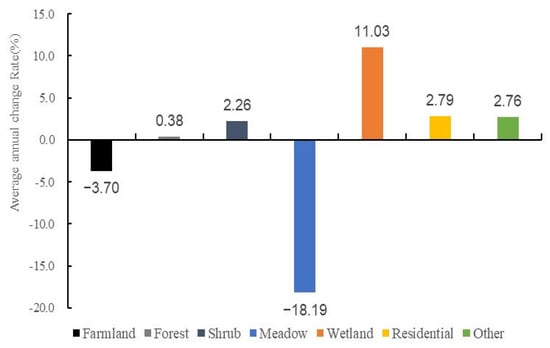
Figure 7.
Average annual change rate of ESV for different land cover types.
As seen from Table 7, the ESV of forests and wetlands have always accounted for a large proportion, and the number has continued to grow. The total ESV in 2015 was 2878.38 × 108 Ұ, and in 2020 it was 3109.16 × 108 Ұ, an increase of 230.78 × 10⁸ Ұ in five years, with a change rate of 8.02%. The overall value of ecological services changed significantly, showing an upward trend. During the study period, the areas of forest, shrub, wetland, and other land all show an increasing trend, and the ESV also increases accordingly.

Table 7.
The Area and ESV of Major Land Cover Types in the SAHMHER.
As seen from Table 8, from 2015 to 2020, the ESV of the water supply and hydrological regulation increased the most, with average annual change rates of 12.89% and 4.08%, respectively. The value of food production and nutrient cycle ecological services decreased, with average annual change rates of 1.01% and 0.13%, respectively. The value of the other seven ecosystem services also showed an increasing trend, but the average annual change rate was less than 2%.

Table 8.
Change of ESV Components in the SAHMHER from 2015 to 2020.
4.4.3. Ecosystem Sensitivity Analysis
The forest area of Xuancheng predicted by the DSLN network model was 7154.79 km2, and the forested area released by the Xuancheng Forestry Bureau was 7084.00 km2. The error rate of the forest area in Xuancheng produced by the DSLN network model and the forest area in Xuancheng released by the Xuancheng Forestry Bureau was 1.00%. The data show that the forest area based on the DSLN network model is consistent with the forest area published by the Xuancheng Forestry Bureau and the effectiveness of the DSLN network model application in practice. (http://lyj.xuancheng.gov.cn/News/show/1068415.html (accessed on 28 June 2022)).
In addition, we used the coefficient of sensitivity (CS) to quantitatively analyze the sensitivity of ESV to the ESV per unit area (Vc, Ұ/hm2) of a certain land cover type. When CS < 1, it means that ESV is inelastic to Vc, and when CS > 1, it means that ESV is elastic to Vc. In this paper, the Vc of each land cover type is adjusted up and down by 50% to calculate the ESV change and the CS value in the study area. From Table 9, we can see that the sensitivity index of the value coefficient varies greatly among different land cover types. The sensitivity index in the five years was less than 1, which indicates that the ESV in SAHMHER lacked elasticity with the adopted ESV coefficient. Therefore, the estimated ESV is reliable, and the adopted ESV coefficient is suitable for the local situation.

Table 9.
The Sensitivity Coefficients in the SAHMHER during 2015–2020.
5. Discussion
Our proposed DSLN network model has certain advantages in LCC for high resolution imagery (GF-1 2 m). First of all, we have proved through our experiments that the DSLN network model has a high overall accuracy in the 11 classifications, which reduces the problem of detail information classification in the classification process. Secondly, we have verified that our proposed NDVI fusion module can play a better positive role in LCC through the experimental comparison of the fusion location of NDVI and spectral feature information. At the same time, in order to verify the adaptability of the DSLN network model in large scenarios, we selected images from different times, different locations, and different sensors for testing. The comprehensive analysis and test results show that the DSLN network model has good adaptability in a limited time and space range, and can improve the time efficiency of regional LCC. Finally, we selected a specific research area to verify the practical application of the DSLN network model, and proved that the DSLN network model has a good performance in practical applications.
The DSLN network model had good performance in overall accuracy improvement, detailed information classification effect improvement and practical application. However, in the model training, the sample data of shrub, grassland, special and other types accounted for a small proportion, which makes the misclassification of shrub, grassland, special and other types obvious. On the other hand, the practical application of the DSLN network model was also limited by time, space, and different sensors. In addition, there was also the problems of hill shadow and cloud detection. In follow-up work, we will consider adopting multi-source data fusion and strengthening index features such as NDWI to further improve the accuracy of the model.
6. Conclusions
In this work, we have proposed a deep learning DSLN model that integrates NDVI and spectral features to achieve a more accurate LCC of HRRS images. The model has used the remote sensing image spectrum and NDVI as the input of the model and realizes the fusion of NDVI feature information and spectral features through the NDVI fusion module to improve the separability between classes of land cover. Experiments on the GF-1 dataset have shown that the mOA and mKappa of the network model reach 0.8069 and 0.7161, respectively. In addition, experiments using different NDVI fusion methods have shown that different NDVI fusion methods have certain differences in the accuracy of LCC. Among them, the post-fusion method adopted in this paper has distinct advantages over the pre-fusion method. The LCC and verification of the images of Henan, Tianjin, Zhejiang and Guizhou with different time phases and different sensors have shown that the DSLN model also has good applicability to temporal and spatial distribution. In the application of ESV assessment, using the DSLN network model, the GF-1 remote sensing image was used to classify the land cover of SAHMHER, and the ESV was analyzed based on the LCC data. We found that from 2015 to 2020, the area of land cover types converted to forest, shrub and wetland increased. Through comparative analysis, we saw that the data of Xuancheng’s forest area produced by our proposed DSLN network model, based on GF-1 remote sensing images, was consistent with the data released by the relevant government departments. In conclusion, the DSLN network model can provide more accurate land cover data for regional ESV analysis.
Author Contributions
Conceptualization, H.Y. and J.Z.; methodology, H.Y. and J.Z.; validation, Y.W.; investigation, L.W. and C.P.; resources, Y.W. and C.P.; data curation, B.W.; writing—original draft preparation, J.Z.; writing—review and editing, P.W. and H.Y.; funding acquisition, Y.W., H.Y. and B.W. All authors have read and agreed to the published version of the manuscript.
Funding
This research was funded by the National Natural Science Foundation of China (grant No. 42101381, 41901282 and 41971311), the National Natural Science Foundation of Anhui (grant No. 2008085QD188) and the Science and Technology Major Project of Anhui Province (grant No. 201903a07020014). Anhui Provincial Key Research and Development Program (grant No. 202104b11020022).
Conflicts of Interest
The authors declare no conflict of interest.
References
- Alexander, H. Nature’s Services: Societal Dependence on Natural Ecosystems Edited by Gretchen C. Daily Island Press, 1997, $24.95, 392 Pages. Corp. Environ. Strategy 1999, 6, 219. [Google Scholar] [CrossRef]
- Mooney, H.A.; Duraiappah, A.; Larigauderie, A. Evolution of Natural and Social Science Interactions in Global Change Research Programs. Proc. Natl. Acad. Sci. USA 2013, 110, 3665–3672. [Google Scholar] [CrossRef] [PubMed]
- Lin, X.; Xu, M.; Cao, C.; Singh, R.P.; Chen, W.; Ju, H. Land-Use/Land-Cover Changes and Their Influence on the Ecosystem in Chengdu City, China during the Period of 1992–2018. Sustainability 2018, 10, 3580. [Google Scholar] [CrossRef]
- Carpenter, S.R.; Mooney, H.A.; Agard, J.; Capistrano, D.; Defries, R.S.; Diaz, S.; Dietz, T.; Duraiappah, A.K.; Oteng-Yeboah, A.; Pereira, H.M.; et al. Science for Managing Ecosystem Services: Beyond the Millennium Ecosystem Assessment. Proc. Natl. Acad. Sci. USA 2009, 106, 1305–1312. [Google Scholar] [CrossRef]
- Shi, H.; Chen, L.; Bi, F.K.; Chen, H.; Yu, Y. Accurate Urban Area Detection in Remote Sensing Images. IEEE Geosci. Remote Sens. Lett. 2015, 12, 1948–1952. [Google Scholar] [CrossRef]
- Fauvel, M.; Tarabalka, Y.; Benediktsson, J.A.; Chanussot, J.; Tilton, J.C. Advances in Spectral-Spatial Classification of Hyperspectral Images. Proc. IEEE 2013, 101, 652–675. [Google Scholar] [CrossRef]
- Tuia, D.; Persello, C.; Bruzzone, L. Domain Adaptation for the Classification of Remote Sensing Data: An Overview of Recent Advances. IEEE Geosci. Remote Sens. Mag. 2016, 4, 41–57. [Google Scholar] [CrossRef]
- Bruzzone, L.; Carlin, L. A Multilevel Context-Based System for Classification of Very High Spatial Resolution Images. IEEE Trans. Geosci. Remote Sens. 2006, 44, 2587–2600. [Google Scholar] [CrossRef]
- Phiri, D.; Morgenroth, J. Developments in Landsat Land Cover Classification Methods: A Review. Remote Sens. 2017, 9, 967. [Google Scholar] [CrossRef]
- Thyagharajan, K.K.; Vignesh, T. Soft Computing Techniques for Land Use and Land Cover Monitoring with Multispectral Remote Sensing Images: A Review. Arch. Comput. Methods Eng. 2019, 26, 275–301. [Google Scholar] [CrossRef]
- Yin, J.; Dong, J.; Hamm, N.A.S.; Li, Z.; Wang, J.; Xing, H.; Fu, P. Integrating Remote Sensing and Geospatial Big Data for Urban Land Use Mapping: A Review. Int. J. Appl. Earth Obs. Geoinf. 2021, 103, 102514. [Google Scholar] [CrossRef]
- Wambugu, N.; Chen, Y.; Xiao, Z.; Tan, K.; Wei, M.; Liu, X.; Li, J. Hyperspectral Image Classification on Insufficient-Sample and Feature Learning Using Deep Neural Networks: A Review. Int. J. Appl. Earth Obs. Geoinf. 2021, 105, 102603. [Google Scholar] [CrossRef]
- Nghiyalwa, H.S.; Urban, M.; Baade, J.; Smit, I.P.J.; Ramoelo, A.; Mogonong, B.; Schmullius, C. Spatio-Temporal Mixed Pixel Analysis of Savanna Ecosystems: A Review. Remote Sens. 2021, 13, 3870. [Google Scholar] [CrossRef]
- Xu, S.; Pan, X.; Li, E.; Wu, B.; Bu, S.; Dong, W.; Xiang, S.; Zhang, X. Automatic Building Rooftop Extraction from Aerial Images via Hierarchical RGB-D Priors. IEEE Trans. Geosci. Remote Sens. 2018, 56, 7369–7387. [Google Scholar] [CrossRef]
- Fang, L.; Li, S.; Duan, W.; Ren, J.; Benediktsson, J.A. Classification of Hyperspectral Images by Exploiting Spectral-Spatial Information of Superpixel via Multiple Kernels. IEEE Trans. Geosci. Remote Sens. 2015, 53, 6663–6674. [Google Scholar] [CrossRef]
- Kang, X.; Xiang, X.; Li, S.; Benediktsson, J.A. PCA-Based Edge-Preserving Features for Hyperspectral Image Classification. IEEE Trans. Geosci. Remote Sens. 2017, 55, 7140–7151. [Google Scholar] [CrossRef]
- Laliberte, A.S.; Rango, A.; Havstad, K.M.; Paris, J.F.; Beck, R.F.; McNeely, R.; Gonzalez, A.L. Object-Oriented Image Analysis for Mapping Shrub Encroachment from 1937 to 2003 in Southern New Mexico. Remote Sens. Environ. 2004, 93, 198–210. [Google Scholar] [CrossRef]
- Mountrakis, G.; Im, J.; Ogole, C. Support Vector Machines in Remote Sensing: A Review. ISPRS J. Photogramm. Remote Sens. 2011, 66, 247–259. [Google Scholar] [CrossRef]
- Zhou, Y.; Li, J.; Feng, L.; Zhang, X.; Hu, X. Adaptive Scale Selection for Multiscale Segmentation of Satellite Images. IEEE J. Sel. Top. Appl. Earth Obs. Remote Sens. 2017, 10, 3641–3651. [Google Scholar] [CrossRef]
- Shen, Y.; Chen, J.; Xiao, L.; Pan, D. Optimizing Multiscale Segmentation with Local Spectral Heterogeneity Measure for High Resolution Remote Sensing Images. ISPRS J. Photogramm. Remote Sens. 2019, 157, 13–25. [Google Scholar] [CrossRef]
- Gao, S.H.; Cheng, M.M.; Zhao, K.; Zhang, X.Y.; Yang, M.H.; Torr, P. Res2Net: A New Multi-Scale Backbone Architecture. IEEE Trans Pattern Anal. Mach. Intell. 2021, 43, 652–662. [Google Scholar] [CrossRef] [PubMed]
- Jaihuni, M.; Khan, F.; Lee, D.; Basak, J.K.; Bhujel, A.; Moon, B.E.; Park, J.; Kim, H.T. Determining Spatiotemporal Distribution of Macronutrients in a Cornfield Using Remote Sensing and a Deep Learning Model. IEEE Access 2021, 9, 30256–30266. [Google Scholar] [CrossRef]
- Yuan, Q.; Shen, H.; Li, T.; Li, Z.; Li, S.; Jiang, Y.; Xu, H.; Tan, W.; Yang, Q.; Wang, J.; et al. Deep Learning in Environmental Remote Sensing: Achievements and Challenges. Remote Sens. Environ. 2020, 241, 11716. [Google Scholar] [CrossRef]
- Xu, Z.-F.; Jia, R.-S.; Yu, J.-T.; Yu, J.-Z.; Sun, H.-M. Fast Aircraft Detection Method in Optical Remote Sensing Images Based on Deep Learning. J. Appl. Remote Sens. 2021, 15, 014502. [Google Scholar] [CrossRef]
- Odebiri, O.; Mutanga, O.; Odindi, J.; Naicker, R.; Masemola, C.; Sibanda, M. Deep Learning Approaches in Remote Sensing of Soil Organic Carbon: A Review of Utility, Challenges, and Prospects. Environ. Monit. Assess. 2021, 193, 802. [Google Scholar] [CrossRef]
- Shelhamer, E.; Long, J.; Darrell, T. Fully Convolutional Networks for Semantic Segmentation. IEEE Trans. Pattern Anal. Mach. Intell. 2017, 39, 640–651. [Google Scholar] [CrossRef] [PubMed]
- Badrinarayanan, V.; Kendall, A.; Cipolla, R. SegNet: A Deep Convolutional Encoder-Decoder Architecture for Image Segmentation. IEEE Trans. Pattern Anal. Mach. Intell. 2017, 39, 2481–2495. [Google Scholar] [CrossRef]
- Chen, L.C.; Papandreou, G.; Kokkinos, I.; Murphy, K.; Yuille, A.L. DeepLab: Semantic Image Segmentation with Deep Convolutional Nets, Atrous Convolution, and Fully Connected CRFs. IEEE Trans. Pattern Anal. Mach. Intell. 2018, 40, 834–848. [Google Scholar] [CrossRef]
- Yao, X.; Yang, H.; Wu, Y.; Wu, P.; Wang, B.; Zhou, X.; Wang, S. Land Use Classification of the Deep Convolutional Neural Network Method Reducing the Loss of Spatial Features. Sensors 2019, 19, 2792. [Google Scholar] [CrossRef]
- Wambugu, N.; Chen, Y.; Xiao, Z.; Wei, M.; Aminu Bello, S.; Marcato Junior, J.; Li, J. A Hybrid Deep Convolutional Neural Network for Accurate Land Cover Classification. Int. J. Appl. Earth Obs. Geoinf. 2021, 103, 102515. [Google Scholar] [CrossRef]
- Shan, L.; Wang, W. DenseNet-Based Land Cover Classification Network with Deep Fusion. IEEE Geosci. Remote Sens. Lett. 2022, 19, 2500705. [Google Scholar] [CrossRef]
- Zuo, R.; Zhang, G.; Zhang, R.; Jia, X. A Deformable Attention Network for High-Resolution Remote Sensing Images Semantic Segmentation. IEEE Trans. Geosci. Remote Sens. 2022, 60, 4406314. [Google Scholar] [CrossRef]
- Boulila, W.; Sellami, M.; Driss, M.; Al-Sarem, M.; Safaei, M.; Ghaleb, F.A. RS-DCNN: A Novel Distributed Convolutional-Neural-Networks Based-Approach for Big Remote-Sensing Image Classification. Comput. Electron. Agric. 2021, 182, 106014. [Google Scholar] [CrossRef]
- Xie, J.; Fang, L.; Zhang, B.; Chanussot, J.; Li, S. Super Resolution Guided Deep Network for Land Cover Classification from Remote Sensing Images. IEEE Trans. Geosci. Remote Sens. 2022, 60, 5611812. [Google Scholar] [CrossRef]
- Gao, H.; Guo, J.; Guo, P.; Chen, X. Classification of Very-high-spatial-resolution Aerial Images Based on Multiscale Features with Limited Semantic Information. Remote Sens 2021, 13, 364. [Google Scholar] [CrossRef]
- Jin, B.; Ye, P.; Zhang, X.; Song, W.; Li, S. Object-Oriented Method Combined with Deep Convolutional Neural Networks for Land-Use-Type Classification of Remote Sensing Images. J. Indian Soc. Remote Sens. 2019, 47, 951–965. [Google Scholar] [CrossRef]
- Wu, Y.; Zhang, P.; Wu, J.; Li, C. Object-Oriented and Deep-Learning-Based High-Resolution Mapping from Large Remote Sensing Imagery. Can. J. Remote Sens. 2021, 47, 396–412. [Google Scholar] [CrossRef]
- Zhang, P.; Ke, Y.; Zhang, Z.; Wang, M.; Li, P.; Zhang, S. Urban Land Use and Land Cover Classification Using Novel Deep Learning Models Based on High Spatial Resolution Satellite Imagery. Sensors 2018, 18, 3717. [Google Scholar] [CrossRef]
- Tong, X.Y.; Xia, G.S.; Lu, Q.; Shen, H.; Li, S.; You, S.; Zhang, L. Land-Cover Classification with High-Resolution Remote Sensing Images Using Transferable Deep Models. Remote Sens. Environ. 2020, 237, 111322. [Google Scholar] [CrossRef]
- Kong, F.; Li, X.; Wang, H.; Xie, D.; Li, X.; Bai, Y. Land Cover Classification Based on Fused Data from GF-1 and MODIS NDVI Time Series. Remote Sens. 2016, 8, 741. [Google Scholar] [CrossRef]
- Liu, X.; Ji, L.; Zhang, C.; Liu, Y. A Method for Reconstructing NDVI Time-Series Based on Envelope Detection and the Savitzky-Golay Filter. Int. J. Digit. Earth 2022, 15, 553–584. [Google Scholar] [CrossRef]
- Yang, Y.; Wu, T.; Zeng, Y.; Wang, S. An Adaptive-Parameter Pixel Unmixing Method for Mapping Evergreen Forest Fractions Based on Time-Series Ndvi: A Case Study of Southern China. Remote Sens. 2021, 13, 4678. [Google Scholar] [CrossRef]
- Zhu, X.; Xiao, G.; Zhang, D.; Guo, L. Mapping Abandoned Farmland in China Using Time Series MODIS NDVI. Sci. Total Environ. 2021, 755, 142651. [Google Scholar] [CrossRef] [PubMed]
- Xi, H.; Cui, W.; Cai, L.; Chen, M.; Xu, C. Spatiotemporal Evolution Characteristics of Ecosystem Service Values Based on NDVI Changes in Island Cities. IEEE Access 2021, 9, 12922–12931. [Google Scholar] [CrossRef]
- Verhoeven, V.B.; Dedoussi, I.C. Annual Satellite-Based NDVI-Derived Land Cover of Europe for 2001–2019. J. Environ. Manage. 2022, 302, 113917. [Google Scholar] [CrossRef]
- Ang, Y.; Shafri, H.Z.M.; Lee, Y.P.; Abidin, H.; Bakar, S.A.; Hashim, S.J.; Che’Ya, N.N.; Hassan, M.R.; Lim, H.S.; Abdullah, R. A Novel Ensemble Machine Learning and Time Series Approach for Oil Palm Yield Prediction Using Landsat Time Series Imagery Based on NDVI. Geocarto. Int. 2022, 1–32. [Google Scholar] [CrossRef]
- Zhang, X.; Liu, K.; Wang, S.; Long, X.; Li, X. A Rapid Model (Cov_psdi) for Winter Wheat Mapping in Fallow Rotation Area Using Modis Ndvi Time-Series Satellite Observations: The Case of the Heilonggang Region. Remote Sens. 2021, 13, 4870. [Google Scholar] [CrossRef]
- Kasoro, F.R.; Yan, L.; Zhang, W.; Asante-Badu, B. Spatial and Temporal Changes of Vegetation Cover in China Based on Modis Ndvi. Appl. Ecol. Environ. Res. 2021, 19, 1371–1390. [Google Scholar] [CrossRef]
- Guo, Y.; Li, Z.; Chen, E.; Zhang, X.; Zhao, L.; Chen, Y.; Wang, Y. A Deep Learning Method for Forest Fine Classification Based on High Resolution Remote Sensing Images: Two-Branch FCN-8s. Linye Kexue/Sci. Silvae Sin. 2020, 56, 48–60. [Google Scholar]
- Wu, Y.; He, K. Group Normalization. Int. J. Comput. Vis. 2020, 128, 742–755. [Google Scholar] [CrossRef]
- Yu, D.; Yang, J.; Zhang, Y.; Yu, S. Additive DenseNet: Dense Connections Based on Simple Addition Operations. J. Intell. Fuzzy Syst. 2021, 40, 5015–5025. [Google Scholar] [CrossRef]
- Ioffe, S.; Szegedy, C. Batch Normalization: Accelerating Deep Network Training by Reducing Internal Covariate Shift. In Proceedings of the 32nd International Conference on Machine Learning, ICML 2015, Lille, France, 6–11 July 2015; Volume 1, pp. 448–456. [Google Scholar]
- Yu, L.; Zeng, Z.; Liu, A.; Xie, X.; Wang, H.; Xu, F.; Hong, W. A Lightweight Complex-Valued DeepLabv3+ for Semantic Segmentation of PolSAR Image. IEEE J. Sel. Top. Appl. Earth Obs. Remote Sens. 2022, 15, 930–943. [Google Scholar] [CrossRef]
- Ronneberger, O.; Fischer, P.; Brox, T. U-Net: Convolutional Networks for Biomedical Image Segmentation. In Proceedings of the Lecture Notes in Computer Science (Including Subseries Lecture Notes in Artificial Intelligence and Lecture Notes in Bioinformatics), Munich, Germany, 5–9 October 2015; Volume 9351, pp. 234–241. [Google Scholar]
- Xie, G.; Zhang, C.; Zhen, L.; Zhang, L. Dynamic Changes in the Value of China’s Ecosystem Services. Ecosyst. Serv. 2017, 26, 146–154. [Google Scholar] [CrossRef]
- Li, T.; Cui, Y.; Liu, A. Spatiotemporal Dynamic Analysis of Forest Ecosystem Services Using “Big Data”: A Case Study of Anhui Province, Central-Eastern China. J. Clean. Prod. 2017, 142, 589–599. [Google Scholar] [CrossRef]
Publisher’s Note: MDPI stays neutral with regard to jurisdictional claims in published maps and institutional affiliations. |
© 2022 by the authors. Licensee MDPI, Basel, Switzerland. This article is an open access article distributed under the terms and conditions of the Creative Commons Attribution (CC BY) license (https://creativecommons.org/licenses/by/4.0/).

