Abstract
Floods are often associated with hurricanes making landfall. When tropical cyclones/hurricanes make landfall, they are usually accompanied by heavy rainfall and storm surges that inundate coastal areas. The worst natural disaster in the United States, in terms of loss of life and property damage, was caused by hurricane storm surges and their associated coastal flooding. To monitor coastal flooding in the areas affected by hurricanes, we used data from sensors aboard the operational Polar-orbiting and Geostationary Operational Environmental Satellites. This study aims to apply a downscaling model to recent severe coastal flooding events caused by hurricanes. To demonstrate how high-resolution 3D flood mapping can be made from moderate-resolution operational satellite observations, the downscaling model was applied to the catastrophic coastal flooding in Florida due to Hurricane Ian and in New Orleans due to Hurricanes Ida and Laura. The floodwater fraction data derived from the SNPP/NOAA-20 VIIRS (Visible Infrared Imaging Radiometer Suite) observations at the original 375 m resolution were input into the downscaling model to obtain 3D flooding information at 30 m resolution, including flooding extent, water surface level and water depth. Compared to a 2D flood extent map at the VIIRS’ original 375 m resolution, the downscaled 30 m floodwater depth maps, even when shown as 2D images, can provide more details about floodwater distribution, while 3D visualizations can demonstrate floodwater depth more clearly in relative to the terrain and provide a more direct perception of the inundation situations caused by hurricanes. The use of 3D visualization can help users clearly see floodwaters occurring over various types of terrain conditions, thus identifying a hazardous flood from non-hazardous flood types. Furthermore, 3D maps displaying floodwater depth may provide additional information for rescue efforts and damage assessments. The downscaling model can help enhance the capabilities of moderate-to-coarse resolution sensors, such as those used in operational weather satellites, flood detection and monitoring.
1. Introduction
Tropical cyclones/hurricanes are the most destructive natural disaster affecting the highly populated East Coast and Gulf Coast of the United States. One of the major threats associated with hurricanes is flooding due to heavy rainfall and storm surges. Storm surges can inundate low-lying coastal areas, damage property and utilities, block evacuation roads and drown people. As hurricane activity has shown an increasing trend in recent decades, with more and more people moving to low-lying coastal areas, flood risks are increasingly being associated with loss of life, property, infrastructure and utilities, as demonstrated by Hurricanes Katrina and Rita in 2005 and Hurricane Harvey in 2017.
Flooding itself is the most frequent and devastating natural hazards all around the world [1,2,3,4,5,6,7,8,9,10]. Satellite-based flood maps are proven to be very helpful in the accurate analysis and evaluation of flooding events [6,7,8,9,10,11,12,13,14,15]. Near real-time flood products, as represented by the floodwater fraction, have been derived from the VIIRS (Visible Infrared Imaging Radiometer Suite) imagery [8,9,10,11,12,13,14,15]. The VIIRS imagery [16] has a wide swath coverage of 3000 km and a relatively constant moderate spatial resolution of 375 m across the scan. These advantages make VIIRS imagery very attractive for daily flood mapping over large areas.
Currently, the VIIRS flood mapping system is based on a two-dimensional (2D) visualization to show the extent of flooding [17]; however, 2D flood maps cannot provide water level information. Adding a third dimension, such as floodwater surface level and depth, may represent the real world better, enabling users to realize the severity of flooding by comparing the floodwater depth with the heights of familiar objects. Floodwater depth can be measured by satellite altimetry data [18,19,20]. However, due to limitations in the orbit/swath coverages of satellite altimeters, it is hard to measure the floodwater levels of entirely inundated areas, especially when related to large-scale hurricane flooding. Several approaches have been proposed to generate three-dimensional (3D) inundation maps from remote sensing imagery, such as the pioneering work of Miller et al. in 1958 [21], and the recent research and applications by Meesuk et al. in 2012 [22], Meesuk et al. in 2015 [23], Hashemi-Beni et al. in 2018 [24] and Gebrehiwot and Hashemi-Beni in 2020 [25] and 2021 [26]. In these works, a Structure from Motion (SfM) approach was investigated and used to construct 3D structures from a series of overlapping 2D images, and a Digital Elevation Model (DEM) was utilized for 3D flood mapping. As indicated by Watts et al. in 2012 [27] and Remondino et al. in 2014 [28], the success of the SfM method is controlled by: the resolution quality of the 2D images; the degree of the image overlap; the relative motion of the camera regarding the scene; and the existence of sharp edges. Gebrehiwot and Hashemi-Beni [25,26] summarized the challenges of using the SfM method for 3D flood mapping as follows: (1) it may be affected by poor weather conditions, especially the strong winds during flooding events; (2) the ground control points (GCPS) may not be available; and (3) the tie-points for image calibration may not be sufficient due to the homogenous water surface. Moreover, it needs to reclassify the noisy point clouds derived from the SfM to determine the flooding extent; thus, it may be difficult to identify the flooded areas from the SfM-based 3D map. With the rapid development of Geographic Information Systems (GIS), some researchers have proposed to estimate the depth of floodwaters using remote-sensing-based flood extent maps [29,30,31,32,33,34,35]. Schumann et al. [29] and Matgen et al. [30] used a regression method to estimate floodwater depths from the flood extent and DEM data. Huang et al. [31] combined satellite optical images with the DEM data to estimate floodwater depth, based on the assumption that the flood surface was flat. The water surface level was estimated by applying a kriging interpolation method. Cian et al. [32] proposed a similar method to estimate floodwater depth by combining the flood extent, derived from the Synthetic-Aperture Radar (SAR) imagery, with the DEM. Firstly, they made floodwater classification maps in the same region at two different times or dates before and after the flooding event; then, they obtained a flood map by comparing the two water classification maps and then estimated floodwater height from the DEM by using a statistical analysis of the terrain of the flooded areas. Recently, Manfreda et al. [33] proposed a geomorphic flood index (GFI) based on the DEM to predict floodwater depth. The GFI is defined as the logarithm of the ratio between the river depth, hr, and the difference in elevation, H, between the location under examination and the elements of the river network closest to it: GFI = ln(hr/H); then, water depth (WD) can be estimated as WD = hr − H. The GFI method can provide indications about flood hazard exposure; moreover, it can offer a potential way to estimate the maximum inundation depth. It is especially helpful for river flooding, in large-scale analyses, and in regions where data are sparse. However, this method takes the flow accumulation values for the entire river basin or sub-basin as the input for floodwater depth prediction; therefore, the water depth results are only reliable for large areas in a river basin or sub-basin, and makes this method inapplicable for small-scale river flooding or floods over a land area not adjacent to a river.
The accuracy of the floodwater depth estimation highly relies on the flood extent map [34,35,36]. The flood extent map derived from the VIIRS imagery showed a high accuracy [8,9,10,11,12,13,14,15]. This study presents an application of a downscaling model for high-resolution 3D mapping of coastal flooding due to hurricanes and to derive 3D floodwater surface levels and depths from 2D flooding water fraction maps derived from the VIIRS imagery. Under certain topographic conditions, floodwater fractions can be used to estimate water surface levels and floodwater depths. Floodwater depths at high resolution can be estimated using moderate-resolution operational satellite JPSS series and GOES-R series using a downscaling model.
2. Data and Methods
2.1. Data Used
The following datasets were used for 3D flood mapping:
Flood extent maps as represented by floodwater fractions derived from the VIIRS imagery and GOES-R Advanced Baseline Imager (ABI) observations [17].
A series of ancillary datasets are collected and reprocessed, including:
- The DEM from the Shuttle Radar Topography Mission Version 3 (SRTM-3) and the SRTM Water Body Dataset (SWBD) at 30-m resolution over continental U. S. (CONUS) [37];
- The IGBP land cover data at 30 m resolution over the CONUS;
- The tree cover dataset at 30 m resolution [38];
- The National Hydrography Dataset (NHD) Plus V2.0 water sheds and river lines over the CONUS [39];
- River gauge height data are used to validate the water surface levels and can be obtained from the United States Geological Survey (USGS) (https://waterdata.usgs.gov/nwis/uv?referred_module=sw) (accessed on 28 October 2022).
All these datasets play important roles in the downscaling process. More details about the methodology can be found in Li et al. (2022) [40].
2.2. Methods
The development of the downscaling model will still be based on the inundation mechanism expressed in Equation (1):
where is the satellite-retrieved water fraction or area in a pixel, including open water areas, and the weighted contribution of the water area veiled by vegetation cover or urban constructions; is a pixel’s minimum surface elevation; is a pixel’s maximum inundated surface elevation; is the weight of land type at height in a pixel at the original resolution; and is the total area of land type at height .
In Equation (1), can be obtained from the SRTM-3/DEM, the weight matrix of land types () can be empirically derived by combining the 30 m National Land Cover Dataset (NLCD) and the National Tree Cover Dataset (NTCD) or the Global Landsat Land Cover Dataset, and can also be obtained from the DEM, land cover and tree cover datasets. Therefore, , which is the floodwater surface level of a pixel, can be calculated using Equation (1). With the retrieved water surface levels, the floodwater depth can be calculated simply by subtracting ground elevations from the water surface levels:
where , is the height of the water surface level of pixel i; is the earth’s surface elevation before flooding and can be obtained from the pre-flood DEM; and FWD is the floodwater depth. The elevation difference between the 3D water surface height ( and its corresponding pixel i on the DEM () gives the floodwater depth for the pixel i (FWDi).
Although the preliminary tests from this method have shown promising results [5,6,12], there are still uncertainties that may cause significant errors, especially when there are few flood pixels in a floodwater polygon. The original method only utilizes the information of floodwater pixels, yet it ignores the non-flooded pixels. However, the non-flooded pixels adjacent to the flooded pixels contain very important information which can be used to improve the accuracy of the retrieved floodwater surface levels. In this study, based on the conception of water flow, if a pixel adjacent to a floodwater pixel is not inundated, then the retrieved water levels should be at a height that no water can flow from the current pixel to adjacent non-flooded pixels through a buffer analysis. Based on this method, the water surface level of each floodwater polygon can be corrected. Since this study focuses on applications, more details about the methodology can be found in Li et al. (2022) [40].
3. Results
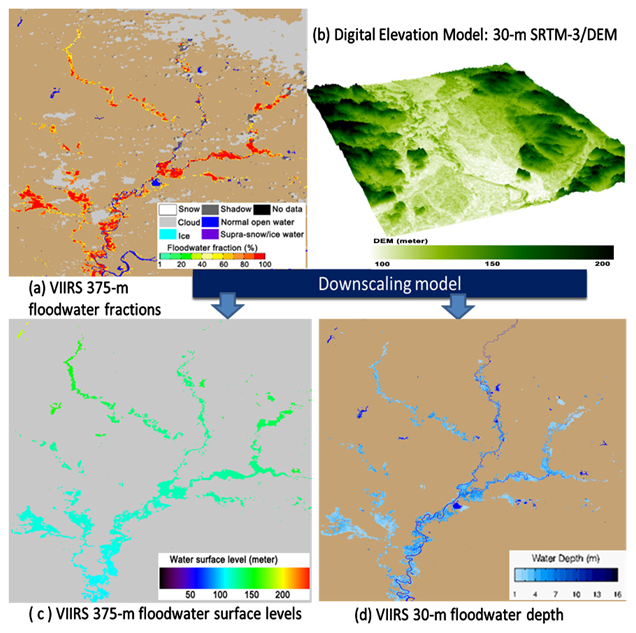
Figure 1 illustrates the downscaling process and the inputs and outputs for the downscaling model. Using VIIRS as an example, when the VIIRS floodwater fraction data at the original 375 m resolution (Figure 1a) are combined with high-resolution DEM data (Figure 1b) using the downscaling process, the floodwater surface level at VIIRS 375 m resolution (Figure 1c) and a high-resolution floodwater depth map (Figure 1d) can be derived.
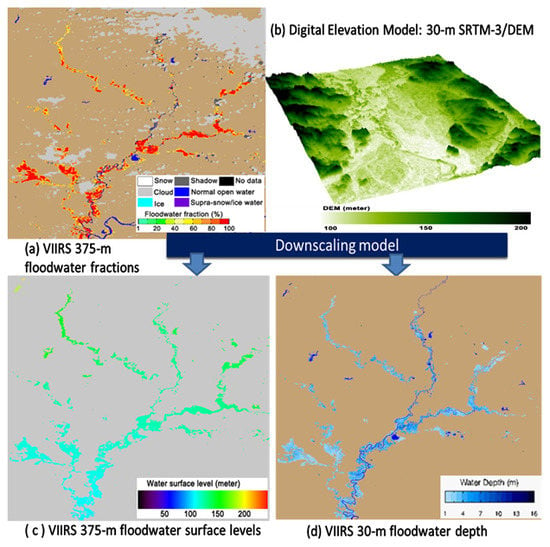
Figure 1.
An example of VIIRS 3D flood products along the Ohio River Basin on 9 May, 2017: (a) VIIRS 375 m floodwater fraction map; (b) high-resolution DEM map; (c) VIIRS 375 m floodwater surface level map; and (d) VIIRS 30 m floodwater depth map.
Recently, Hurricane Ian made landfall in southwest Florida on 28 September, 2022 as a strong, deadly and destructive Category 4 hurricane, causing widespread damage across the southeast United States, especially in the states of Florida and South Carolina. Hurricane Ian became the fifth-strongest hurricane on record to make landfall on continental United States (CONUS). Ian resulted in catastrophic damages amounting to economic losses over $50 billion, mostly from flooding caused by extremely heavy rainfall and storm surges in parts of Southwest Florida, especially in the cities of Fort Myers Beach and Naples. Hurricane Ian caused at least 147 deaths in total, including 136 in Florida [41].
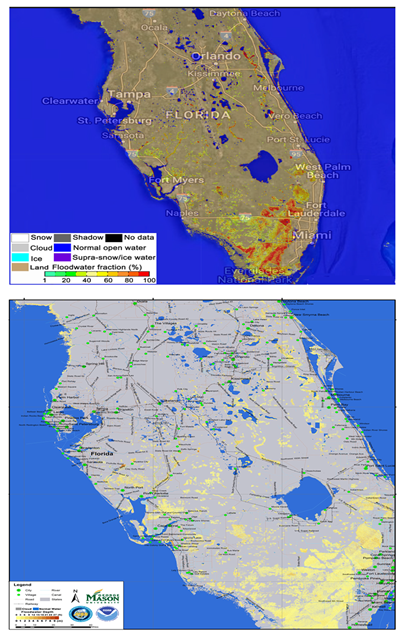
The VIIRS flood map at the original 375 m resolution can provide a big picture of the flooding situation in the whole Florida region (Figure 2). It shows that although Hurricane Ian made landfall in southwest Florida, which did experience severe flooding, especially around the Fort Myers area, flooding also occurred to a large extent in Southern Florida. This is because the movement of the hurricane itself enhanced the wind speed and caused the strongest winds and the highest storm surge along the right-hand side of the storm track. Fortunately, although southern Florida, near the Everglades National Park, is a marshland area and can easily become inundated in periods of rain, it is used as a park, so the floodwaters there did not cause severe damages.
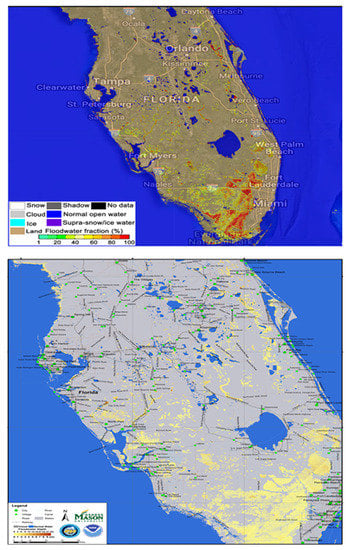
Figure 2.
VIIRS flood map at the original 375 m resolution (upper) and the downscaled 30 m floodwater depths (lower) in Florida due to Hurricane Ian on 30 September 2022.
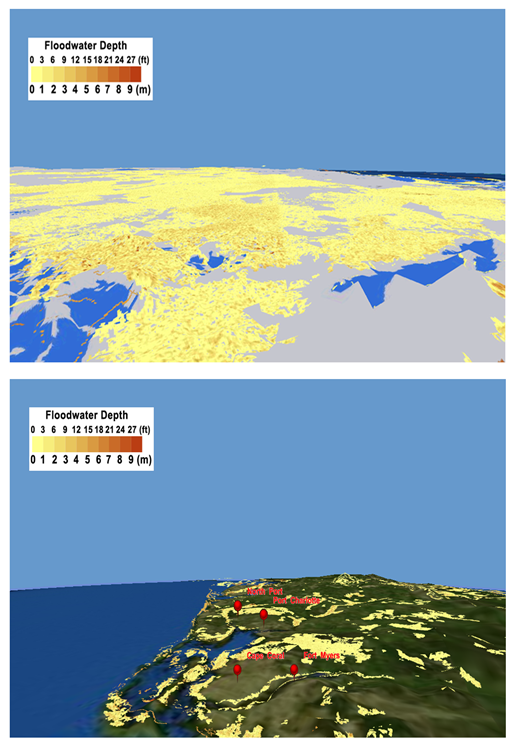
The downscaled or enhanced 30 m flood water depth map shown in Figure 3 (lower) further confirms this flooding distribution in greater detail. The 3D floodwater depth map in Figure 4 (upper) emphasizes southern Florida’s flooding situation, in particular. Since the flooding in southern Florida did not cause severe damage, and the most severe damage occurred near the Fort Myers area, we also generated a 3D flood map for southwest Florida near the Fort Myers region, where severe flooding caused catastrophic damage. From Figure 4, it is very interesting to compare the differences between the floodwaters in southern Florida, near the Everglades National Park, and in southwest Florida, near Fort Myers. We can see how the flooding in southern Florida occurred over the flat wetlands and was a “non-hazard” type of flood, while the flooding in Southwest Florida occurred in cities and over complex coastal terrains, especially in Fort Myers, Cape Coral, North Port and near Port Charlotte. This is the type of real “hazard” flooding, which can cause significant damage.
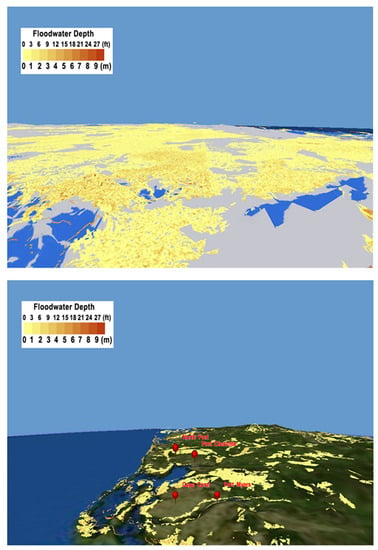
Figure 3.
The 3D visualization of the VIIRS downscaled 30 m floodwater depths in southern Florida (Upper) and southwest Florida (Lower) on 30 September 2022 by using the ArcGlobe.
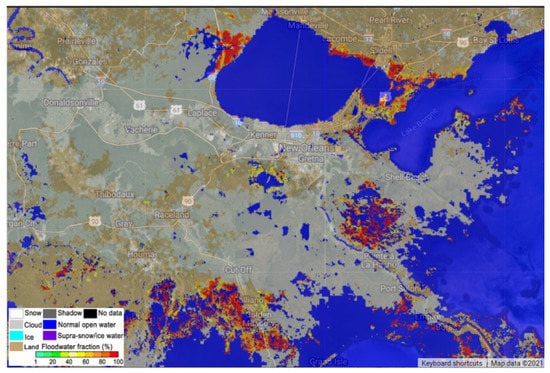
Figure 4.
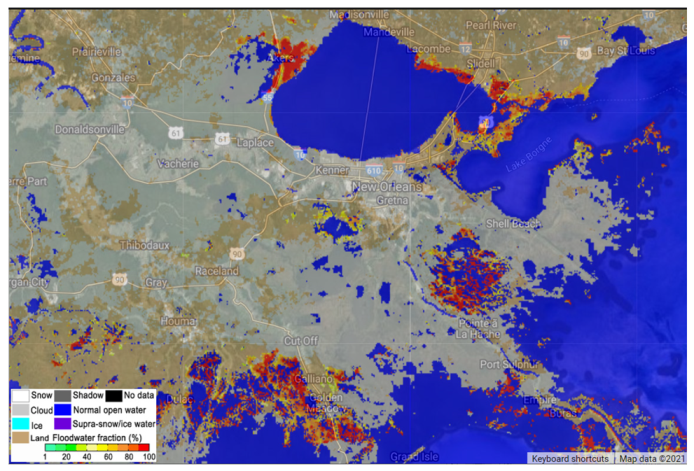
VIIRS map of flooding caused by Hurricane Ida in the Louisiana region on 31 August 2021.
One year ago, Hurricane Ida made landfall near Port Fourchon in Louisiana on 29 August 2021, as a deadly and destructive Category 4 hurricane. Ida became the second-most damaging hurricane in the Atlantic basin on record, only behind Hurricane Katrina, and is tied for the strongest landfall hurricane in the state by maximum winds with Hurricane Laura a year prior. Hurricane Ida brought severe storm surges and caused catastrophic flooding along the Gulf Coast and East Coast of the United States.
As shown in Figure 4, most areas seen by VIIRS at the original 375 m resolution on 31 August 2021 showed more moist marshland (top right) than floodwater. Severe flooding can be found south and east of New Orleans and in the southeast of Louisiana.
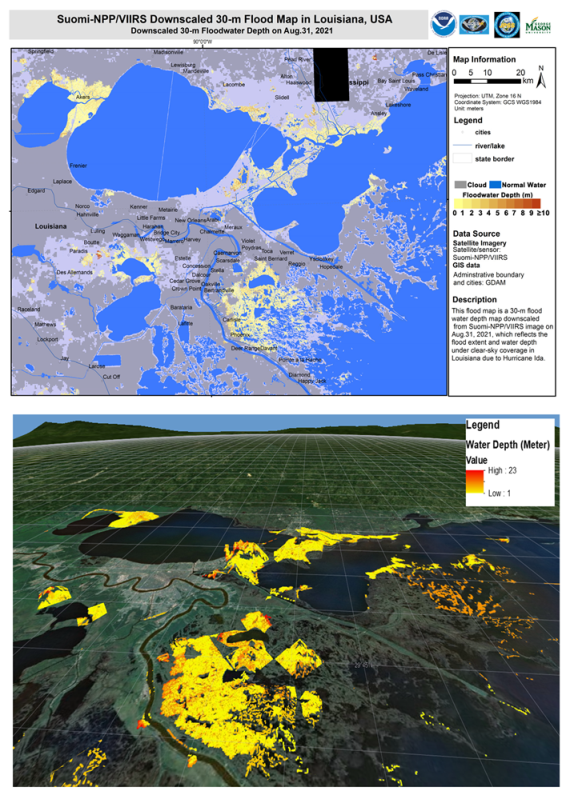
From the VIIRS floodwater fraction and the high-resolution DEM data, with the downscaling model, we can derive 3D floodwater information at high resolution. Figure 5 (upper) demonstrates the downscaled 30 m floodwater depth derived from the VIIRS floodwater fraction data in the New Orleans region due to Hurricane Ida on 31 August 2021. In the downscaled VIIRS 30 m floodwater depth maps, the pixels in blue indicate normal water bodies, and the floodwater depth is in meters and displayed in yellow, brown and red, as represented in the scale bar. Detailed analysis with the enhanced 30 m flood map showed that there appears to be continued flooding, potentially impacting some urban areas along the northern edge of Lake Pontchartrain (Figure 5). With the recent advancement of ArcGIS, floodwater depth in a 3D view can be illustrated with ArcGlobe, as shown in Figure 5 (lower). In this 3D map, to demonstrate the floodwater depth more clearly, the clouds and shadows in Figure 5 (upper) are removed and the floodwater depths are represented by a yellow–red color scale. As compared to the 2D flood map shown in Figure 4, we can see that the high-resolution 3D map demonstrates floodwater depth more clearly in the east and south of New Orleans. Hurricane Ida caused catastrophic flooding with more than 10 m floodwater depths in some parts of southeast Louisiana.
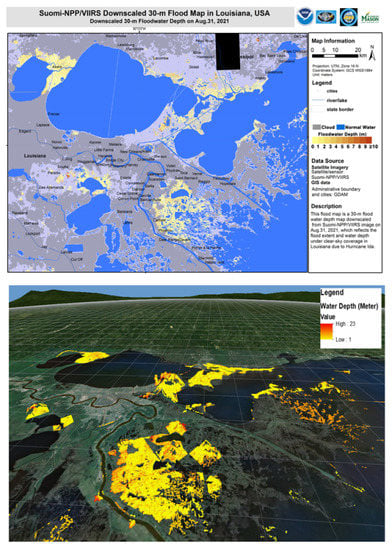
Figure 5.
VIIRS downscaled 30 m floodwater depths in the New Orleans region due to Hurricane Ida on 31 August 2021 (upper); the corresponding 3D view of the VIIRS downscaled 30 m floodwater depth using the ArcGlobe (lower).
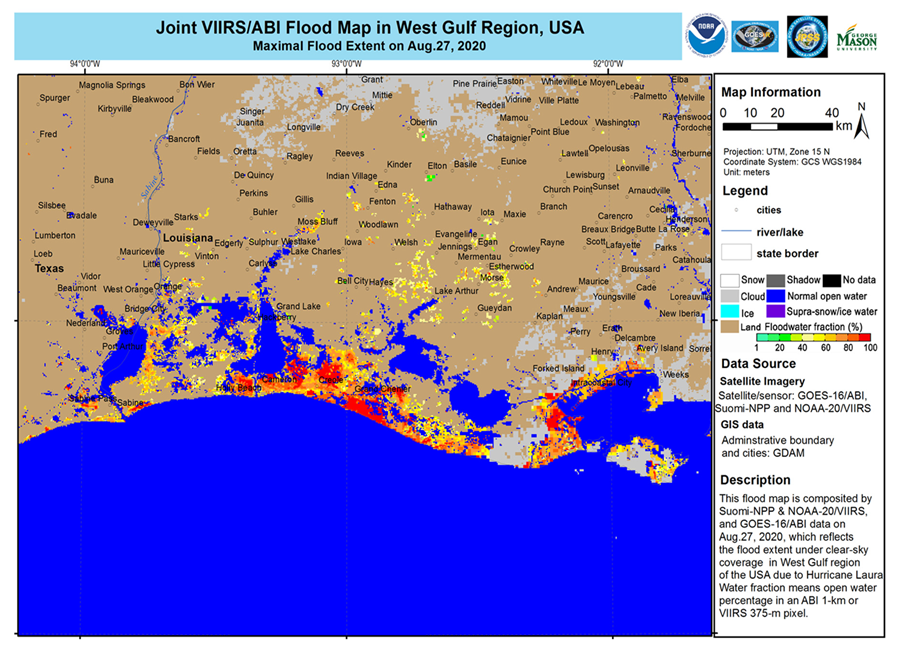
Two years ago, on August 27, 2020, Hurricane Laura made landfall at Cameron, Louisiana as a deadly and destructive hurricane, causing nearly 10-foot-high storm surges and severe flooding in the Cameron region. Figure 4 shows the 2D flood extent map as presented by the floodwater fraction at 375 m resolution derived from the joint VIIRS and ABI data recorded during the flooding event caused by Hurricane Laura in the West Gulf region on 27 August, 2020.
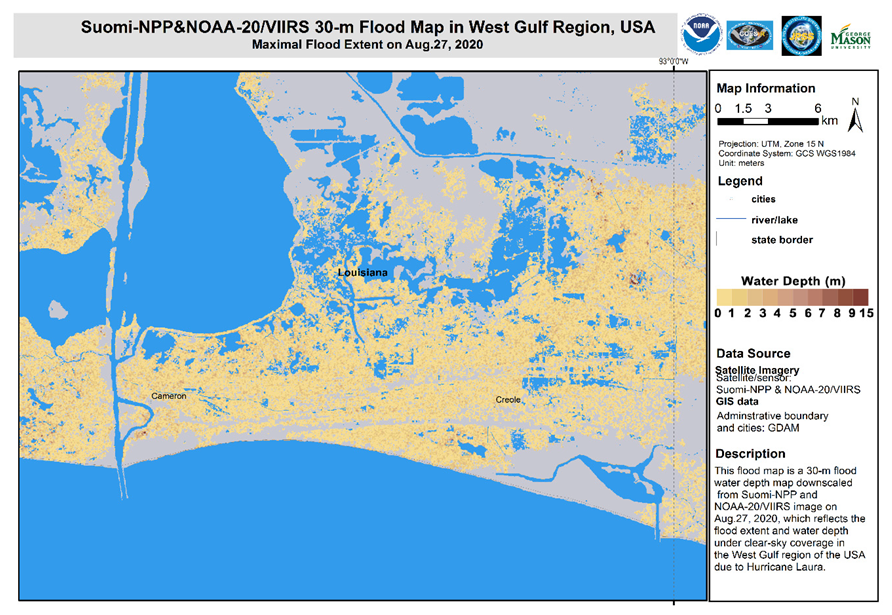
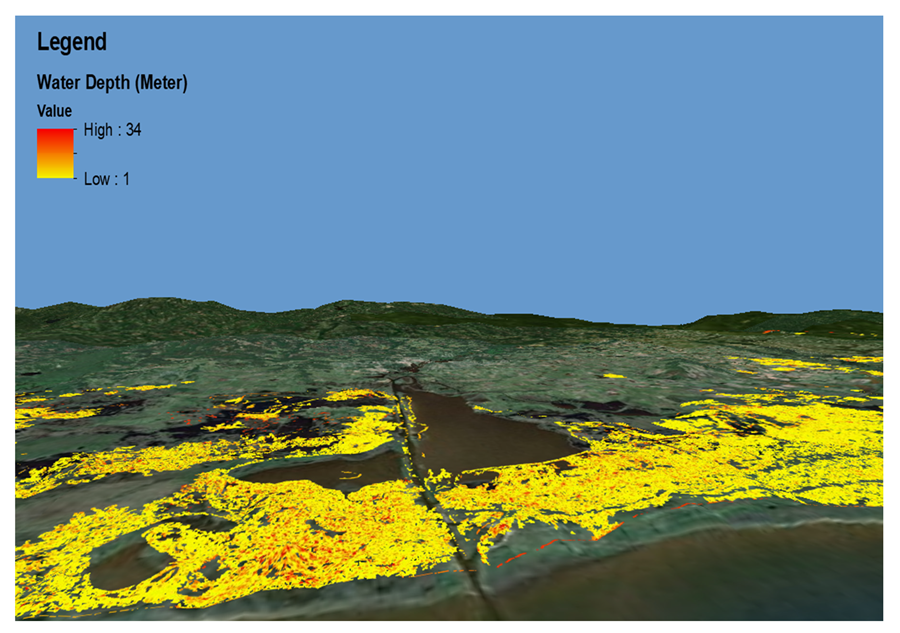
Figure 6 shows the VIIRS flood extent map as represented by floodwater fraction at the original 375 m resolution, while Figure 7 demonstrates the downscaled 30 m floodwater depth derived from the downscalimg model in the West Gulf region due to Hurricane Laura on 27 August, 2020. As compared to the flood map at the original 375 m resolution (Figure 6), the enhanced resolution (30 m) map (Figure 7) provides more detailed flood information. Floodwater depths in the 3D view are illustrated with ArcGlobe, as shown in Figure 8. In comparison to the 2D visualization of the same area, it was found that the 3D map can demonstrate floodwater depths in greater clarity relative to the underlying terrain conditions. It is important to observe the direct perception of the potentially different effects caused by the inundation due to Hurricane Laura in the West Gulf region. The 3D map relating to floodwater depth may provide additional information for rescue efforts and damage assessment.
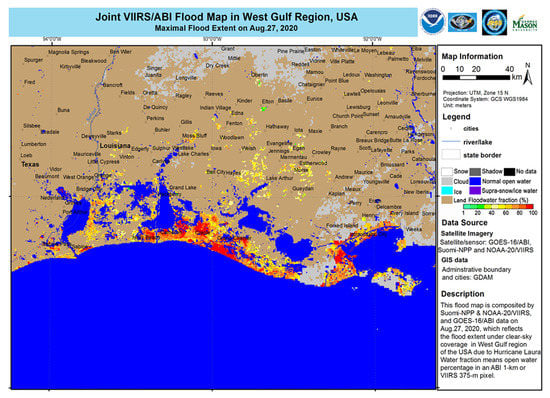
Figure 6.
Blended VIIRS and ABI mapping of the flooding caused by Hurricane Laura in the West Gulf region on 27 August 2020.
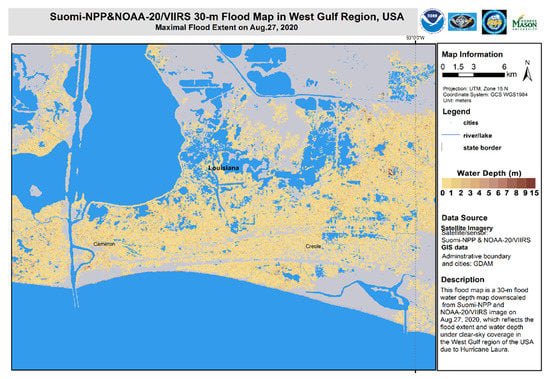
Figure 7.
VIIRS downscaled 30 m floodwater depths in the West Gulf region due to Hurricane Laura on 27 August 2020.
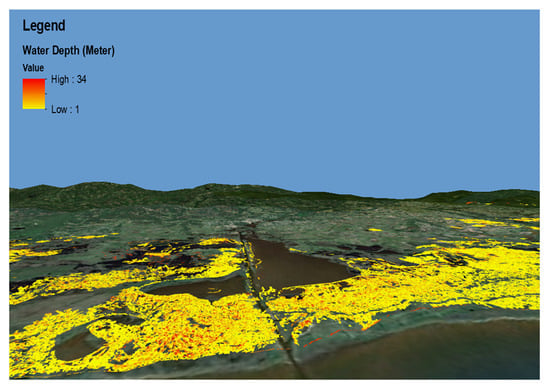
Figure 8.
The 3D view of VIIRS downscaled 30 m floodwater depths in the West Gulf region due to Hurricane Laura on 29 August 2020.
4. Discussion
Operational satellites, such as the NOAA next-generation Joint Polar Satellite System (JPSS) series and the GOES-R series geostationary satellites, have the advantages of frequent revisits and wide spatial coverage which can provide a bigger picture of a flooding event in a large area. However, operational satellites usually have a moderate-to-coarse spatial resolution, which may not provide details of flood information in a local area. Moreover, most current satellite-based flood products are based on the 2D flood extent, which cannot provide water level information. Three-dimensional flood mapping, including floodwater surface levels and depths, may represent the real world more accurately than 2D flood extent maps, so users can directly perceive the severity of the flood by comparing floodwater depths with objects familiar to them. The downscaling model demonstrated in this study can be applied to enhance the spatial resolution of flood maps derived from the moderate-to-course resolution sensors; in addition, it can be utilized to obtain detailed 3D flood maps, which may provide additional information for rescue efforts and damage assessments.
The VIIRS flood mapping products at the original 375 m resolution are now produced by the NOAA operational system. They include four products: a VIIRS global near real-time gridded flood product in granules from Suomi-NPP and NOA-20 between 80°S and 80°N; a VIIRS near-real-time gridded flood product in the U.S. National Weather Service (NWS) domains from Suomi-NPP and NOA-20; a VIIRS global daily composited flood product; and a VIIRS global five-day composited flood product covering global land regions between 60°S and 75°N. Compared to previous studies, the downscaling model demonstrated in this study can be used to automatically generate operational products, which include a 375 m floodwater surface level product, a 30 m floodwater extent product and a 30 m floodwater depth product. The VIIRS Downscaling software has been tested with VIIRS data covering most of the major flood events in the CONUS since 2016. The outputs have been compared with other high-resolution Landsat-8 and Sentinel-2 images, and ground river gauge observations; the results are reasonable and promising. The experimental near-real-time downscaled VIIRS 30 m floodwater depth product in the CONUS has been generating data since December 2020. The latest 10-day products are available at https://floods.ssec.wisc.edu/?products=VIIRS-3Dflood (accessed on 28 October 2022). In this automatic system, the downscaled VIIRS 30 m floodwater depth is still displayed as 2D images. The 3D visualization, as demonstrated in this study, is generated manually with ArcGlobe and thus cannot be produced automatically by our operational system. The experiences recorded in many recent flooding events showed that the enhanced VIIRS floodwater depth maps at 30 m resolution are extremely useful and accurate in assisting flood monitoring and damage assessment. To apply the downscaling model, floodwater fraction data are required as the input. In this study, the input to the downscaling model is the floodwater fraction data derived from the VIIRS observations. Since the VIIRS is an optical sensor, cloud contamination is still an issue. Geostationary satellites, such as the GOES-R series, can provide observations at a 15-minute temporal resolution, which means the GOES-R can capture frequent cloud-free views of floodwaters and provides the possibility to aggregate clear sky observations. As shown in our previous study [8], the frequent GOES-R/ABI observations can help solve some cloud contamination problems in the VIIRS flood maps. Moreover, as shown in Li et al. (2022), concerning the methodology [40], there are some limitations in the SRTM/DEM data over forest areas where the SRTM/DEM may measure the elevation of treetops rather than the elevation of ground under the trees. Future works will aim to use other DEM data to correct the SRTM/DEM data over forest regions, and extend the 3D flood products to global coverage.
5. Conclusions
In this study, a downscaling model was applied to derive 3D flood maps for the severe hurricane flooding in Florida due to Hurricane Ian and around the Louisiana area due to Hurricanes Ida and Laura. When compared to the previously published methods and algorithms for 3D flood mapping, the downscaling model demonstrated in this study can be applied to generate floodwater depths for land floods as well as river flooding and for small-scale as well as large-scale flooding. Moreover, the downscaling model can be run in operational systems to automatically generate 3D flood products at high resolution (30 m in this study), depending on the resolution of the DEM data used. As the input to the downscaling model, the 2D floodwater fraction data are derived from the SNPP/NOAA-20 VIIRS observations. Operational weather satellites such as the SNPP/JPSS and GOES-16 have the strengths of large area coverage and high temporal resolution but usually have moderate-to-coarse spatial resolution. The downscaling model can improve the spatial resolution of these operational satellites to a higher resolution and, furthermore, can obtain 3D flood maps and provide additional information, thus enhancing the capability of operational satellites in flood detection and monitoring. Here, we have taken a recent catastrophic flooding case in Florida, due to Hurricane Ian, as an example, and we present the VIIRS flood map at the original 375 m resolution, which shows a large flood extent in southern Florida. The 2D image of the enhanced 30 m floodwater depth can provide greater detail, but it shows much more flooding in southern Florida than in southwest Florida. The 3D visualization maps can help clearly show the difference between the flooding that occurred in southern Florida and southwest Florida. The large area of floodwaters in southern Florida occurred on flat wetlands and did not cause damage, as the area is used as a national park with a low population and few properties, making this a “non-hazardous” type of flood. Conversely, the flood in southwest Florida occurred over a complex coastal terrain and caused catastrophic damages to nearby cities, including Fort Myers, and this is a real “hazardous” type of flood. Three-dimensional visualizations of floodwater depths can help users see the terrain conditions the floodwaters occurred over more clearly and thus help to identify hazardous floods from non-hazardous floods. Although the 3D visualizations demonstrated in this study are generated manually with ArcGlobe, the floodwater depths at high resolution, even when shown as 2D images, such as those displayed in our operational system, can still provide additional vertical water information, so people can compare water depths to familiar objects and become aware of the threats of deep floodwaters. The downscaled VIIRS 3D flood water depth maps at 30 m resolution were provided to FEMA continuously during flooding events for relief and rescue efforts. The experimental near-real-time, downscaled VIIRS 30 m floodwater depth product in the CONUS has been generated since December 2020 and is currently being extended to global coverage.
Author Contributions
Conceptualization, S.L. and D.S.; methodology, S.L.; software, S.L.; validation, S.L. and D.T.L.; formal analysis, S.L. and D.S.; investigation, S.L. and D.S.; resources, M.G., D.T.L., S.H., D.G. and D.B.; data curation, S.L.; writing—original draft preparation, D.S.; writing—review and editing, D.S., S.L., M.G., D.T.L., D.G., B.S. and L.Z.; visualization, T.Y., S.L. and D.S.; supervision, M.G., D.T.L., B.S. and L.Z.; project administration, B.S., S.H., S.K. and L.Z.; funding acquisition, M.G., D.T.L., L.Z., D.G., D.B. and S.H. All authors have read and agreed to the published version of the manuscript.
Funding
This research was funded by NOAA JPSS Program Office and the GOES-R Program Office through the NSF I/UCRC for Spatiotemporal Thinking, Computing, and Applications.
Acknowledgments
The data reported in the study are presented, archived or available from the NOAA Satellite Proving Ground Global Products Archive System at George Mason University. The VIIRS and ABI flood products are operationally generated at the Space Science and Engineering Center (SSEC) at the University of Wisconsin-Madison and the Geographic Information Network of Alaska (GINA). This work is supported by the NOAA JPSS and GOES-R Program Offices. The contents are solely the opinions of the authors and do not constitute a statement of policy, decision or position on behalf of NOAA or the U. S. Government.
Conflicts of Interest
The authors declare no conflict of interest.
References
- Jongman, B.; Ward, P.J.; Aerts, J.C.J.H. Global exposure to river and coastal flooding: Long term trends and changes. Glob. Environ. Chang. 2012, 22, 823–835. [Google Scholar] [CrossRef]
- Winsemius, H.C.; Aerts, J.C.J.H.; Van Beek, L.P.H.; Bierkens, M.F.P.; Bouwman, A.; Jongman, B.; Kwadijk, J.C.J.; Ligtvoet, W.; Lucas, P.L.; Van Vuuren, D.P.; et al. Global drivers of future river flood risk. Nat. Clim. Chang. 2016, 6, 381–385. [Google Scholar] [CrossRef]
- Guerreiro, S.B.; Dawson, R.J.; Kilsby, C.; Lewis, E.; Ford, A. Future heat-waves, droughts and floods in 571 European cities. Environ. Res. Lett. 2018, 13, 034009. [Google Scholar] [CrossRef]
- Gao, L.; Tao, B.; Miao, Y.; Zhang, L.; Song, X.; Ren, W.; He, L.; Xu, X. A global data set for economic losses of extreme hydrological events during 1960–2014. Water Resour. Res. 2019, 55, 5165–5175. [Google Scholar] [CrossRef]
- Yin, J.; Guo, S.; Gentine, P.; Sullivan, S.C.; Gu, G.; He, S.; Chen, J.; Liu, P. Does the Hook Structure Constrain Future Flood Intensification Under Anthropogenic Climate Warming? Water Resour. Res. 2021, 57, e2020WR028491. [Google Scholar] [CrossRef]
- Huffman, G.J.; Adler, R.F.; Bolvin, D.T.; Nelkin, E.J. The TRMM Multi-Satellite Precipitation Analysis (TMPA). In Satellite Rainfall Applications for Surface Hydrology; Gebremichael, M., Hossain, F., Eds.; Springer: Dordrecht, The Netherlands, 2010. [Google Scholar] [CrossRef]
- Sunilkumar, K.; Narayana Rao, T.; Satheeshkumar, S. Assessment of small-scale variability of rainfall and multi-satellite precipitation estimates using measurements from a dense rain gauge network in Southeast India. Hydrol. Earth Syst. Sci. 2016, 20, 1719–1735. [Google Scholar] [CrossRef]
- Goldberg, M.; Li, S.; Goodman, S.; Lindsey, D.; Sjoberg, B.; Sun, D. Contributions of Operational Satellites in Monitoring the Catastrophic Floodwaters due to Hurricane Harvey. Remote Sens. 2018, 10, 1256. [Google Scholar] [CrossRef]
- Sun, D.; Li, S.; Zheng, W.; Croitoru, A.; Stefanidis, A.; Goldberg, M.D. Mapping floods due to Hurricane Sandy using NPP VIIRS and ATMS data and geotagged Flickr imagery. Int. J. Digit. Earth 2015, 9, 427–441. [Google Scholar] [CrossRef]
- Li, S.; Goldberg, M.; Lindsey, D.; Sjoberg, W.; Zhou, L.; Nandi, S.; Chowdhury, N.; Straka, W., III; Yang, T.; Sun, D. Assessment of the Catastrophic Asia Floods and Potentially Affected Population in Summer 2020 Using VIIRS Flood Products. Remote Sens. 2020, 12, 3176. [Google Scholar] [CrossRef]
- Li, S.; Sun, D.; Yu, Y.; Csiszar, I.; Stefanidis, A.; Goldberg, M.D. A New Shortwave Infrared (SWIR) Method for Quantitative Water Fraction Derivation and Evaluation with EOS/MODIS and Landsat/TM data. IEEE Trans. Geosci. Remote Sens. 2012, 51, 1852–1862. [Google Scholar] [CrossRef]
- Li, S.; Sun, D.; Goldberg, M.D.; Stefanidis, A. Derivation of 30-m-resolution Water Maps from TERRA/MODIS and SRTM. Remote Sens. Environ. 2013, 134, 417–430. [Google Scholar] [CrossRef]
- Li, S.; Sun, D.; Yu, Y. Automatic cloud-shadow removal from flood/standing water maps using MSG/SEVIRI imagery. Int. J. Remote Sens. 2013, 34, 5487–5502. [Google Scholar] [CrossRef]
- Li, S.; Sun, D.; Goldberg, M.D.; Sjoberg, W. Object-based automatic terrain shadow removal from SNPP/VIIRS flood maps. Int. J. Remote Sens. 2015, 36, 5504–5522. [Google Scholar] [CrossRef]
- Li, S.; Sun, D.; Goldberg, M.D.; Sjoberg, W.; Santek, D.; Hoffman, J.P.; De Weese, M.; Restrepo, P.; Lindsey, S.; Holloway, E. Automatic near real-time flood detection using Suomi-NPP/VIIRS data. Remote Sens. Environ. 2017, 204, 672–689. [Google Scholar] [CrossRef]
- Cao, C.; De Luccia, F.J.; Xiong, X.; Wolfe, R.; Weng, F. Early On-Orbit Performance of the Visible Infrared Imaging Radiometer Suite Onboard the Suomi National Polar-Orbiting Partnership (S-NPP) Satellite. IEEE Trans. Geosci. Remote Sens. 2014, 52, 1142–1156. [Google Scholar] [CrossRef]
- VIIRS Flood Mapping System. Available online: http://jpssflood.gmu.edu (accessed on 28 October 2022).
- Jarihani, A.A.; Callow, J.N.; Johansen, K.; Gouweleeuw, B. Evaluation of multiple satellite altimetry data for studying inland water bodies and river floods. J. Hydrol. 2013, 505, 78–90. [Google Scholar] [CrossRef]
- Baup, F.; Frappart, F.; Maubant, J. Combining high-resolution satellite images and altimetry to estimate the volume of small lakes. Hydrol. Earth Syst. Sci. 2014, 18, 2007–2020. [Google Scholar] [CrossRef]
- Ovando, A.; Martinez, J.M.; Tomasella, J.; Rodriguez, D.A.; von Randow, C. Multi-temporal flood mapping and satellite altimetry used to evaluate the flood dynamics of the Bolivian Amazon wetlands. Int. J. Appl. Earth Obs. Geoinf. 2018, 69, 27–40. [Google Scholar] [CrossRef]
- Miller, C.L.; Laflamme, R.A. The Digital Terrain Model: Theory & Application; MIT Photogrammetry Laboratory: Cambridge, MA, USA, 1958; pp. 433–442. [Google Scholar]
- Meesuk, V.; Vojinovic, Z.; Mynett, A.E. Using multidimensional views of photographs for flood modelling. In Proceedings of the 2012 IEEE 6th International Conference on Information and Automation for Sustainability, Beijing, China, 27–29 September 2012; pp. 19–24. [Google Scholar]
- Meesuk, V.; Vojinovic, Z.; Mynett, A.E.; Abdullah, A.F. Urban flood modeling combining top-view LiDAR data with ground-view SfM observations. Adv. Water Resour. 2015, 75, 105–117. [Google Scholar] [CrossRef]
- Hashemi-Beni, L.; Jones, J.; Thompson, G.; Johnson, C.; Gebrehiwot, A. Challenges and opportunities for UAVbased digital elevation model generation for flood-risk management: A case of Princeville, North Carolina. Sensors 2018, 18, 3843. [Google Scholar] [CrossRef]
- Gebrehiwot, A.; Hashemi-Beni, L. A method to generate flood maps in 3D using DEM and deep learning. Int. Arch. Photogramm. Remote Sens. Spatial Inf. Sci 2020, XLIV-M-2-2020, 25–28. [Google Scholar] [CrossRef]
- Gebrehiwot, A.A.; Hashemi-Beni, L. Three-Dimensional Inundation Mapping Using UAV Image Segmentation and Digital Surface Model. ISPRS Int. J. Geo.-Inf. 2021, 10, 144. [Google Scholar] [CrossRef]
- Watts, A.C.; Ambrosia, V.G.; Hinkley, E.A. Unmanned aircraft systems in remote sensing and scientific research: Classification and considerations of use. Remote Sens. 2012, 4, 1671–1692. [Google Scholar] [CrossRef]
- Remondino, F.; Spera, M.G.; Nocerino, E.; Menna, F.; Nex, F. State of the art in high density image matching. Photogramm. Rec. 2014, 29, 144–166. [Google Scholar] [CrossRef]
- Schumann, G.; Hostache, R.; Puech, C.; Hoffmann, L.; Matgen, P.; Pappenberger, F.; Pfister, L. High-resolution 3-D flood information from radar imagery for flood hazard management. IEEE Trans. Geosci. Remote Sens. 2007, 45, 1715–1725. [Google Scholar] [CrossRef]
- Matgen, P.; Schumann, G.; Henry, J.B.; Hoffmann, L.; Pfister, L. Integration of SAR-derived river inundation areas, high precision topographic data and a river flow model toward near real-time flood management. Int. J. Appl. Earth Obs. Geoinf. 2007, 9, 247–263. [Google Scholar] [CrossRef]
- Huang, C.; Chen, Y.; Wu, J.; Chen, Z.; Li, L.; Liu, R.; Yu, J. Integration of remotely sensed inundation extent and high-precision topographic data for mapping inundation depth. In Proceedings of the 2014 IEEE 3rd International Conference on AgroGeoinformatics, Beijing, China, 11–14 August 2014; pp. 1–4. [Google Scholar]
- Cian, F.; Marconcini, M.; Ceccato, P.; Giupponi, C. Flood depth estimation by means of high-resolution SAR images and lidar data. Nat. Hazards Earth Syst. Sci. 2018, 18, 3063–3084. [Google Scholar] [CrossRef]
- Manfreda, S.; Samela, C. A digital elevation model-based method for a rapid estimation of flood inundation depth. J. Flood Risk Manag. 2019, 12, e12541. [Google Scholar] [CrossRef]
- Lou, H.; Wang, P.; Yang, S.; Hao, F.; Ren, X.; Wang, Y.; Shi, L.; Wang, J.; Gong, T. Combining and comparing an unmanned aerial vehicle and multiple remote sensing satellites to calculate long-term river discharge in an ungauged water source region on the Tibetan Plateau. Remote Sens. 2020, 12, 2155. [Google Scholar] [CrossRef]
- Yang, S.; Wang, P.; Lou, H.; Wang, J.; Zhao, C.; Gong, T. Estimating river discharges in ungauged catchments using the slope–area method and unmanned aerial vehicle. Water 2019, 11, 2361. [Google Scholar] [CrossRef]
- Zazo, S.; Molina, J.L.; Rodríguez-Gonzálvez, P. Analysis of flood modeling through innovative geomatic methods. J. Hydrol. 2015, 524, 522–537. [Google Scholar] [CrossRef]
- Rabus, B.; Eineder, M.; Roth, A.; Bamler, R. The shuttle radar topography mission- a new class of digital elevation models acquired by spaceborne radar. Photogramm. Remote Sens. 2003, 57, 241–262. [Google Scholar] [CrossRef]
- Hansen, M.C.; Potapov, P.V.; Moore, R.; Hancher, M.; Turubanova, S.A.; Tyukavina, A.; Thau, D.; Stehman, S.V.; Goetz, S.J.; Loveland, T.R.; et al. High-Resolution Global Maps of 21st-Century Forest Cover Change. Science 2013, 342, 850–853. [Google Scholar] [CrossRef]
- Moore, R.B.; McKay, L.D.; Rea, A.H.; Bondelid, T.R.; Price, C.V.; Dewald, T.G.; Johnston, C.M. User’s guide for the national hydrography dataset plus (NHDPlus) high resolution: U.S. Geological Survey Open-File Report 2019–1096; U.S. Geological Survey: Asheville, NC, USA, 1958; 66p. [Google Scholar] [CrossRef]
- Li, S.; Sun, D.; Goldberg, M.D.; Kalluri, S.; Sjoberg, B.; Lindsey, D.; Hoffman, J.P.; DeWeese, M.; Connelly, B.; Mckee, P.; et al. A downscaling model for derivation of 3-D flood products from VIIRS imagery and SRTM/DEM. ISPRS J. Photogramm. Remote Sens. 2022, 192, 279–298. [Google Scholar] [CrossRef]
- Hurricane Ian from Wikipedia. Available online: https://en.wikipedia.org/wiki/Hurricane_Ian (accessed on 28 October 2022).
Publisher’s Note: MDPI stays neutral with regard to jurisdictional claims in published maps and institutional affiliations. |
© 2022 by the authors. Licensee MDPI, Basel, Switzerland. This article is an open access article distributed under the terms and conditions of the Creative Commons Attribution (CC BY) license (https://creativecommons.org/licenses/by/4.0/).

