Article

Urban Traffic Imaging Using Millimeter-Wave Radar

1
School of Aerospace Science and Technology, Xidian University, Xi’an 710071, China
2
The Science and Technology on Near-Surface Detection Laboratory, Wuxi 214035, China
3
The Beijing Institute of Control Engineering, Beijing 100190, China
*
Author to whom correspondence should be addressed.
Remote Sens. 2022, 14(21), 5416; https://doi.org/10.3390/rs14215416
Submission received: 28 August 2022 / Revised: 23 October 2022 / Accepted: 25 October 2022 / Published: 28 October 2022
(This article belongs to the Special Issue Radar Techniques and Imaging Applications)

Abstract

:
Imaging technology enhances radar environment awareness. Imaging radar can provide richer target information for traffic management systems than conventional traffic detection radar. However, there is still a lack of research on millimeter-wave radar imaging technology for urban traffic surveillance. To solve the above problem, we propose an improved three-dimensional FFT imaging algorithm architecture for radar roadside imaging in urban traffic scenarios, enabling the concurrence of dynamic and static targets imaging. Firstly, by analyzing the target characteristics and background noise in urban traffic scenes, the Monte-Carlo-based constant false alarm detection algorithm (MC-CFAR) and the improved MC-CFAR algorithm are proposed, respectively, for moving vehicles and static environmental targets detection. Then, for the velocity ambiguity solution problem with multiple targets and large velocity ambiguity cycles, an improved Hypothetical Phase Compensation algorithm (HPC-SNR) is proposed and complimented. Further, the Density-Based Spatial Clustering of Applications with Noise (DBSCAN) algorithm is used to remove outliers to obtain a clean radar point cloud image. Finally, traffic targets within the 50 m range are presented as two-dimensional (2D) point cloud imaging. In addition, we also try to estimate the vehicle type by target point cloud size, and its accuracy reaches more than 80% in the vehicle sparse condition. The proposed method is verified by actual traffic scenario data collected by a millimeter-wave radar system installed on the roadside. The work can support further intelligent transportation management and extend radar imaging applications.

1. Introduction

Being robust against the environment and suitable for traffic surveillance in all-weather types and providing high-resolution estimation of the range and velocity of targets at low cost [1], millimeter-wave radars emitting Linear Frequency Modulated Continuous Wave (LFMCW) have a wide range of applications in the detection of traffic targets, including the detection and analysis of traffic flow [2], the detection of obstacles with the help of vision sensors [3], and the tracking and identification of pedestrians based on deep learning frameworks [4].
With the application and development of Multiple-input Multiple-output (MIMO) technology, imaging algorithms (e.g., the three-dimensional Fast Fourier Transform (3D-FFT) [5,6], the back-propagation algorithm (BPA) [7], and the Range Migration algorithm (RMA) [8]), and antenna array design [9], using millimeter-wave radar to image and perceive the environment has become possible [10,11]. In fact, in-vehicle radar has contributed to drivers or autonomous driving systems using imaging technologies, such as near-target 4-D information capture (range, Doppler, azimuth, and elevation) [12], roadside environment sensing [13,14], road curvature estimation [15], road surface classification [16], etc. As a result, radar imaging technology and MIMO imaging radar system design have become research hot spots.
Compared with the traffic radar used in traffic vehicle monitoring, MIMO imaging radars with high angular resolution can provide intelligent transportation systems with richer traffic information such as vehicle profiles, vehicle travel status (moving or stopped), and the surrounding environment of the road, which can better reflect the actual situation of the traffic scenes. However, simply modifying the radar transmission method on common traffic detection radar systems is not impractical.
Plaque-like targets detection and extraction: Radar Constant False Alarm Rate (CFAR) detection is an important technique to separate target and background by adaptively setting detection thresholds by evaluating the current clutter environment [17,18]. Currently, the Cell Average CFAR (CA-CFAR) [19], the Ordered Statistical CFAR (OS-CFAR), and the fusion CFAR algorithm combining CA and OS (namely, OSCA-CFAR) [20], etc., are widely used in traffic radars to detect moving vehicles. They detect all targets in the radar’s field of view from the range-Doppler power spectrum matrix (RDM) by two-dimensional reference window sliding and in-window noise power estimation. However, the resolution of imaging radars in terms of range, velocity, and angle is much higher (up to 10 times or more) than that of detection radar, which turns the target area from an “ideal point” to a “plaque” in the RDM. In this case, the classic CFAR algorithm based on window sliding detection will fail because the target samples that fill the reference window lead to incorrect estimation of the background noise; moreover, target misses and target segmentation will occur.
The detection of targets from the RDM is unsuitable for static target detection, as stationary targets with larger area characteristics are compressed in the zero-Doppler region (only one column or row of the RDM area), resulting in less target information and large fluctuations in background noise energy.
Large speed ambiguity cycle compensation: The MIMO technology brings high angular resolution to radar systems while significantly reducing the maximum unambiguous speed of the radar. Without changing the distance resolution, the maximum unambiguous speed of the radar decreases further with the expanded detection range. In practice, the speed of a vehicle in urban traffic can be 5–8 times the maximum unambiguous speed of the imaging radar. In MIMO radar systems, incorrect velocity estimates can lead to incorrect target angle estimates due to the coupling between the target velocity and the angle. Therefore, the velocity ambiguity solution is necessary to ensure the accuracy of imaging, especially in the case of a large velocity ambiguity cycle.
The Chinese Remainder Theorem (CRT) is a typical multi-frame velocity disambiguation technique [21,22] that recovers the true velocity of the target by transmitting multiple pulse repetition frequency (MPRF) with different configuration parameters. However, the performance of the CRT algorithm decreases as the ambiguity cycle increases. A hybrid method between the CRT and Density-Based Spatial Clustering of Applications with Noise algorithm (CRT-DBSCAN) [23] is proposed for more stable processing speed ambiguation problems. However, target matching and time delay problems are unavoidable. To avoid the target matching problem caused by MPRF and improve processing efficiency, people began to study the speed disambiguation algorithm based on a single frame. A speed expansion algorithm based on the Doppler phase shift assumption is proposed [24,25], but the maximum solvable speed is only twice the maximum unambiguous speed. In [26,27], Hypothetical Phase Compensation (HPC) is proposed, which can theoretically handle ambiguity cycles up to a maximum of M times, where M is the number of transmitting antennas. However, the algorithm may fail when multiple target points exist in the same range-Doppler cell due to the instability of energy peak detection.
Multi-dimensional Perception of Vehicle Information: The elevation-dimensional antenna array design enables the radar to estimate the height of the objects [28], which makes it possible for the radar to acquire target size or shape information. However, the multi-dimensional antenna array increases the complexity and cost of the design. In general, we would like to obtain more information about the target with less economic and design costs in civilian applications.
To avoid complex antenna array designs, multi-platform radars are used to enhance elevation angle resolution to estimate the height of the target [29]. In [30,31], a method for estimating the height of objects using FMCW automotive radar is presented, which exploits the frequency shift caused by the Doppler effect when approaching a stationary object to estimate the heights of the target. Although the algorithm does not require multiple vertical antennas to find the height, it needs to provide a well-defined travel speed for the radar itself.
As aforementioned, many problems must be solved to apply radar imaging technology in the traffic field. In [32,33], moving vehicles are imaged using millimeter-wave radar, but static targets in the road are ignored and the imaging range is limited (<15 m). In fact, so far, there is little literature on urban traffic surveillance using radar imaging technology, with even less study on the concurrence of dynamic and static imaging. To make up for the lack of research and promote the application of radar imaging, We present a preliminary study on roadside imaging using millimeter-wave radar in traffic surveillance. The contributions of this paper are summarized as follows:
  • An improved 3D-FFT imaging algorithm architecture is presented and discussed for urban traffic imaging using the millimeter-wave radar system. It enables the concurrence of dynamic and static target imaging within 50 m (speed up to 70 km/h) in the form of a 2D point cloud.
  • In the proposed imaging algorithm framework, Monte-Carlo-based CFAR detection algorithm (the MC-CFAR) and improved MC-CFAR are applied and proposed, respectively, to detect moving vehicles and traffic static objects. The MC-CFAR algorithm estimates the background noise of the moving target by random sampling of the RDM, which avoids reference window design and sliding. Compared with the traditional CFAR algorithm, the MC-CFAR algorithm has higher detection efficiency and provides a more complete target output, which is more suitable for “plaque-like” target detection. The improved MC-CFAR uses RAM as the detection object. While maintaining the advantages of the MC-CFAR algorithm, it achieves static target extraction with non-uniform background noise and a larger “plaque-like” area by dividing the RAM area with a noise power drop gradient.
  • In the proposed imaging algorithm framework, an improved HPC algorithm is proposed for velocity ambiguity solution with a large ambiguity cycle. We changed the evaluation method to estimate speed—that is, by choosing the hypothesis with the strongest SNR in the angular power spectrum instead of the peak value to obtain the real speed. Compared with the original HPC algorithm (which we call HPC-Peak), the effectiveness of the velocity disambiguation is guaranteed when there are multiple targets in the same range-Doppler cell.
  • The DBSCAN algorithm is used to eliminate the isolated noise generated by the detection of false alarms to obtain a clean point cloud image. In addition, we performed a preliminary estimation experiment for the vehicle type based on the target point cloud image, which is not possible with traffic detection radar. Although the method is still crude in the type identification of the vehicle, it avoids errors caused by target distance, plane mapping relationship, and occlusion, etc. To a certain extent, it is able to provide accurate dimensions of ordinary small cars and buses in sparse vehicle scenarios.
The structure of this paper is organized as follows: Section 2 describes the radar signal model, the scenario model, the imaging millimeter-wave radar system, and the scene characteristics analysis. Then, in Section 3, we give the principle and model of the road imaging processing architecture and imaging algorithm. Numerical simulations of the proposed key algorithms are given in Section 4. In Section 5, we analyze the performance of the imaging algorithm through real experiments. Finally, Section 6 summarizes the conclusions of this paper.

2. Model and Scenario Analysis

2.1. Radar Detection Principle and FFT-Based Processing Model

In the LFMCW radar system, the radar transmits a sawtooth signal (called Chirp) through the transmitting antenna (TX), which can be expressed as
s T x ( t ) = A T e x p ( 2 π ( f o t + 1 2 k t 2 ) )
where A T refers to the transmit power of the Chirp signal, f o the starting frequency, k = B / T c the slope, B the bandwidth, and T c the duration.
The transmitted signal is received by the radar receiving antenna (RX) after being reflected by the target, and the echo signal can be expressed as
s R x ( t ) = α A T e x p ( 2 π ( f o ( t τ ) + 1 2 k ( t τ ) 2 ) )
where α is the return loss, τ = 2 R / c is the transmission delay, R represents the distance of the target relative to the radar, and c is the speed of light. The beat frequency signal is obtained when the echo signal is mixed with the transmitted signal, which can be expressed as
y ( t ) = A R e x p ( 2 π ( 2 R B c T c t + 2 R c ( f o B τ T c ) ) ) A R e x p ( 2 π ( f b t + 2 R c f o ) )
where A R represents received power and f b is the frequency of the beat frequency signal. Then, we can obtain the distance of the target relative to the radar by f b :
R = c f b T c 2 B
When the radial velocity of the target relative to the radar is v, the beat signal expression of Formula (3) is transformed into
y ( n , k ) = A R e x p ( j 2 π ( ( 2 B ( R + v T c ( k 1 ) ) c T c + 2 f o v c ) t + 2 f o c ( R + v T c ( k 1 ) ) ) )
where k = 1 , 2 , 3 , , K is the number of Chirp cycles. Assuming that the target moves at a uniform speed, the phase difference Δ ϕ between the beat signals caused by the target speed can be expressed as
Δ ϕ = 4 π f o Δ R c = 4 π v T c λ
where Δ R represents the displacement of the object in time T c and λ represents the wavelength. The phase change can be equivalent to the integration of a fixed frequency over T c time:
Δ ϕ = 2 π f d T c
where f d represents a fixed frequency due to velocity v, usually called Doppler. So, combining formulas (6) and (7), we can obtain the velocity of the target relative to the radar:
v = λ f d 2
In a radar system, at least two or more receiving antennas are required to estimate the target azimuth because there is a target angle-dependent phase difference between the antenna channels, which is introduced due to the different antenna positions. As shown in Figure 1, suppose the receiving antenna is uniformly distributed, the distance between the antennas is d, and the angle between the target and the radar is θ ; then, the beat frequency signals received by different antenna channels can be expressed as
y ( n , k , m ) = y ( n , k ) e x p ( j 2 π f o c d ( m 1 ) sin θ )
where m = 1 , 2 , 3 , , M , M represents the number of receiving antennas (virtual antennas). The phase difference ( Δ ω ) between adjacent receiving channels can be expressed as
Δ ω = ( 2 π / λ ) d s i n ( θ )
Then, the angle of arrival of the object can be obtained:
θ = arcsin Δ ω λ 2 π d
In practical application, we can obtain the parameters ( f b , f d , and Δ ω ) by performing FFT operations on the radar raw data in the fast time dimension, the slow time dimension, and the spatial dimension in turn. This approach is also known as the 3D-FFT method, which has been widely used in traffic millimeter radar systems.
Figure 2 illustrates a typical signal processing flow for acquiring target information based on the 3D-FFT method. Firstly, the radar echo signal from the target is received by all receiving antennas and the beat frequency signal is obtained after mixing and sampling. Secondly, the RDM containing the target velocity and distance information is obtained by performing FFT operations on each antenna channel in the fast time dimension and slow time dimension, in turn. Then, a third FFT is performed along the spatial dimension to obtain the target angular spectrum. Finally, the distance, velocity, and angle are extracted by constant false alarm detection of the RDM and angle spectrum.

2.2. Traffic Scene Model and Radar System

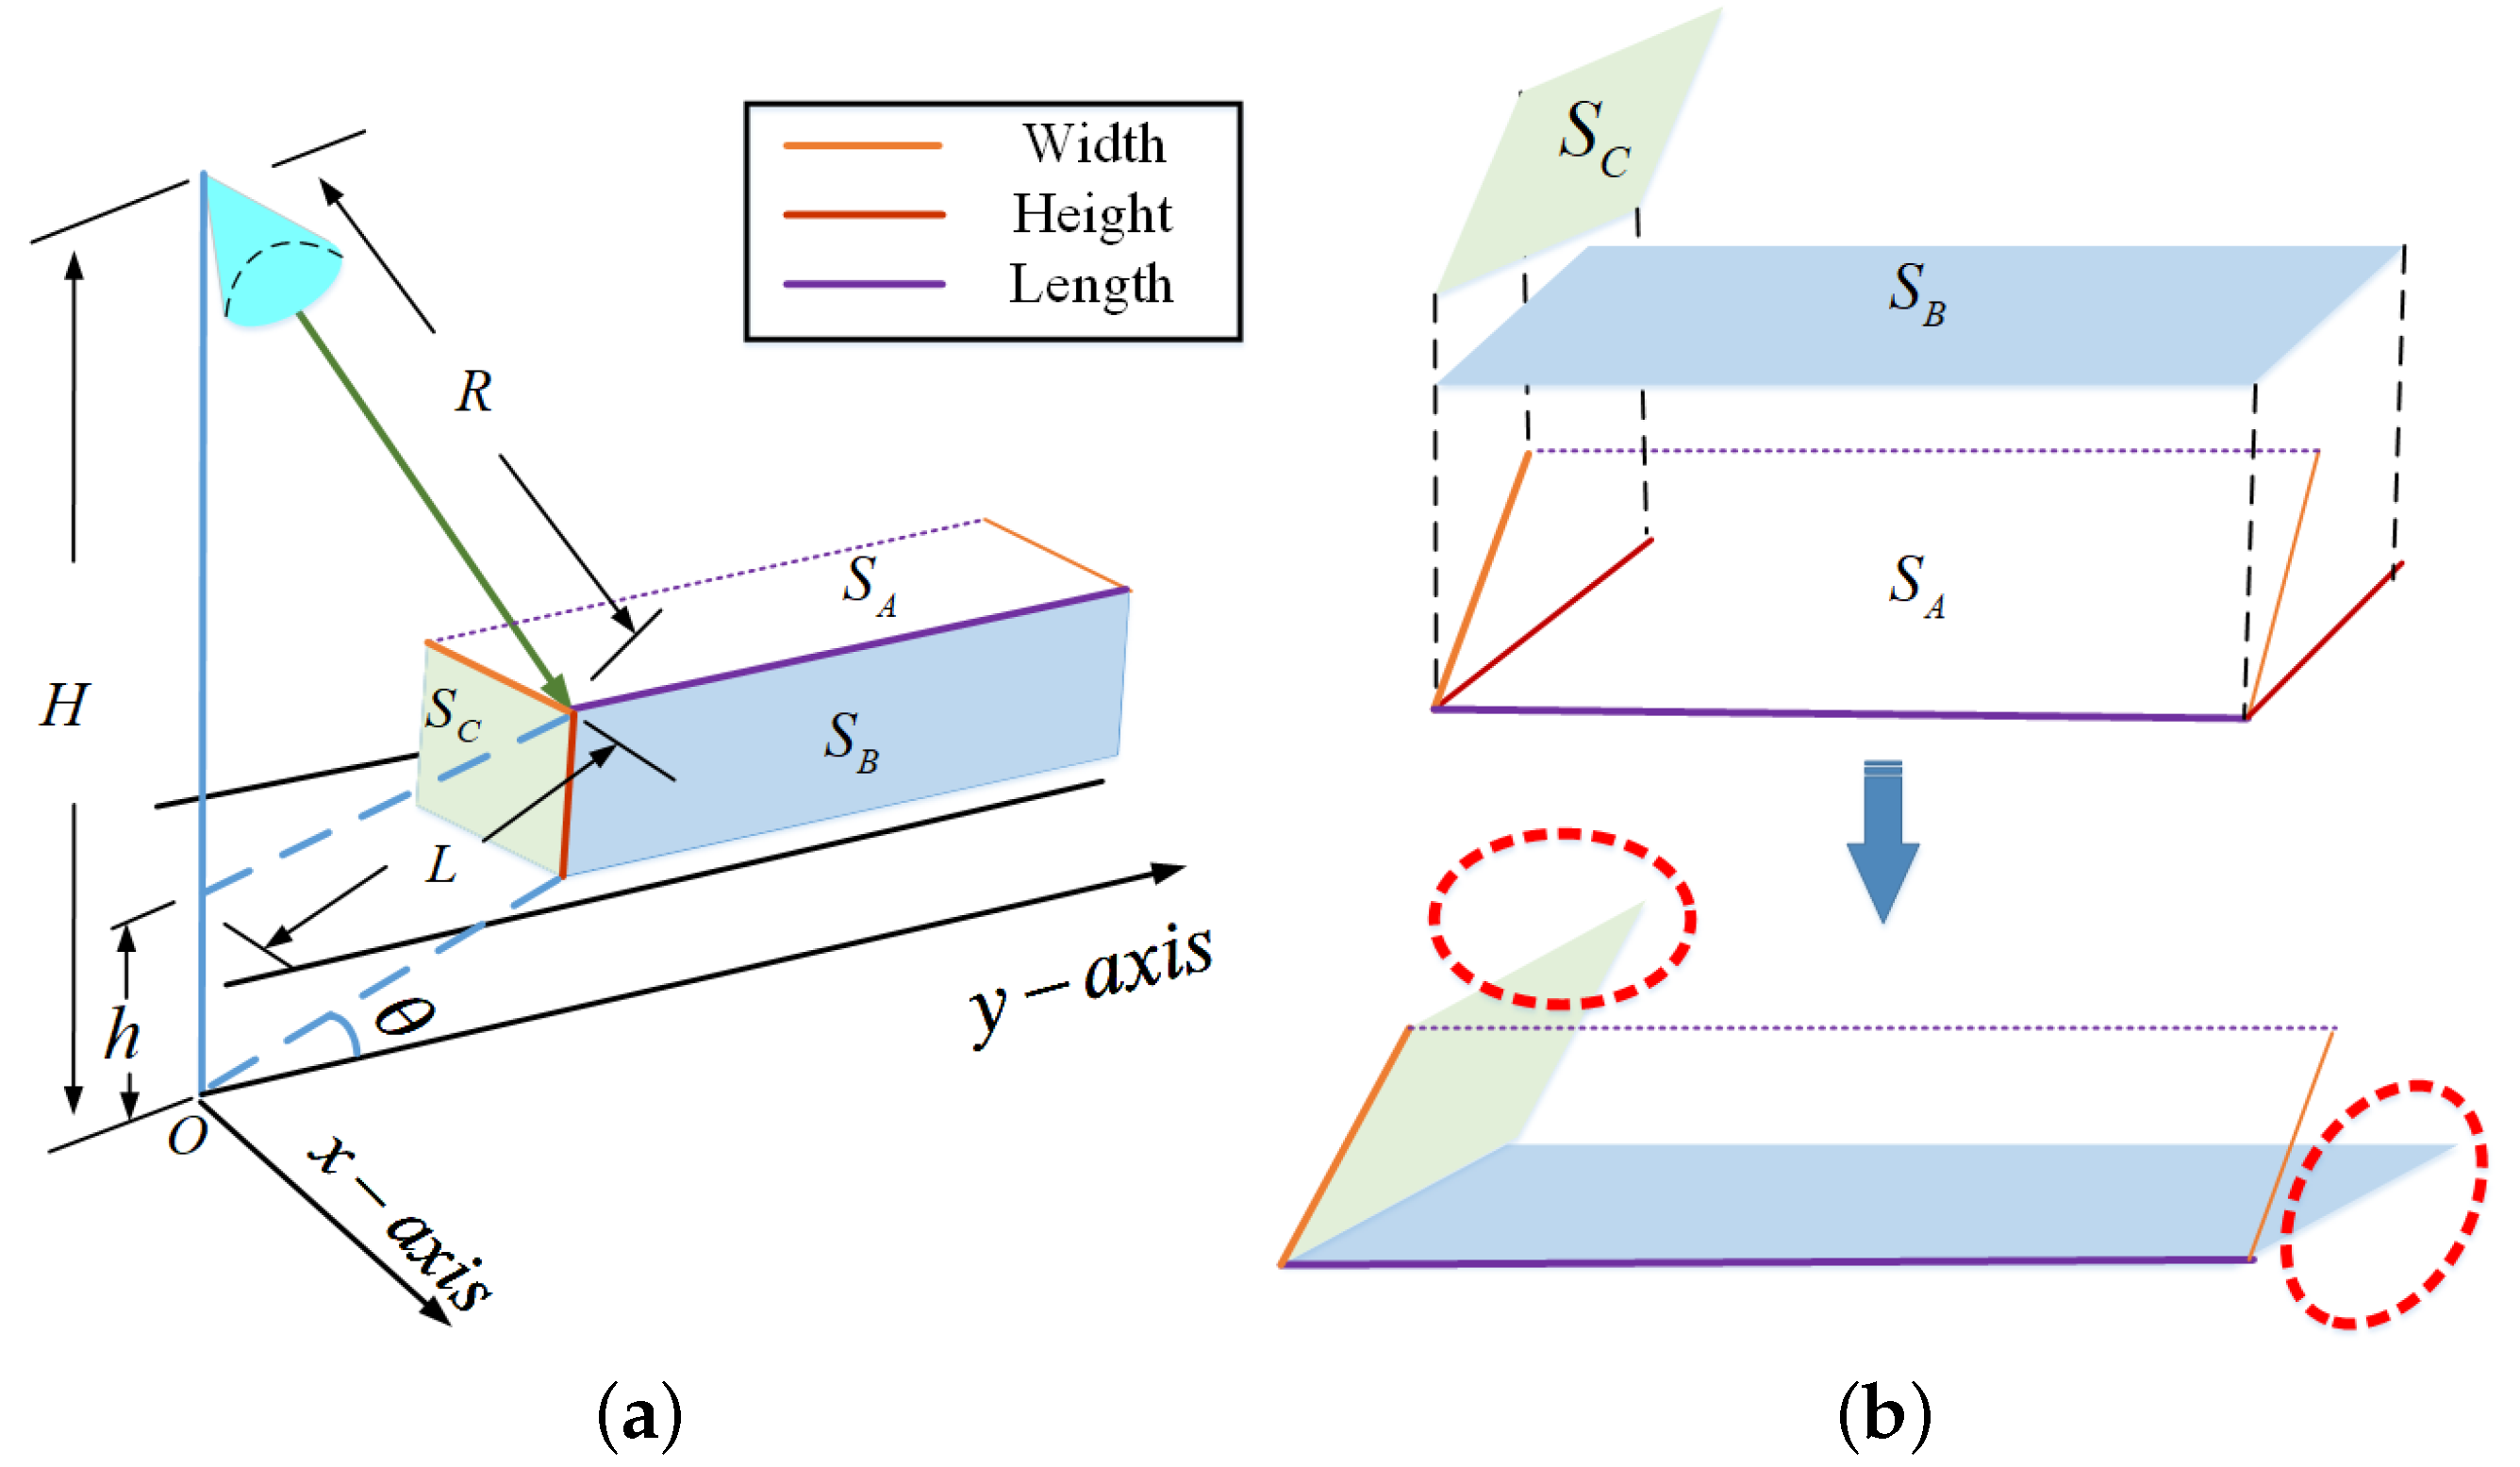
Figure 3a shows a roadside imaging scenario model based on millimeter-wave radar. A millimeter-wave radar system with negligible height resolution is installed on the roadside to monitor the road within a distance of 50 m ( D = 10∼50 m) from an overhead view, where H (>6 m) is the height of the installed radar; θ is the pitch angle of the radar; and ϕ and ϑ are 6 db azimuth beamwidth and 8 db elevation beamwidth, respectively. The road information obtained by the radar is processed to produce the point cloud imaging of the target vehicle and the road environment. In our study, we conducted experiments on Xuefu Street Road, Xi’an, China. The radar was deployed at one end of the test bridge to monitor the roads on both sides, as shown in Figure 3b.
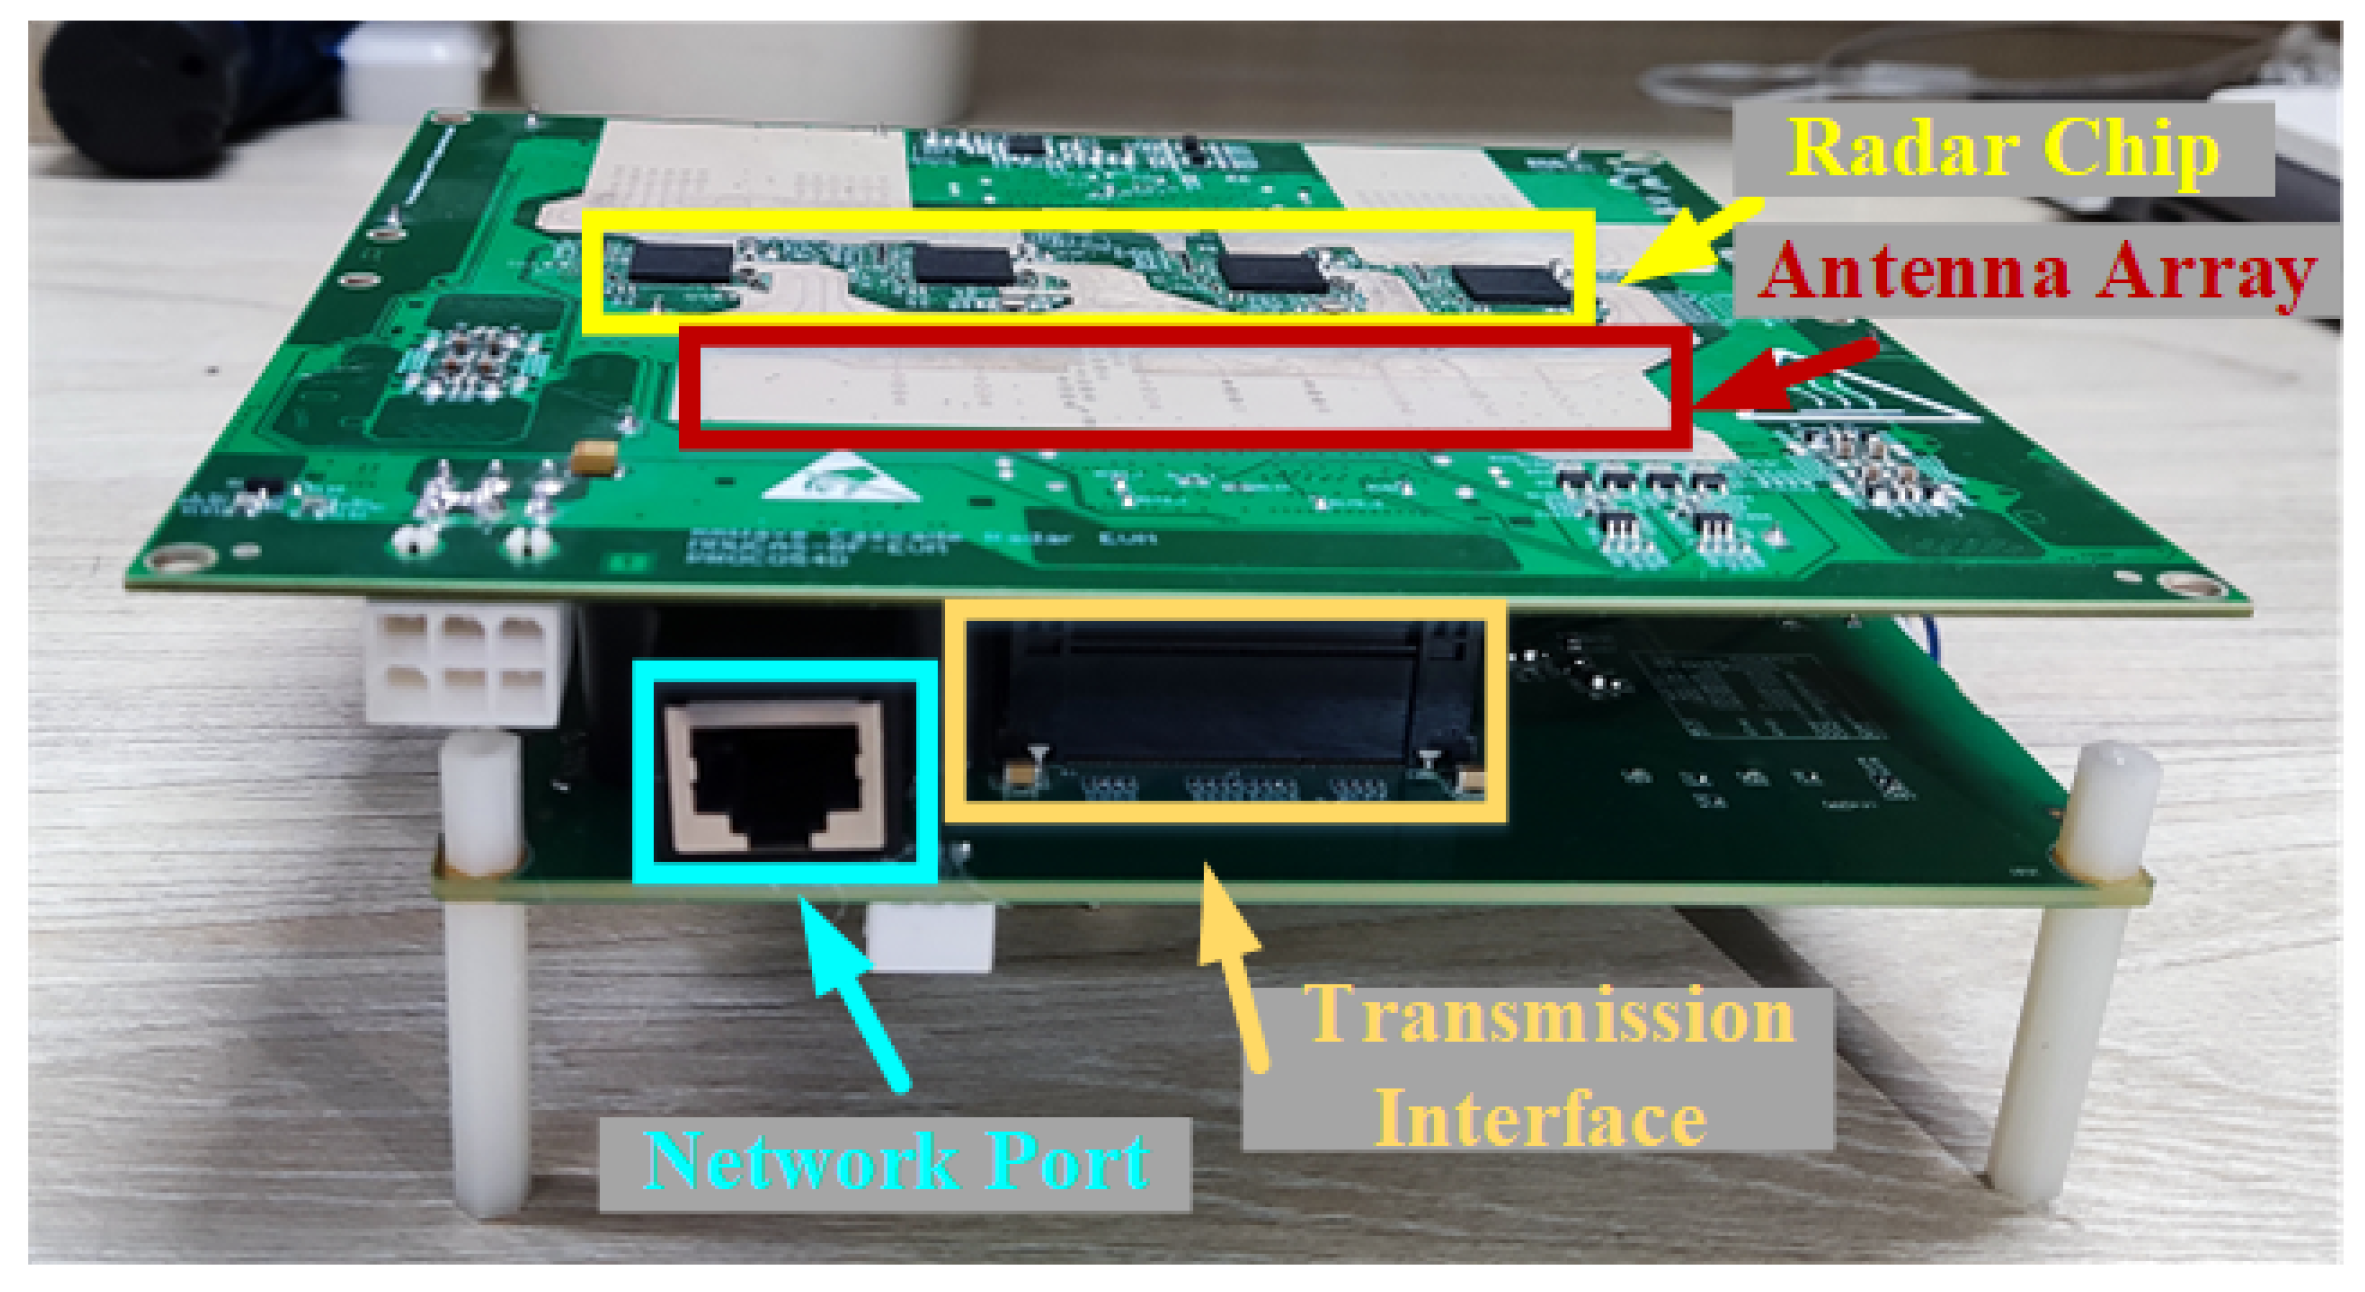
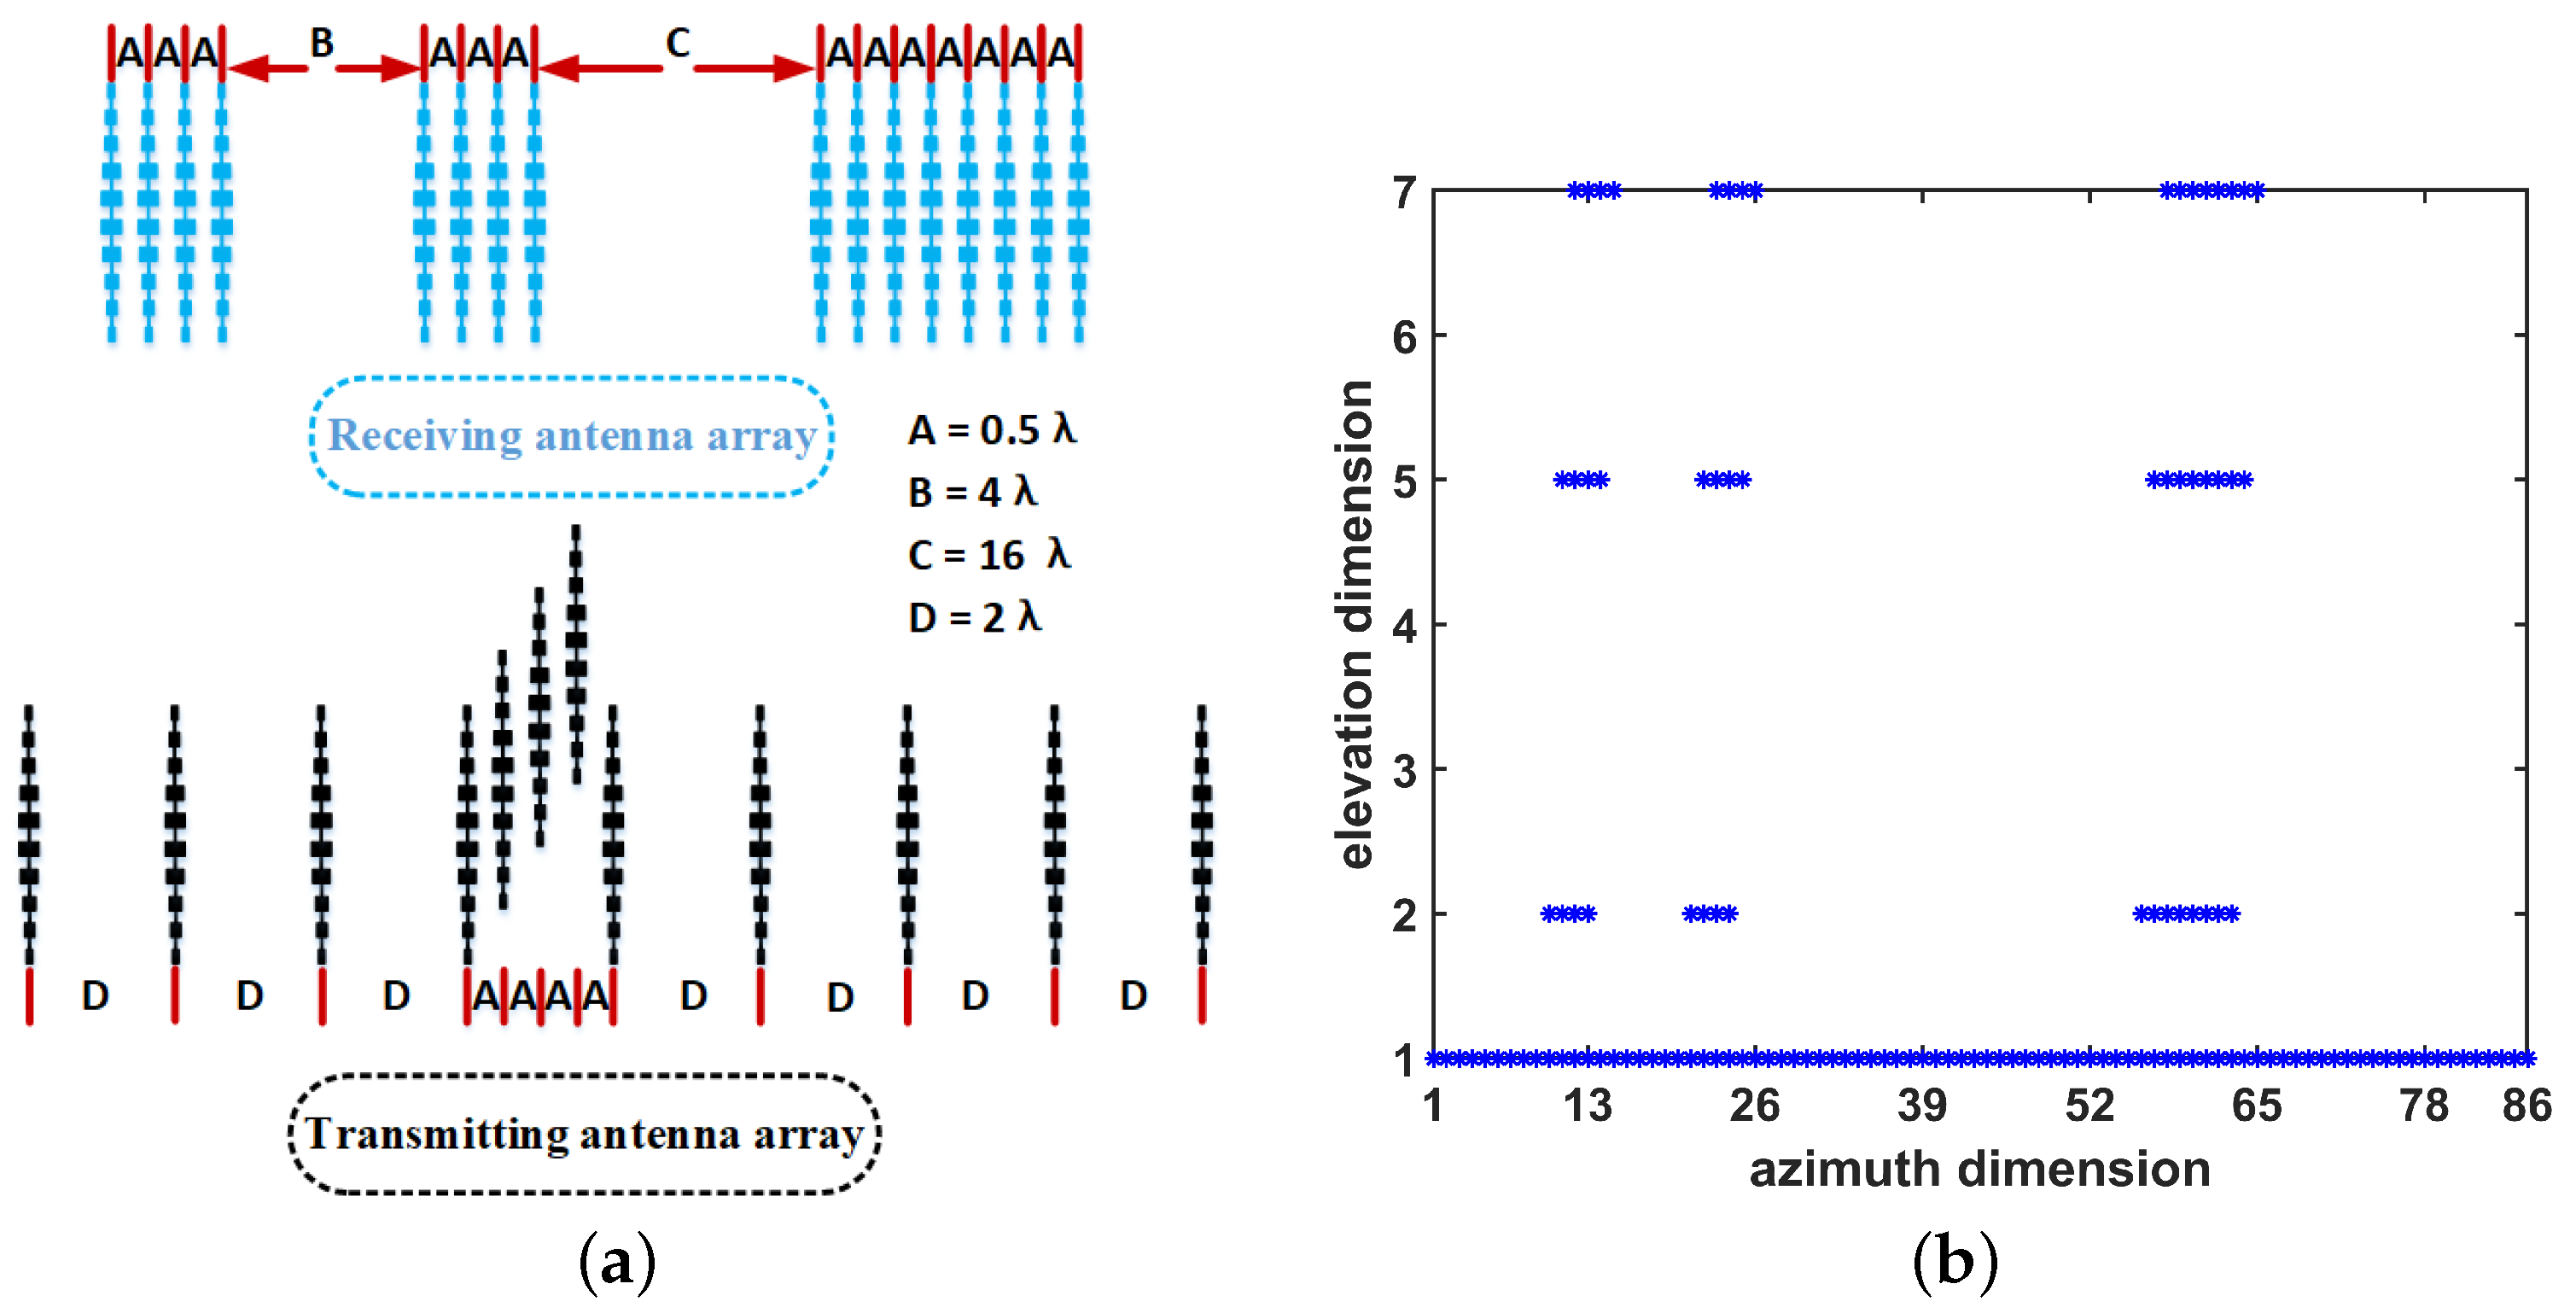
To not lose generality, we use the radar RF front-end available in the market and match it with the self-designed IF processing board (as shown in Appendix A.1) to form the millimeter-wave radar system required for the experiment, as shown in Figure 4. The real antenna array of the radar system consists of 12 TX antennas and 16 RX antennas, as shown in Figure 5a. Via MIMO technology, 86 virtual antenna arrays (as shown in Figure 5b) in azimuth dimension can be obtained to achieve an azimuth resolution of A r e s o l u t i o n = 1.4 . Elevation resolution ( 20 ) due to the elevation antenna array can be ignored. The imaging radar system parameters are shown in Table 1.

2.3. Scenario Analysis

Although the application scenarios of imaging radar and traffic detection radar are the same, the background noise and target characteristics will vary due to the different mission requirements of imaging radar and traffic detection radar.
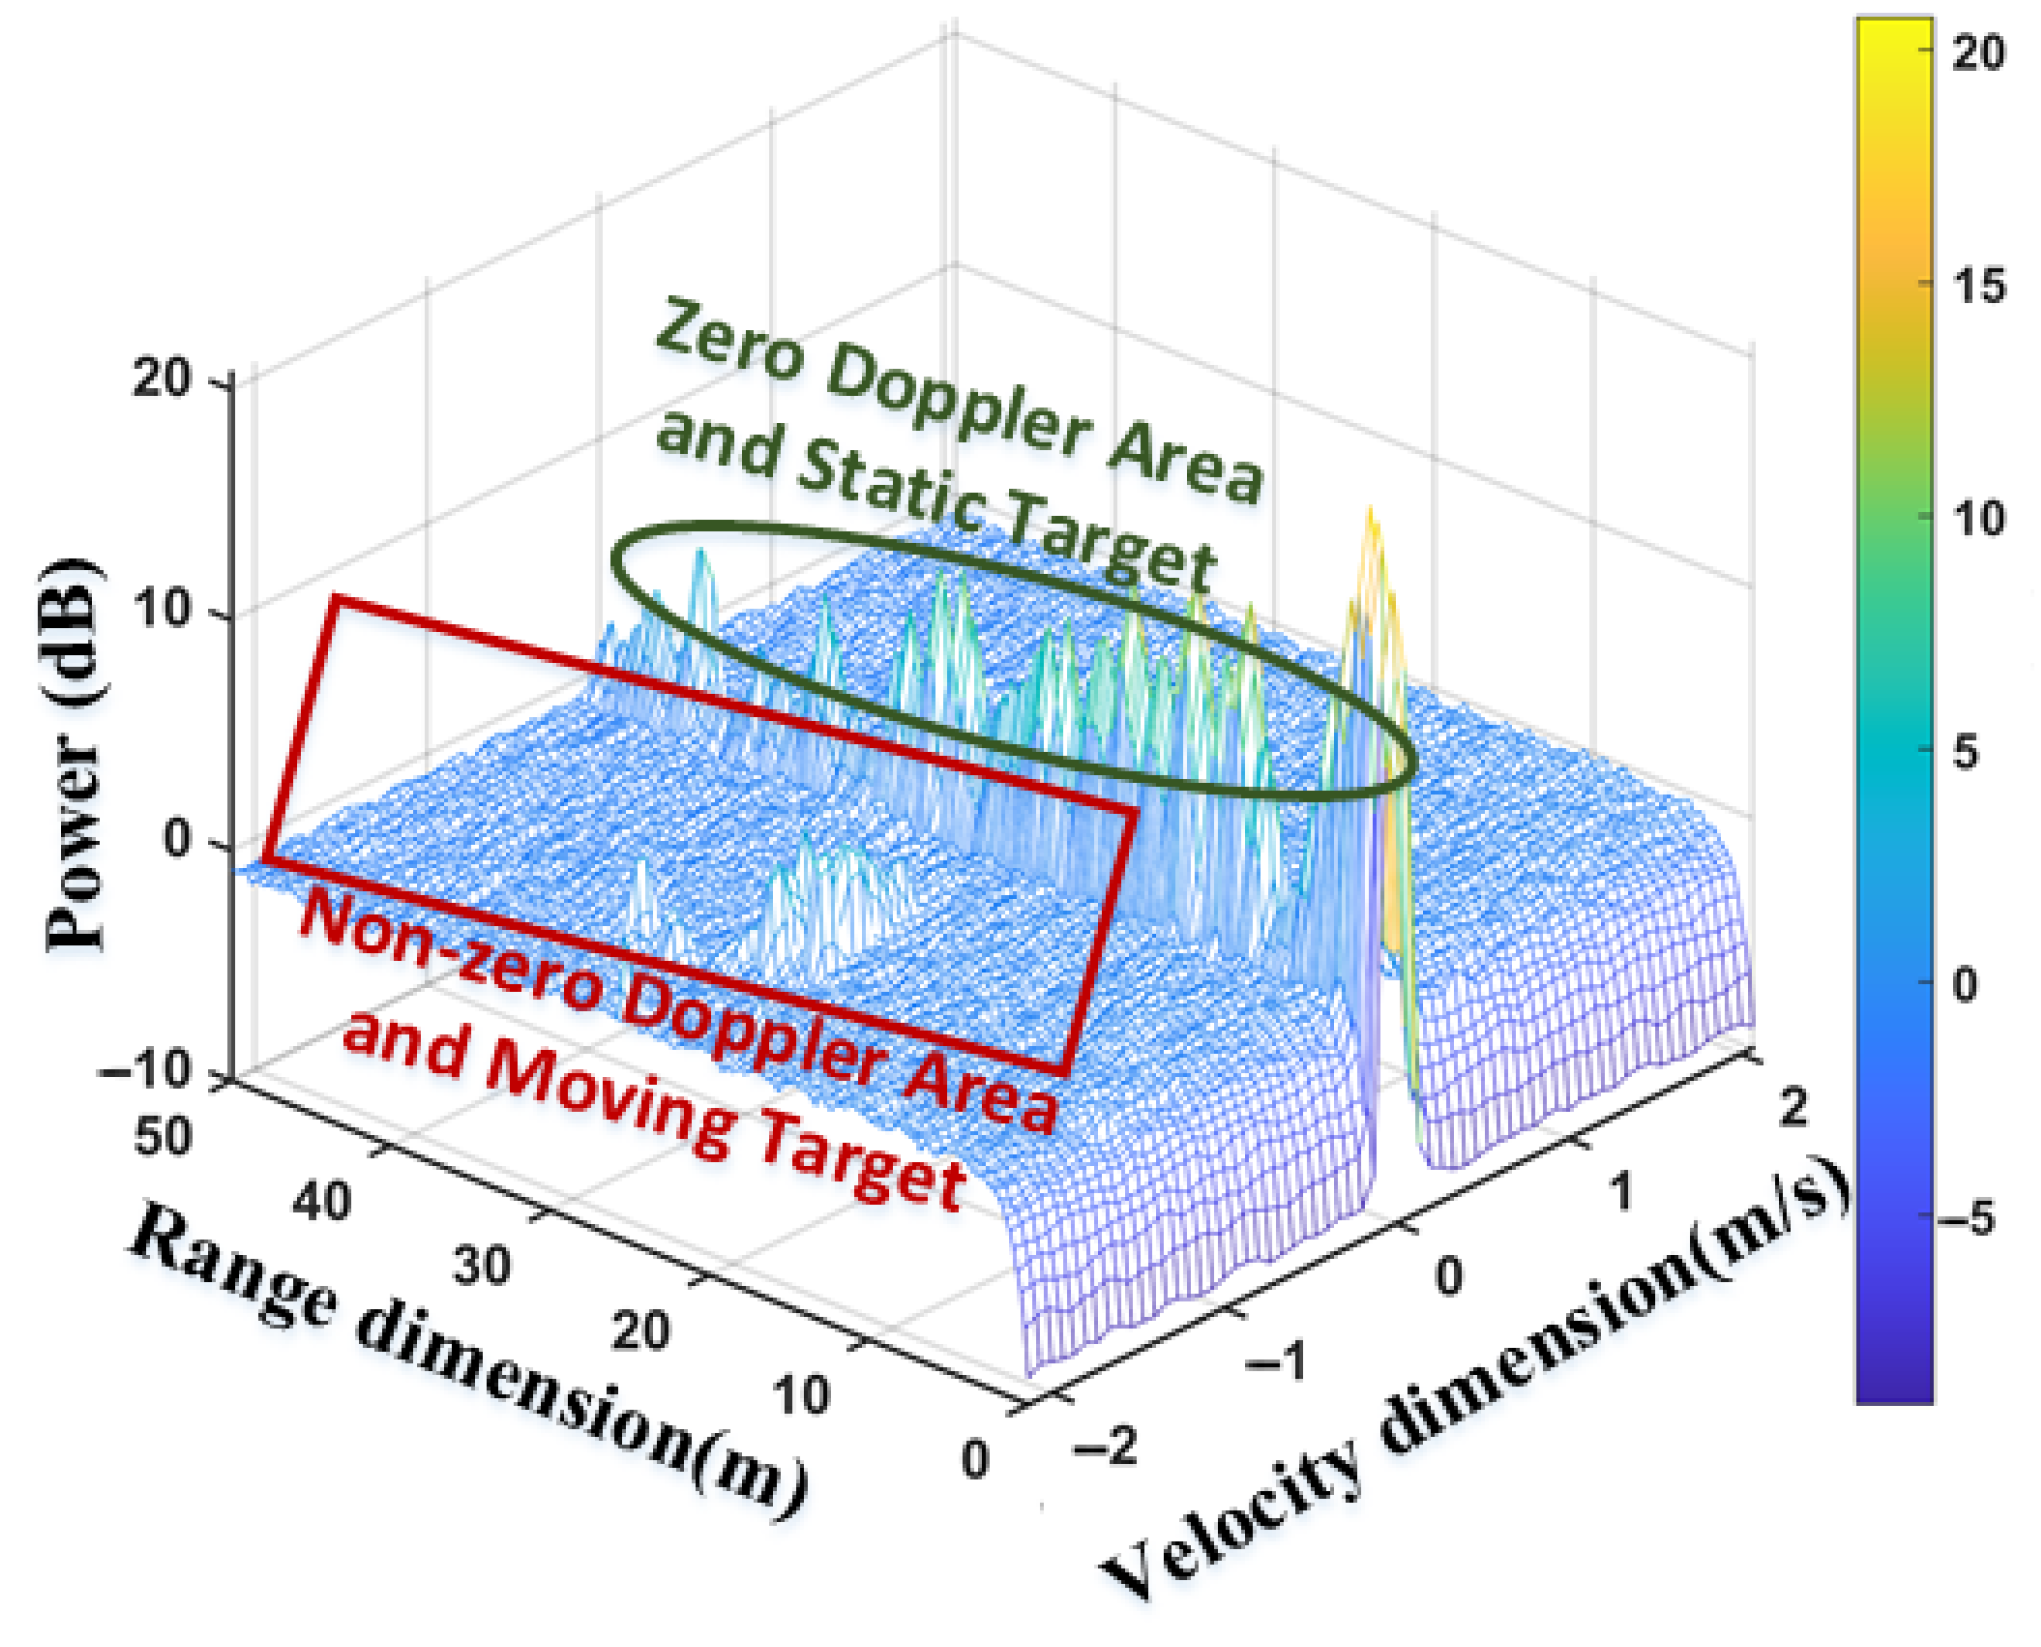
Figure 6 shows the RDM operated by 2D-FFT in the urban traffic scenario. The data are acquired by the proposed imaging radar system in this paper. The energy amplitudes in the non-zero-Doppler (non-zero velocity) region and the zero-Doppler (zero velocity) region represent the power values reflected by moving (static) objects or background noise, respectively.
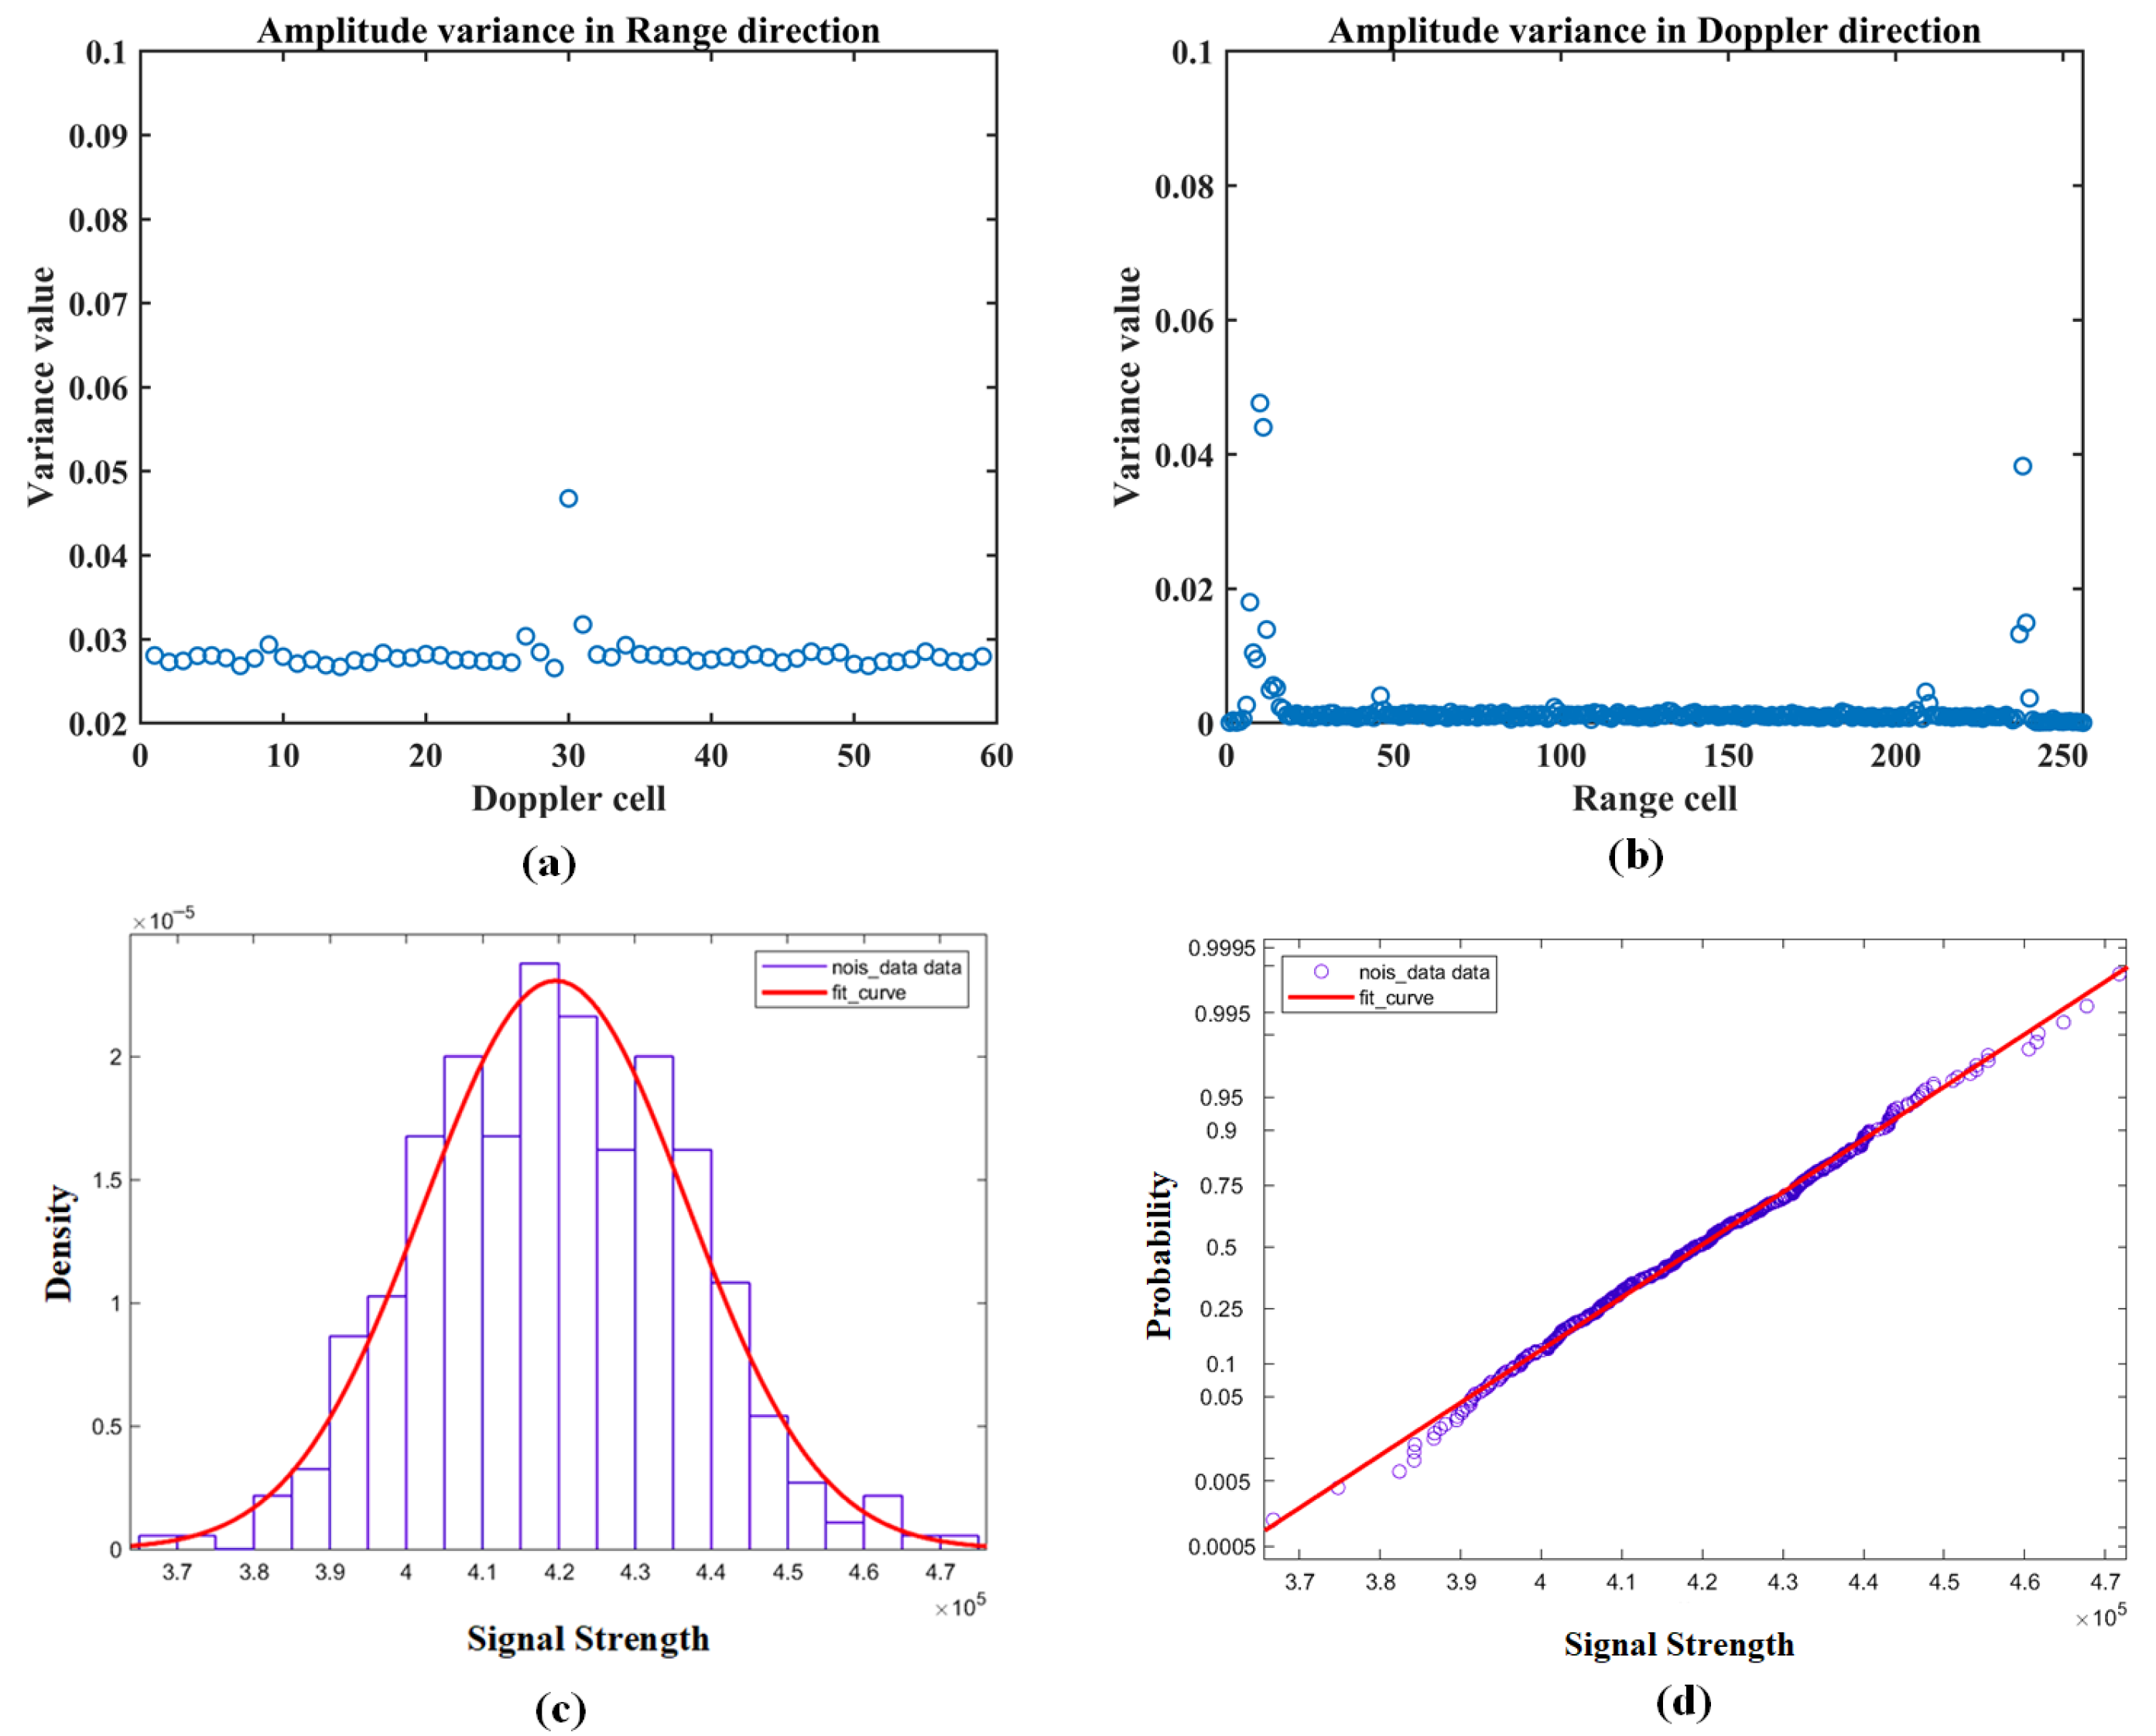
We conduct statistical analysis on the data in RDM to obtain the background noise distribution in the area where the moving target is located (ignoring zero-Doppler data and data with a distance of fewer than 10 m). As shown in Figure 7, the background noise distribution power fluctuates smoothly and the power distribution is relatively uniform. Both the variance of the velocity dimension and the variance of the distance dimension are less than 0.03, as shown in Figure 7a,b. The non-zero-Doppler cells in RDM are sampled and processed by MATLAB Distribution Fitter Toolbox; then, the distribution of data (purple) and the fitting curve of Normal distribution (red) are shown in Figure 7c. Figure 7d shows the matching degree between data probability distribution and Normal distribution, i.e., the closer the data are to a curve line, the more consistent they are with a Normal distribution.
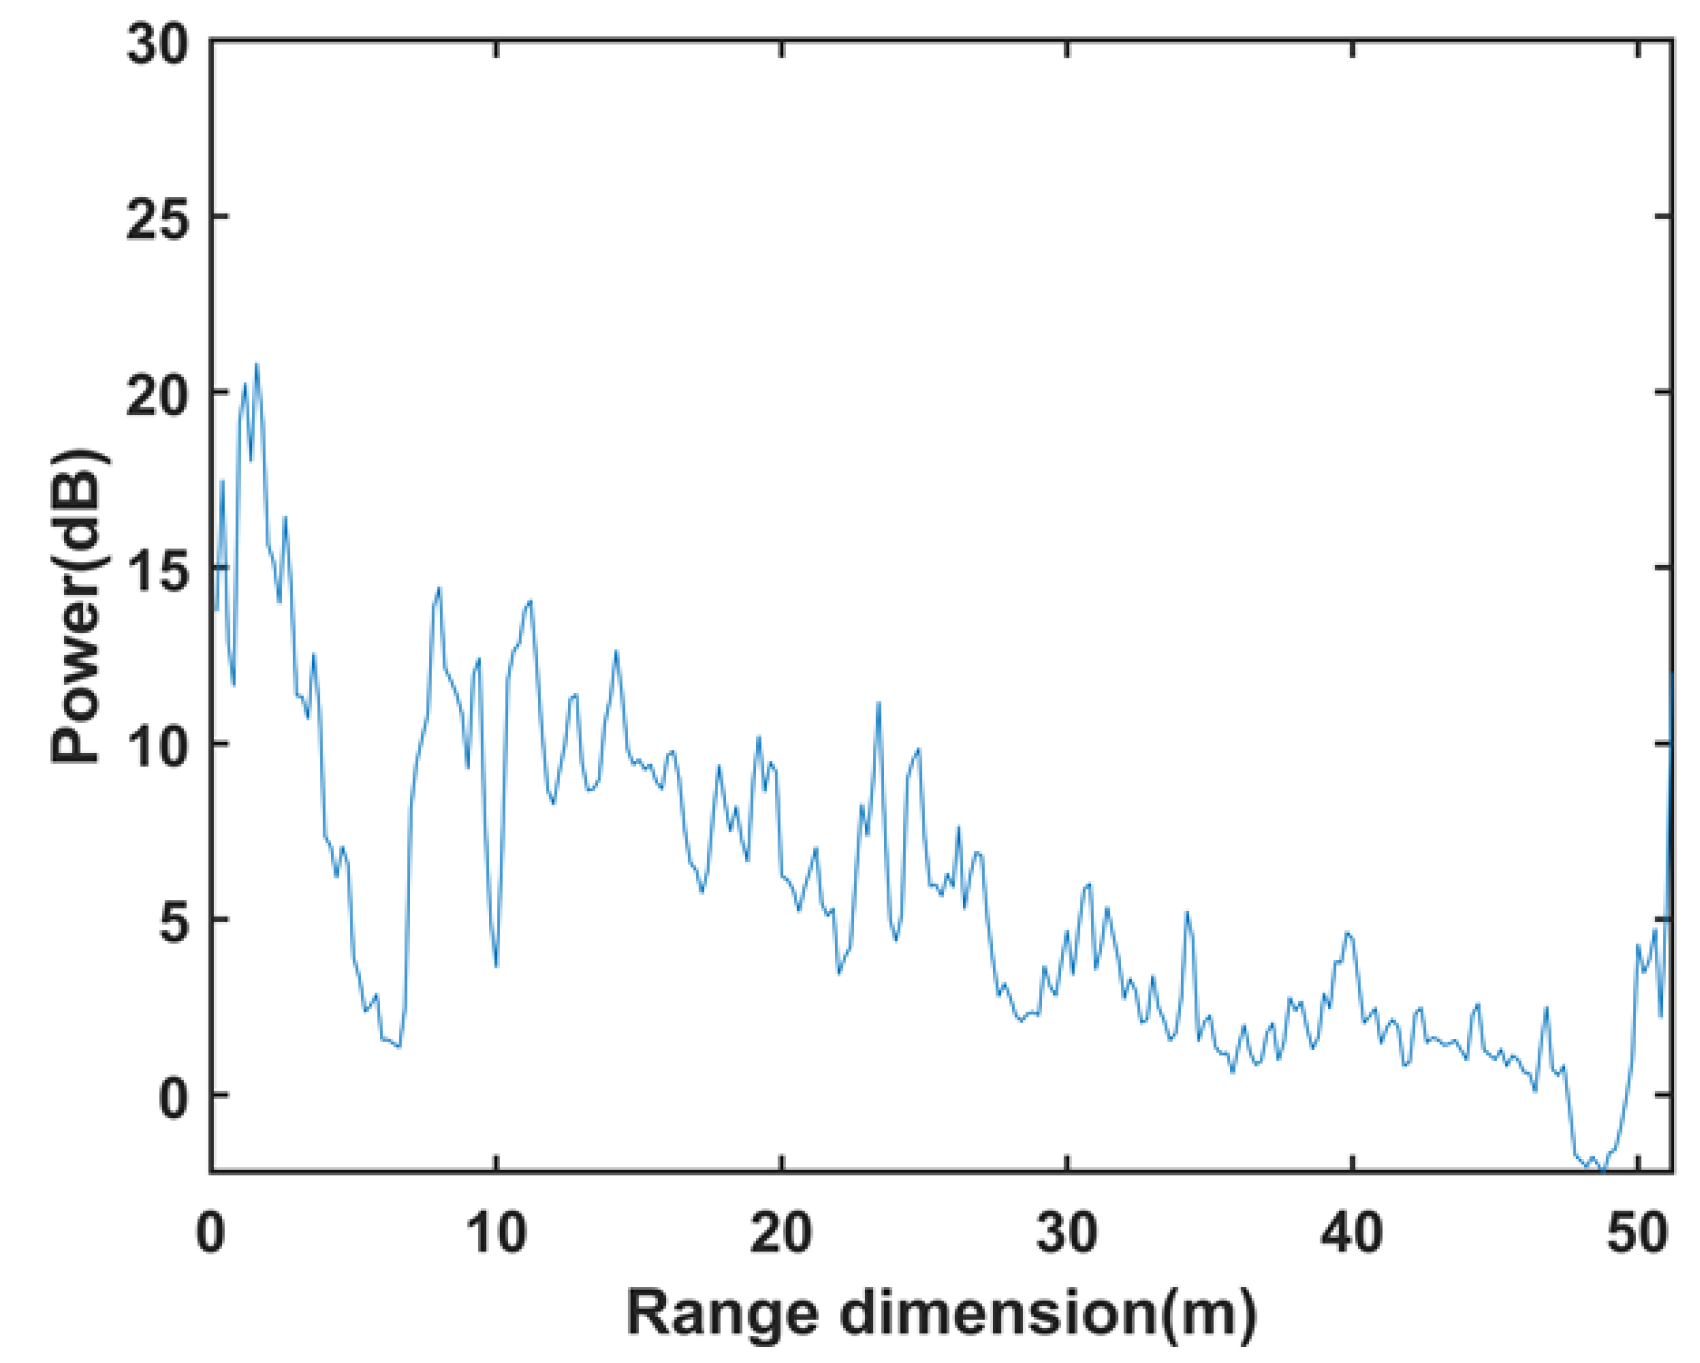
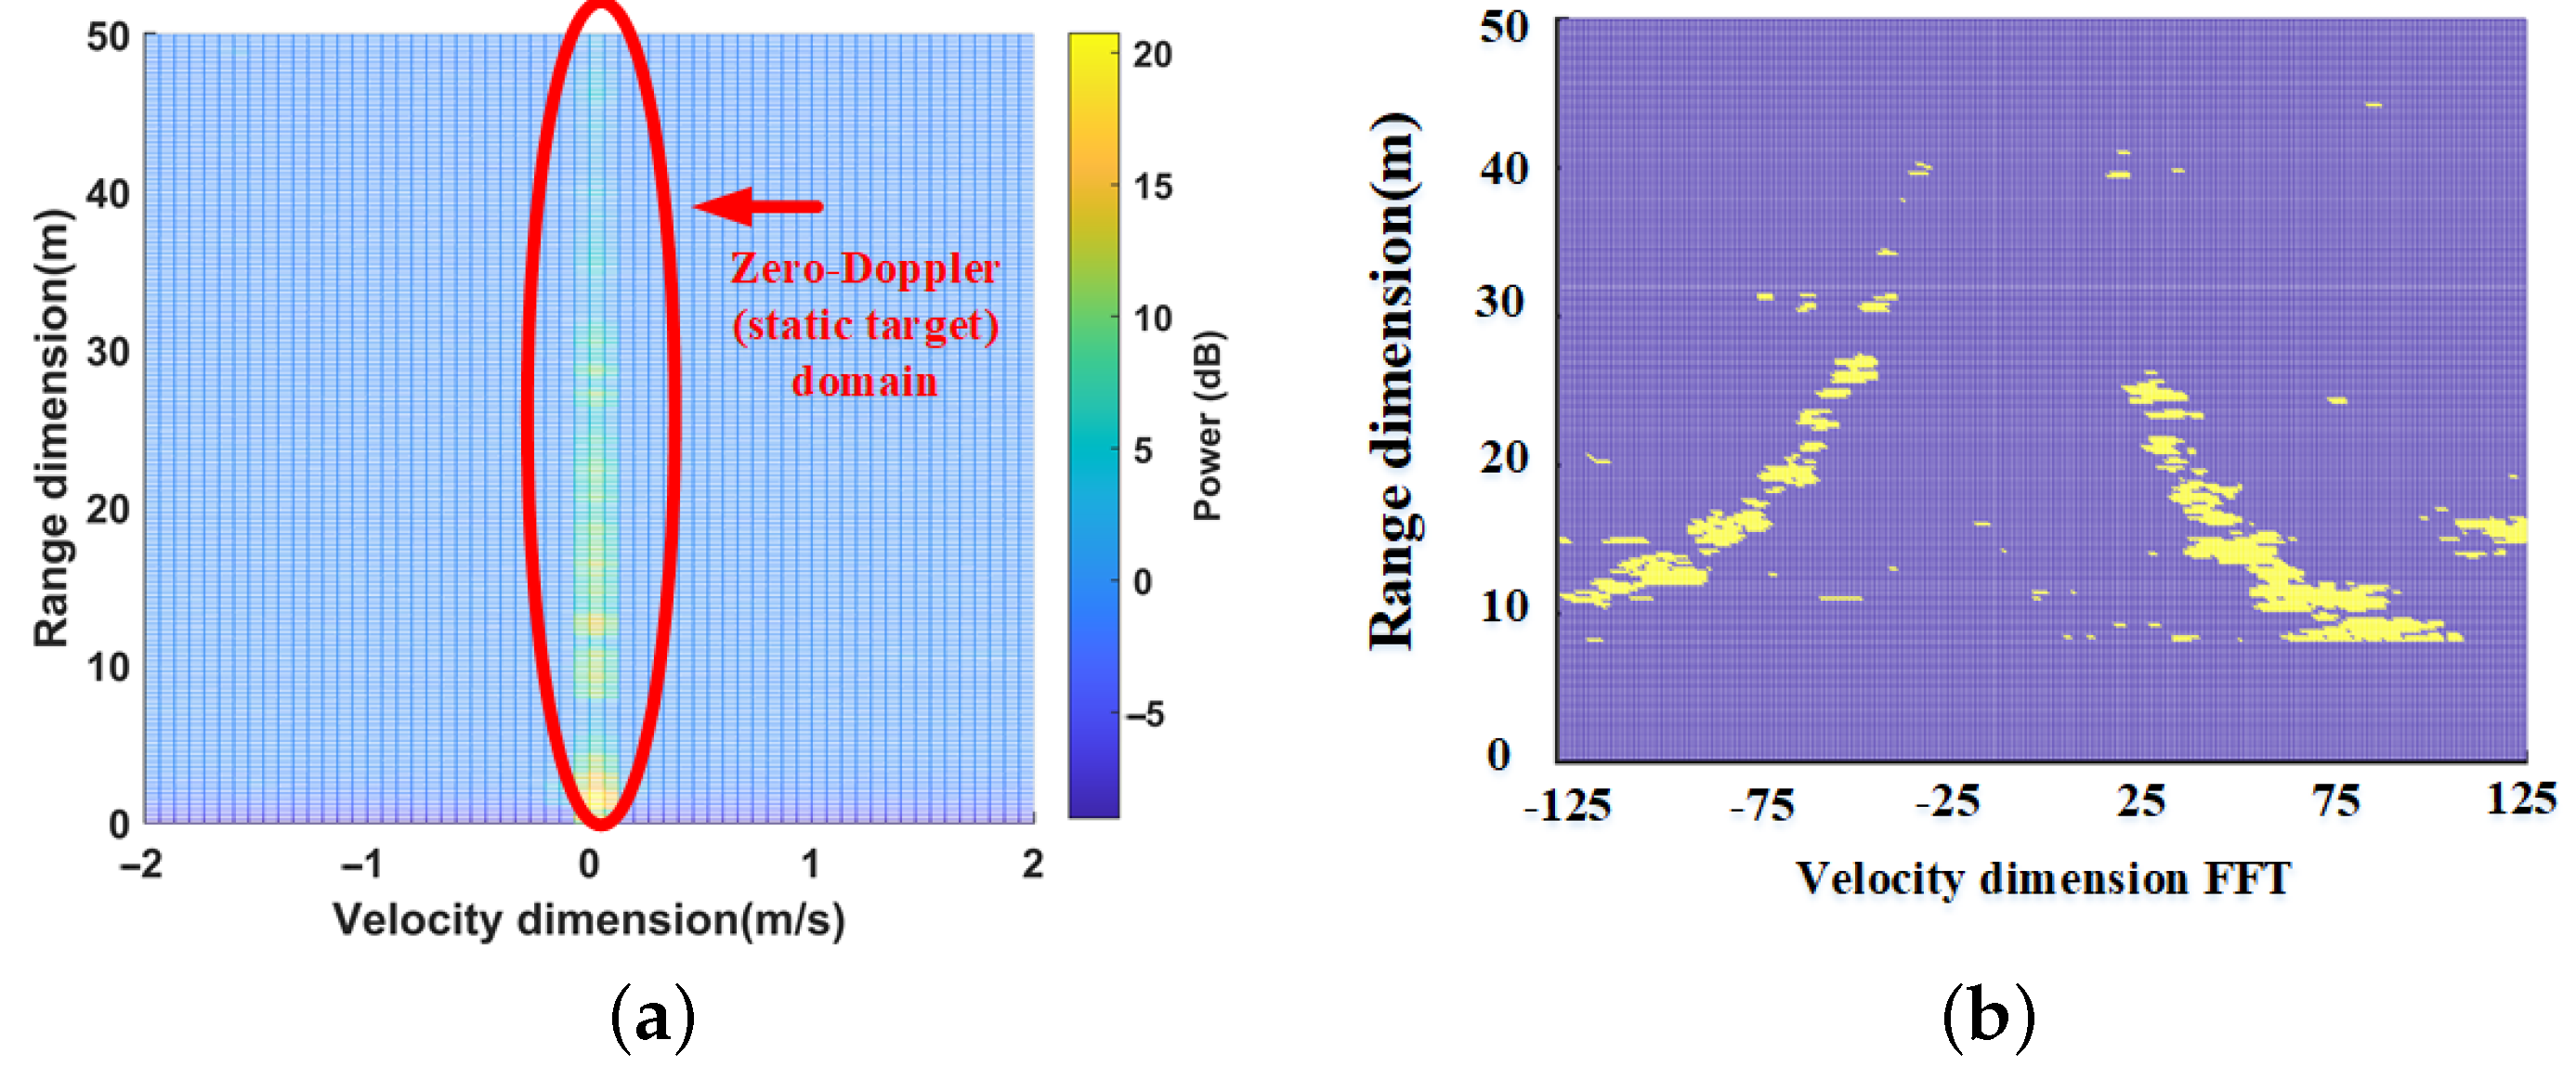
However, in RDM, the reflected energy in the area where the static target is located fluctuates seriously and irregularly (as shown in Figure 8), which is not conducive to weak signal target detection. Besides, the stationary target information only occupies the zero-Doppler column, which leads to a severe lack of static target information. It is entirely impossible to detect stationary targets from the RDM based on the strength of the reflected energy.
Table 2 also summarizes the differences between imaging radar and traffic detection radar for traffic applications, including detection objects, target characteristics, and outputs. In fact, the typical 3D-FFT signal processing methods used in detection radar systems are not entirely suitable for imaging radar.

3. The Proposed Imaging Architecture and Algorithms

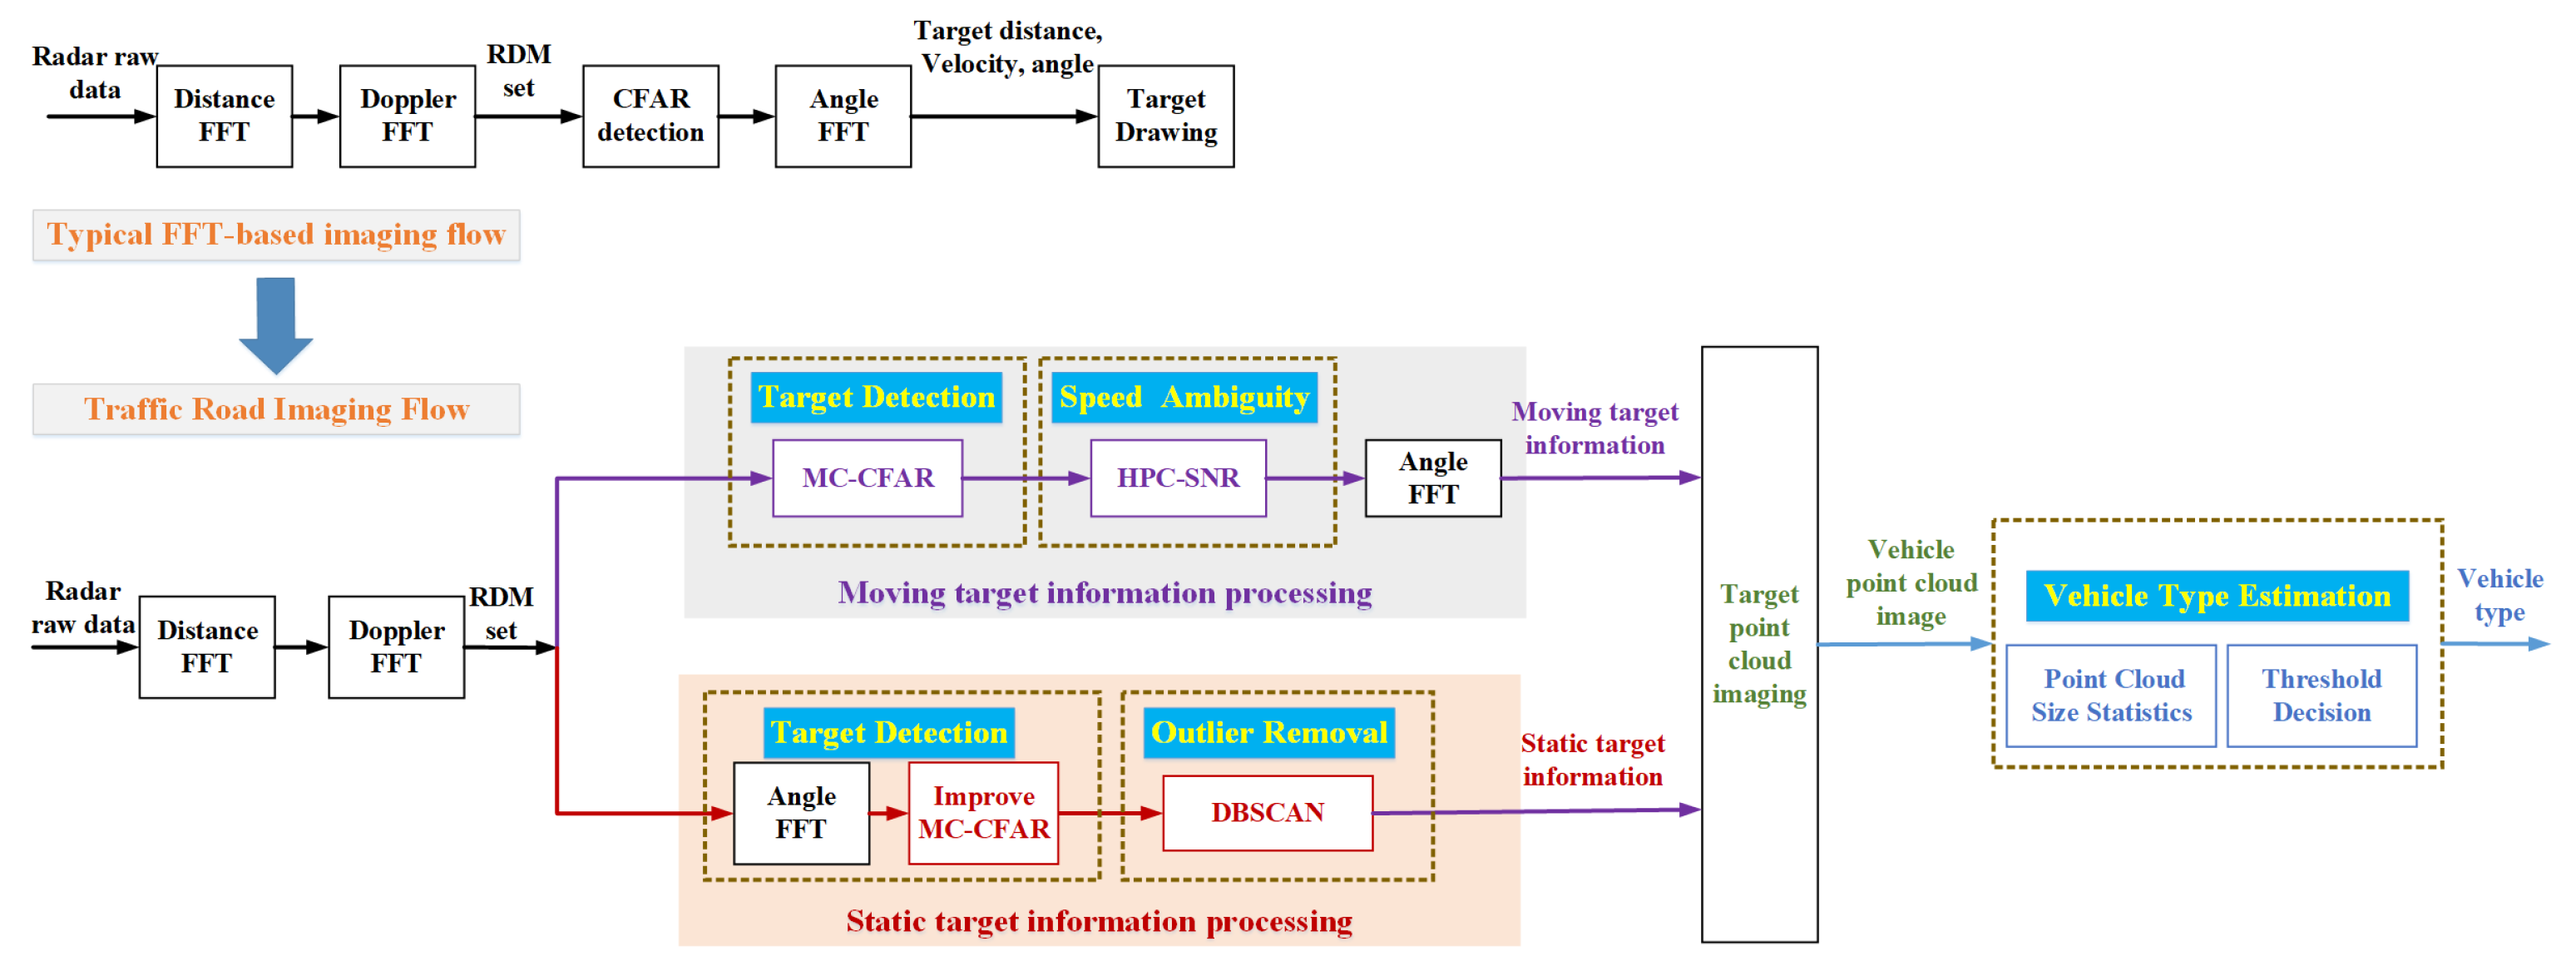
Based on the typical 3D-FFT radar processing algorithm, we propose an improved 3D-FFT radar imaging framework to realize the concurrence of dynamic and static imaging in urban traffic using millimeter-wave radar, as shown in Figure 9. The Monte-Carlo-based detection algorithm, the velocity disambiguation algorithm with large velocity ambiguity cycles, an outlier removal algorithm, and a vehicle-type estimation method are introduced to make the imaging radar suitable for urban surveillance.

3.1. The MC-CFAR Algorithm and Improved MC-CFAR Algorithm for Target Detection

3.1.1. The MC-CFAR Algorithm for Moving Target Detection

In the previous work [34], we proposed a new CFAR algorithm (the MC-CFAR) for detecting vehicles in urban traffic environments using traffic detection radar. The MC-CFAR algorithm flow is shown in Figure 10; the process is as follows:
  • Step 1: Use Monte Carlo experiments to obtain configuration parameters (sampling points M and the threshold factor α ). When the detection environment and platform remain unchanged, this step only needs to be performed once.
  • Step 2: Randomly draw M sample points (X) in the RDM non-zero-Doppler region. Sort the sample points according to the magnitude of the power magnitude:
    X 1 X 2 X q X M k X M ,
  • Step 3: k maximum points and q minimum points are removed, and it is considered that the remaining M k q sample points only contain background noise power points.
  • Step 4: Average the remaining M q k sample points to obtain the estimated value ( μ ) of the current background average noise power in the RDM.
    μ = 1 M k q i = k M k q X i ,
  • Step 5: Each detection cell in the RDM is sequentially compared with the threshold value T = α · μ . If X > T , the target exists; otherwise, the target does not exist.
In the imaging algorithm architecture, we adopt the MC-CFAR algorithm to implement the detection and extraction of moving objects. The main reasons are as follows: (1) In Section 2.3, we analyze the background noise of traffic scenes. The noise power distribution of the non-zero-Doppler region in the RDM is uniform, which meets the use conditions of the MC-CFAR algorithm. (2) Compared with the conventional CFAR algorithm, the MC-CFAR algorithm has higher detection sensitivity. More importantly, it avoids the limitation of the reference window and can prevent the target from being split by the window, which is more suitable for detecting “plaque-like” targets due to the imaging radar’s high distance and velocity resolution.

3.1.2. The Improved MC-CFAR Algorithm for Static Target Detection

In static target imaging, we regard objects outside the surface of the lane as targets of interest, e.g., roadside trees, stationary vehicles, and obstacles in the lane. However, according to the background noise analysis in Section 2.3, it is not advisable for imaging applications to implement static object detection and extraction with RDM as the detection object, as in common CFAR. Taking scene 1 as an example, the static objects in the traffic scene are entirely concentrated in the zero-Doppler region with little information and large energy fluctuations, as shown in Figure 11a.
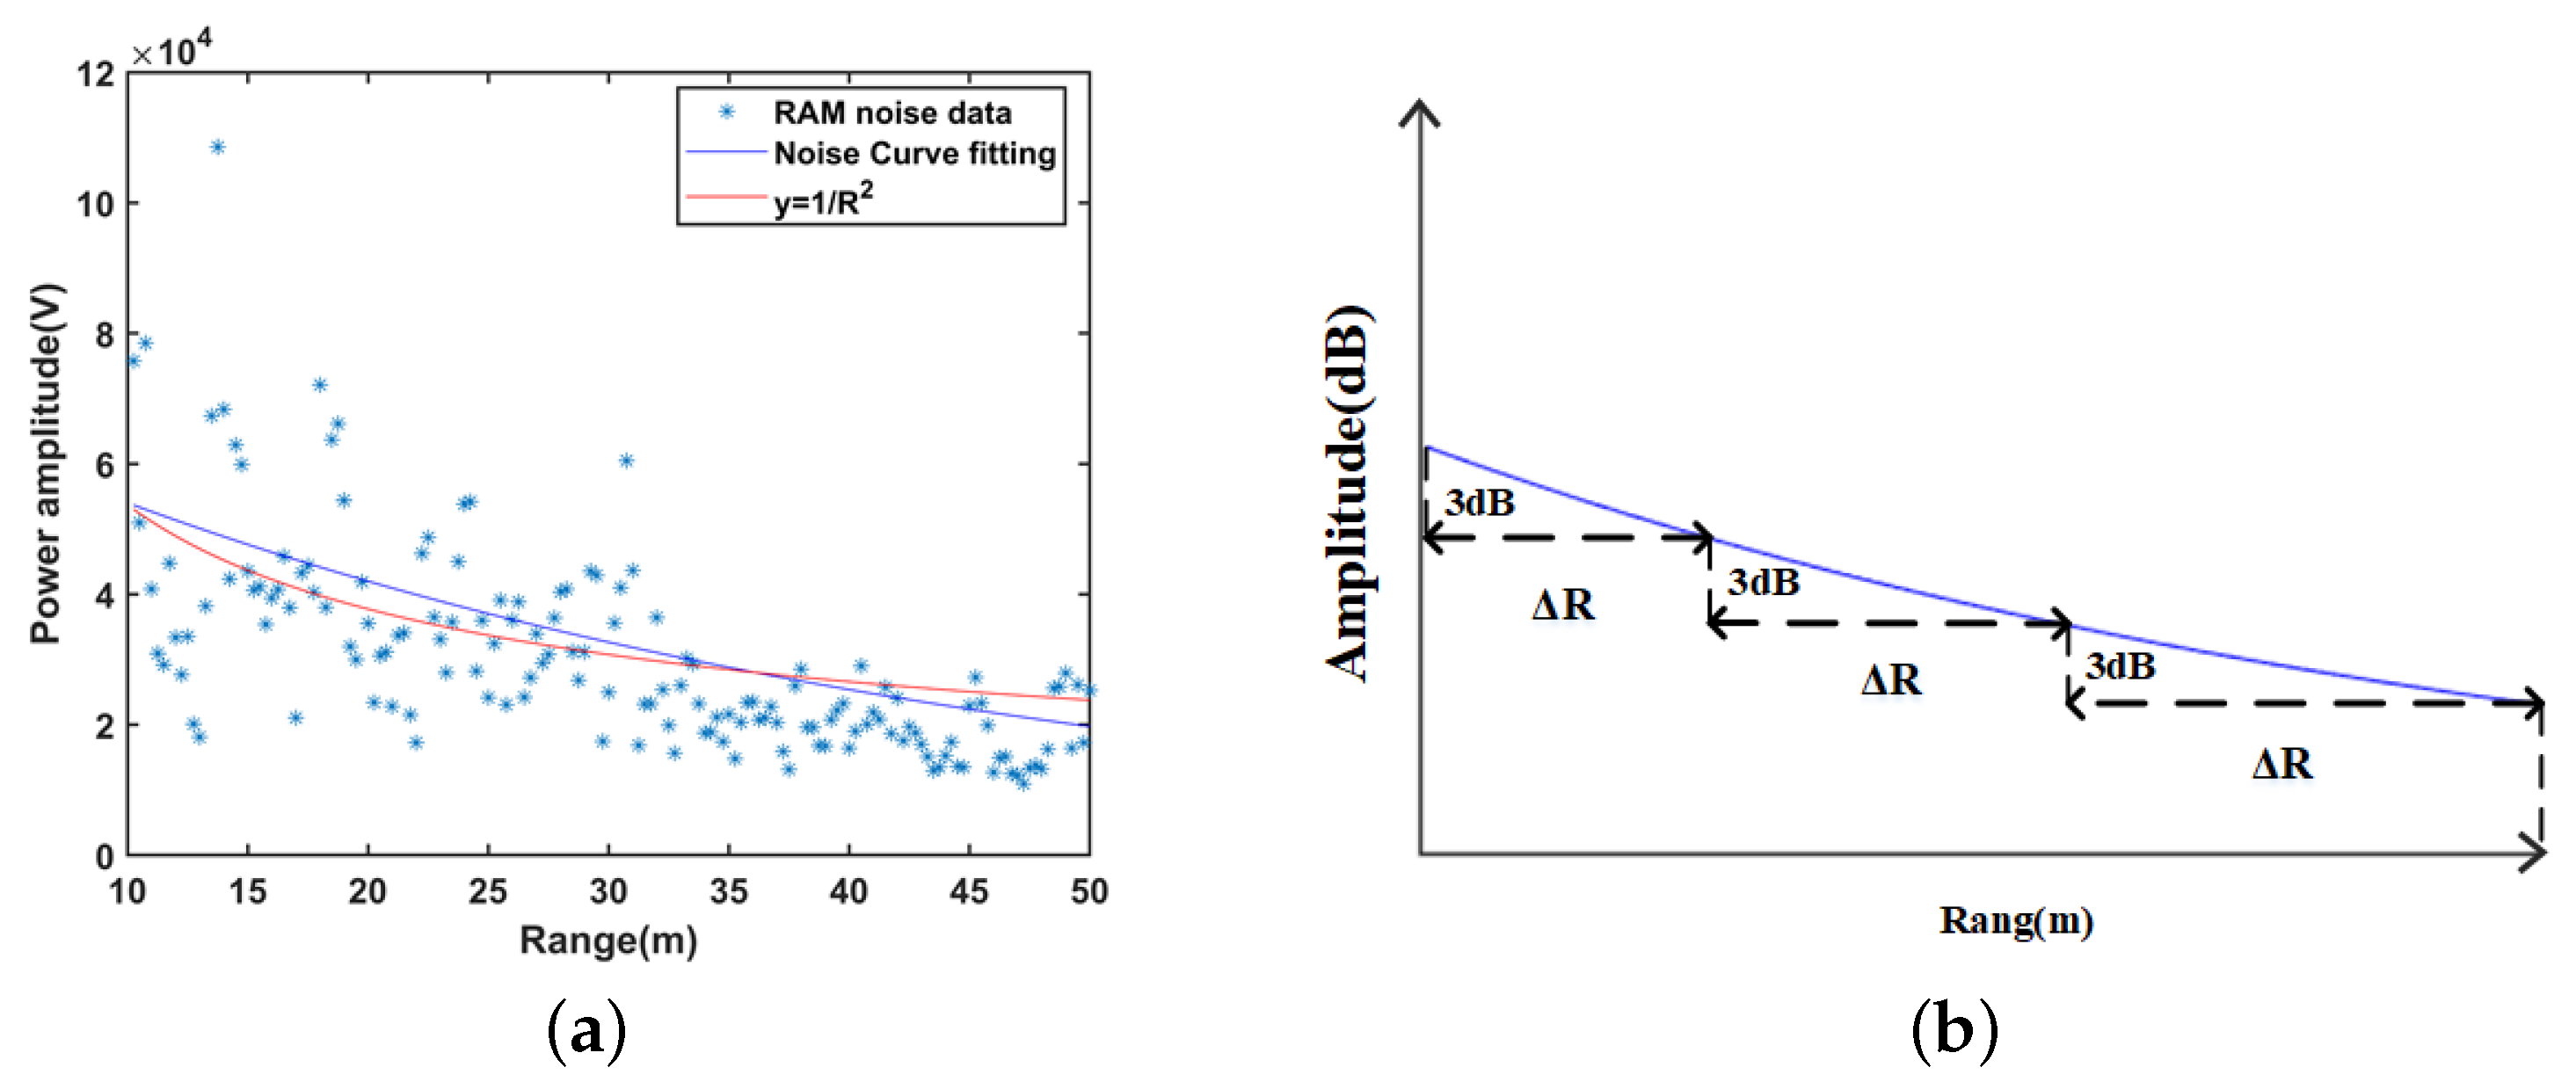
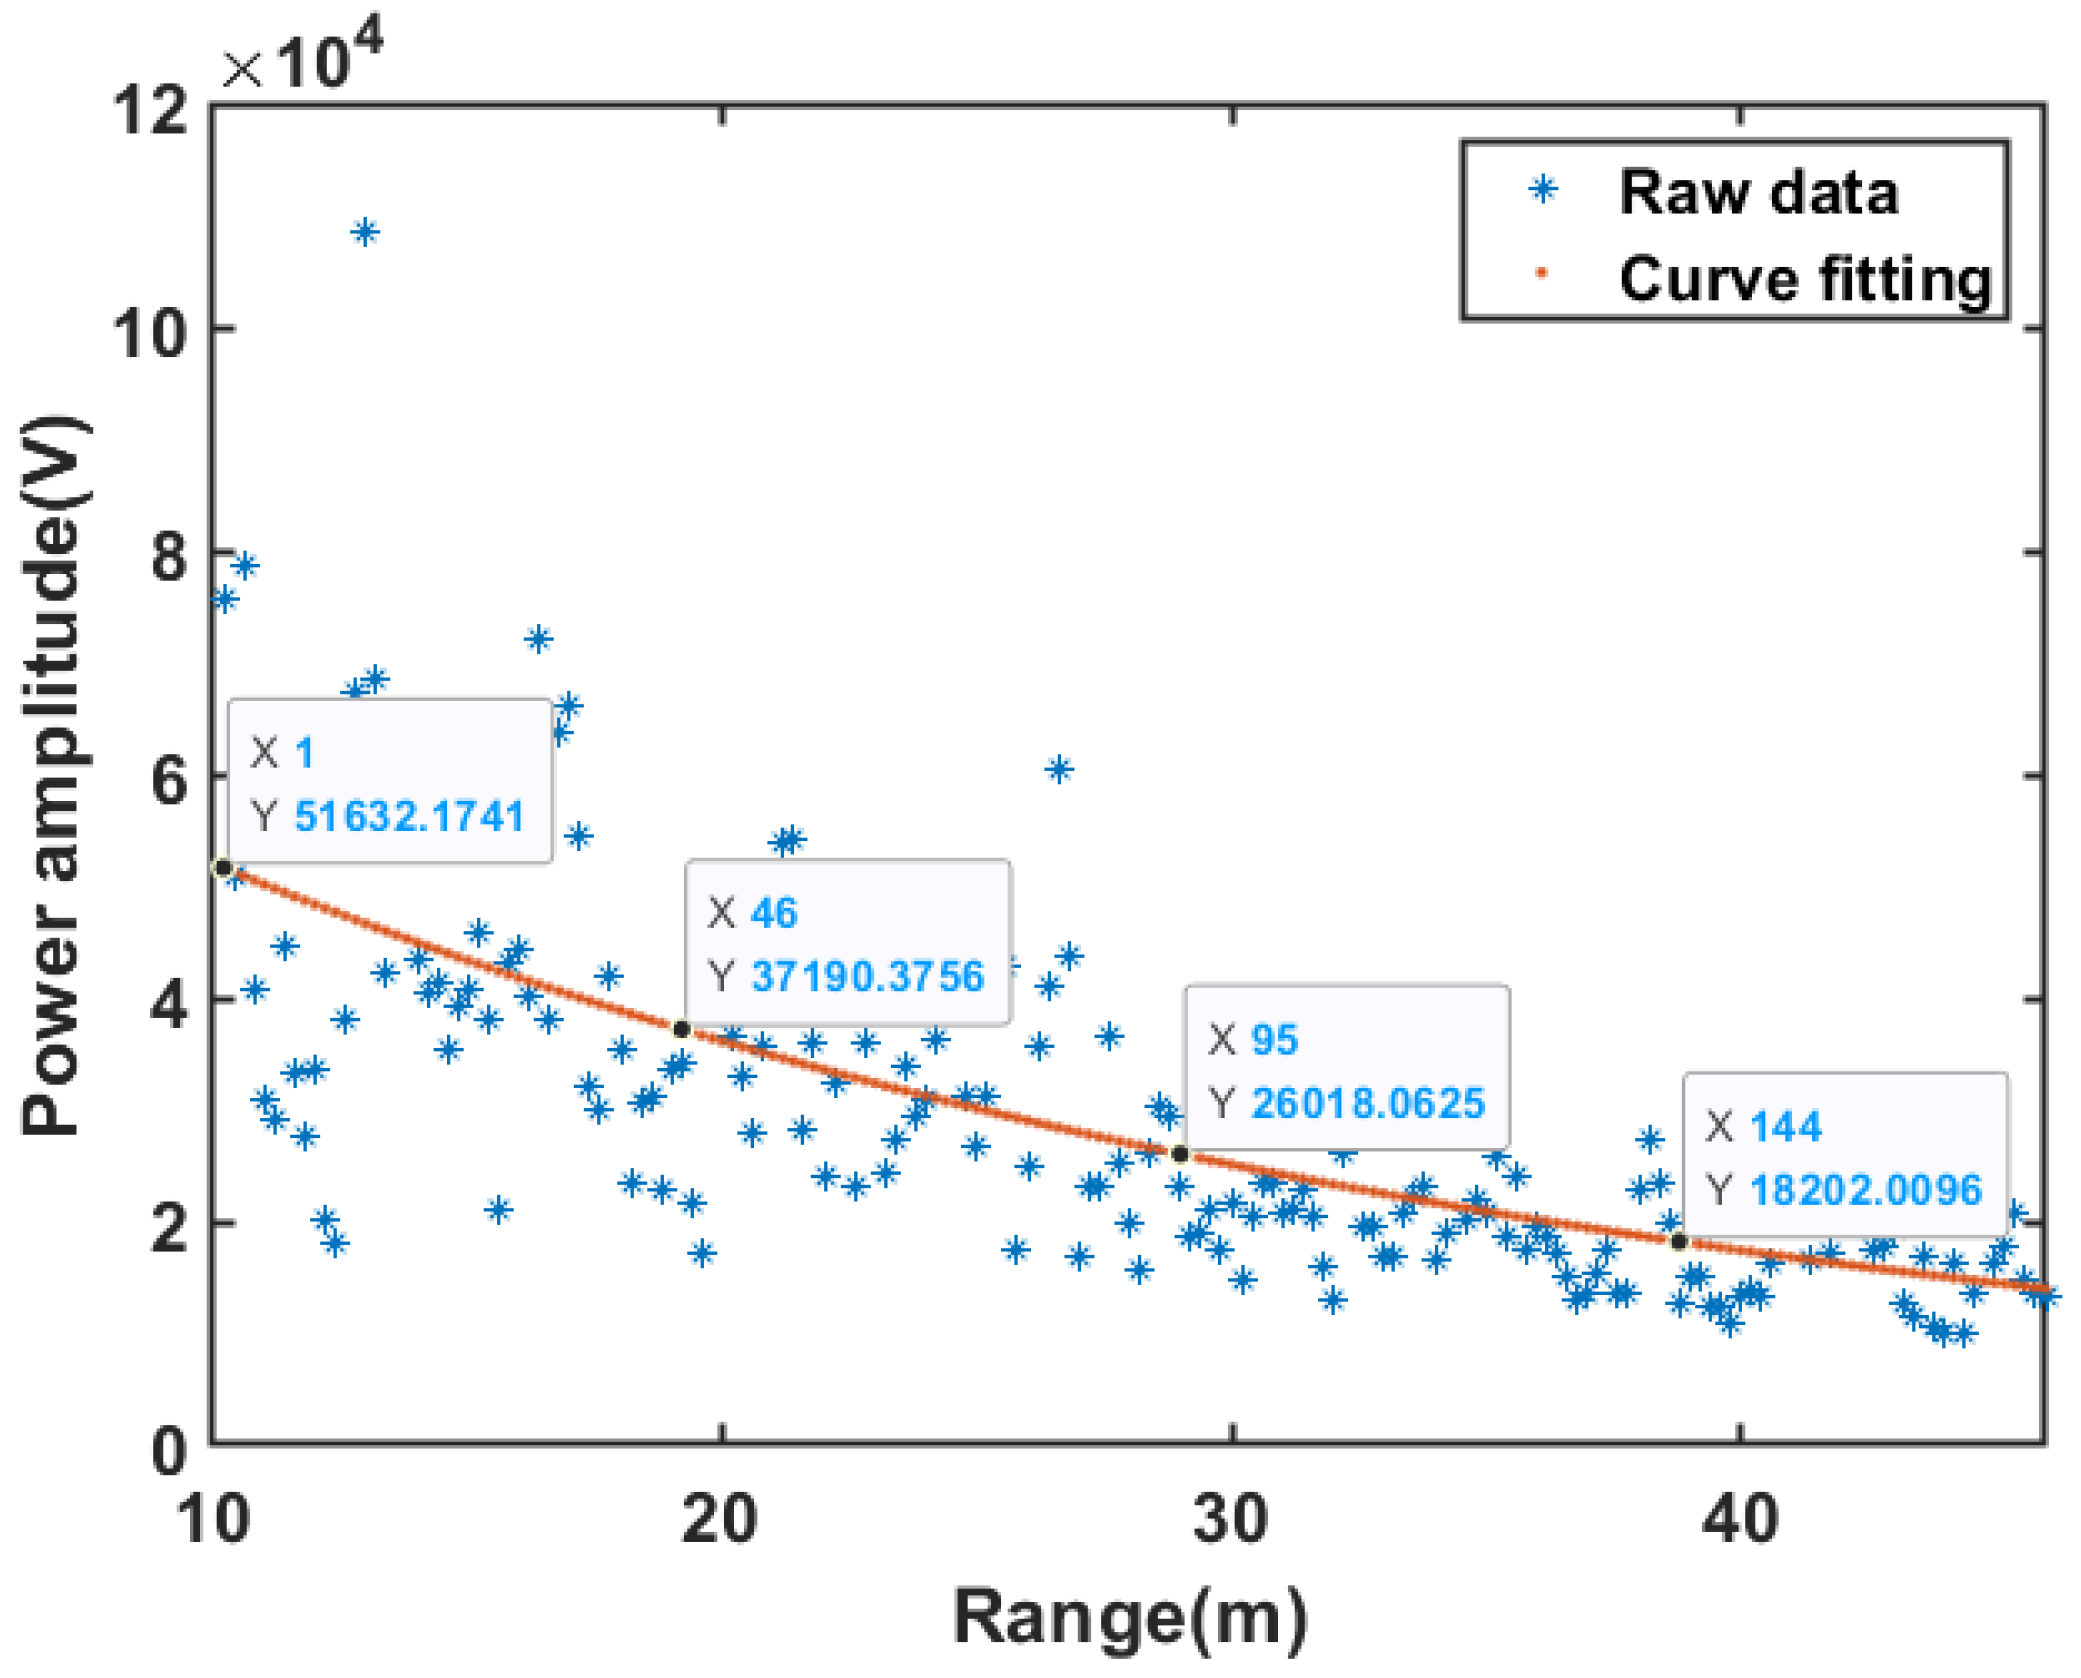
To better extract static targets in traffic scenes, we convert the zero-Doppler data in the RDM into the range–angle power spectrum matrix (RAM) by angular dimensional FFT. In RAM, static targets and lane backgrounds are separated in different distance angle cells (as shown in Figure 11b), just as moving targets are distributed in RDM. However, the MC-CFAR algorithm proposed above is unsuitable for static target detection because the noise power has a non-uniform distribution in RAM, which changes with distance (the discrete points in Figure 12a). Through statistics and fitting, we can obtain a fitted curve of background noise power and distance (blue curve in Figure 12a). The overall trend is similar to 1 R 2 (the blue curve in Figure 12a).
Although the noise amplitude in the RAM is no longer uniformly distributed, the trend of noise amplitude changes moderately, especially with increasing distance. Therefore, we divide the RAM into multiple sub-RAM spaces along the distance dimension based on the scale of the 3 dB drop of the fitted curve (as shown in Figure 12b). Consider that the background noise amplitude in the sub-spaces fluctuates uniformly. The MC-CFAR algorithm will be executed separately in each RAM subspace to achieve static target detection. We call this method the improved MC-CFAR algorithm, and the algorithm flow is as follows:
  • Step 1: Extract the zero-Doppler column of each RDM from different receiving channels and implement the angle dimension FFT on each range cell to obtain the RAM.
  • Step 2: Obtain the interval parameter for dividing RAM. Firstly, the background noise samples in RAM are extracted, and the change curve between noise power and distance is fitted. Then, we obtain the interval parameters based on the scale of the 3 dB drop of the fitted curve. When the detection environment and platform remain unchanged, this step only needs to be performed once.
  • Step 3: Divide the RAM to form multiple sub-RAM spaces along the distance dimension based on interval parameters.
  • Step 4: Implement the MC-CFAR algorithm for each sub-RAM space separately to search and extract all static targets.
Although the time complexity of the improved MC-CFAR algorithm is higher than the original MC-CFAR, it retains the good detection performance of the MC-CFAR algorithm. In addition, through the division of sub-spaces, the MC-CFAR algorithm can be applied to detect stationary objects in traffic scenes.

3.2. The HPC-SNR Algorithm for Speed Ambiguity

When the velocity of the target exceeds maximum unambiguous velocity of the radar, there will be a deviation between the velocity estimate value ( V C F A R ) (Doppler compensation phase ( φ C F A R )) directly detected by the CFAR detector and the actual velocity of the radar ( V t r u e ) (true required Doppler compensation phase ( φ t r u e )). The error relationship is shown in Equation (14):
V t r u e = V C F A R + N V m a x φ t r u e = φ C F A R + k π , N Z
where N denotes the ambiguous cycles and k = 1 2 N is Doppler ambiguous cycle.
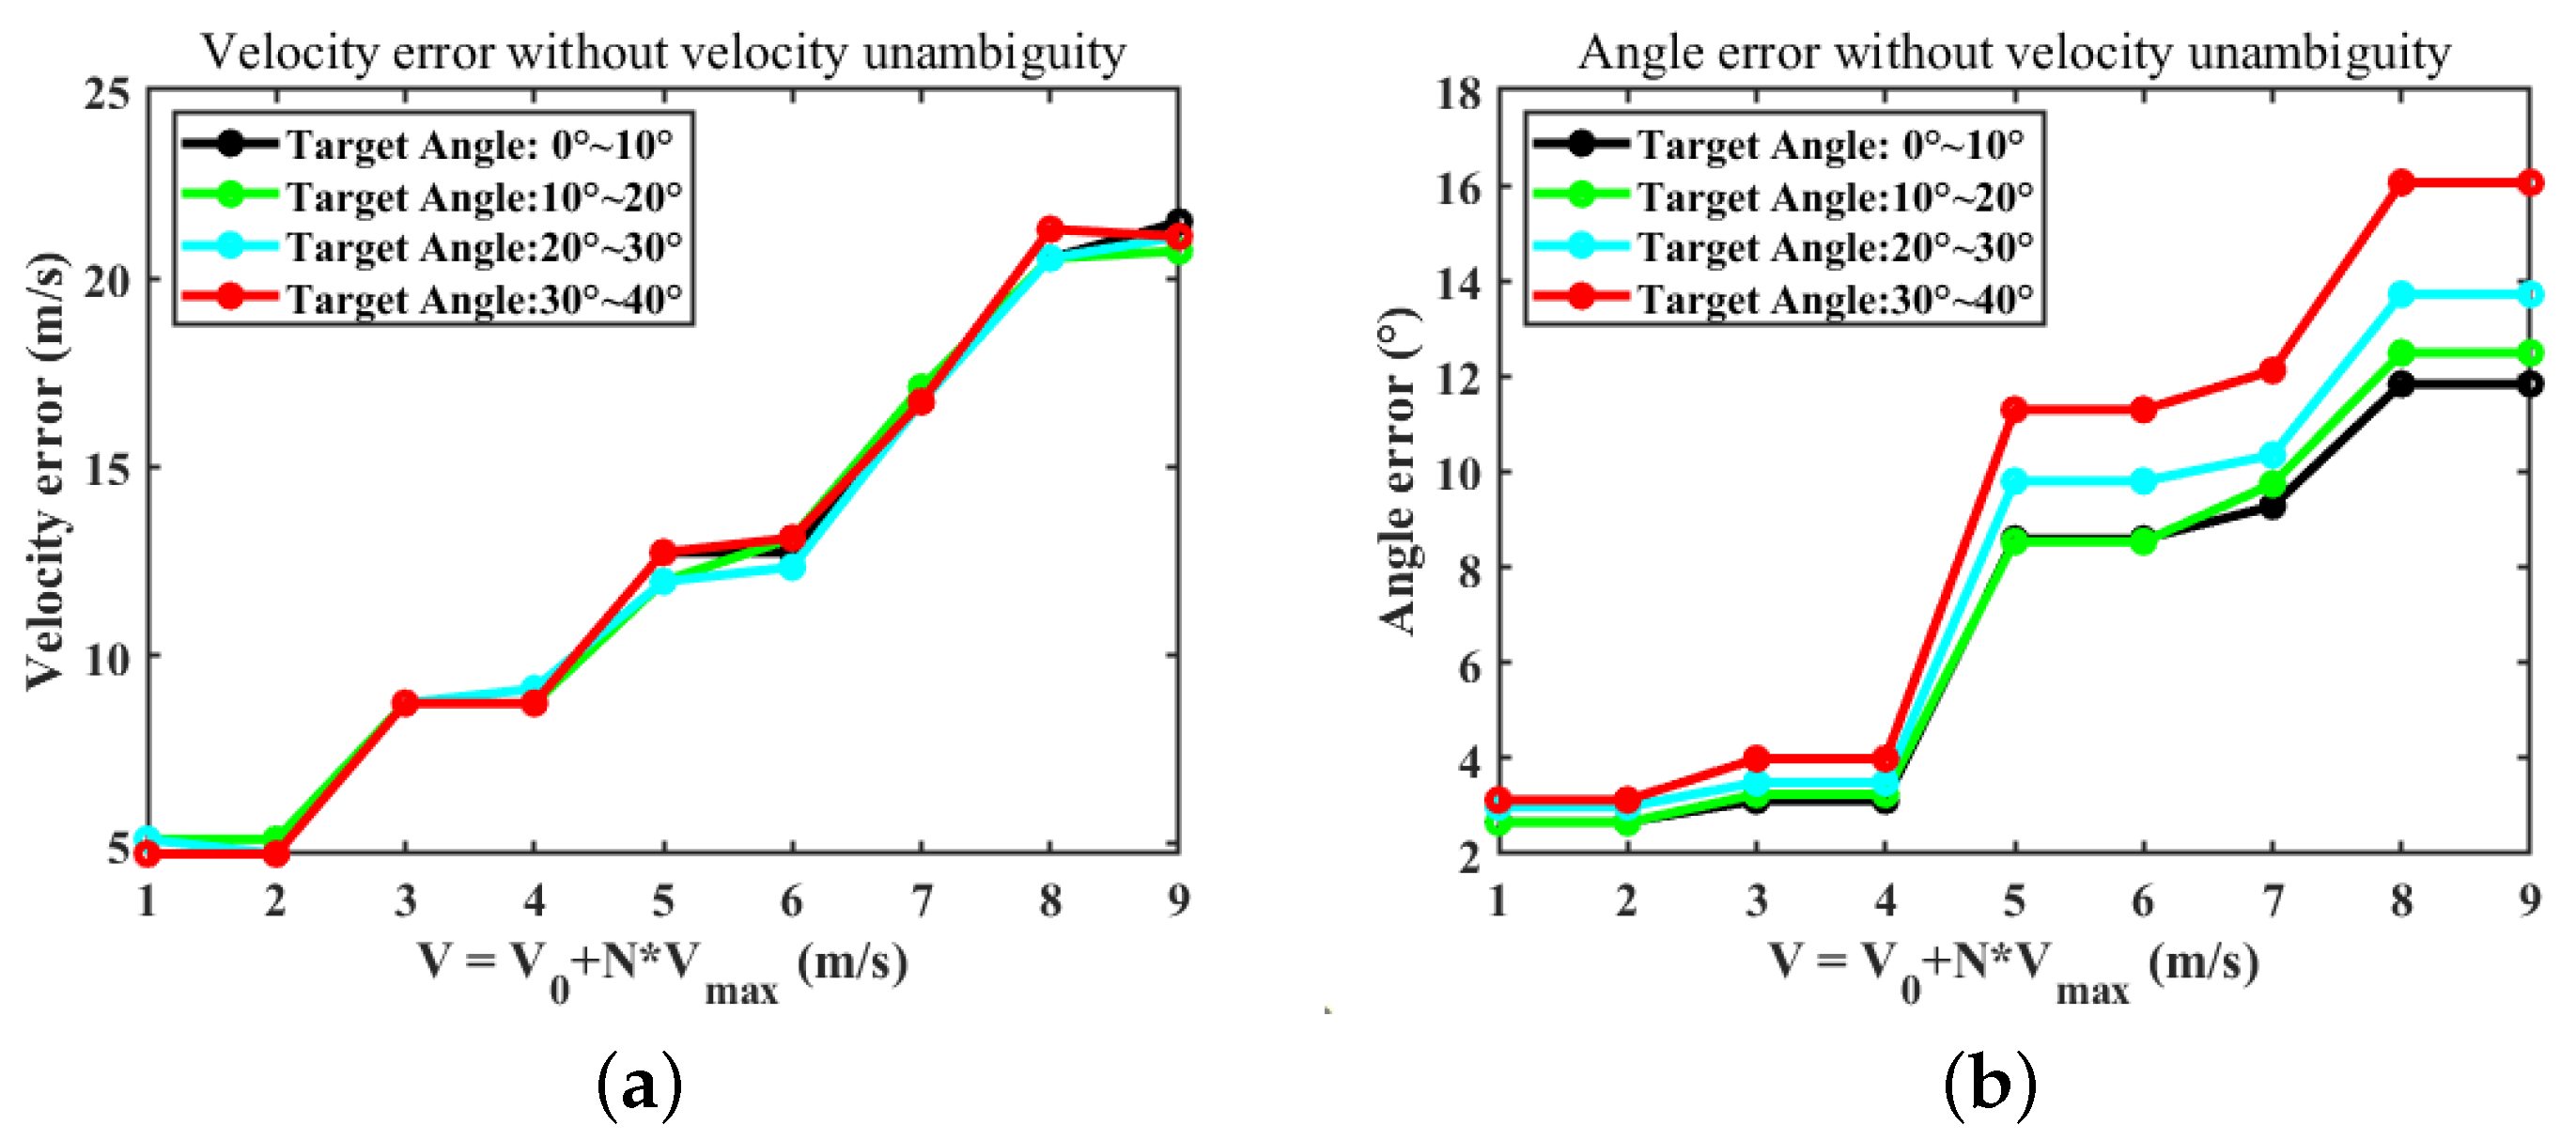
In MIMO radar systems, velocity ambiguity affects the correctness of radar estimation of target velocity and angle. As the target velocity increases, the difference between the target velocity detected by CFAR and the actual target velocity keeps growing (as shown in Figure 13a). At the same time, the radar angle estimation error also increases gradually (as shown in Figure 13b). In addition, as the angle of the target with respect to the radar center is larger, the error between the value of the estimated angle and the actual angle is larger. In this case, the imaging radar cannot obtain the correct image of the moving target.
The hypothetical phase compensation (called HPC-Peak in this paper) algorithm is proposed, which can estimate the velocity of the target in the case of large velocity ambiguity cycles, and avoids multiple radar waveform designs. Ideally, the maximum detectable velocity of the HPC is M t V m a x , where M t is the number of transmit antennas of the radar. However, when multiple targets are in the same range-Doppler cell, the HPC-Peak algorithm may fail due to peak fluctuations in the angular power spectrum and mutual interference between peaks. In imaging applications, due to the high resolution of the radar in terms of range and angle, the size of the vehicle cannot be ignored. The information of different parts from the same vehicle may be stored in the same range-Doppler cell.
To address this issue, we choose the more stable angle spectrum SNR maximum value as the judgment basis rather than the energy peak value. Then, the improved HPC algorithm is called the HPC-SNR. The algorithm flow is as follows:
  • Step 1: Based on the output phase of the CFAR detector ( φ C F A R ), enumerate all possible Doppler phases ( φ H ) that may need to be compensated:
    φ n e e d k = φ C F A R + 2 k π
    where k Z indicates the speed estimation range.
  • Step 2: Calibrate the radar data with each hypothetical phase sequentially:
    H 1 : S i = S i e x p ( i 1 M t φ n e e d 1 ) H 2 : S i = S i e x p ( i 1 M t φ n e e d 2 ) . H k : S i = S i e x p ( i 1 M t φ n e e d k ) , i = 1 , 2 , 3 , · , M t
    where S i is the echo signal data from the i-th transmitting antenna.
  • Step 3: Perform FFT operation on the calibrated radar data to obtain the angular power spectrum under each hypothetical condition ( H k ).
  • Step 4: According to the HPC-Peak algorithm, if the hypothesis with maximum peak point in the FFT power spectrum is accurate, then the velocity and the angle corresponding to this hypothesis are the true velocities and angle of the target. Unlike the HPC-Peak algorithm, HPC-SNR will extract the maximum value of SNR in each hypothesis and consider the hypothesis with the largest SNR value as true. Then, the speed and the angle corresponding to this hypothesis will be the actual speed and angle of the target.

3.3. Noise Removal Based on DBSCAN Algorithm

There will be some noise points in the radar point cloud image due to the false alarm of the detector. These noises are usually outliers, sparse, and displayed as tiny clusters. Especially, in static target imaging, the noise points appear more frequently and persistently due to the complex energy distribution of the background noise and the gradual changes of the background environment. The presence of noise points affects the quality of radar imaging and may also lead to misjudgment of the target, such as being misjudged as an obstacle when noise appears in the driveway.
The DBSCAN is a density-based clustering algorithm. It can divide regions with sufficient density into clusters and find arbitrary shape clusters in a spatial noise database. More importantly, DBSCAN does not require prior knowledge of the number of cluster classes to be formed, is insensitive to the order of the data samples, and is highly robust. We use the DBSCAN algorithm to cluster the data output by the improved MC-CFAR, determine the outliers and remove them, and then obtain a “clean” point cloud image of the static target. The DBSCAN algorithm flow is as follows:
  • Step 1: Determine the parameters E p s and m i n P t s . E p s represents the maximum radius. If the distance between data points is less than or equal to the specified radius, they belong to the same neighborhood. m i n P t s stands for the minimum number of points. When the number of points in a domain is the minimum number, these points are considered a cluster.
  • Step 2: Find core points to form temporary clusters. All sample points are scanned; if the number of sample points within the radius of a sample point is greater than m i n P t s , the sample point is considered to be a core point. With the core point as the center, the set of all points with direct density with the core point is regarded as a temporary cluster.
  • Step 3: Start from any core point; merge the temporary clusters that satisfy the distance relationship (< E p s ) to obtain the final cluster.
  • Step 4: Points that do not belong to any clusters are considered outliers and should be removed.

3.4. 2D Point Cloud Imaging and Vehicle Information Perception

After being processed by the imaging algorithms, we can accurately obtain the range, velocity, and azimuth angle of the target relative to the radar. According to the geometric relationship, the target is projected on a two-dimensional plane centered on the radar (as shown in Figure 14).
Figure 14a illustrates the geometric relationship between the radar and the target. The radar is installed on the roadside (height: H) to detect vehicles on the road from a bird’s-eye view, where R is the distance from the radar to the target, L is the distance between the origin of the coordinate and the target, and h is the height of the target. The y-axis is parallel to the lane and θ = θ 1 + θ 2 is the azimuth angle of the target, where θ 1 is the angle between the target and the center of the radar, and θ 2 (fixed value) is the angle between the center of the radar beam and the direction of the lane. The mapping relationship of any point on the target in two-dimensional coordinates is
X t a r g e t = s i n ( θ ) L Y t a r g e t = c o s ( θ ) L
where L = R 2 ( H h ) 2 .
Figure 14b shows the effect of mapping the three surfaces of the vehicle to a two-dimensional plane. The surfaces of the vehicle are deformed to different degrees during the projection process. The length and width of the target are also stretched or compressed. In fact, it is not desirable to estimate the size of the target directly from the length and width of the target point cloud image. Due to the absence of height information, the error caused by the deformation of the image area cannot be estimated (as shown by the red dashed circles in Figure 14b), which will lead to an incorrect target in the estimation of the size of the target. In addition, factors such as occlusion between targets, discrete point cloud distribution of large vehicle, and differences in strength of reflected energy in different parts will affect the estimation of the length and width of the target.
The transformation of the target from “ideal point” to “point cloud block” is the most prominent feature of radar imaging. The size and type of the target directly affect the area of the point cloud image of the target, i.e., the larger the size of the target, the larger the point cloud area in the 2D image. Although the shape of the surface of the target changes, it has less effect on the area. Thus, we propose a method to perceive the target information, i.e., to first classify the target based on the result of the point cloud imaging and then assign a value to the target size. The process is as follows:
  • Step 1: By calculating the area of different targets in the radar image, we set the minimum area unit U.
  • Step 2: Divide the target into three categories based on the relationship between the point cloud area of the target (S) and the minimum unit: ordinary small cars ( S < P 1 U ), medium-sized cars ( P 1 U < S < P 2 U ), and large buses ( S > P 2 U ).
  • Step 3: The vehicle size is inferred in a reverse way according to the industry rules on vehicle types and sizes.
Although the information acquired by using this method may not be accurate for every vehicle, it ensures a stable estimation of the vehicle type and size throughout the monitored road segment and provides information about the height of the target.

4. Numerical Simulations and Comparison

In this chapter, the performance of key algorithms in the improved 3D-FFT algorithm framework is verified by numerical simulation and compared. To ensure accuracy, all parameters in the simulation are consistent with radar system parameters, as shown in Table 1.

4.1. Target Detection Algorithm Performance Simulation and Comparison

4.1.1. The MC-CFAR Algorithm Performance

In the previous work, we verified the detection sensitivity of the MC-CFAR algorithm. After Monte Carlo repetition experiments, the MC-CFAR algorithm has the highest detection sensitivity compared with the commonly used CFAR algorithm at the same false alarm rate, as shown in Figure 15a. In addition to its high detection sensitivity, the MC-CFAR algorithm has the lowest time complexity, which reduces the processing delay and makes the algorithm more suitable for changing traffic scenarios, as shown in Figure 15b.
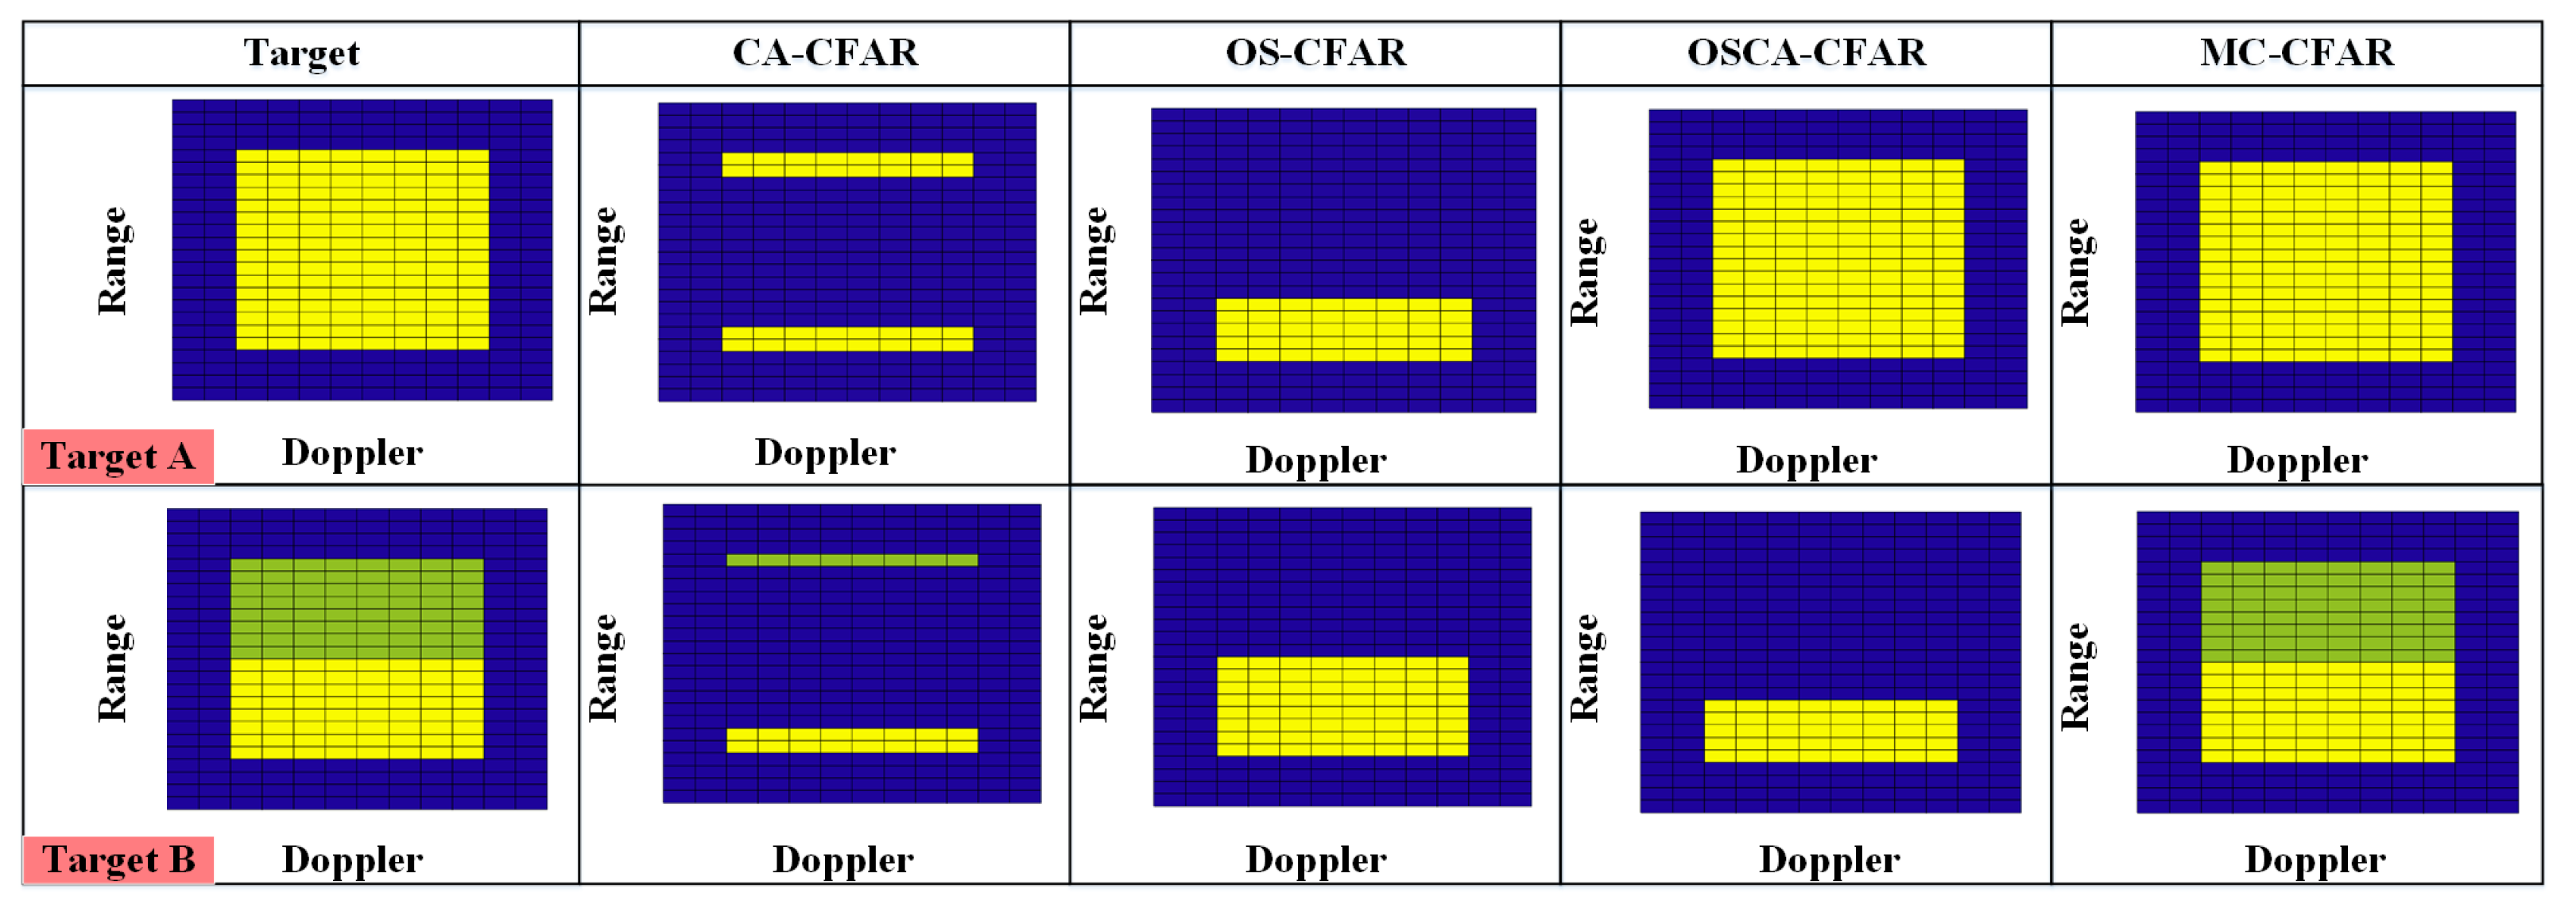
In traffic imaging applications, another requirement for the detection algorithm is to completely detect and extract the “plaque-like” target, which directly affects the final imaging effect. Figure 16 shows the detection results of “plaque-like” targets using different CFAR algorithms. We give two hypothetical targets: (1) Target A, of which the reflected power of the different parts is approximately the same. (2) Target B, of which the reflected power of different parts is different. The target size is L × M = 16 × 8 , where L is the number of range cells and M is the number of Doppler cells. It can be seen that the CFAR algorithm based on the sliding reference window is unsuitable for detecting “plaque-like” targets. Some anomalies may occur, such as target segmentation, loss of target information, and missed detection of the parts reflecting weak energy. On the contrary, the MC-CFAR algorithm, not limited by the reference window, can entirely detect the target.

4.1.2. The Improved MC-CFAR Algorithm Performance

For the improved MC-CFAR algorithm, the sensitivity is similar to the MC-CFAR algorithm because it is essentially multiple MC-CFAR algorithms performing detection of a uniformly distributed noisy background. Unlike the MC-CFAR algorithm, the improved MC-CFAR algorithm can accomplish target detection in non-uniform background noise power distribution through region division.
To verify the detection performance of the improved MC-CFAR algorithm, we extract a section of background noise from RAM for simulation experiments, where the background noise in RAM comes from real urban traffic scenes. As shown in Figure 17, in the clutter background with a length of 180, four targets are added at 50, 122, 126, and 131. The detection thresholds of different CFAR algorithms are shown as lines of different colors. When the signal strength exceeds the threshold, it indicates that the signal is the target; otherwise, it is noise. In the improved MC-CFAR algorithm, the noise segment is divided into three parts based on the 3 dB descent gradient of the fitting curve (as shown in Figure 17b. The background noise amplitude in each region is considered evenly distributed.
As shown in Figure 17a, the improved MC-CFAR algorithm can handle the target detection task with a non-uniform distribution of background noise power compared with the MC-CFAR algorithm. Compared with the CA-CFAR algorithm, the improved MC-CFAR has multi-target detection capability. In addition, the improved MC-CFAR algorithm retains the ability of MC-CFAR to detect speckled targets, which is not available in the OS-CFAR algorithm.
Through the analysis, we can obtain the following two conclusions:
  • When there are multiple targets in the same range-Doppler cell, the performance of the HPC-Peak algorithm is unstable. Once the algorithm fails, there is a large error between the estimated angle and the true value, and the number of targets is incorrectly estimated. However, the HPC-SNR algorithm maintains good performance in multi-object situations. Moreover, the angular power spectrum can correctly reflect the number of targets.
  • The improved MC-CFAR algorithm maintains the advantages of the MC-CFAR algorithm and realizes target detection under a non-uniform noise background by fitting and dividing the noise curve, which makes up for the shortage of the MC-CFAR algorithm.

4.2. The HPC-SNR Algorithm Performance Simulation and Comparison

When there is only a single target in the range-Doppler cell, the performance of the proposed HPC-SNR algorithm is similar to the HPC Peak algorithm. They can both solve the velocity ambiguity problem with large velocity ambiguity cycles. As shown in the simulation results in Figure 18, although the target velocity is increasing, the error between the target actual velocity and the estimated velocity value does not exceed 0.6 m/s, and the error between the target real angle and the estimated angle value does not exceed 0.15°.
The most significant advantage of HPC-SNR is that when there are multiple targets in the same range Doppler unit, it can stably and correctly give all targets’ true speed and angle information, which is needed for traffic imaging applications. Figure 19 shows the velocity disambiguation performance of HPC-Peak and HPC-SNR algorithms when there are multiple targets in the same range-Doppler cell. In the simulation, multiple angle values were randomly selected from 40 to 40 . Angles with different values are randomly combined to form angle test groups, such as ( θ i , θ j ) , ( θ i , θ j , θ p ) , or ( θ i , θ j , θ p , θ q ) , where ( θ i θ j θ p θ q ) . In addition, the difference between angular values belonging to the same angle test group is larger than the angular resolution of the radar.
We use the error between the estimated angle obtained after velocity compensation and the actual value to measure the performance of the algorithm, as shown in Figure 19a,b,d,e,g,h. Figure 19c,f,i shows the angular power spectrum waveform after HPC algorithm compensation and FFT operation. The FFT points represent the angle frequency points of the target—that is, targets at different angles are located at different frequency locations. The number of spectrum peaks represents the number of targets.
It can be seen that some angle groups may make the HPC-Peak algorithm fail under multi-object velocity disambiguation. Once HPC-Peak fails, there will be a large error between the estimation angle of the target and the real one (the maximum error can reach 5 ° ), as shown by the red dot area in Figure 19a,d,g. Further, the number of peaks in the angular power spectrum does not match the true number of the targets (as shown in the red angular spectrum waveform in Figure 19c,f,i), i.e., the number of targets is misestimated. On the contrary, the HPC-SNR algorithm has always maintained good performance in Doppler compensation. Throughout the experiment, the error between the estimated angle and the actual value does not exceed 0.5 ° and the number of peaks of the power spectrum is consistent with the number of actual targets, as shown by the blue dot area and waveform in Figure 19b,e,h,c,f,i. Through the experiment, the following two conclusions can be obtained:
  • When there are multiple targets in the same range-Doppler cell, the performance of the HPC-Peak algorithm is unstable. Once the algorithm fails, there is a large error between the estimated angle and the true value, and the number of targets is incorrectly estimated. However, the HPC-SNR algorithm maintains good performance in multi-object situations. Moreover, the angular power spectrum can correctly reflect the number of targets.
  • In the case where both algorithms are valid, the HPC-SNR algorithm performs better, i.e., the error of angle estimation is smaller, especially in the case of multi-objective situations.

4.3. Noise Removal Algorithm Simulation

In radar point cloud imaging, targets are always presented in the form of clustered point sets. Thus, we can use the clustering method to condense the target and eliminate the outliers caused by CFAR false alarms to obtain a higher-quality point cloud image. The k-mean and the DBSCAN are two common clustering methods.
In the simulation, we set up three point cloud targets with some outlier points distributed around them, as shown in Figure 20a. The parameters of the DBSCAN algorithm and K-mean algorithm are set with the radar distance resolution as a reference ( R r e s o l u t i o n = 0.1 m), which avoids the removal of real obstacles while removing the noise points. The algorithm parameters are DBSCAN ( E p s = R r e s o l u t i o n , m i n P t s = 3 ), k-mean ( E p s = R r e s o l u t i o n , k = 3 ). Figure 20b,c shows the clustering results of the two clustering algorithms. Obviously, DBSCAN can better remove unwanted outliers. After removing the outliers, clean point cloud imaging can be obtained.

5. Experiment and Result Analysis

In our experiments, we port the proposed algorithms to the radar system platform and show the application effect of the algorithm in real traffic scenarios, used as the actual experimental scene, as shown in Figure 3b. The detailed processing flow of the proposed algorithms on the radar system is shown in Appendix A.2. Through the processing of the imaging algorithm, moving targets (moving vehicles) and stationary targets (roadside trees, stationary vehicles, etc.) on the road are presented in the form of 2D point cloud images. At the same time, the performance of the proposed algorithm is verified and compared.

5.1. Moving Target Imaging Experiment and Analysis

We collected data on vehicles moving at different speeds, in different directions, and on different lanes to verify the performance of the imaging algorithm and the imaging effect, as shown in Figure 21.
The radar center is taken as the coordinate origin, the direction of the radar beam (parallel to the lane direction) as the y-axis, and the perpendicular to the direction of radar beam (perpendicular to the direction of the lane) as the x-axis. The target speed away from the radar is defined as positive speed; otherwise, it is defined as negative speed. The original parameters of the vehicle are shown in Table 3.

5.1.1. Experiment on the Performance of MC-CFAR Algorithm and Comparison with Other Algorithm

For a fair comparison of all the CFAR methods, the parameter configuration of each detection algorithm is adjusted so that the algorithm maintains good detection performance in the radar system and traffic scenario, i.e., the shape of the target output by the detector is as complete as possible and the number of noise points is as little as possible. Through multiple independent experiments and statistics, the optimal configuration parameters of different algorithms on the radar system are obtained, as shown in Table 4.
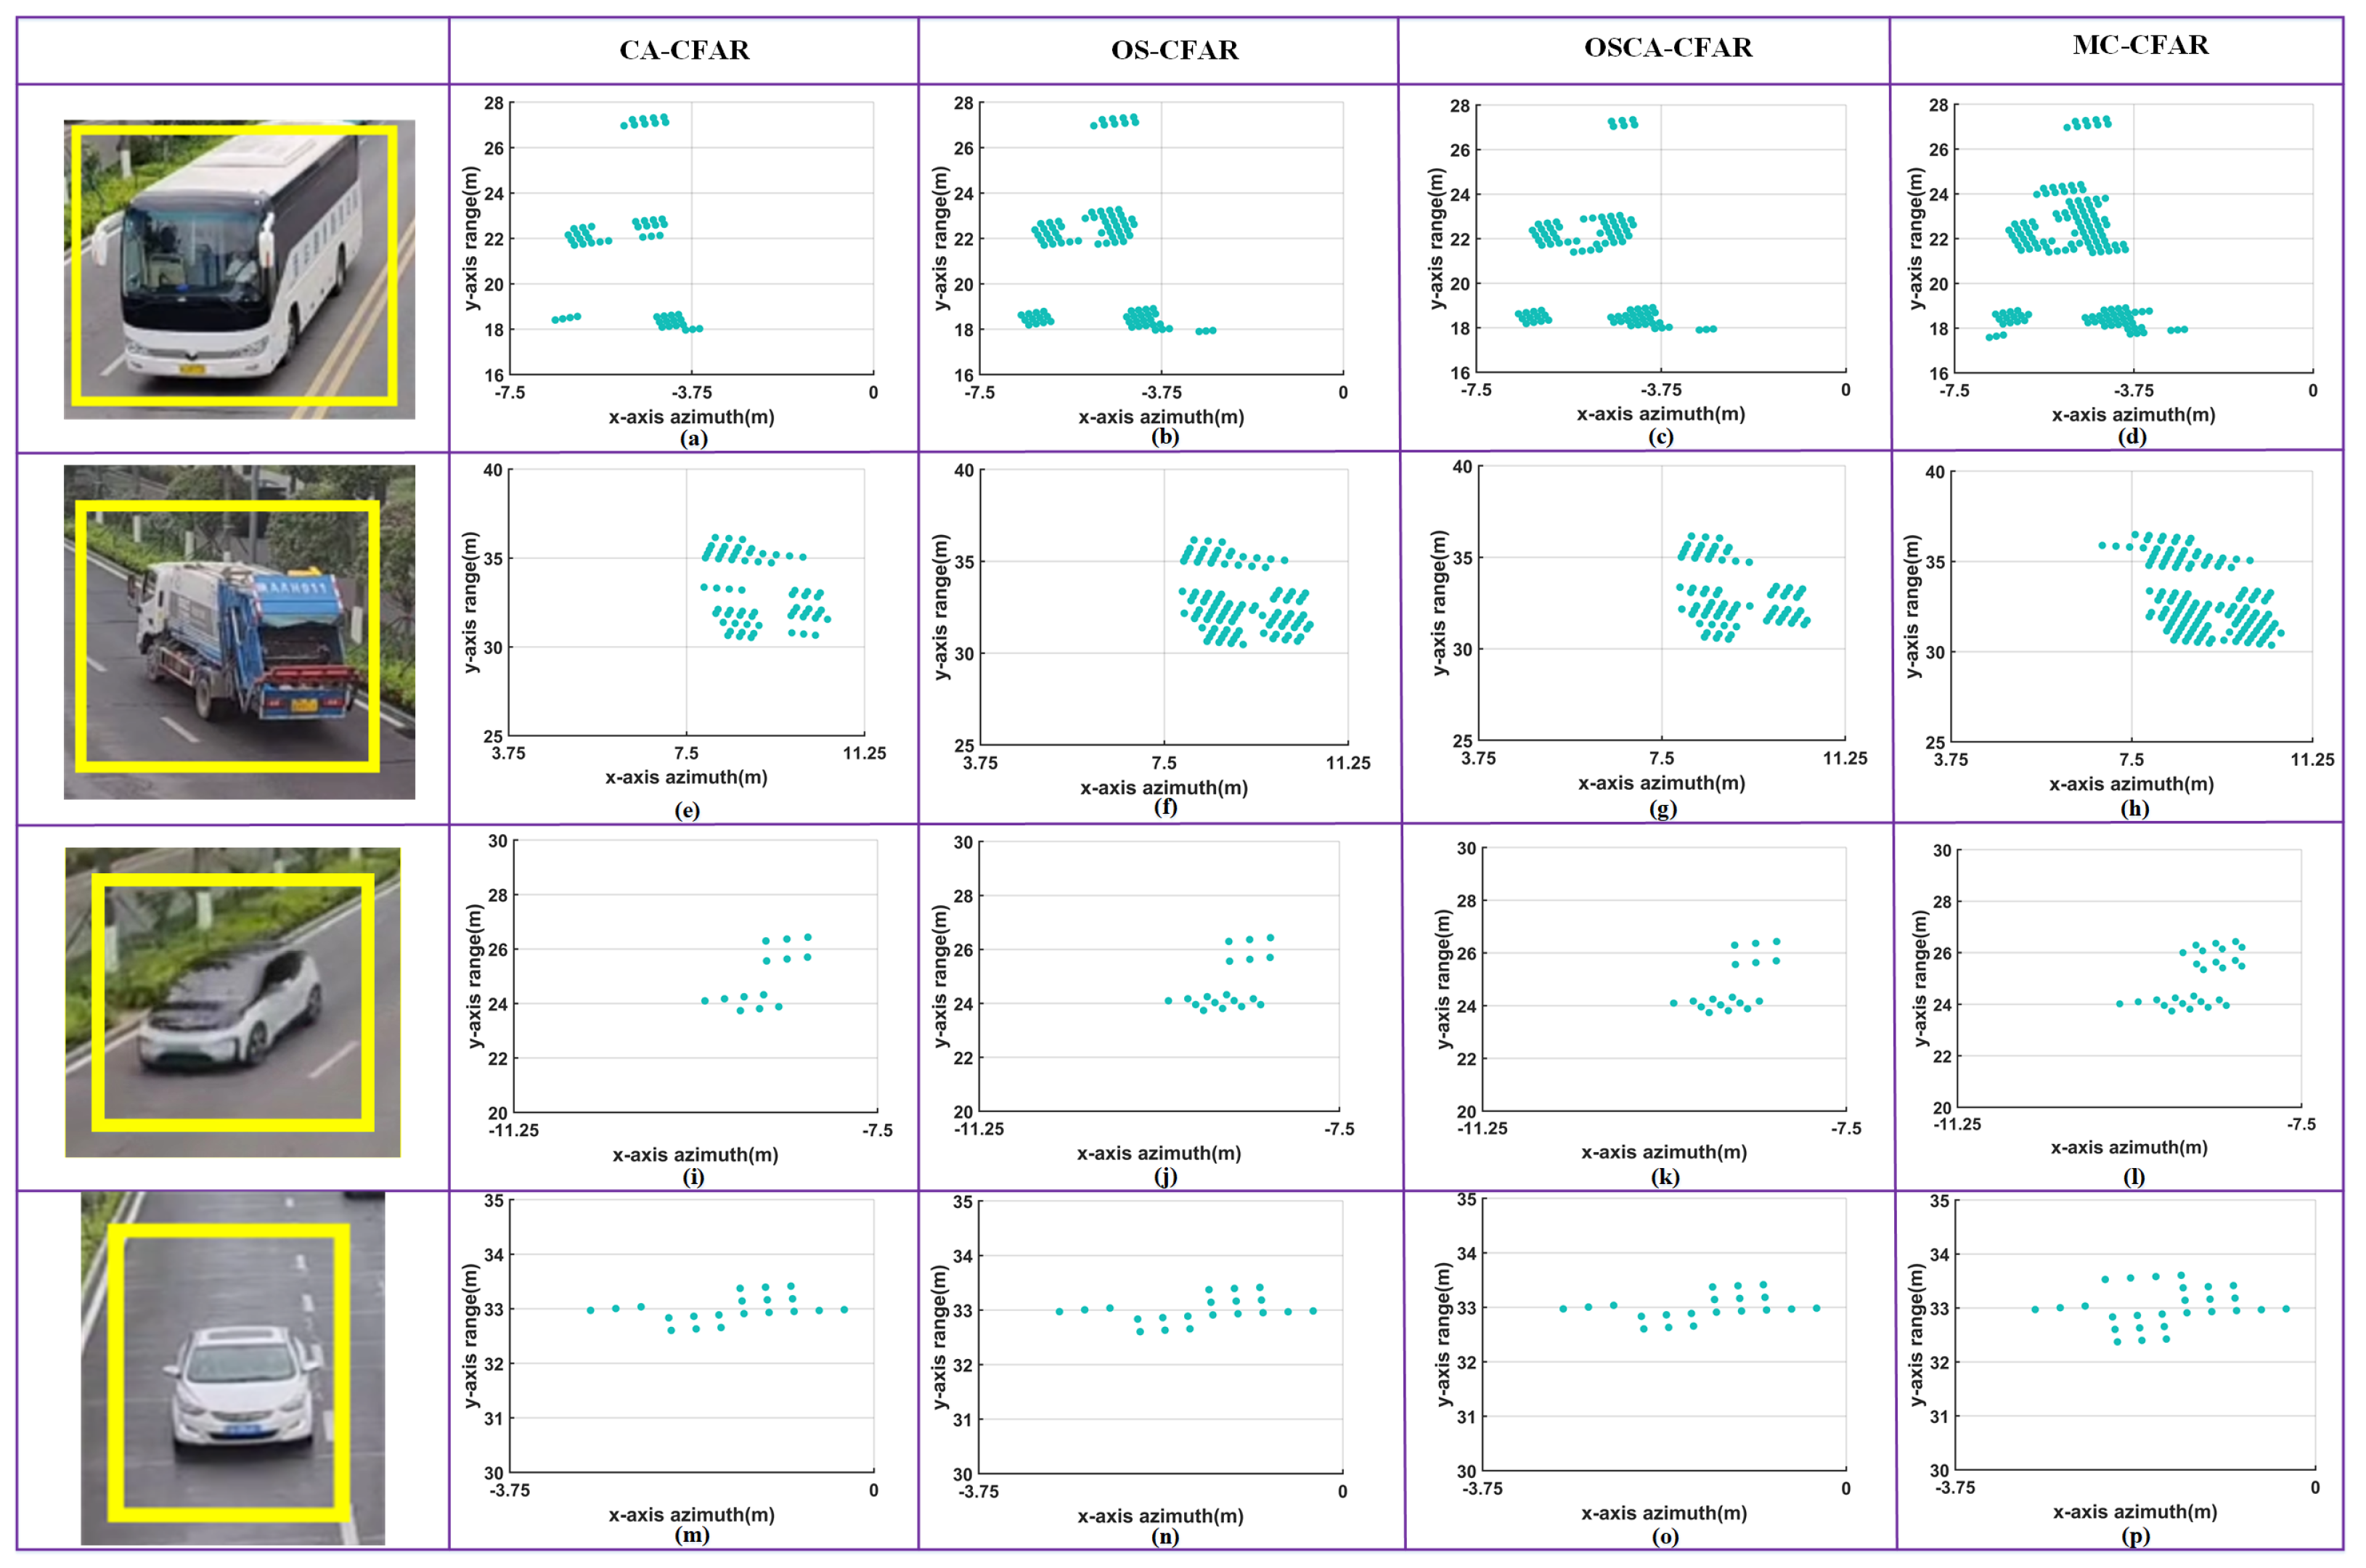
Figure 22 shows the imaging results of moving targets using different CFAR detection algorithms. With the same detection target, the MC-CFAR algorithm with higher detection sensitivity can output more target points than the commonly used CFAR. For all CFAR detectors, as the volume of the detected object continues to increase, the set of point clouds that belong to the same target will be dispersed into multiple subsets. However, the point cloud obtained by the MC-CFAR algorithm is more dense and cohesive, as shown in Figure 22d,h,i,p. In addition, by comparing vehicle 3 and vehicle 4, radar roadside surveillance is more conducive to presenting the shape of the target because it can avoid occlusion of the vehicle itself.
Through the experiments on the detection of actual targets, the MC-CFAR algorithm has the best imaging effect compared with other CFAR algorithms. It can represent the shape of the target with a richer and denser point cloud, which will be beneficial for the recognition of vehicle types.

5.1.2. Velocity Disambiguation for Accurate Imaging

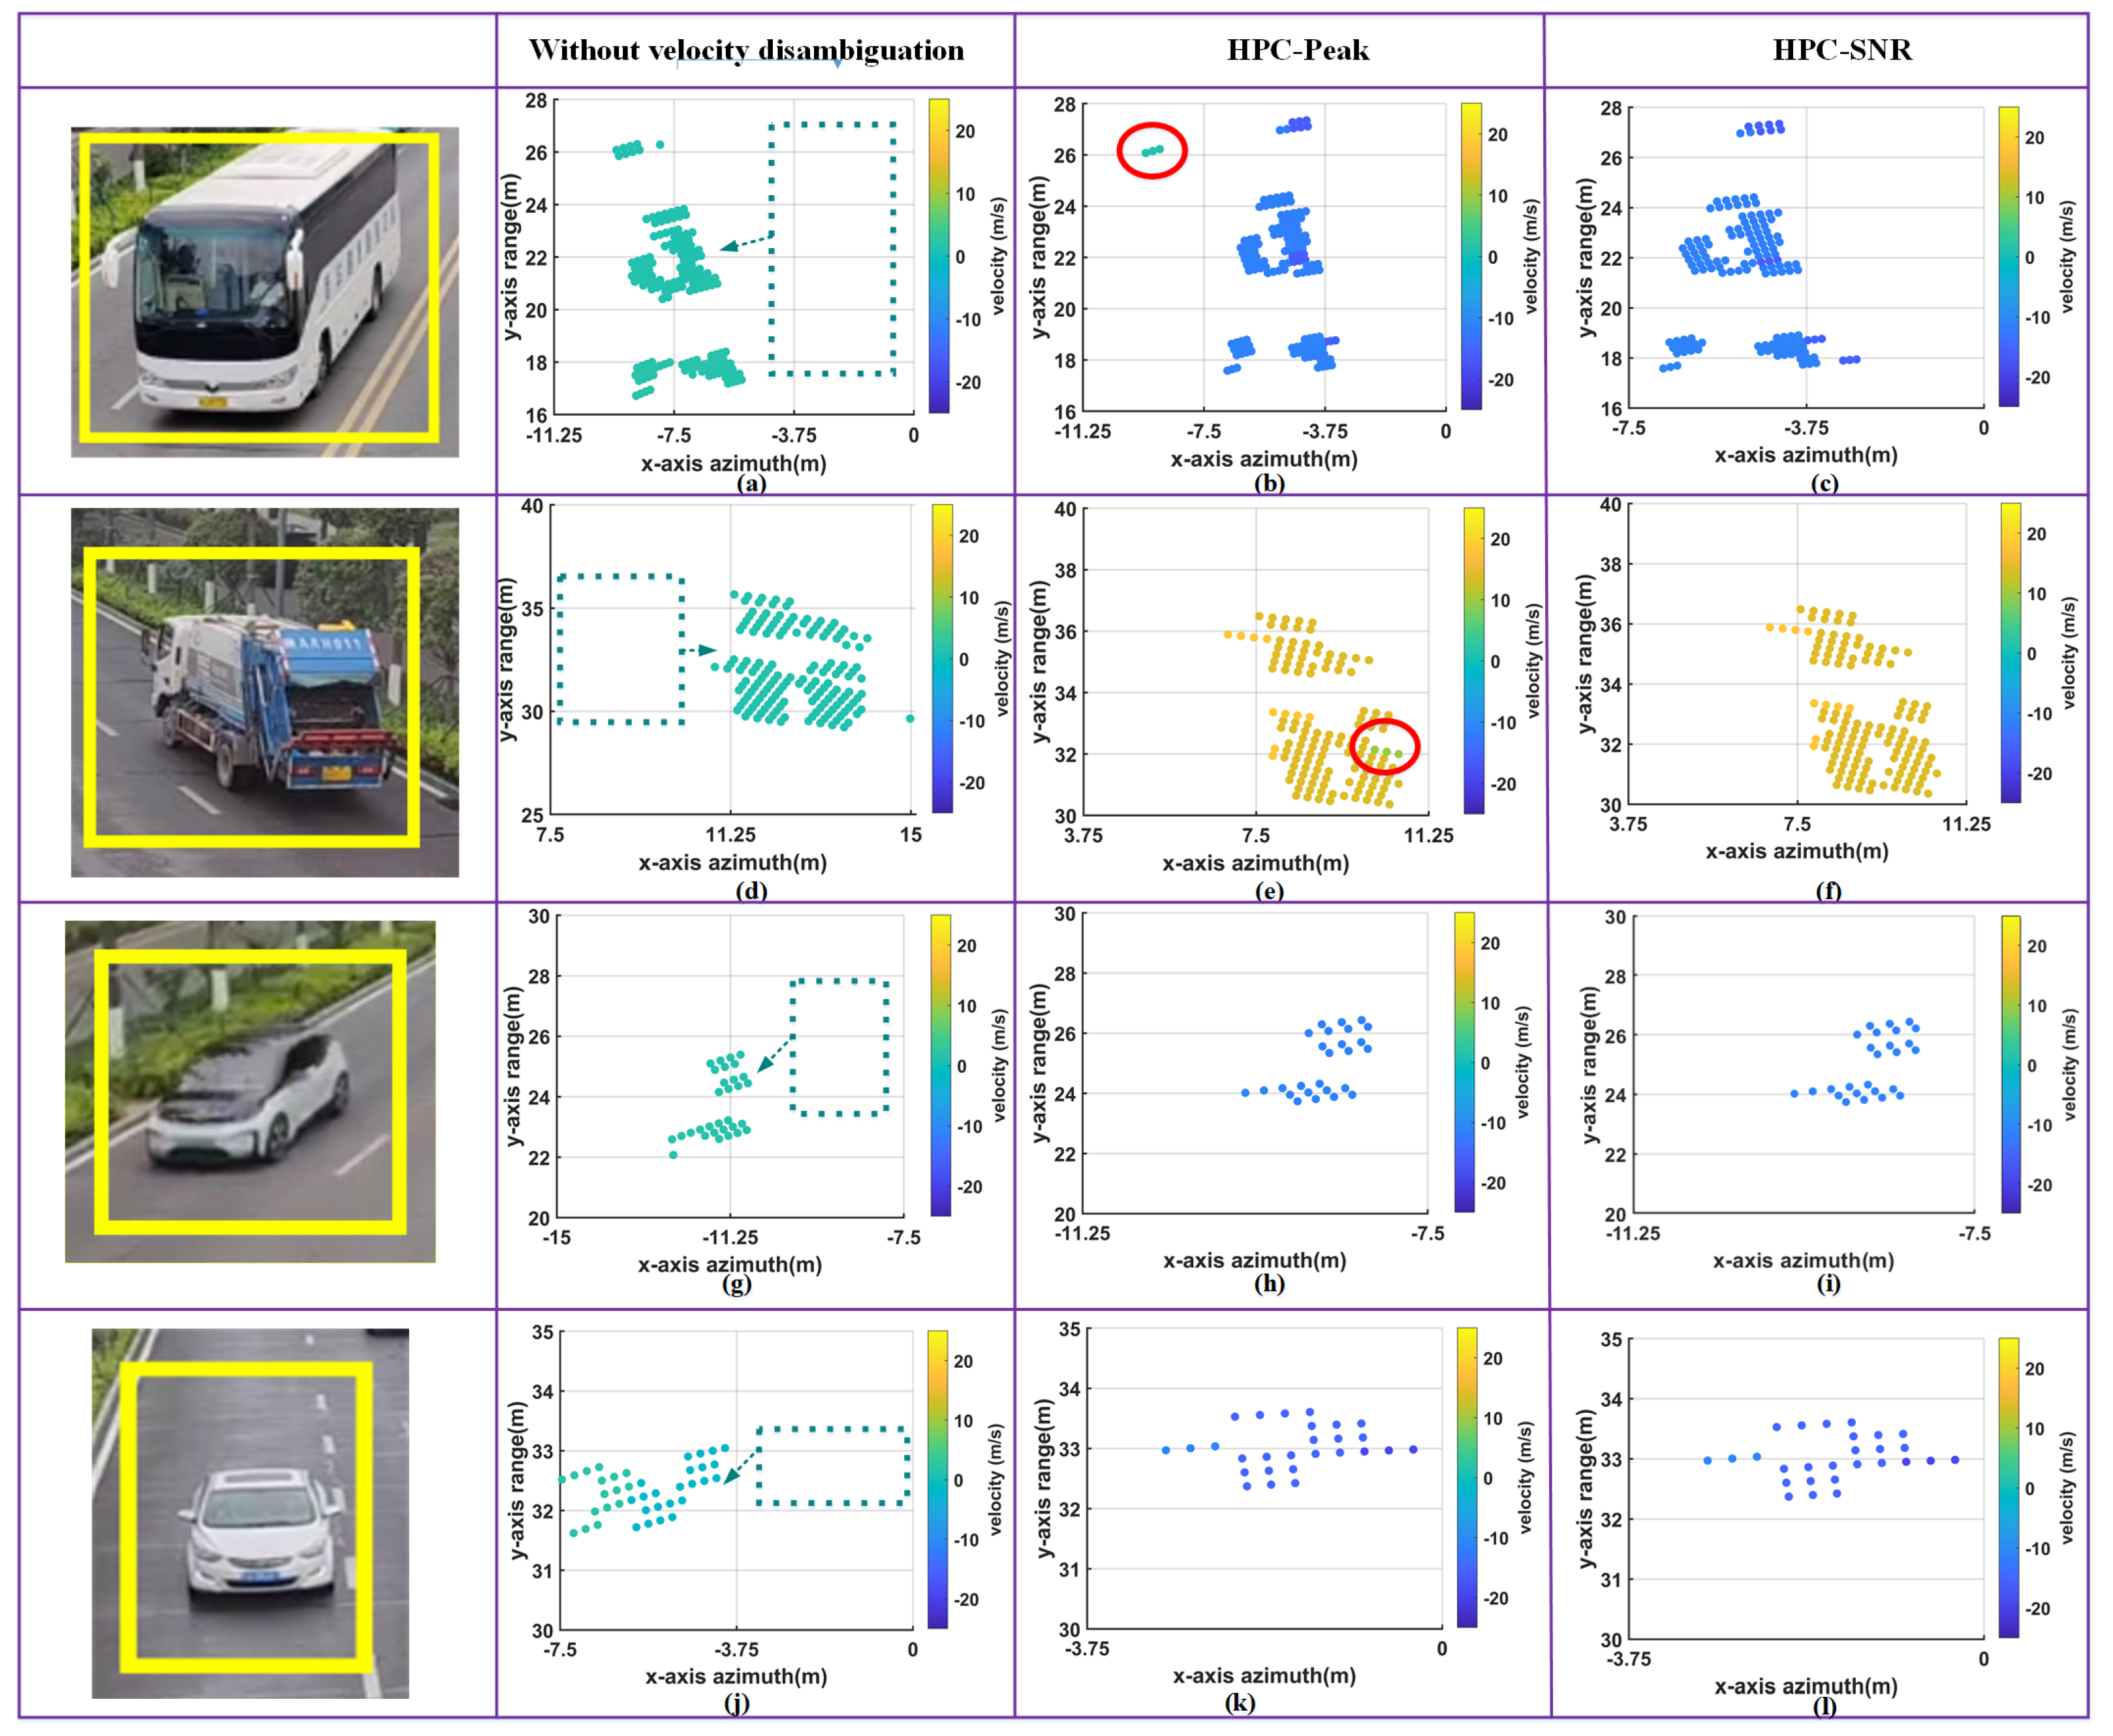
Figure 23 shows the effect of the velocity disambiguation algorithm on the imaging results. When velocity disambiguation is not performed, the imaged position and actual position of the target are deviated in the azimuth (lateral) dimension. As the speed of target increases, the deviation of the target position becomes larger, as show in Figure 23a,d,g,j). More seriously, the estimation of the vehicle’s speed and direction of travel were completely wrong.
When the velocity disambiguation algorithms (HPC-Peak and HPC-SNR) are implemented, the radar can correctly provide information on the position, lane, speed, and direction of travel of all vehicles. When the same range-Doppler cell exists in different parts of the target, there will be error points in the imaging results of the HPC-Peak algorithm, as shown by the red circles in Figure 23b,e. However, the HPC-SNR algorithm can solve this problem well, as shown in the red circle position in Figure 23c,f.
In our experiments, the noise points, false alarm points, and error points in the imaging results of moving targets are all referred to as outliers. After counting 1000 frames, we can see that the HPC-SNR algorithm has significantly fewer outliers than the HPC-Peak algorithm. Especially in the imaging results of large vehicles, the number of abnormal points can be reduced by 20%.
Through the experiment, two conclusions can be drawn as follows:
  • For the imaging of high-speed target, velocity ambiguity will affect the accuracy of the lateral position of the target. The faster the speed, the larger the error in the lateral position. Velocity disambiguation is one of the key techniques to ensure the imaging accuracy of moving targets.
  • Compared with HPC-Peak, the HPC-SNR algorithm can obtain fewer abnormal points and more stable imaging results. When there are multiple targets in the same range-Doppler cell, the HPC-Peak algorithm may fail.

5.2. Static Target Imaging Experiments

Figure 3b shows the road environment in the test scene, where the proposed CFAR algorithm and noise removal algorithm are implemented to achieve extraction and imaging of the static targets on the road.

5.2.1. Improved MC-CFAR Algorithm for Static Target Extraction

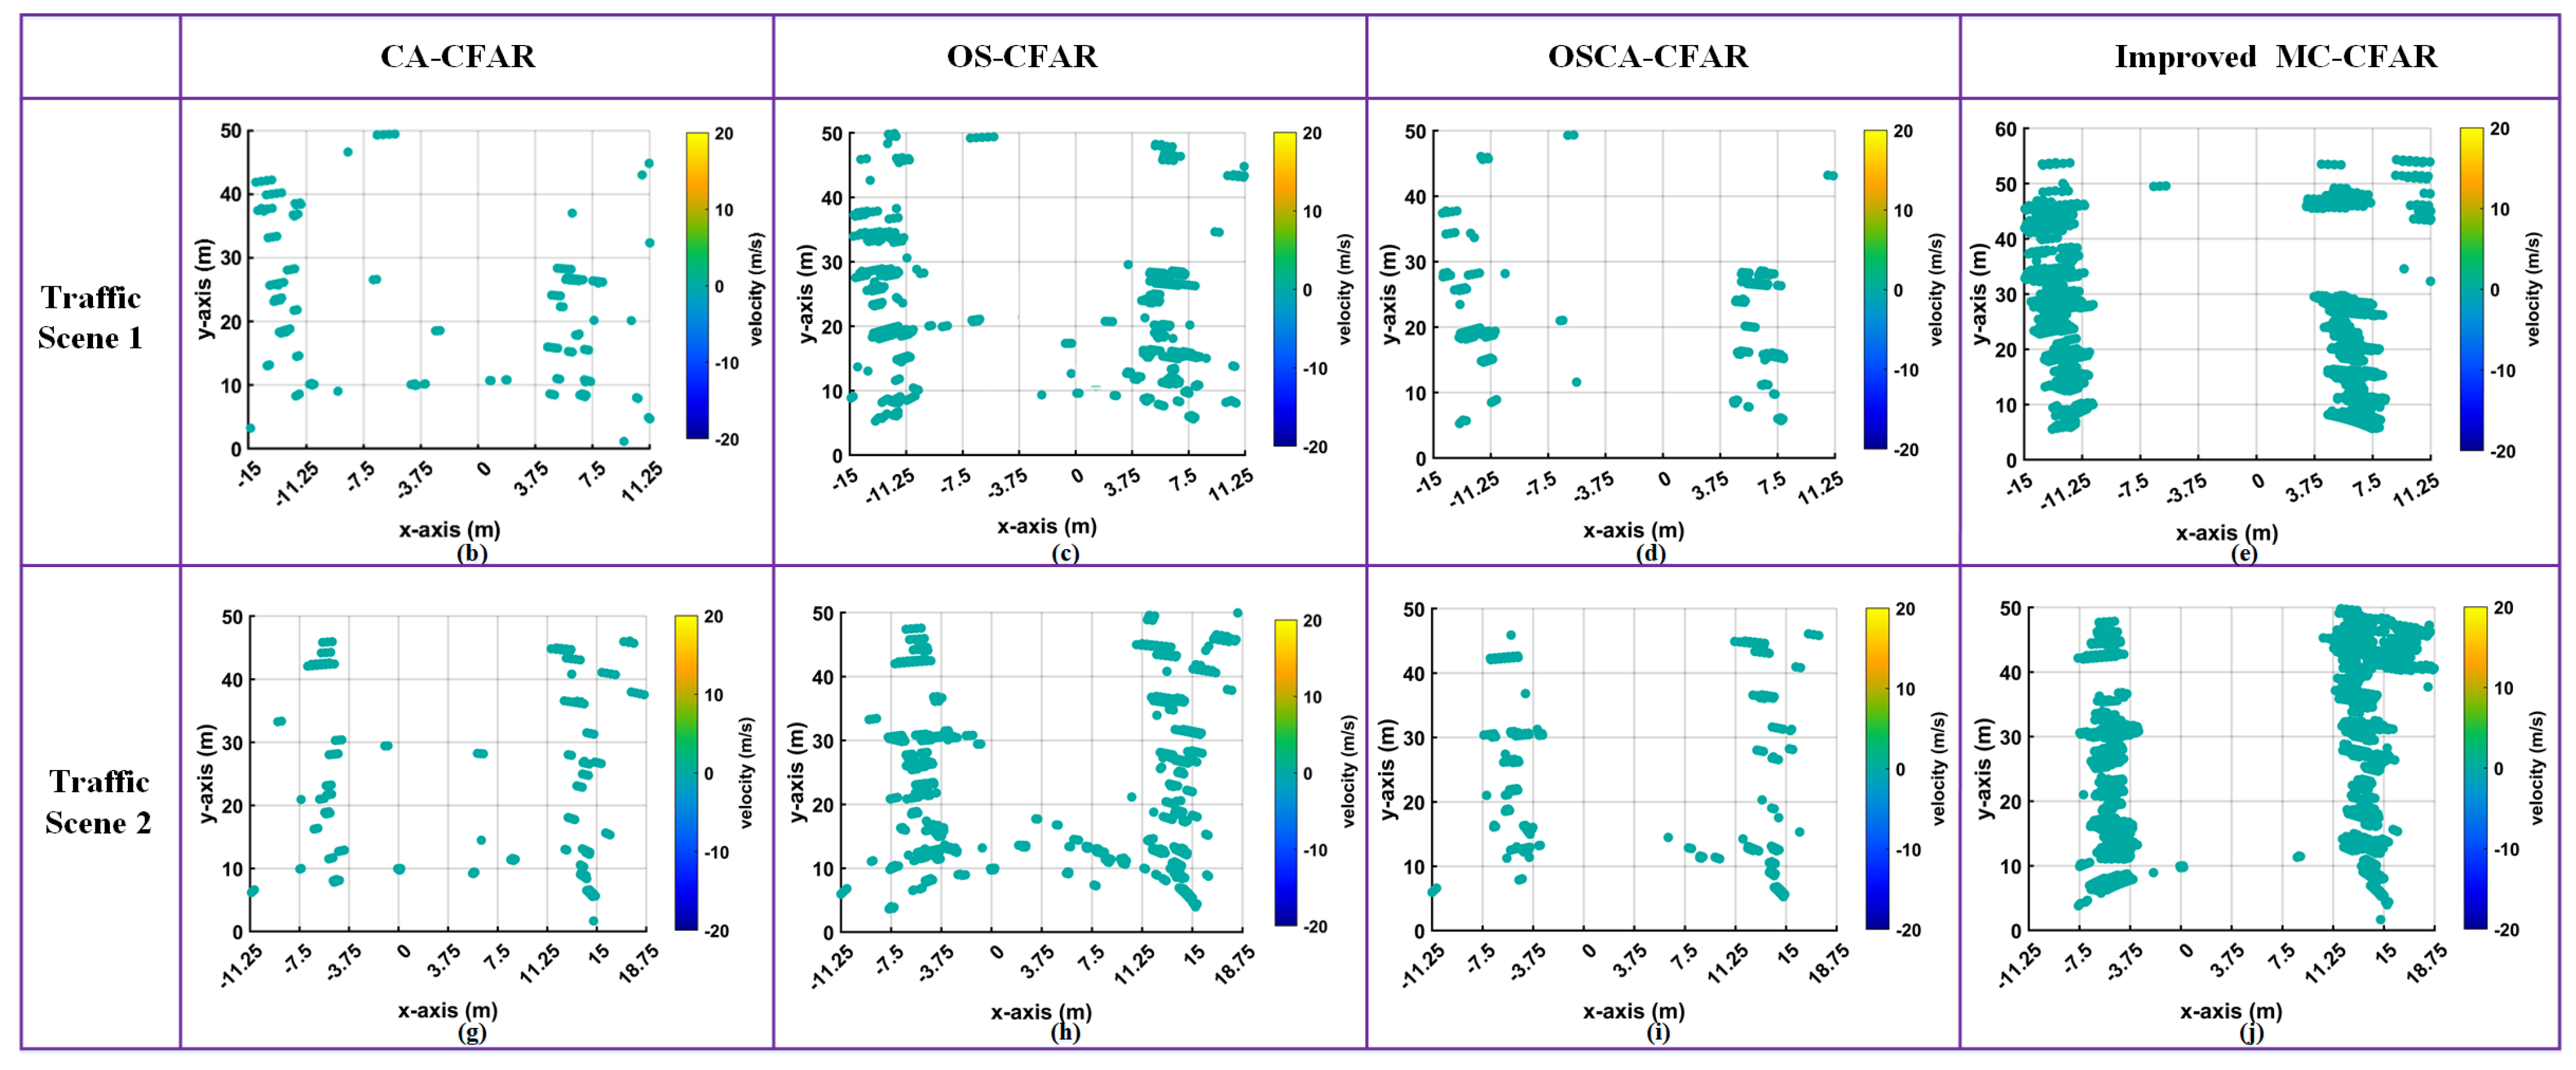
Figure 24 shows the test results of static object imaging on traffic roads (10∼50 m), where different CFAR algorithms are implemented and compared. In the experiment, the parameters of the CFAR algorithm are shown in Table 4. The RAM is divided into multiple sub-RAM spaces according to the 3 dB energy descent gradient (the division interval is shown in Figure 25).
Obviously, among all CFAR detection algorithms, the improved MC-CFAR algorithm has the best detection effect, i.e., the green belt areas on both sides of the road are clearly presented in the form of 2D point clouds by the improved MC-CFAR detection technology. Thanks to the fact that it is not limited by the reference window, MC-CFAR can detect large-sized objects better than several other detection algorithms. In addition, the 3 dB division operation of RAM enables the improved MC-CFAR algorithm to implement static target detection and extraction in the traffic environments with increasing or decreasing background noise power amplitude, which compensates for the shortcomings of the MC-CFAR algorithm.

5.2.2. Noise Points Removal Based on the DBSCAN Algorithm

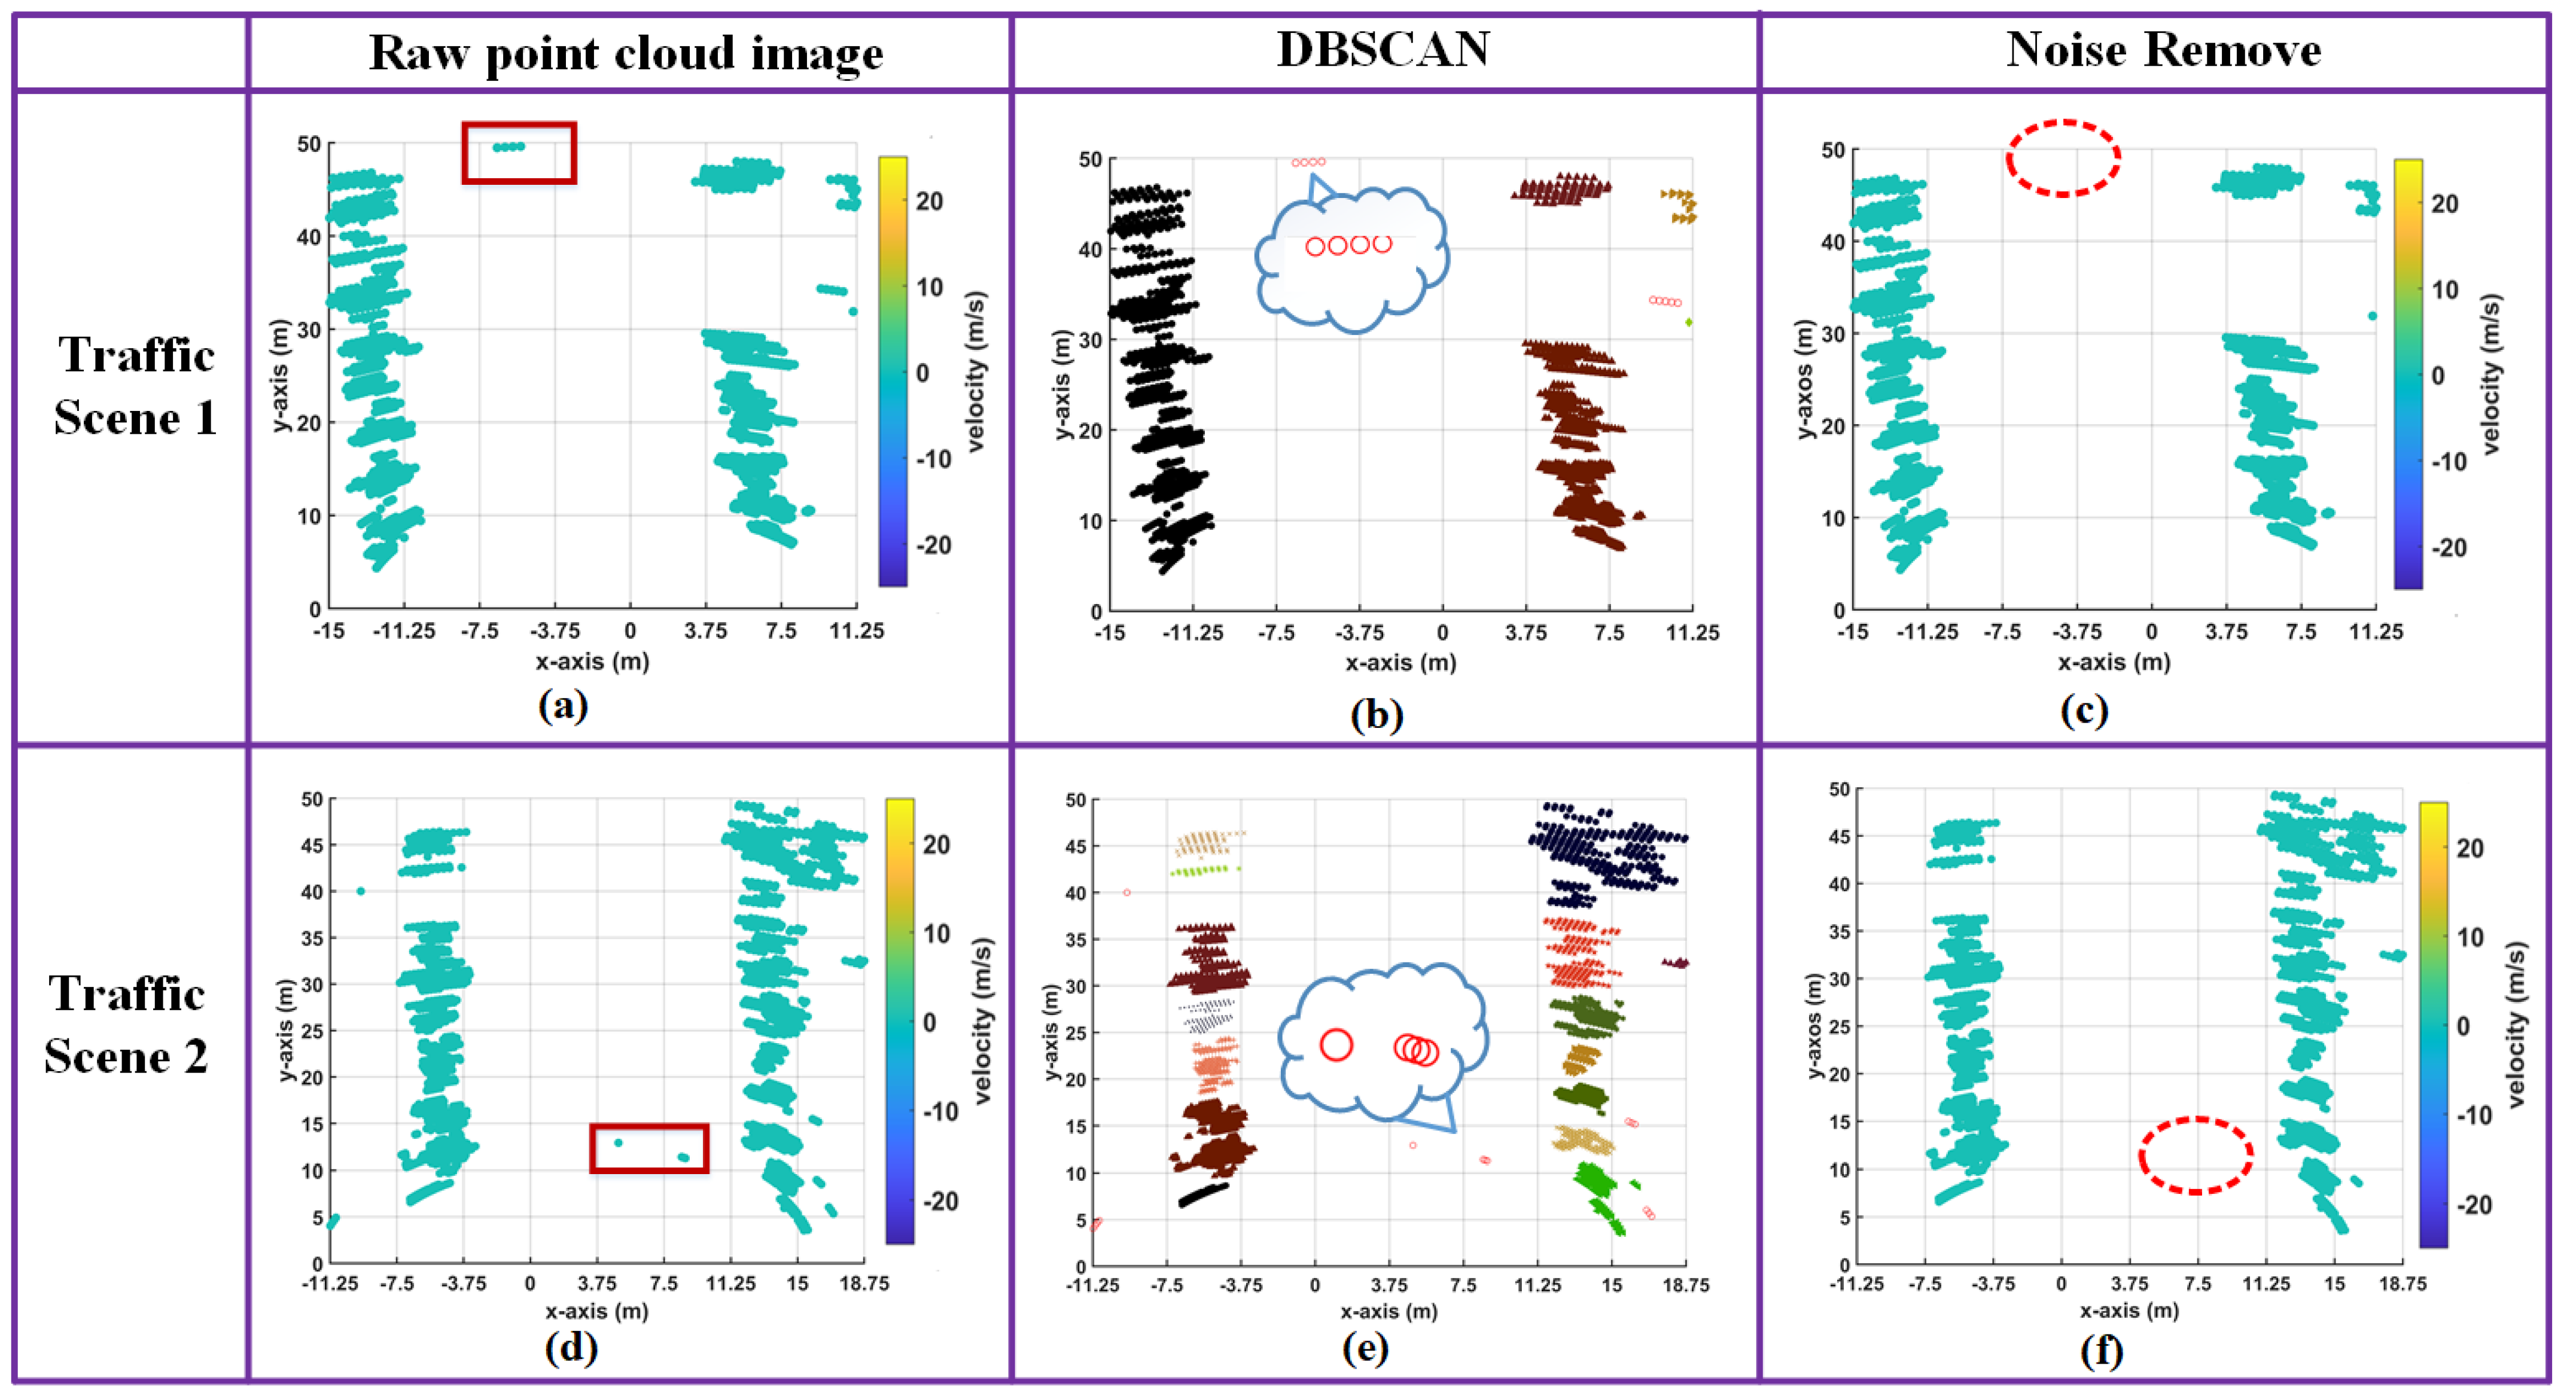
The parameters of the DBSCAN algorithm are set with the radar distance resolution as a reference ( R r e s o l u t i o n = 0.1 m), which avoids the removal of real obstacles while removing the noise points. The algorithm parameters are E p s = 3 R r e s o l u t i o n and m i n P t s = 9 .
Figure 26 shows the results of using the DBSCAN algorithm to remove noise points. The noise points generated by the false alarms of the detector are projected into the radar point cloud image along with the true target points, which makes wrong targets appear on the original “clean” lane, as shown in Figure 26a,d in the red box. The points output by the detector are sent to the DBSCAN processor for class clustering, and these outliers and sparse noise points will be identified, as shown by the red circle in Figure 26b,e. Finally, the detected noise points are removed and a “clean” radar point cloud image is obtained, as shown in Figure 26c,f.

5.3. Urban Traffic Road Scenes 2D Imaging and Vehicle Information Perception

5.3.1. Dynamic and Static Target Imaging Integration

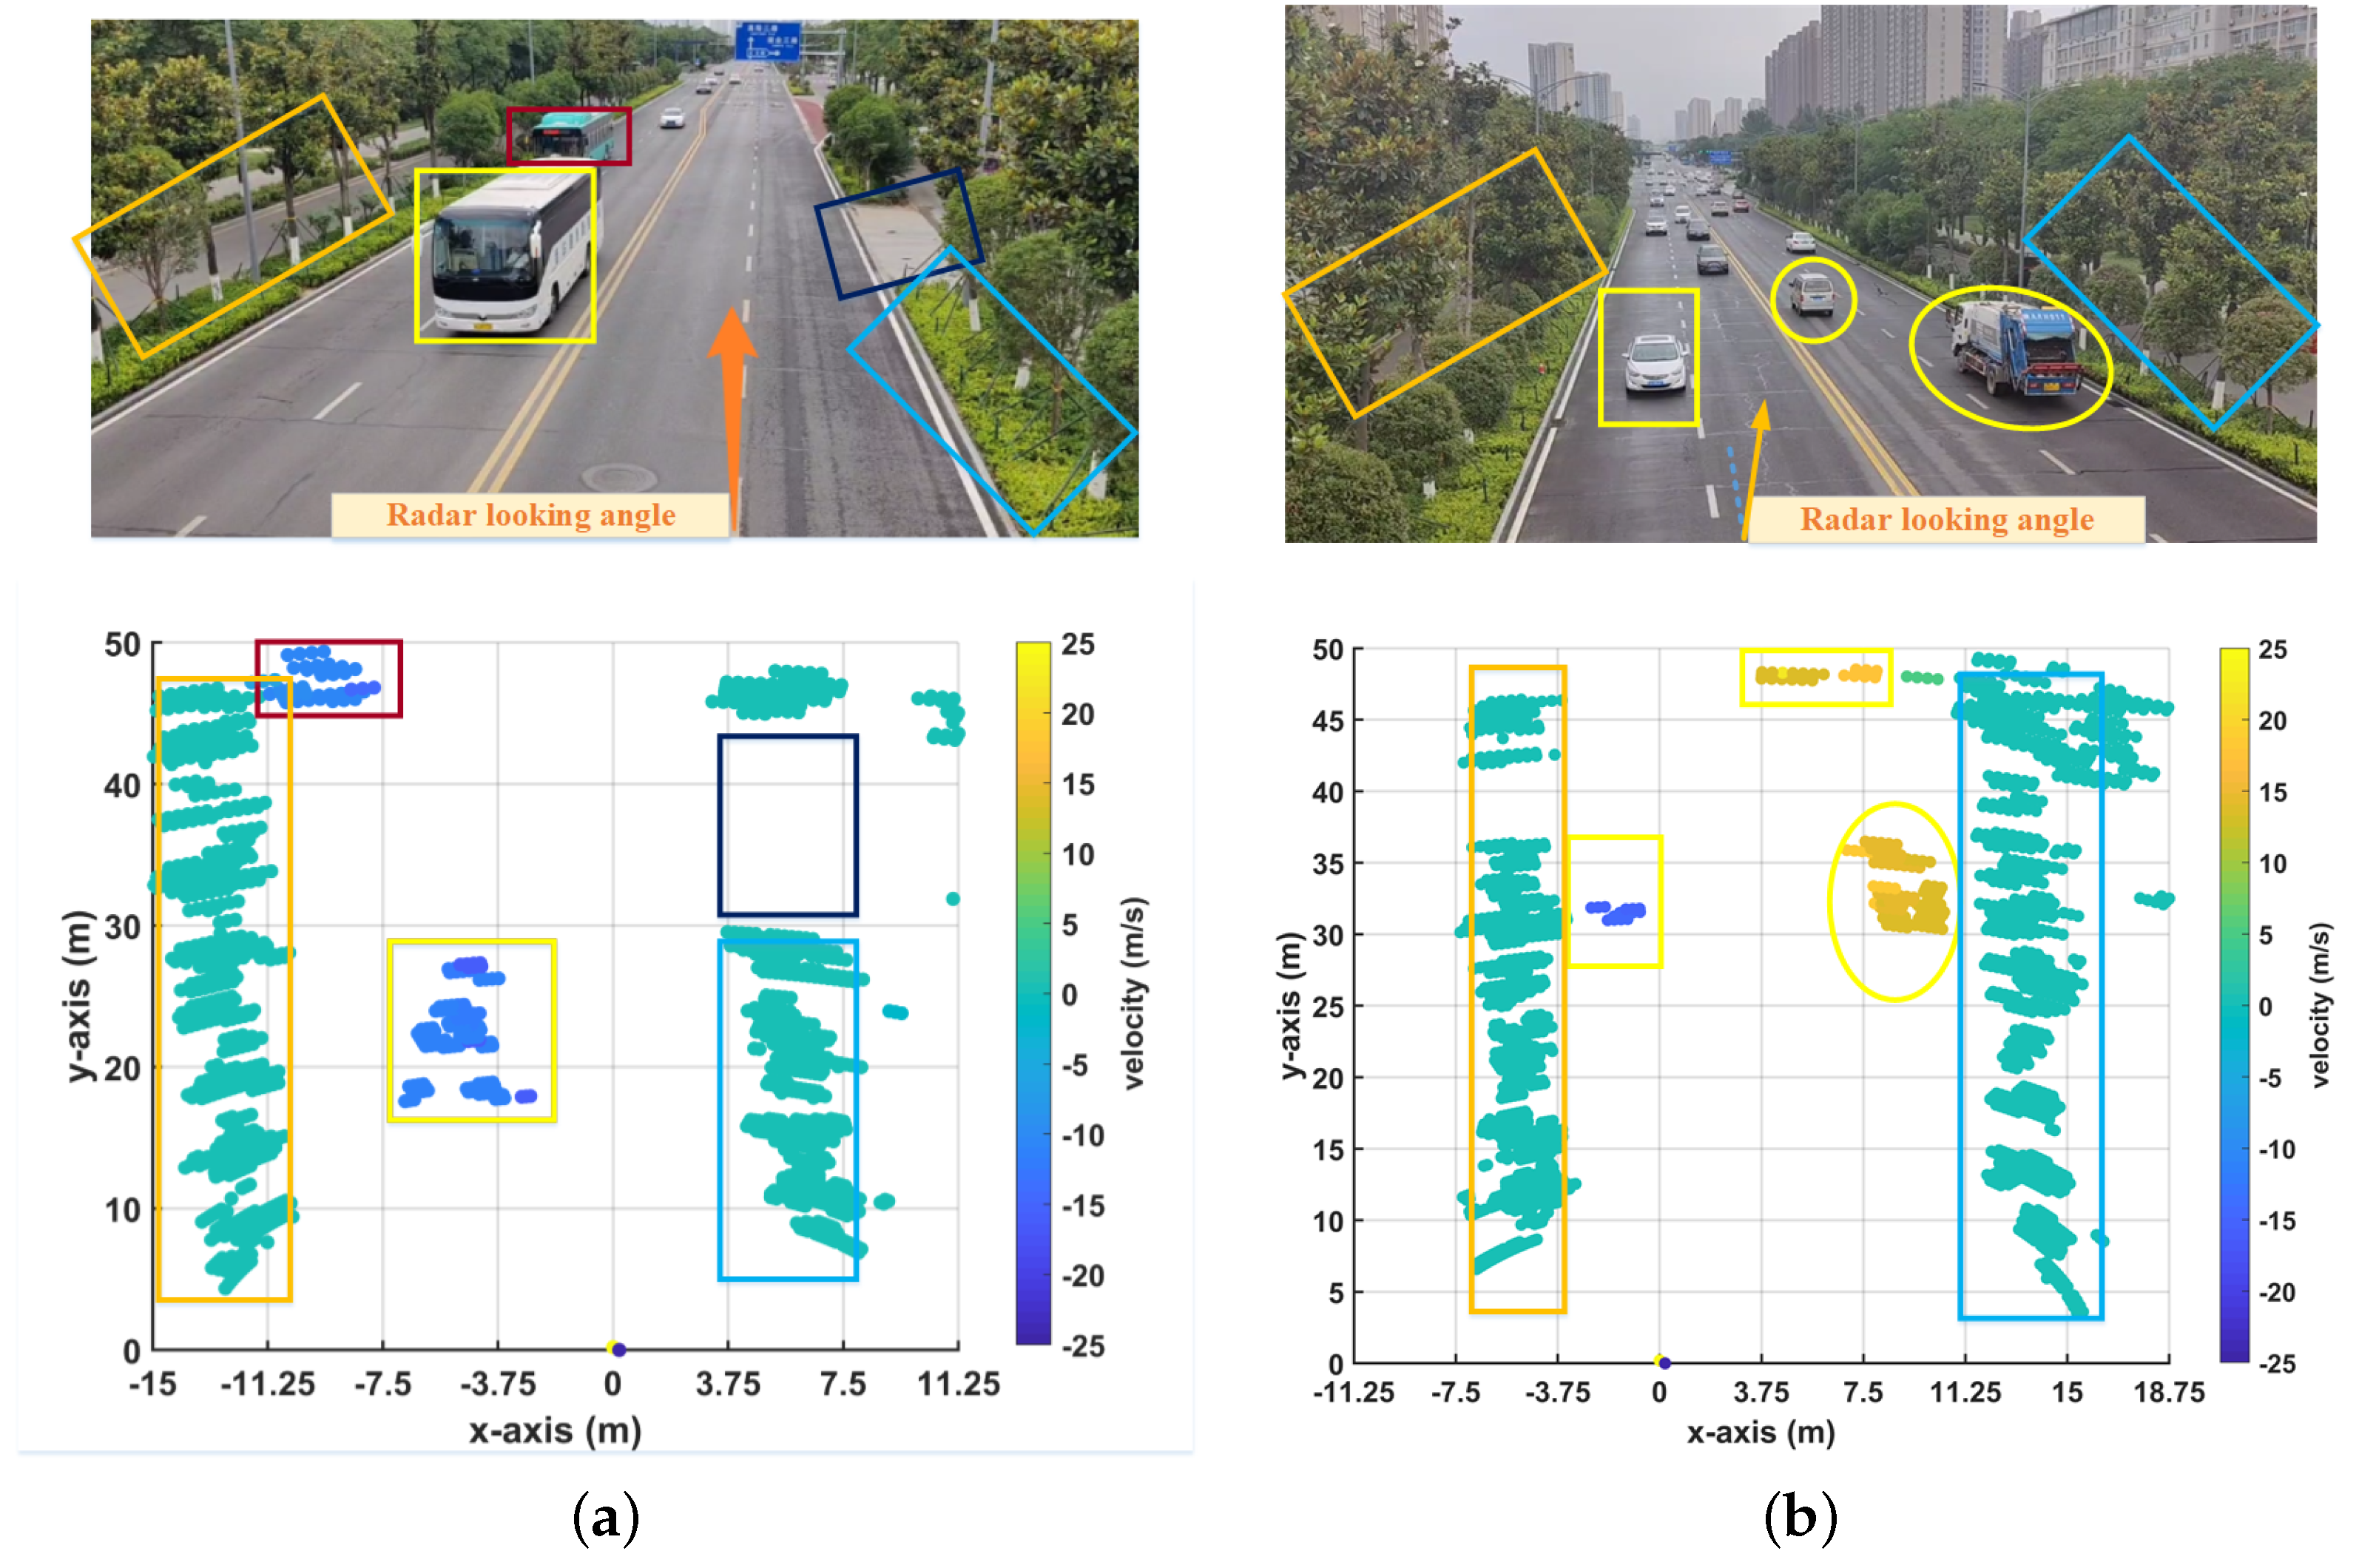
Figure 27 shows the imaging results of the traffic scene based on millimeter-wave radar. Based on the proposed imaging architecture and algorithm, targets in the range of 10–50 m in urban roads are presented in the form of 2D radar point cloud images. In the point cloud image, the color of the point cloud represents the speed and direction of travel of the target (the faster the target, the darker the point cloud), and the shape, size, and distribution of the point field represent different types of targets. Compared with detection radar, the use of millimeter-wave radar imaging technology can provide people and intelligent traffic monitoring systems with richer and more intuitive road information. In addition, a video is provided to further show the imaging results (as shown in Appendix B, for video link).

5.3.2. Vehicle Information Perception

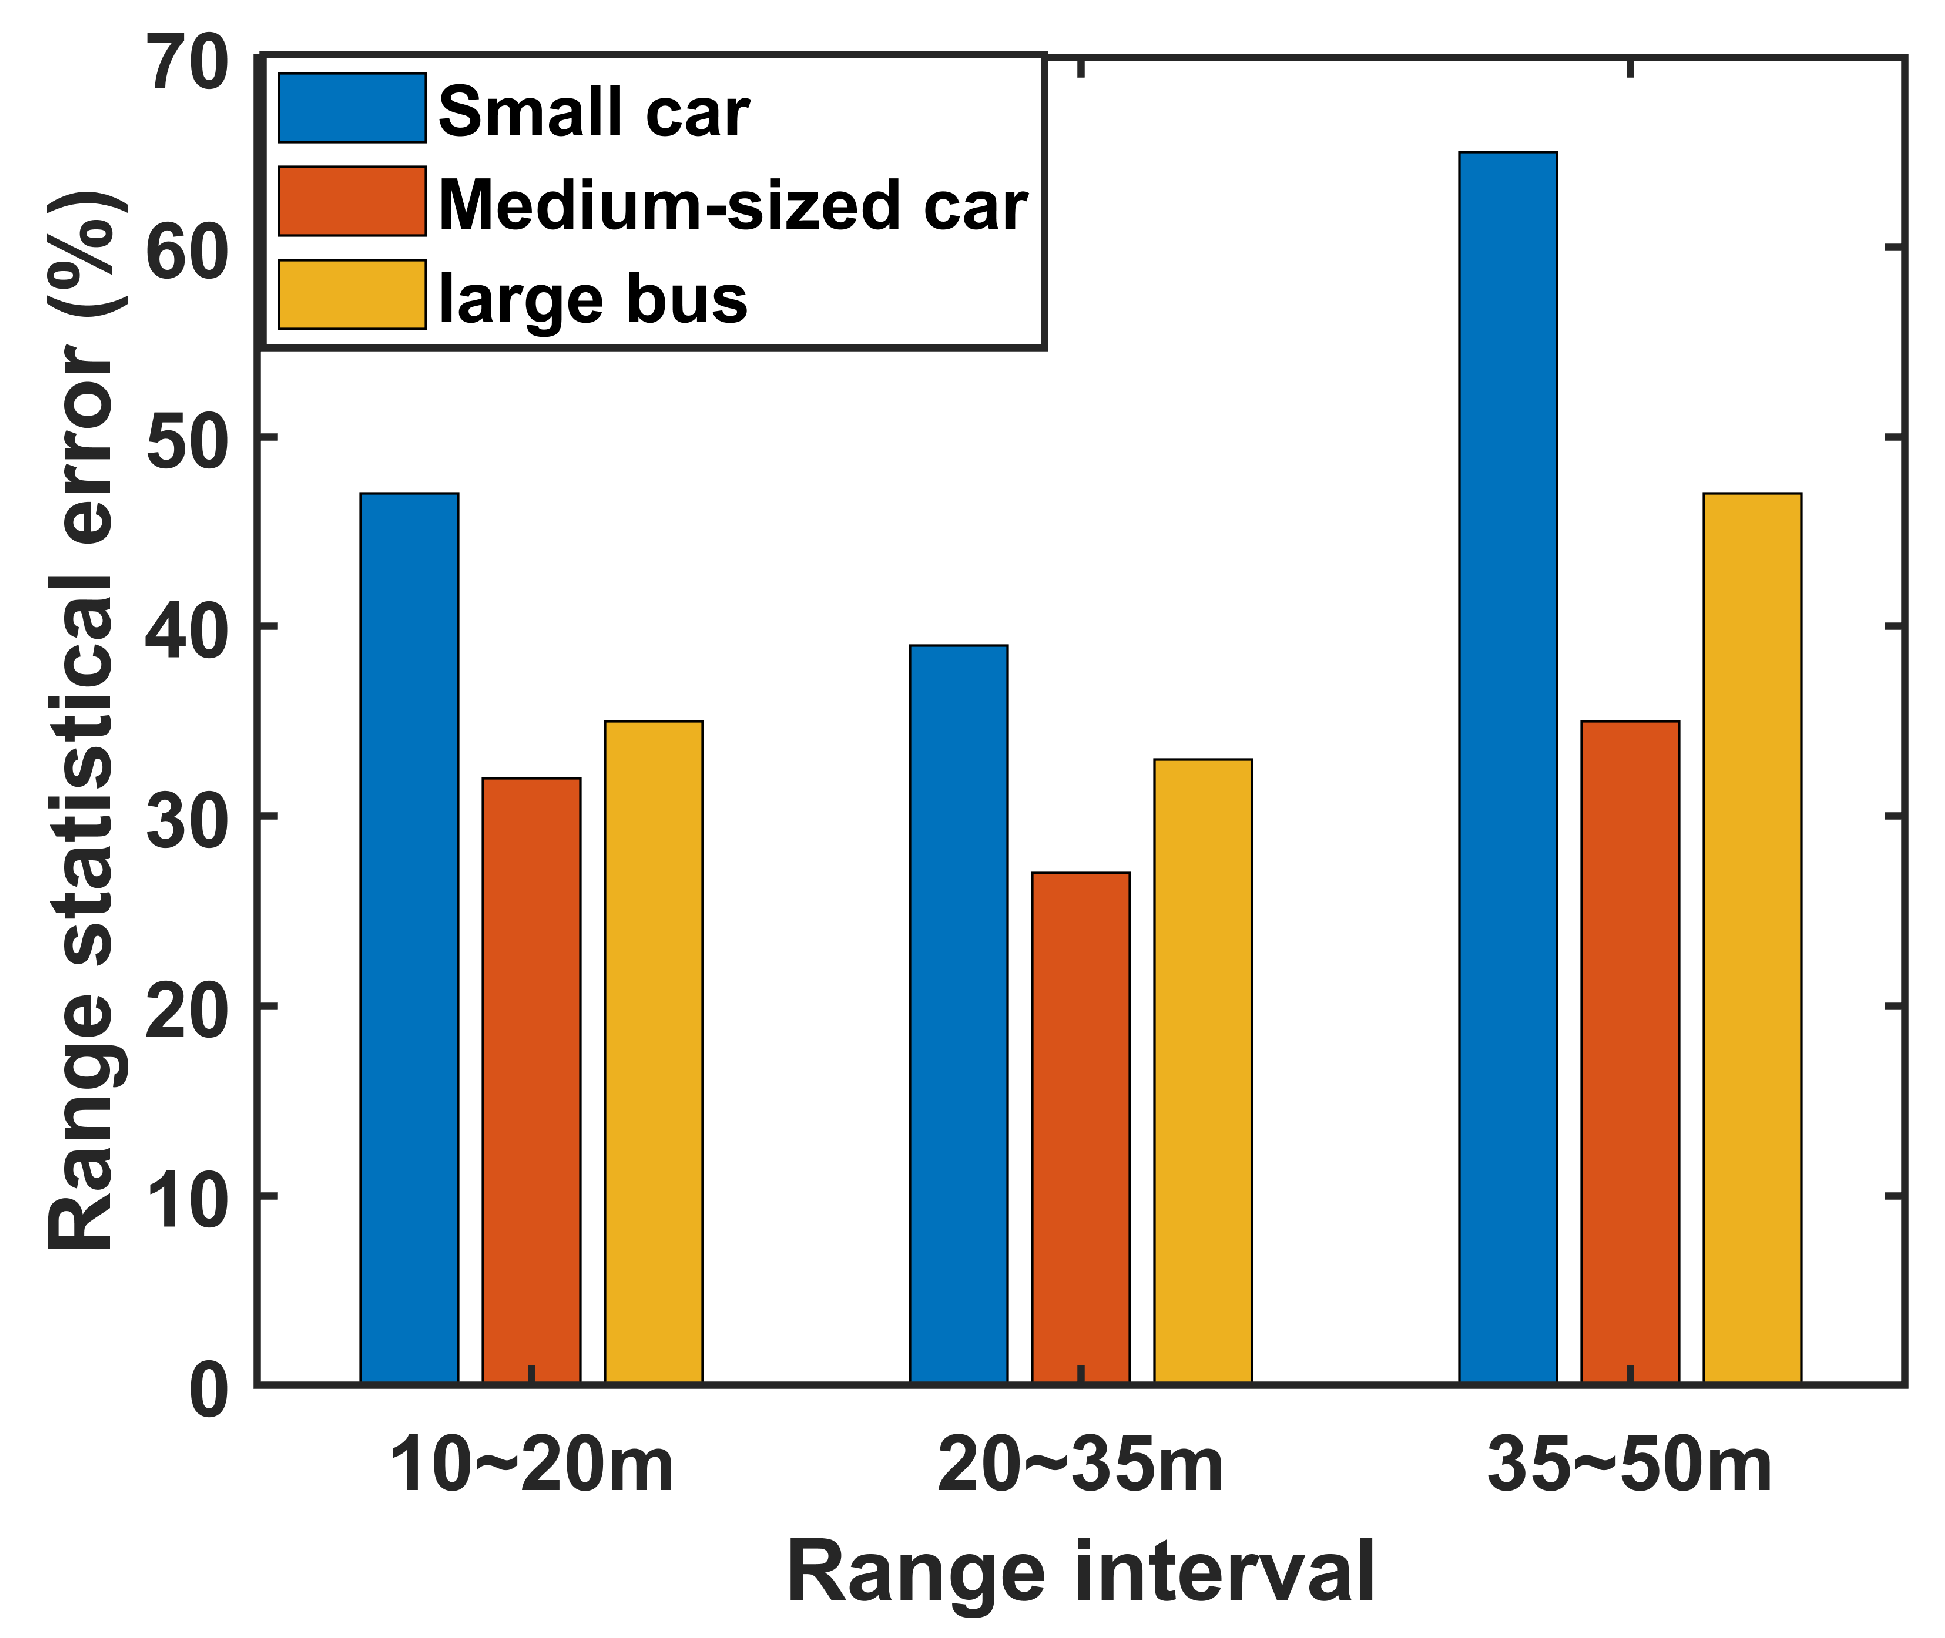
In general, vehicles are classified by length: small car ( L < 4.3 m), medium-sized car ( 4.3 m < L < 7 m), and large bus ( L > 8 m). However, it is not appropriate to estimate the size and type of vehicles directly from the imaged length of the target. The deformation of the point cloud image of the target at different distances and the dispersion of the point cloud image in the case of a large target will lead to a large error between the length of the point cloud image and the real length of the target. Figure 28 shows the error between the length of the point cloud image and the real length of the target, with the length error of almost every type of vehicle exceeding 25%. In particular, the reflected power of the small car is insufficient in the case of long-distance and the point cloud of the large car in the case of short distance is scattered; so, the error of the length estimation of vehicles exceeds 50%.
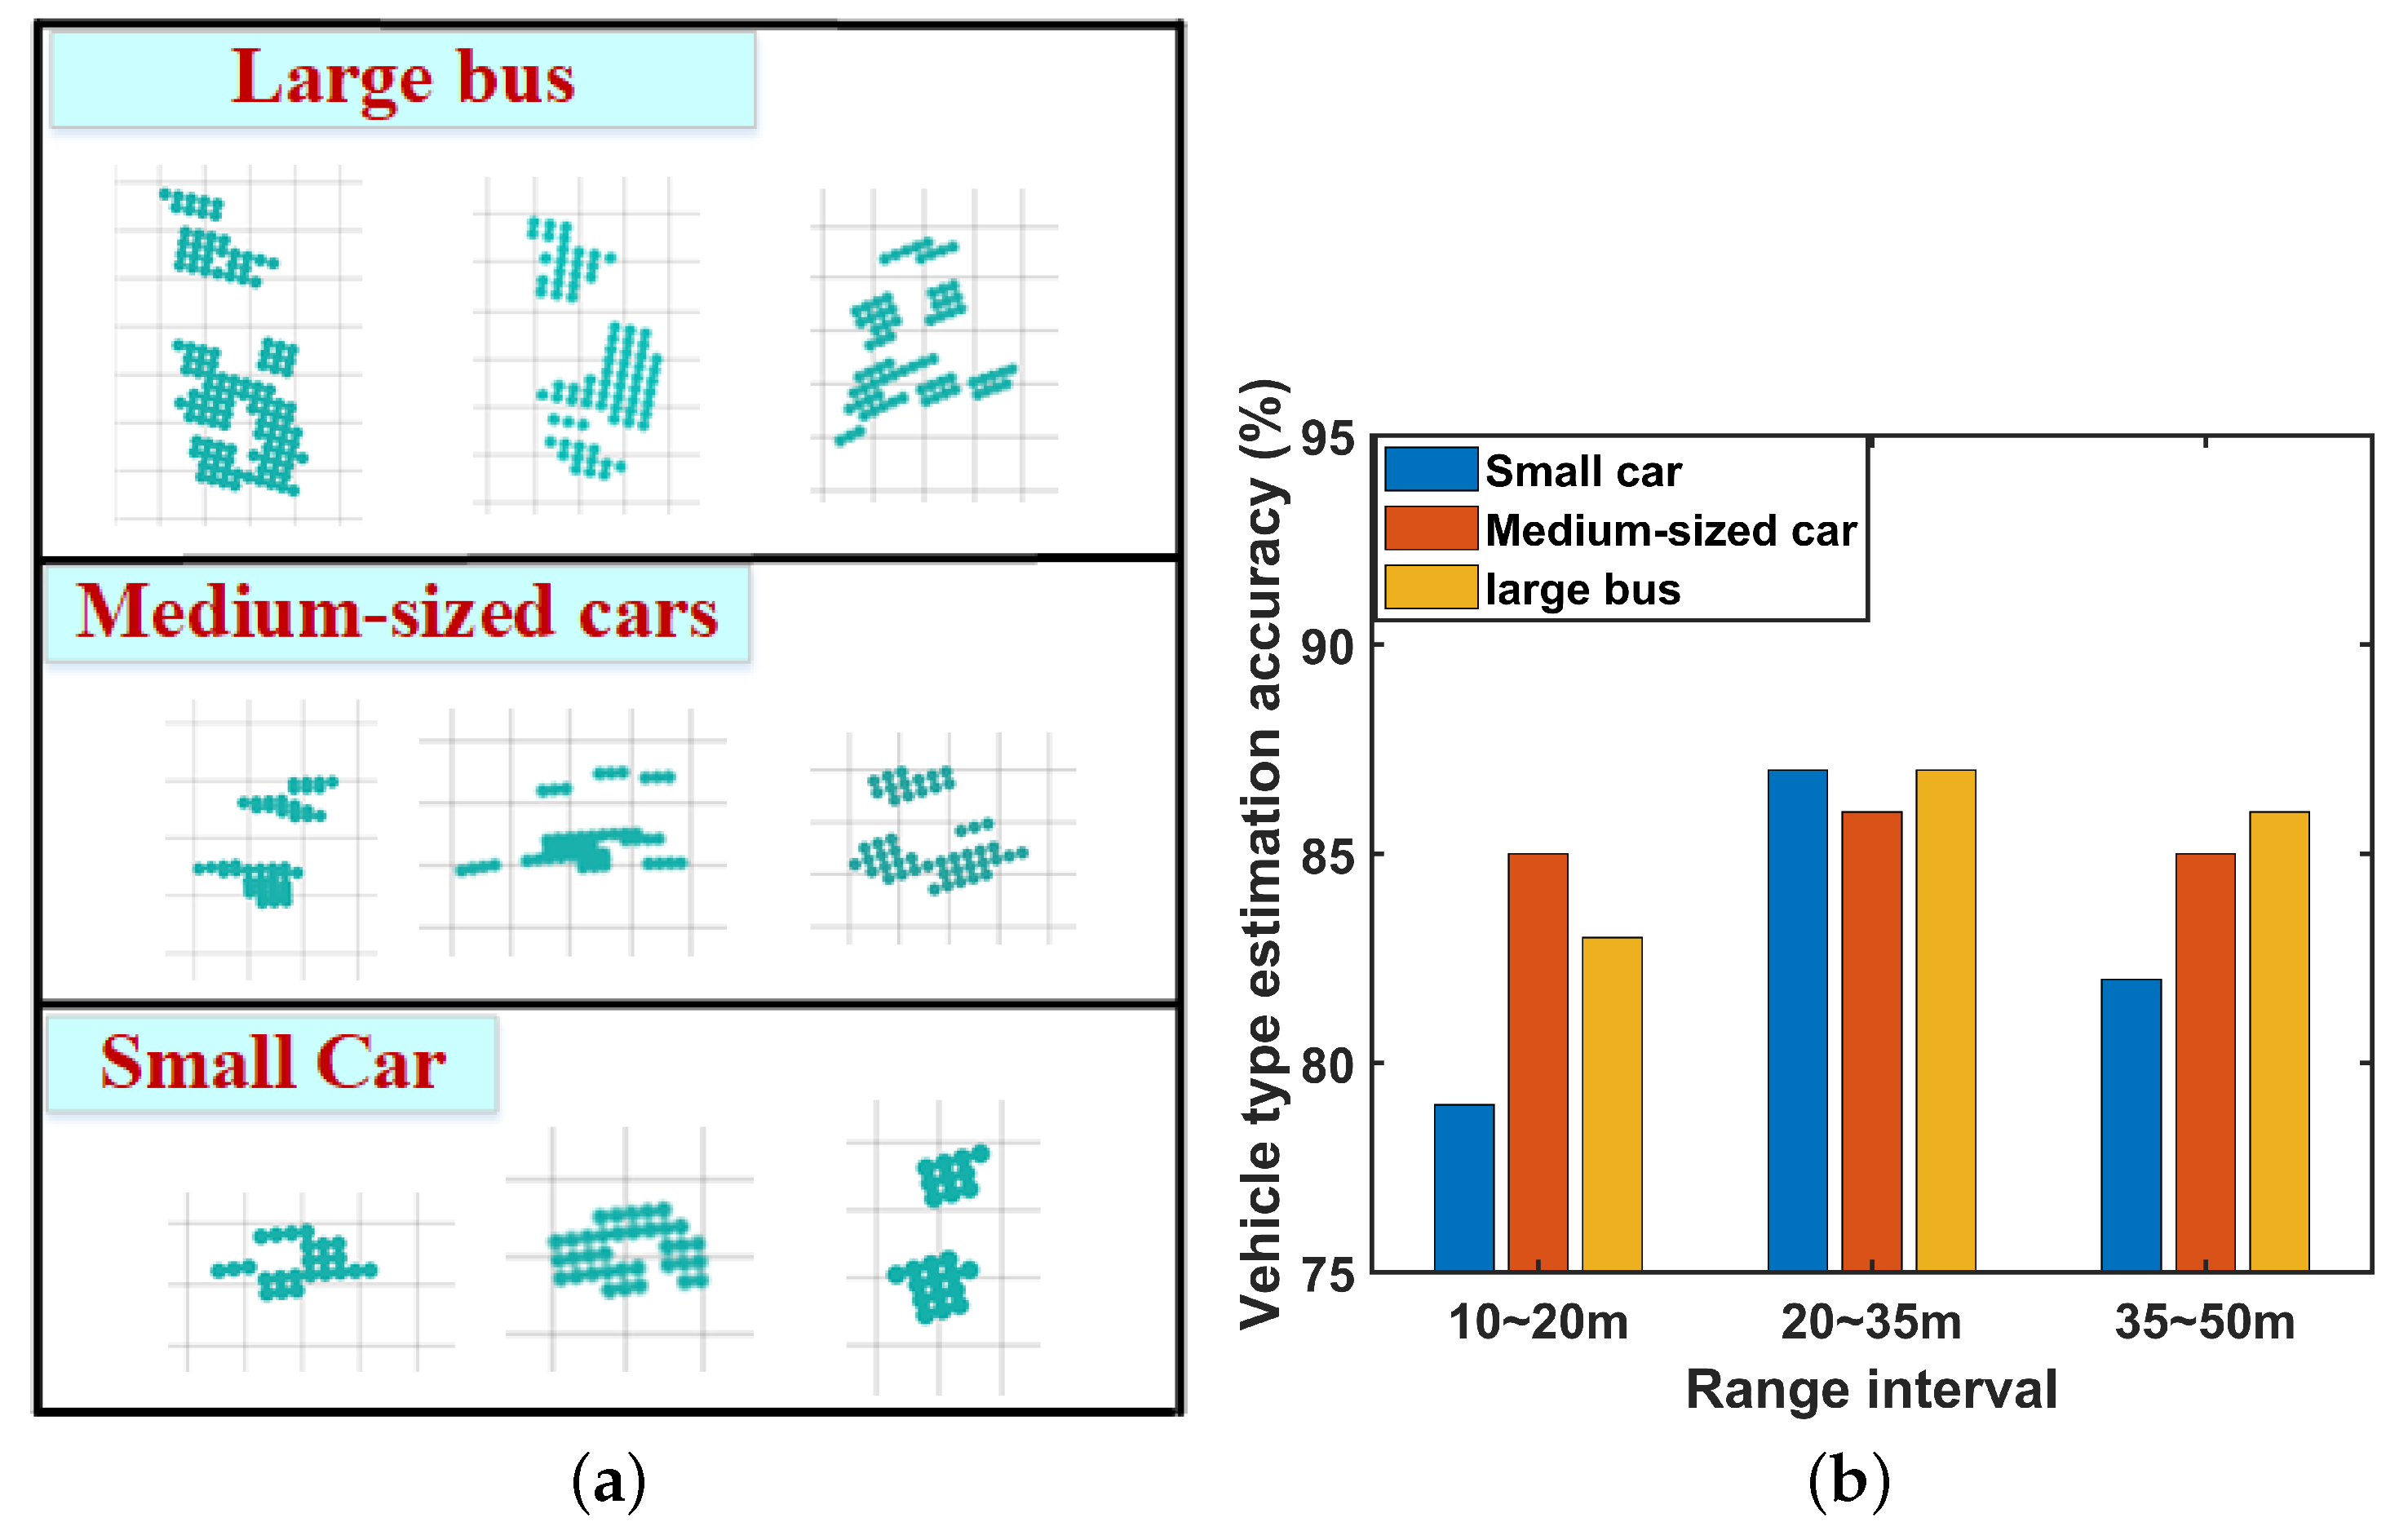
Although the shape of the vehicle changes during the 2D projection, there is a large difference between the areas of the point cloud sets due to different vehicle types, as shown in Figure 29a. Therefore, an approach of vehicle information perception that first estimates the vehicle type and then infers the vehicle size is adopted. Before the estimation of vehicle types, the minimum unit area U (=1 m × 1 m) is set by counting the point cloud areas of different types of vehicles. Then, based on the relationship between the target point cloud area ( S ) and the minimum unit, the targets are divided into three categories: small car ( S < 8 U ) , medium-sized car ( 8 U < S < 12 U ) , and large bus ( S > 20 U ) .
Based on the proposed perception method, the accuracy of the estimation of vehicle types remains above 80 % , as shown in Figure 29b. It is worth noting that the accuracy of the estimation of small cars decreases at close range; however, this does not mean that the area and distribution of point clouds of small cars do not satisfy the set conditions. The fundamental reason for this phenomenon is that when large vehicles are imaged at close range, the distribution of point cloud sets is more serious, which leads to some point cloud sets belonging to large vehicles being mistaken for small cars. Based on the classification results, the length, width, and height information ( L , W , H ) can be assigned to different types of vehicles: small car (4 m, 1.7 m, 1.5 m), medium-sized car (7 m, 2 m, 2.5 m), large bus (10 m, 2.5 m, 3 m).
The proposed method can ensure that the error of vehicle size is relatively stable during the entire monitored road segment, and avoids the misjudgment of vehicle type resulting from the change in the point cloud length. However, the vehicle size under this method is only a reference value where the error is relatively stable and, thus, cannot be guaranteed to suit every vehicle.

6. Conclusions

In this work, the Monte-Carlo-based moving target detection algorithm (the MC-CFAR), the improved Hypothetical Phase Compensation (HPC-SNR) velocity disambiguation algorithm, the improved MC-CFAR static target detection algorithm, and the DBSCAN-based noise removal algorithm are supplemented and proposed to improve typical three-dimensional FFT imaging algorithm architecture for radar roadside imaging in traffic scenarios. The performance of the proposed improved 3D-FFT algorithm architecture is verified with actual urban traffic data collected by a roadside-mounted radar platform instead of simulated data. It turns out that it enables the concurrence of dynamic and static target imaging in urban traffic using millimeter-wave radar. In addition, based on radar point cloud images, we initially perceive the type of moving vehicles, which conventional traffic detection radars cannot achieve. We hope our work can promote the application of radar imaging in urban traffic surveillance.
However, there are still issues that need to be improved and further studied. In future work, we will conduct further research on radar urban roadside imaging: (1) Combined with ISAR algorithm, to improve the imaging effect of long-distance targets. (2) Research on the discrete phenomenon of large vehicle point cloud images to avoid large vehicles being misclassified as multiple small targets. (3) Improve radar target recognition, including vehicle types and road obstacles.

Author Contributions

Conceptualization, B.Y. and H.Z.; investigation, Y.Z. and Y.P.; project administration, H.Z.; writing—original draft preparation, B.Y. and Y.C.; writing—review and editing, B.Y. and Y.C. All authors have read and agreed to the published version of the manuscript.

Funding

This work was supported partially by the Civil Aerospace Technology Advanced Research project (No. D020403) and Science and Technology on Near-Surface Detection Laboratory (No. 6142414211202). The authors greatly appreciate the above financial support.

Data Availability Statement

Not applicable.

Conflicts of Interest

This manuscript has not been published or presented elsewhere in part or in its entirety, and is not under consideration by another journal. There are no conflicts of interest to declare.

Abbreviations

The following abbreviations are used in this manuscript:
LFMCWLinear Frequency Modulated Continuous Wave
MIMOMultiple-input Multiple-output
3D-FFTThe 3-dimensional Fast Fourier Transform
RMARange Migration algorithm
BPABackpropagation algorithm
CFARConstant False Alarm Rate
CA-CFARCell Average CFAR
OS-CFAROrdered Statistical CFAR
OSCA-CFARFusion CFAR algorithm combining CA and OS
MC-CFARCFAR algorithm based on the Monte Carlo principle
RDMRange-Doppler power spectrum matrix
MPRFMultiple pulse repetition frequency
HPCHypothetical Phase Compensation
HPC-SNRImproved Hypothetical Phase Compensation
RAMRange–angle power spectrum matrix
CRTChinese Remainder Theorem
IFIntermediate frequency
TXTransmitting antennas
RXReceiving antennas
DBSCANDensity-Based Spatial Clustering of Applications with Noise

Appendix A

Appendix A.1

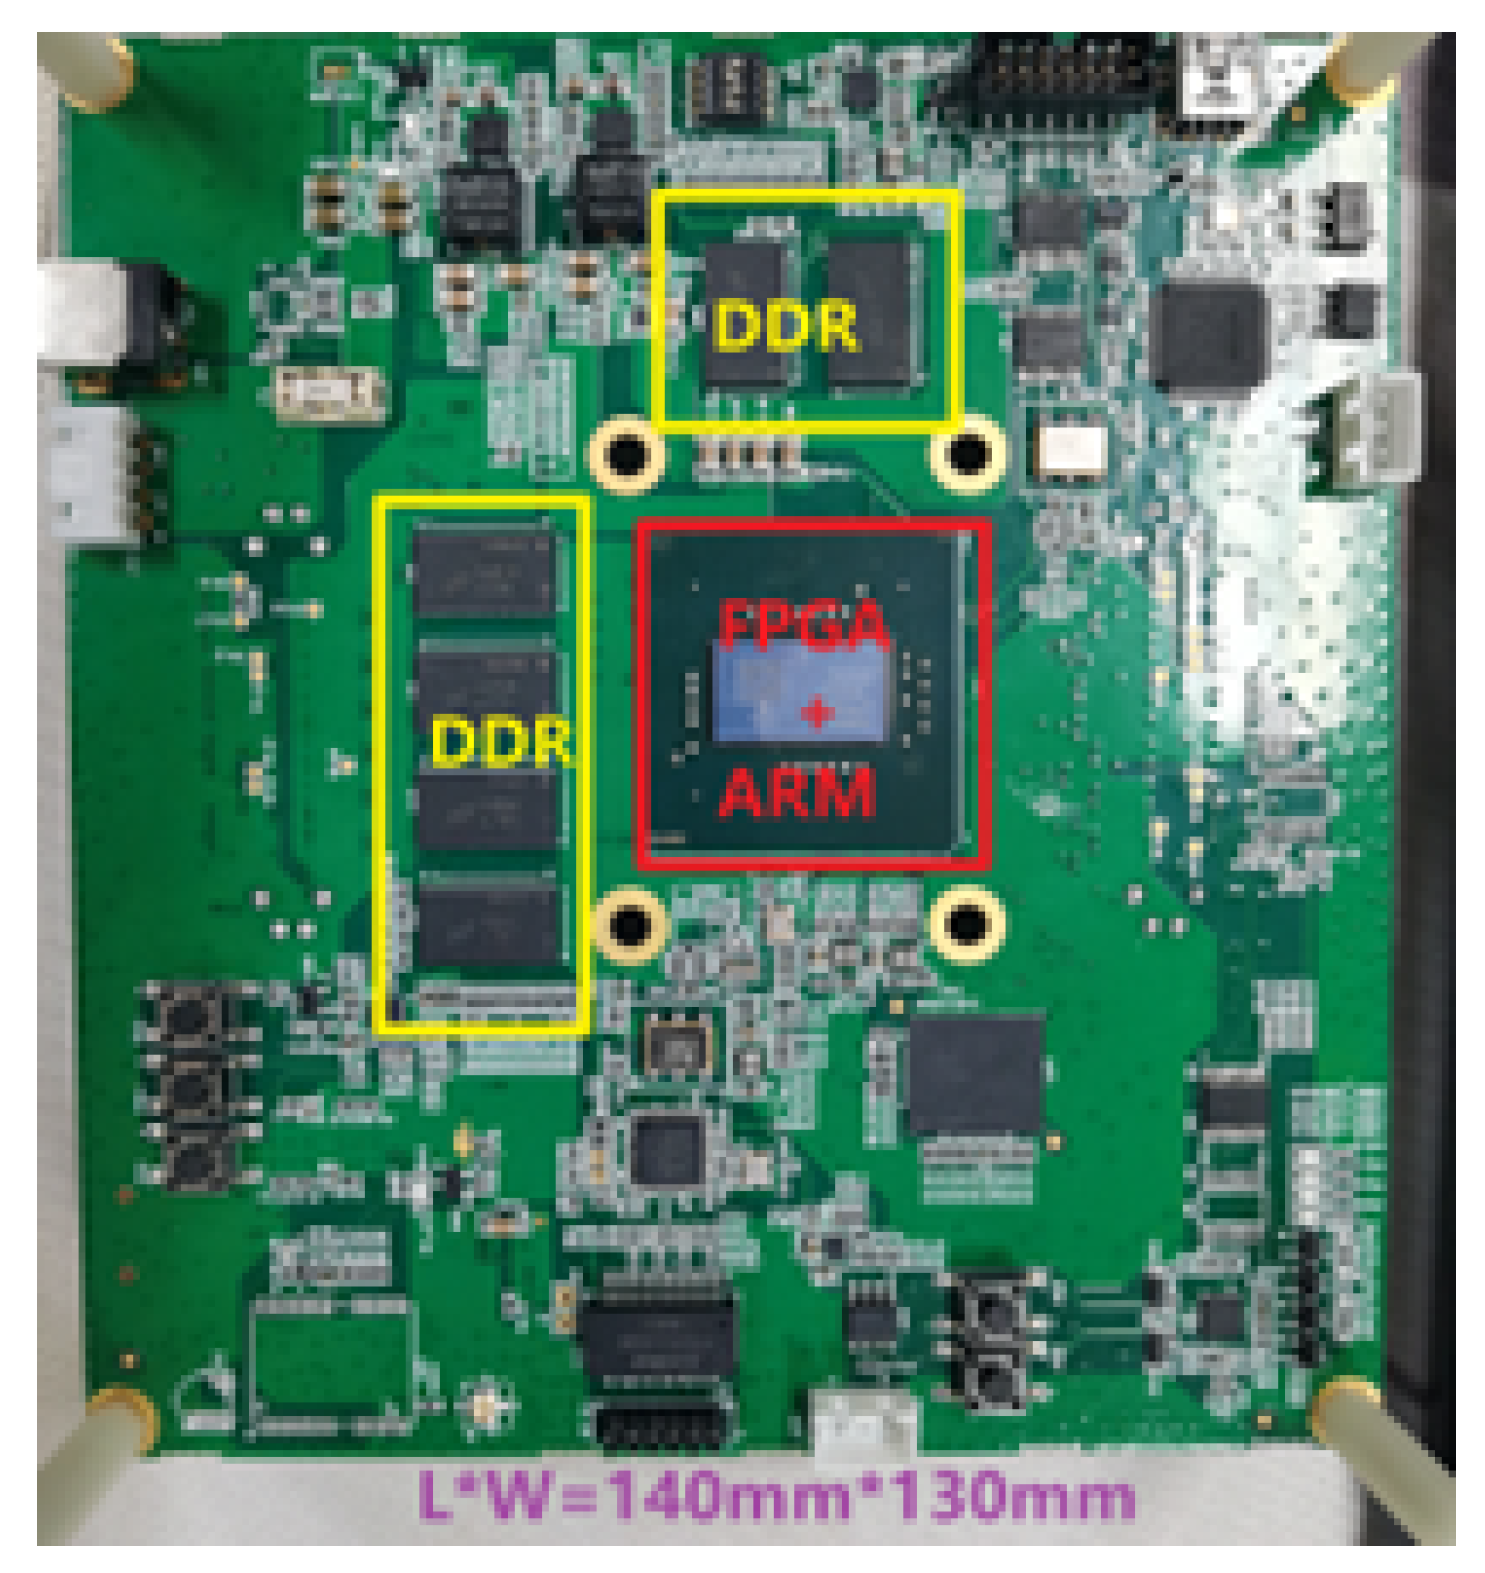
In practice, compared with traffic detection radar, the imaging radar system can provide richer target point cloud information, but it also requires the support of a better processor and storage system to complete the tasks of traffic monitoring, which is an inevitable price to pay. However, this price is manageable. In our radar system, we use the physical architecture of FPGA+RAM to provide a platform for software development. At the same time, six pieces of DDR memory (two on the FPGA side and four on the RAM side) are used to support the data processing and data flow of the algorithm, as shown in Figure A1.
Figure A1. Radar IF signal processor board.
Remotesensing 14 05416 g0a1

Appendix A.2

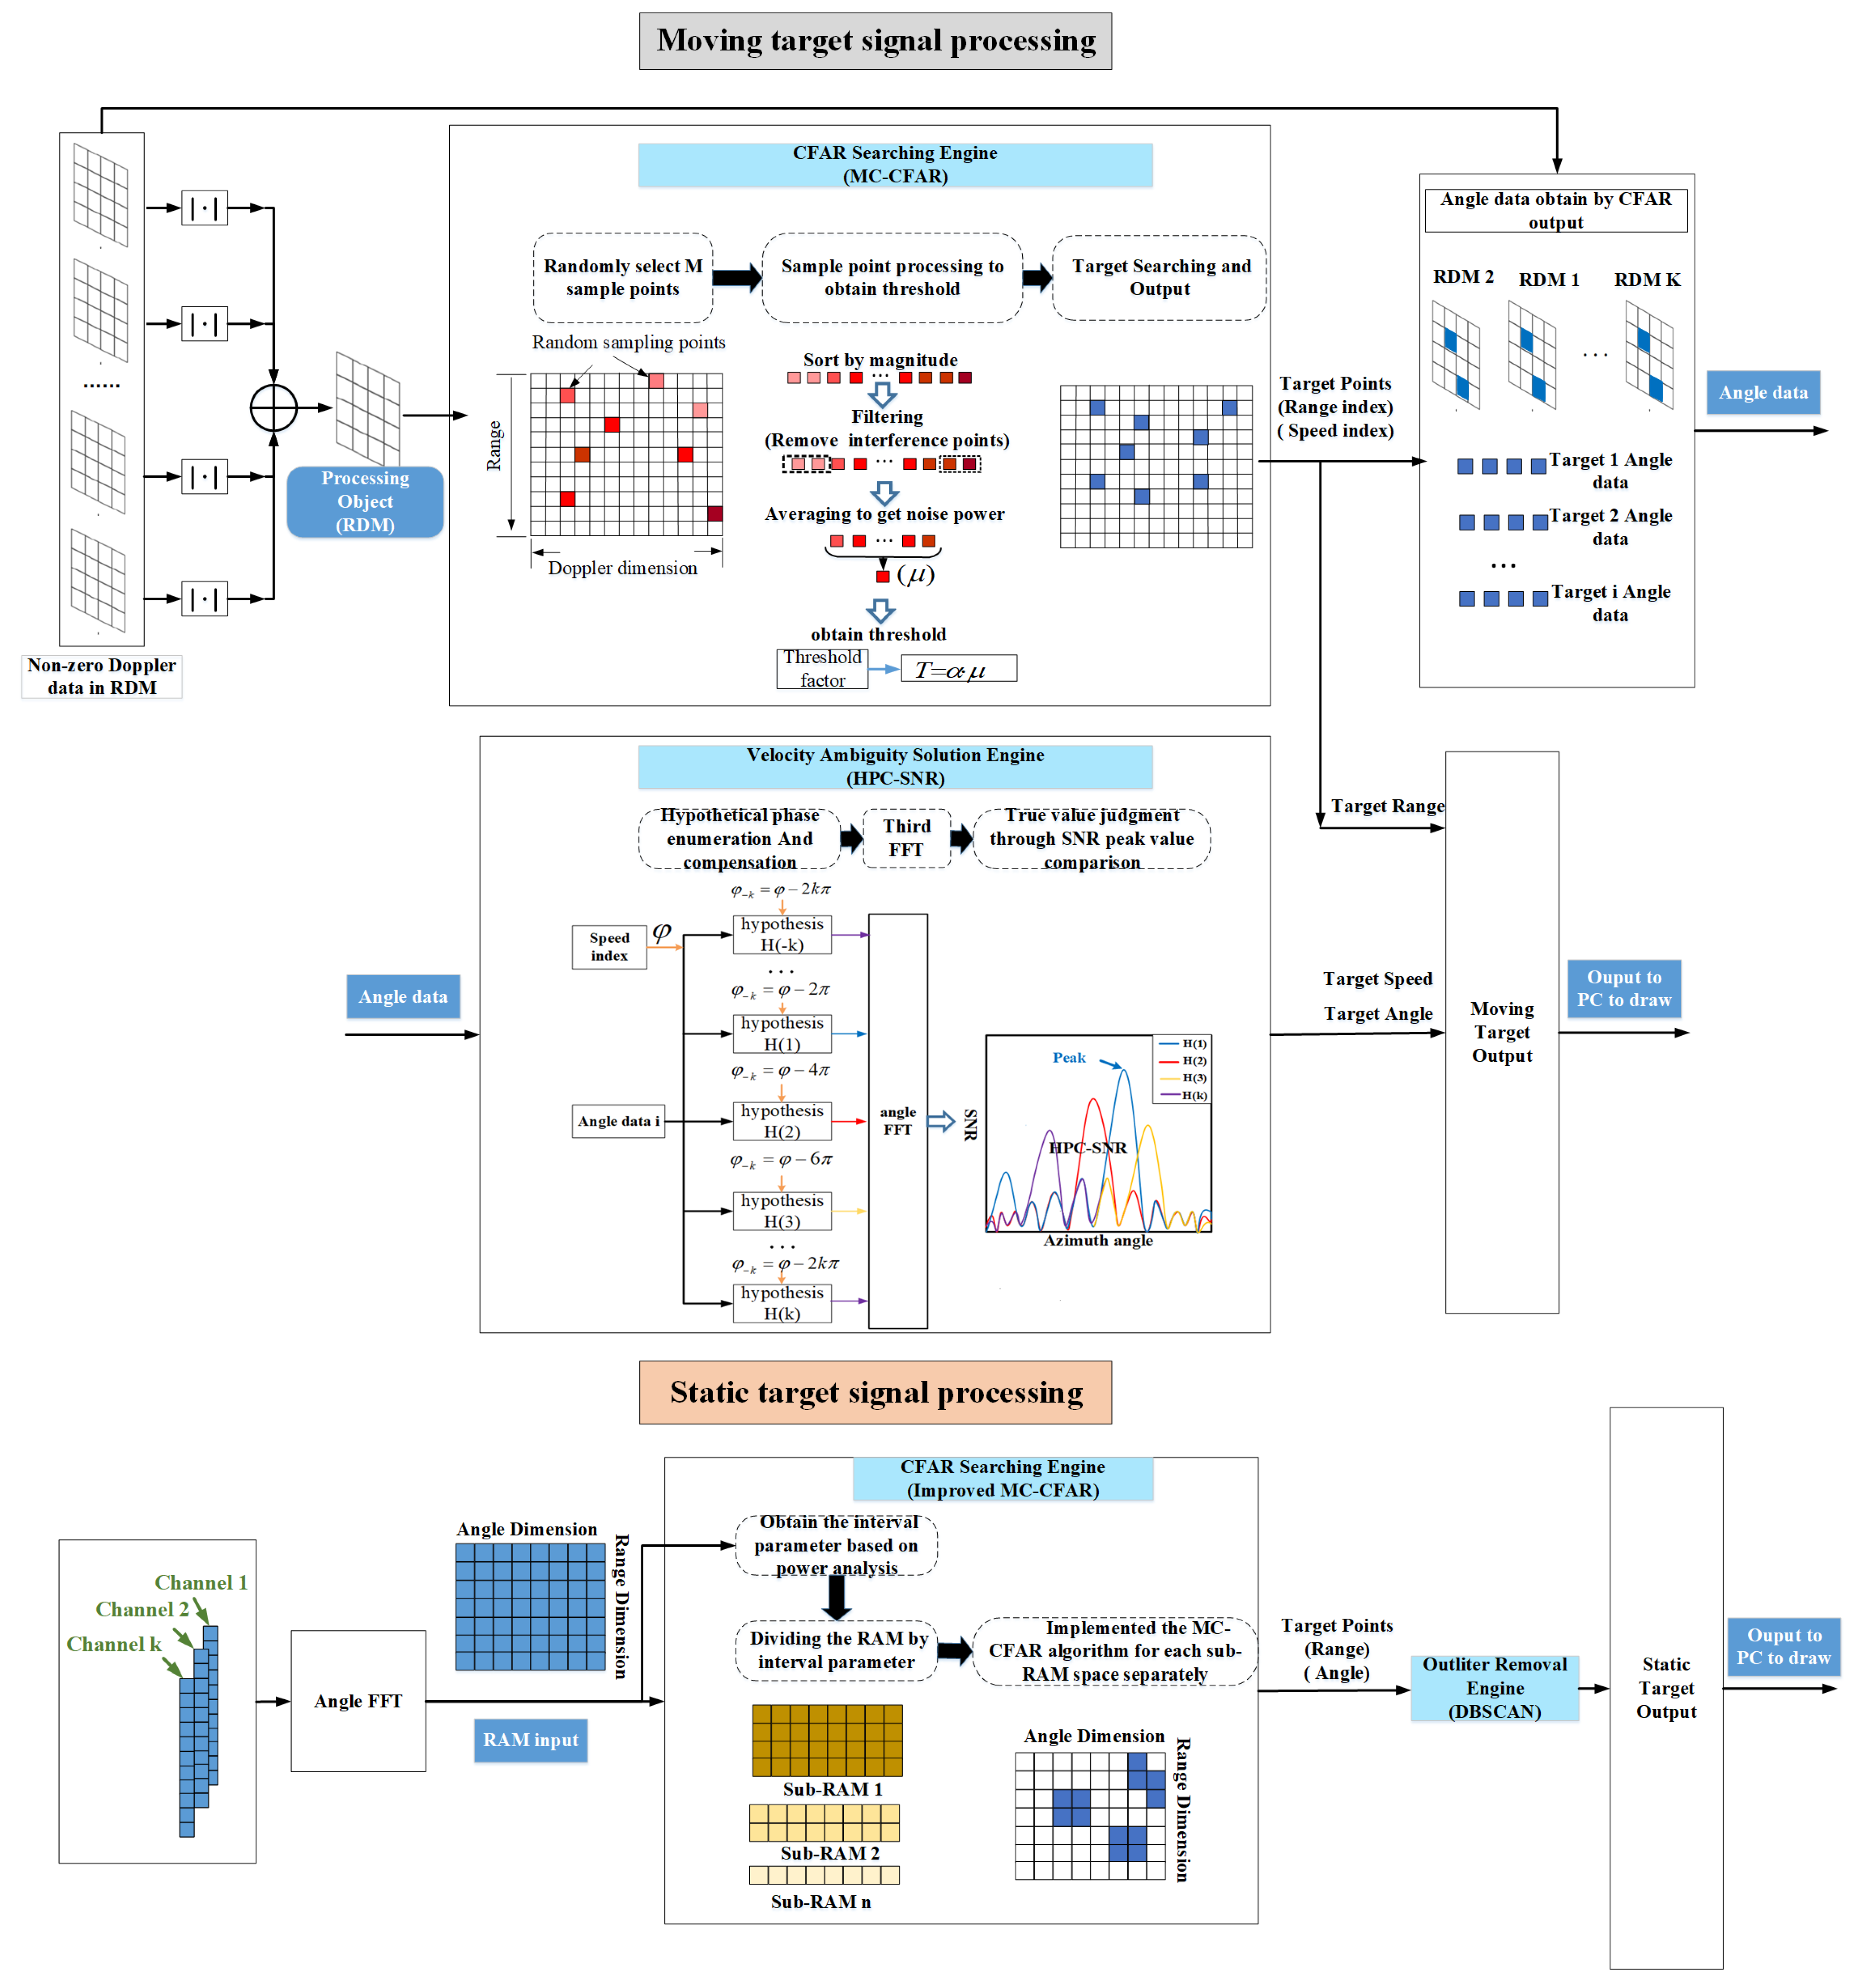
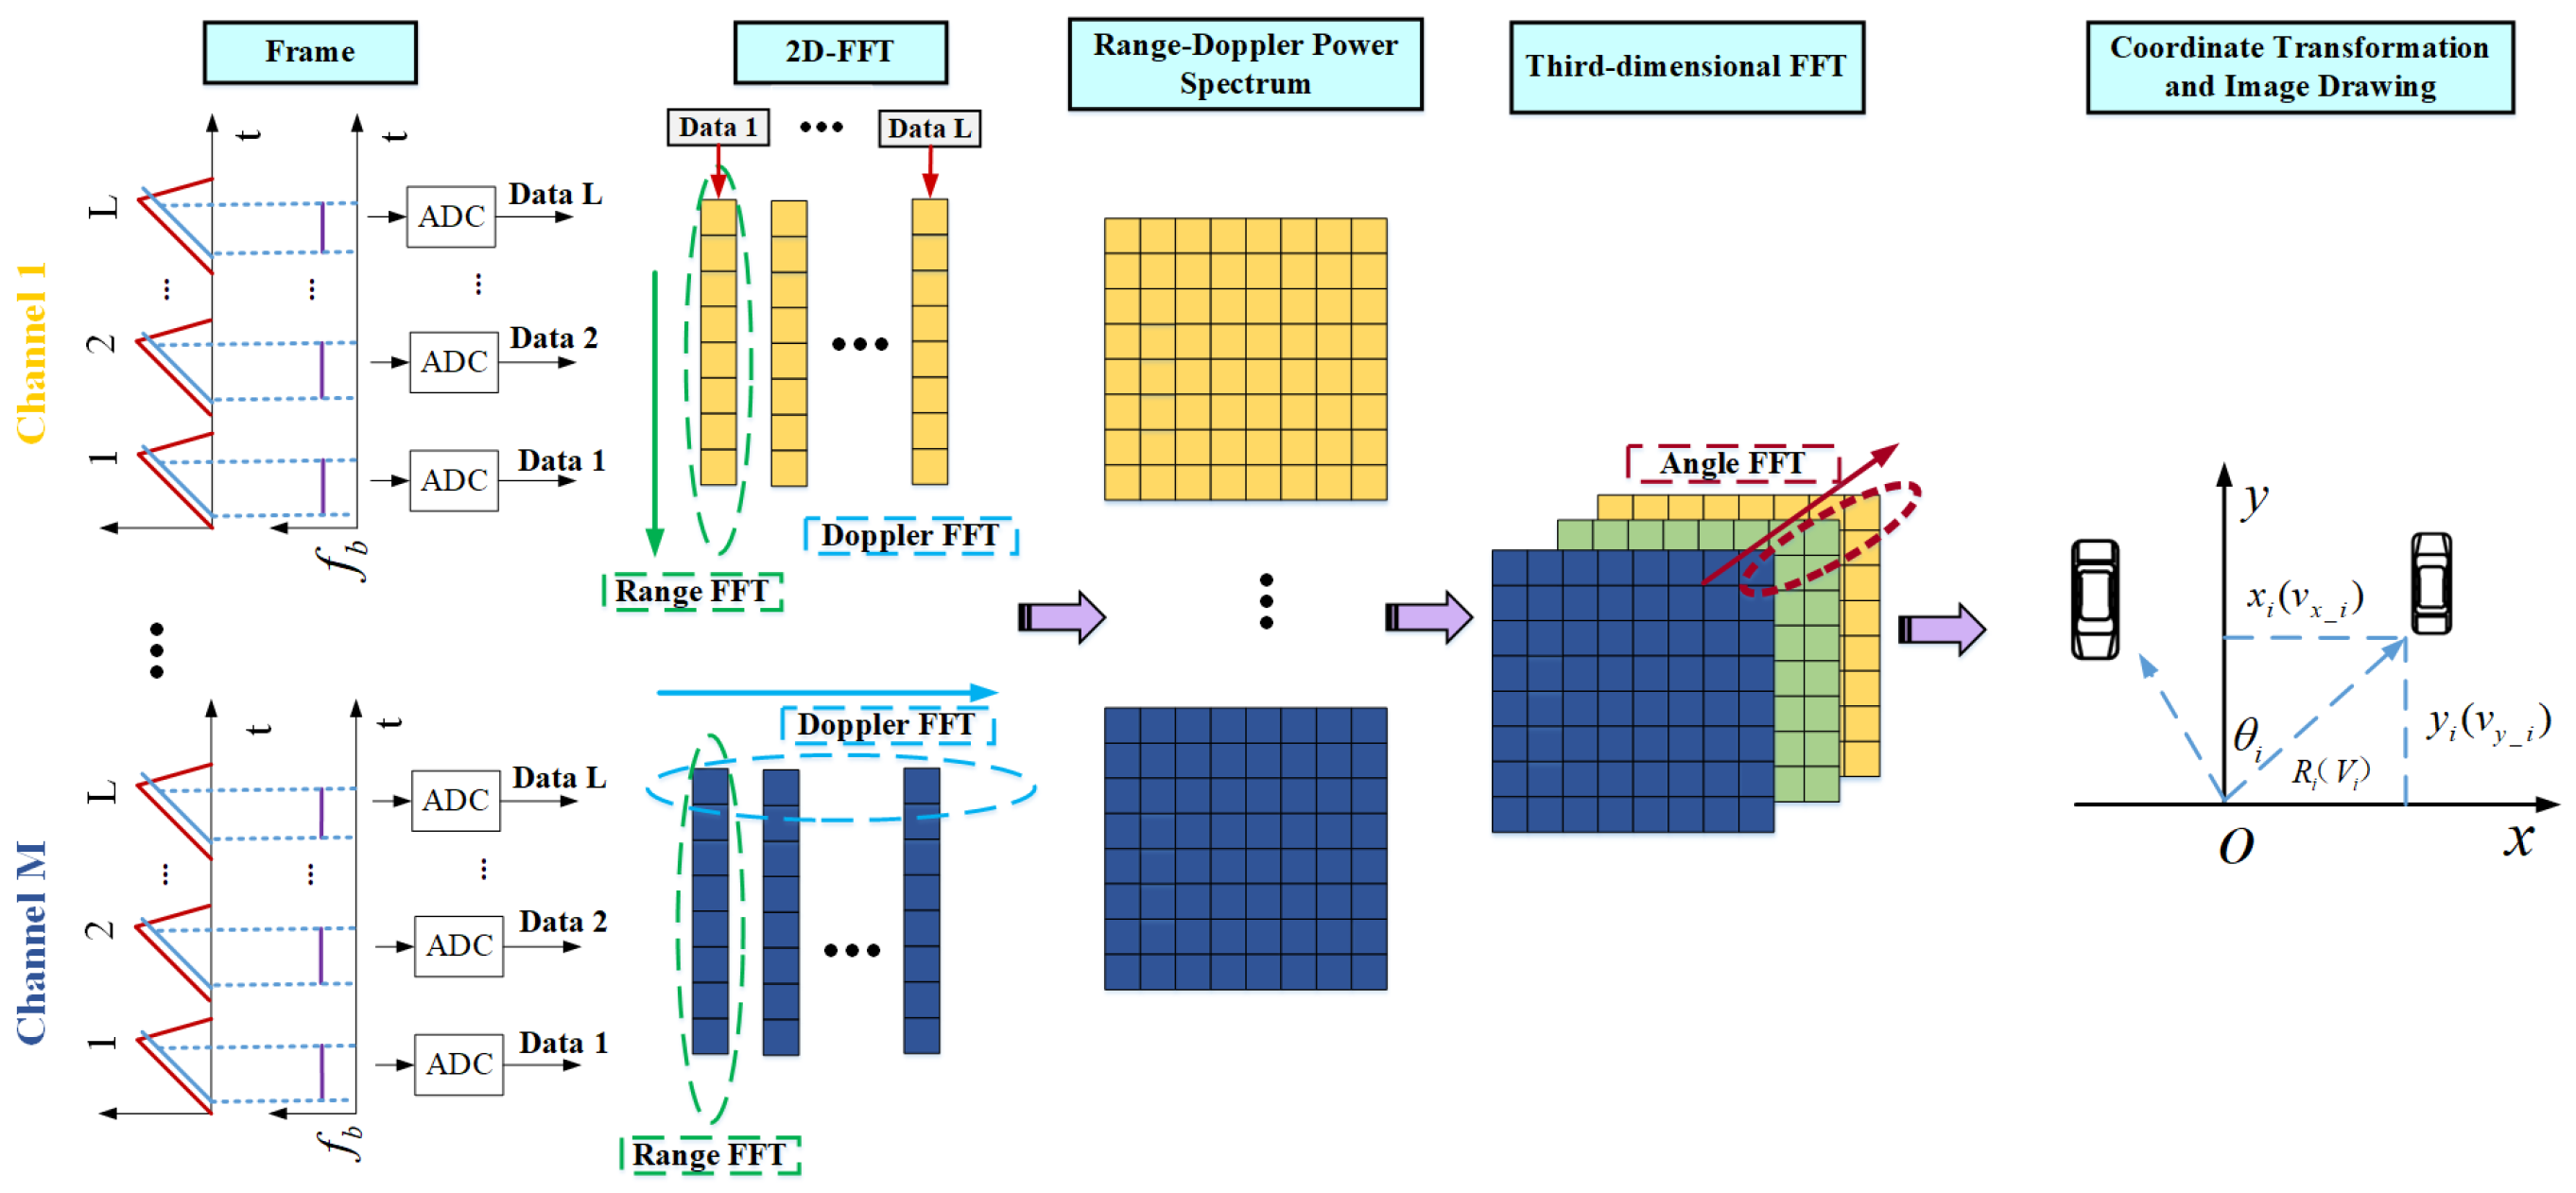
We divide the whole radar signal processing process into signal pre-processing and signal post-processing. The detailed processing flow of the proposed algorithms on the radar system is shown in Figure A2 and Figure A3.
The radar signal pre-processing process is as follows:
  • First, the radar uses the antenna array to obtain the raw data of the traffic scene. In the working mode of TDM-MIMO, the radar can obtain raw data from k ( k = 86 ) azimuth antenna channels at one time.
  • Then, the data of each azimuth antenna channel are subjected to a 2D-FFT operation to obtain k RDM matrices.
  • Next, we divide RDM data into two categories: zero-Doppler data and non-zero-Doppler data.
  • Finally, the non-zero-Doppler data and zero-Doppler data will be sent to the moving target signal processing unit and static target signal processing unit, respectively, in the post-processing of the radar signal to realize the detection and extraction of moving and static targets.
In the post-processing process of the radar signal, it is mainly divided into moving target signal processing and static target signal processing. The two processing flows are as follows:
Moving target information processing flow:
  • A new RDM matrix is obtained by incoherent accumulation of all non-zero-Doppler data. The new RDM matrix will be processed by the moving target CFAR search engine.
  • In the moving target CFAR search engine, the MC-CFAR algorithm is implemented to obtain the indices of target distance and velocity. In addition, the CA-CFAR, OS-CFAR, and OSCA-CFAR algorithms are implemented and compared to verify the performance of MC-CFAR algorithm.
  • The raw data on the target angle are obtained from the RDM set according to the index information. The angle data of all targets are sent to the velocity disambiguation engine for processing.
  • In the velocity disambiguation engine, the HPC-SNR algorithm is implemented to obtain the true velocity and azimuth of the target. Furthermore, the HPC-Peak algorithm is implemented and compared to verify the performance of HPC-SNR algorithm.
  • Finally, the real distance, speed, and angle of the target obtained through the CFAR engine and the velocity disambiguation engine are output to the PC terminal and drawn by drawing tools such as MATLAB.
Static target information processing flow:
  • The RDM zero-Doppler data in all channels are sent to the static target signal processing unit. The RAM matrix is obtained after FFT processing of the angle. The RAM matrix will be processed by the static target CFAR search engine.
  • In the static target CFAR search engine, the improved MC-CFAR algorithm is implemented to obtain indices of the target distance and angle. In addition, the CA-CFAR, OS-CFAR, and OSCA-CFAR algorithms are implemented and compared to verify the performance of the improved MC-CFAR algorithm.
  • All target points are input into the Outlier Removal Engine to eliminate interference points.
  • Finally, the static target point, after being processed by the DBSCAN algorithm, is output to the PC terminal to be drawn by tools such as MATLAB.
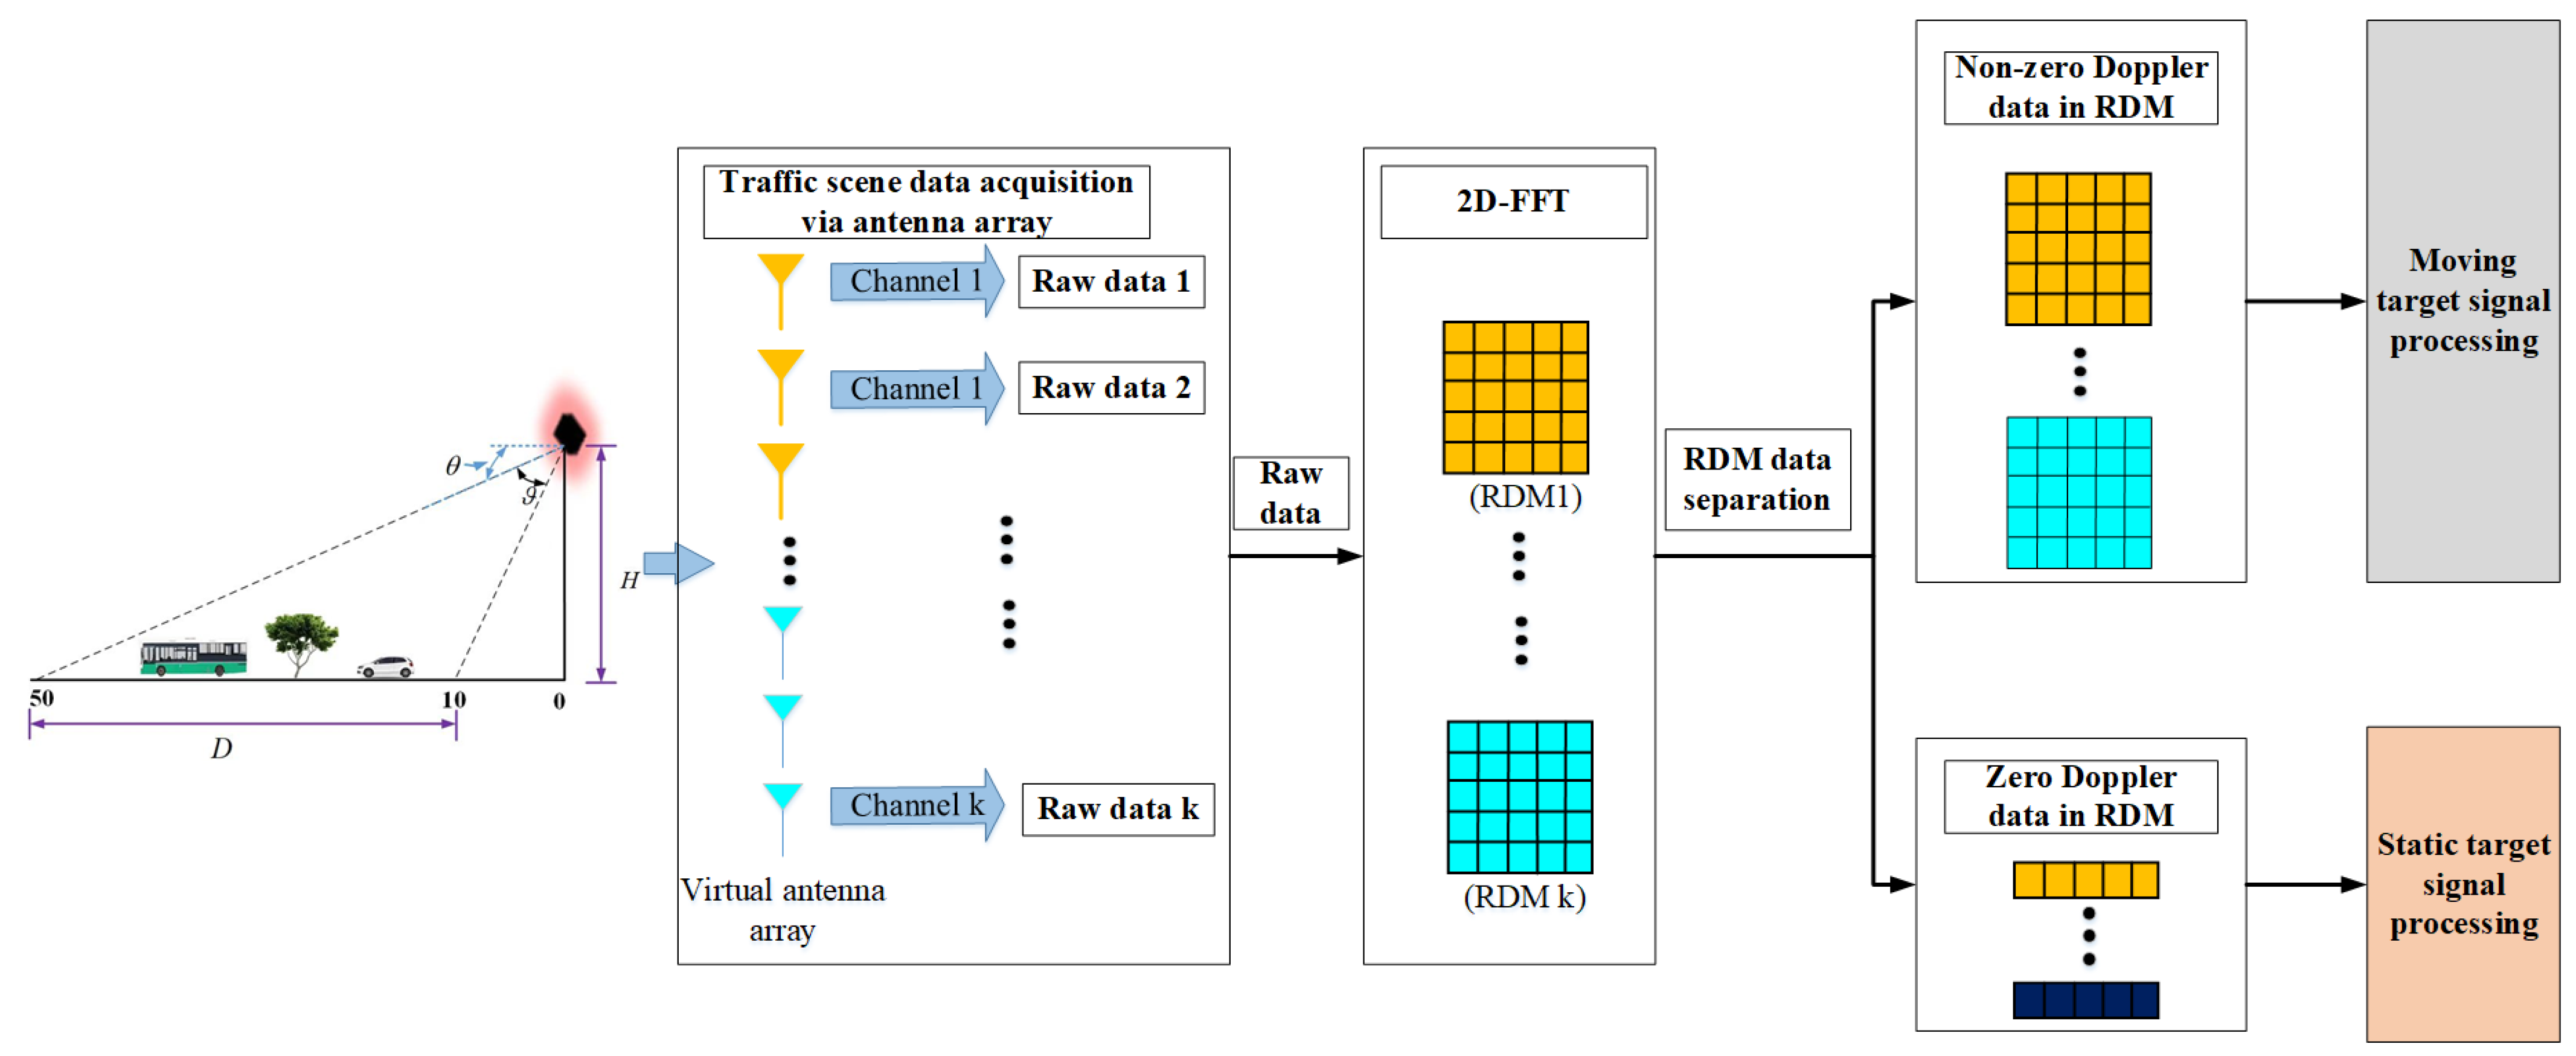
Figure A2. The radar signal pre-processing process.
Remotesensing 14 05416 g0a2
Figure A3. The radar signal post-processing process.
Remotesensing 14 05416 g0a3

Appendix B

Here is a video link:

References

  1. Prabhakara, A.; Jin, T.; Das, A.; Bhatt, G.; Kumari, L.; Soltanaghaei, E.; Bilmes, J.; Kumar, S.; Rowe, A. High Resolution Point Clouds from mmWave Radar. arXiv 2022, arXiv:2206.09273. [Google Scholar]
  2. Liu, H.; Li, N.; Guan, D.; Rai, L. Data feature analysis of non-scanning multi target millimeter-wave radar in traffic flow detection applications. Sensors 2018, 18, 2756. [Google Scholar] [CrossRef] [PubMed] [Green Version]
  3. Chang, S.; Zhang, Y.; Zhang, F.; Zhao, X.; Huang, S.; Feng, Z.; Wei, Z. Spatial attention fusion for obstacle detection using mmwave radar and vision sensor. Sensors 2020, 20, 956. [Google Scholar] [CrossRef] [Green Version]
  4. Pegoraro, J.; Meneghello, F.; Rossi, M. Multiperson continuous tracking and identification from mm-wave micro-Doppler signatures. IEEE Trans. Geosci. Remote Sens. 2020, 59, 2994–3009. [Google Scholar] [CrossRef]
  5. Dankert, H.; Horstmann, J.; Rosenthal, W. Wind-and wave-field measurements using marine X-band radar-image sequences. IEEE J. Ocean. Eng. 2005, 30, 534–542. [Google Scholar] [CrossRef]
  6. Nieto-Borge, J.; Hessner, K.; Jarabo-Amores, P.; De La Mata-Moya, D. Signal-to-noise ratio analysis to estimate ocean wave heights from X-band marine radar image time series. IET Radar Sonar Navig. 2008, 2, 35–41. [Google Scholar] [CrossRef] [Green Version]
  7. Wei, S.; Zhou, Z.; Wang, M.; Wei, J.; Liu, S.; Zhang, X.; Fan, F. 3DRIED: A high-resolution 3-D millimeter-wave radar dataset dedicated to imaging and evaluation. Remote Sens. 2021, 13, 3366. [Google Scholar] [CrossRef]
  8. Wang, Z.; Guo, Q.; Tian, X.; Chang, T.; Cui, H.L. Near-field 3-D millimeter-wave imaging using MIMO RMA with range compensation. IEEE Trans. Microw. Theory Tech. 2018, 67, 1157–1166. [Google Scholar] [CrossRef]
  9. Zhao, Y.; Yarovoy, A.; Fioranelli, F. Angle-insensitive Human Motion and Posture Recognition Based on 4D imaging Radar and Deep Learning Classifiers. IEEE Sens. J. 2022, 22, 12173–12182. [Google Scholar] [CrossRef]
  10. Qian, K.; He, Z.; Zhang, X. 3D point cloud generation with millimeter-wave radar. Proc. Acm Interact. Mob. Wearable Ubiquitous Technol. 2020, 4, 148. [Google Scholar] [CrossRef]
  11. Guo, Q.; Wang, Z.; Chang, T.; Cui, H.L. Millimeter-Wave 3-D Imaging Testbed with MIMO Array. IEEE Trans. Microw. Theory Tech. 2020, 68, 1164–1174. [Google Scholar] [CrossRef]
  12. Sun, S.; Zhang, Y.D. 4D Automotive Radar Sensing for Autonomous Vehicles: A Sparsity-Oriented Approach. IEEE J. Sel. Top. Signal Process. 2021, 15, 879–891. [Google Scholar] [CrossRef]
  13. Gao, X.; Xing, G.; Roy, S.; Liu, H. Ramp-cnn: A novel neural network for enhanced automotive radar object recognition. IEEE Sens. J. 2020, 21, 5119–5132. [Google Scholar] [CrossRef]
  14. Li, G.; Sit, Y.L.; Manchala, S.; Kettner, T.; Ossowska, A.; Krupinski, K.; Sturm, C.; Goerner, S.; Lübbert, U. Pioneer study on near-range sensing with 4D MIMO-FMCW automotive radars. In Proceedings of the 2019 20th International Radar Symposium (IRS), Ulm, Germany, 26–28 June 2019; pp. 1–10. [Google Scholar]
  15. Lee, T.Y.; Skvortsov, V.; Kim, M.S.; Han, S.H.; Ka, M.H. Application of W -Band FMCW Radar for Road Curvature Estimation in Poor Visibility Conditions. IEEE Sens. J. 2018, 18, 5300–5312. [Google Scholar] [CrossRef]
  16. Sabery, S.M.; Bystrov, A.; Gardner, P.; Stroescu, A.; Gashinova, M. Road Surface Classification Based on Radar Imaging Using Convolutional Neural Network. IEEE Sens. J. 2021, 21, 18725–18732. [Google Scholar] [CrossRef]
  17. Farina, A.; Studer, F.A. A review of CFAR detection techniques in radar systems. Microw. J. 1986, 29, 115. [Google Scholar]
  18. Gandhi, P.; Kassam, S. Analysis of CFAR processors in nonhomogeneous background. IEEE Trans. Aerosp. Electron. Syst. 1988, 24, 427–445. [Google Scholar] [CrossRef]
  19. Finn, H.M. Adaptive detection mode with threshold control as a function of spatially sampled-clutter-level estimates. RCA Rev. 1968, 29, 414–464. [Google Scholar]
  20. Yan, J.; Li, X.; Shao, Z. Intelligent and fast two-dimensional CFAR procedure. In Proceedings of the 2015 IEEE International Conference on Communication Problem-Solving (ICCP), Guilin, China, 16–18 October 2015; pp. 461–463. [Google Scholar] [CrossRef]
  21. Rohling, H. Resolution of Range and Doppler Ambiguities in Pulse Radar Systems. In Proceedings of the Digital Signal Processing, Florence, Italy, 7–10 September 1987; p. 58. [Google Scholar]
  22. Kronauge, M.; Schroeder, C.; Rohling, H. Radar target detection and Doppler ambiguity resolution. In Proceedings of the 11-th International Radar Symposium, Vilnius, Lithuania, 16–18 June 2010; pp. 1–4. [Google Scholar]
  23. Kellner, D.; Klappstein, J.; Dietmayer, K. Grid-based DBSCAN for clustering extended objects in radar data. In Proceedings of the IEEE Intelligent Vehicles Symposium, Madrid, Spain, 3–7 June 2012; pp. 365–370. [Google Scholar]
  24. Roos, F.; Bechter, J.; Appenrodt, N.; Dickmann, J.; Waldschmidt, C. Enhancement of Doppler unambiguity for chirp-sequence modulated TDM-MIMO radars. In Proceedings of the 2018 IEEE MTT-S International Conference on Microwaves for Intelligent Mobility (ICMIM), Munich, Germany, 16–17 April 2018; pp. 1–4. [Google Scholar]
  25. Gonzalez, H.A.; Liu, C.; Vogginger, B.; Mayr, C.G. Doppler Ambiguity Resolution for Binary-Phase-Modulated MIMO FMCW Radars. In Proceedings of the 2019 International Radar Conference (RADAR), Toulon, France, 23–27 September 2019; pp. 1–6. [Google Scholar] [CrossRef]
  26. Gonzalez, H.A.; Liu, C.; Vogginger, B.; Kumaraveeran, P.; Mayr, C.G. Doppler disambiguation in MIMO FMCW radars with binary phase modulation. IET Radar Sonar Navig. 2021, 15, 884–901. [Google Scholar] [CrossRef]
  27. Liu, C.; Gonzalez, H.A.; Vogginger, B.; Mayr, C.G. Phase-based doppler disambiguation in TDM and BPM MIMO FMCW radars. In Proceedings of the 2021 IEEE Radio and Wireless Symposium (RWS), San Diego, CA, USA, 17–22 January 2021; pp. 87–90. [Google Scholar]
  28. Stolz, M.; Wolf, M.; Meinl, F.; Kunert, M.; Menzel, W. A new antenna array and signal processing concept for an automotive 4D radar. In Proceedings of the 2018 15th European Radar Conference (EuRAD), Madrid, Spain, 26–28 September 2018; pp. 63–66. [Google Scholar]
  29. Phippen, D.; Daniel, L.; Hoare Sr, E.; Gishkori Sr, S.; Mulgrew, B.; Cherniakov, M.; Gashinova, M. Height estimation for 3-D automotive scene reconstruction using 300 GHz multireceiver radar. IEEE Trans. Aerosp. Electron. Syst. 2022, 58, 2339–2351. [Google Scholar] [CrossRef]
  30. Laribi, A.; Hahn, M.; Dickmann, J.; Waldschmidt, C. A new height-estimation method using FMCW radar Doppler beam sharpening. In Proceedings of the 2017 25th European Signal Processing Conference (EUSIPCO), Kos Island, Greece, 28 August–2 September 2017; pp. 1932–1936. [Google Scholar]
  31. Laribi, A.; Hahn, M.; Dickmann, J.; Waldschmidt, C. A novel target-height estimation approach using radar-wave multipath propagation for automotive applications. Adv. Radio Sci. 2017, 15, 61–67. [Google Scholar] [CrossRef]
  32. Cui, H.; Wu, J.; Zhang, J.; Chowdhary, G.; Norris, W.R. 3D Detection and Tracking for On-road Vehicles with a Monovision Camera and Dual Low-cost 4D mmWave Radars. In Proceedings of the 2021 IEEE International Intelligent Transportation Systems Conference (ITSC), Indianapolis, IN, USA, 19 September 2021; pp. 2931–2937. [Google Scholar]
  33. Jin, F.; Sengupta, A.; Cao, S.; Wu, Y.J. Mmwave radar point cloud segmentation using gmm in multimodal traffic monitoring. In Proceedings of the 2020 IEEE International Radar Conference (RADAR), Washington, DC, USA, 28–30 April 2020; pp. 732–737. [Google Scholar]
  34. Yang, B.; Zhang, H. A CFAR Algorithm Based on Monte Carlo Method for Millimeter-Wave Radar Road Traffic Target Detection. Remote Sens. 2022, 14, 1779. [Google Scholar] [CrossRef]
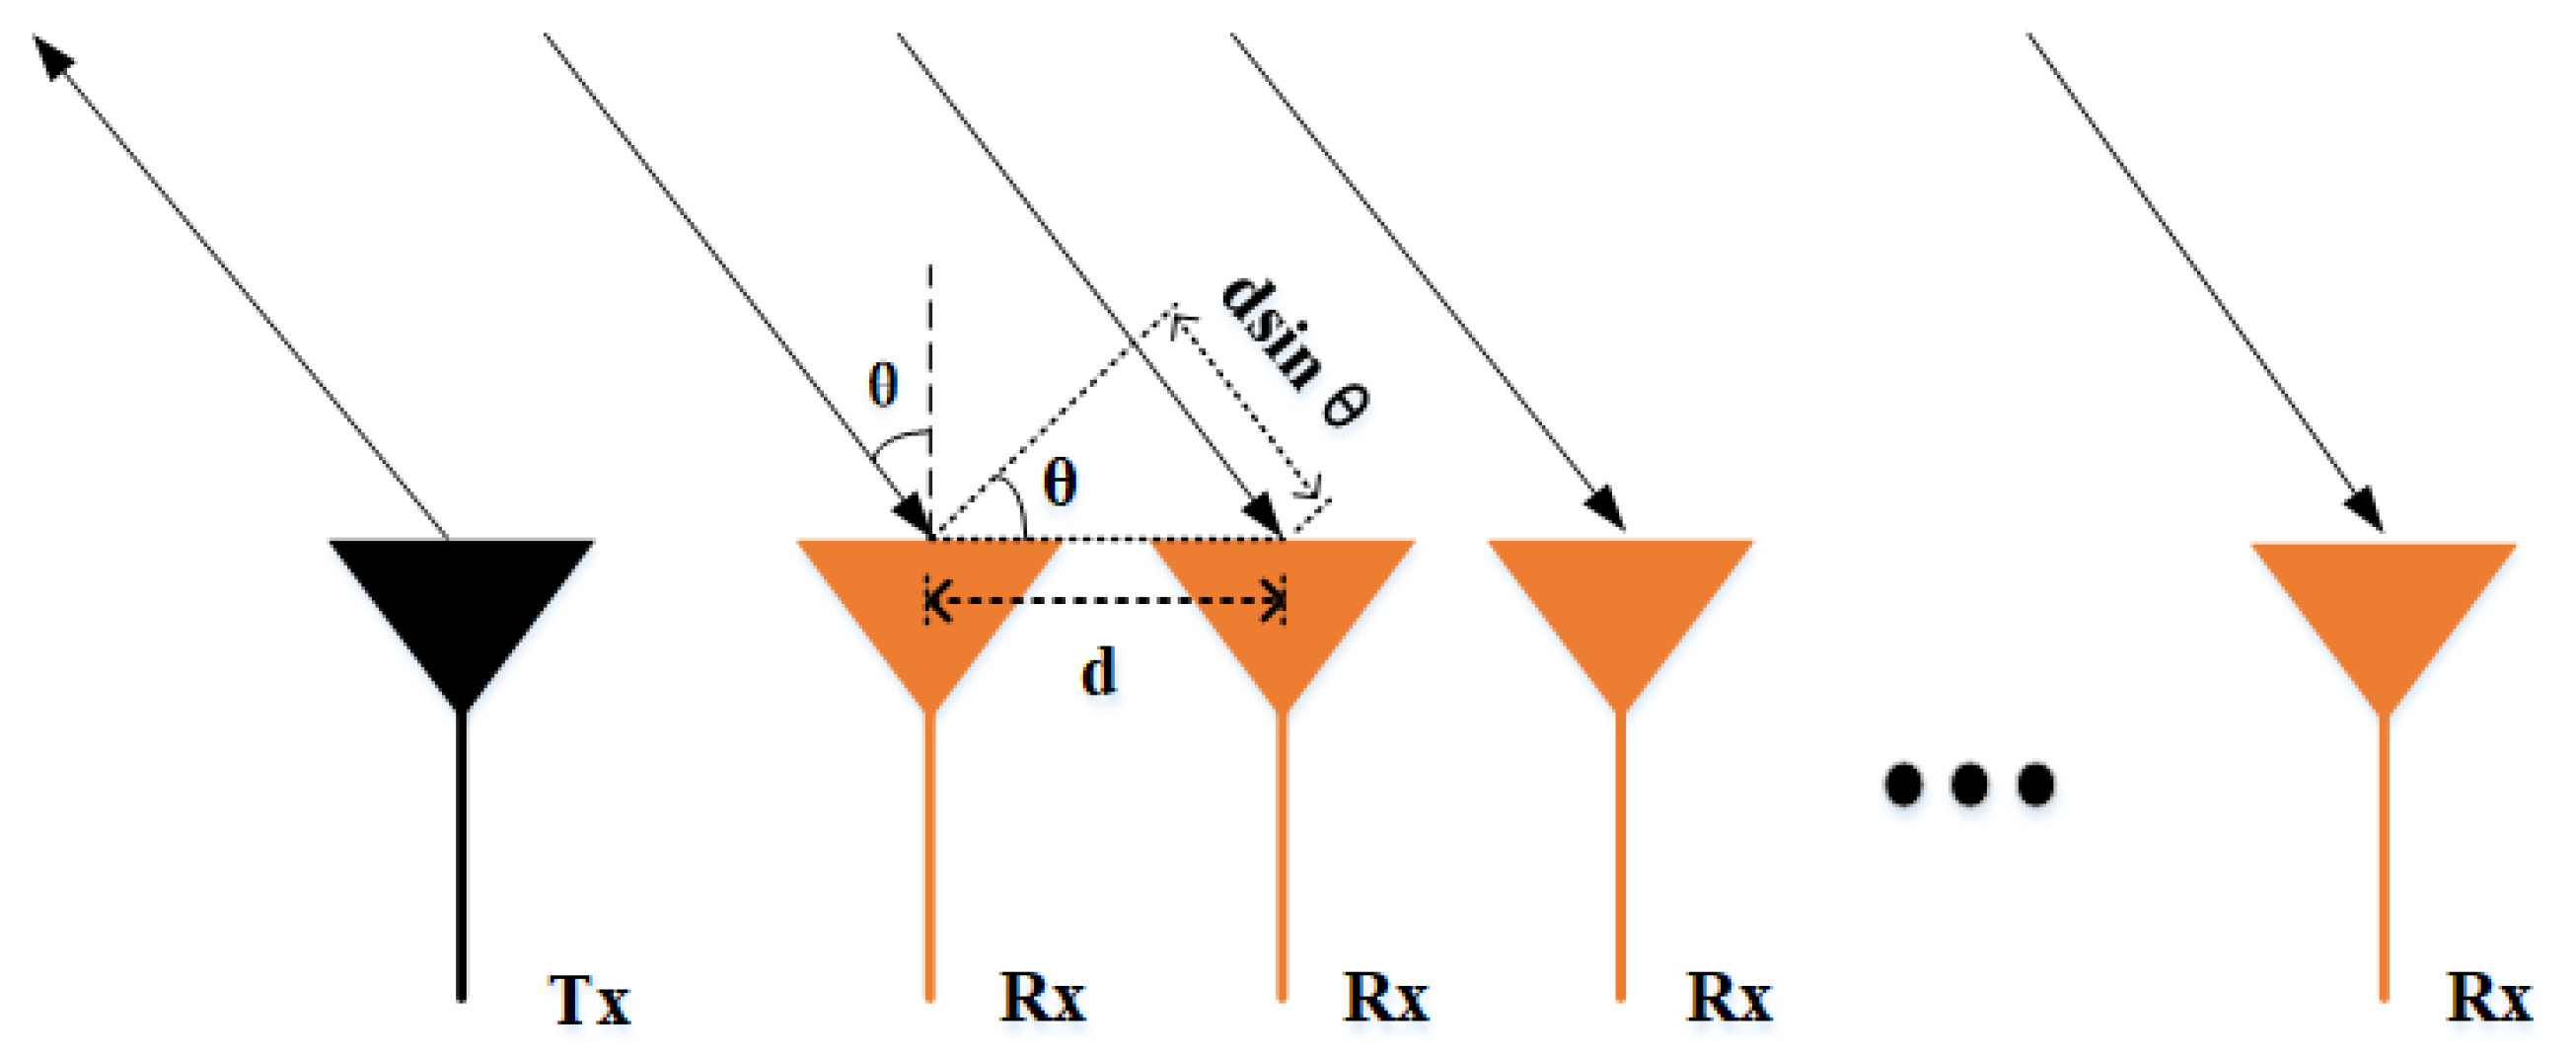
Figure 1. Linear arrays.
Remotesensing 14 05416 g001
Figure 2. A typical radar imaging process flow based on the 3D-FFT method.
Remotesensing 14 05416 g002
Figure 3. (a) Traffic scene model. (b) Radar deployment and test scenarios.
Remotesensing 14 05416 g003
Figure 4. Radar systems.
Remotesensing 14 05416 g004
Figure 5. (a) Radar real antenna array. (b) Virtual antenna array.
Remotesensing 14 05416 g005
Figure 6. The RDM detection matrix.
Remotesensing 14 05416 g006
Figure 7. Background noise amplitude dispersion analysis in non-zero-Doppler region. (a) Noise amplitude variance in range direction. (b) Noise amplitude variance in Doppler direction. (c) Noise distribution curve. (d) Matching degree of Normal distribution.
Remotesensing 14 05416 g007
Figure 8. Background noise amplitude dispersion in RDM zero-Doppler region.
Remotesensing 14 05416 g008
Figure 9. The improved 3D-FFT radar imaging architecture.
Remotesensing 14 05416 g009
Figure 10. The MC-CFAR processing model.
Remotesensing 14 05416 g010
Figure 11. Static target distribution in the RDM and RAM. (a) RDM in a two-dimensional view. (b) RAM in a two-dimensional view.
Remotesensing 14 05416 g011
Figure 12. RAM noise analysis and interval division. (a) Relationship between noise amplitude and distance in RAM. (b) RAM interval division for MC-CFAR detection.
Remotesensing 14 05416 g012
Figure 13. Velocity and angle estimation errors caused by velocity ambiguity. (a) Velocity estimation error. (b) Angle estimation error.
Remotesensing 14 05416 g013
Figure 14. Vehicle 2D image mapping. (a) Radar detection geometry model. (b) Vehicle 2D imaging.
Remotesensing 14 05416 g014
Figure 15. MC-CFAR algorithm performance. (a) Detection sensitivity. (b) Computational complexity.
Remotesensing 14 05416 g015
Figure 16. CFAR detection example.
Remotesensing 14 05416 g016
Figure 17. The improved MC-CFAR algorithm performance. (a) Target detection under non-uniform noise. (b) Noise region division based on the fitting curve.
Remotesensing 14 05416 g017
Figure 18. The HPC-Peak algorithm simulation. (a) Velocity estimation error. (b) Angle estimation error.
Remotesensing 14 05416 g018
Figure 19. Performance simulation of Velocity disambiguation algorithm in multi-objective situations. (a) The angle estimation error of the HPC-Peak in two targets. (b) The angle estimation error of the HPC-SNR in two targets. (c) The FFT angle power spectrum waveform of the HPC-Peak and the HPC-SNR in two targets. (d) The angle estimation error of the HPC-Peak in three targets. (e) The angle estimation error of the HPC-SNR in three targets. (f) The FFT angle power spectrum waveform of the HPC-Peak and the HPC-SNR in three targets. (g) The angle estimation error of the HPC-Peak in four targets. (h) The angle estimation error of the HPC-SNR in four targets. (i) The FFT angle power spectrum waveform of the HPC-Peak and the HPC-SNR in four targets.
Remotesensing 14 05416 g019
Figure 20. DBSCAN-based noise removal simulation. (a) The raw data of point cloud. (b) The performance of the DBSCAN algorithm. (c) The performance of the K-MEANS algorithm.
Remotesensing 14 05416 g020
Figure 21. Driving vehicle imaging examples.
Remotesensing 14 05416 g021
Figure 22. Moving targets CFAR test. (a) The CA-CFAR algorithm test result in the case of vehicle 1. (b) The OS-CFAR algorithm test result in the case of vehicle 1. (c) The OSCA-CFAR algorithm test result in the case of vehicle 1. (d) The MC-CFAR algorithm test result in the case of vehicle 1. (e) The CA-CFAR algorithm test result in the case of vehicle 2. (f) The OS-CFAR algorithm test result in the case of vehicle 2. (g) The OSCA-CFAR algorithm test result in the case of vehicle 2. (h) The MC-CFAR algorithm test result in the case of vehicle 2. (i) The CA-CFAR algorithm test result in the case of vehicle 3. (j) The OS-CFAR algorithm test result in the case of vehicle 3. (k) The OSCA-CFAR algorithm test result in the case of vehicle 3. (m) The MC-CFAR algorithm test result in the case of vehicle 3. (l) The CA-CFAR test result algorithm in the case of vehicle 4. (n) The OS-CFAR algorithm test result in the case of vehicle 4. (o) The OSCA-CFAR algorithm test result in the case of vehicle 4. (p) The MC-CFAR algorithm test result in the case of vehicle 4.
Remotesensing 14 05416 g022
Figure 23. Velocity disambiguation test. (a) Without velocity disambiguation in vehicle 1 case. (b) The HPC-Peak algorithm test result in vehicle 1 case. (c) The HPC-SNR algorithm test result in vehicle 1 case. (d) Without velocity disambiguation in vehicle 2 case. (e) The HPC-Peak algorithm test result in vehicle 2 case. (f) The HPC-SNR algorithm test result in vehicle 2 case. (g) Without velocity disambiguation in vehicle 3 case. (h) The HPC-Peak algorithm test result in vehicle 3 case. (i) The HPC-SNR algorithm test result in vehicle 3 case. (j) Without velocity disambiguation in vehicle 4 case. (k) The HPC-Peak algorithm test result in vehicle 4 case. (l) The HPC-SNR algorithm test result in vehicle 4 case.
Remotesensing 14 05416 g023
Figure 24. Static target imaging test.
Remotesensing 14 05416 g024
Figure 25. RAM division interval.
Remotesensing 14 05416 g025
Figure 26. Noise points removal results by DBSCAN algorithm. (a) Raw point cloud image of traffic scene 1. (b) Target point classification by the DBSCAN in traffic scene 1. (c) Noise remove Result in traffic scene 1. (d) Raw point cloud image of traffic scene 2. (e) Target point classification by the DBSCAN in traffic scene 2. (f) Noise remove Result in traffic scene 2.
Remotesensing 14 05416 g026
Figure 27. Urban traffic road imaging based on millimeter-wave radar. (a) Traffic scene 1 and combined moving and static targets imaging result. (b) Traffic scene 2 and combined moving and static targets imaging result.
Remotesensing 14 05416 g027
Figure 28. Length estimation error.
Remotesensing 14 05416 g028
Figure 29. Vehicle type estimation based on point cloud area. (a) Different types of vehicle point clouds. (b) Vehicle type awareness accuracy.
Remotesensing 14 05416 g029
Table 1. Radar platform parameters.
ItemParametersItemParameters
Range FFT points512Chirp number64
R m a x 50 m V m a x 2.14 m/s
R r e s o l u t i o n 0.098 m V r e s o l u t i o n 0.067 m/s
Operating modeTDM-MIMO A r e s o l u t i o n 1.4
ϕ 30 ϑ 40
Table 2. Imaging radar vs. detection radar.
ItemImaging RadarDetection Radar
Mission FocusTraffic PerceptionMoving target detection
Detection ObjectMoving target and Static targetMoving target
Target SizeNot NegligibleIdeal point
Target Velocity>(5∼8) V m a x <2 V m a x
OutputTarget point cloudsTarget trajectory
Table 3. Vehicle information.
Vehicle TypeDriving DirectionLane (Relative to Radar)X-Axis Range (m)
Vehicle 1closeSecond lane on the left radar[−7.5, −3.5]
Vehicle 2far awayThird lane on the right radar[7.5, 11.5]
Vehicle 3closeFirst lane on the left radar[−11.5, −7.5]
Vehicle 4closeThird lane on the left radar[−3.5, 0]
Table 4. CFAR algorithm parameter configuration.
AlgorithmWindow Length/Samples NumberThreshold Factor
CA-CFAR163
OS-CFAR163
OSCA-CFAR164
MC-CFAR7684
Publisher’s Note: MDPI stays neutral with regard to jurisdictional claims in published maps and institutional affiliations.