Abstract
With the rapid upgrade of global navigation satellite system (GNSS) single-frequency (SF) receivers and the increasing market demand for low-cost hardware, SF precise point positioning (PPP) technology has been widely applied in the time and frequency field. The five-frequency signals provided by the whole constellation of Galileo bring more opportunities for the application of SF PPP in time and frequency transfer. In this contribution, using Galileo’s multi-frequency observations, three SF PPP time and frequency transfer models, i.e., the un-combined (UC) model, the ionosphere-free-half (IFH) model, and the ionosphere-weighted constraints (IWCs) model are established. SF PPP time and frequency transfer performance with Galileo E1, E5a, E5b, E5, and E6 multi-frequency observations is evaluated using four links (947.7 km to 1331.6 km) with five external high-precision atomic clocks stations. The results show that the time and frequency transfer performance of SF-UC and SF-IWC is better than that of SF-IFH, and the timing accuracy of SF-UC and SF-IWC is similar. SF PPP time and transfer performance with E5, E5a, E5b, and E6 signals is improved compared with traditional E1 signal. Among them, the frequency stability of E5 improves the most (about 58%), and that of E6 improves the least (about 14%). In addition, the difference in frequency stability between SF and double-frequency (DF) PPP decreases gradually with an increase in average time, and the frequency stability difference between SF and DF PPP can reach 2 × 10⁻¹⁶ in 120,000 s, indicating that SF PPP has the potential to achieve DF PPP frequency stability. Considering the possible frequency data loss during actual observation, the cost of the GNSS SF receiver, and the advantages of Galileo multi-frequency observations, SF PPP can also meet the long-time time and frequency transfer requirements, and the SF-IWC model based on Galileo E5 observations is more recommended.
1. Introduction
In recent decades, the development and modernization of global navigation satellite systems (GNSSs) have substantially progressed, which has realized interoperability and multi-frequency signal support [1,2,3,4,5]. The Galileo navigation satellite system (Galileo) operated by the European Space Agency (ESA) supports the broadcasting of five-frequency signals, i.e., E1 (1575.42 MHz), E5a (1176.45 MHz), E5b (1207.14 MHz), E5 (1191.795 MHz), and E6 (1278.75 MHz), throughout the constellation to provide positioning, navigation, and timing (PNT) services worldwide [6,7,8,9].
Relevant scholars have investigated the performance of multi-frequency signals in time and frequency transfer [10,11,12]. For instance, Zhang et al. [13] studied the Galileo E1/E5a/E5b/E6 quad-frequency IF PPP time transfer model, proving the similar performance of double-, triple- and quad-frequency time transfer; Jin and Su [14] compared the BDS combined quad-frequency PPP models and demonstrated that multi-frequency signals could improve PPP performances; and Ge et al. [15] investigated the performance of BDS-3/Galileo combined with quad-frequency time transfer and proved that the stability and accuracy of four-frequency and dual-frequency (DF) time transfer were the same. The multi-frequency research mentioned above proves that a multi-frequency signal has a slight advantage over a DF signal in positioning and timing. However, these studies all focus on the multi-frequency ionosphere-free (IF) combination model and do not involve the single-frequency (SF) model with a multi-frequency signal. At the same time, with the rapid upgrade of single-frequency GNSS receivers and the increasing demand for low-cost SF hardware in the market, many scholars have evaluated the performance of SF PPP [16,17,18,19,20,21,22,23,24,25]. For instance, Li et al. [26] compared ionosphere-corrected (IC), ionosphere-free-half (IFH), and ionosphere-weighted constraint (IWC) SF PPP models from a theoretical and experimental perspective, and proved that the IWC model has advantages over the IC and IF SF PPP model. Ge et al. [27] evaluated the performance of SF PPP time transfer of multi-GNSS, proving that the type A uncertainty of SF PPP can reach the sub-nanosecond level, and the multi-system has obvious advantages in SF time transfer compared with the single system. Zhao et al. [28] released an open-source multi-system SF PPP data-processing software SUPREME. Wang et al. [29] used BDS-3 B1I and B1C signals to carry out the time and frequency transfer of SF PPP, which proved that B1C has an advantage over B1I in timing and proved that the time and frequency transfer performance of SF PPP with ionospheric constraints is better than that of SF un-combined (UC) PPP. It can be found that the above SF PPP researches all focus on the basic signal SF positioning or timing, and the performance evaluation of multi-frequency signal in post-time (PT) and real-time (RT) SF model time and frequency transfer is insufficient.
With the maturity of clock manufacturing technology, rubidium and cesium atomic clock and even hydrogen atomic clocks have achieved low cost and miniatures (at present, about 67% of International GNSS Service (IGS) stations are equipped with rubidium, cesium and hydrogen atomic clocks), and the cost of small rubidium and cesium atomic clocks are comparable or even lower than that of GNSS receivers. The development of kinematic positioning and intelligent driving technology also makes the demand for high-precision and lower-cost timing gradually increase. Considering the lower cost of an SF GNSS receiver, the potential loss of multi-frequency data during actual observation, the fact that hardware delay calibration of SF devices is simpler than that of DF devices, and the fact that the noise coefficient of the SF model is smaller than that of the traditional DF IF model, the precision time and frequency transfer based on SF observations will have a wide application prospect. However, current studies on SF PPP time and frequency transfer only use the basic frequencies (such as the GPS L1 signal, the BDS B1I signal, and the Galileo E1 signal), and research on the time and frequency transfer of the SF PPP model using Galileo E1, E5a, E5b, E5, and E6 multi-frequency observations is lacking.
Combining the potential of SF time and frequency transfer applications and the real environment of the rapid development of multi-frequency signals, in this contribution, we adopt three SF PPP models and systematically assess the performance of the SF PPP time and frequency transfer of Galileo E1, E5, E5a, E5b, and E6 signals by PT and RT processing schemes. In Section 2, the SF-UC, SF-IFH, and SF-IWC SF PPP models are presented. Section 3 introduces the experimental data and its processing strategy, and the Centre National d’Etudes Spatiales (CNES) GRG final and SSRC00CNE0 real-time stream (RTS) precise products are used to compare and analyze the performance of the SF-UC, SF-IFH, and SF-IWC PPP time and frequency transfer with Galileo E1, E5, E5a, E5b, and E6 signals. Finally, we summarize this work and draw some conclusions.
2. Materials and Methods
In this section, three types of single-frequency PPP time and frequency transfer models are established based on GNSS original multi-frequency observations, the method to solve the rank deficiency of the single-frequency PPP model is proposed, and the implementation flow of single-frequency PPP time and frequency transfer is given.
2.1. SF-UC PPP Time and Frequency Transfer Model
GNSS original pseudo-range and carrier-phase observations can be expressed as [30,31]:
where P and L denote pseudo range and carrier-phase observation in meters, respectively; i represents the epochs; superscript s denotes the satellite pseudo random noises (PRNs); subscripts r and j denote the rover receiver and frequency identifiers, respectively; for convenience, the frequency identifiers 1, 2, 3, 4, and 5 in the Galileo system represent E1, E5a, E5b, E5, and E6 signal frequencies, respectively; ρ represents the geometric distance between the satellite and the receiver; c represents the speed of light in a vacuum; dtr and dts denote the receiver and satellite clock offsets in meters, respectively; M denotes the wet mapping function; ZWD denotes the zenith troposphere wet delay (ZWD); I denotes the slant ionospheric delay; γ represents the frequency-dependent ionospheric delay amplification factors, defined as ; λ is the wavelength corresponding to frequency j; N is the carrier-phase integer ambiguity; d denotes the receiver uncalibrated code delay (UCD) in meters; b means uncalibrated phase delay (UPD) in cycles; and ζ and ξ represent the pseudo-orange and carrier-phase noises, respectively.
Generally, the Galileo precise satellite clock offset released from IGS is referred to as E1/E5a double-frequency (DF) IF combinations [32,33]. After using the IGS precise satellite orbit and clock offset products, as well as the satellite differential code bias (DCB) product [34], the linearized SF-UC PPP model can be expressed as:
with
where p and l are the pseudo-range and carrier-phase observed minus computed (OMC) values in meters, respectively; u denotes the unit vector of the component from the receiver to the satellites; x denotes the vector of the receiver position increments; the hat “¯” denotes the reparametrized estimate.
Equation (2) is rank-deficient (the rank defect is 1) due to the strong correlation between the receiver clock offset, the slant ionosphere delay, and ambiguity. Ning et al. [35] showed that the receiver clock offset can be constrained in the first epoch to eliminate the correlation between ambiguity, the slant ionosphere delay, and the receiver clock offset, which makes the equation full-rank. Then, the full-rank linearized SF-UC PPP for epochs 1 and i (i = 2, 3, …) can be written as follows [28]:
We find that the estimated receiver clock offsets, starting from the second epoch, involve the receiver clock which offsets the difference between the current epoch and the first epoch. The estimated slant ionosphere delay and ambiguity are biased by a constant receiver clock offset at the first epoch. When the receiver clock offset of the first epoch is accurately known, the model can be used for time transfer. In fact, the receiver clock offset in the first epoch is often not accurately obtained. The common practice is to determine it by standard single-point positioning, which gives the result of the time transfer of the SF-UC PPP model a systematic deviation from the true value, and the SF-UC PPP model is shown to be more suitable for frequency transfer. It should be noted that if the coordinates of static time and frequency transfer are accurately known, a priori constraint can be applied to the coordinates in Equation (4), and the parameters to be estimated in Equation (6) will not include coordinates xr.
2.2. SF-IWC PPP Time and Frequency Transfer Model
Adding external ionospheric delay constraints can also eliminate the rank deficiency problem in Equation (2). This research uses the global ionospheric map (GIM) model [36] with IGS ionospheric products to constrain SF-UC PPP. The linearized SF-IWC PPP model can be written as follows [37,38]:
where represents the slant ionospheric delay from the GIM model and represents the noise of the slant ionospheric delay. The GIM product published by the Centre for Orbit Determination in Europe (CODE) is used in this contribution; its accuracy is about 2–8 TECU, which is equivalent to 0.32–1.28 m in the Galileo E1 frequency [36]. The estimated parameter vector in the SF-IWC PPP model is:
Considering the accuracy limitation of the GIM products, the virtual ionospheric observation is given a large weight at the beginning of PPP convergence; its weight is gradually reduced with an increase in the PPP convergence time. The slant ionospheric noise variance in the progressive relaxation constraint formula is [16]:
where the α represents the change rate of variance; ΔT represents the sampling interval of observations in minutes; and and α are generally set as 0.09 m2 and 0.04 m2/min, respectively [16].
2.3. SF-IFH PPP Time and Frequency Transfer Model
Since the sign of ionospheric delay in the pseudo-range is the opposite to that in the carrier-phase observations, the influence of first-order ionospheric delay can be eliminated according to this characteristic. SF-IFH PPP, by forming the code-phase combination on the identical frequency, is initially known as the group and phase ionospheric correction (GRAPHIC). The linearized SF-IFH PPP model can be expressed as [14]:
with
where h is the code and phase IFH combination OMC value.
Similarly, the receiver clock offset and ambiguity cannot be estimated individually, which presents a rank deficiency of size one between them. Hence, the tight constraints of the receiver clock offset at the first epoch are also used in the SF-IFH PPP model, which is as follows [21]:
with
The estimated parameter vector in the SF-IFH PPP model is:
Considering that the carrier-phase noise is much smaller than the pseudo-range, the noise of the SF-IFH PPP model is about half of the pseudo-range noise. The SF-IFH PPP model has much higher noise than the SF-UC and SF-IWC PPP models, which will affect the performance of time and frequency transfer using this model.
2.4. Galileo SF Time and Frequency Transfer Process
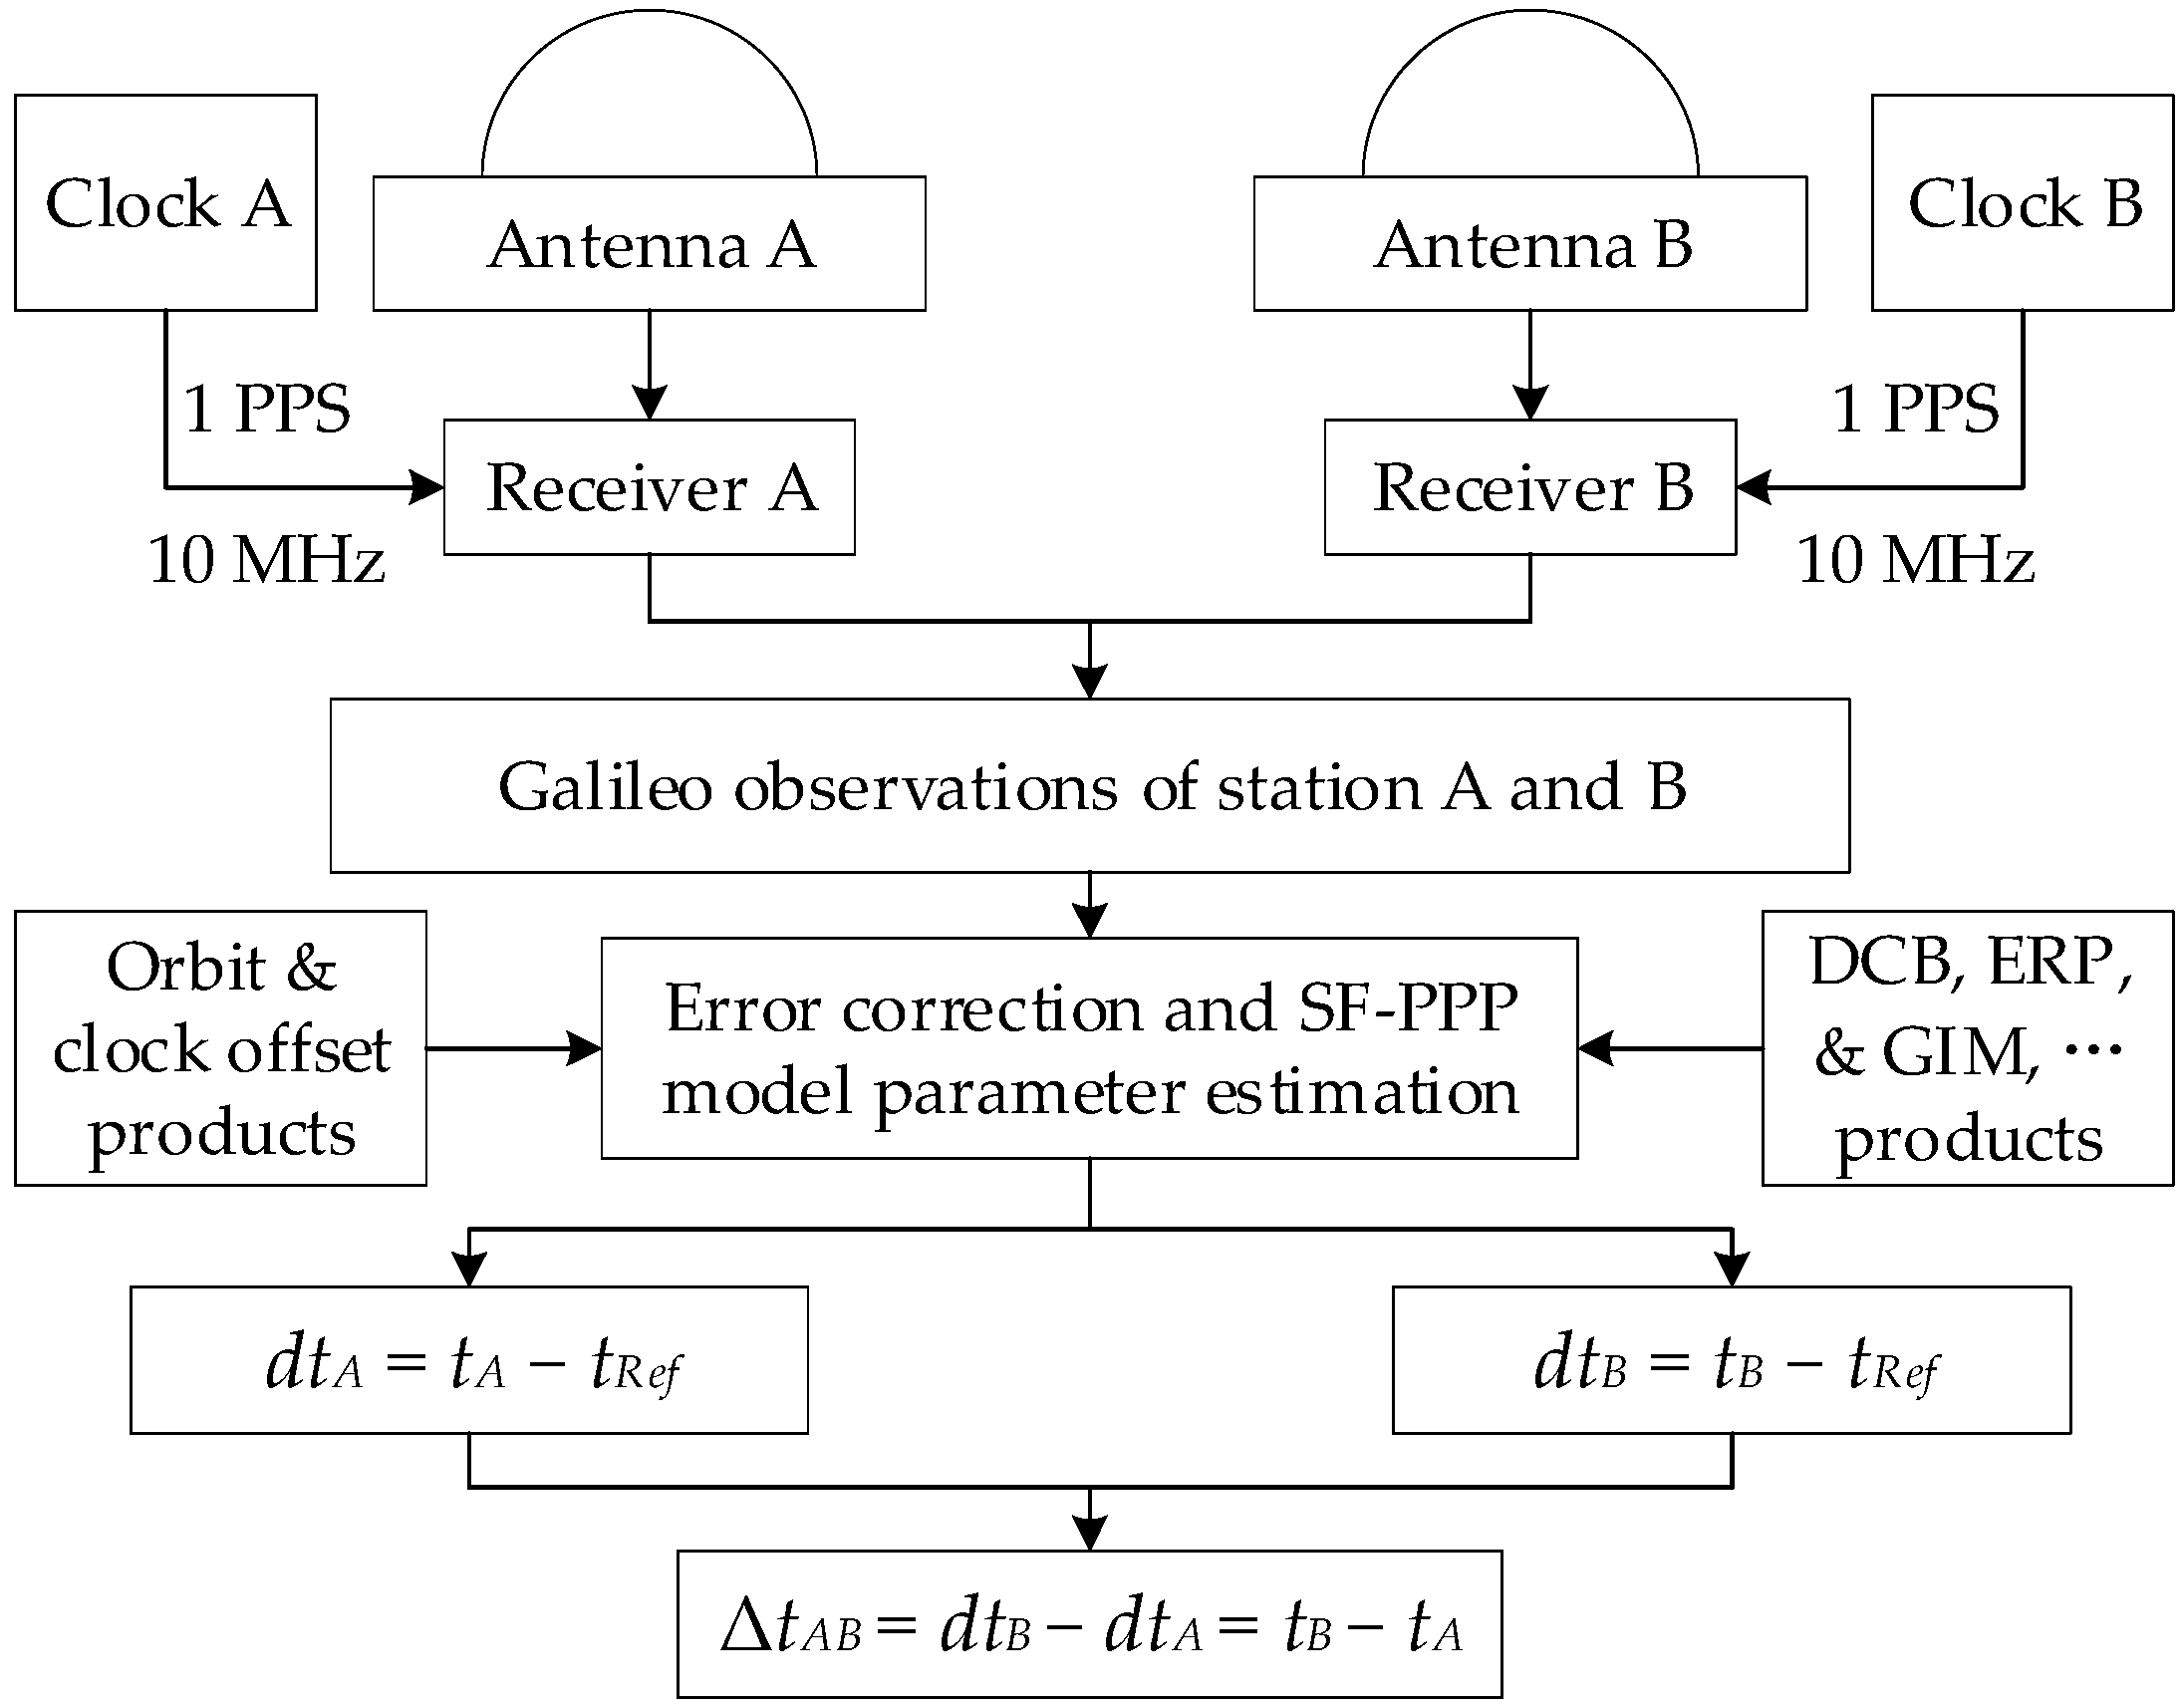
A flow chart of SF PPP time and frequency transfer is exhibited in Figure 1. Station A and B are both connected to the local atomic clock, the local clock inputs 1 PPS, and 10 MHz signals are linked to the GNSS receivers. In this case, GNSS observations contain the time information of clocks A and B. Based on the Galileo multi-frequency pseudo-range and carrier-phase observations collected by the GNSS receiver, the related errors can be accurately corrected by using precision satellite orbit, precision satellite clock offset, satellite DCB, earth rotation parameters (ERPs), GIM, and other products. At this time, according to the SF-PPP algorithm, the receiver clock offset of A and B can be obtained as:
where dtA and dtB are the receiver clock offsets of A and B, respectively; tA and tB are local times recorded by clocks A and B, respectively; and tRef is the reference for the precise satellite clock products from IGS.
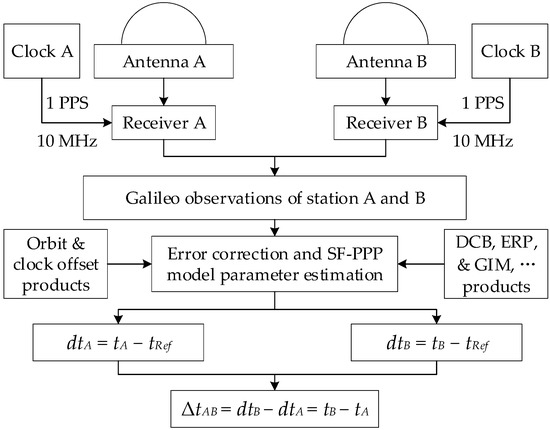
Figure 1.
Galileo single-frequency (SF) precise point positioning (PPP) time and frequency transfer flow chart.
The time difference ΔtAB between stations A and B can be written as:
3. Results
In this section, we first introduce the data sources used in the experiment and the data-processing strategy. Then, we evaluate the number of valid satellites; the time dilution of precision (TDOP); and the multipath combination (MPC) noise [39,40] of BRUX, CEBR, HERS, ONSA, and SPT0. Next, the SF-UC, SF-IFH, and SF-IWC PPP solutions are compared with the Galileo E1 signal. Then, the time and frequency transfer performances of SF-UC, SF-IFH, and SF-IWC PPP are evaluated with Galileo multi-frequency signals (E5a, E5b, E5, and E6). Finally, we select CNES SSRC00CNE0 RTS precision products for precise timing experiments.
3.1. Date Selection and Processing Strategies
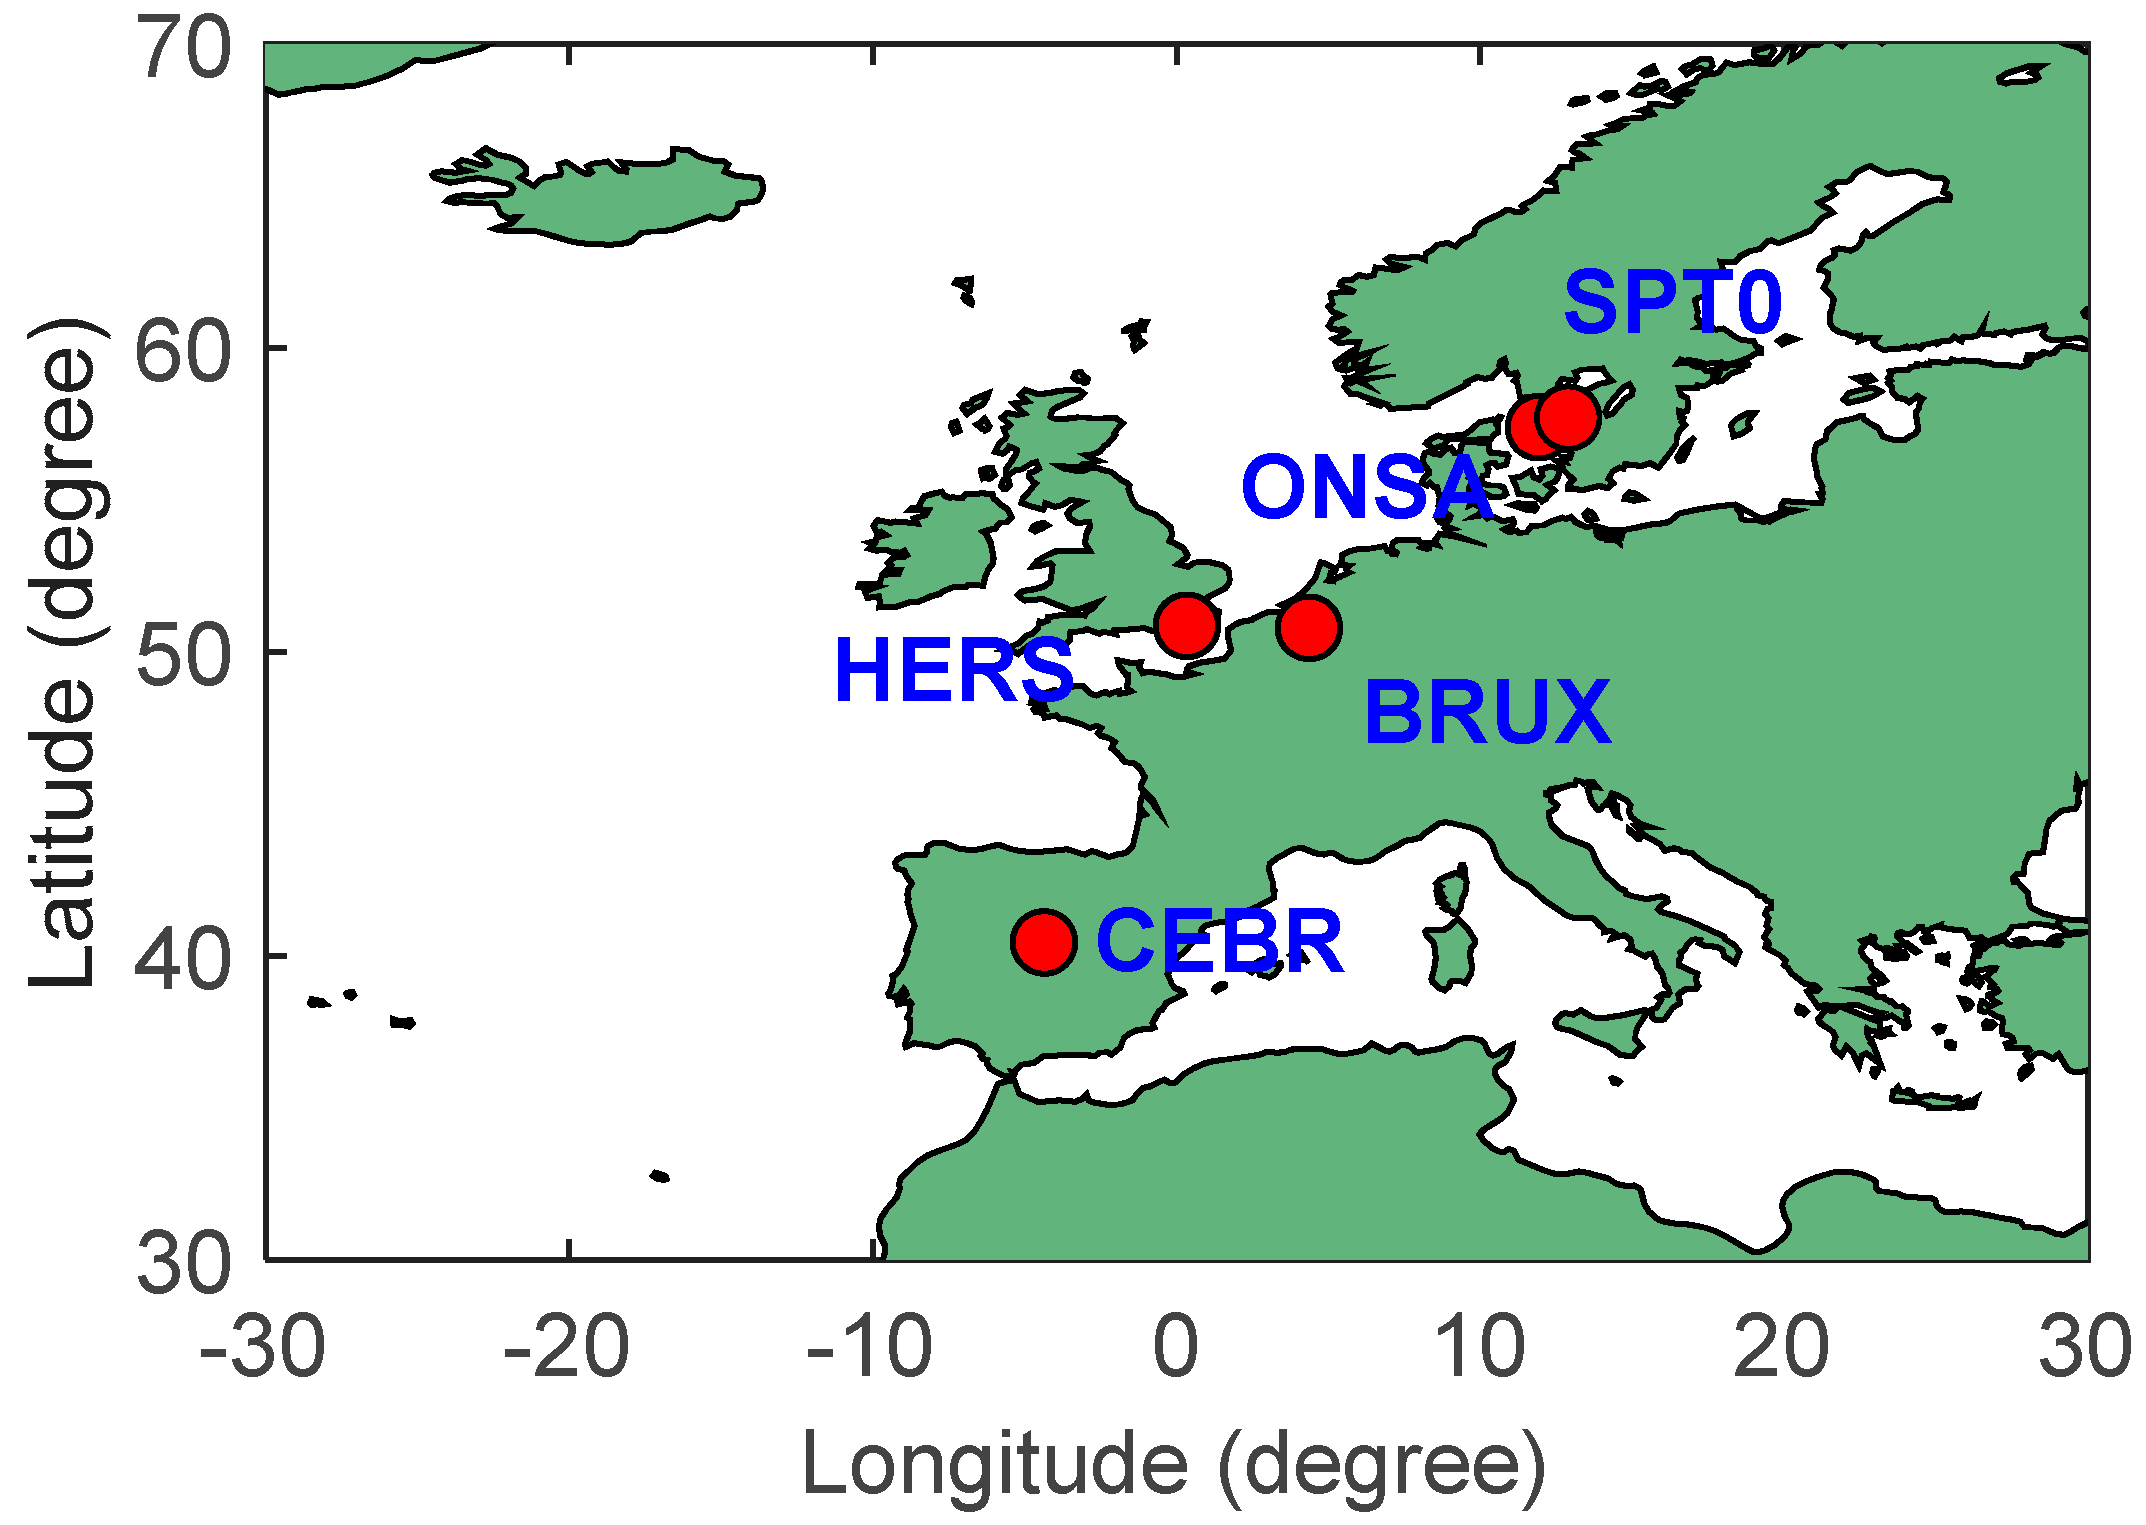
The BRUX, CEBR, HERS, ONSA, and SPT0 five stations in the multi-GNSS experiment (MGEX) network are selected from the days of the year (DOYs) 38 to 45 in 2022. The selected five stations all support Galileo E1, E5a, E5b, E5, and E6 signals, and the sample interval of observations is 30 s. The selected five stations are all equipped with high-precision hydrogen atomic clocks, among which BRUX and SPT0 are the stations of Observatoire Royal de Belgique (ORB) and the punctual laboratory of Research Institutes of Sweden AB (RISE). With BRUX as the center, BRUX-CEBR, BRUX-HERS, BRUX-ONSA, and BRUX-SPT0 links are established. The distribution of the selected stations is shown in Figure 2, and the basic information of the stations is shown in Table 1.
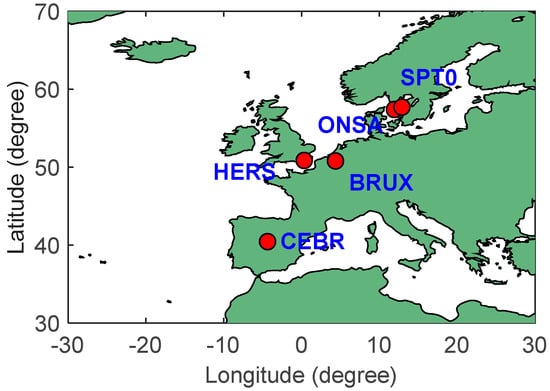
Figure 2.
Geographical distribution of the stations.

Table 1.
List of experimental station information.
The CNES GRG (Groupe De Recherche De Geodesie) final and SSRC00CNE0 RTS precise satellite products are used in this research. Among them, the GIM product provided by CODE is used in PT SF data processing, and the global ionospheric vertical total electron content (VTEC) product [41,42,43] provided by CNES is used in RT SF data processing. The dry tropospheric delay is corrected by the Saastamoinen model based on global pressure and temperature (GPT). The wet tropospheric delay is estimated as a random walk process. To simplify the data-processing process, we carry out equal-weight processing for Galileo E1, E5a, E5b, E5, and E6 observations. The code and phase observation noises are set to 0.3 m and 3.0 mm, respectively, and elevation-dependent weighting for the observations is applied. The antenna file generated by IGS is used for correct phase center offset (PCO) and phase center variation (PCV). For E5a, E5b, E5, and E6 observations, the receiver’s PCO and PCV corrections for the GPS L2 frequency are used [14]. Considering that the coordinates during the time and frequency transfer are generally known, and to ignore the influence of coordinate parameter estimation on SF time and frequency transfer, we use the coordinate information provided by the IGS SNX weekly solution file to restrict the coordinate parameters. Table 2 illustrates the processing strategies for SF PPP time and frequency transfer.

Table 2.
Details of processing strategies.
3.2. Multi-Frequency Observations Quality Analysis
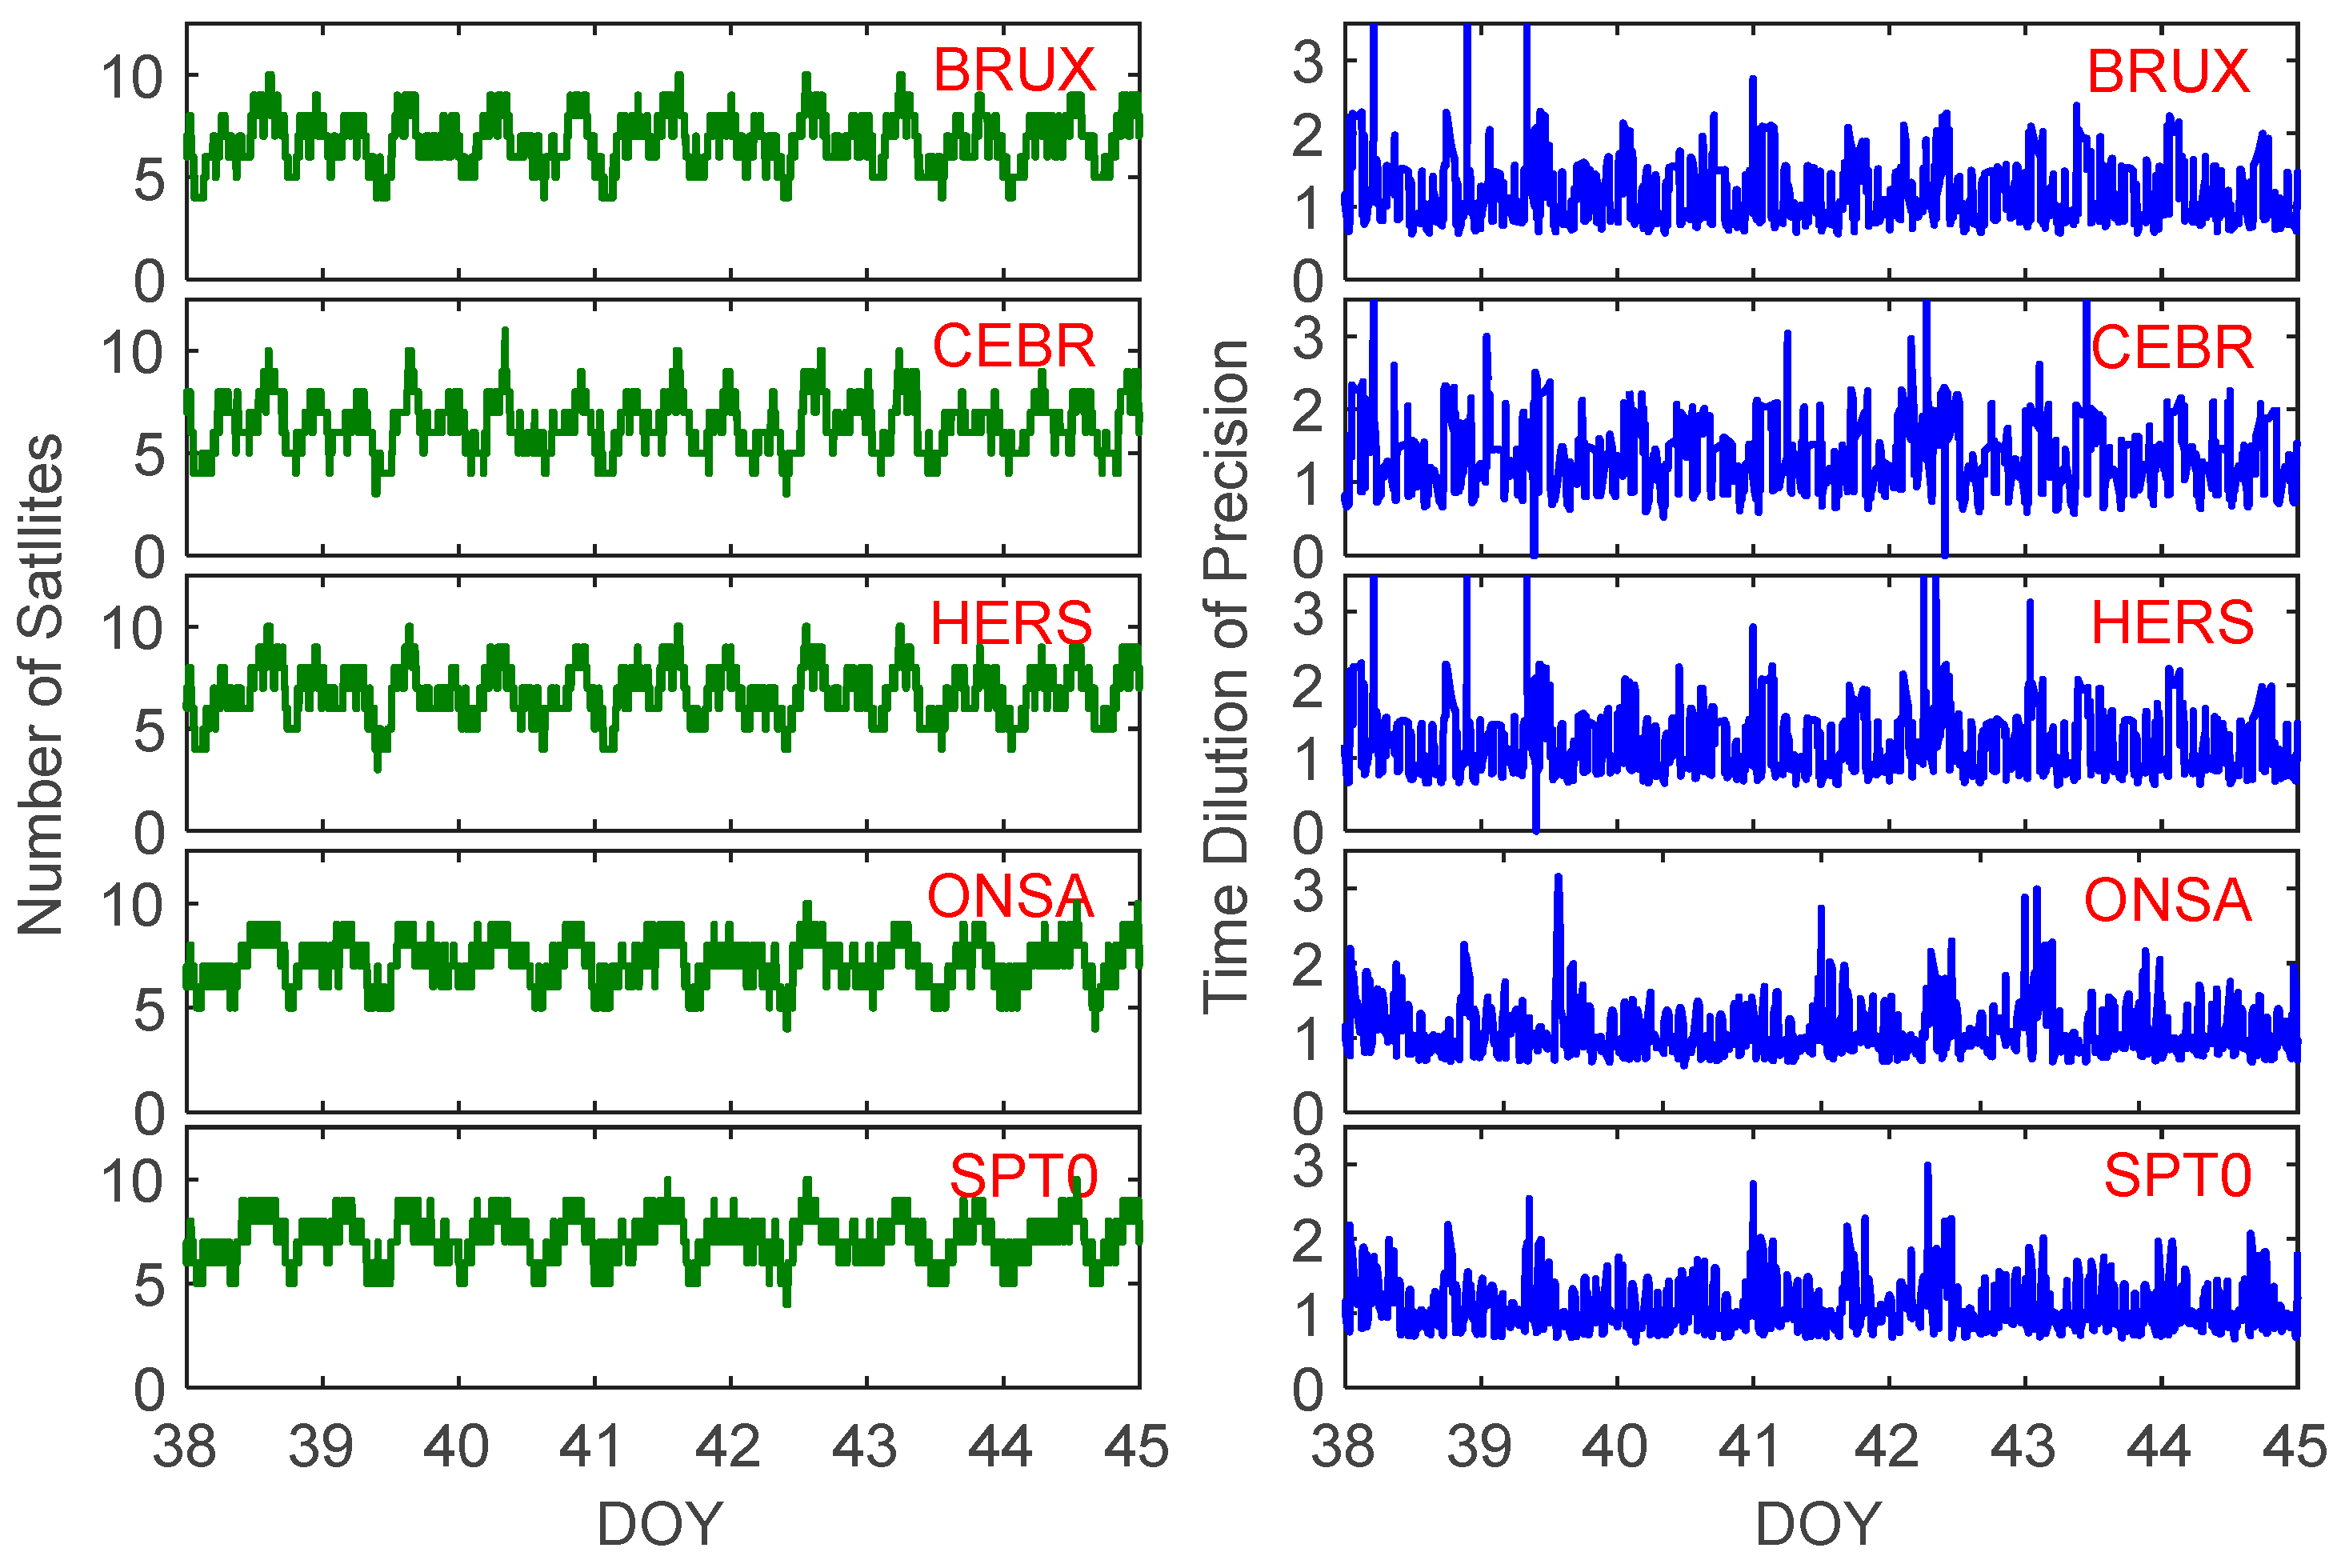
As shown in Figure 3, the number of satellites in the selected stations is concentrated between 4 and 10, and the TDOP values are concentrated between 1.0 and 2.0. There are some noise points in TDOP values of all stations, especially in BRUX and CEBR. We noted that the number of satellites in CEBR and HERS is sometimes only three, resulting in the zero-value phenomenon of TDOP. The mean values of satellites at BRUX, CEBR, HERS, ONAS, and SPT0 are 6.8, 6.3, 6.8, 7.2, and 7.1, respectively, and the corresponding mean values of TDOP are 2.2, 2.5, 2.3, 2.1, and 2.2, respectively. Overall, the data quality of ONSA is the best, while the data quality of CEBR is slightly worse than the other four stations.
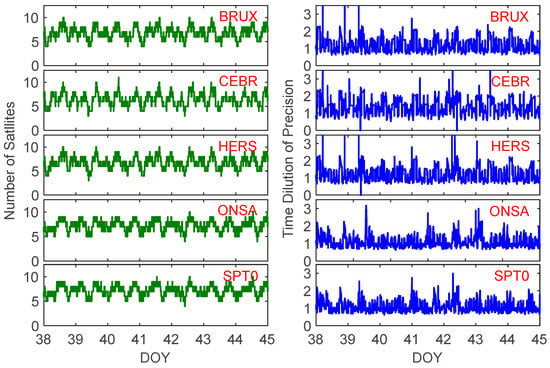
Figure 3.
The number of satellites (NSats) (left) and the time dilution of precision (TDOP) (right) at BRUX, CEBR, HERS, ONSA, and SPT0 stations on days of the year (DOYs) 38 to 45 in 2022.
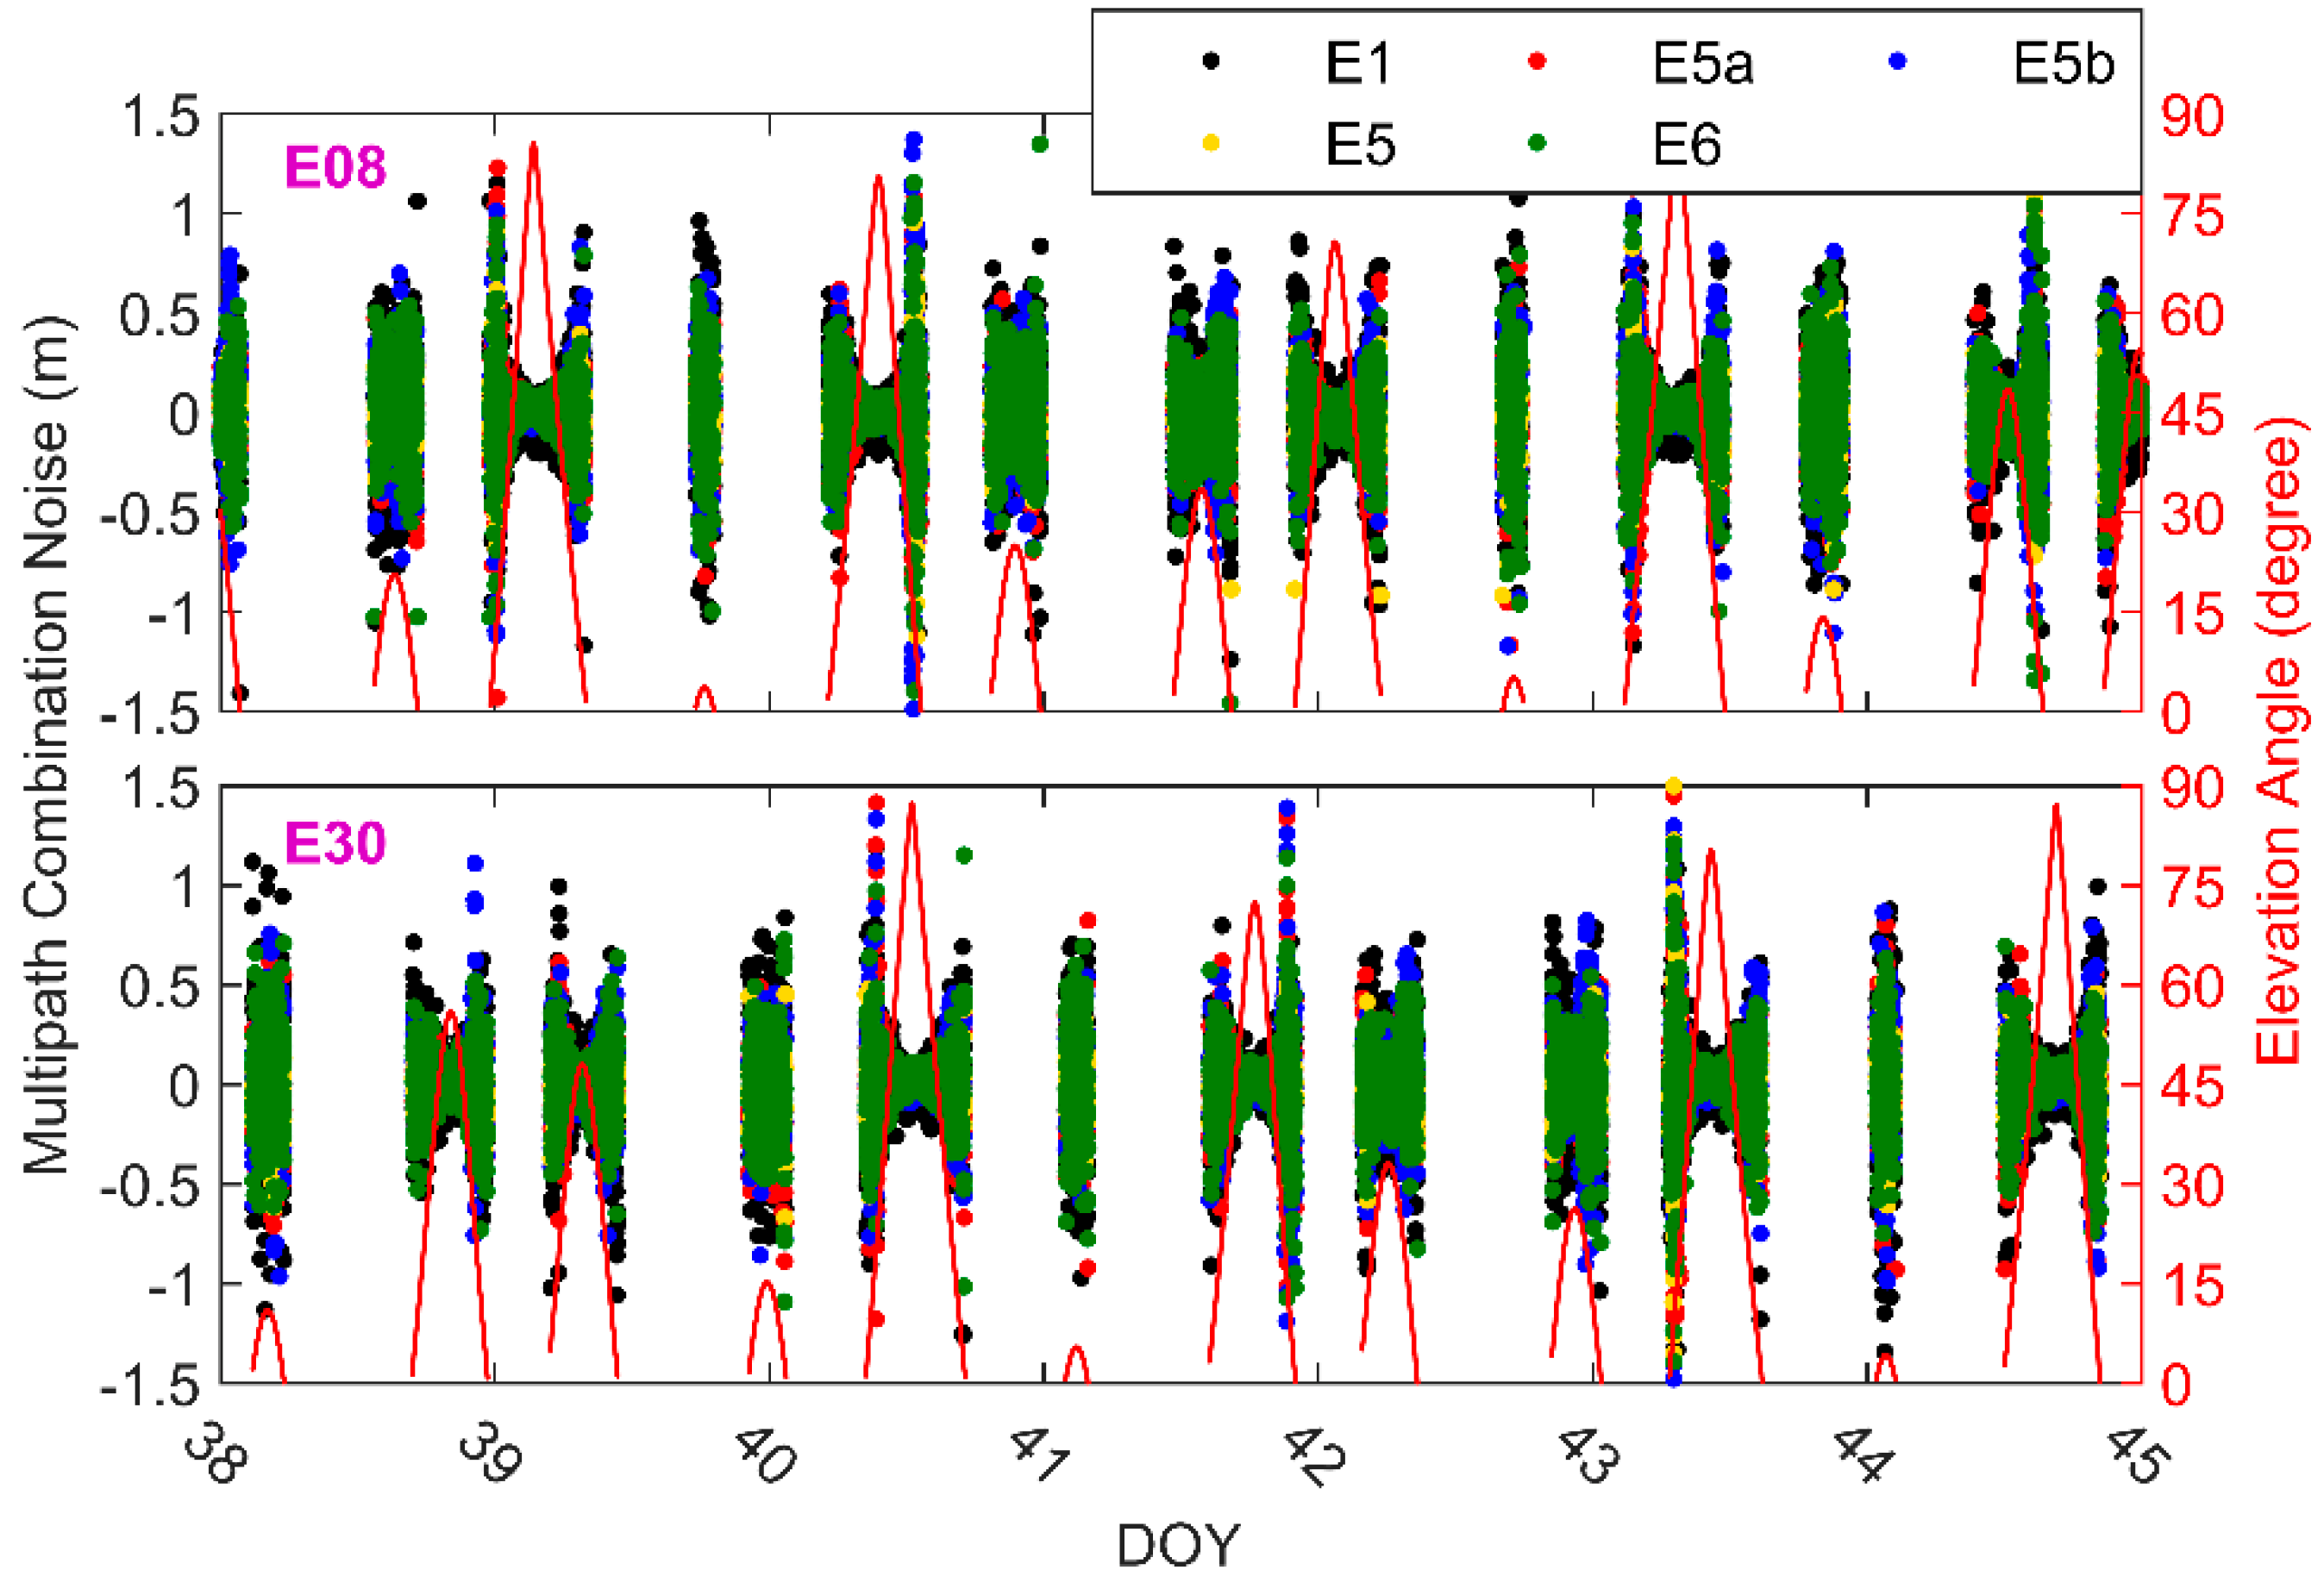
The quality of pseudo-range observations is crucial for estimating receiver clock offsets. To analyze SF PPP time and frequency transfer performance with multi-frequency signals, the MPC noise of E1, E5a, E5b, E5 and E6 observations on DOYs 38 to 45 in 2022 are studied.
As shown in Figure 4, the MPC noises of each frequency are all within ±2.0 m, and the MPC noises correlate with elevation. E1 and E5b have many noise points, especially at low elevation angles, which may affect the performance of time and frequency transfer using those signals. The RMS values of E1, E5a, E5b, E5, and E6 MPC noises in BRUX are 0.231 m, 0.174 m, 0.194 m, 0.116 m, and 0.188 m respectively; the corresponding RMS values in CEBR are 0.314 m, 0.296 m, 0.312 m, 0.139 m, and 0.346 m, respectively; the corresponding RMS values in HERS are 0.252 m, 0.181 m, 0.208 m, 0.132 m, and 0.208 m, respectively; the corresponding RMS values in ONSA are 0.222 m, 0.185 m, 0.196 m, 0.126 m, and 0.184 m, respectively; and the corresponding RMS values in SPT0 are 0.253 m, 0.174 m, 0.192 m, 0.121 m, and 0.206 m, respectively. By comparison, the MPC noise of each frequency is relatively close, while the E5 single has a smaller noise, and the E1 single has the maximum noise.
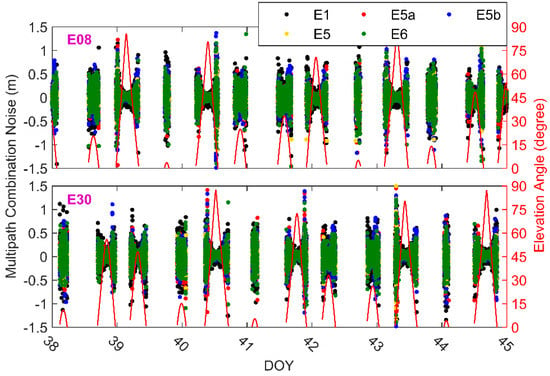
Figure 4.
E1, E5a, E5b, E5, and E6 multipath combination (MPC) noises at BRUX.
3.3. Time and Frequency Transfer with Different SF PPP Models and Traditional E1 Signal
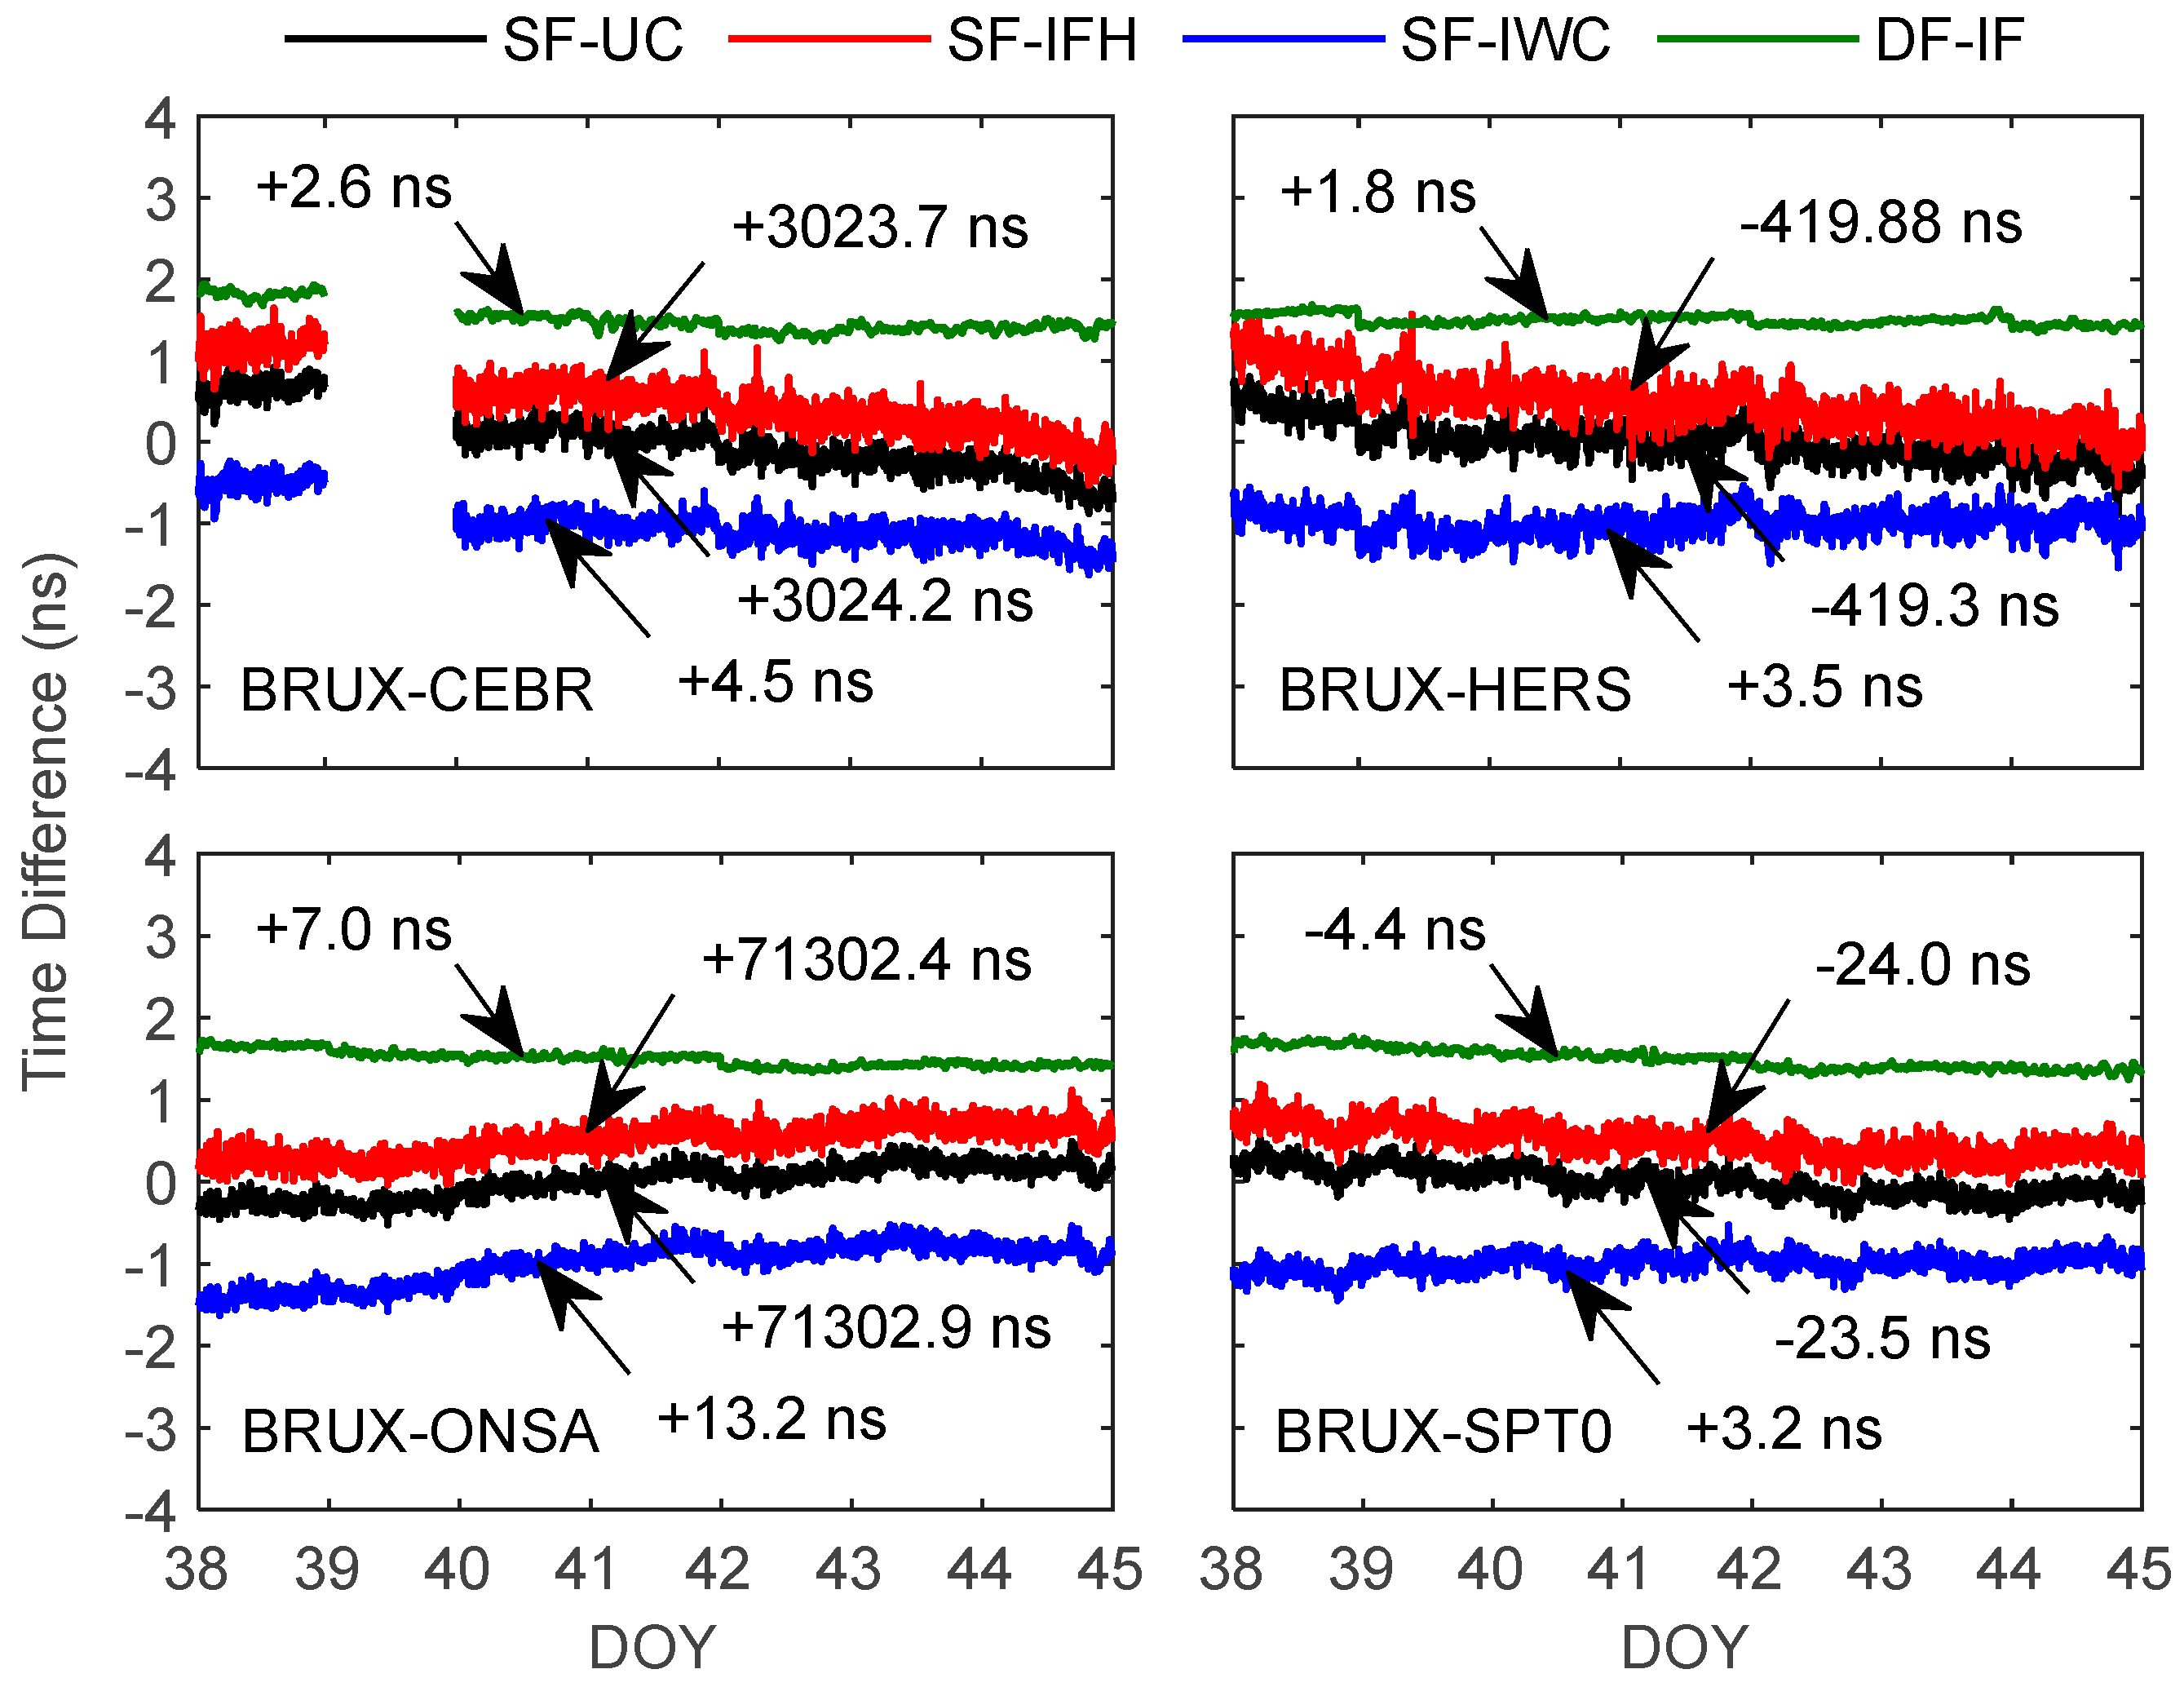
To display the results of each model in the same figure, we shift the time difference in each model and display the translated value in the figure by arrows. In this subsection, we use the traditional E1 signal for SF PPP time and frequency transfer and provide the results of the DF-IF PPP model with the E1 and E5a signals. As shown in Figure 5, the variation trend of clock offsets of SF-UC, SF-IFH and SF-IWC are basically the same. Due to the receiver clock offset of SF-UC, the SF-IFH and SF-IWC models will absorb different parameters, resulting in a specific system bias between the SF-UC, SF-IFH, and SF-IWC models. It should be noted that the clock offset’s interruption of BRUX-CEBR at DOY 39 is caused by the fact that IGS does not provide the receiver clock offset of CEBR on that day. Compared with DF-IF PPP results, the clock offsets of SF PPP significantly fluctuate, which indicates that the receiver clock offsets solved by SF PPP models have absorbed some ionospheric or pseudo-range residual. The noise of SF-IFH is much bigger than that of SF-UC and SF-IWC, resulting in the noise of SF-IFH clock offsets being bigger than that of SF-UC and SF-IWC. We note that the clock offsets of the DF-IF have particular jumps at the daily boundary (for instance, BRUX-CEBR’s DOY 39), which is caused by the IGS satellite precision orbit and clock offset product. Our strategy of passing ambiguity parameter information at the day boundary to keep the time and frequency transfer results continuous also caused daily jumps in the calculated results from the IGS final products.
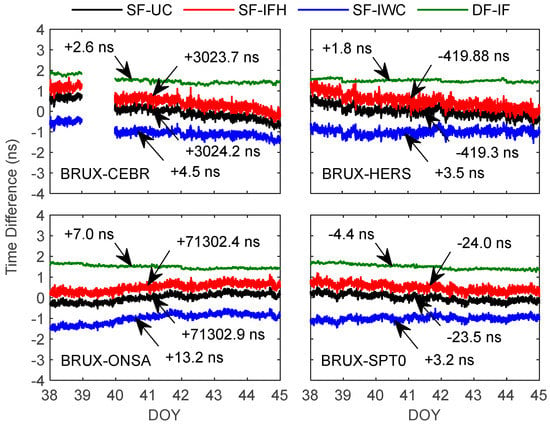
Figure 5.
Time and frequency transfer results of the SF un-combined (UC) model, the ionospheric-free-half (IFH) model, the ionospheric-weighting constraint (IWC) model, and the double-frequency (DF) ionospheric-free (IF) PPP solution model with respect to International GNSS Service (IGS) final products.
Taking the IGS final receiver clock offsets as the reference, we calculate the standard deviation (STD) of the time and frequency transfer result and use STD as the evaluation index of class A uncertainty [50,51]. To eliminate the influence of the day boundary effect, we calculate the STD of each day successively and then calculate the mean value of the STD of the whole experimental period.
As shown in Table 3, the STD of DF-IF is the smallest, while that of the SF-IFH is the largest, and SF-UC and SF-IWC are relatively close. Compared with SF-UC, SF-IFH, and SF-IWC, the STDs of DF-IF are reduced by 71.6%, 48.8%, and 55.4% on average, respectively, which shows the apparent advantage of dual frequency compared with single frequency. The mean STDs of SF-UC, SF-IFH, SF-IWC, and DF-IF are 111.8 ps, 142.6 ps, 110.4 ps, and 31.0 ps, respectively, and the mean STDs of BRUX-CEBR, BRUX-HRES, BRUX-ONSA and BRUX-SPT0 are 117.9 ps, 120.0 ps, 79.2 ps, and 88.9 ps, respectively. The STD of BRUX-ONSA is the smallest, and that of BRUX-HERS is the largest, which is related to the best data quality of ONSA and the poor data quality of HERS. Compared with SF-IFH, the maximum, minimum, and average STDs of SF-UC are decreased by 24.9%, 19.5%, and 21.7%, respectively, and those of SF-IWC are decreased by 24.7%, 21.0%, and 22.6%, respectively.

Table 3.
Standard deviation (STD) values of the SF-UC, SF-IFH, SF-IWC, and SF-IF PPP solutions in contrast with the International GNSS Service (IGS) final receiver clock products (ps), and the DF-IF PPP solution STD reduced rates (%) compared to the SF-UC, SF-IFH, and SF-IWC SF PPP solutions.
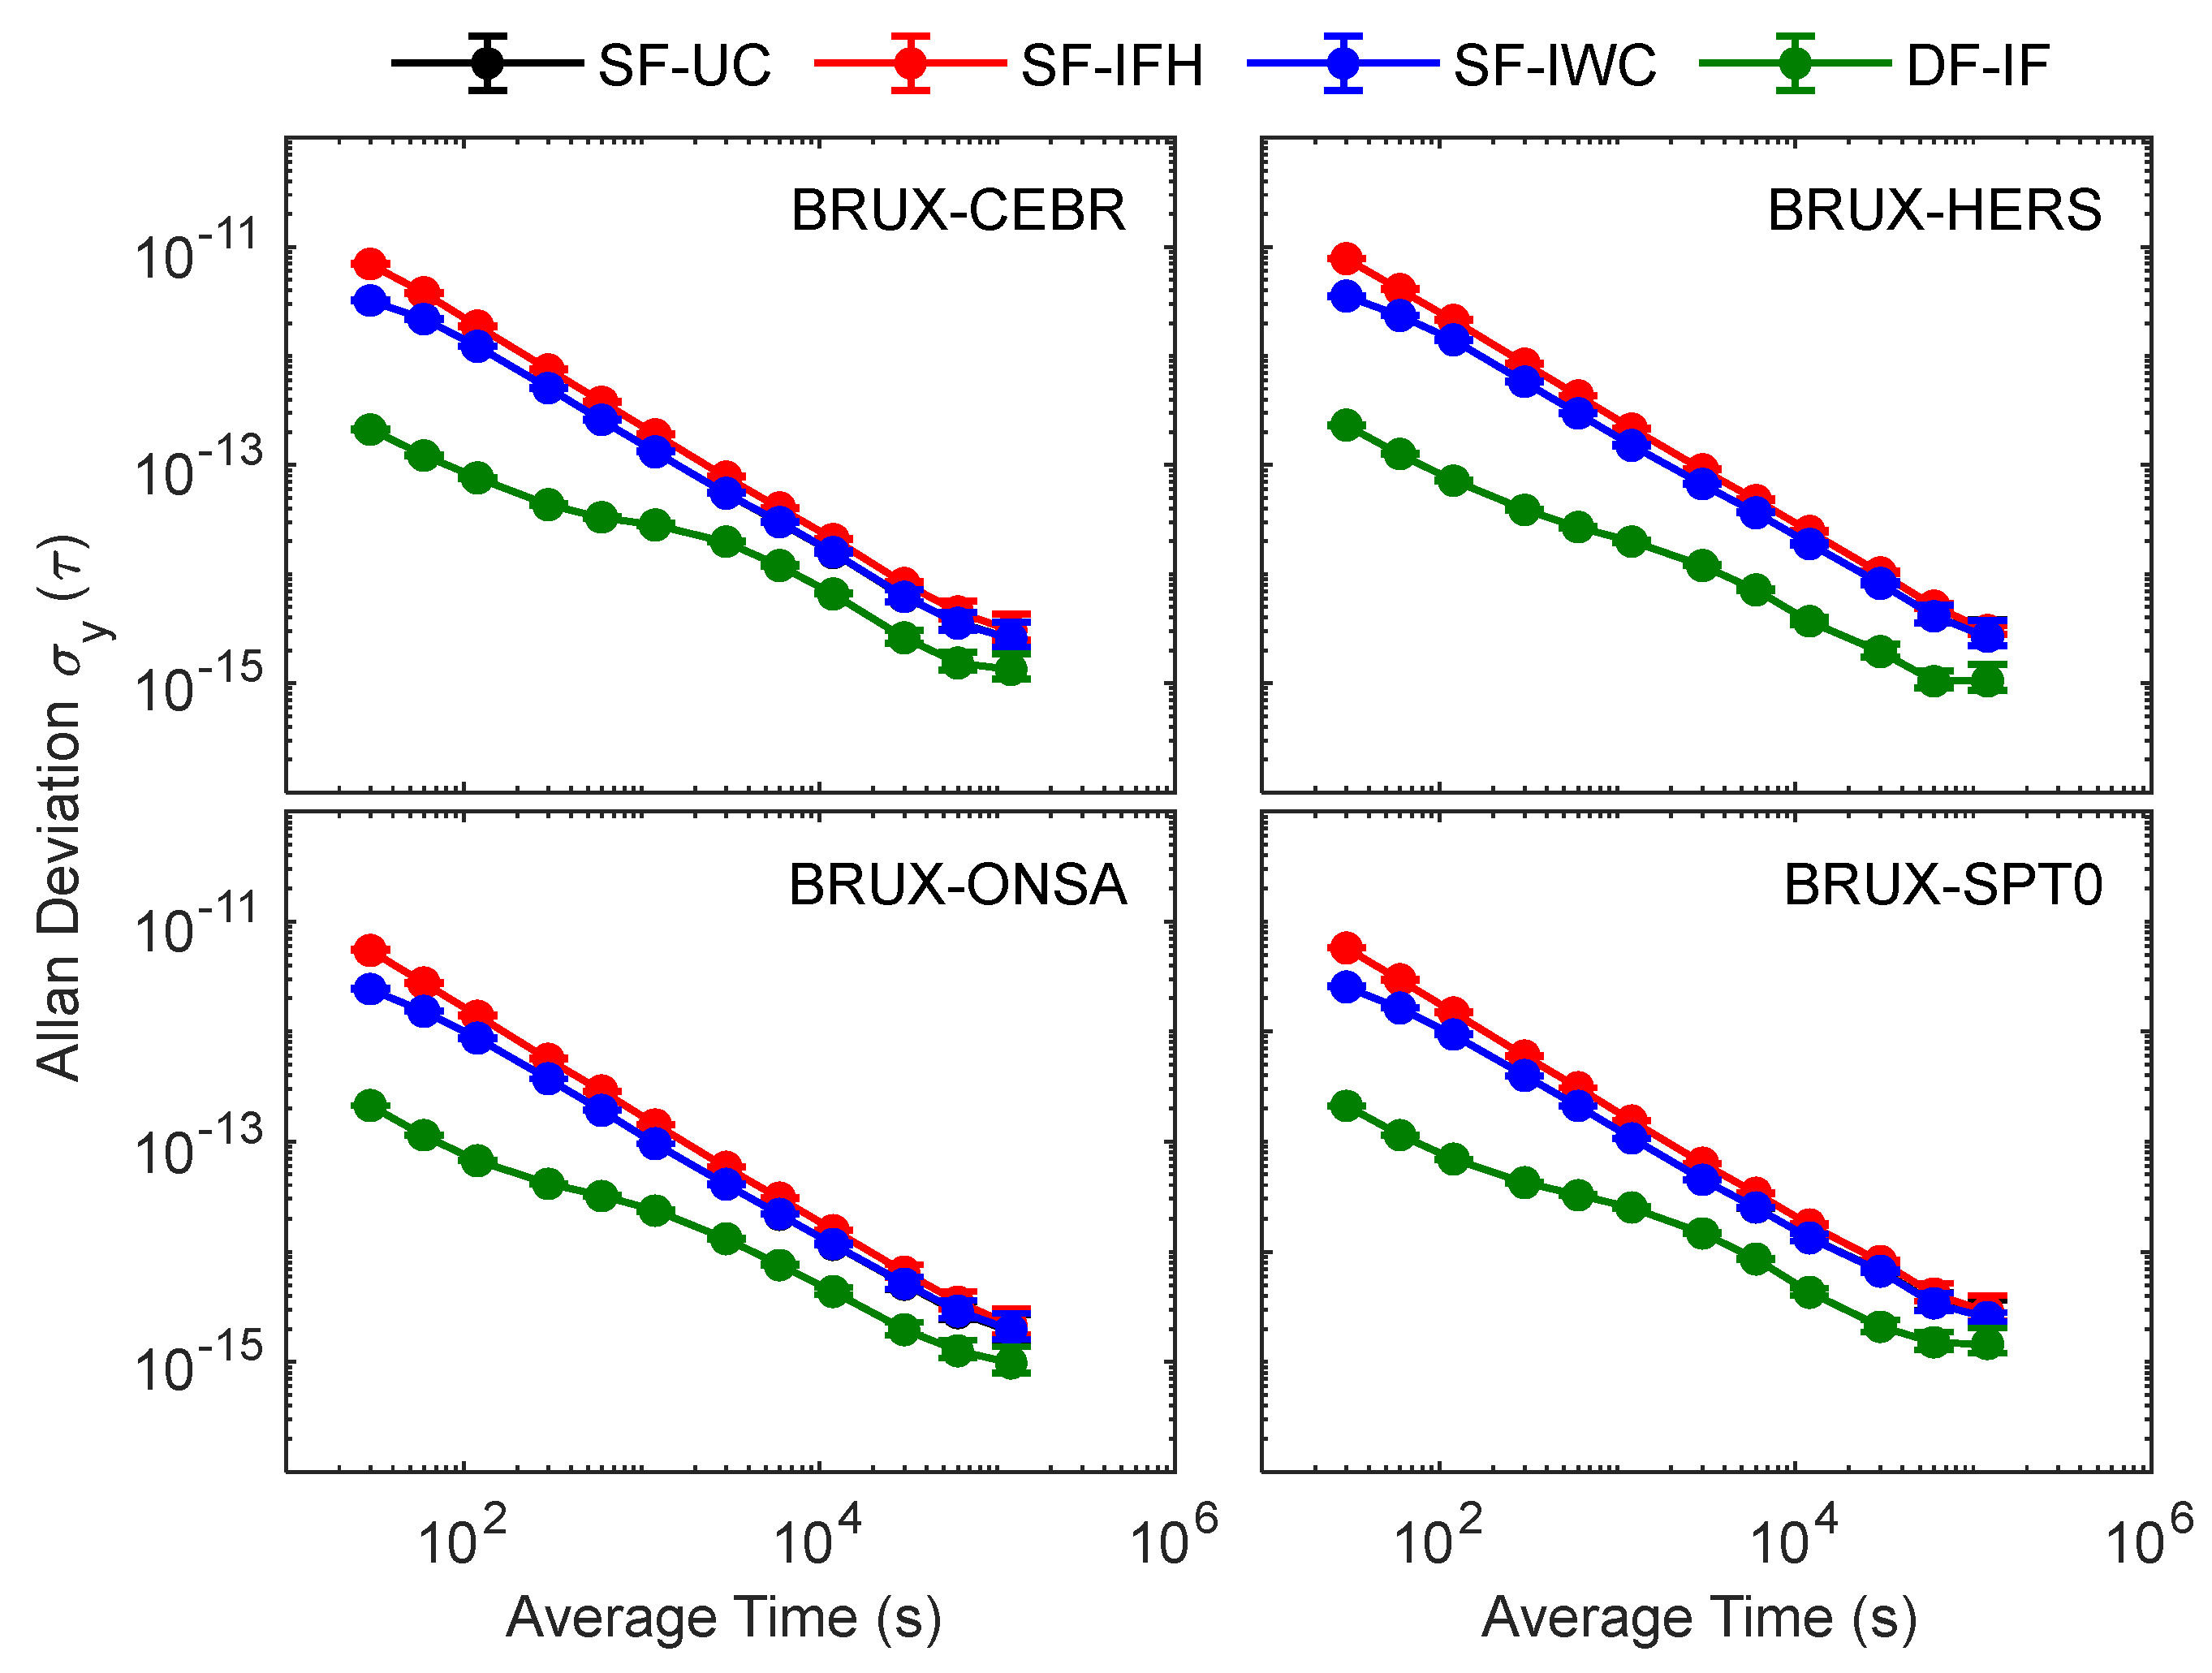
The Allan deviation (ADEV) [52,53] is used as the stability index of time and frequency transfer, and the ADEV of the time and frequency transfer is obtained using Stable32 software [54] (www.stable32.com/ (accessed on 23 October 2022)). Figure 6 illustrates the time and frequency transfer frequency stability of the SF-UC, SF-IFH, SF-IWC, and DF-IF models at the four links. The DF-IF model is superior to the three SF models in short-term frequency stability and long-term frequency stability, indicating that dual frequency has apparent advantages over single frequency in time and frequency transfer. The frequency stability of SF-UC and SF-IWC is basically the same. We gradually relax the constraints on ionospheric parameters in SF-IWC, and the SF-IWC model is still dominated by ionospheric parameter estimation, resulting in no significant influence on the frequency stability of SF-UC and SF-IWC. The frequency stability of SF-IFH is significantly worse than that of SF-UC and SF-IWC, and the difference between SF-IFH and SF-UC or SF-IWC is the greatest in short-term stability. However, with an increase in the average time, the difference in stability of SF-IFH and SF-UC or SF-IWC gradually decreases. The frequency stability of SF-IFH, SF-UC, and SF-IWC is basically the same in 120,000 s. To quantitatively evaluate the time and frequency transfer performance of SF-UC, SF-IFH, SF-IWC, and DF-IF, Table 4 provides statistics on the four links’ average frequency stability.
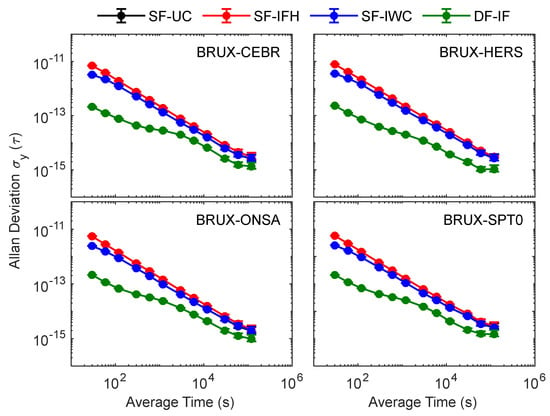
Figure 6.
Frequency stabilities at four links for SF-UC, SF-IFH, SF-IWC, and DF-IF PPP solutions.

Table 4.
The mean values of frequency stability (×10−14) at four links for SF-UC, SF-IFH, SF-IWC, and DF-IF PPP solutions.
As shown in Table 4, the frequency stability of SF-UC, SF-IFH, and SF-IWC is worse than that of DF-IF, among which IF-IFH has the worst frequency stability, and SF-UC and SF-IWC have the same frequency stability. The short-term frequency stability of SF-IFH is significantly worse than that of SF-UC and SF-IWC, due to the most significant noise. However, the receiver clock offset and ambiguity gradually separate as the time increases. The difference in frequency stability between SF-IFH, SF-UC, and SF-IWC is steadily reduced. Among them, the difference in frequency stability between SF-IFH, SF-UC, and SF-IWC at 120,000 s is only 4 × 10⁻¹⁶. By comparison, it can be found that the stability difference between SF and DF-IF models gradually decreases with an increase in the average time, and the frequency stability differences between SF-UC, SF-IFH, SF-IWC, and DF-IF at 120,000 s are 1.2 × 10⁻¹⁵, 1.6 × 10⁻¹⁵, and 1.2 × 10⁻¹⁵, respectively. It can be predicted that with a continuous increase in the average time, the frequency stability difference between SF and DF-IF PPP will be further reduced, which means that SF PPP has the potential to achieve the same frequency stability as DF-IF PPP. Considering the lower cost of the SF GNSS receiver and the possible data loss during actual observation, SF observation can also meet the needs of long-time time and frequency transfer. The use of SF-UC and SF-IWC models is recommended for SF PPP time and frequency transfer.
3.4. SF PPP Time and Frequency Transfer with Multi-Frequency Signals
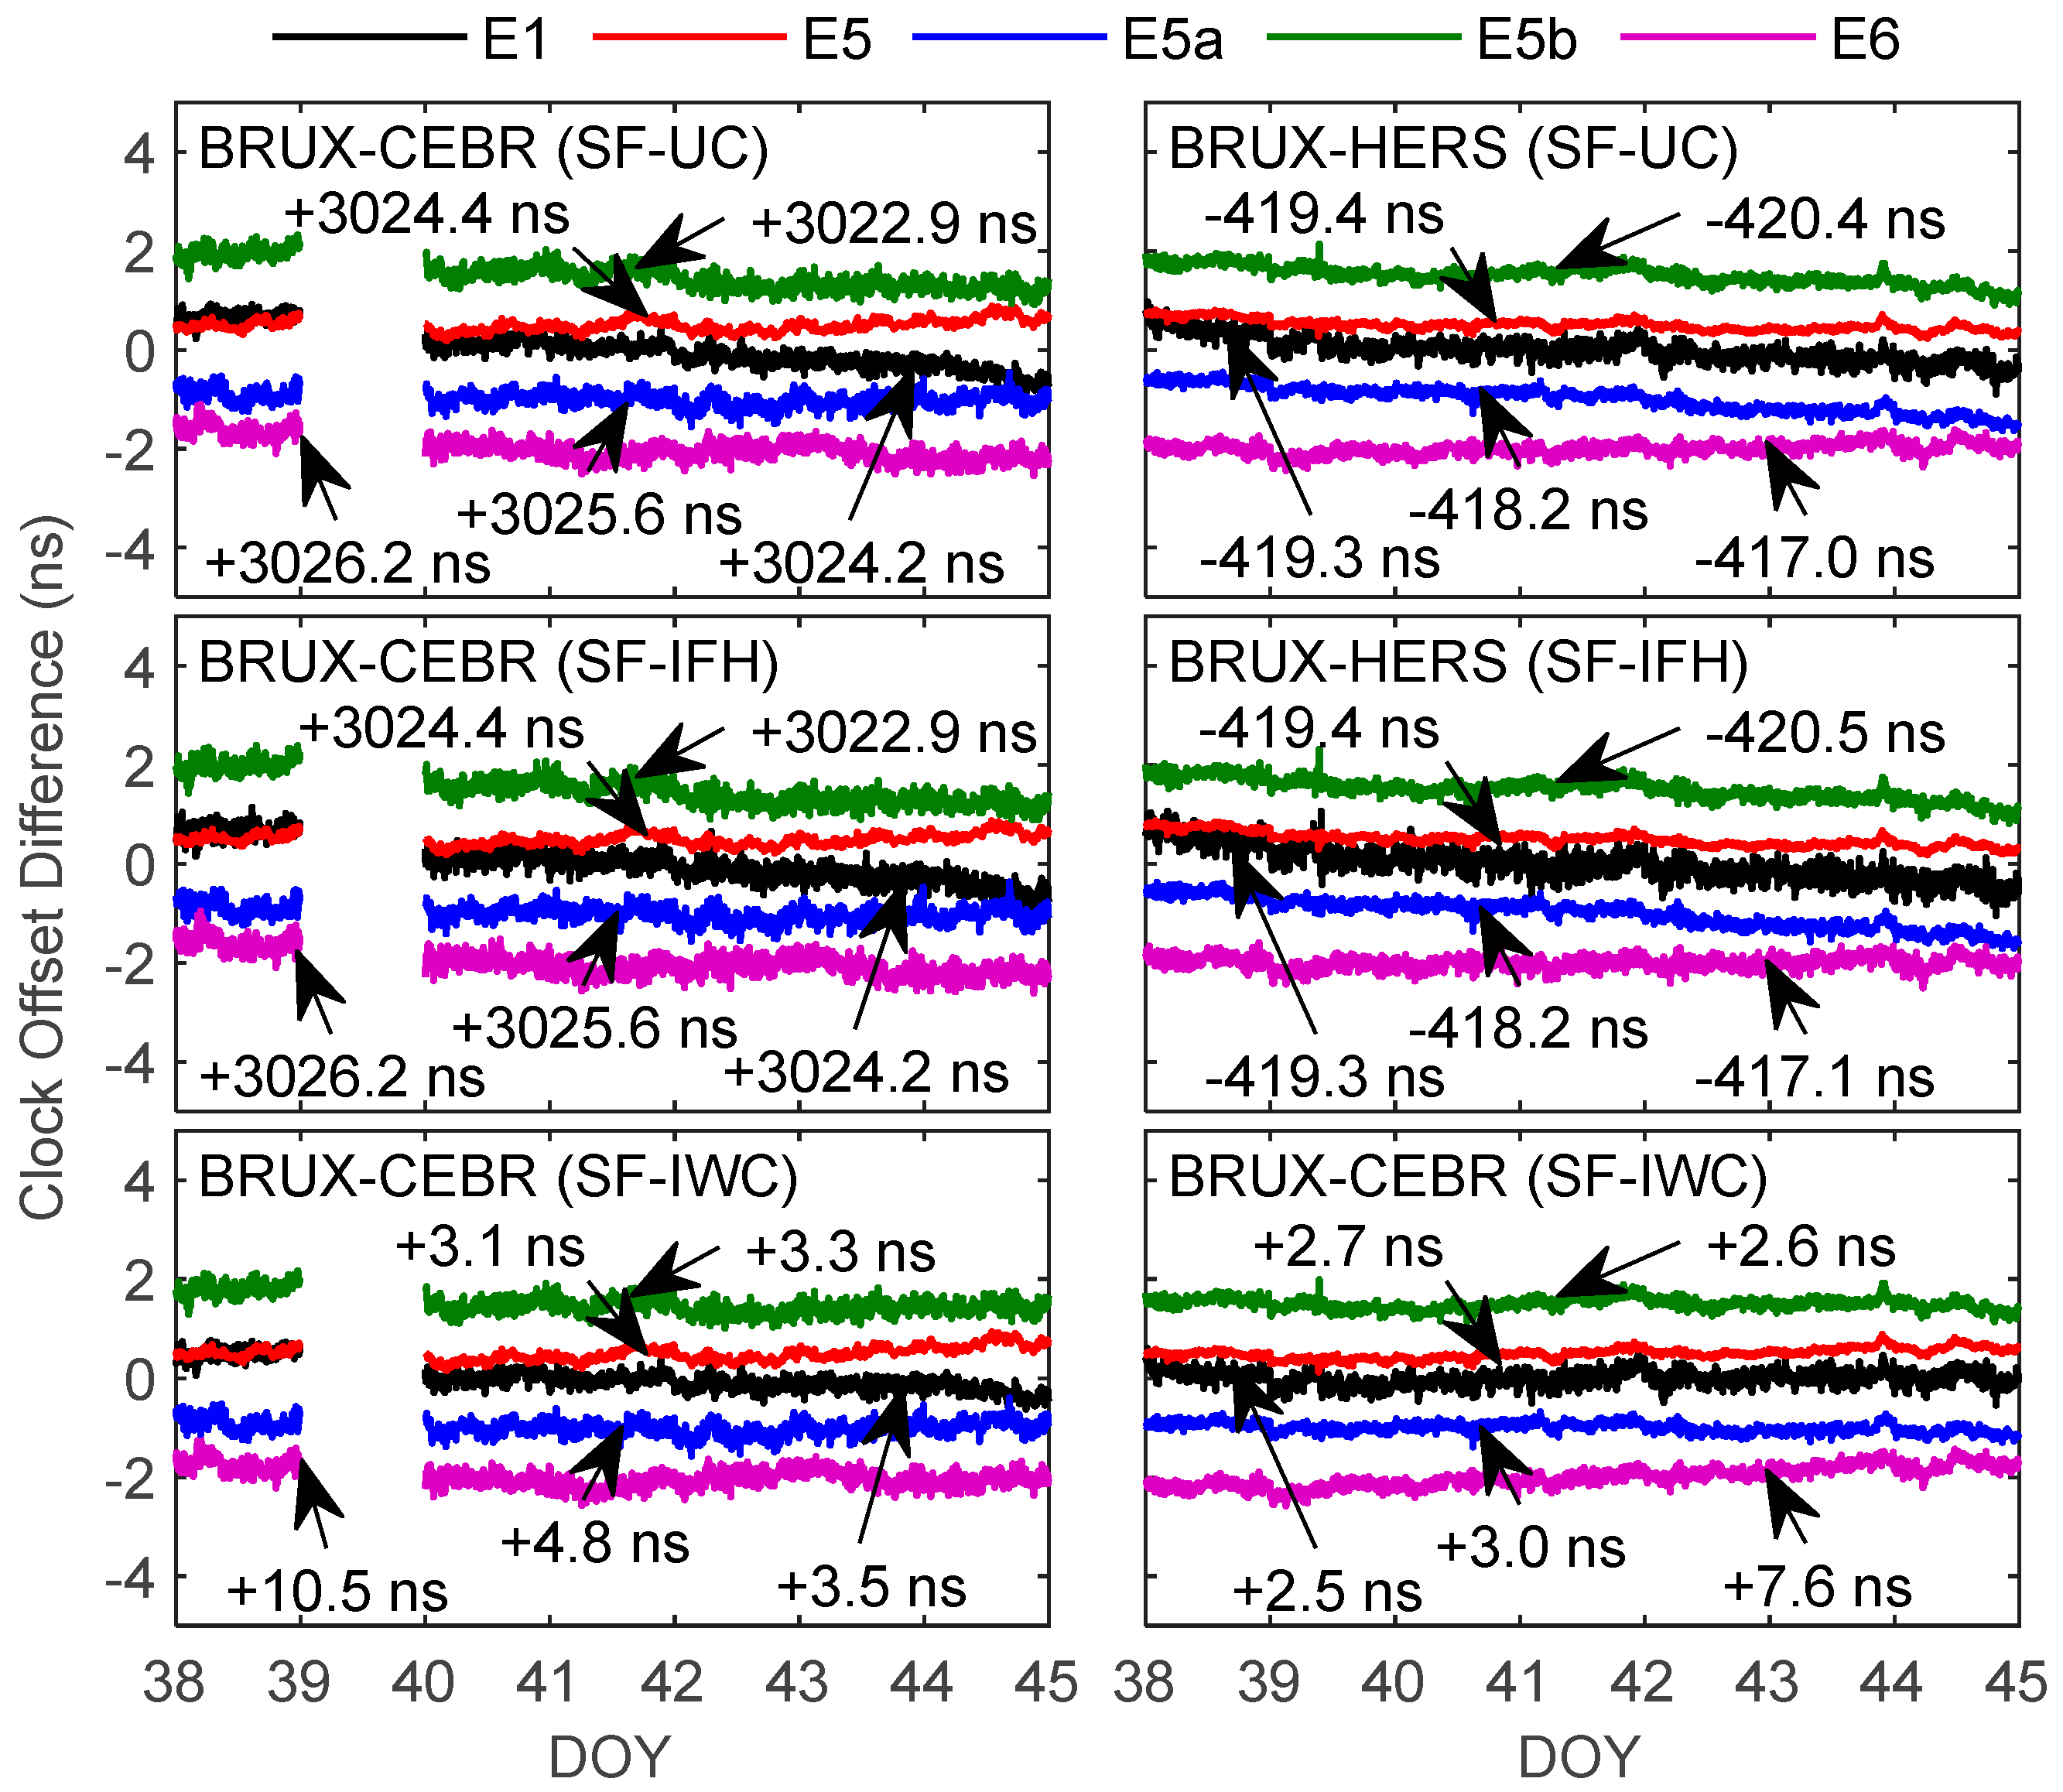
Limited by space, Figure 7 only shows the clock offset sequence of BRUX-CEBR and BRUX-HERS links. The variation trend of clock offsets of multi-frequency is basically the same. Among them, the clock offset noise of E5 is the smallest, and that of E1, E5a, E5b, and E6 is basically the same, which is related to the minimum noise of E5 observation and the larger noise of E1, E5a, E5b, and E6 signals. We note that the clock offset noise of the BRUX-HERS is slightly small than that of BRUX-CEBR, which corresponds with the idea that the data quality of HERS is better than CEBR. The minimum biases of E1, E5a, E5b, and E6 between E5 are 148.9 ps, 124.9 ps, 121.3 ps, and 156.7 ps, respectively; the corresponding maximum biases are 103.9 ps, 62.2 ps, 69.7 ps, and 93.7 ps; and the related average biases are 124.9 ps, 84.6 ps, 94.5 ps, and 115.1 ps, respectively, implying that the E5a signal is superior to the E1, E5b, and E6 signals.
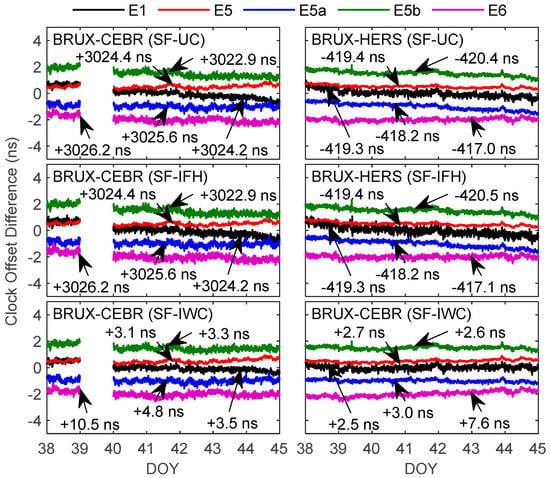
Figure 7.
Time and frequency transfer results of the E1, E5a, E5b, E5, and E6 signal SF PPP solutions with respect to IGS final products.
As shown in Table 5, the STD of E5 is the smallest, while that of E1 is the largest, and the STD of E5a is smaller than E5a and E5b. The mean STDs of E1, E5, E5a, E5b, and E6 are 121.7 ps, 68.5 ps, 111.1 ps, and 108.88 ps, respectively. Compared with E1, the STDs of E5, E5a, E5b, and E6 are reduced by 43.7%, 22.0%, 8.7%, and 10.5% on average, respectively, among which E5 has the most significant decrease rate, while E5b has the smallest decrease rate, which is related to the smaller noise of E5 and the bigger noise of E5b. The mean STD values of SF-UC, SF-IFH, SF-IWC, and DF-IF are 97.0 ps, 109.6 ps, and 96.4 ps, respectively, among which the STD of SF-IFH is the largest, while the SF-IWC is the smallest. Compared with the STD of SF-IFH, the STDs of SF-UC and SF-IWC are reduced by 11.5% and 12.0% on average, respectively. The mean STDs of BRUX-CEBR, BRUX-HRES, BRUX-ONSA, and BRUX-SPT0 are 125.2 ps, 98.8 ps, 83.8 ps, and 96.2 ps, respectively. The accuracy of BRUX-ONSA is the best, and that of BRUX-CEBR is the worst, which is related to the best data quality of ONSA and the poor data quality of CEBR.

Table 5.
STD values of the E1, E5, E5a, E5b, and E6 signal SF PPP solutions in contrast with the IGS final products (ps).
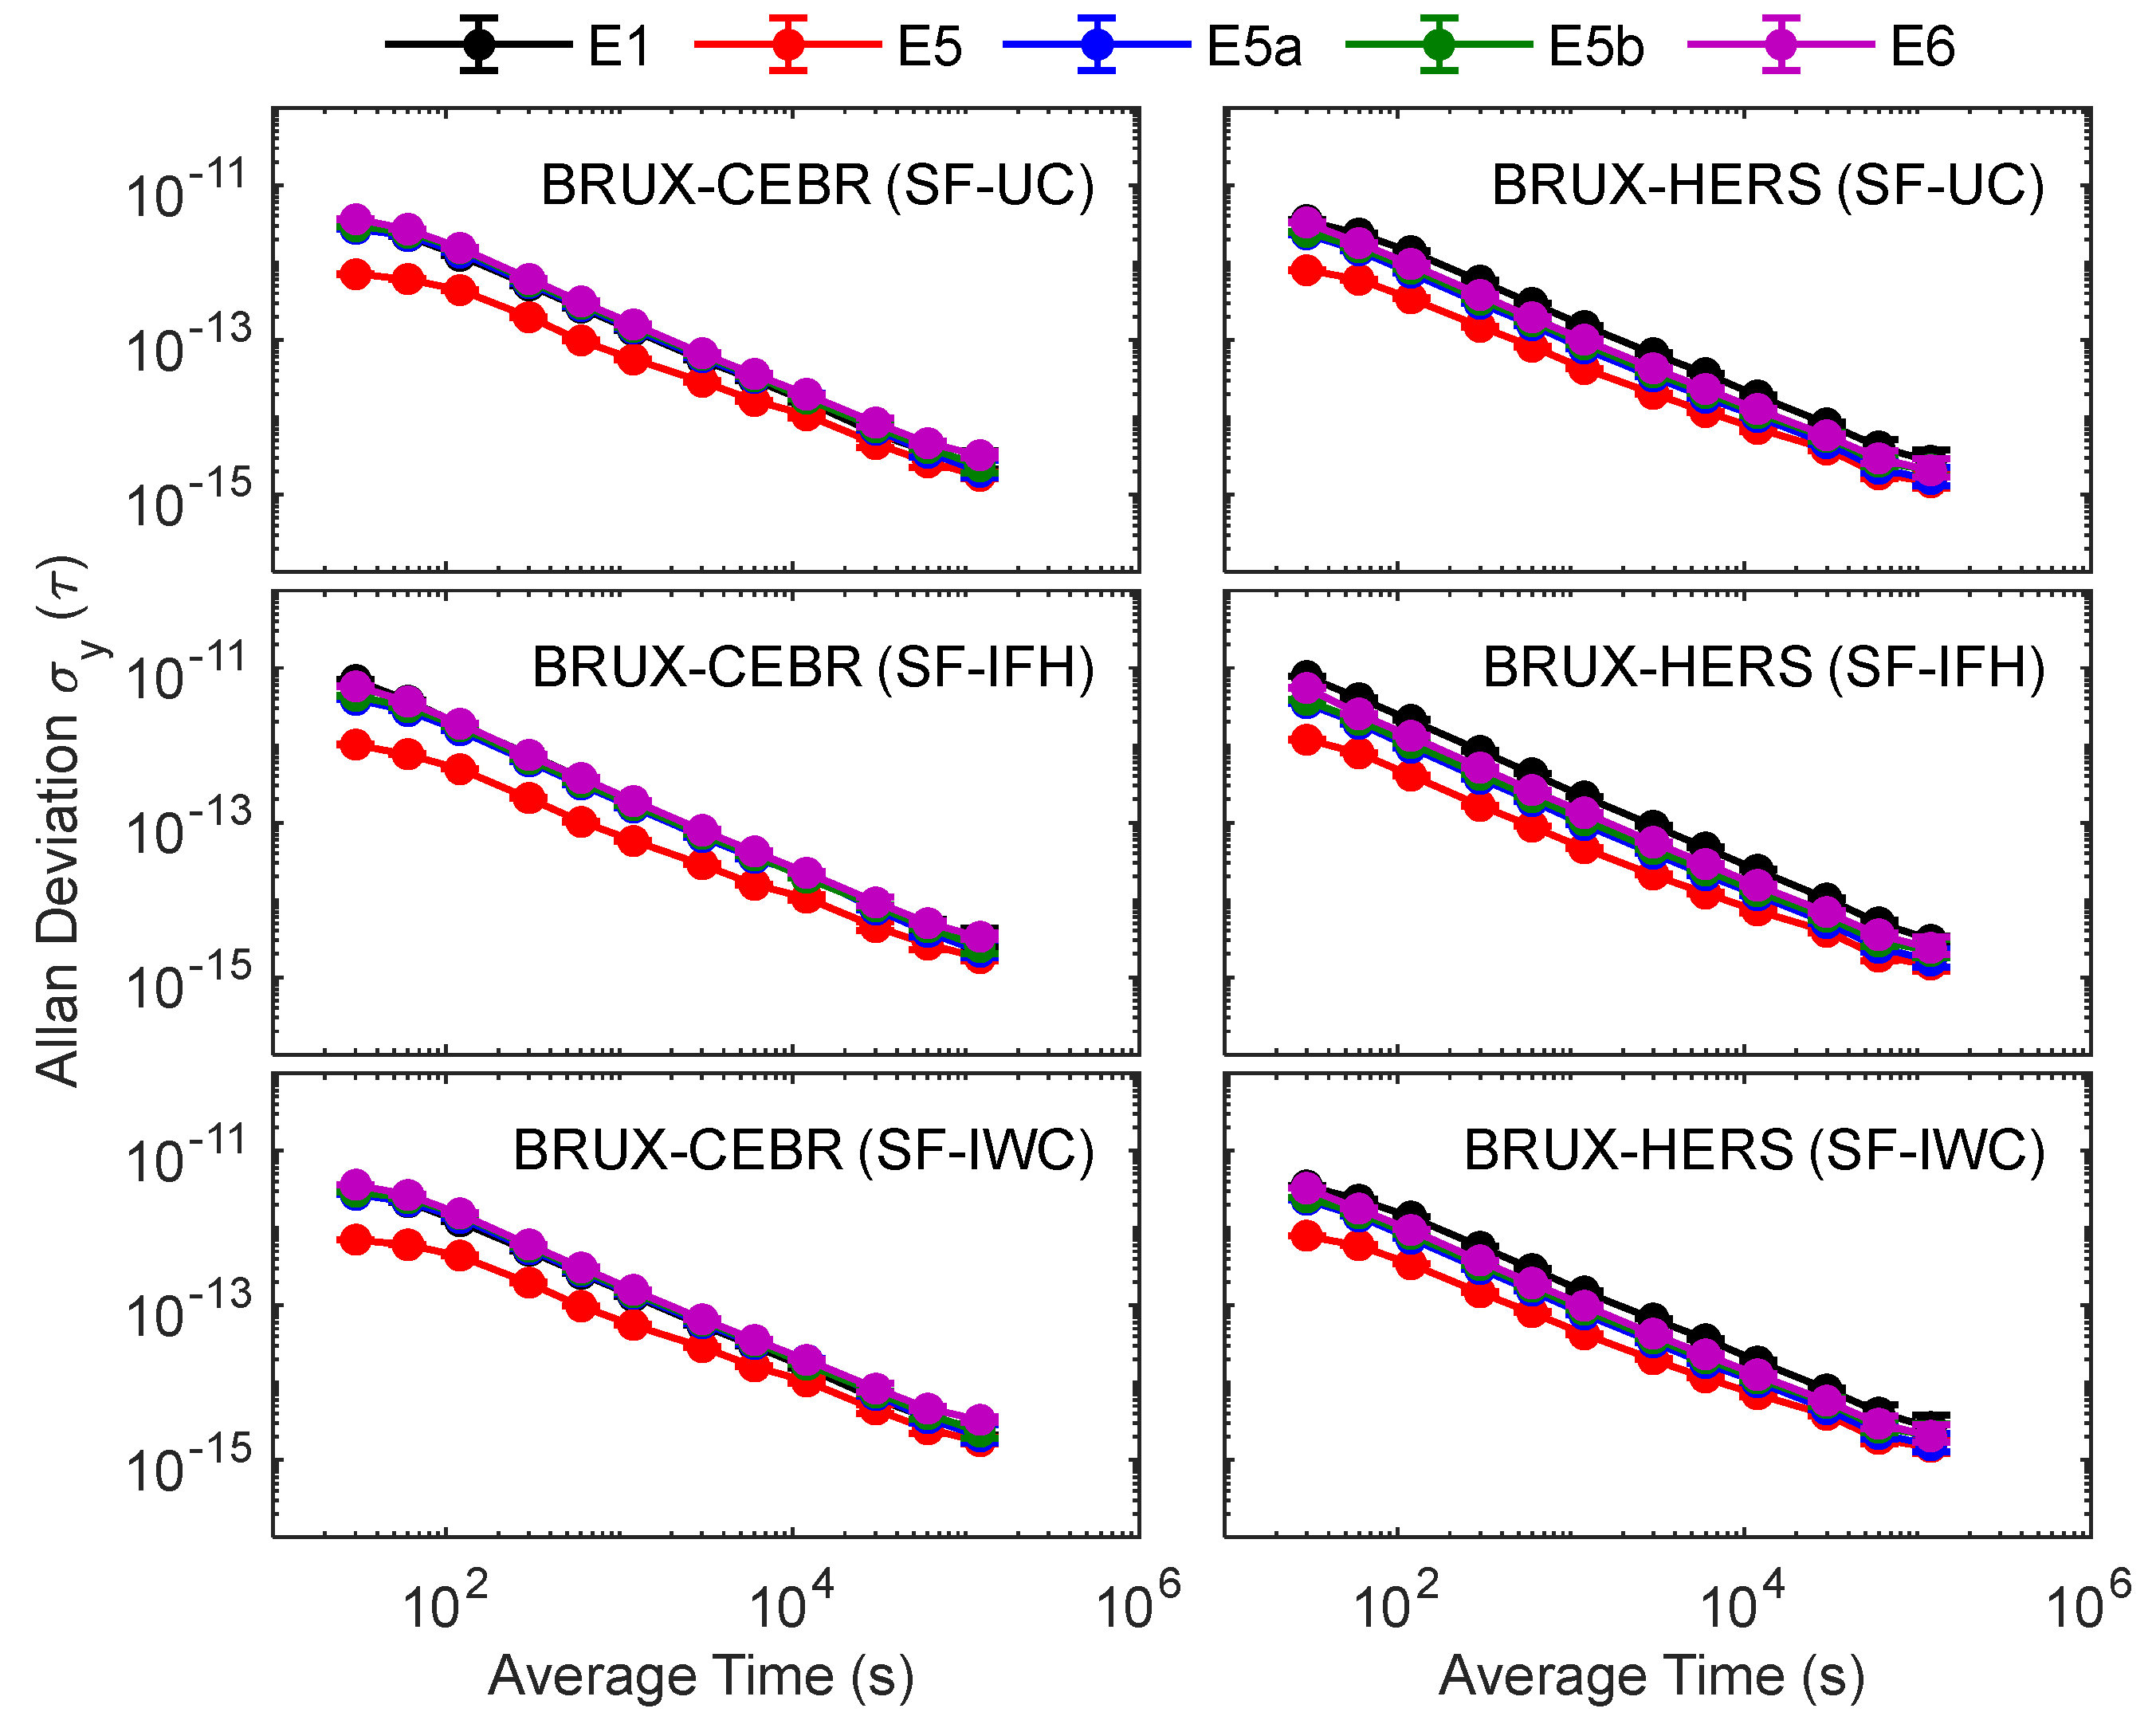
As shown in Figure 8, there are some differences in the short-term stability of E1, E5, E5a, E5b, and E6. However, with the increase in average times, the difference in frequency stability among E1, E5, E5a, E5b, and E6 gradually decreases, and the frequency stability of each frequency at 120,000 s is close. By comparison, we found that the frequency stability of E5 is significantly better than that of E1, E5a, E5b, and E6, and the frequency stabilities of E5, E5b, and E6 are also close, which is related to the minimum pseudo-range noise of E5 and the closed pseudo-range noise of E5, E5b, and E6. In the BRUX-CEBR link, the frequency stabilities of E1, E5, E5b, and E6 are consistent. However, in the BRUX-ONSA link, the frequency stability of E1 is significantly worse than that of E5, E5b, and E6, which is related to the noise of multi-frequency observations at CEBR and ONSA. To further analyze the performance of SF time and frequency transfer using Galileo multi-frequency observations, Table 6 makes statistics on the average frequency stability of the four links.
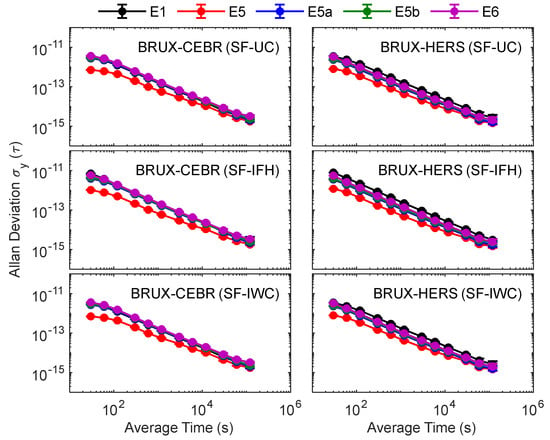
Figure 8.
Frequency stabilities at BRUX-CEBR and BRUX-HERS for E1, E5, E5a, E5b, and E6 signal SF PPP solutions.

Table 6.
The mean values of frequency stability (×10−14) at four links for E1, E5, E5a, E5b, and E6 signal SF PPP solutions.
As shown in Table 6, the long-term and short-term stability of using the E1 signal for time and frequency transfer is worse than that of using E5, E5a, E5b, and E6, especially in the short-term stability, demonstrating the most apparent difference between E5, E5a, E5b, and E6. The frequency stability performance using the E5 signal is the best, while the frequency stability using the E5a signal is the second best. Since the short-term stability is mainly affected by the noise of the observation, the results of multiple frequencies have the most significant difference in short-term frequency stability. With an increase in the average time, the frequency stability of each model shows a gradually approaching trend. The frequency stability differences between E1, E5a, E5b, E6, and E5 in 120,000 s are 8 × 10⁻¹⁶, 2 × 10⁻¹⁶, 4 × 10⁻¹⁶, and 5 × 10⁻¹⁶, respectively. With a continuous increase in the average time, the stability difference between each frequency may be smaller. The frequency stabilities of E5, E5a, E5b, and E6 are significantly improved compared with E1, with maximum, minimum, and average values of 78.8%, 10.5%, and 30.0%, respectively. The average gain of E1 is the largest (57.8%), and that of E6 is the most minor (14.4%). All these indicate that, compared with the single-frequency observation, the multi-frequency observations increase the reliability of the SF time and frequency transfer, and also improve the accuracy of the SF time and frequency transfer.
3.5. SF PPP Time and Frequency Transfer with RTS Products and Multi-Frequency Signals
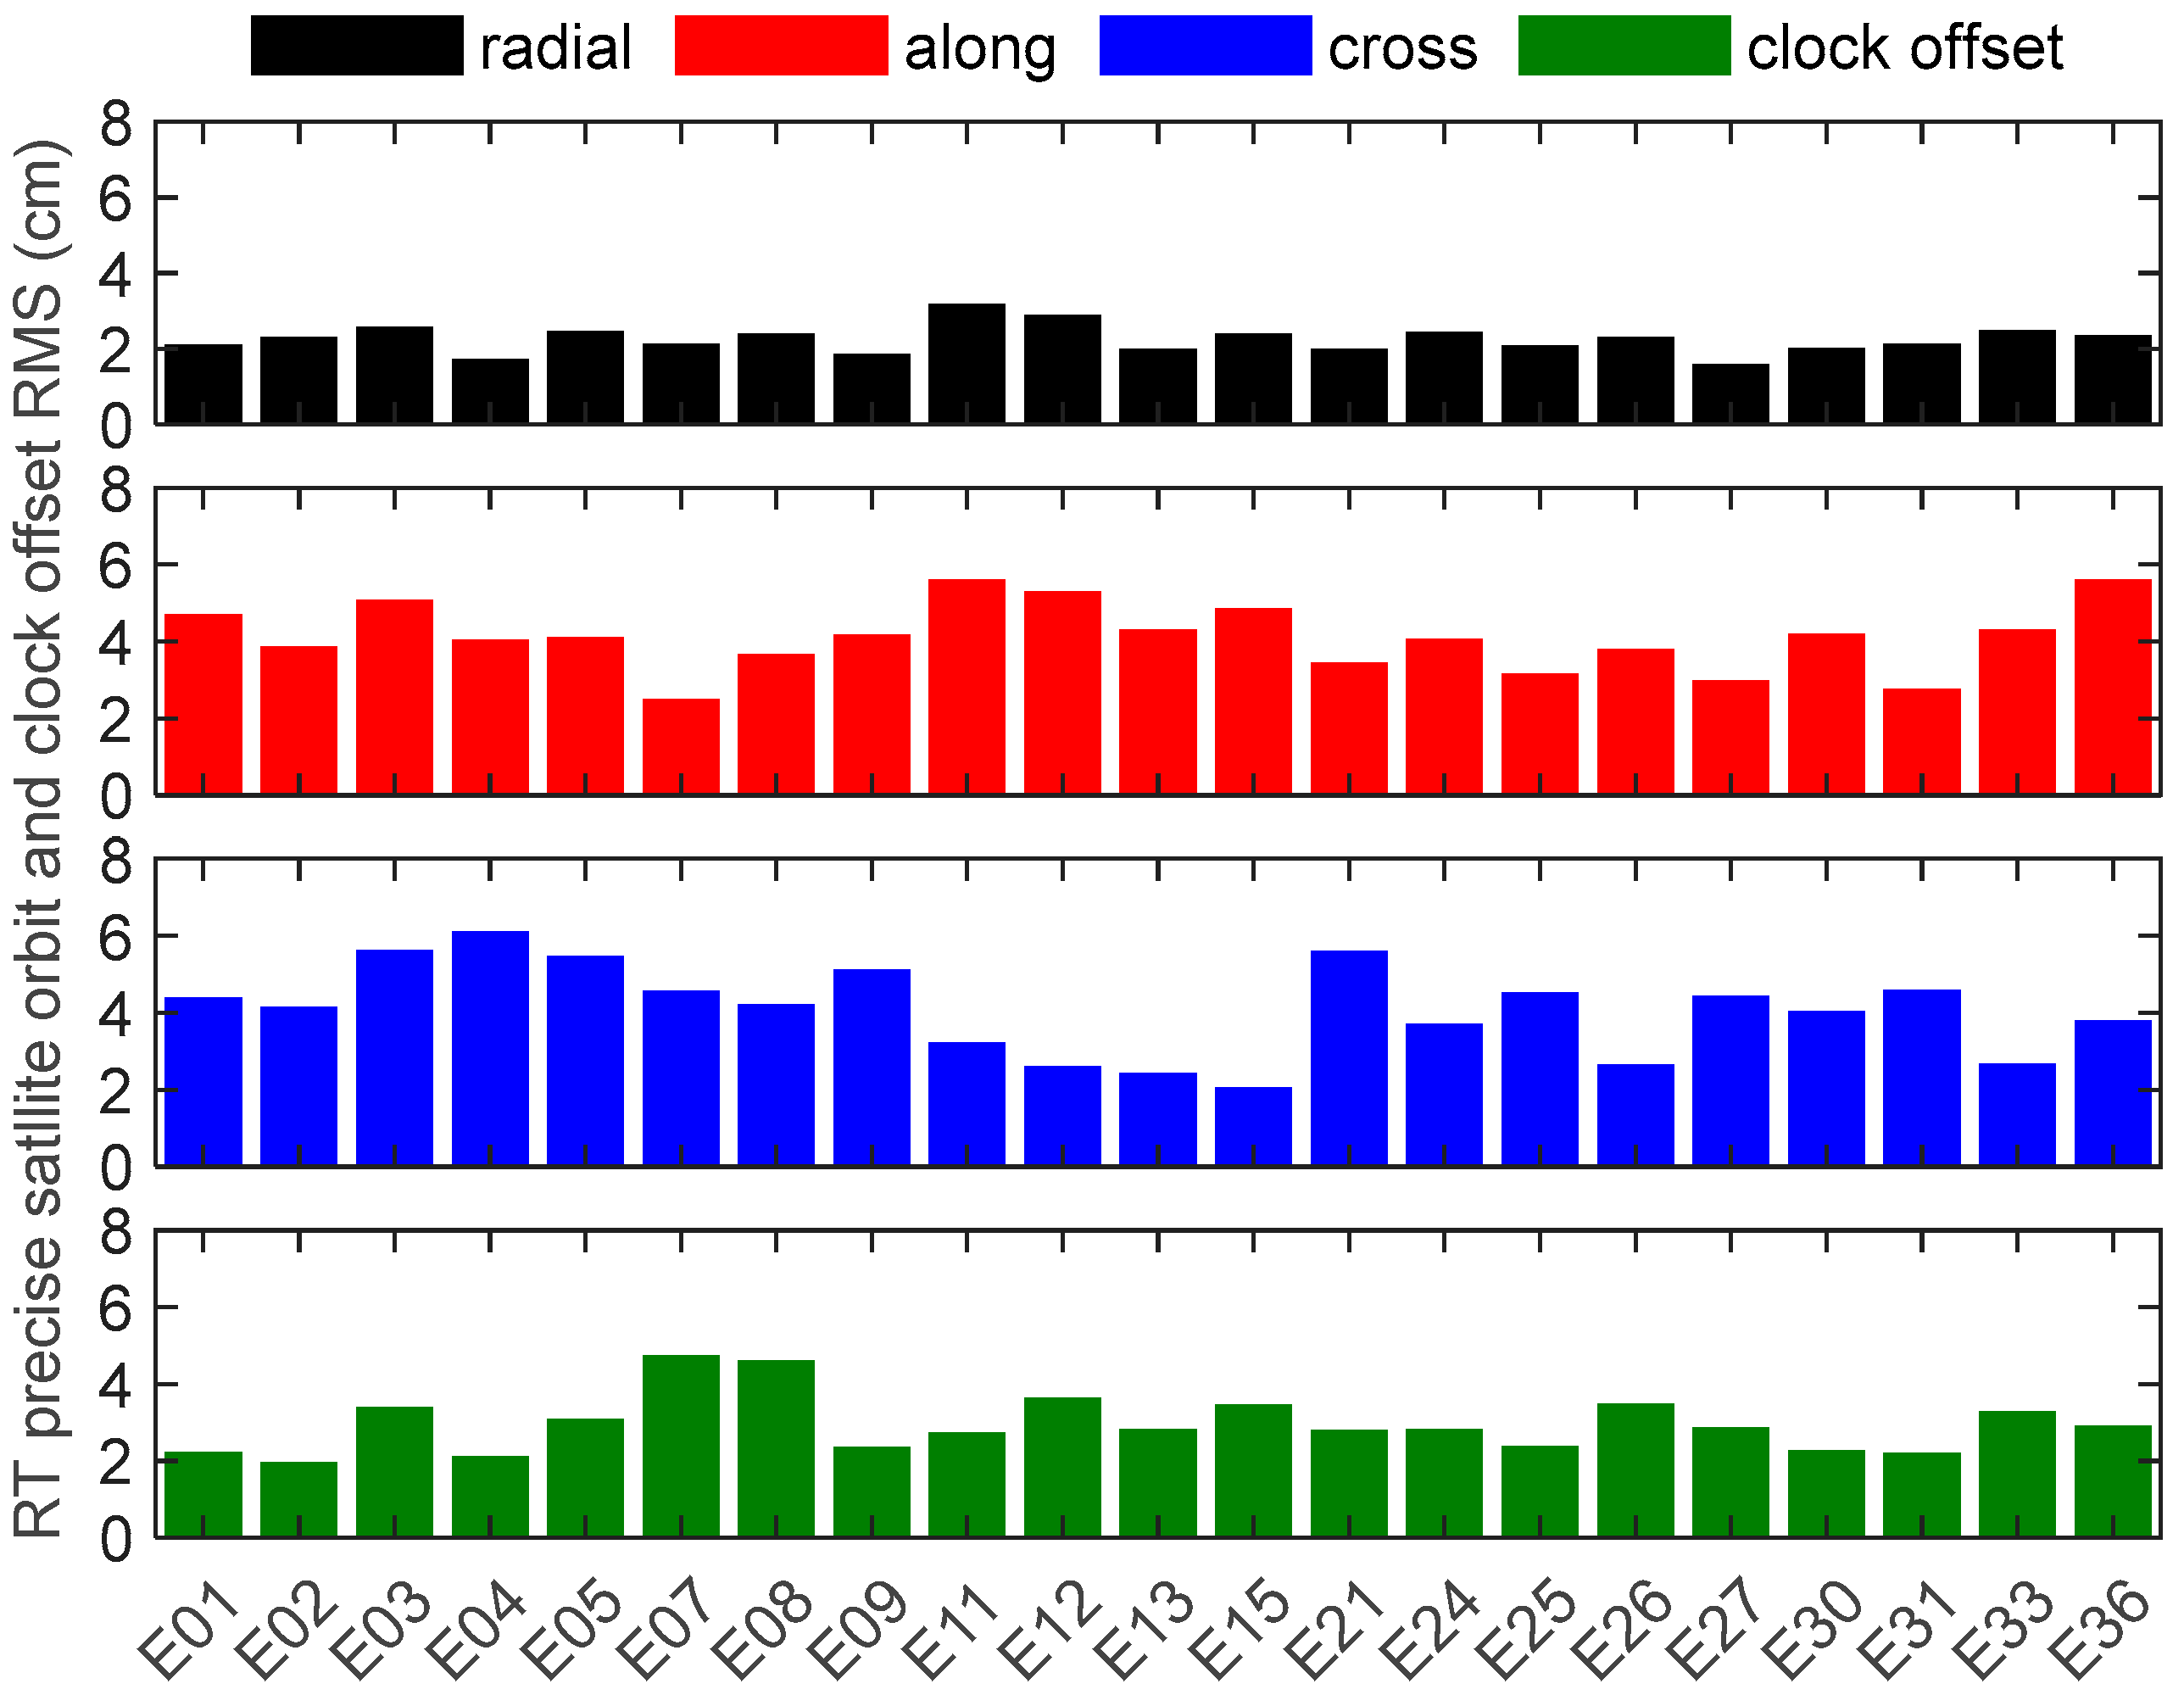
Figure 9 provides the Galileo satellite orbit and clock offset difference in the SSRC00CNE0 RTS to GRG final products. Galileo’s total number of available satellites in the SSRC00CNE0 stream is 21. The RMS values of orbit and clock offset difference are all within 6.0 cm, and the RMS values of the radial component are significantly smaller than that the along the component and the cross-component. The mean RMS values of the radial component, along component, cross-component, and clock offset of Galileo satellites are 2.3 cm, 4.1 cm, 4.1 cm, and 3.0 cm, respectively.
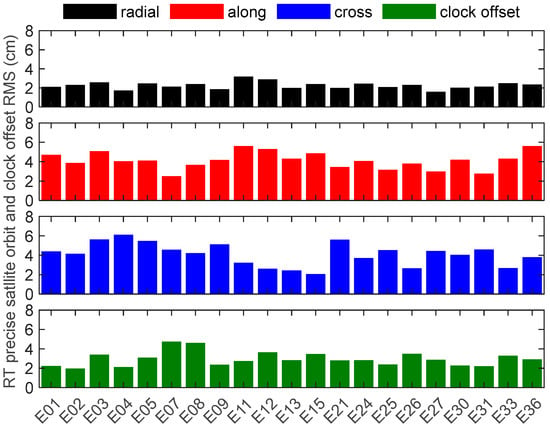
Figure 9.
Difference in the orbit and clock offset between the SSRC00CNE0 RTS and the GRG final products.
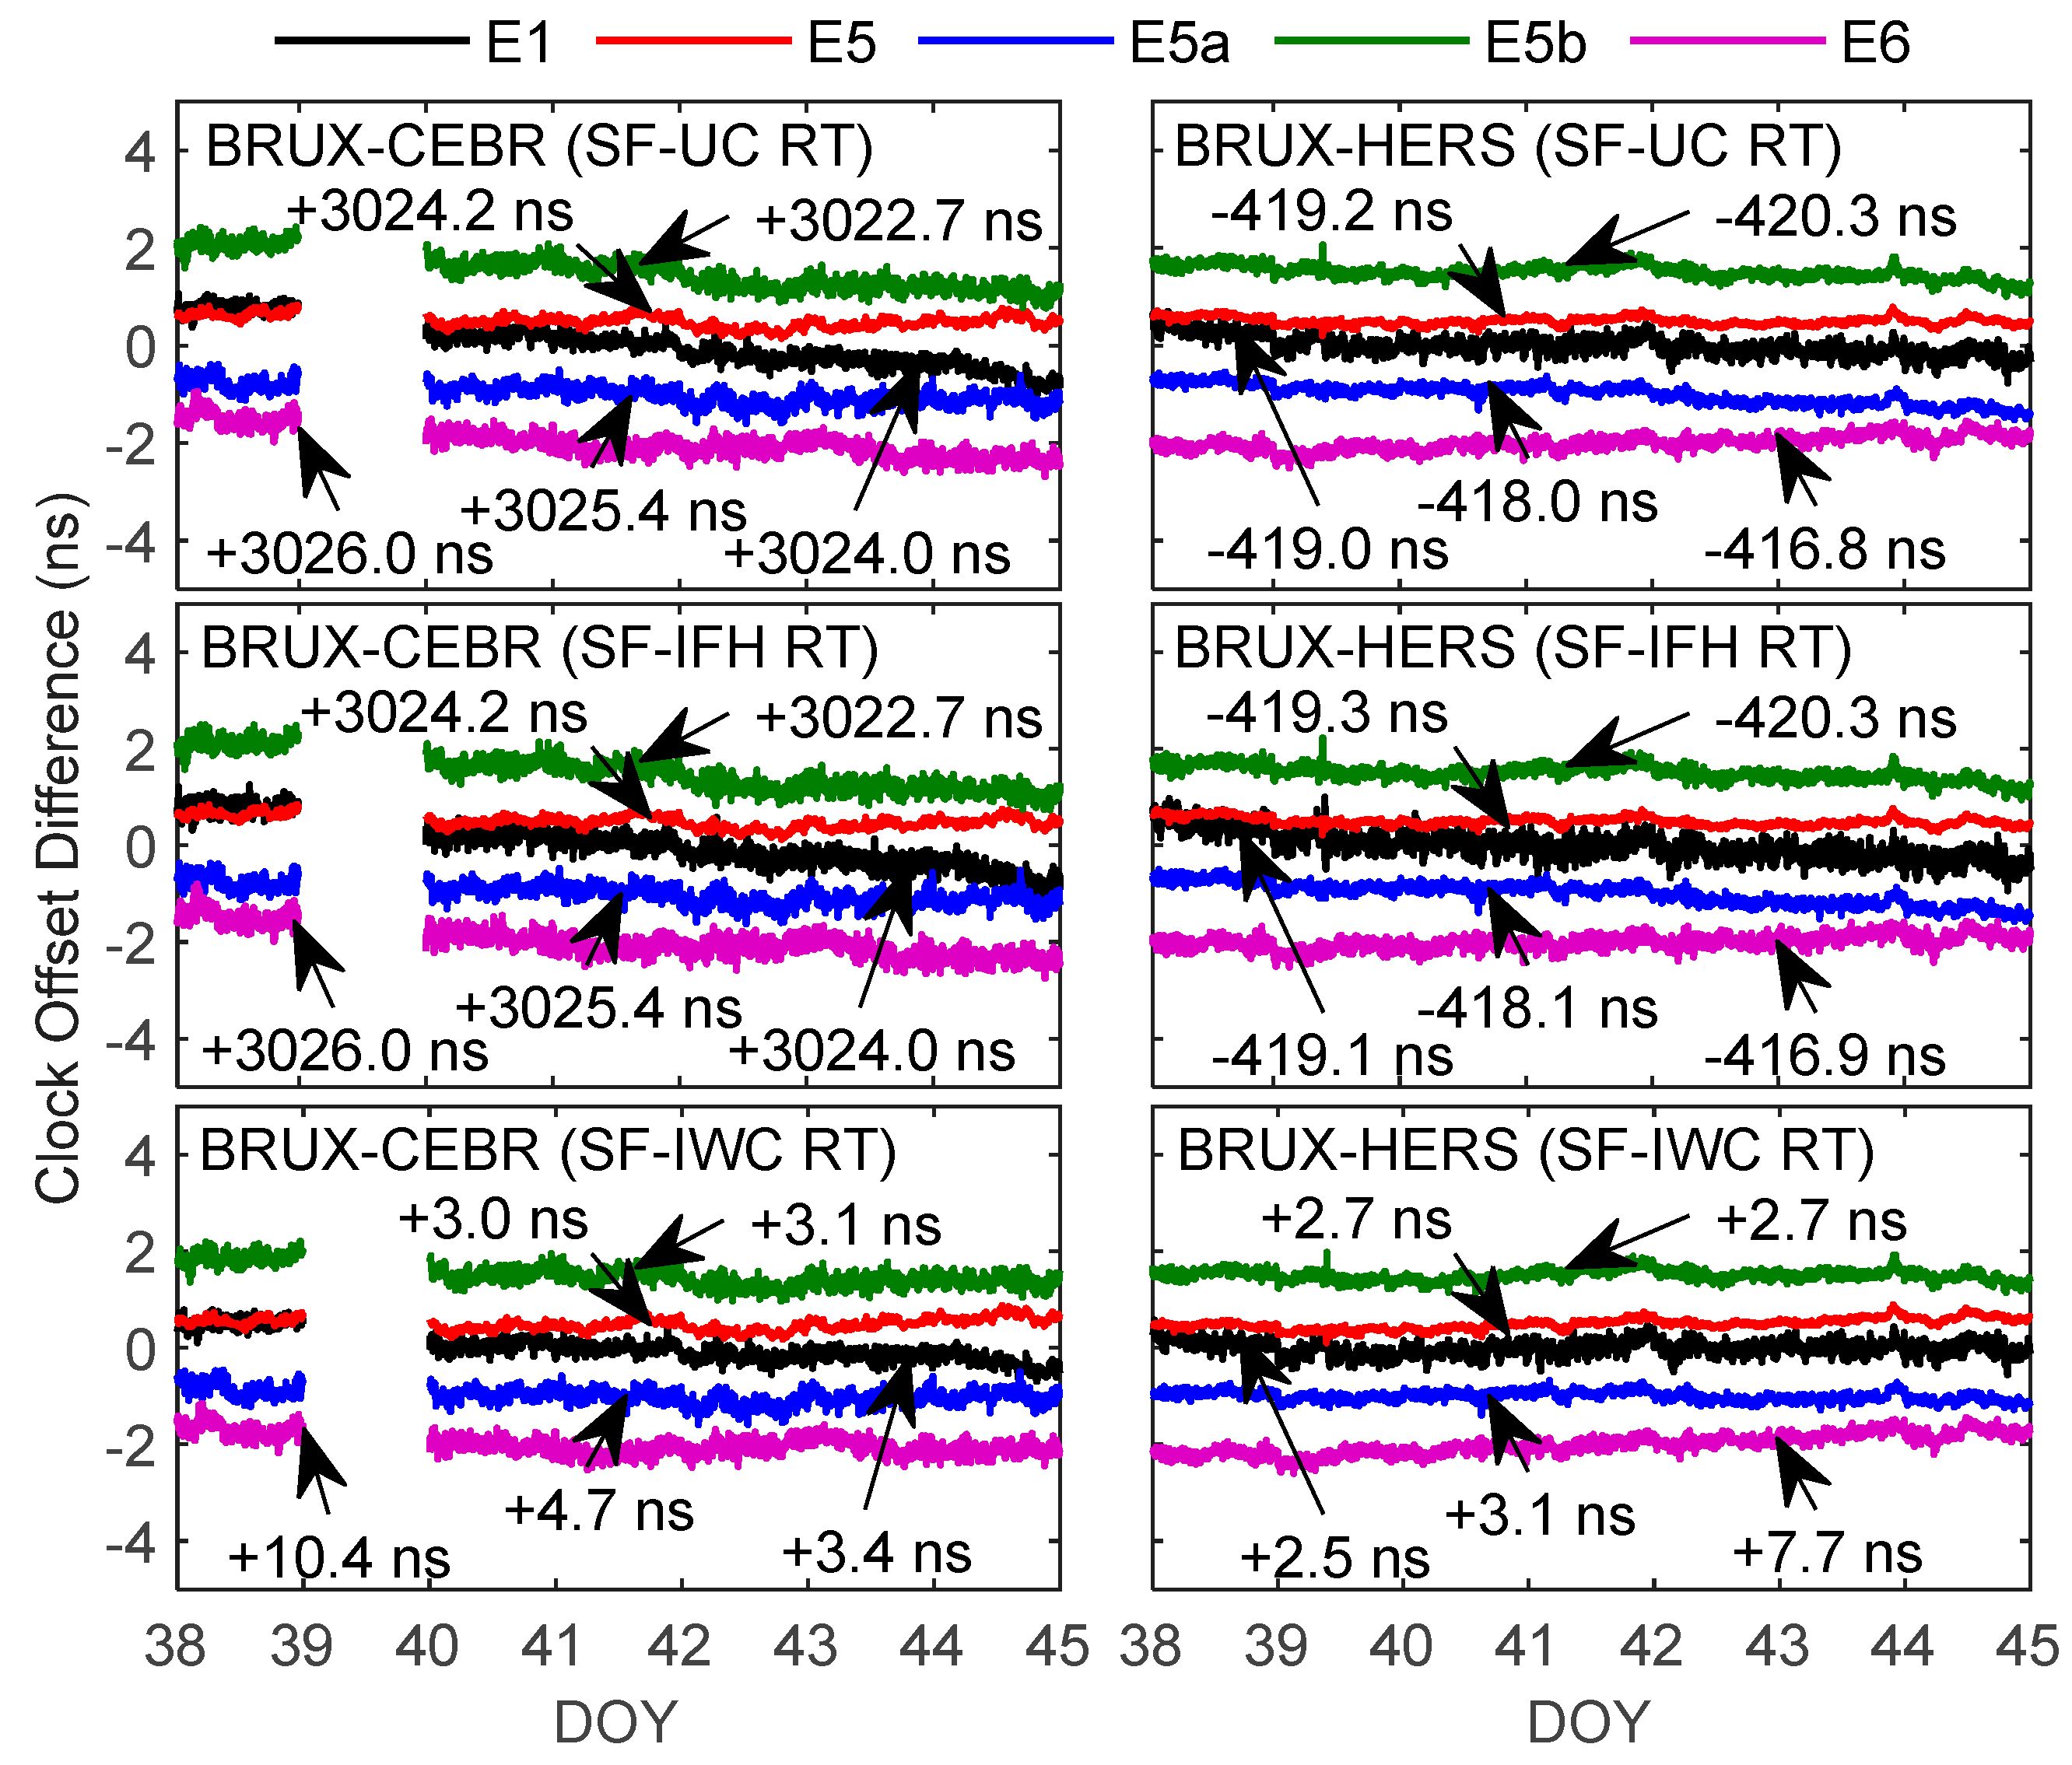
Figure 10 shows the clock offset of BRUX-CEBR and BRUX-HERS links with the RT processing mode. The variation trend of multi-frequency clock offsets is the same; the variation trend among the clock offset noise of E5 is the smallest; and the variation trends of E1, E5a, E5b, and E6 are bigger than E5. Although the product of the SSRC00CNE0 stream is slightly worse than that of the GRG final product, there are no obvious differences between Figure 6 and Figure 10, which may be related to the big noise of the SF PPP clock offset sequence obliterating the product error of the SSRC00CNE0 stream. The minimum biases of E1, E5a, E5b, and E6 between E5 are 147.8 ps, 125.0 ps, 121.3 ps, and 156.3 ps, respectively; the corresponding maximum biases are 105.0 ps, 62.2 ps, 69.4 ps, and 93.2 ps, respectively; and the corresponding average biases are 124.8 ps, 84.6 ps, 91.4 ps, and 114.9 ps, respectively. The difference between the RT and the post-processing biases is slight (mean value of 0.4 ps), which indicates that the RT and post-processing SF time and frequency transfer performance is relatively close.
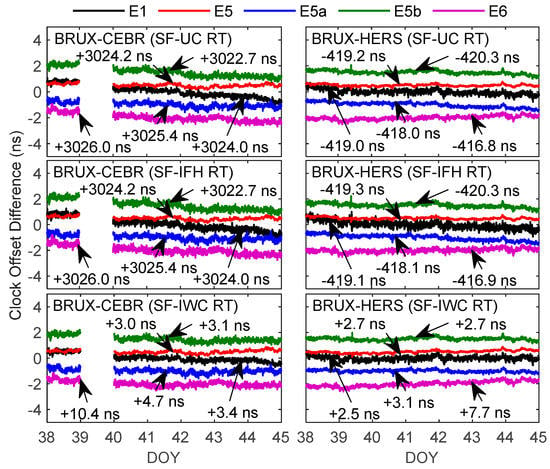
Figure 10.
Time and frequency results of the E1, E5, E5a, E5b and E6 signal SF real-time (RT) PPP solutions with respect to IGS final products at BRUX-CEBR and BRUX-HERS links.
Table 7 shows the STD values of the Galileo RT SF PPP solutions in contrast with the IGS final clock offset product. Similar to the post-processing results, the STD of E5 is the smallest, while that of E1 is the largest, and the STDs of E5a are smaller than E5a and E5b. The mean STDs of E1, E5, E5a, E5b, and E6 are 123.8 ps, 67.0 ps, 95.6 ps, 108.5 ps, and 112.5 ps, respectively. Compared with E1, the STDs of E5, E5a, E5b, and E6 are reduced by 45.9%, 22.8%, 12.4%, and 9.1%, on average, respectively, among which E5 has the most significant decrease rate, while E6 has the smallest decrease rate. The mean STDs of SF-UC, SF-IFH, SF-IWC, and DF-IF are 97.5 ps, 109.9 ps, 97.1 ps, and 37.29 ps, respectively, among which the STD of SF-IFH is the largest, while the STD of SF-IWC is the smallest.

Table 7.
STD values of E1, E5, E5a, E5b, and E6 frequency real-time (RT) SF PPP solutions in contrast with the IGS final clock offset product (ps).
The STDs of RT SF PPP increase by an average of 5.5% compared with PT SF PPP, and the STD of RT DF-IF PPP increase by an average of 20.4% compared with post-processing SF PPP. We found that the STD of RT SF PPP is lower than that of post-processing SF PPP in some links, but the STD of RT DF-IF PPP is always greater than that of post-processing DF-IF PPP. This phenomenon may be caused by the large noise of clock offsets in SF PPP, which submerges the biases of RT satellite products, and the RT satellite products are not affected by the daily boundary effect.
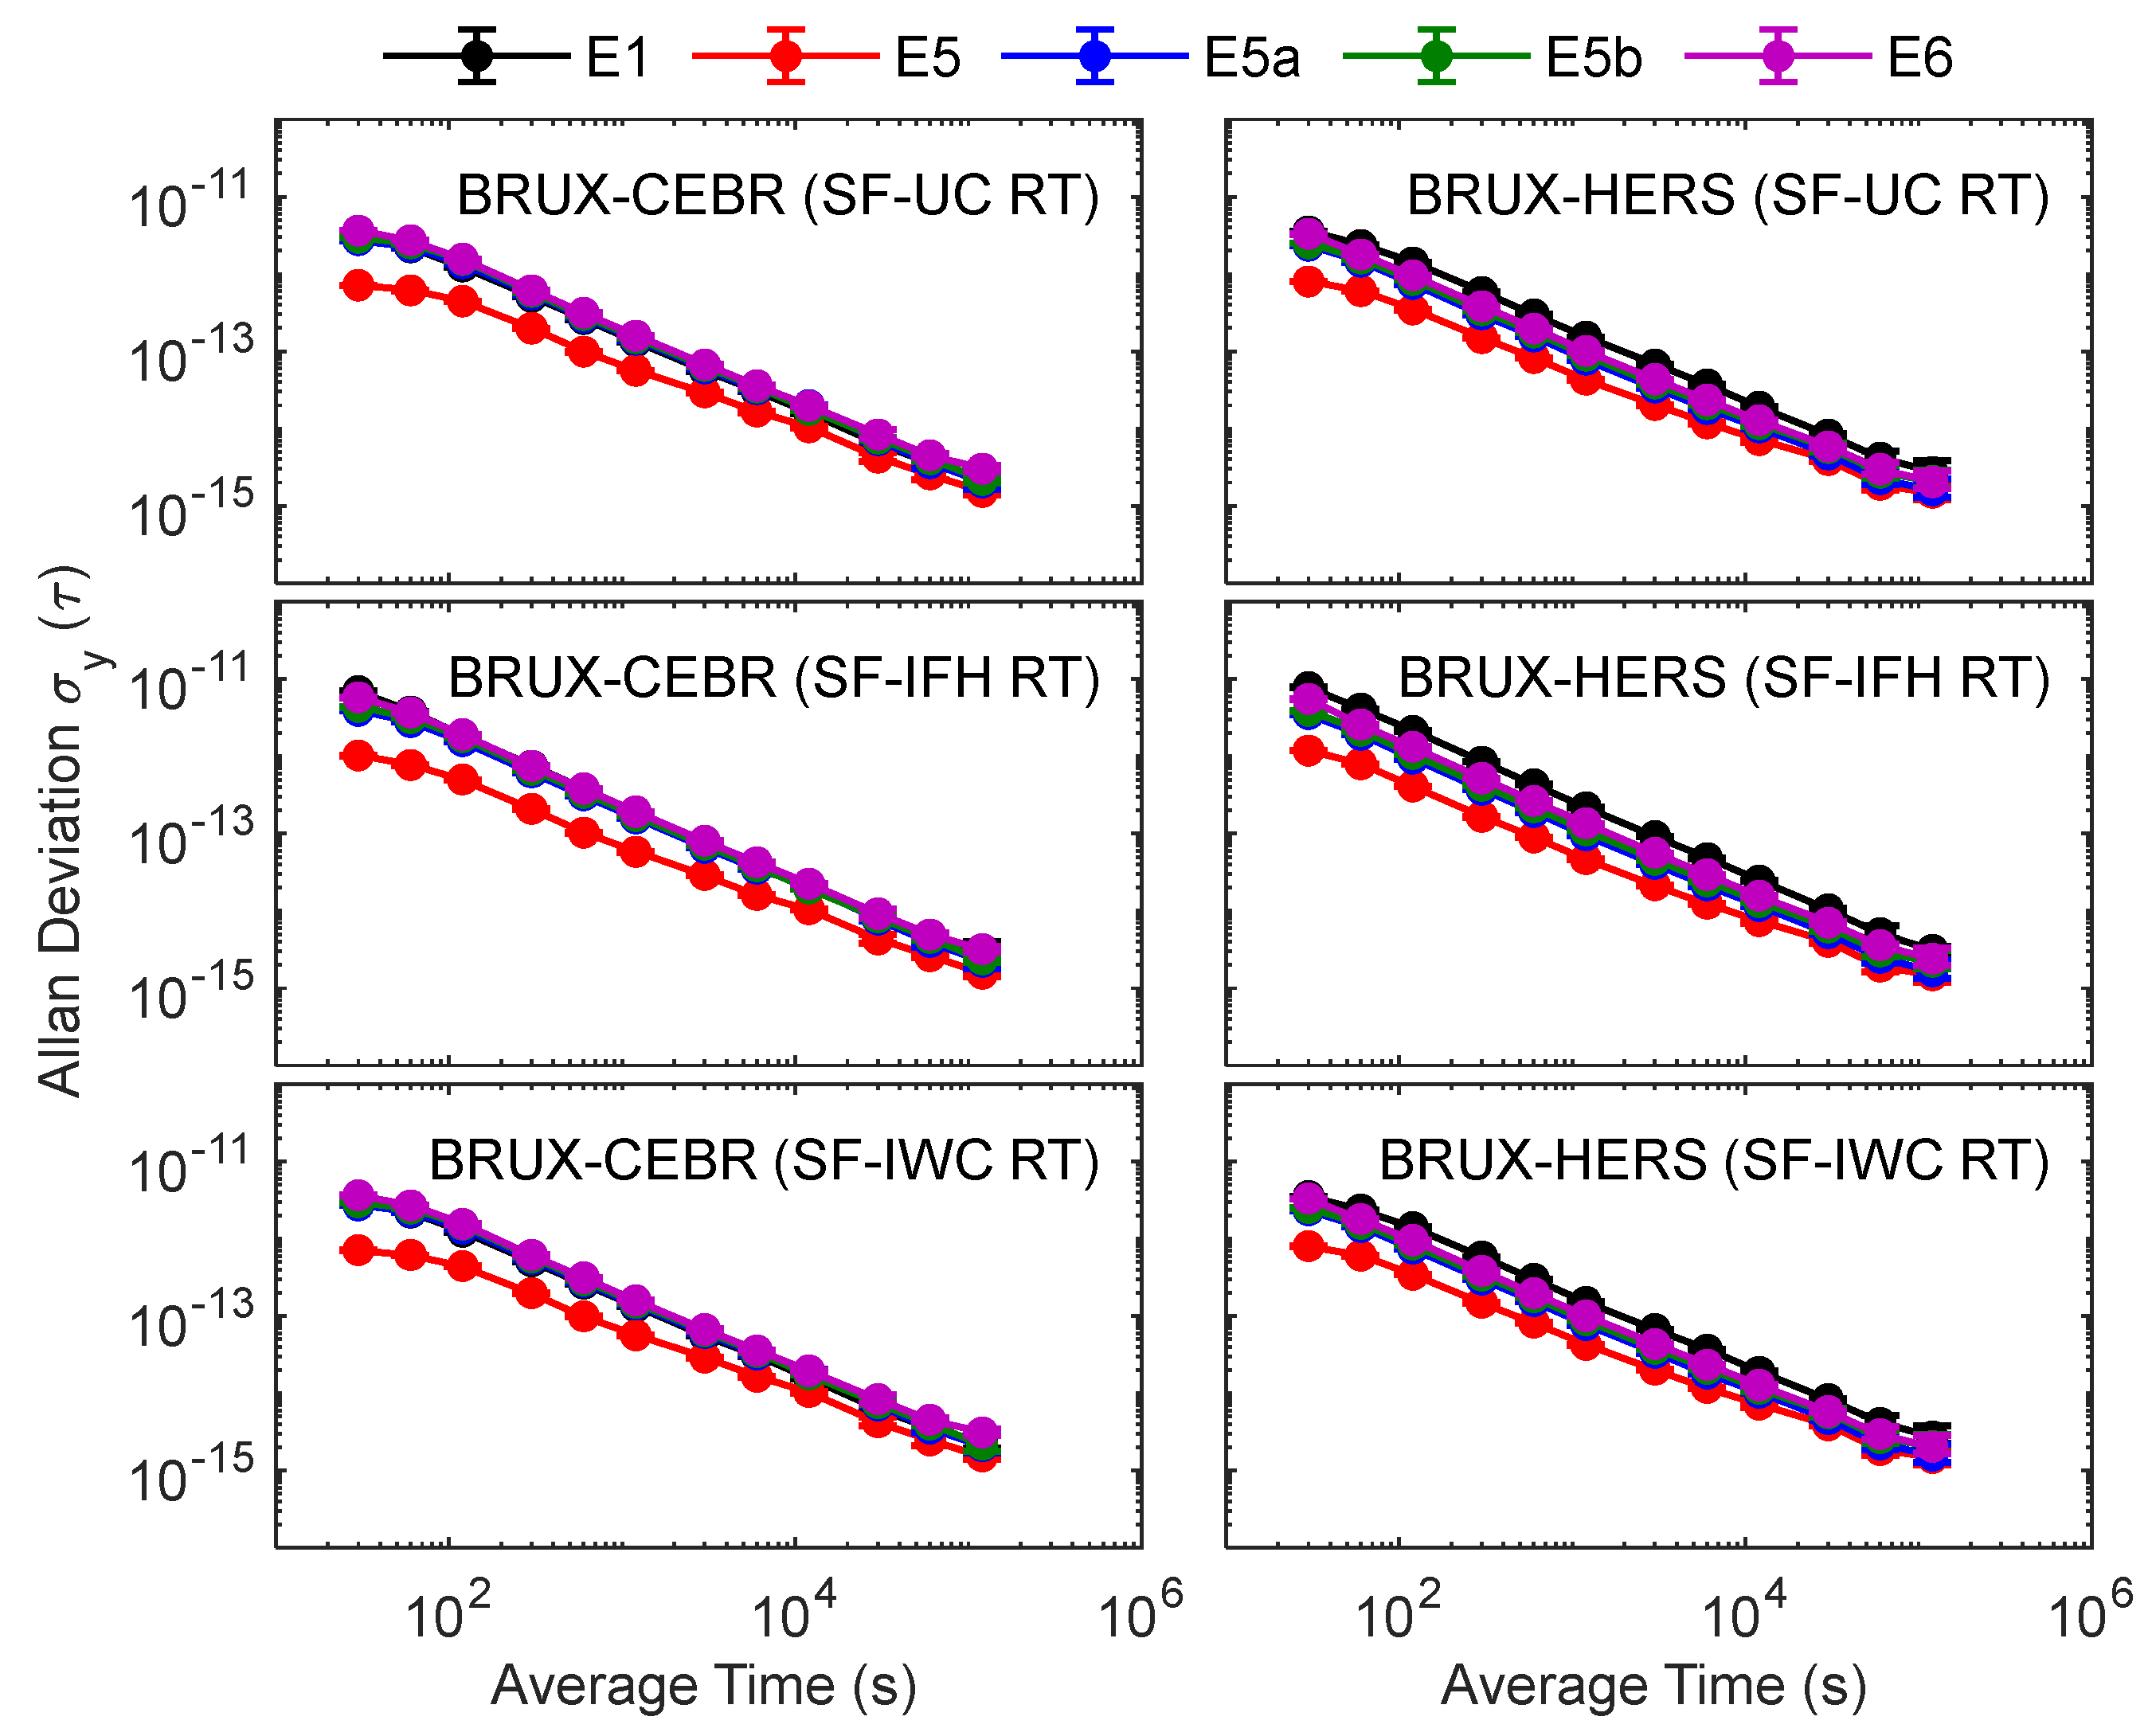
Figure 11 shows frequency instabilities at BRUX-CEBR and BRUX-HERS links for RT SF PPP. Similar to the post-processing results, there are significant differences in the short-term frequency stability of E1, E5, E5a, E5b, and E6. With the increase in average times, the difference in frequency stability among E1, E5, E5a, E5b, and E6 gradually decreases. To further analyze the performance of RT SF PPP time and frequency transfer with E1, E5, E5a, E5b, and E6 signals, Table 8 makes statistics on the average stability of BRUX-CEBR, BRUX-HERS, BRUX-ONSA, and BRUX-SPT0 links.
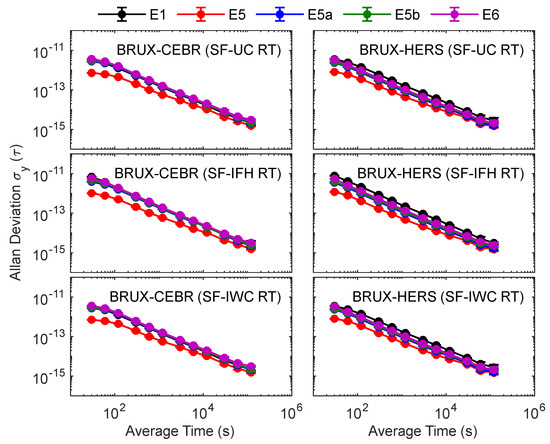
Figure 11.
Frequency stabilities at BRUX-CEBR and BRUX-HERS for E1, E5, E5a, E5b, and E6 SF RT PPP solutions.

Table 8.
The mean values of frequency stability (×10−14) at four links for E1, E5, E5a, E5b, and E6 frequency RT SF and DF-IF (E1/E5a) PPP solutions.
As shown in Table 8, E1 frequency stability is worse than that of E5, E5a, E5b, and E6, especially in the short-term frequency stability. The order of frequency stability is E5 > E5a > E5b > E6 > E5a, which corresponds to the MPC noise of multi-frequency signals (E5, E5a, E5b, E6, and E1 mean that MPC noise values are 0.127 m, 0.202 m, 0.220 m, 0.226 m, and 0.254 m, respectively). Compared with E1, the frequency stability of E5, E5a, E5b, and E6 is improved, with maximum, minimum, and average values reaching 78.8%, 8.9%, and 29.5%, respectively, and the gain of E5 is the largest (mean value of 57.5%) and that of E6 is the most minor (mean value of 14.0%).
Similar to the PT processing results, there are obvious differences in the short-term frequency stability of E1, E5, E5a, E5b, E5, and E6, but with the increase the time, their frequency stability gradually approaches (differences between E1, E5a, E5b, E6, and E5 in 120,000 s are 8 × 10⁻¹⁶, 3 × 10⁻¹⁶, 4 × 10⁻¹⁶, and 5 × 10⁻¹⁶, respectively). Interestingly, the long-term frequency stability of RT SF and RT DF-IF (E1/E5a) solutions are also relatively close (differences between E1, E5, E5a, E5b, E6, and DF-IF in 120,000 s are only 1.3 × 10⁻¹⁵, 5 × 10⁻¹⁶, 8 × 10⁻¹⁶, 9 × 10⁻¹⁶, and 1 × 10⁻¹⁵, respectively), which indicates that SF PPP has the potential to achieve the same frequency stability as DF-IF PPP.
We also found that the frequency stability of RT SF-PPP is better than that of PT SF-PPP in some signals (E1, E5, E5a, E5b, and E6 increase by 0.3%, 0.0%, −2.3%, 0.5%, and 0.0%, on average, respectively), but that of the RT DF-IF PPP is always worse than PT DF-IF PPP (decreased by 9.2% on average). This phenomenon may be caused by the large noise of clock offsets in SF PPP solutions, which submerges the biases of RT satellite products, and may also be related to the reasonable setting of multi-frequency signal noise.
4. Conclusions
The SF-UC, SF-IFH, and SF-IWC PPP time and frequency transfer models are established in this contribution. In the MGEX network, the BRUX, CEBR, HERS, ONSA, and SPT0 stations are selected to form four links from 947.7 km to 1331.6 km. The time and frequency transfer performances of Galileo E1, E5a, E5b, E5, and E6 multi-frequency observation SF PPP with RT and post-processing types are analyzed and compared.
The results show that the time and frequency transfer accuracy of SF-UC and SF-IWC is better than that of SF-IFH, and that of SF-UC and SF-IWC is similar. Interestingly, although the short-term frequency stability of the SF-IFH and SF-UC/SF-IWC is significantly different, their long-term frequency stability is close. Furthermore, SF PPP time and transfer performance with E5, E5a, E5b, and E6 signals are improved in comparison with the traditional E1 signal, among which the E5 signal improves the most (mean value of 58%) and the E6 signal improves the least (mean value of 14%), indicating the advantage of multi-frequency signals in timing. We also found that the difference in frequency stability between SF and DF PPP decreases gradually with an increase in the average time, and the frequency stability difference between SF and DF-IF PPP can reach 2 × 10⁻¹⁶ in 120,000 s, which indicates that SF PPP has the potential to achieve DF PPP frequency stability. Hence, SF PPP can also meet the long-time time and frequency transfer requirements, and the SF-IWC model based on the Galileo E5 signal is more recommended.
In addition, it is worth mentioning that to simplify the data-processing process, we set the prior noises of the Galileo multi-frequency signal to the same. If reasonable prior noise can be set for multi-frequency signals and SF PPP ambiguity can be fixed, then the advantages of multi-frequency signals can be further proved, and the results will be more convincing. Hence, in the follow-up research, we will explore the method used to determine the optimal prior noises of Galileo multi-frequency signals, and further study the ambiguity resolution method of SF PPP.
Now, given that the four major GNSSs have received support for multi-frequency signals (especially BDS and Galileo support five-frequency signals), and the demand for SF time and frequency transfer application is gradually increasing, multi-frequency signals will help to improve the robustness and accuracy of SF time and frequency transfer, and provide more choices for time users.
Author Contributions
Conceptualization, W.X.; methodology, C.Y.; software, W.X. and J.C.; validation, W.X., C.Y. and J.C.; formal analysis, W.X.; investigation, W.X.; resources, C.Y.; data curation, J.C.; writing—original draft preparation, J.C.; writing—review and editing, C.Y.; visualization, W.X.; supervision, C.Y.; project administration, C.Y. All authors have read and agreed to the published version of the manuscript.
Funding
This work is supported by the National Natural Science Foundations of China (no. 42030105), the Key Project of Natural Science Research in Universities of Anhui Province (no. KJ2021A0443), the Natural Science Foundation of Anhui Province (no. 2108085QD171), and the Open Research Fund of Coal Industry Engineering Research Center of Collaborative Monitoring of Mining Area’s Environment and Disasters (no. KSXTJC202006).
Data Availability Statement
The Galileo observation data from MGEX networks are available at ftps://gdc.cddis.eosdis.nasa.gov/gps/data/daily/ (accessed on 23 October 2022). The precise orbit and clock products are available at ftps://gdc.cddis.eosdis.nasa.gov/gps/products/mgex/ (accessed on 23 October 2022).
Acknowledgments
We gratefully acknowledge the CNES and IGS for providing precise orbit and clock products and observation datasets used in this study.
Conflicts of Interest
The authors declare no conflict of interest.
References
- Hein, G.W. Status, perspectives and trends of satellite navigation. Satell. Navig. 2020, 1, 22. [Google Scholar] [CrossRef] [PubMed]
- Benedicto, J. Directions 2020: Galileo moves ahead. GPS World 2019, 30, 38–47. [Google Scholar]
- Yang, Y.; Mao, Y.; Sun, B. Basic performance and future developments of BeiDou global navigation satellite system. Satell. Navig. 2020, 1, 1–8. [Google Scholar] [CrossRef]
- Zaminpardaz, S.; Teunissen, P.J.G.; Nadarajah, N. GLONASS CDMA L3 ambiguity resolution and positioning. GPS Solut. 2016, 21, 535–549. [Google Scholar] [CrossRef]
- Montenbruck, O.; Hugentobler, U.; Dach, R.; Steigenberger, P.; Hauschild, A. Apparent clock variations of the Block IIF-1 (SVN62) GPS satellite. GPS Solut. 2012, 16, 303–313. [Google Scholar] [CrossRef]
- Diessongo, T.H.; Schüler, T.; Junker, S. Precise position determination using a Galileo E5 single-frequency receiver. GPS Solut. 2013, 18, 73–83. [Google Scholar] [CrossRef]
- Su, K.; Jin, S.; Jiao, G. Assessment of multi-frequency global navigation satellite system precise point positioning models using GPS, BeiDou, GLONASS, Galileo and QZSS. Meas. Sci. Technol. 2020, 31, 064008. [Google Scholar] [CrossRef]
- Wang, K.; Khodabandeh, A.; Teunissen, P.J.G. Five-frequency Galileo long-baseline ambiguity resolution with multipath mitigation. GPS Solut. 2018, 22, 75. [Google Scholar] [CrossRef]
- Li, X.; Liu, G.; Li, X.; Zhou, F.; Feng, G.; Yuan, Y.; Zhang, K. Galileo PPP rapid ambiguity resolution with five-frequency observations. GPS Solut. 2019, 24, 24. [Google Scholar] [CrossRef]
- Tu, R.; Zhang, P.; Zhang, R.; Liu, J.; Lu, X. Modeling and Assessment of Precise Time Transfer by Using BeiDou Navigation Satellite System Triple-Frequency Signals. Sensors 2018, 18, 1017. [Google Scholar] [CrossRef]
- Su, K.; Jin, S. Triple-frequency carrier phase precise time and frequency transfer models for BDS-3. GPS Solut. 2019, 23, 86. [Google Scholar] [CrossRef]
- Xu, W.; Shen, W.; Cai, C.; Li, L.; Wang, L.; Shen, Z. Modeling and Performance Evaluation of Precise Positioning and Time-Frequency Transfer with Galileo Five-Frequency Observations. Remote Sens. 2021, 13, 2927. [Google Scholar] [CrossRef]
- Zhang, P.; Tu, R.; Gao, Y.; Zhang, R.; Han, J. Performance of Galileo precise time and frequency transfer models using quad-frequency carrier phase observations. GPS Solut. 2020, 24, 40. [Google Scholar] [CrossRef]
- Jin, S.; Su, K. PPP models and performances from single- to quad-frequency BDS observations. Satell. Navig. 2020, 1, 16. [Google Scholar] [CrossRef]
- Ge, Y.; Cao, X.; Shen, F.; Yang, X.; Wang, S. BDS-3/Galileo Time and Frequency Transfer with Quad-Frequency Precise Point Positioning. Remote Sens. 2021, 13, 2704. [Google Scholar] [CrossRef]
- Cai, C.; Gong, Y.; Gao, Y.; Kuang, C. An Approach to Speed up Single-Frequency PPP Convergence with Quad-Constellation GNSS and GIM. Sensors 2017, 17, 1302. [Google Scholar] [CrossRef]
- de Bakker, P.F.; Tiberius, C.C.J.M. Real-time multi-GNSS single-frequency precise point positioning. GPS Solut. 2017, 21, 1791–1803. [Google Scholar] [CrossRef]
- Martínez-Belda, M.C.; Defraigne, P.; Baire, Q.; Aerts, W. Single-frequency time and frequency transfer with Galileo E5. In Proceedings of the 2011 Joint conference of the IEEE international frequency control and the European frequency and time forum (FCS) proceedings, San Francisco, CA, USA, 1–5 May 2011; pp. 1–6. [Google Scholar]
- Hong, J.; Tu, R.; Zhang, R.; Fan, L.; Zhang, P.; Han, J. Contribution analysis of QZSS to single-frequency PPP of GPS/BDS/GLONASS/Galileo. Adv. Space Res. 2020, 65, 1803–1817. [Google Scholar] [CrossRef]
- Hong, J.; Tu, R.; Zhang, R.; Fan, L.; Han, J.; Zhang, P.; Lu, X. Analysis of dual-frequency solution method for single-frequency precise point positioning based on SEID model for GPS and BDS. Measurement 2021, 175, 109102. [Google Scholar] [CrossRef]
- Zhu, S.; Yue, D.; He, L.; Chen, J.; Liu, Z. Comparative analysis of four different single-frequency PPP models on positioning performance and atmosphere delay retrieval. Adv. Space Res. 2021, 67, 3994–4010. [Google Scholar] [CrossRef]
- Shi, C.; Wu, X.; Zheng, F.; Wang, X.; Wang, J. Modeling of BDS-2/BDS-3 single-frequency PPP with B1I and B1C signals and positioning performance analysis. Measurement 2021, 178, 109355. [Google Scholar] [CrossRef]
- Su, K.; Jin, S.; Jiang, J.; Hoque, M.; Yuan, L. Ionospheric VTEC and satellite DCB estimated from single-frequency BDS observations with multi-layer mapping function. GPS Solut. 2021, 25, 68. [Google Scholar] [CrossRef]
- Xiao, X.; Shen, F.; Lu, X.; Shen, P.; Ge, Y. Performance of BDS-2/3, GPS, and Galileo Time Transfer with Real-Time Single-Frequency Precise Point Positioning. Remote Sens. 2021, 13, 4192. [Google Scholar] [CrossRef]
- Zhao, C.; Yuan, Y.; Zhang, B.; Li, M. Ionosphere Sensing with a Low-Cost, Single-Frequency, Multi-GNSS Receiver. IEEE Trans. Geosci. Electron. 2019, 57, 881–892. [Google Scholar] [CrossRef]
- Li, B.; Zang, N.; Ge, H.; Shen, Y. Single-frequency PPP models: Analytical and numerical comparison. J. Geod. 2019, 93, 2499–2514. [Google Scholar] [CrossRef]
- Ge, Y.; Zhou, F.; Dai, P.; Qin, W.; Wang, S.; Yang, X. Precise point positioning time transfer with multi-GNSS single-frequency observations. Measurement 2019, 146, 628–642. [Google Scholar] [CrossRef]
- Zhao, C.; Zhang, B.; Zhang, X. SUPREME: An open-source single-frequency uncombined precise point positioning software. GPS Solut. 2021, 25, 86. [Google Scholar] [CrossRef]
- Wang, S.; Ge, Y.; Meng, X.; Shen, P.; Wang, K.; Ke, F. Modelling and Assessment of Single-Frequency PPP Time Transfer with BDS-3 B1I and B1C Observations. Remote Sens. 2022, 14, 1146. [Google Scholar] [CrossRef]
- Leick, A.; Rapoport, L.; Tatarnikov, D. GPS Satellite Surveying, 4th ed.; John Wiley & Sons: New York, NY, USA, 2015; pp. 1–807. [Google Scholar]
- Bahadur, B.; Nohutcu, M. Comparative analysis of MGEX products for post-processing multi-GNSS PPP. Measurement 2019, 145, 361–369. [Google Scholar] [CrossRef]
- Zhou, F.; Dong, D.; Li, W.; Jiang, X.; Wickert, J.; Schuh, H. GAMP: An open-source software of multi-GNSS precise point positioning using undifferenced and uncombined observations. GPS Solut. 2018, 22, 33. [Google Scholar] [CrossRef]
- Carlin, L.; Hauschild, A.; Montenbruck, O. Precise point positioning with GPS and Galileo broadcast ephemerides. GPS Solut. 2021, 25, 77. [Google Scholar] [CrossRef]
- Zhang, B.; Teunissen, P.J.G.; Yuan, Y.; Zhang, H.; Li, M. Joint estimation of vertical total electron content (VTEC) and satellite differential code biases (SDCBs) using low-cost receivers. J. Geod. 2017, 92, 401–413. [Google Scholar] [CrossRef]
- Ning, Y.; Han, H.; Zhang, L. Single-frequency precise point positioning enhanced with multi-GNSS observations and global ionosphere maps. Meas. Sci. Technol. 2019, 30, 015013. [Google Scholar] [CrossRef]
- Hernández-Pajares, M.; Juan, J.M.; Sanz, J.; Orus, R.; Garcia-Rigo, A.; Feltens, J.; Komjathy, A.; Schaer, S.C.; Krankowski, A. The IGS VTEC maps: A reliable source of ionospheric information since 1998. J. Geod. 2009, 83, 263–275. [Google Scholar] [CrossRef]
- Zhang, L.; Yao, Y.; Peng, W.; Shan, L.; He, Y.; Kong, J. Real-Time Global Ionospheric Map and Its Application in Single-Frequency Positioning. Sensors 2019, 19, 1138. [Google Scholar] [CrossRef]
- Shen, H.; Li, S.; Li, L.; Zhang, W.; Tian, Y.; Hao, W.; Li, R. Evaluation of ionospheric-constrained single-frequency PPP enhanced with an improved stochastic model. Earth Sci. Inform. 2022, 15, 1671–1681. [Google Scholar] [CrossRef]
- Wanninger, L.; Beer, S. BeiDou satellite-induced code pseudorange variations: Diagnosis and therapy. GPS Solut. 2015, 19, 639–648. [Google Scholar] [CrossRef]
- Chen, J.; Yue, D.; Zhu, S.; Chen, H.; Liu, Z.; Zhao, X. Correction model of BDS satellite-induced code bias and its impact on precise point positioning. Adv. Space Res. 2019, 63, 2155–2163. [Google Scholar] [CrossRef]
- Nie, Z.; Yang, H.; Zhou, P.; Gao, Y.; Wang, Z. Quality assessment of CNES real-time ionospheric products. GPS Solut. 2019, 23, 1–15. [Google Scholar] [CrossRef]
- Wang, A.; Chen, J.; Zhang, Y.; Meng, L.; Wang, B.; Wang, J. Evaluating the impact of CNES real-time ionospheric products on multi-GNSS single-frequency positioning using the IGS real-time service. Adv. Space Res. 2020, 66, 2516–2527. [Google Scholar] [CrossRef]
- Liu, Q.; Hernández-Pajares, M.; Yang, H.; Monte-Moreno, E.; Roma-Dollase, D.; García-Rigo, A.; Li, Z.; Wang, N.; Laurichesse, D.; Blot, A.; et al. The cooperative IGS RT-GIMs: A reliable estimation of the global ionospheric electron content distribution in real time. Earth Syst. Sci. Data. 2021, 13, 4567–4582. [Google Scholar] [CrossRef]
- Wang, N.; Yuan, Y.; Li, Z.; Montenbruck, O.; Tan, B. Determination of differential code biases with multi-GNSS observations. J. Geod. 2016, 90, 209–228. [Google Scholar] [CrossRef]
- Petit, G.; Luzum, B. IERS Conventions (2010); Technical Report; Verlag des Bundesamts für Kartographie und Geodäsie: Frankfurtam Main, France, 2010. [Google Scholar]
- Kouba, J. A Guide to Using International GNSS Service (IGS) Products; Jet Propulsion Laboratory: Pasadena, CA, USA, 2009. [Google Scholar]
- Wu, J.-T.; Wu, S.C.; Hajj, G.A.; Bertiger, W.I.; Lichten, S.M. Effects of antenna orientation on GPS carrier phase. In Proceedings of the Astrodynamics 1991, San Diego, CA, USA, 19–22 August 1991; pp. 1647–1660. [Google Scholar]
- Yuan, Y.; Huo, X.; Ou, J.; Zhang, K.; Chai, Y.; Wen, D.; Grenfell, R. Refining the Klobuchar ionospheric coefficients based on GPS observations. IEEE Trans. Mil. Electron. 2008, 44, 1498–1510. [Google Scholar] [CrossRef]
- Böhm, J.; Niell, A.; Tregoning, P.; Schuh, H. Global Mapping Function (GMF): A new empirical mapping function based on numerical weather model data. Geophys. Res. Lett. 2006, 33, 3–6. [Google Scholar] [CrossRef]
- Petit, G. The TAIPPP pilot experiment. In Proceedings of the 2009 IEEE International Frequency Control Symposium Joint with the 22nd European Frequency and Time forum, Besançon, France, 20–24 April 2009; pp. 116–119. [Google Scholar]
- Lv, D.; Zeng, F.; Han, Y.; Ouyang, X. BDS PPP ambiguity resolution and its application on time and frequency transfer. In China Satellite Navigation Conference; Springer: Singapore, 2020; pp. 573–585. [Google Scholar]
- Allan, D.W.; Weiss, M.A. Accurate time and frequency transfer during common-view of a GPS satellite. In Proceedings of the 1980 IEEE Frequency Control Symp, Philadelphia, PA, USA, 28–30 May 1980; pp. 334–346. [Google Scholar]
- Weinbach, U.; Schön, S. GNSS receiver clock modeling when using high-precision oscillators and its impact on PPP. Adv. Space Res. 2011, 47, 229–238. [Google Scholar] [CrossRef]
- Bartoccini, U.; Barchi, G.; Nunzi, E. Methods and tools for frequency jump detection. In Proceedings of the 2009 IEEE International Workshop on Advanced Methods for Uncertainty Estimation in Measurement, Bucharest, Romania, 6–7 July 2009; pp. 109–112. [Google Scholar]
Publisher’s Note: MDPI stays neutral with regard to jurisdictional claims in published maps and institutional affiliations. |
© 2022 by the authors. Licensee MDPI, Basel, Switzerland. This article is an open access article distributed under the terms and conditions of the Creative Commons Attribution (CC BY) license (https://creativecommons.org/licenses/by/4.0/).

