Article

Spatio-Temporal Changes, Trade-Offs and Synergies of Major Ecosystem Services in the Three-River Headwaters Region from 2000 to 2019

1
Academy of Agriculture and Forestry Sciences, Qinghai University, Xining 810016, China
2
The Institute of Geographical Sciences and Natural Resources Research, Chinese Academy of Sciences, Beijing 100101, China
3
University of Chinese Academy of Sciences, Beijing 100049, China
*
Author to whom correspondence should be addressed.
Remote Sens. 2022, 14(21), 5349; https://doi.org/10.3390/rs14215349
Submission received: 18 August 2022 / Revised: 18 October 2022 / Accepted: 19 October 2022 / Published: 25 October 2022

Abstract

:
The Three-River Headwaters Region (TRHR) is an important part of the ecological barrier of the Qinghai–Tibet Plateau. Understanding the TRHR’s major ecosystem service trade-offs and synergies is important for scientifically integrating and optimizing ecosystem services. We studied the spatial–temporal changes, trade-offs and synergies of the TRHR’s water retention (WR), soil retention (SR), windbreak and sand fixation (WD) and forage supply (FS) services from 2000 to 2019. The results showed that: (1) The TRHR’s WR, SR and FS services gradually decreased from east to west in space, and showed an increasing trend between years; the WD service gradually decreased from west to east in space, and showed a downward trend between years. (2) The synergistic relationship was the dominant relationship between the TRHR’s grassland regulation and provision services. Future research on ecosystem service trade-offs and synergies should consider both the type of ecosystem services and the ecosystem’s multifunctionality. (3) The improvement of the TRHR’s ecosystem services in the future needs to focus on improving the fraction vegetation coverage (FVC) through ecological engineering measures in Maduo, and other areas near the 400 mm precipitation line, and enhancing the synergy of ecosystem services. (4) The restoration of TRHR FVC needs to consider the difference in natural endowments. It is recommended to adopt near-natural restoration in the northwest of the TRHR, and avoid setting too high restoration targets. Planting high-quality pastures in the southeast of the TRHR with good water and heat conditions and rationally allocating grassland ecological and production functions are recommended measures. (5) The TRHR’s grassland should give priority to the development of the ecological functions of natural grasslands, and then give full play to its production functions. Overgrazing is strictly prohibited, so as to avoid the “over-transformation” of ecosystem regulation services to supply services.

Graphical Abstract

1. Introduction

Ecosystem services are the tangible or intangible benefits that humans obtain from ecosystems [1,2,3,4,5,6,7]. These benefits are the basis for the survival and development of human society, including supply, regulation, support and culture services. These services do not exist in isolation, but are related to each other, manifesting as a synergistic relationship of mutual gain and a trade-off relationship [8,9,10]. The analysis of ecosystem service trade-offs and synergies has become an important basis for ecological management decision-making and regulation in recent years [11,12,13,14]. Studies have shown that there is often a trade-off relationship between supply and regulation services [15]. For example, if the coverage of forest and grass is high, regulation services and carbon storage services will be high, while food supply services will be low [16,17,18]. There is also a trade-off between the two regulating services [19,20], for example, afforestation can control soil erosion, but the enhancement of forest evapotranspiration will lose water production [21]. Bennet et al. [15] believe that the complex relationships between ecosystem services are mainly due to the fact that multiple ecosystem services are driven by common influencing factors and the inherent interaction between ecosystem services. Different climatic conditions and human activity disturbances will change the patterns, processes, and functions of ecosystems and lead to great changes in ecosystem services and their trade-offs and synergies, affecting and changing the provision of ecosystem services [7,22]. For example, NPP and soil conservation services showed a trade-off relationship in the upper reaches of the Han River where the climate was humid [23], but they showed a synergistic relationship in the Loess Plateau or arid regions such as Xinjiang [16,17,24], and their spatial differences could be roughly analyzed using the constraint threshold [25]; that is, the places with high NPP had a higher level of vegetation coverage, so had an inhibitory effect on soil erosion caused by precipitation in the area, so the soil conservation and NPP had a synergistic relationship. On the other hand, the places with high NPP had abundant precipitation, and when precipitation increases, the corresponding soil erosion increases, so the NPP and soil conservation had a trade-off relationship. The trade-offs and synergies of the same ecosystem services had also changed under different land use types [23]. Relevant studies have shown that returning farmland to forests and grasslands in China has increased regulatory services, resulting in a reduction in farmland, which may exacerbate the trade-off relationship between food production and ecological protection [26]. Overall, ecosystem service trade-offs and synergies are characterized by spatial heterogeneity and temporal dynamics, and are scale-dependent [27]. Research shows uncertainty regarding the influence of climate, land use, social preferences, incentive policies and other factors [28,29,30]. Clarifying the temporal and spatial characteristics of the trade-offs and synergies between ecosystem services is of great significance for promoting the optimal overall benefit of various regional ecosystem services and achieving a “win–win” between regional economic development and ecological environmental protection [31,32,33]. Therefore, it is necessary to scientifically integrate and optimize ecosystem services through the study of trade-offs and synergies between multiple ecosystem services for specific regions [7]. The quantitative research methods to identify the relationships between ecosystem services can be mainly divided into four types: the statistical description method, the spatial statistical mapping method, the scenario analysis method, and the model simulation method [23]. The statistical description method is widely used because non-spatial data such as aggregated data, average data, or discrete sample data are used to analyze the correlation between various ecosystem services with the help of mathematical statistics [34,35,36,37].
Located in the hinterland of the Qinghai–Tibet Plateau, the TRHR is known as the “Chinese Water Tower” [38,39]. It is the development base of grassland animal husbandry in China and the alpine biodiversity resource treasury [40,41,42]. Its widely distributed glaciers, snow, permafrost and various types of ecosystems such as alpine swamp wetlands, alpine grasslands and alpine grasslands provide continuous and stable services such as WR, SR, WD, and FS for the region and surrounding areas. For a long time, the TRHR has faced the severe challenge of building a strong ecological security barrier and realizing a virtuous circle of ecological and production development. Under the Sustainable Development Goals, nearly 20 years after the implementation of the first and second phases of the ecological protection and construction of TRHR [39,43], what are the spatial–temporal variation characteristics of the major ecosystem services of the TRHR? What are the relationships between the major ecosystem services? What are the major factors affecting ecosystem services and their relationships in the TRHR? How can we rationally allocate various ecosystem services in a space? How can we implement ecological engineering measures aimed at improving ecosystem services in a spatially differentiated manner? To this end, this paper firstly used the precipitation storage method, RUSLE, RWEQ and Gill to model the TRHR’s WR, SR, WD, and GY services from 2000 to 2019. Then, the spatial–temporal variation characteristics of these ecosystem services were studied using Sen and MK methods, and the correlation coefficient method was used to quantify the trade-offs and synergies among major ecosystem services. Finally, the dominance analysis method was used to study the spatial distribution characteristics of the dominant influencing factors of major ecosystem services such as precipitation, temperature, FVC and wind speed, combined with the main characteristics of the ecosystem service trade-offs and synergies, to discuss spatial differences in regulation and provision service enhancement measures. It is expected that this study will provide scientific support for the formulation of policies for the management and protection of the TRHR’s ecosystem and the rolling implementation of ecological projects.

2. Materials and Methods

2.1. Study Area

The TRHR is located in the alpine zone on the northeastern edge of the Qinghai–Tibet Plateau, accounting for 14.11% of the total land area of the Qinghai–Tibet Plateau [44] (Figure 1). The TRHR is dominated by glaciers, ice margins, mountains, highland plains and hills, with an altitude of 2600–6584 m. The terrain is high in the west and low in the east. The East Kunlun Mountain and its branches, Animaqing Mountain, Bayan Har Mountain and Tanggula Mountain, constitute the main skeleton of the TRHR’s topography. The climate of TRHR is a typical plateau continental climate, with sufficient light and strong sunshine; a cold winter and cool summer; a short warm season and a long cold season; little rainfall; rain and heat in the same period; and distinct wet and dry seasons. There are various types of natural vegetation. The vegetation is mainly shrubs, alpine meadows, alpine grasslands and alpine vegetation. The grassland ecosystem is the main ecosystem in the TRHR, accounting for about 69.70% of the total area of the region [45]. The grassland types of the TRHR appear in sequence from southeast to northwest, including alpine meadows, temperate grasslands, alpine grasslands, and alpine deserts, and their productivity decreases in turn [46,47].
Since the 1970s, due to the combined influence of climate change and human activities, the TRHR ecosystems have undergone extensive and continuous degradation [38,48], resulting in increasingly serious water and soil erosion in the basin and reduced water production at the source, directly threatening the ecological security of the Yangtze River, Yellow River and Lancang River [40], and also affecting the performance of various ecosystem services such as WR and FS. To curb the deterioration of the ecological environment and consolidate the achievements of ecological protection and construction, the Chinese government approved and implemented the TRHR’s ecological protection and construction project Phase I and II (TRHREPCP) in 2005 and 2014 [39,40,42,48]. Relevant studies have shown that, benefiting from climate warming and humidification and the effective implementation of TRHREPCP in the past 20 years [39,49,50], the TRHR’s grassland degradation trend has been significantly slowed down, the quality of the ecological environment has improved.

2.2. Data and Processing

2.2.1. Meteorological Data

The meteorological data came from the “China Surface Climate Data Daily Value Data Set (V3.0)” of the China Meteorological Data Network (http://data.cma.cn, accessed on 16 May 2020), which contains information on daily pressure, temperature, precipitation, wind direction, wind speed and sunshine hours from nearly 700 weather stations in China, dating back to January 1951. In this study, the ANUSPLIN method based on slice spline theory [51,52,53,54] was used to spatially interpolate the temperature and precipitation at the site, and the Kriging interpolation method was used to spatially interpolate the wind speed at the site.

2.2.2. Fraction Vegetation Coverage

Fraction vegetation coverage (FVC) was calculated from the normalized difference vegetation index (NDVI) data. NDVI data were derived from MOD13A2 v006 product (https://ladsweb.modaps.eosdis.nasa.gov/missions-and-measurements/science-domain/vegetation-indices/, accessed on 20 June 2021), the spatial resolution was 1000 m, the temporal resolution was 16 days, and the Savitzky–Golay (S-G) method of the TIMESAT V3.3 software was used for smoothing filtering to improve the smoothness of the NDVI data. The dichotomous pixel method was used to calculate the FVC of each pixel [55]. For the frequency accumulation table of each NDVI image, the NDVI value corresponding to the frequency of 5% was taken as the NDVI value of pure bare soil, and the NDVI value of the cumulative frequency of 95% was taken as the NDVI value of pure vegetation pixels. At the same time, in order to exclude the influence of outliers on subsequent calculations, the pixels with vegetation coverage less than 0 and greater than 1 were assigned as null value.

2.2.3. Hydrological Monitoring Data

The hydrological monitoring data came from the hydrological data yearbook of the Institute of Geographical Sciences and Natural Resources Research, Chinese Academy of Sciences, including the measured runoff and sediment transport data from the Jimai and Tangnaihai stations in the headwater of the Yellow River, and the Tuotuohe and Zhimenda stations in the headwater of the Yangtze River, from 2000 to 2019. The spatial location and catchment area of each hydrological station are shown in the following table (Table 1).

2.2.4. Other Data

Vegetation Net Primary Productivity (NPP) data came from MOD17A3HGF v006 product (https://lpdaac.usgs.gov/products/mod17a3hgfv006/, accessed on 28 June 2021), with a spatial resolution of 500 m and a temporal resolution of 1 year. The soil data came from the 1:1 million soil and vegetation type dataset of the National Academy of Sciences of China.

2.3. Total Research Approach

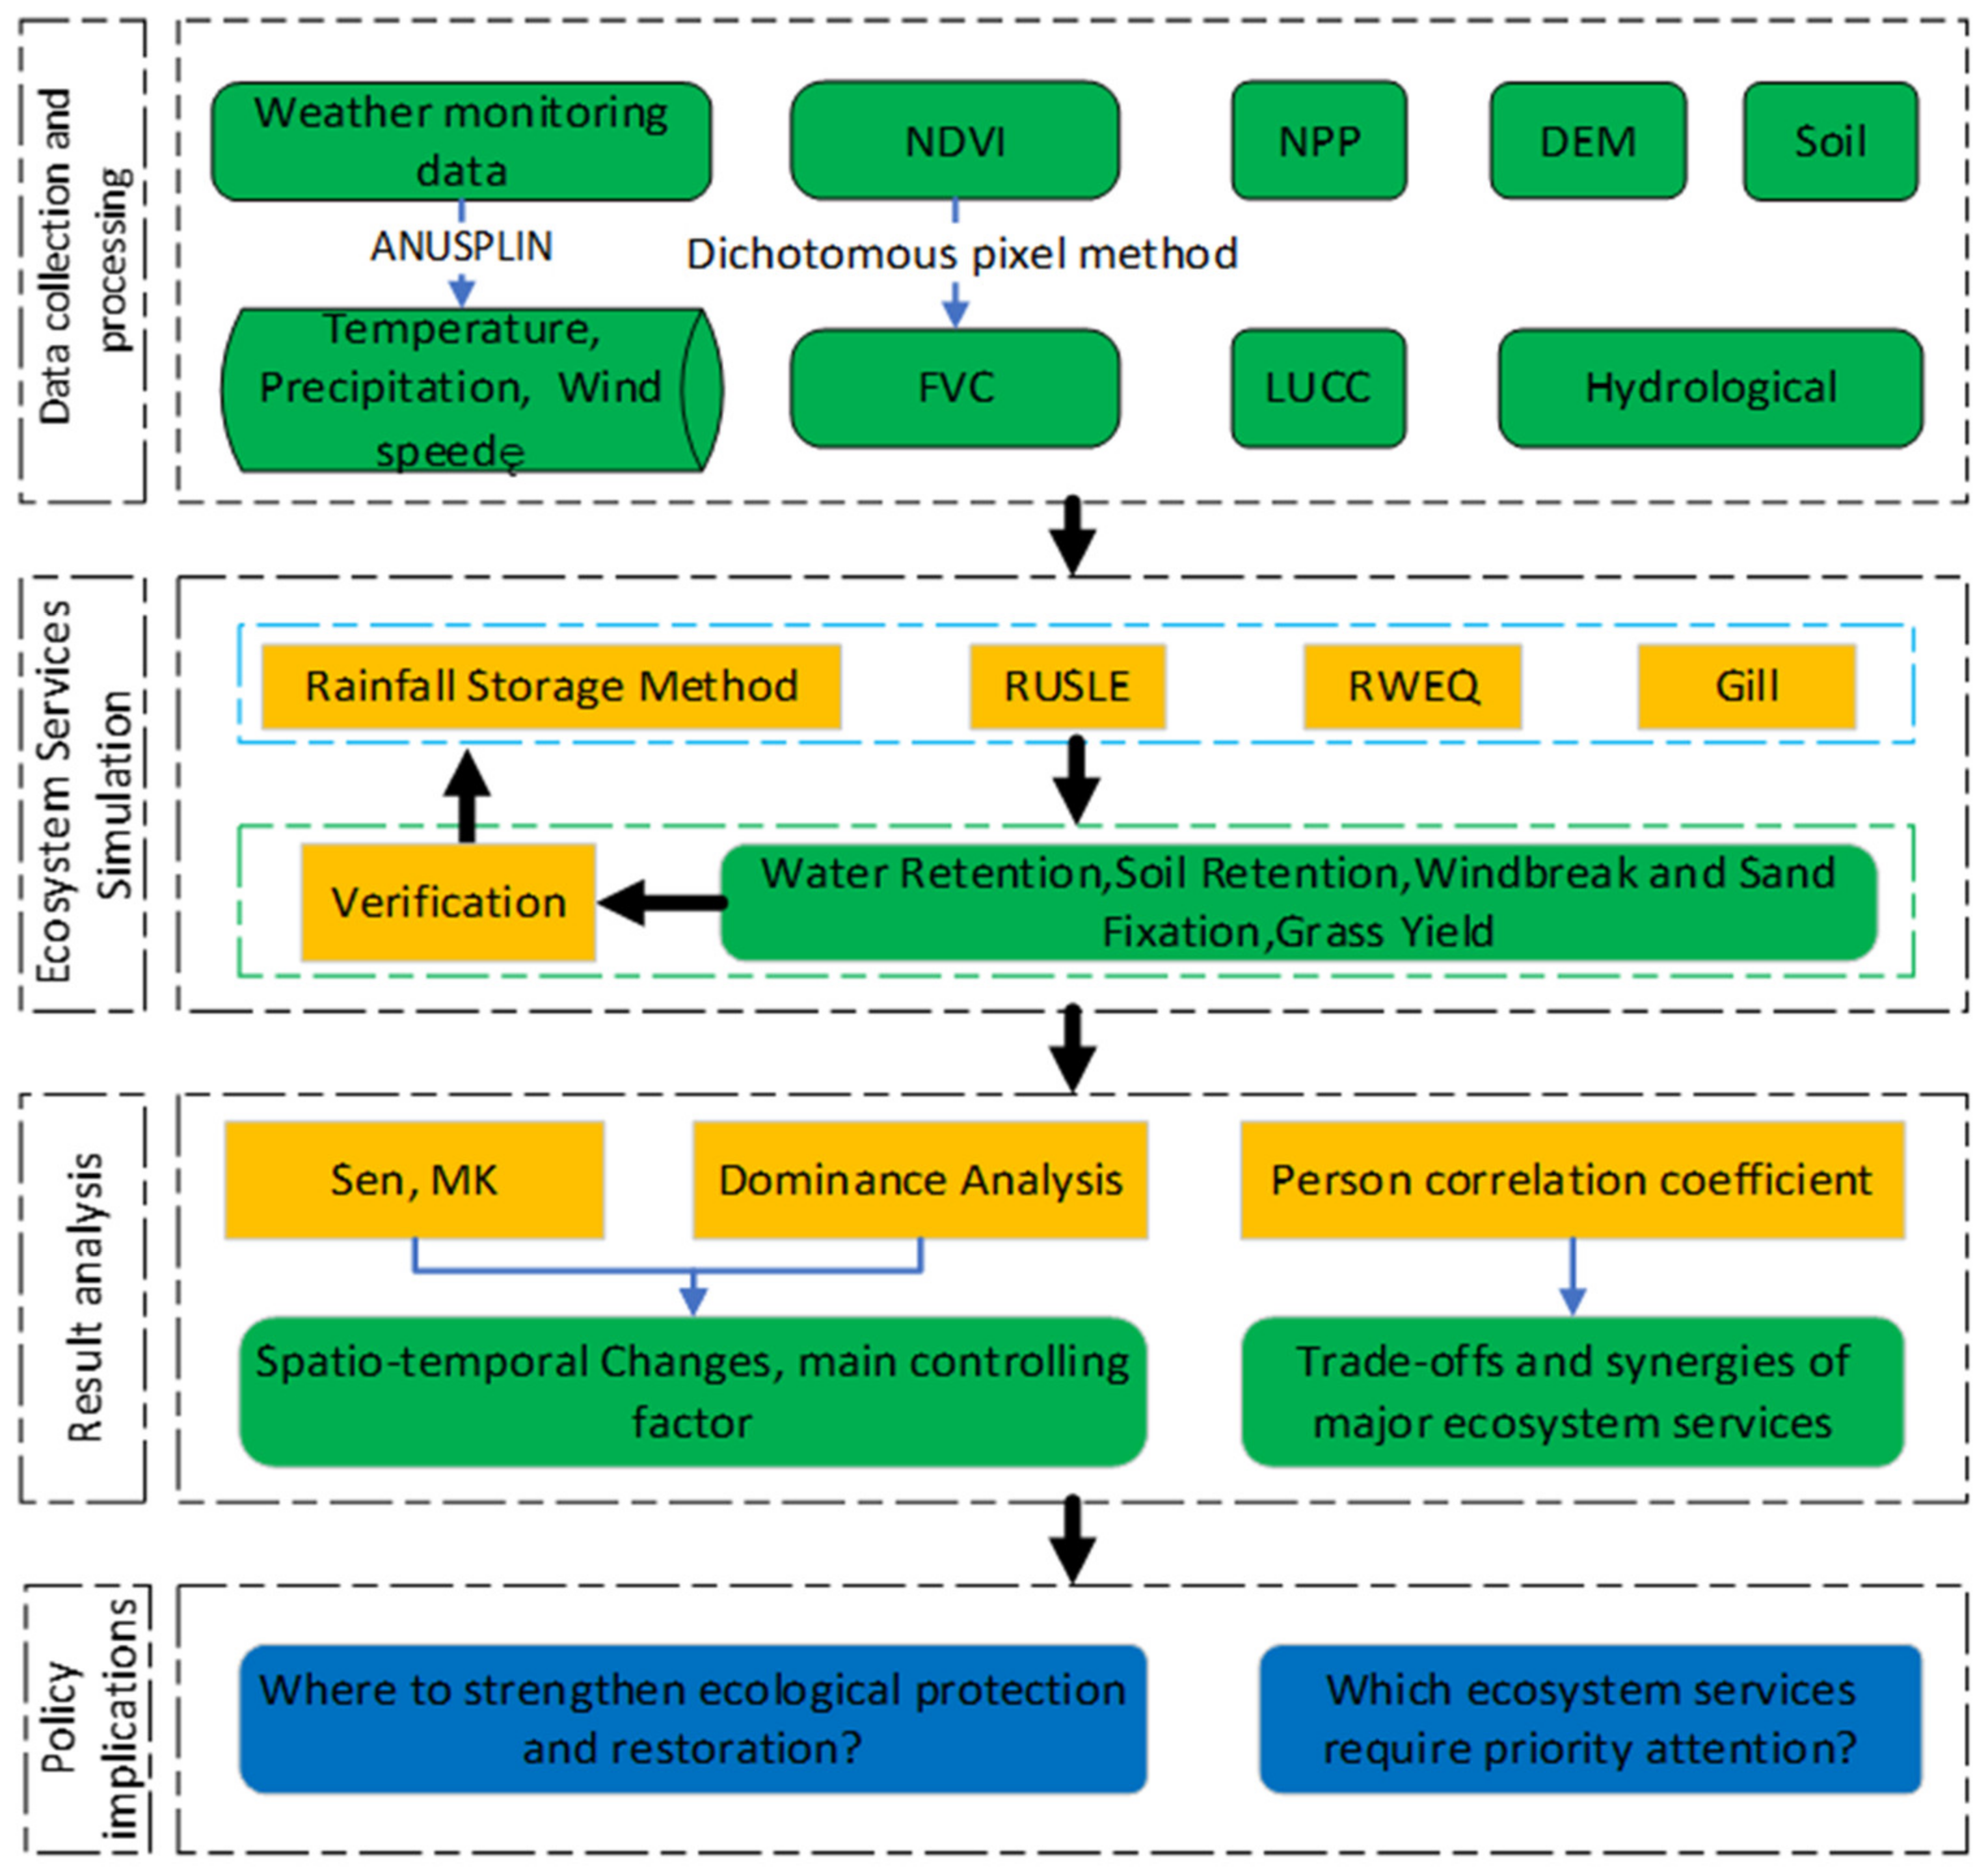
The specific steps of the research plan are as follows: (1) Data collection and processing: Meteorological, hydrological, DEM, NDVI, NPP and soil data were collected, and spatial interpolation and FVC were performed. (2) The precipitation storage method, RUSLE, RWEQ and Gill methods were used to simulate WR, SR, WD and GY of the TRHR from 2000 to 2019. (3) Sen and MK methods were used to study the spatial–temporal variation characteristics of the ecosystems services. (4) The dominance analysis method was used to study the spatial distribution characteristics of the dominant influencing factors of major ecosystem services, such as precipitation, air temperature, vegetation coverage and wind speed. (5) The correlation coefficient method was used to quantify the trade-offs and synergies between ecosystem services. (6) Based on the trade-offs and synergies between ecosystem services, and combined with the spatial distribution characteristics of the dominant influencing factors, we discussed the spatial differences in regulation and provision service enhancement measures (Figure 2).

2.4. Ecosystem Services Accounting Method

2.4.1. Water Retention

WR refers to the magnitude of runoff, flood, and aquifer recharge influenced by changes in the ecosystem. We estimated WR using the rainfall storage method (RSM) [35,56], which considers the hydrological regulation effect of ecosystems, including forest, grassland, and cropland, compared with bare land. RSM can be expressed as follows:
Q = A × J × R
J = J 0 × K
R = R 0 R g
where Q is water retention (m3); A is the area of the ecosystem (hm2); J is the annual runoff rainfall (mm); J0 is the annual average rainfall (mm); K is the ratio of rainfall yielding runoff to total rainfall, which is determined by precipitation and raininess; R is the benefit coefficient of the ecosystem reducing runoff compared with bare land; and R0 and Rg are the runoff yield rates of bare land and the ecosystem, respectively. K, R, R0 and Rg are dimensionless parameters.
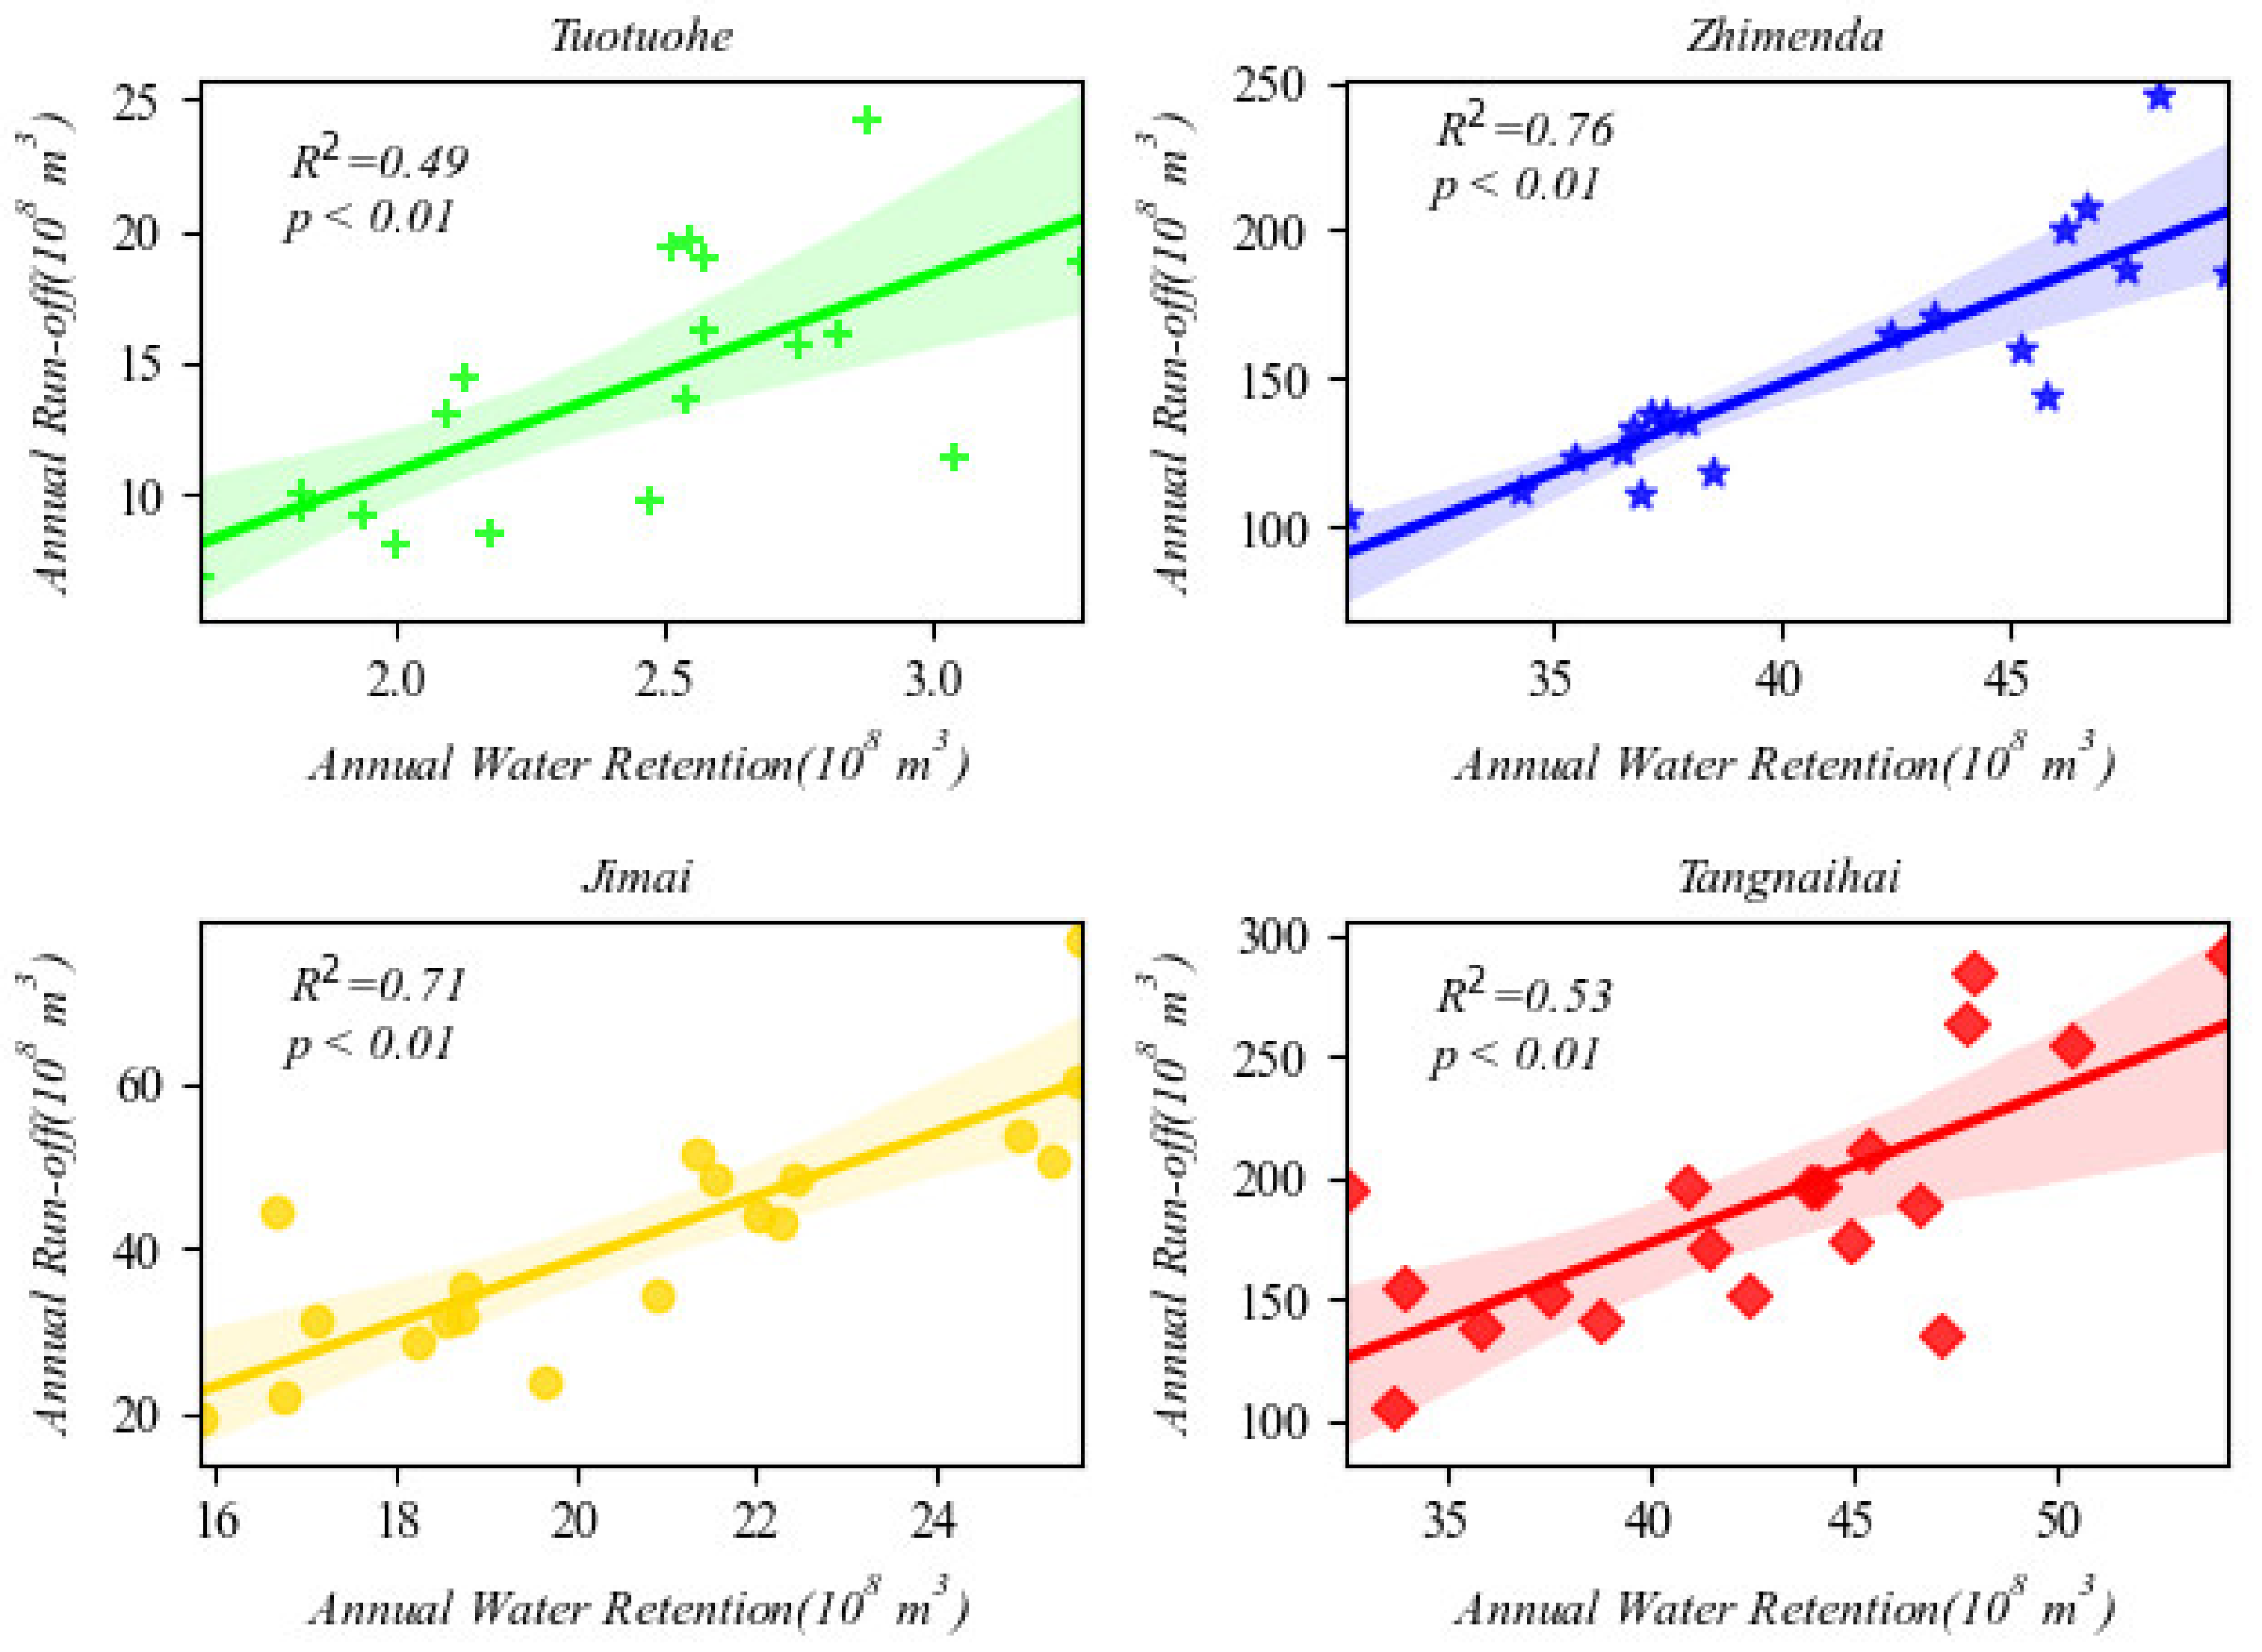
The water retention and runoff within the catchment area of a hydrological station are affected by precipitation at the same time, and the river runoff data can be used to verify the water retention in the catchment area. Using the total annual runoff data of the four hydrological stations of Tuotuohe, Zhimenda, Jimai and Tangnaihai, the simulation results of the annual water retention capacity within the catchment area of each hydrological station in the same period were verified. The results showed that the R2 of the annual runoff of the four hydrological stations and the annual water retention of the catchment area all exceeded 0.49 (p < 0.01), showing a good correlation (Figure 3).

2.4.2. Soil Retention

The ecosystem soil retention service represents the difference between the potential soil erosion under bare-soil conditions and the soil erosion that occurs under the true vegetation conditions [40,57,58]. It is calculated as follows:
S K = S K q S K r
S K q = A q × M
S K r = A r × M
where S K is ecosystem soil retention (t/a); S K q is the potential soil erosion without vegetation cover (t/a); S K r is the soil erosion under the real vegetation cover (t/a); A q is the potential soil erosion modulus without vegetation cover (t/hm2/a); A r is the soil erosion modulus under real vegetation cover (t/hm2/a); and M is the area of the study area (hm2). In this study, we used the revised universal soil loss equation (RUSLE) [59,60] to estimate the soil erosion modulus:
A = R × K × L × S × C × P
where A is the soil erosion modulus (t/hm2/a); R is the rainfall erodibility factor (MJ·mm·hm−2·h−1·a−1); K is the soil erodibility factor (t·h·MJ−1·mm−1); LS is the slope length and slope factor; C is the vegetation coverage factor; P is the soil and water retention measure factor; and LS, C and P are dimensionless parameters.
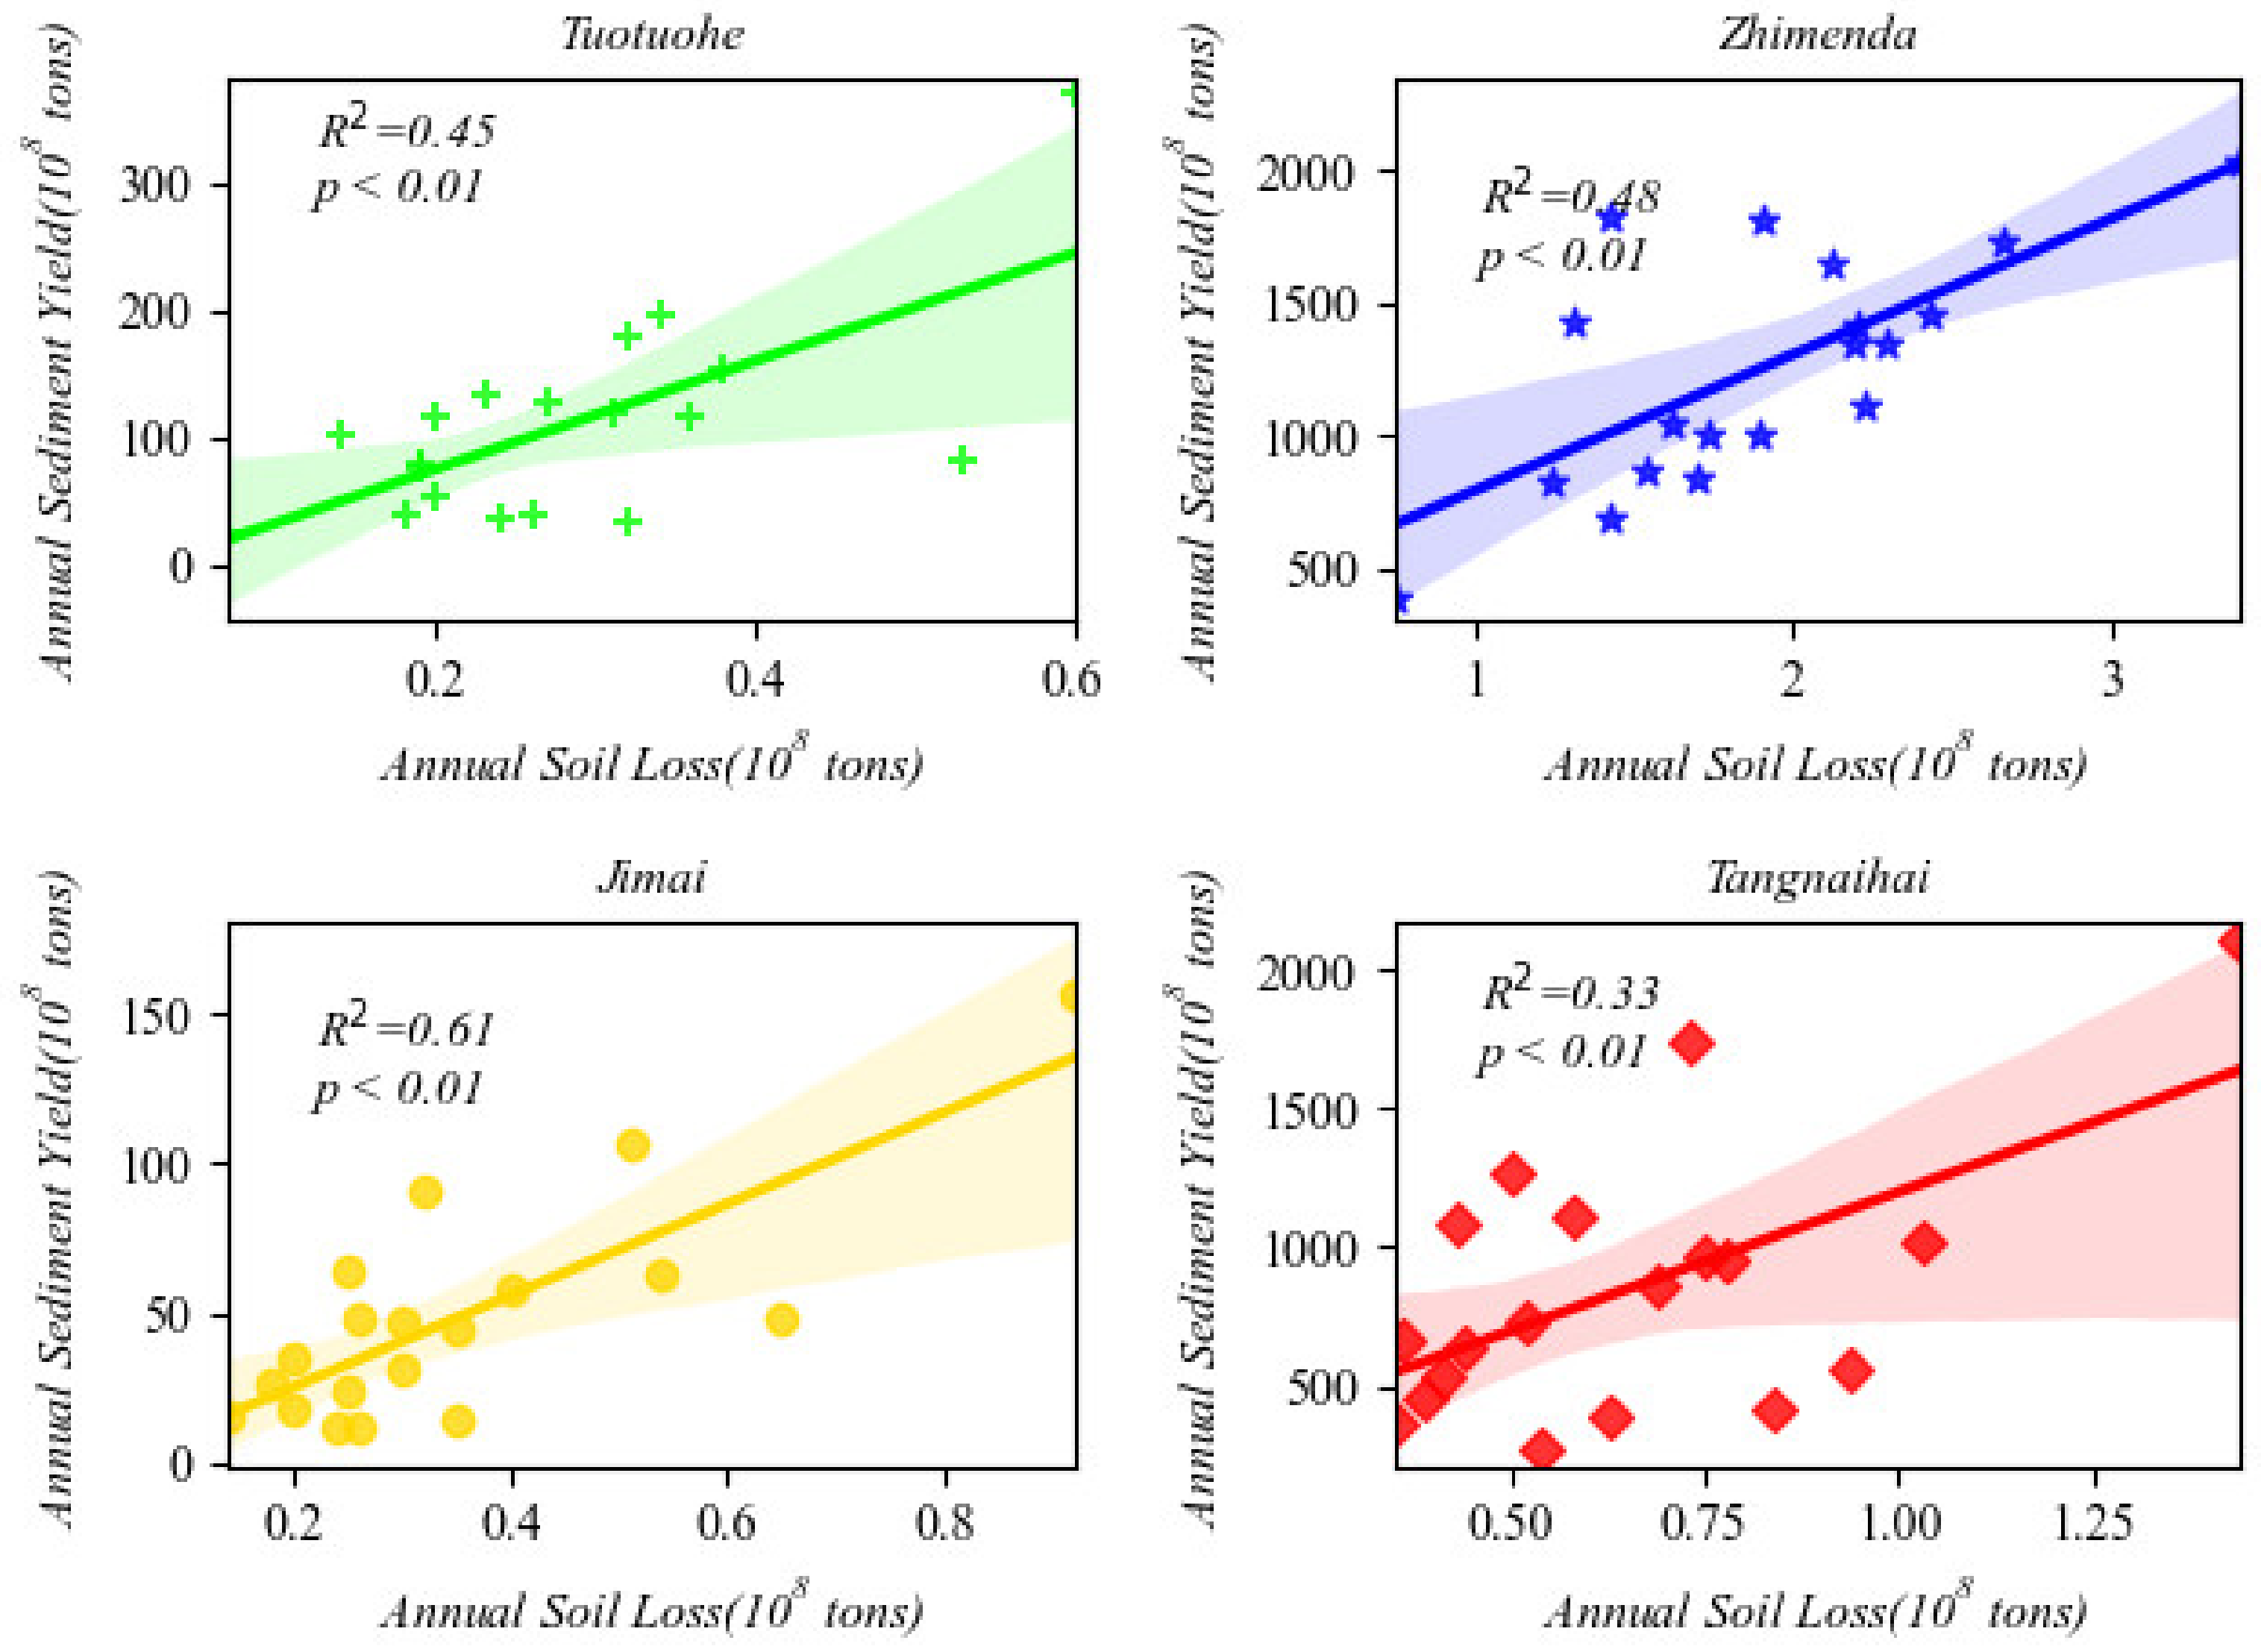
According to the sediment concentration monitoring data recorded at the four hydrological stations of Tuotuohe, Zhimenda, Jimai and Tangnaihai, we verified the simulation results derived using RUSLE. The results showed that, except for Tangnaihai Station, the R2 of three hydrological stations exceeded 0.30 (p < 0.01), which had a good correlation (Figure 4). The R2 of Tangnaihai Station is 0.33 (p < 0.01), because some reaches of the Yellow River are not in the TRHR.

2.4.3. Windbreak and Sand Fixation

The windbreak and sand fixation magnitudes in an ecosystem represent the difference between the potential wind erosion that would occur under bare soil conditions and the actual wind erosion that occurs under the real vegetation conditions [61]. This is calculated as follows:
F S = F S s F S v
F S s = S L s × M
F S v = S L v × M
where FS is the windbreak and sand fixation amount of the ecosystem (t/a); F S s is the soil wind erosion amount under the bare soil condition (t/a); F S v is the actual wind erosion amount that occurs under real vegetation conditions (t/a); S L s is the soil wind erosion modulus under the bare soil condition (t/hm2/a); S L v is the actual wind erosion amount that occurs under the real vegetation conditions (t/hm2/a); and M is the area of the study area (hm2). We used the modified revised wind erosion equation (RWEQ) [62] to estimate the wind erosion modulus in the Upper Yellow River as follows:
S L = Q m a x 1 e X S 2 X
Q m a x = 109.8   W F × E F × S C F × K × C O G
S = 150.71   W F × E F × S C F × K × C O G 0.3711
where SL is the soil wind erosion modulus (kg·m−2); X is the block length (m); Qmax is the maximum sand transport capacity of wind (kg·m−1); S is the length of the key block (m); WF is the meteorological factor (kg·m−1); EF is the soil erodibility factor; SCF is the soil crust factor; K′ is the soil roughness factor; COG is a comprehensive vegetation factor; and EF, SCF, K′ and COG are dimensionless parameters.
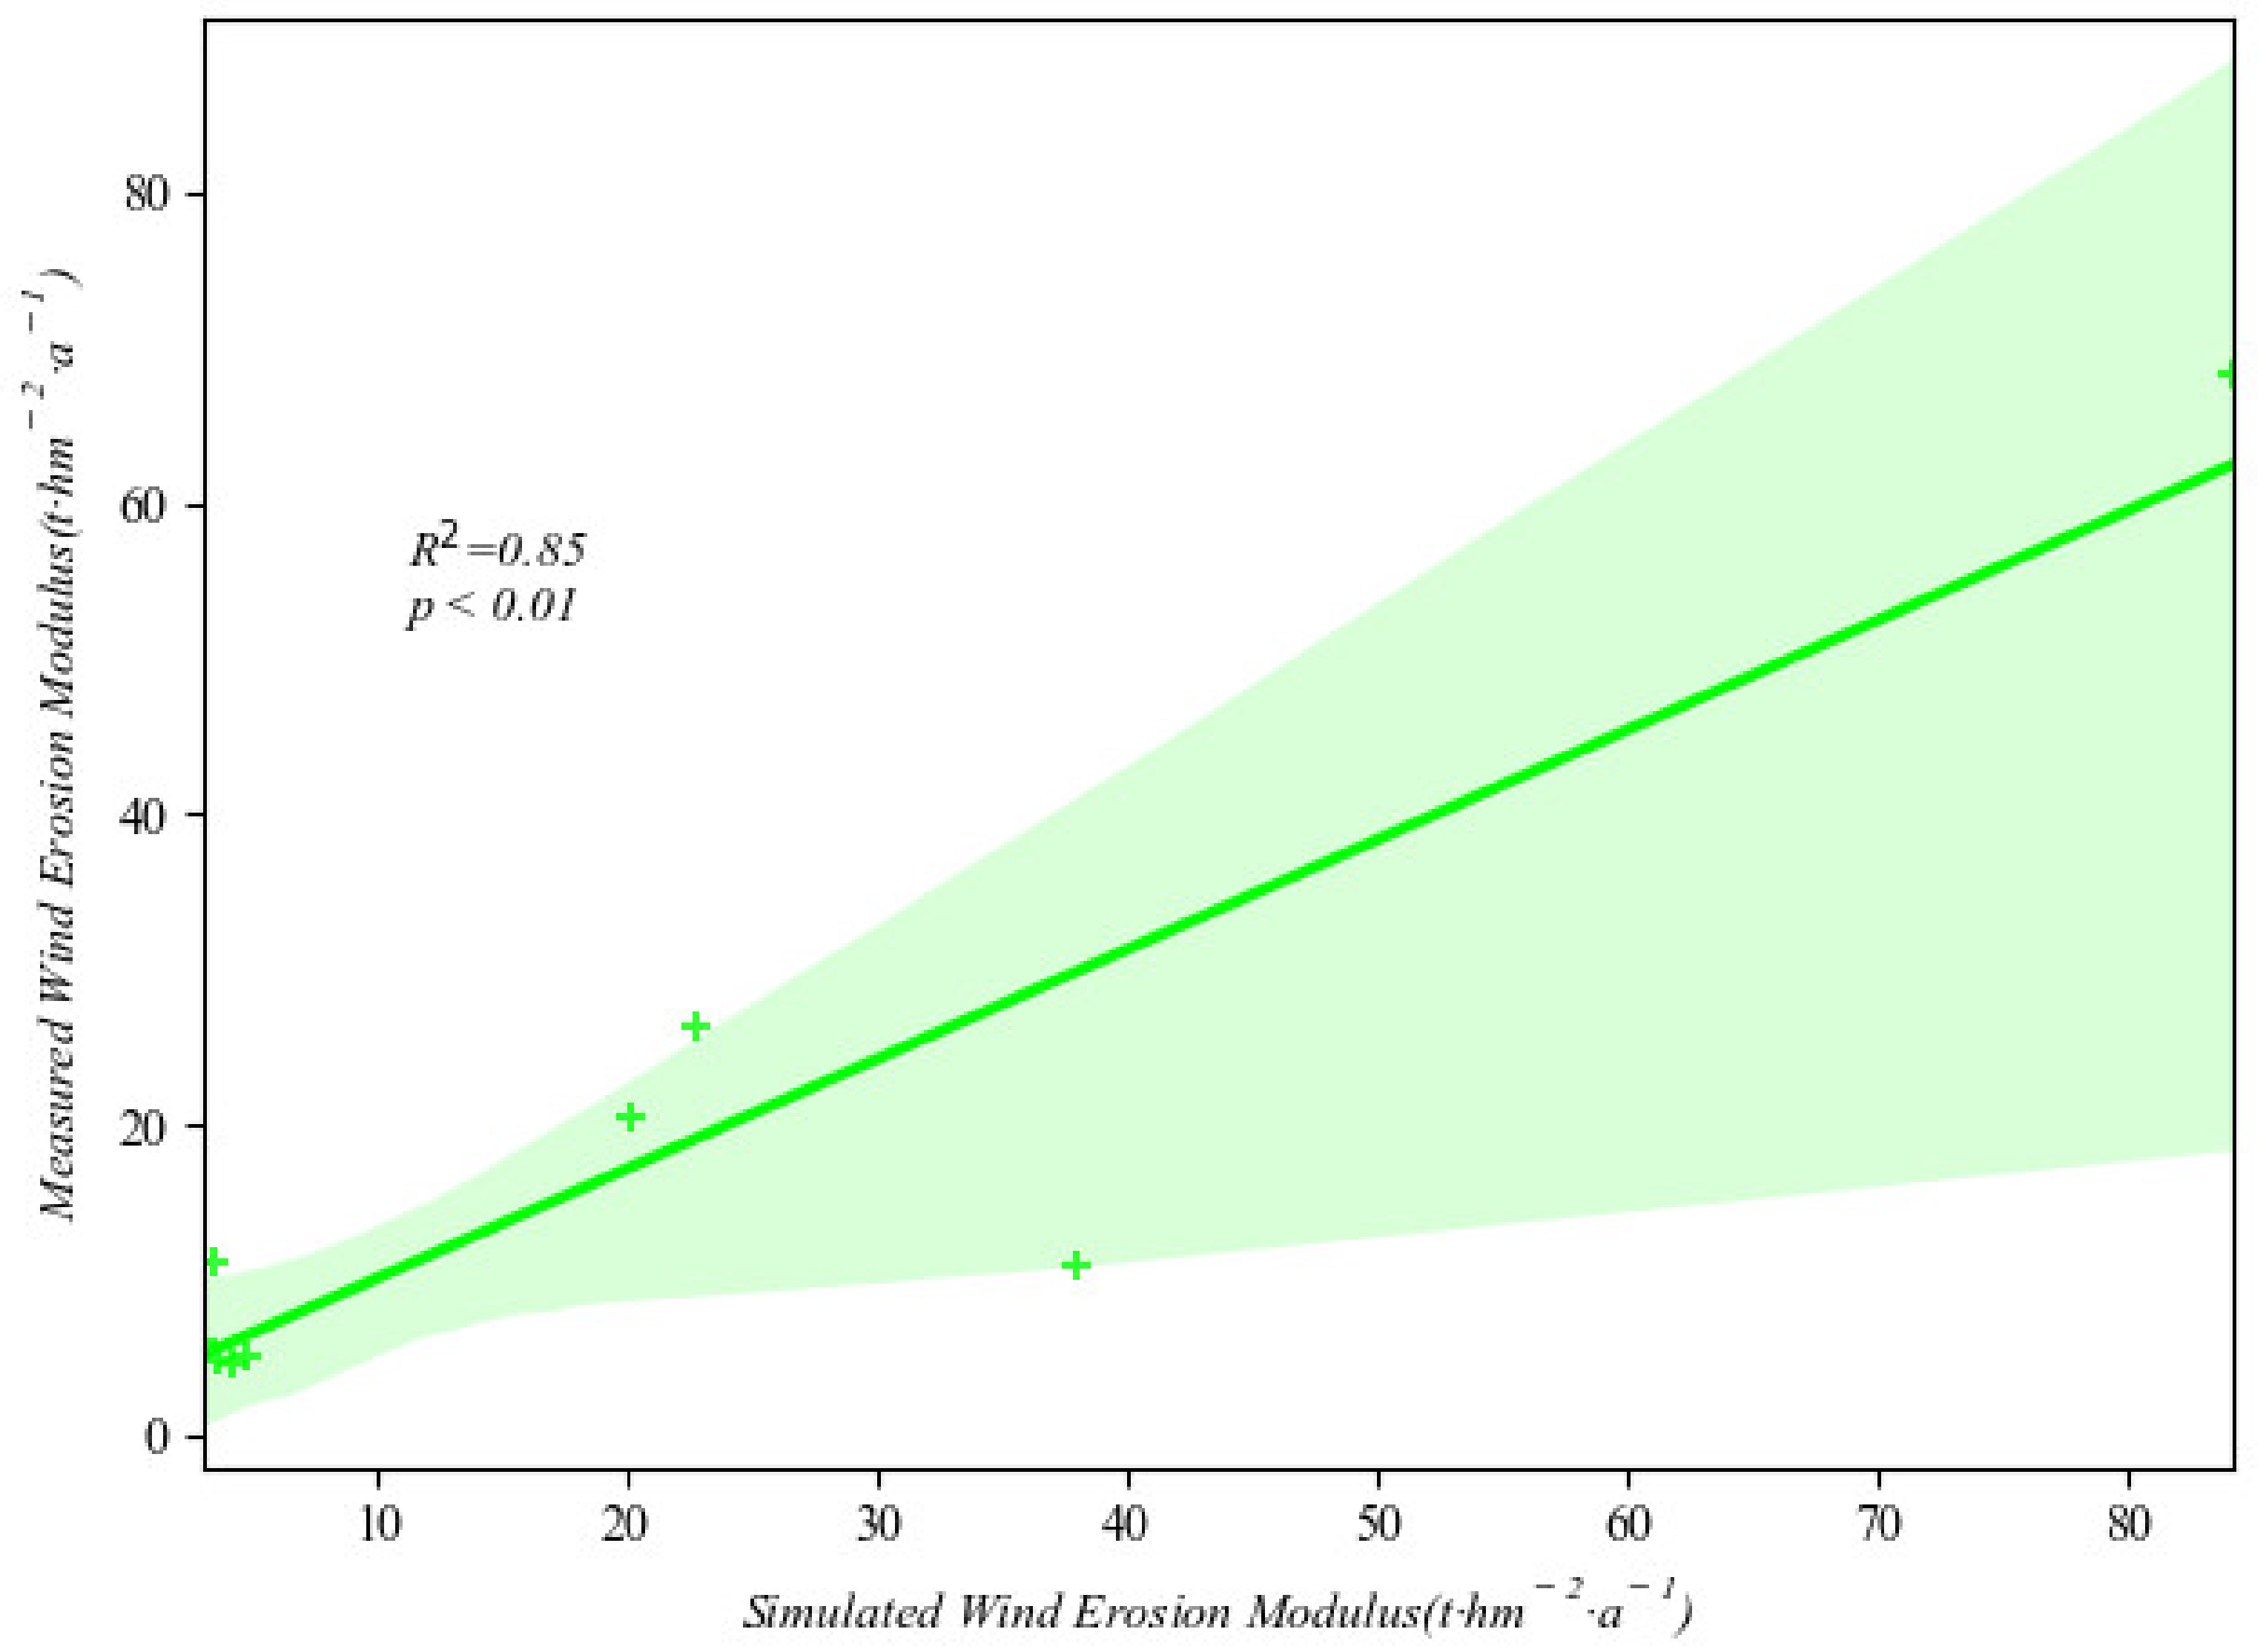
The wind erosion modulus simulation results have been well verified using the measured data of 9 137Cs isotope monitoring sites in western China from previous research [61]. The results show that R2 is 0.85 (Figure 5).

2.4.4. Forage Supply

Based on the NPP data, the ratio of the productivity of the underground part of the vegetation to the above-ground part of the vegetation of each grassland type of the TRHR was used to estimate the grassland yield. The underground productivity of grassland vegetation was calculated by the method proposed by Gill et al. [63].
G Y = N P P / 1 + B N P P / A N P P
B N P P = B G B × l i v e B G B / B G B × t u r n o v e r
t u r n o v e r = 0.0009 × A N P P + 0.25
where GY is the grass yield (kg/hm2); BGB and ANPP use the quadrat data of grassland belowground biomass and aboveground productivity measured by Fan et al., in 2003–2005 at the TRHR; the TRHR ratio of belowground and aboveground biomass of different grassland types comes from the literature data (Table 2) [64]; liveBGB/BGB is the ratio of living root biomass to total root biomass; in this study, the measured value is 0.79 in Qinghai [65]; turnover is the root turnover value of grassland plants; and 0.0009 is the change rate of root turnover value with ANPP (g/m2).
The model-simulated forage yield data were verified through the measured grass yield data of 31 grassland plots by Fan et al., 2004 [66]. The results showed that the correlation between the two was high (R2 = 0.542, p < 0.01), indicating that the model-simulated grass yield results have good accuracy and validity, and can meet the needs of forage supply service evaluation.

2.5. Trend and Significance Test

The trend of ecosystem services for many years was calculated using Sen’s slope [67]. Sen’s slope avoids the loss of time series data and the influence of data distribution on the analysis results, and it can eliminate the interference of outliers on the time series [68]. It has superior performance in the trend analysis of time series. The calculation formula of Sen’s slope is as follows:
S   =   m e d i a n x j x i j i ,   1   <   i   <   j   <   n
where S is Sen’s slope, and x j and x i are the sequence values at times j and i, respectively. If S > 0, the time series data show an upwards trend; otherwise, they show a downwards trend.
Sen’s slope is obtained by calculating the median value of the sequence. It can reduce the noise interference very well, but it cannot realize the significance test of the sequence trend by itself [69]. The Mann–Kendall (MK) trend test method is a nonparametric test method recommended by the World Meteorological Organization (WMO) and has been widely used [70,71,72,73]. The advantage of using the MK test is that the sample does not need to obey a certain distribution, and it is not sensitive to missing values and outliers; thus, the MK method was introduced to test the significance of the trend of long-term ecosystem services data [71,74]. The statistical test method is as follows:
For the time series X k , k = 1, 2, 3, … i, … j, …, n. Define the standardized test statistic Z :
Z   =   S V a r S S   >   0 0 S   =   0 S + 1 V a r S S   <   0
S   =   i = 1 n 1 j = i + 1 n s i g n x j x i
s i g n θ   =   1 θ   >   0 0 θ   =   0 1 θ   <   0
where x j and x i are the sequence values at time j and i, respectively. n is the number of data. When n ≥ 8, the test statistic S is approximately normally distributed, and its mean and variance are as follows:
E S   =   0
V a r S   =   n n 1 2 n + 5 18
Given the significance level α, if Z   >   Z 1 α / 2 , the hypothesis indicating that the current time series data does not have a trend is rejected, and there is an obvious trend change; Z 1 α / 2 is the value corresponding to the standard normal function distribution table at the significance level α. This research considered the significance levels α = 0.1 and α = 0.05 for the significance test. When Z is greater than 1.65 or 1.96, the change trend of the data series passes the significance test with a confidence of 90% or 95%, respectively. Additionally, combined with the positive and negative Sen trends, the significance test results were defined as five types: significant decrease, relatively significant decrease, no significant change, relatively significant increase and significant increase (Table 3).

2.6. Methods for Determining Ecosystem Service Trade-Offs and Synergies

Based on the TRHR’s 2000–2019 terrestrial ecosystem water retention, soil retention, windbreak and sand fixation, and forage supply services data, the Pearson correlation coefficient was used to measure the correlation between the two ecosystem services [11]. The positive and negative values and the absolute value of the values can be used to determine the trade-off and synergy between the two ecosystem services. At the same time, the significance of the trade-off synergy between ecosystem services was judged by the t test. The specific formula is as follows:
r = x i x ¯ y i y ¯ x i x ¯ 2 y i y ¯ 2
where r is the correlation coefficient. If r is a positive value, the relationship between the two services is synergy; if r is negative, the relationship between the two services is a trade-off. Think of x and y as two ecosystem service variables. If p < 0.01, the trade-off or synergy relationship is extremely significant; if 0.01 < p < 0.05, the trade-off or synergy relationship is significant; if p > 0.05, the trade-off or synergy relationship is not significant.

2.7. Dominance Analysis of Ecosystem Services’ Influencing Factors

Ecosystem services are affected by natural factors and human activities with nonlinear and multivariate characteristics. For example, WR and SR services are mainly affected by natural factors such as temperature, precipitation, and FVC. The WD service is mainly affected by wind speed, precipitation, FVC and other natural factors. FS is mainly affected by natural factors such as temperature and precipitation. The change of surface vegetation is affected by both climate change and human activities [75]. Therefore, in this paper, factors such as temperature, precipitation, wind speed, and FVC are selected as explanatory variables, and multiple linear regression is performed with ecosystem services as dependent variables, and the dominance analysis of explanatory variables is calculated according to the standardized coefficient method. The multiple linear regression equation is:
y = a + i = 1 n b i x i + e
where y is the dependent variable; x i is an explanatory variable; a is the constant term coefficient; b i is the regression coefficient corresponding to the explanatory variable; and e is the model parameter. The dominance of x i can be defined as [76]:
C i = b i s t d x i s t d y
where C i is the relative importance of an explanatory variable; std( x i ) is the standard deviation of an explanatory variable; and std( y ) is the standard deviation of the dependent variable.

3. Results

3.1. Spatial–Temporal Characteristics of Ecosystem Services

3.1.1. Water Retention Service

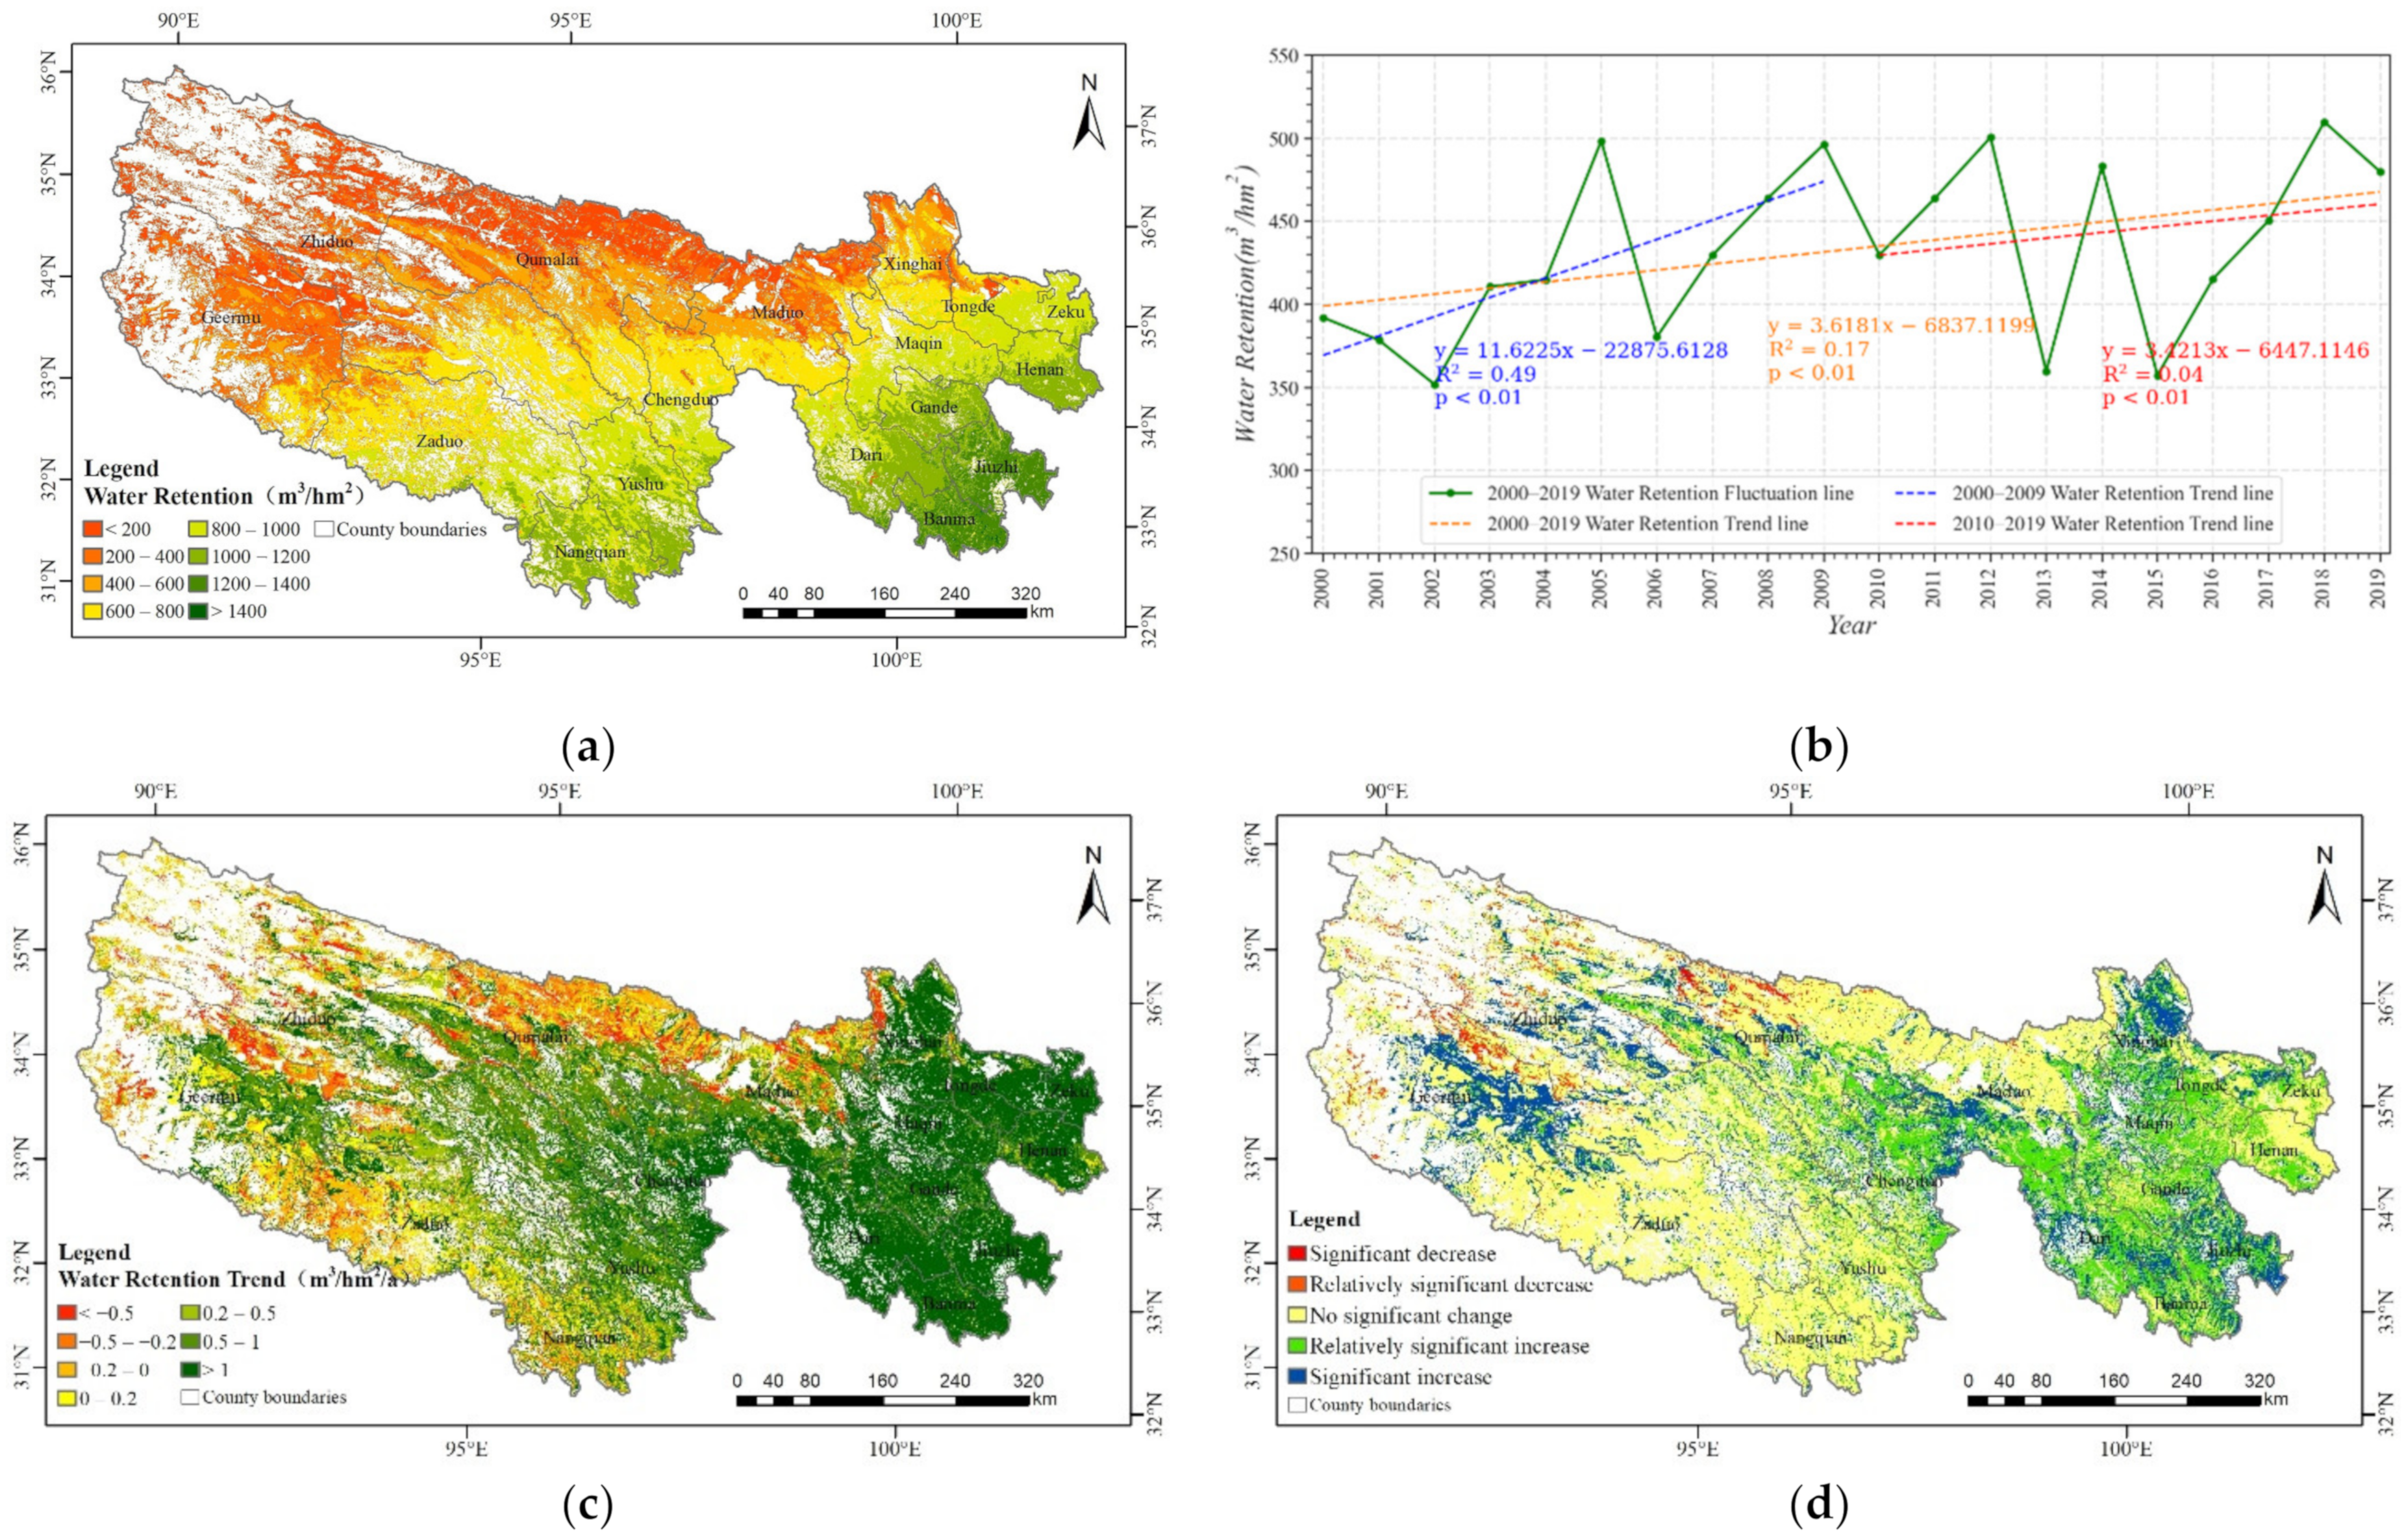
From 2000 to 2019, the annual average water retention of the TRHR forest–grass ecosystem was 15.792 billion m3, and the water retention per unit area was 433.39 m3/hm2. From a spatial point of view, the water retention of the TRHR forest–grass ecosystem showed a decreasing trend from southeast to northwest (Figure 6a). The southeastern region was rich in precipitation, and the ecosystem types such as woodland and alpine meadow were widely distributed. The water retention capacity per unit area in most regions was above 600 m3/hm2, among which, the water retention per unit area capacity was relatively high in Banma, Jiuzhi, Gander, Dari, Henan, Zeku, Nangqian, and Yushu. Due to the sparse precipitation, the large distribution of bare land and bare rock texture, and the low coverage of forest and grass vegetation, the water retention capacity per unit area was below 400 m3/hm2 in most northwest regions, such as Geermu, the northwest of Zhiduo, and the north of Qumalai and Maduo, which was consistent with the predecessor’s research results of “TRHR water retention capacity decreasing from southeast to northwest” [40,77,78,79].
From the perspective of the inter-annual variation trend, the annual average water retention per unit area of TRHR showed a trend of increasing in fluctuation from 2000 to 2019 (Figure 6b). The annual slope rate of water retention per unit area was 3.62 m3/hm2/a, with a significant increase trend (p < 0.01), and the coefficient of variation was 0.118. The annual slope rate of water retention per unit area was 11.62 m3/hm2/a from 2000 to 2009, with a significant increase trend (p < 0.01), and the coefficient of variation was 0.113. The water retention amount per unit area fluctuated greatly from 2010 to 2019, and the inter-annual slope rate of the water retention amount per unit area was 3.42 m3/hm2/a, with a significant increase trend (p < 0.01), and the coefficient of variation was 0.116. In general, the water retention per unit area of the TRHR has shown a significant increase trend in the past 20 years. Compared with the two periods of 10 years before and after, the trend value of the former is larger than that of the latter, but the volatility of the former is smaller than that of the latter.
At the pixel scale, there were significant spatial differences in the interannual variation of water retention per unit area of the TRHR forest–grass ecosystem (Figure 6c). The water retention per unit area in most of the eastern and central parts of the TRHR showed an upward trend with the time series, while the water retention per unit area in the western and northern parts of the TRHR showed a downward trend with the time series. Except for the water body and non-vegetation area of the whole TRHR, the pixels with an increasing trend of water retention per unit area accounted for 80.35% of the total area of TRHR, while the pixels with a decreasing trend accounted for 18.82% of the total area of TRHR, and the pixels with no obvious change accounted for 0.83% of the total area of the TRHR. Among them, Jiuzhi, Gander, Tongde, Zeku, Xinghai, Chengduo, and Yushu had a relatively obvious increase in water retention per unit area, and Qumalai, Maduo, Zhiduo, Geermu and Nangqian had a relatively obvious decreasing trend of water retention per unit area.
At the pixel scale, the change trend significance of water retention per unit area of the TRHR forest–grass ecosystem from 2000 to 2019 showed a spatial distribution characteristic of a staggered distribution of significant areas and no significant change areas (Figure 6d). The no obvious changes and remained stable areas accounted for the largest area, with a value of 52.98%, followed by relatively significantly increased areas, with a value of 23.70%, and significantly increased areas, with a value of 20.11%. The significantly decreased areas and relatively significantly decreased areas accounted for a relatively small proportion of The values were 0.87% and 2.33%, respectively. In general, the areas with significant increases were mainly distributed in the eastern and central parts of the TRHR, such as Tongde, Gander, Dari, Xinghai, Zeku, Jiuzhi and Chengduo. However, the change trend of water retention per unit area in most areas in the western and northern parts of the TRHR presents a feature of “no significant change”. About 43.81% of the forest and grass ecosystems in the entire TRHR showed significant or significant water retention per unit area.

3.1.2. Soil Retention Service

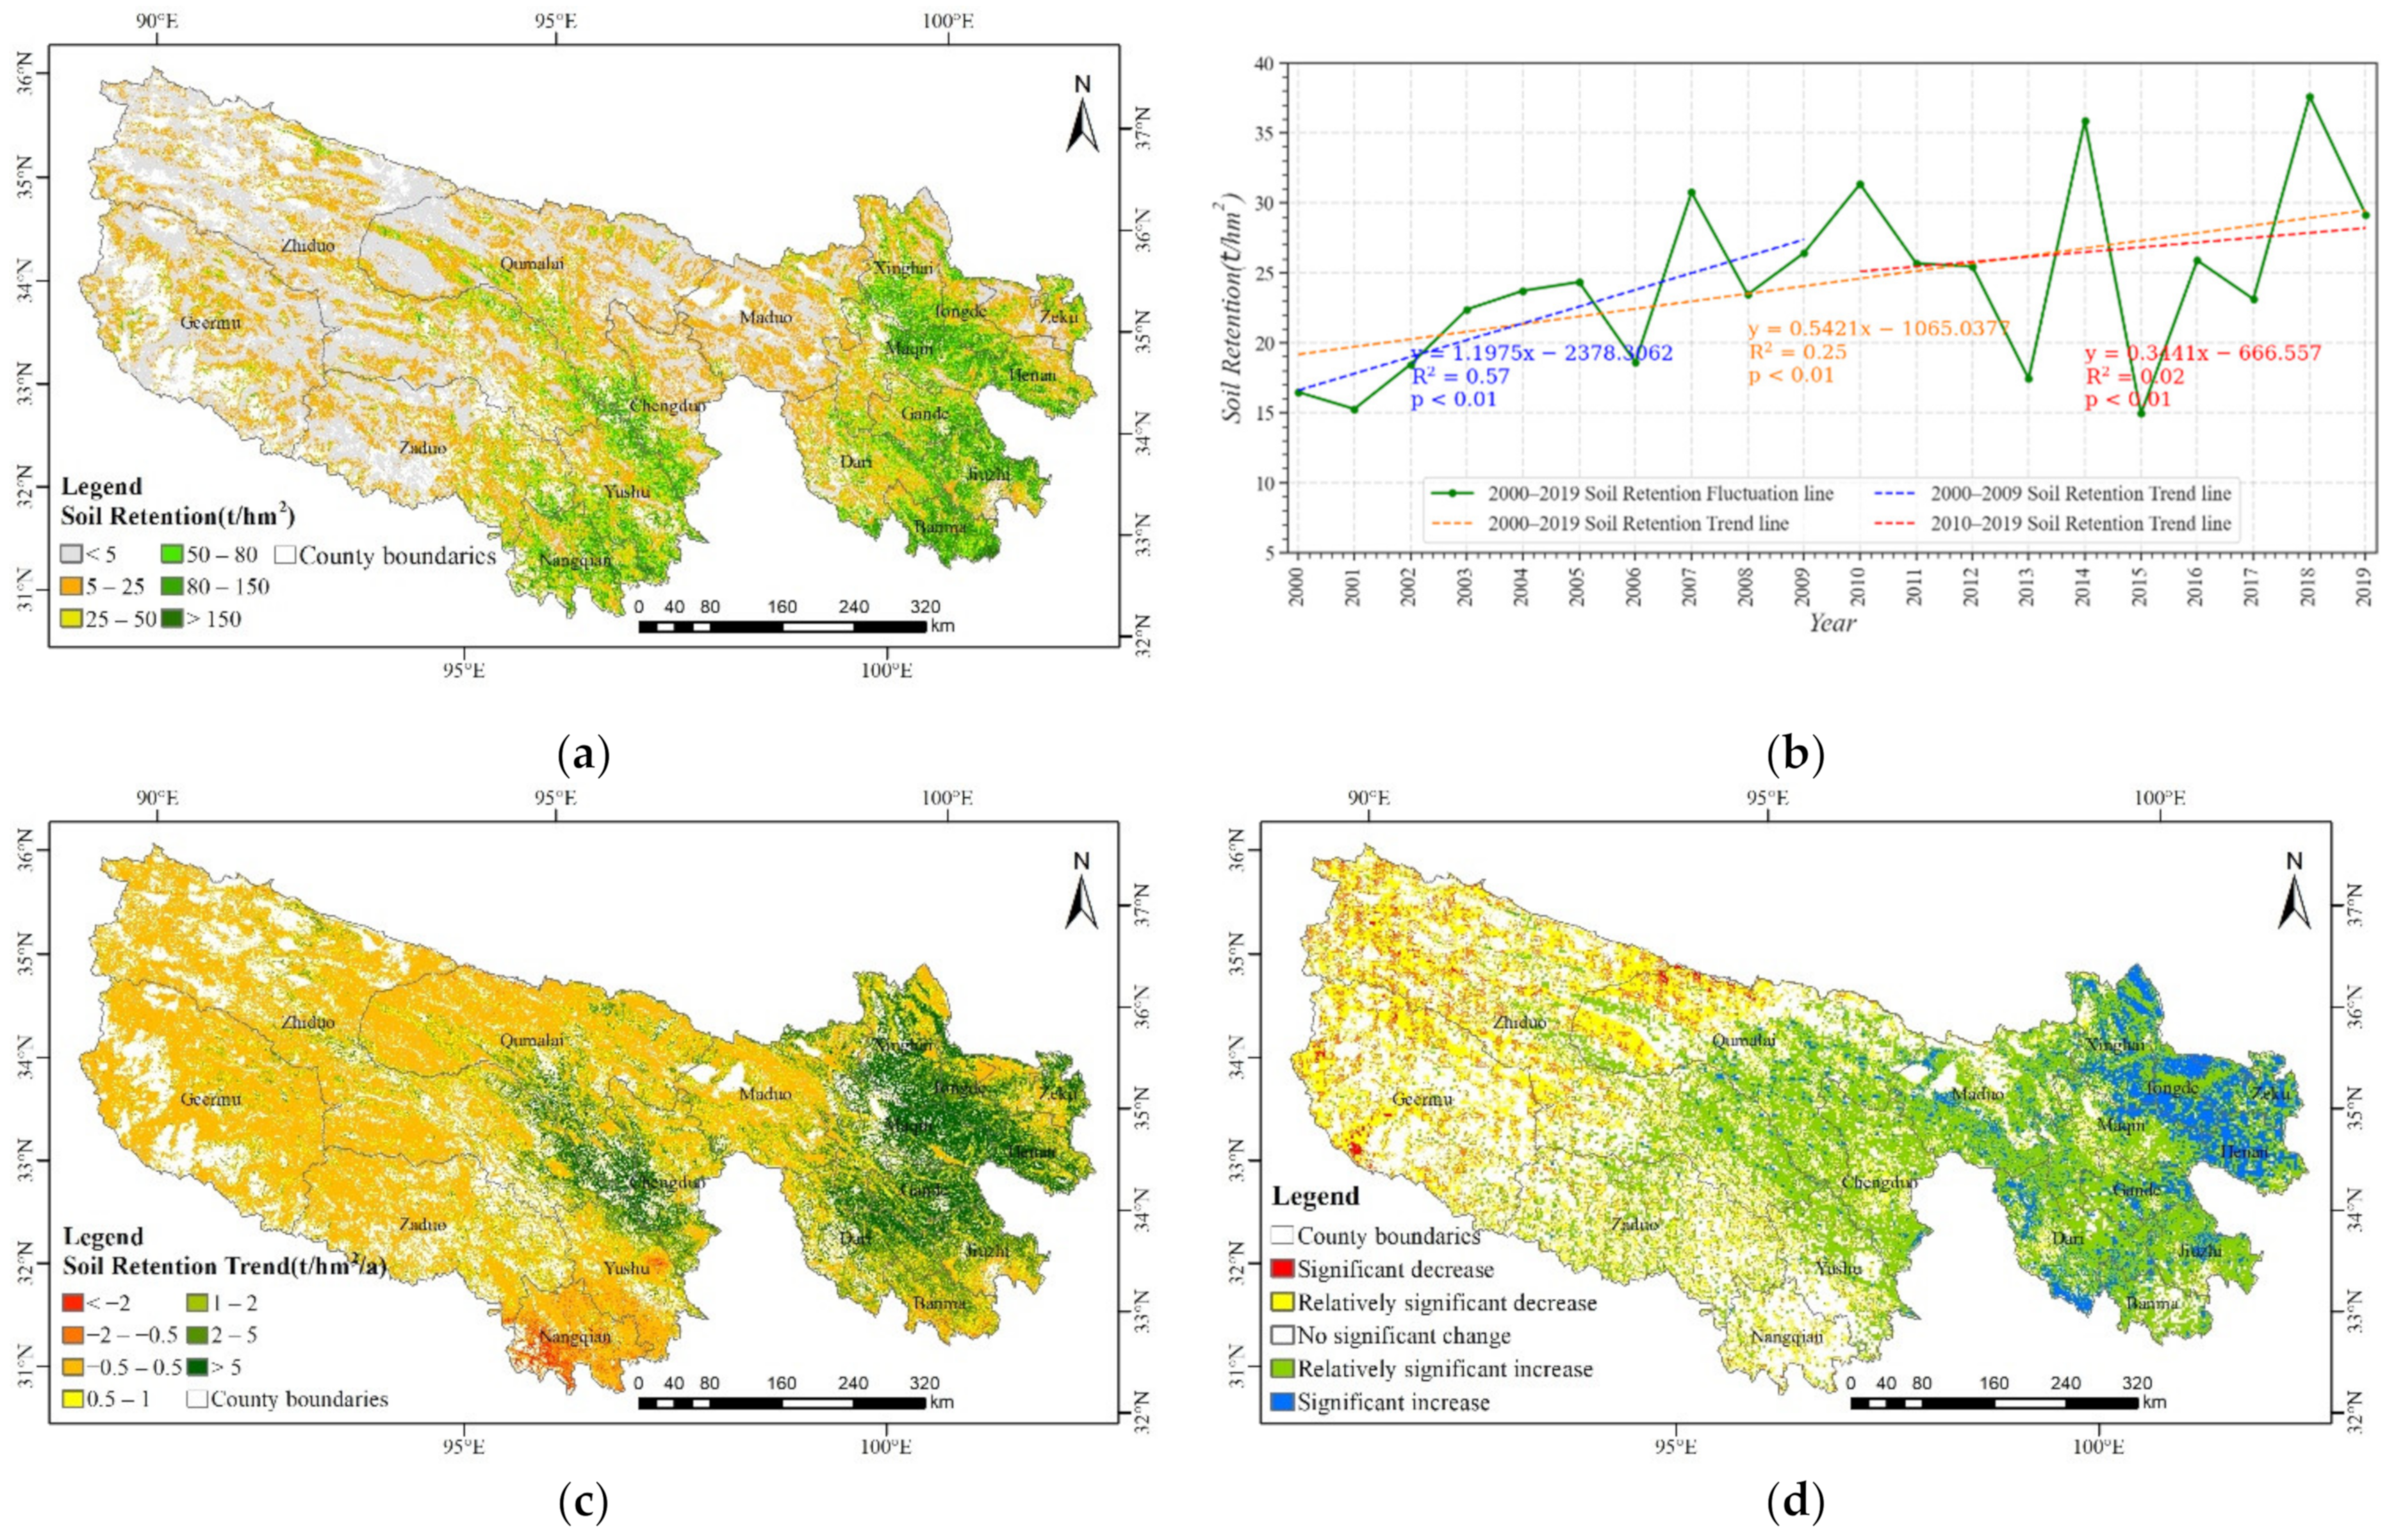
From 2000 to 2019, the annual average soil retention of TRHR ecosystems was 719 million t, and the annual average soil retention per unit area was 24.09 t/hm2. From a spatial point of view, the soil retention of the TRHR ecosystems showed a decreasing trend from southeast to northwest (Figure 7a). Due to more precipitation in the eastern region, the erosive force was larger, the terrain was more mountainous, and the ravines were widely distributed. Larger slopes were more likely to cause soil erosion. At the same time, woodlands and high-coverage grasslands were widely distributed, and due to the implementation of ecological projects, the restoration of forest and grass vegetation could well play the role of preventing soil water erosion and soil retention. The soil retention capacity was above 25 t/hm2, among which, the soil retention per unit area was relatively high in Zema, Jiuzhi, Gander, Dari, Henan, Maqin, Xinghai, Tongde, Nangqian and Yushu, while the coverage of forest and grass vegetation was low in the northwestern region and Maduo, so the soil retention per unit area was below 25 t/hm2 in most areas. Among them, Geermu, as well as the northwest of Zhiduo, Qumalai and Maduo, had lower soil retention per unit area.
From the perspective of the inter-annual variation trend, the annual average soil retention per unit area of the TRHR showed a significant increasing trend in fluctuation from 2000 to 2019 (Figure 7b). The annual slope rate of soil retention per unit area was 0.54 t/hm2/a, with a significant increase trend (p < 0.01), and the coefficient of variation was 0.258. The annual slope rate of soil retention per unit area was 1.20 t/hm2/a from 2000 to 2009, with a significant increase trend (p < 0.01), and the coefficient of variation was 0.207. The soil retention per unit area fluctuated greatly from 2010 to 2019, and the annual slope rate of soil retention per unit area was 0.34 t/hm2/a, with a significant increase trend (p < 0.01), and the coefficient of variation was 0.257. In general, the soil retention per unit area of the TRHR showed a significant increase trend for the past 20 years. Compared with the two 10-year periods before and after, the former trend value was larger than that of the latter, but the volatility of the former was smaller than that of the latter.
At the pixel scale, there were significant spatial differences in the interannual trends of soil retention per unit area of the TRHR ecosystem from 2000 to 2019 (Figure 7c). The soil retention per unit area in the eastern, central, and main regions of the Yangtze River showed an upward trend, while the soil retention per unit area in some areas in the northwest and south showed a downward trend. Except for the water body and non-vegetation area of the whole TRHR, the pixels with an increasing trend of soil retention per unit area accounted for 90.11% of the total area of the TRHR, while the pixels with a decreasing trend accounted for 7.62% of the total area of the TRHR. The pixels with no obvious change accounted for 2.27% of the total area of the TRHR. Among them, Xinghai, Tongde, Zeku, Henan, Maqin, Jiuzhi, Chengduo, and Yushu had a relatively obvious increasing trend in the soil retention per unit area. Shanzhen, Zhiduo, Qumalai, Banma and Nangqian had a relatively obvious decreasing trend in soil retention per unit area.
At the pixel scale, the change trend significance of soil retention per unit area of the TRHR ecosystem from 2000 to 2019 showed a spatial distribution characteristic of a staggered distribution of significant areas and non-significant areas (Figure 7d). The areas with non-significant change and those that remained stable accounted for the largest proportion, with a value of 56.27%; followed by the area with a significant increase, with a value of 18.09%; the area with a relatively significant increase accounted for 8.83%. The relatively significantly decreased areas and significantly decreased areas accounted for a relatively small proportion, and the values were 10.85% and 5.97%, respectively. In general, the soil retention per unit area in most of the central and eastern parts of the TRHR had a significant increasing trend, such as Tongde, Gander, Dari, Xinghai, Maduo, Jiuzhi and Chengduo. However, the change trend of soil retention per unit area in most areas in the west and north of the TRHR was characterized by a “significant decrease”, and in parts of Banma, the change trend of soil retention per unit area was also noted. About 26.92% of the area showed a relatively significant or significant increase trend of soil retention per unit area in the entire TRHR.

3.1.3. Windbreak and Sand Fixation Service

From 2000 to 2019, the annual average windbreak and sand fixation of TRHR was 530 million t, and the annual average windbreak and sand fixation per unit area was 21.19 t/hm2. From a spatial point of view, the windbreak and sand fixation in the TRHR ecosystem showed a decreasing trend from west to east (Figure 8a). Due to most parts of the western region having large amounts of wind and sand, which can be reduced by relatively low vegetation coverage to a certain extent, the windbreak and sand fixation per unit area in most areas was above 25 t/hm2. Among them, the windbreak and sand fixation rates per unit area in the north of Geermu, the northwest of Zhiduo, and the west of Qumalai were higher than that of the eastern region. With less sandstorms and better vegetation coverage, the amount of windbreak and sand fixation was still small. Thus, Jiuzhi, Gander, Dari, Henan, Maqin, Xinghai, Tongde, Nangqian and Yushu had low windbreak and sand fixation per unit area.
From the perspective of the inter-annual variation trend, the annual average windbreak and sand fixation per unit area of TRHR showed a significant decrease trend in fluctuation from 2000 to 2019 (Figure 8b). The annual slope rate of windbreak and sand fixation per unit area was −0.52 t/hm2/a, with a significant decreasing trend (p < 0.01), and the coefficient of variation was 0.30. The annual slope rate of windbreak and sand fixation per unit area was −0.17 t/hm2/a from 2000 to 2009, with a significant decreasing trend (p < 0.01), and the coefficient of variation was 0.32. The annual slope rate of windbreak and sand fixation per unit area was −1.47 t/hm2/a from 2010 to 2019, with a significant decreasing trend (p < 0.01), and the coefficient of variation was 0.24. In general, the windbreak and sand fixation per unit area of the TRHR has shown a significant decreasing trend for the past 20 years. Compared with the two 10 years before and after, the former trend value was greater than the latter, and the former was more volatile than the latter.
At the pixel scale, there were significant spatial differences in the interannual trends of windbreaks and sand fixation per unit area of the TRHR ecosystem from 2000 to 2019 (Figure 8c). The windbreak and sand fixation per unit area in most areas of TRHR showed a decreasing trend with time series, such as the central and northwestern regions of the TRHR, while the windbreak and sand fixation per unit area in some southern TRHR areas showed an increasing trend with time series. Except for non-wind erosion areas such as water bodies, bare rock gravel, glaciers, alpine canyons, etc., in the entire TRHR, the pixels with a decreasing trend of windbreak and sand fixation per unit area accounted for 89.73% of the total TRHR area. While the pixels with an increasing trend accounted for 8.99% of the total area of TRHR, and the pixels with no obvious change accounted for 1.27% of the total area of TRHR. The Geermu, Zhiduo, Zaduo, Qumalai, Maduo, Xinghai, and Zeku had a relatively obvious decreasing trends of windbreak and sand fixation per unit area, while parts of Jiuzhi, Zaduo, Zhiduo, Qumalai and Yushu had an obvious increasing trend of windbreak and sand fixation per unit area.
At the pixel scale, the windbreak and sand fixation per unit area in most areas of the central TRHR from 2000 to 2019 showed the spatial characteristics of “no obvious change” and “significant decrease” (Figure 8d). The area proportion of the area with no obvious change and maintaining stability was 62.50%, followed by the area proportion of the area with a significant decrease; its value was 18.95%. The area proportion of the relatively significantly decreased area was 18.03%. The area proportions of the relatively significantly increased and significantly increased areas were relatively small, with values of 0.39% and 0.12%, respectively. On the whole, the areas with no obvious changes were mainly concentrated in the eastern parts of Qumalai, Zhiduo and Zaduo, as well as the southern parts of Chengduo and Maduo. The change trend of windbreak and sand fixation per unit area showed the characteristic of “significant decrease” in the west and north of the TRHR. About 36.98% of the area showed a relatively significant decrease or a significant decrease trend in the entire TRHR.

3.1.4. Forage Supply Service

From 2000 to 2019, the annual average grass yield per unit area of the TRHR was 503.65 kg/hm2, and the total annual average forage supply was about 12.89 million t. From the perspective of spatial distribution, grassland productivity varies greatly depending on the grassland type, and the grass yield showed a decreasing trend from southeast to northwest (Figure 9a) [66]. From the perspective of unit area, Henan, Zeku and Jiuzhi in the east of the TRHR had higher grass yield, and the grass yields per unit area were 1085.15 kg/hm2, 962.86 kg/hm2 and 880.00 kg/hm2, respectively. However, Geermu, Zhiduo and Qumalai in the northwest of the TRHR had low grass yield, and their grass yields per unit area were 209.41 kg/hm2, 291.42 kg/hm2 and 360.98 kg/hm2, respectively. The spatial imbalance of forage yield in the TRHR grassland was determined by the differences in water and heat conditions between regions. The water and heat conditions of the TRHR determined its vegetation zonal pattern and productivity gradient, which are important characteristics of forage production and supply in the TRHR [66]. From 2000 to 2019, The grass yield per unit area of alpine meadows, temperate grasslands, alpine grasslands and alpine deserts were 615.57 kg/hm2, 500.93 kg/hm2, 262.29 kg/hm2 and 95.76 kg/hm2, respectively.
From the perspective of the inter-annual variation trend, the annual forage supply changes in the TRHR showed a significant increasing trend in fluctuation from 2000 to 2019 (Figure 9b). The annual slope rate of grass yield per unit area was 2.75 kg/hm2/a, with a significant increasing trend (p < 0.01), and the coefficient of variation was 0.093. The annual slope rate of grass yield per unit area was 6.29 kg/hm2/a from 2000 to 2009, with a significant increasing trend (p < 0.01), and the coefficient of variation was 0.086. The annual slope rate of grass yield per unit area was −1.06 kg/hm2/a from 2010 to 2019, with a significant decreasing trend (p < 0.01), and the coefficient of variation was 0.092. In general, in the two periods of 2000–2019 and 2000–2009, the grass yield per unit area of the TRHR showed a significant upward trend in fluctuation, while the grass yield per unit area of the TRHR showed a significant decreasing trend from 2010 to 2019.
At the pixel scale, there were significant spatial differences in the interannual variation of grass yield per unit area of the TRHR from 2000 to 2019 (Figure 9c). The grass yield per unit area in most areas of the TRHR showed an increasing trend, concentrated in the northeastern, central and western regions of the TRHR, while decreases in the grass yield per unit area were mainly concentrated in the southern part of the TRHR. The pixels with increasing grass yield per unit area accounted for 73.68% of the total area of the TRHR, while the pixels with a decreasing trend accounted for 22.78% of the total area of the TRHR. The pixels with no obvious change accounted for 3.54% of the total area of the TRHR. Most areas in Zeku, Xinghai, western Zhiduo, Geermu and other places had a relatively obvious increase in grass yield per unit area, while Jiuzhi, Nangqian, Zaduo, Dari and Gander had a relatively obvious decreasing trend.
At the pixel scale, the spatial distribution of the change trend significance of grass yield per unit area in the TRHR from 2000 to 2019 was significantly different, showing the spatial difference of “more areas with significant increase in the north and more areas with significant reduction in the south” (Figure 9d). The area of no obvious change accounted for the largest proportion, with a value of 73.95%, followed by the area with relatively increased significance, with a value of 14.23%. The area with a significant increase was 9.66%. The proportion of relatively significantly decreased areas and significantly decreased areas accounted for a relatively small proportion, and the values were 1.54% and 0.62%, respectively. The areas with a significant increase trend were mainly concentrated in Zhiduo, Geermu, Zeku, Tongde and other places, while the areas with no obvious change were mainly distributed in the middle of the TRHR. The areas with a significant grass decrease trend were mainly concentrated in the southern TRHR, such as Banma, Jiuzhi, Nangqian and Yushu. Overall, about 23.89% of the area showed a relatively significant or significant increase trend for grass yield per unit area in the entire TRHR.

3.2. Trade-Off and Synergy Relationships of Ecosystem Services

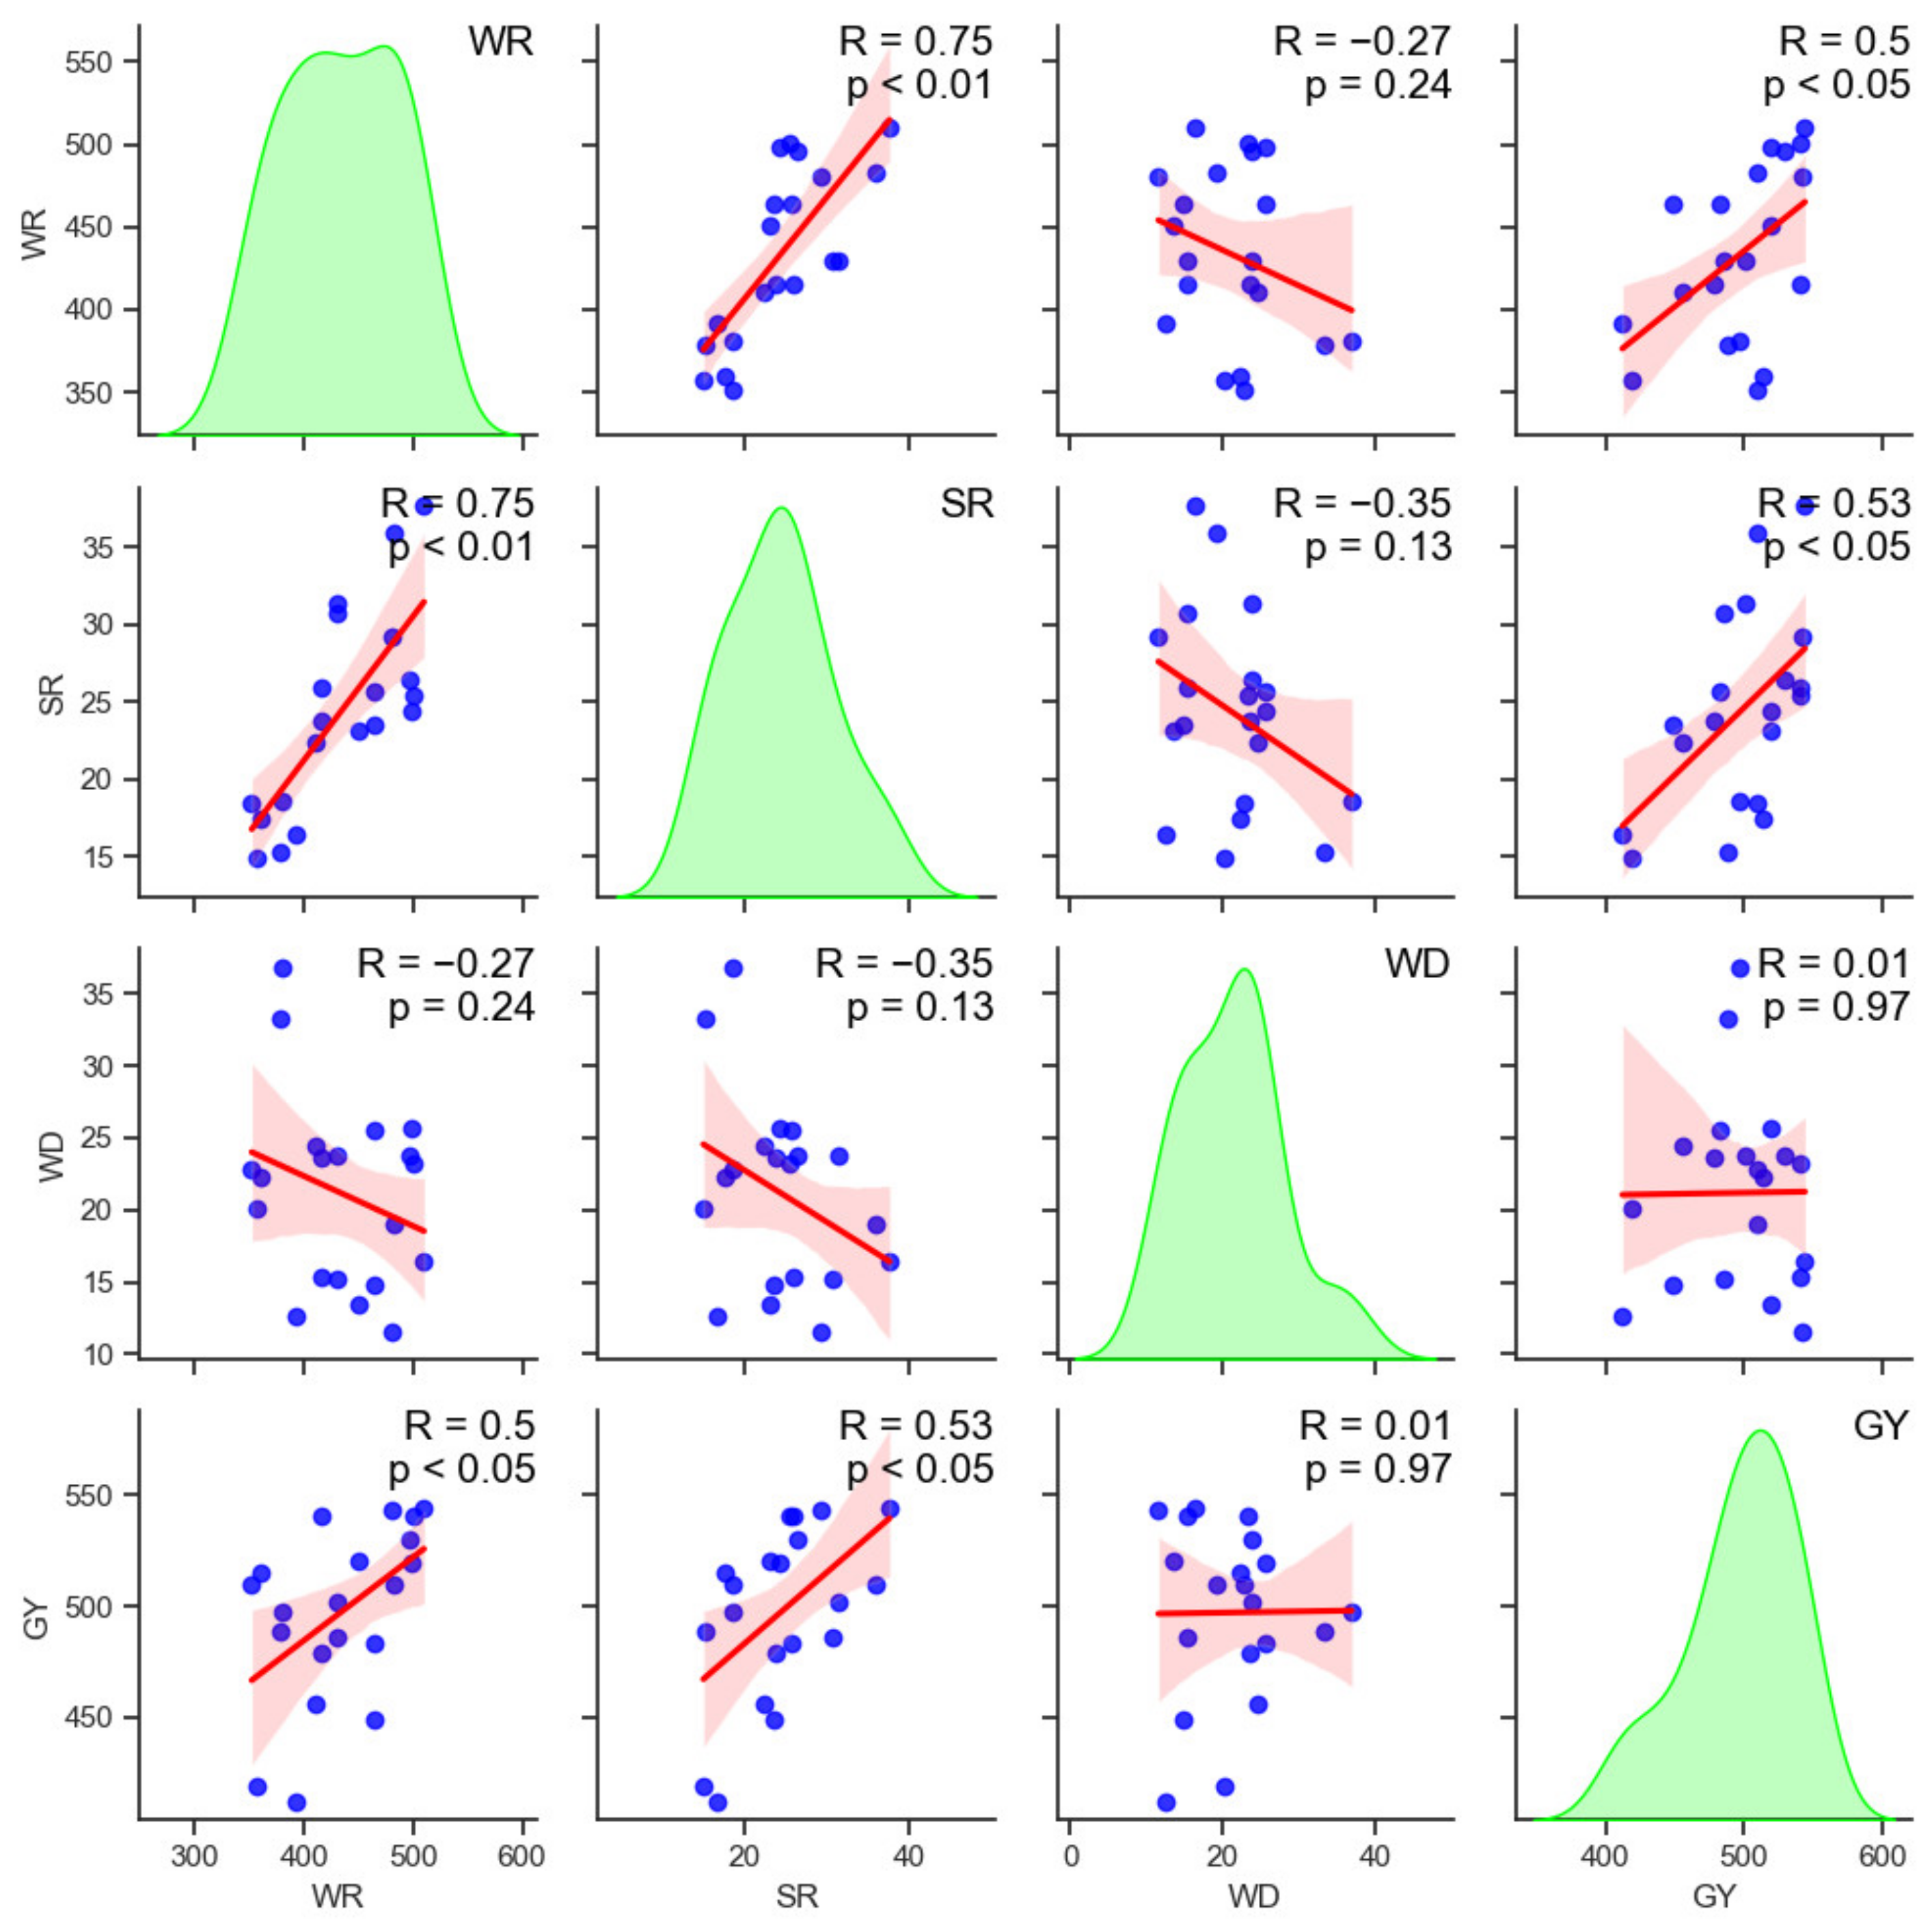
The trade-off and synergy relationships between the main ecosystem services in the TRHR from 2000 to 2019 mainly showed the following characteristics (Figure 10): (1) Extremely significant synergistic relationship: WR and SR. (2) Significant synergistic relationship: WR and GY, SR and GY. (3) Not significant synergistic relationship: WD and GY. (4) Not significant trade-off relationship: WR and WD, SR and WD. Except for WD, there were different degrees of synergy between the other ecosystem services, which is consistent with the research conclusion of Zheng et al. [80,81] that “The synergistic relationship is the dominant relationship among the ecosystem services of TRHR National Park, but the conclusion that the correlation degrees between the ecosystem services are different is relatively consistent”.
Extremely significant correlation: Both WR and SR are closely related to factors such as precipitation and vegetation coverage, so they will show an extremely significant synergistic relationship. Water retention is a complex process of redistribution of rainfall by the forest canopy, the shrub and grass layer under the forest, the litter layer and the loose and deep soil layer. The greater the rainfall and vegetation coverage, the greater the water retention of the vegetation. An increase in precipitation will increase soil hydraulic erosion, and at the same time, an increase in precipitation is beneficial to vegetation restoration, which will increase vegetation coverage and effectively reduce the soil erosion by precipitation; that is, vegetation restoration will increase soil retention.
Significant correlation: GY was closely related to vegetation growth. Grass yield was the above-ground biomass part of NPP for the grassland ecosystem [82]. The greater the precipitation, the higher the grassland vegetation coverage, and the greater the annual NPP and annual grass yield. At the same time, with better vegetation restoration, water retention and soil retention services can be more effectively implemented. Therefore, there was a significant synergistic relationship between GY and WR, and also between GY and SR.
No significant synergistic relationship: WD was positively correlated with GY, but the correlation was not significant. This was mainly because that WD was mainly affected by wind speed, while GY was mainly affected by precipitation, temperature and other factors, so the correlation between the two services was not obvious.
No significant trade-off relationship: There were negative correlations between WD and WR, and between WD and SR, but the correlations were not significant. Wind speed had a great influence on WD, and the weakening of wind speed would reduce the amount of sand in the wind erosion area, fundamentally reduce the potential wind erosion amount and the actual wind erosion amount, and correspondingly reduce the amount of windbreak and sand fixation. Therefore, the weakening wind speed showed a direct and fundamental impact on the reduction in windbreak and sand fixation in the TRHR in the past 20 years, so the relationships between WD and WR, WD and SR showed a negative correlation.

4. Discussion

4.1. Spatial Differences of Ecosystem Services’ Dominance Factors

Ecosystem services were affected by natural factors and human activities with nonlinear and diverse characteristics. For example, WR and SR were mainly affected by natural factors such as temperature, precipitation, and vegetation coverage. WD was mainly affected by wind speed, precipitation, vegetation coverage, etc. GY was mainly affected by natural factors such as temperature and precipitation. The change in surface vegetation was mainly affected by external effects such as climate change and human activities, and climatic conditions were the direct driving force of vegetation distribution and change [75]. Therefore, we selected factors such as temperature, precipitation, wind speed and vegetation coverage for multiple regression, and judged the main control factors affecting each service according to the standardized regression coefficient.

4.1.1. Water Retention

The water retention function of the forest–grass ecosystem was a complex process of redistributing rainfall. The amount of precipitation directly determined the amount of water that can be redistributed. Temperature affected the direct distribution ratio of precipitation in water retention, evapotranspiration and runoff. Vegetation was the main body of interception, storage and storage of precipitation. The results showed that the relative importance distribution of temperature, precipitation and FVC showed a typical zonal law (Figure 11a). Temperature was the main controlling factor affecting the change in WR in the southeastern and central parts of the TRHR, accounting for 5.21% of the area. Precipitation was the main controlling factor affecting the change in water retention in the northeastern and southern parts of the TRHR, accounting for 31.27%. The reason was that the above-mentioned areas increased their precipitation and vegetation coverage in the past 20 years, which further increased the water retention of TRHR. FVC was the main controlling factor affecting the change in water retention in the northwest of the TRHR, accounting for 27.42%. Therefore, it is very important to strengthen the management of desertified land, restore the zonal vegetation at the headwaters of the rivers, and maintain a certain degree of vegetation coverage in the northwest of the TRHR to improve the TRHR’s function as the Chinese Water Tower.

4.1.2. Soil Retention

The relative importance distribution of the three influencing factors of air temperature, precipitation and FVC showed a typical zonal law (Figure 11b). Air temperature was the main controlling factor of soil retention changes in the eastern and central parts of the TRHR, accounting for 4.86%. Precipitation was the main controlling factor for soil retention changes in the central and northern parts of the TRHR, accounting for 36.86%. FVC was the main controlling factor of soil retention change in the southeast of the TRHR, such as Nangqian and Zema, accounting for 8.78%. The soil retention service was the result of various factors, such as precipitation, vegetation, terrain relief, and soil erodibility. Precipitation would increase soil erosion, while vegetation could effectively reduce hydraulic erosion, thereby increasing soil retention. Therefore, it is necessary to continue to carry out ecological engineering construction in the southeast of the TRHR with large topographic fluctuations in the future to further increase FVC and soil conservation.

4.1.3. Windbreak and Sand Fixation

The relative importance distribution of the three influencing factors of wind speed, precipitation and FVC presented a patchy staggered distribution (Figure 11c). Wind speed was the main controlling factor for WD in the eastern, central and western regions of the TRHR, accounting for 14.91%. Relevant studies have shown that the weakening of the wind field in the past 16 years—especially the weakening of the wind field in the spring where sand and dust weather is prone to occur, and the restoration of grassland and sandy land vegetation, which are important for the WD service in the north—is the most important reason for the decline in the amount of wind erosion in the north [83]. Precipitation was the main controlling factor of WD in some areas of Maduo and Zaduo, accounting for 14.91% of the entire TRHR. The higher the FVC in areas with more precipitation, the smaller the amount of sediment, so the amount of WD caused by vegetation was also small. FVC was the main controlling factor of WD in the northeastern and western margins of the TRHR, accounting for 15.62% of the entire TRHR.

4.1.4. Forage Supply

Temperature was the main controlling factor for the change in forage supply in most regions of TRHR, accounting for 48.45%, which was widely distributed in the entire TRHR. The region where precipitation was the main controlling factor accounts for 14.91% of the entire TRHR, and it is concentrated in Nangqian, Zema, Xinghai and Maduo (Figure 11d). The TRHR’s temperature has continued to rise for the past 20 years, which would have an obvious positive effect on the TRHR’s grass yield. However, continuous temperature increase would increase evapotranspiration and cause a water deficit, without taking advantage of the increase in grass yield. At the same time, an increase in temperature would cause the accelerated melting of glaciers, snow and frozen soil, resulting in unpredictable ecological disasters, so it needs to be paid great attention.

4.2. The Impact of Trade-Offs and Synergies on Future Ecological Engineering

Trade-offs and synergies among ecosystem services have important implications for ecosystem management and regional sustainable development [84]. Supply services and regulatory services in previous studies often showed the trade-off relationships and synergistic relationships of ecosystem services [16,17]. If the vegetation coverage is high, the level of regulation service is high, and the level of food supply service is low. The reason is that the food crops that provide supply services, and the forest and grass vegetation that provide regulation services, have a potential conflict between productive and ecological land use. However, this is not the case for the supply and regulation services in the TRHR, because the TRHR ecosystems are dominated by grasslands, which are not only a source of foraging for livestock and other ungulates, but also a key factor in providing multiple ecosystem regulation services, such as WR. For example, the protection and restoration of grassland vegetation means that grassland vegetation coverage and grassland biomass are higher, and forage supply service will be further improved. At the same time, higher vegetation cover will also prevent soil erosion and improve WR and SR services. Therefore, the TRHR’s FS, WR, and SR services have a significant synergistic relationship. It is necessary to consider not only the specific types of ecosystem services, but also the multi-functionality of vegetation for research on the relationship between ecosystem regulation services and supply services. From the perspective of ecosystem management, synergy is the dominant factor of the TRHR’s major ecosystem services, which is beneficial to the formulation and implementation of the TRHR’s ecological engineering management strategies. Climate factors of precipitation, temperature and wind speed are difficult to change in the short term, and FVC is an important vegetation factor for FS, WR, and SR services. It is affected by both natural and human factors, so ecological engineering measures need to be carried out in areas where FVC plays a leading role, and to increase local vegetation coverage and enhance the synergy of multiple ecosystem services, such as Maduo, Zhiduo, Zaduo, Chengduo and other areas near the 400 mm precipitation line.
The WD service is greatly affected by the wind intensity and mainly occurs in the northwest of the TRHR, while the WR, SR and FS services mainly occur in the southeast of the TRHR with better water and heat conditions and FVC. This spatial variability is a major factor in determining the trade-off relationship of ecosystem services. The characteristics of the natural environment with dry climate, strong wind and sparse vegetation in the northwest of the TRHR are naturally formed. It is neither possible nor necessary for humans to impose changes on these normal natural wind erosion processes. Wind erosion in this natural state is called “permissible erosion” [85]. However, it is necessary to control the intensity of human disturbances such as population growth, indiscriminate cultivation, excessive grazing, etc., and carry out sandy land management to reduce the damage to soil agglomeration, soil mechanical structure and soil crust, so as to avoid the induction and aggravation of soil wind erosion. It is recommended to take near-natural restoration measures to improve its vegetation coverage, and carry out research on restoration potential to avoid setting too high goals and excessive investment in ecological projects. As for the central and southeastern parts of the TRHR, due to the high intensity and unreasonable activities of human beings, the vegetation is degraded, the process of vegetation coverage restoration is very slow, relying only on natural recovery. In the future, it will still be necessary to prevent the fragmentation of forests and grasslands, to control soil desertification through ecological engineering measures such as black soil beach management and returning grazing to grassland, further improve vegetation coverage, and enhance soil erosion resistance, thereby reducing soil erosion.
It should be emphasized that the use of grassland by livestock also means the transformation of regulation services into supply services. Pastures can serve as WR, SR, WD services before being eaten by livestock. They become a source of forage for livestock, which also results in the “transformation” of regulation services to supply services after being eaten by livestock. It is estimated that the value of WR, SR, WD services in TRHR is about USD 364.219 billion, while the value of the forage supply service is about USD 22.668 billion [86]. Therefore, from the perspective of ecological economics, TRHR should be focus on restoration and protection, give priority to the development of ecological functions, and then exert their productive functions [87]. To avoid the excessive loss of regulation services, it is necessary to continue to implement the grass–stock balance policy in the TRHR to avoid overgrazing, and the “over-transformation” of ecosystem regulation services to supply services. At the same time, high-quality pasture cultivation should be carried out in Nangqian, Banma, Guinan and other places in the southeast of the TRHR with good water and heat conditions. Based on the principle of “small to protect the big” [88], the ecological and production functions of grasslands are rationally allocated in space, so as to realize the dual improvement of regulation and supply services in the TRHR.
The correlation coefficient method belongs to the statistical description method [23], which can directly reveal the numerical relationship of the trade-off/synergy of ecosystem services, and can characterize the trade-off/synergy relationship of ecosystem services, but it still cannot fully reflect the internal mechanism and action mechanism of ecosystem services. Further exploration and in-depth analysis of other methods are needed [89]. With the increase in ecosystem service variables, the calculation method of partial correlation between various services tends to be complicated [16,83] and the accuracy of the results is difficult to assess. In addition, ecosystem services can be divided into various types such as support, supply, regulation and culture. This study only analyzes supply services and regulation services; a comprehensive assessment of the TRHR’s ecosystem services should be strengthened in the future. On this basis, it is necessary to divide the TRHR into watersheds, climate zones or ecogeographical divisions, and put forward targeted policies and suggestions in terms of ecosystem services and human activity management. There will be some collinearity problems because FVC is also affected by natural conditions such as precipitation, temperature and wind speed. We describe this deficiency in the discussion section, and hope that subsequent research can improve this research with structural equation models and other methods.

5. Conclusions

This paper studied the temporal and spatial changes of the TRHR’s main ecosystem services and their trade-offs and synergies in the past 20 years. The main conclusions are as follows: (1) the TRHR’s WR, SR and FS services gradually decreased from east to west in space, and showed an increasing trend between years; the WD service gradually decreased from west to east in space, and showed a downward trend between years. (2) The supply services and regulatory services often showed a trade-off relationship in previous studies on the trade-off and synergistic relationship of ecosystem services. However, this is not the case for the supply and regulation services in the TRHR, because the TRHR’s ecosystems are dominated by grasslands, which are not only the source of foraging for livestock and other ungulates, but also a key factor in providing multiple ecosystems’ regulation services, such as WR. The synergistic relationship was the dominant relationship between TRHR grassland regulation and provision services. Future research on ecosystem service trade-offs and synergies should consider both the types of ecosystem services and the ecosystems’ multifunctionality. (3) The improvement of TRHR ecosystem services in the future needs to focus on improving fraction vegetation coverage (FVC) through ecological engineering measures in Maduo and other areas near the 400 mm precipitation line, and enhancing the synergy of ecosystem services. (4) The restoration of TRHR FVC needs to consider the difference in natural endowments. It is recommended to adopt near-natural restoration in the northwest of the TRHR and avoid setting too high restoration targets. It is also recommended to plant high-quality pastures in the southeast of the TRHR with good water and heat conditions, and rationally allocate grassland ecological and production functions. (5) The TRHR’s grassland should give priority to the development of the ecological functions of natural grasslands, and then give full play to its production functions. Overgrazing is strictly prohibited, so as to avoid the “over-transformation” of ecosystem regulation services to supply services. (6) It is necessary to divide the TRHR into watersheds, climate zones or ecogeographical divisions, and put forward targeted policies and suggestions in terms of ecosystem services and human activity management.

Author Contributions

All the authors contributed significantly to this study. Conceptualization, Q.S., J.L. and G.L.; methodology, G.L., Q.S. and J.F.; writing—original draft preparation, G.L.; writing—review and editing, J.F., Q.S. and G.L.; data curation, G.L. and H.H.; software, G.L; visualization, G.L, J.N., S.L., L.N. and X.Z. All authors have read and agreed to the published version of the manuscript.

Funding

This research was funded by the National Natural Science Foundation of China (Grant No.42071289), and the Strategic Priority Research Program of the Chinese Academy of Sciences (Grant No. XDA23100203).

Data Availability Statement

The data that support the findings of this study are available from the corresponding author, upon reasonable request.

Conflicts of Interest

The authors declare no conflict of interest.

References

  1. Costanza, R.; Darge, R.; Groot, R.D. The value of the world’s ecosystem services and natural capital. Nature 1997, 387, 253–260. [Google Scholar] [CrossRef]
  2. Daily, G. Nature’s Services: Societal Dependence on Natural Ecosystems; Island Press: Washington, DC, USA, 1997. [Google Scholar]
  3. Millennium Ecosystem Assessment. Ecosystems and Human Well-being; Island Press: Washington, DC, USA, 2005. [Google Scholar]
  4. Fu, B.J.; Zhang, L.W. Land-use change and ecosystem services: Concepts, methods and progress. Prog. Geogr. 2014, 33, 441–446. (In Chinese) [Google Scholar]
  5. Peterson, G.D.; Harmackova, Z.V.; Meacham, M. Welcoming different perspectives in IPBES: “Nature’s contributions to people” and “Ecosystem services”. Ecol. Soc. 2018, 23, 307–312. [Google Scholar] [CrossRef] [Green Version]
  6. Stevenson, H.; Auld, G.; Allan, J.I. The Practical Fit of Concepts: Ecosystem Services and the Value of Nature. Glob. Environ. Polit. 2021, 21, 3–22. [Google Scholar] [CrossRef]
  7. Fu, B.J.; Yu, D.D. Trade-off analyses and synthetic integrated method of multiple ecosystem services. Resour. Sci. 2016, 38, 1–9. (In Chinese) [Google Scholar]
  8. Haase, D.; Schwarz, N.; Strohbach, M.; Kroll, F.; Seppelt, R. Synergies, Trade-offs, and Losses of Ecosystem Services in Urban Regions: An Integrated Multiscale Framework Applied to the Leipzig-Halle Region, Germany. Ecol. Soc. 2012, 17, 102–123. [Google Scholar] [CrossRef]
  9. Li, S.C.; Zhang, C.Y.; Liu, J.L.; Zhu, W.B.; Ma, C.; Wang, J. The tradeoffs and synergies of ecosystem services: Research progress, development trend, and themes of geography. Geogr. Res. 2013, 32, 1379–1390. (In Chinese) [Google Scholar]
  10. Pan, J.; Wei, S.; Li, Z. Spatiotemporal pattern of trade-offs and synergistic relationships among multiple ecosystem services in an arid inland river basin in NW China. Ecol. Indic. 2020, 114, 106345. [Google Scholar] [CrossRef]
  11. Zhu, P.; Liu, X.; Zheng, Y.H.; Wang, S.H.; Huang, L. Tradeoffs and synergies of ecosystem services in key ecological function zones in northern China. Acta Ecol. Sin. 2020, 40, 8694–8706. (In Chinese) [Google Scholar]
  12. Yin, L.C.; Wang, X.F.; Zhang, K.; Xiao, F.Y.; Cheng, C.W.; Zhang, X.R. Trade-offs and synergy between ecosystem services in national barrier zone. Geogr. Res. 2019, 38, 2162–2172. [Google Scholar]
  13. Li, Z.; Deng, X.; Jin, G. Tradeoffs between agricultural production and ecosystem services: A case study in zhangye, northwest China. Sci. Total Environ. 2020, 707, 136032. [Google Scholar] [CrossRef]
  14. Wang, X.F.; Ma, X.; Feng, X.M.; Zhou, C.W.; Fu, B.J. Spatial-temporal characteristics of trade-off and synergy of ecosystem services in key vulnerable ecological areas in China. Acta Ecol. Sin. 2019, 39, 7344–7355. [Google Scholar]
  15. Bennett, E.M.; Peterson, G.D.; Gordon, L.J. Understanding relationships among multiple ecosystem services. Ecol. Lett. 2009, 12, 1394–1404. [Google Scholar] [CrossRef] [PubMed]
  16. Sun, Y.J.; Ren, M.Y.; Hao, M.Y.; Duan, Y.F. Spatial and temporal changes in the synergy and trade-off between ecosystem services, and its influencing factors in Yanan, Loess Plateau. Acta Ecol. Sin. 2019, 39, 3443–3454. (In Chinese) [Google Scholar]
  17. Hao, M.Y.; Ren, Z.Y.; Sun, Y.J.; Zhao, S.N. The dynamic analysis of trade-off and synergy of ecosystem services in the Guanzhong Basin. Geogr. Res. 2017, 36, 592–602. (In Chinese) [Google Scholar]
  18. Wu, W.H.; Peng, J.; Liu, Y.X. Tradeoffs and synergies between ecosystem services in Ordos City. Prog. Geogr. 2017, 36, 1571–1581. (In Chinese) [Google Scholar]
  19. Zheng, Z.; Fu, B.; Hu, H.; Sun, G. A method to identify the variable ecosystem services relationship across time: A case study on Yanhe Basin, China. Landsc. Ecol. 2014, 29, 1689–1696. [Google Scholar] [CrossRef]
  20. Li, Y.J.; Zhang, L.W.; Qiu, J.X.; Yan, J.P.; Wan, L.W. Spatially explicit quantification of the interactions among ecosystem services. Landsc. Ecol. 2017, 32, 1181–1199. [Google Scholar] [CrossRef]
  21. Djanibekov, U.; Khamzina, A.; Djanibekov, N. How attractive are short-term CDM forestations in arid regions? The case of irrigated croplands in Uzbekistan. For. Policy Econ. 2012, 21, 108–117. [Google Scholar] [CrossRef]
  22. Baskent, E.Z. Assessment and valuation of key ecosystem services provided by two forest ecosystems in Turkey. J. Environ. Manag. 2021, 285, 112–135. [Google Scholar] [CrossRef]
  23. Wang, P.T.; Zhang, L.W.; Li, Y.J.; Jiao, L.; Wang, H.; Yan, J.P.; Lu, Y.H.; Fu, B.J. Spatio-temporal characteristics of the trade-off and synergy relationships among multiple ecosystem services in the Upper Reaches of Hanjiang River Basin. Acta Geogr. Sin. 2017, 72, 2064–2078. (In Chinese) [Google Scholar]
  24. Wang, X.F.; Cheng, C.W.; Yi, L.C.; Feng, X.M.; Wei, X.D. Spatial-temporal changes and tradeoff/synergy relationship of ecosystem services in Xinjiang. Chin. J. Ecol. 2020, 39, 990–1000. (In Chinese) [Google Scholar]
  25. Hao, R.; Yu, D.; Wu, J. Relationship between paired ecosystem services in the grassland and agro-pastoral transitional zone of China using the constraint line method. Agric. Ecosyst. Environ. 2017, 240, 171–181. [Google Scholar] [CrossRef]
  26. Geng, Q.; Ren, Q.; Yan, H. Target areas for harmonizing the Grain for Green Programme in Chinas Loess Plateau. Land Degrad. Dev. 2020, 31, 325–333. [Google Scholar] [CrossRef]
  27. Liu, Y.; Bi, J.; Lv, J. Spatial multi-scale relationships of ecosystem services: A case study using a geostatistical methodology. Sci. Rep. 2017, 7, 2045–2322. [Google Scholar] [CrossRef] [PubMed] [Green Version]
  28. Li, S.C.; Wang, J.; Zhu, W.B.; Zhang, J.; Liu, Y.; Gao, Y.; Wang, Y.; Li, Y. Research framework of ecosystem services geography from spatial and regional perspectives. Acta Geogr. Sin. 2014, 69, 1628–1639. [Google Scholar]
  29. Runting, R.K.; Bryan, B.A.; Dee, L.E. Incorporating climate change into ecosystem service assessments and decisions: A review. Glob. Chang. Biol. 2017, 23, 28–41. [Google Scholar] [CrossRef] [Green Version]
  30. Motallebi, M.; Hoag, D.L.; Tasdighi, A.; Arabi, M.; Osmond, D.L.; Boone, R.B. The impact of relative individual ecosystem demand on stacking ecosystem credit markets. Ecosyst. Serv. 2018, 29, 137–144. [Google Scholar] [CrossRef]
  31. Liu, H.; Wu, J.; Chen, X. Study on spatial-temporal change and trade-off/synergy relationships of ecosystem services in the Danjiangkou water source area. Acta Ecol. Sin. 2018, 38, 4609–4624. (In Chinese) [Google Scholar]
  32. Peng, L.; Jiagn, L.G.; Feng, Z.M. Research progress on trade-offs and synergies of ecosystem services: An overview. Acta Ecol. Sin. 2012, 32, 5219–5229. [Google Scholar] [CrossRef]
  33. Lin, Z.Y.; Xiao, Y.; Rao, E.M. Relationships among different types of ecosystem service in Southwest China. Chin. J. Appl. Ecol. 2020, 31, 978–986. (In Chinese) [Google Scholar]
  34. Tian, Y.; Wang, S.; Bai, X. Trade-offs among ecosystem services in a typical karst watershed, SW China. Sci. Total Environ. 2016, 566, 1297–1308. [Google Scholar] [CrossRef] [PubMed]
  35. Tang, Y.Z.; Shao, Q.Q.; Liu, J.Y. Did Ecological Restoration Hit Its Mark? Monitoring and Assessing Ecological Changes in the Grain for Green Program Region Using Multi-source Satellite Images. Remote Sens. 2019, 11, 358. [Google Scholar] [CrossRef] [Green Version]
  36. Yang, X.N.; Li, J.; Qin, K.Y.; Li, T.; Liu, J.Y. Trade-offs between ecosystem services in Guangzhou-tianshui economic region. Acta Geogr. Sin. 2015, 70, 1762–1773. [Google Scholar]
  37. Obiang, N.G.; Villerd, J.; Cousin, I. Using a multivariate regression tree to analyze trade-offs between ecosystem services: Application to the main cropping area in France. Sci. Total Environ. 2021, 764, 142815. [Google Scholar] [CrossRef] [PubMed]
  38. Liu, J.Y.; Xu, X.L.; Shao, Q.Q. The Spatial and Temporal Characteristics of Grassland Degradation in the Three- River Headwaters Region in Qinghai Province. Acta Geogr. Sin. 2008, 63, 364–376. (In Chinese) [Google Scholar]
  39. Shao, Q.Q.; Fan, J.W.; Liu, J.Y.; Huang, L.; Cao, W.; Xu, X.L.; Ge, J.S.; Li, Z.Q. Assessment on the effects of the first-stage ecological conservation and restoration project in Sanjiangyuan region. Acta Geogr. Sin. 2016, 71, 3–20. (In Chinese) [Google Scholar]
  40. Shao, Q.Q.; Fan, J.W. Ecological Protection and Ecological Benefit Monitoring and Evaluation of Construction Projects in the Three-River Headwaters Region; Science Press: Beijing, China, 2018. (In Chinese) [Google Scholar]
  41. Shao, Q.Q.; Fan, J.W. Comprehensive Monitoring and Evaluation of Ecosystem in the Three-River Headwaters Region; Science Press: Beijing, China, 2012. (In Chinese) [Google Scholar]
  42. Shao, Q.Q.; Fan, J.W.; Liu, J.Y.; Huang, L.; Cao, W.; Liu, L.L. Target-based Assessment on Effects of First-stage Ecological Conservation and Restoration Project in Three-river Source Region, China and Policy Recommendations. Bull. Chin. Acad. Sci. 2017, 32, 35–44. (In Chinese) [Google Scholar]
  43. People’s Government of Qinghai Province. The Second Phase Project Planning of Ecological Protection and Construction in the Headwaters of Three Rivers in Qinghai; People’s Government of Qinghai Province: Xining, China, 2013.
  44. Zhang, Y.L.; Li, B.Y.; Zheng, D. A discussion on the boundary and area of the Tibetan Plateau in China. Geogr. Res. 2002, 21, 1–8. (In Chinese) [Google Scholar]
  45. Shao, Q.Q.; Liu, G.B.; Li, X.D.; Huang, H.B.; Fan, J.W.; Wang, L.Y.; Liu, J.Y.; Guo, X.J. Assessing the Snow Disaster and Disaster Resistance Capability for Spring 2019 in China’s Three-River Headwaters Region. Sustainability 2019, 11, 6423. [Google Scholar] [CrossRef] [Green Version]
  46. Fan, J.W.; Shao, Q.Q.; Wang, J.B.; Chen, Z.Q.; Zhong, H.P. Temporal and spatial dynamic analysis of livestock pressure in Three-River Headwaters Region grassland. Chin. J. Grassl. 2011, 33, 64–72. (In Chinese) [Google Scholar]
  47. Wang, K.; Hong, F.Z.; Zong, J.Y. Grass Resources and Their Sustainable Utility in the “Three-River Headwaters” Region. Acta Agrestia Sin. 2005, 13, 28–31, 47. (In Chinese) [Google Scholar]
  48. Liu, J.Y.; Shao, Q.Q.; Fan, J.W. Ecological construction achievements assessment and its revelation of ecological project in Three Rivers Headwaters Region. Chin. J. Nat. 2013, 35, 40–46. (In Chinese) [Google Scholar]
  49. Huang, L.; Cao, W.; Xu, X.L.; Fan, J.W.; Wang, J.B. The Ecological Effects of Ecological Security Barrier Protection and Construction Project in Tibet Plateau. J. Nat. Resour. 2018, 33, 398–411. (In Chinese) [Google Scholar]
  50. Liu, F.; Zeng, Y.N. Spatial-temporal change in vegetation Net Primary Productivity and its response to climate and human activities in Qinghai Plateau in the past 16 years. Acta Ecol. Sin. 2019, 39, 1528–1540. (In Chinese) [Google Scholar]
  51. Liu, H.Z.; Tim, R.M.; Li, L.T.; Tom, G.V.N.; Yang, Q.K.; Li, R.; Mu, X.M. Interpolation for time series of meteorological variables using ANUSPLIN. Nat. Sci. Educ. 2008, 36, 227–234. (In Chinese) [Google Scholar]
  52. Hutchinson, T.X. Anusplin Version 4.4 User Guide; The Australian National University: Canberra, Australia, 2013. [Google Scholar]
  53. Guo, B.; Zhang, J.; Meng, X. Long-term spatio-temporal precipitation variations in China with precipitation surface interpolated by ANUSPLIN. Sci. Rep. 2020, 10, 81. [Google Scholar] [CrossRef] [Green Version]
  54. Hutchinson, M.F. Interpolating mean rainfall using thin plate smoothing splines. Int. J. Geogr. Inf. Syst. 1995, 9, 385–403. [Google Scholar] [CrossRef]
  55. Li, M.M. The Method of Vegetation Fraction Estimation by Remote Sensing. Master’s Thesis, The University of Chinese Academy of Sciences, Beijing, China, 2003. (In Chinese). [Google Scholar]
  56. Zhao, T.Q.; Ouyang, Z.Y.; Jia, L.Q.; Zheng, H. Ecosystem services and their valuation of China grassland. Acta Ecol. Sin. 2004, 24, 10. (In Chinese) [Google Scholar]
  57. Liu, J.Y.; Shao, Q.Q.; Yu, X.B. Comprehensive Monitoring and Assessment of Terrestrial Ecosystems in China; Science Press: Beijing, China, 2016. (In Chinese) [Google Scholar]
  58. Sun, W.Y. Temporal and Spatial Variation and Driving Mechanism of Soil Erosion in the Loess Plateau in Recent 20 Years. Ph.D. Thesis, The University of Chinese Academy of Sciences, Beijing, China, 2013. (In Chinese). [Google Scholar]
  59. Wischmeier, W.H.; Smith, D.D. Predicting Rainfall Erosion Losses: A Guide to Conservation Planning; U.S. Department of Agriculture: Washington, DC, USA, 1978.
  60. Renard, K.G.; Foster, G.R.; Weeies, G.A. Predictiong Rainfall Erosion Losses: A Guide to Conservation Planning with the Revised Universal Soil Loss Equation(RUSLE); U.S. Department of Agriculture: Washington, DC, USA, 1997.
  61. Gong, G.L. Analysis of Temporal and Spatial Variation Characteristics and Influencing Factors of Soil Wind Erosion in Northern China. Ph.D. Thesis, The University of Chinese Academy of Sciences, Beijing, China, 2014. (In Chinese). [Google Scholar]
  62. Fryrear, D.; Saleh, A. Field Wind Erosion—Vertical-Distribution. Soil Sci. 1993, 155, 294–300. [Google Scholar] [CrossRef]
  63. Gill, R.; Kelly, R.; Parton, W. Using simple environmental variables to estimate belowground productivity in grasslands. Glob. Ecol. Biogeogr. 2002, 11, 79–86. [Google Scholar] [CrossRef]
  64. Chen, Z.Q. Research on Productivity and Carrying Capacity of Grassland Ecosystem on Qinghai-Tibet Plateau. Ph.D. Thesis, The University of Chinese Academy of Sciences, Beijing, China, 2009. (In Chinese). [Google Scholar]
  65. Zhou, X.M. Chinese Wormwood Meadow; Science Press: Beijing, China, 2001. (In Chinese) [Google Scholar]
  66. Fan, J.W.; Shao, Q.Q.; Liu, J.Y.; Wang, J.B.; Chen, Z.Q.; Zhong, H.P.; Xu, X.L.; Liu, R.G. Dynamic Changes of Grassland Yield in Three River Headwater Region from 1988 to 2005. Acta Agrestia. Sin. 2010, 18, 5–10. (In Chinese) [Google Scholar]
  67. Sen, P.K. Estimates of the Regression Coefficient Based on Kendall’s Tau. J. Am. Stat. Assoc. 1968, 63, 1379–1389. [Google Scholar] [CrossRef]
  68. Yin, H.; Li, G.Z.; Wang, Y.Y.; Cai, F. Assessment of Desertification Using Time Series Analysis of Hyper-temporal Vegetation Indicator in Inner Mongolia. Acta Geogr. Sin. 2011, 66, 653–661. (In Chinese) [Google Scholar]
  69. Long, Y.H.; Qin, J.X.; He, X.G. Wavelet multi-resolution analysis of vegetation dynamic change in Dongting Lake Basin. Acta Geogr. Sin. 2018, 70, 1491–1502. [Google Scholar]
  70. Daneshvar, V.F.; Dinpashoh, Y.; Aalami, M.T. Trend analysis of groundwater using non-parametric methods (case study: Ardabil plain). Stoch. Environ. Res. Risk Assess. 2012, 27, 547–559. [Google Scholar] [CrossRef]
  71. Wu, S.H.; Yin, Y.H.; Zheng, D.; Yang, Q.Y. Climate Changes in the Tibetan Plateau during the Last Three Decades. Acta Geogr. Sin. 2005, 60, 3–11. (In Chinese) [Google Scholar]
  72. Hamed, K.H.; Rao, A.R. A modified Mann-Kendall trend test for autocorrelated data. J. Hydrol. 1998, 204, 182–196. [Google Scholar] [CrossRef]
  73. Gocic, M.; Trajkovic, S. Analysis of changes in meteorological variables using Mann-Kendall and Sen’s slope estimator statistical tests in Serbia. Glob. Planet. Chang. 2013, 100, 172–182. [Google Scholar] [CrossRef]
  74. Wang, D.L.; Liu, W.P.; Huang, X.Y. Trend analysis in vegetation cover in Beijing based on Sen+Mann-Kendall method. Comput. Eng. Appl. 2013, 49, 13–17. (In Chinese) [Google Scholar]
  75. Mao, F.; Lu, Z.G.; Zhang, J.H.; Hou, Y.Y. Relations between AVHRR NDVI and climate factors in Northern Tibet in recent 20 years. Acta Ecol. Sin. 2007, 27, 3198–3205. (In Chinese) [Google Scholar]
  76. Flannery, M.J.; Rangan, K.P. Partial adjustment toward target capital structures. J. Financ. Econ. 2006, 79, 469–506. [Google Scholar] [CrossRef]
  77. Wu, D. Research on Water Regulation Service of the Main Terrestrial Ecosystems in China. Ph.D. Thesis, The University of Chinese Academy of Sciences, Beijing, China, 2014. (In Chinese). [Google Scholar]
  78. Wu, D.; Shao, Q.Q.; Liu, J.Y.; Cao, W. Assessment of water conservation services in forest and grass ecosystems in the Three River Headwaters region. Bull. Soil Water Conserv. 2016, 36, 206–210. (In Chinese) [Google Scholar]
  79. Huang, L.; Cao, W.; Wu, D.; Gong, G.L. The Temporal and Spatial Variations of Ecological Services in the Tibet Plateau. J. Nat. Resour. 2016, 31, 543–555. (In Chinese) [Google Scholar]
  80. Zheng, D.F.; Wang, Y.; Hao, S.; Lv, L.T.; Xu, W.J.; Wang, Y.Y.; Wang, H. Spatial-temporal change and trade-off/synergy relationships among multiple ecosystem services in Three-River-Source National Park. Geogr. Res. 2020, 39, 64–78. (In Chinese) [Google Scholar]
  81. Zheng, D.F.; Wang, Y.H.; Hao, S.; Xu, W.J.; Lv, L.T.; Yu, S. Spatial-temporal variation and tradeoffs/synergies analysis on multiple ecosystem services: A case study in the Three-River Headwaters region of China. Ecol. Indic. 2020, 116, 106494. [Google Scholar] [CrossRef]
  82. Wang, S.Z. The Impacts of Grazing on Water Supply and Herbage Supply Function of Grassland Ecosystem on the Tibetan Plateau. Ph.D. Thesis, The University of Chinese Academy of Sciences, Beijing, China, 2019. (In Chinese). [Google Scholar]
  83. Huang, L.; Zhu, P.; Cao, W. The impacts of the Grain for Green Project on the trade-off and synergy relationships among multiple ecosystem services in China. Acta Ecol. Sin. 2021, 41, 1178–1188. (In Chinese) [Google Scholar]
  84. Gao, J.B.; Zuo, L.Y.; Wang, H. The spatial trade-offs and differentiation characteristics of ecosystem services in Karst peak-cluster depression. Acta Ecol. Sin. 2019, 39, 7829–7839. [Google Scholar]
  85. Hu, Y.F.; Liu, J.Y.; Zhuang, D.F. Progress in Wind Erosion Research. Prog. Geogr. 2003, 22, 288–295. (In Chinese) [Google Scholar]
  86. Liu, L.L. Ecosystem Services Values and Their Application in the Cost-Benefit Analysis of Ecological Projects and Balance Sheet Analysis of Ecological Asset in the Three-River Headwaters Region. Ph.D. Thesis, The University of Chinese Academy of Sciences, Beijing, China, 2016. (In Chinese). [Google Scholar]
  87. Pan, Q.M.; Sun, J.M.; Yang, Y.H.; Liu, W.; Li, A.; Peng, Y.F. Issues and Solutions on Grassland Restoration and Conservation in China. Bull. Chin. Acad. Sci. 2021, 36, 666–674. [Google Scholar]
  88. Fang, J.Y.; Pan, Q.M.; Gao, S.Q.; Jing, H.C.; Zhang, W.H. Small vs large area: Protecting and restoring a large area of natural grassland by establishing a small area of cultivated pasture. Pratacultural Sci. 2016, 33, 1913–1916. [Google Scholar]
  89. Qian, C.Y.; Gong, J.; Zhang, J.X.; Liu, D.Q.; Ma, X.C. Change and tradeoffs-synergies analysis on watershed ecosystem services: A case study of Bailongjiang Watershed, Gansu. Acta Geogr. Sin. 2018, 73, 868–879. (In Chinese) [Google Scholar]
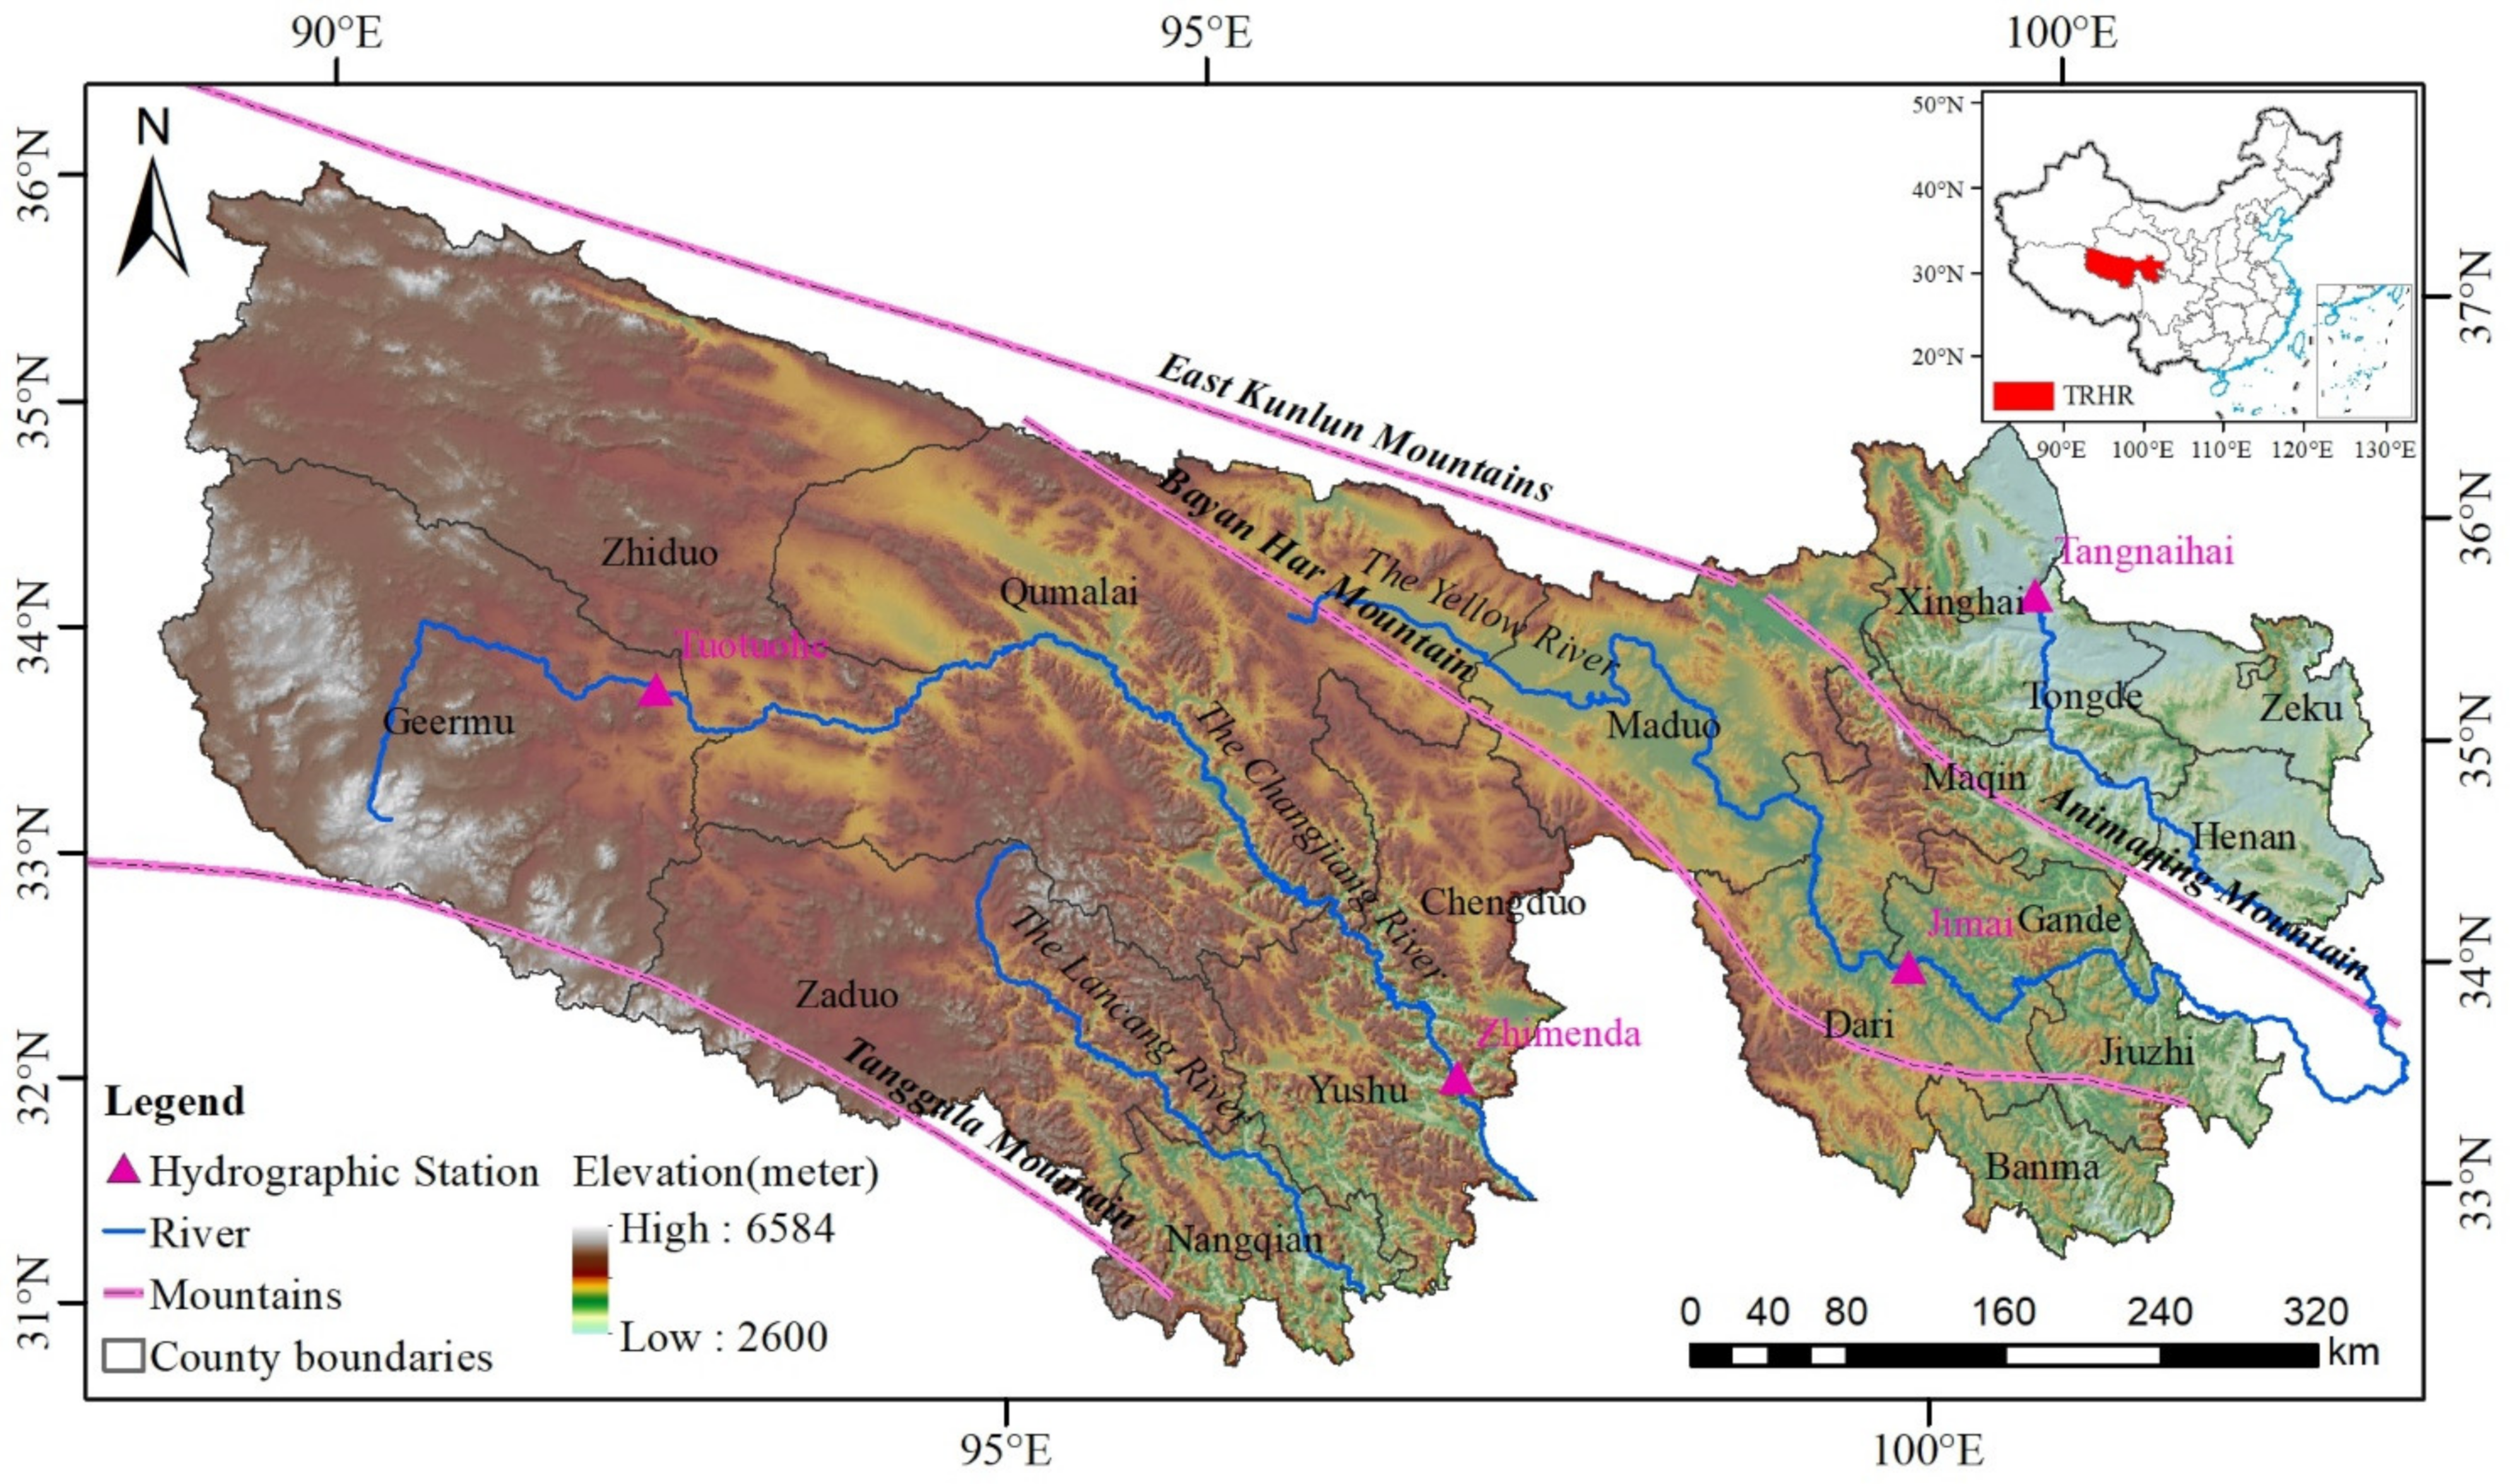
Figure 1. Digital elevation model of the TRHR.
Remotesensing 14 05349 g001
Figure 2. Technology roadmap of this study.
Remotesensing 14 05349 g002
Figure 3. Verification of water retention and runoff.
Remotesensing 14 05349 g003
Figure 4. Verification of soil water erosion and sediment transport.
Remotesensing 14 05349 g004
Figure 5. Verification of RWEQ-simulated wind erosion modulus and 137Cs-measured wind erosion modulus results.
Remotesensing 14 05349 g005
Figure 6. Spatial distribution of average annual water retention (a), inter-annual changes (b), change trend (c), and significance (d) of forest and grass ecosystems in the TRHR from 2000 to 2019.
Remotesensing 14 05349 g006
Figure 7. Spatial distribution of average annual soil retention (a), inter-annual changes (b), change trend (c), and significance (d) of ecosystems in the TRHR from 2000 to 2019.
Remotesensing 14 05349 g007
Figure 8. Spatial distribution of average annual windbreak and sand fixation (a), inter-annual changes (b), change trend (c), and significance (d) of ecosystems in the TRHR from 2000 to 2019.
Remotesensing 14 05349 g008aRemotesensing 14 05349 g008b
Figure 9. Spatial distribution of average annual grass yield (a), inter-annual changes (b), change trend (c), and significance (d) of ecosystems in the TRHR from 2000 to 2019.
Remotesensing 14 05349 g009
Figure 10. The relationships between the main ecosystem services in the TRHR.
Remotesensing 14 05349 g010
Figure 11. Relative importance of influencing factors to water retention (a), soil retention (b), sand retention (c), and grass yield (d) services in the TRHR.
Remotesensing 14 05349 g011aRemotesensing 14 05349 g011b
Table 1. Basic information of 4 hydrological stations in TRHR.
WatershedHydrological StationsLongitudeLatitudeAltitude (m)Catchment Area (km2)
Headwater of the Yangtze RiverTuotuohe92°27′34°13′453515,924
Zhimenda97°13′33°02′3546137,704
Headwater of the Yellow RiverTangnaihai100°12′35°34′2770121,972
Jimai99°39′33°46′413545,019
Table 2. The aboveground biomass ratio of different grassland types in the TRHR.
Grass TypeThe Aboveground Biomass Ratio
Alpine meadow7.25
Alpine steppe9.75
Alpine desert3.29
Temperate steppe3.27
Table 3. Significance test of the trend of NPP.
Significance TypesSen Trend ValueMK p Value
Significant decrease<0p < 0.05
Relatively significant decrease<00.05 ≤ p ≤ 0.1
No significant changeValid range0.1 < p
Relatively significant increase>00.05 ≤ p ≤ 0.1
Significant increase>0p < 0.05
Publisher’s Note: MDPI stays neutral with regard to jurisdictional claims in published maps and institutional affiliations.