Abstract
The primary objectives of this study are to investigate the interference of ground penetrating radar (GPR) signals with air-cavities behind concrete linings subjected to three experimental parameters (GPR antenna frequency, thickness of concrete lining, and thickness of air-cavities), and their effects on the evaluation of important engineering parameters (thickness of concrete, and length and thickness of air-cavities) for tunnel structure inspection using GPR. For these purposes, first, a concrete model specimen is fabricated in the laboratory, which simulates air-cavity defects with various thicknesses (0 mm, 30 mm, 100 mm, 200 mm, and 300 mm) behind concrete with four different thicknesses (100 mm, 200 mm, 300 mm, and 400 mm) in tunnel structures. Second, a series of GPR survey is performed on the fabricated concrete model specimen using three ground-coupled GPR antennas with nominal center frequencies of 400 MHz, 900 MHz, and 1600 MHz. Third, a practical signal interpretation method is proposed to evaluate air-cavities in concrete tunnel linings subjected to the three experimental parameters. It is demonstrated that the cross-correlation analysis is effective for identifying air-cavities behind concrete, and for characterizing the length of the air-cavities. In addition, the thicknesses of air-cavities are estimated by a new approach in this study, measuring the apparent time delay of partially overlapped electromagnetic wave reflections within air-cavities. The results in this study provide a fundamental basis to improve GPR signal interpretation techniques for the evaluation of air-cavities behind concrete tunnel linings.
1. Introduction
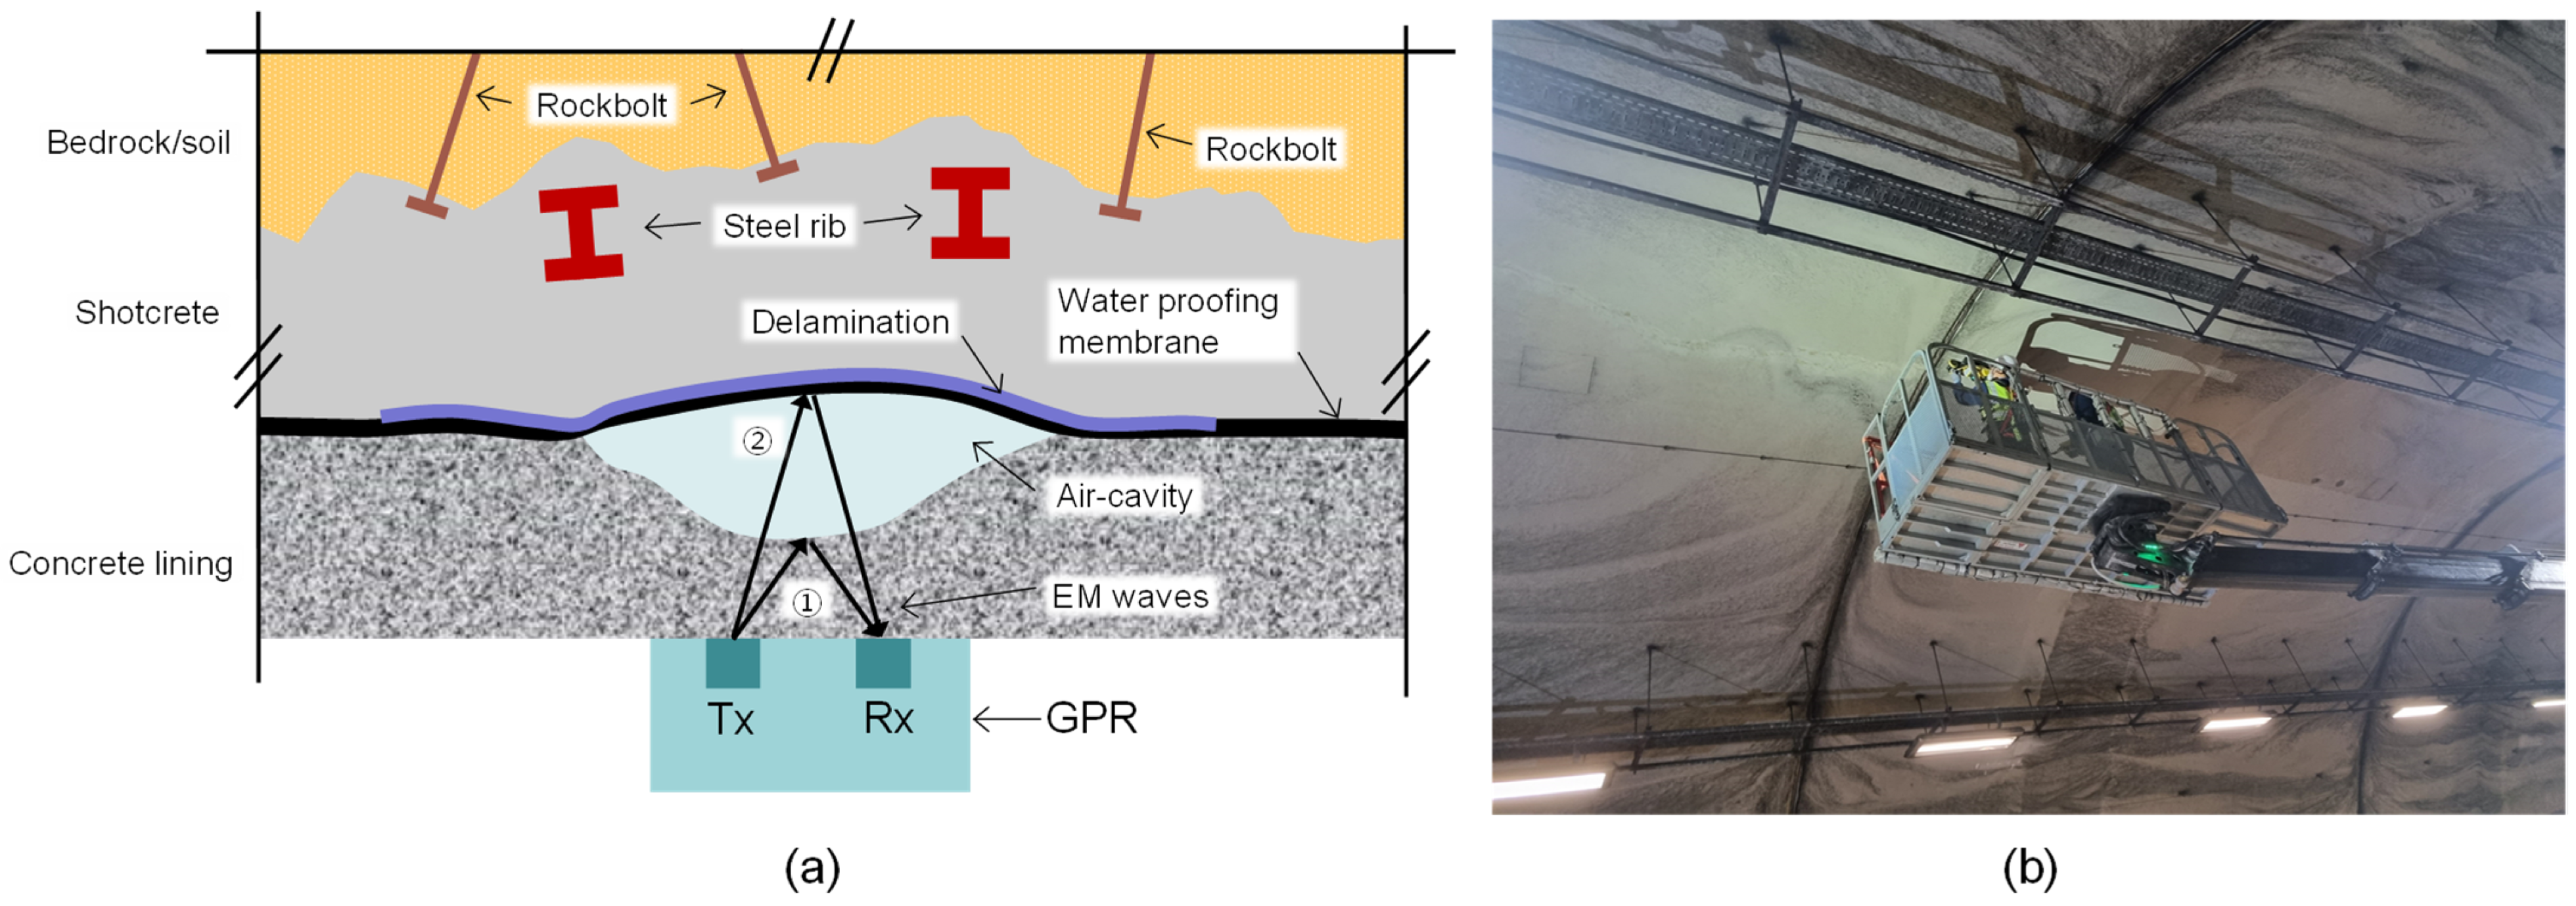
Tunnels are underground structures in civil engineering that create a path passing through natural or artificial barriers (mountains, water, roads, buildings, or entire cities) in railway or highway networks. Tunnels are regarded as critical nodes in transportation systems, on which higher priorities are generally placed in the strategic planning of infrastructure maintenance than on most other components in transportation networks [1]. Tunnel structures are composed of several critical elements such as concrete lining, shotcrete, water-proofing layers, and various metallic embedments (see Figure 1a). Among them, concrete lining, a two-dimensional curved structure located at the innermost of tunnel elements, is one of the most crucial elements in tunnel structures to secure the durability and structural stability of tunnels. Air-cavities are a typical defect in tunnel structures, which are located behind the concrete tunnel lining, caused by various reasons: over-excavation, incomplete filling of the rock-lining gap, and water leakage. The presence of air-cavities behind the tunnel linings does not necessarily imply the failure of tunnel structures. However, some sizable air-cavities could induce unexpected tensile stresses in tunnel linings and the relaxation of soil [2]. If not properly maintained, they can significantly increase the risk of local rock collapse behind tunnel linings, and the catastrophic collapse of the original ground [2,3,4]. Therefore, it is of importance to identify and characterize the air-cavities behind the concrete tunnel lining during the construction and operation stages of the structures, and, if necessary, proper maintenance actions can be made in a timely manner.
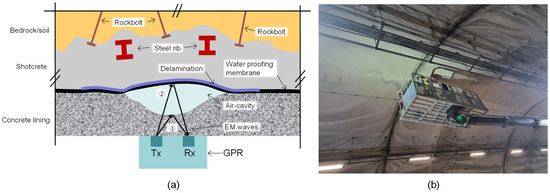
Figure 1.
GPR survey on the surface of concrete tunnel lining: (a) a conceptual drawing of a concrete tunnel lining section, including an air-cavity behind concrete lining, and (b) a photograph of GPR survey on the crown of concrete lining in an actual tunnel structure in Korea.
Ground Penetrating Radar (GPR) is a rapid and non-invasive inspection tool for evaluating critical features of various components in tunnel structures (as-built dimensions of lining concrete, engineering properties of constituent materials, anomalies within or behind lining concrete, etc.). Table 1 summarizes some previous researchers’ works for the evaluation of concrete tunnel lining using GPR [3,5,6,7,8,9,10,11,12,13,14,15,16]. It has been demonstrated by previous research works that GPR is a powerful technique for the evaluation of air-cavities within and/or behind concrete tunnel linings. GPR B-scan images visualize the presence of air-cavities in actual tunnel structures. The horizontal size (length) of air-cavities can be directly read from the horizontal axis of the GPR B-scan images. However, further signal processing processes are necessary to retrieve the vertical size (thickness) of air-cavities from GPR data. The two-way travel time method is useful for thickness estimation using GPR data. The thickness of air-cavities behind concrete tunnel lining can be estimated by measuring the two-way travel time of electromagnetic (EM) waves between the two surfaces of an air-cavity, when the velocity of EM wave is known, as follows:
where is the thickness of the air-cavity behind concrete, is the two-way travel time within the air-cavity, and is the EM wave velocity in air (~300 mm/ns). The two-way travel time method is especially effective in the high frequency conditions where the two EM pulses reflected at the top and bottom of the air-cavity (see ① and ② in Figure 1a) are sufficiently separated in the time signal. However, the air-cavities of interest in tunnel lining inspections in practice are generally categorized into the low frequency conditions because relatively low GPR antenna frequencies are usually used for tunnel inspections (see Table 1). Specifically, the thicknesses of air-cavities would be comparable to, or smaller than, the wavelength of dominant GPR signals. In the low-frequency conditions, the two reflection waves from the top and bottom of the cavity would partially or perfectly overlap each other, which poses difficulties in determining the two-way travel time of the two critical EM pulses within an air-cavity [17,18,19,20,21]. Previous researchers addressed several effective methods for the thickness evaluation of thin layers. This includes support for the vector machine method [22], regularized deconvolution method [18], and time-and-frequency method [19]. However, there is still a gap of knowledge to directly apply the previous methods for the evaluation of the thickness of the air-cavity behind tunnel concrete linings. This is mainly attributed to the fact that GPR signals are sensitive to various experimental parameters, which would be distinct in different GPR applications. Before achieving reliable results for the cavity evaluation in tunnel structures, it is of importance to understand the effects of various experimental parameters associated with the GPR survey for the tunnel structures: the properties of GPR antennas (air-coupled or ground coupled, frequency, configurations), thickness of concrete lining, thickness of air-cavities, scattering waves from reinforcing steel in lining concrete, types of materials filling cavities, water contents, etc. Unfortunately, until now, it is difficult to find available previous research works that addressed the effects of various experimental parameters on the evaluation of air-cavities behind concrete tunnel linings in a systematic way.

Table 1.
Summary of GPR survey for evaluation of lining concrete in tunnels.
This study is a part of a more comprehensive research project for developing an advanced in-situ GPR signal interpretation technique for the inspection of concrete tunnel linings in railway systems in Korea, which is led by a research team at the Korea Railroad Research Institute (KRRI). As preliminary research, the primary objective of this study is to investigate the effect of three experimental parameters (GPR antenna frequency, thickness of concrete lining, and thickness of air-cavities) on the evaluation of air-cavities behind concrete tunnel linings from GPR data. For these purposes, three main tasks were performed in this study. First, a concrete model specimen was fabricated to simulate air-cavities with various dimensional sizes (depths, thicknesses, and lengths) behind concrete in a laboratory. Second, a series of GPR surveys were performed using three ground-coupled GPR antennas with nominal center frequencies of 400 MHz, 900 MHz, and 1600 MHz. Third, we examined the effects of the three experimental parameters on the evaluation of important engineering parameters for tunnel structure inspection using GPR (thickness of concrete, and length and thickness of air-cavities). The results in this study would expand the understanding of important features of GPR signals interfering with the air-cavities behind the tunnel lining, which further improves the practicality of GPR for a more accurate evaluation of air-cavities in tunnel structures.
2. Experimental Program
2.1. Concrete Tunnel Lining Model Spcimen
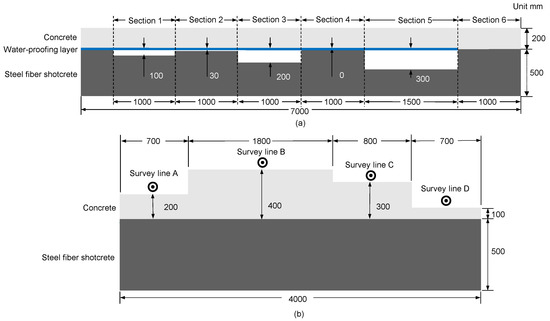
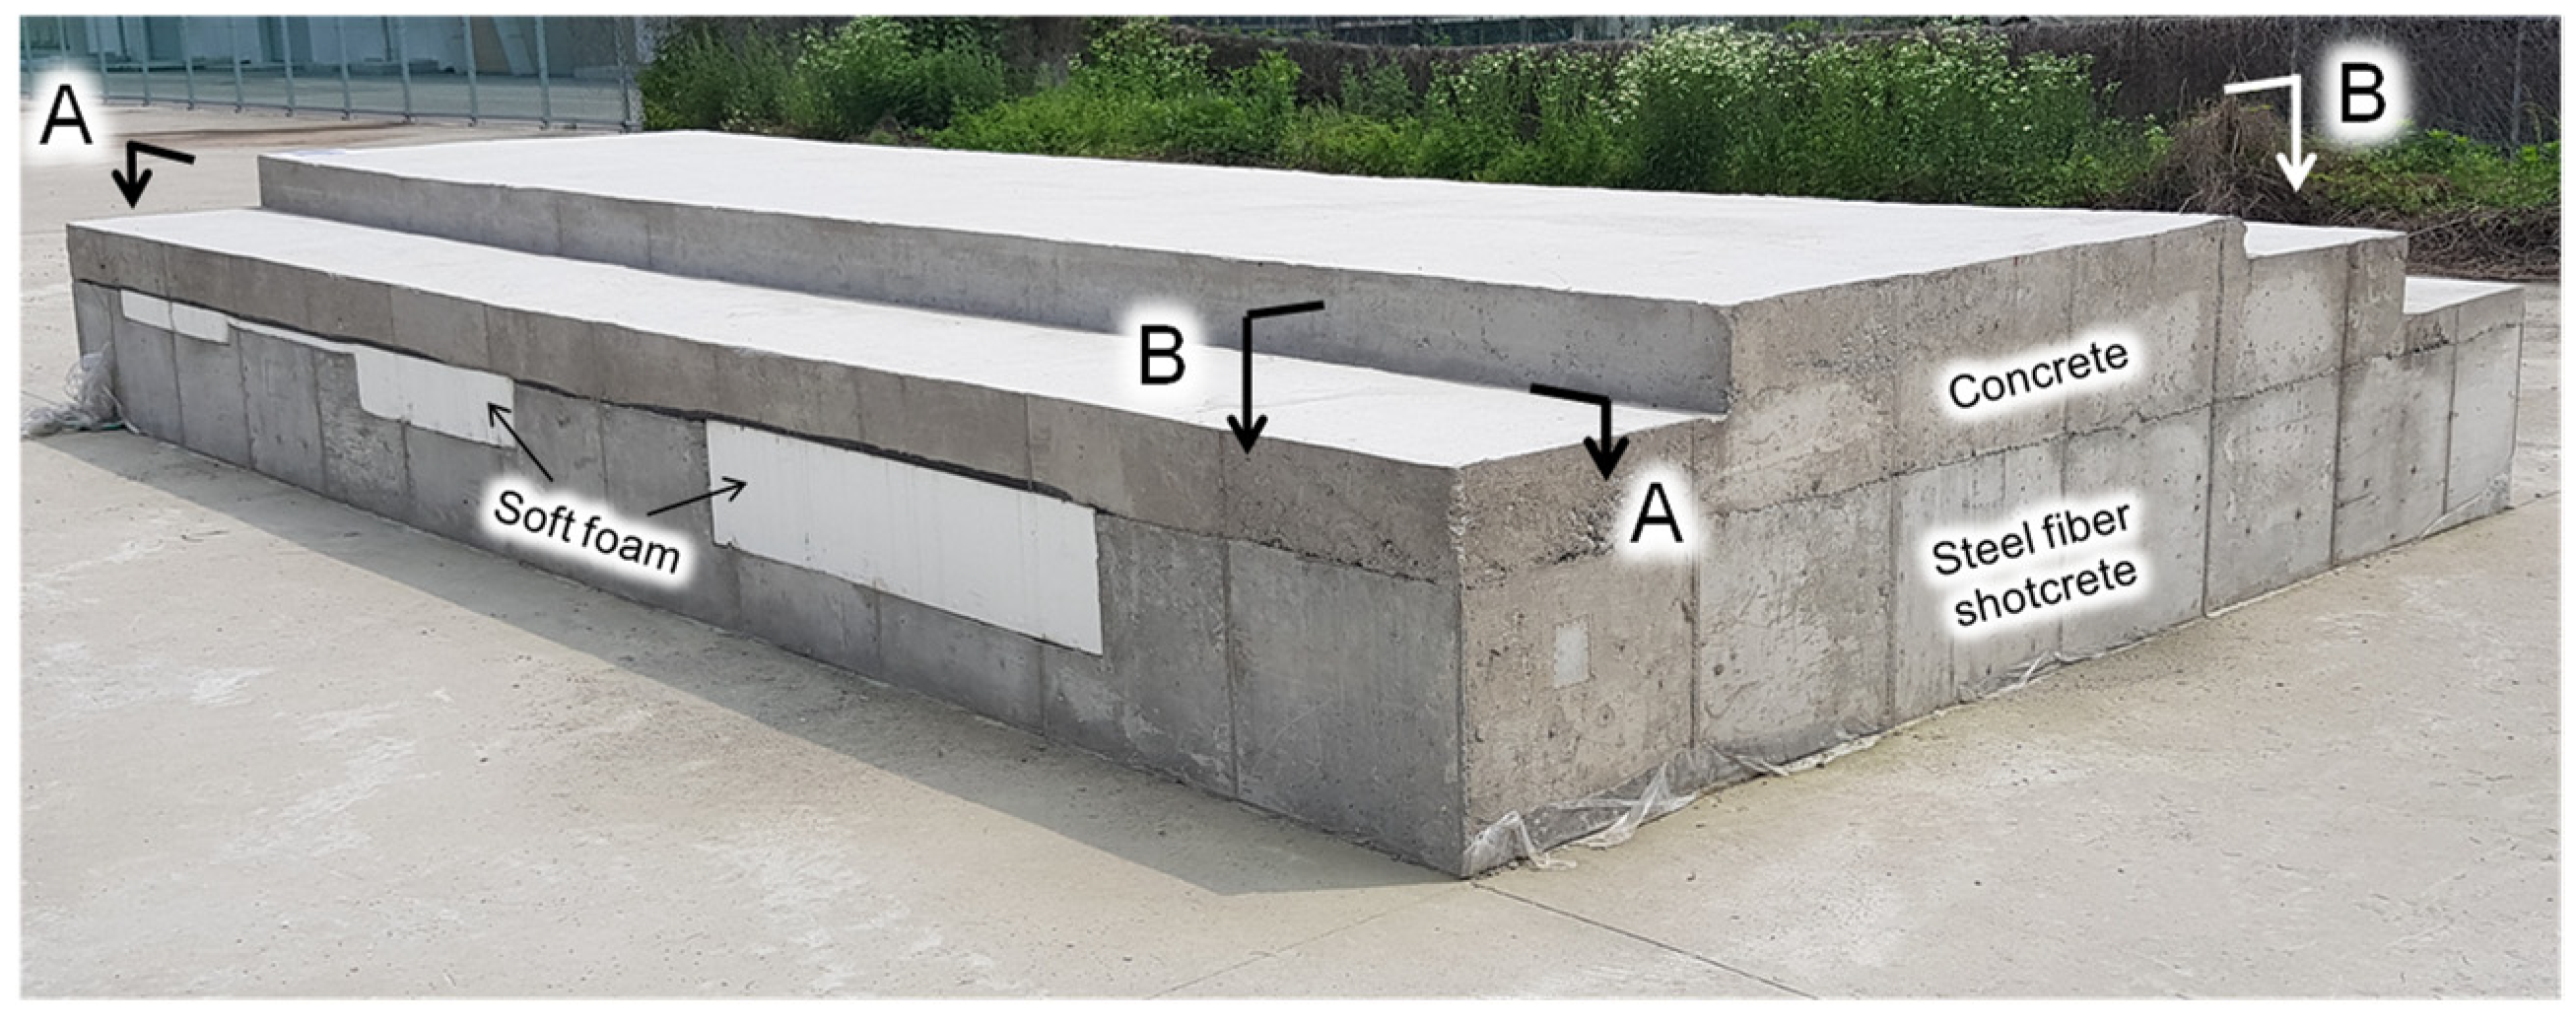
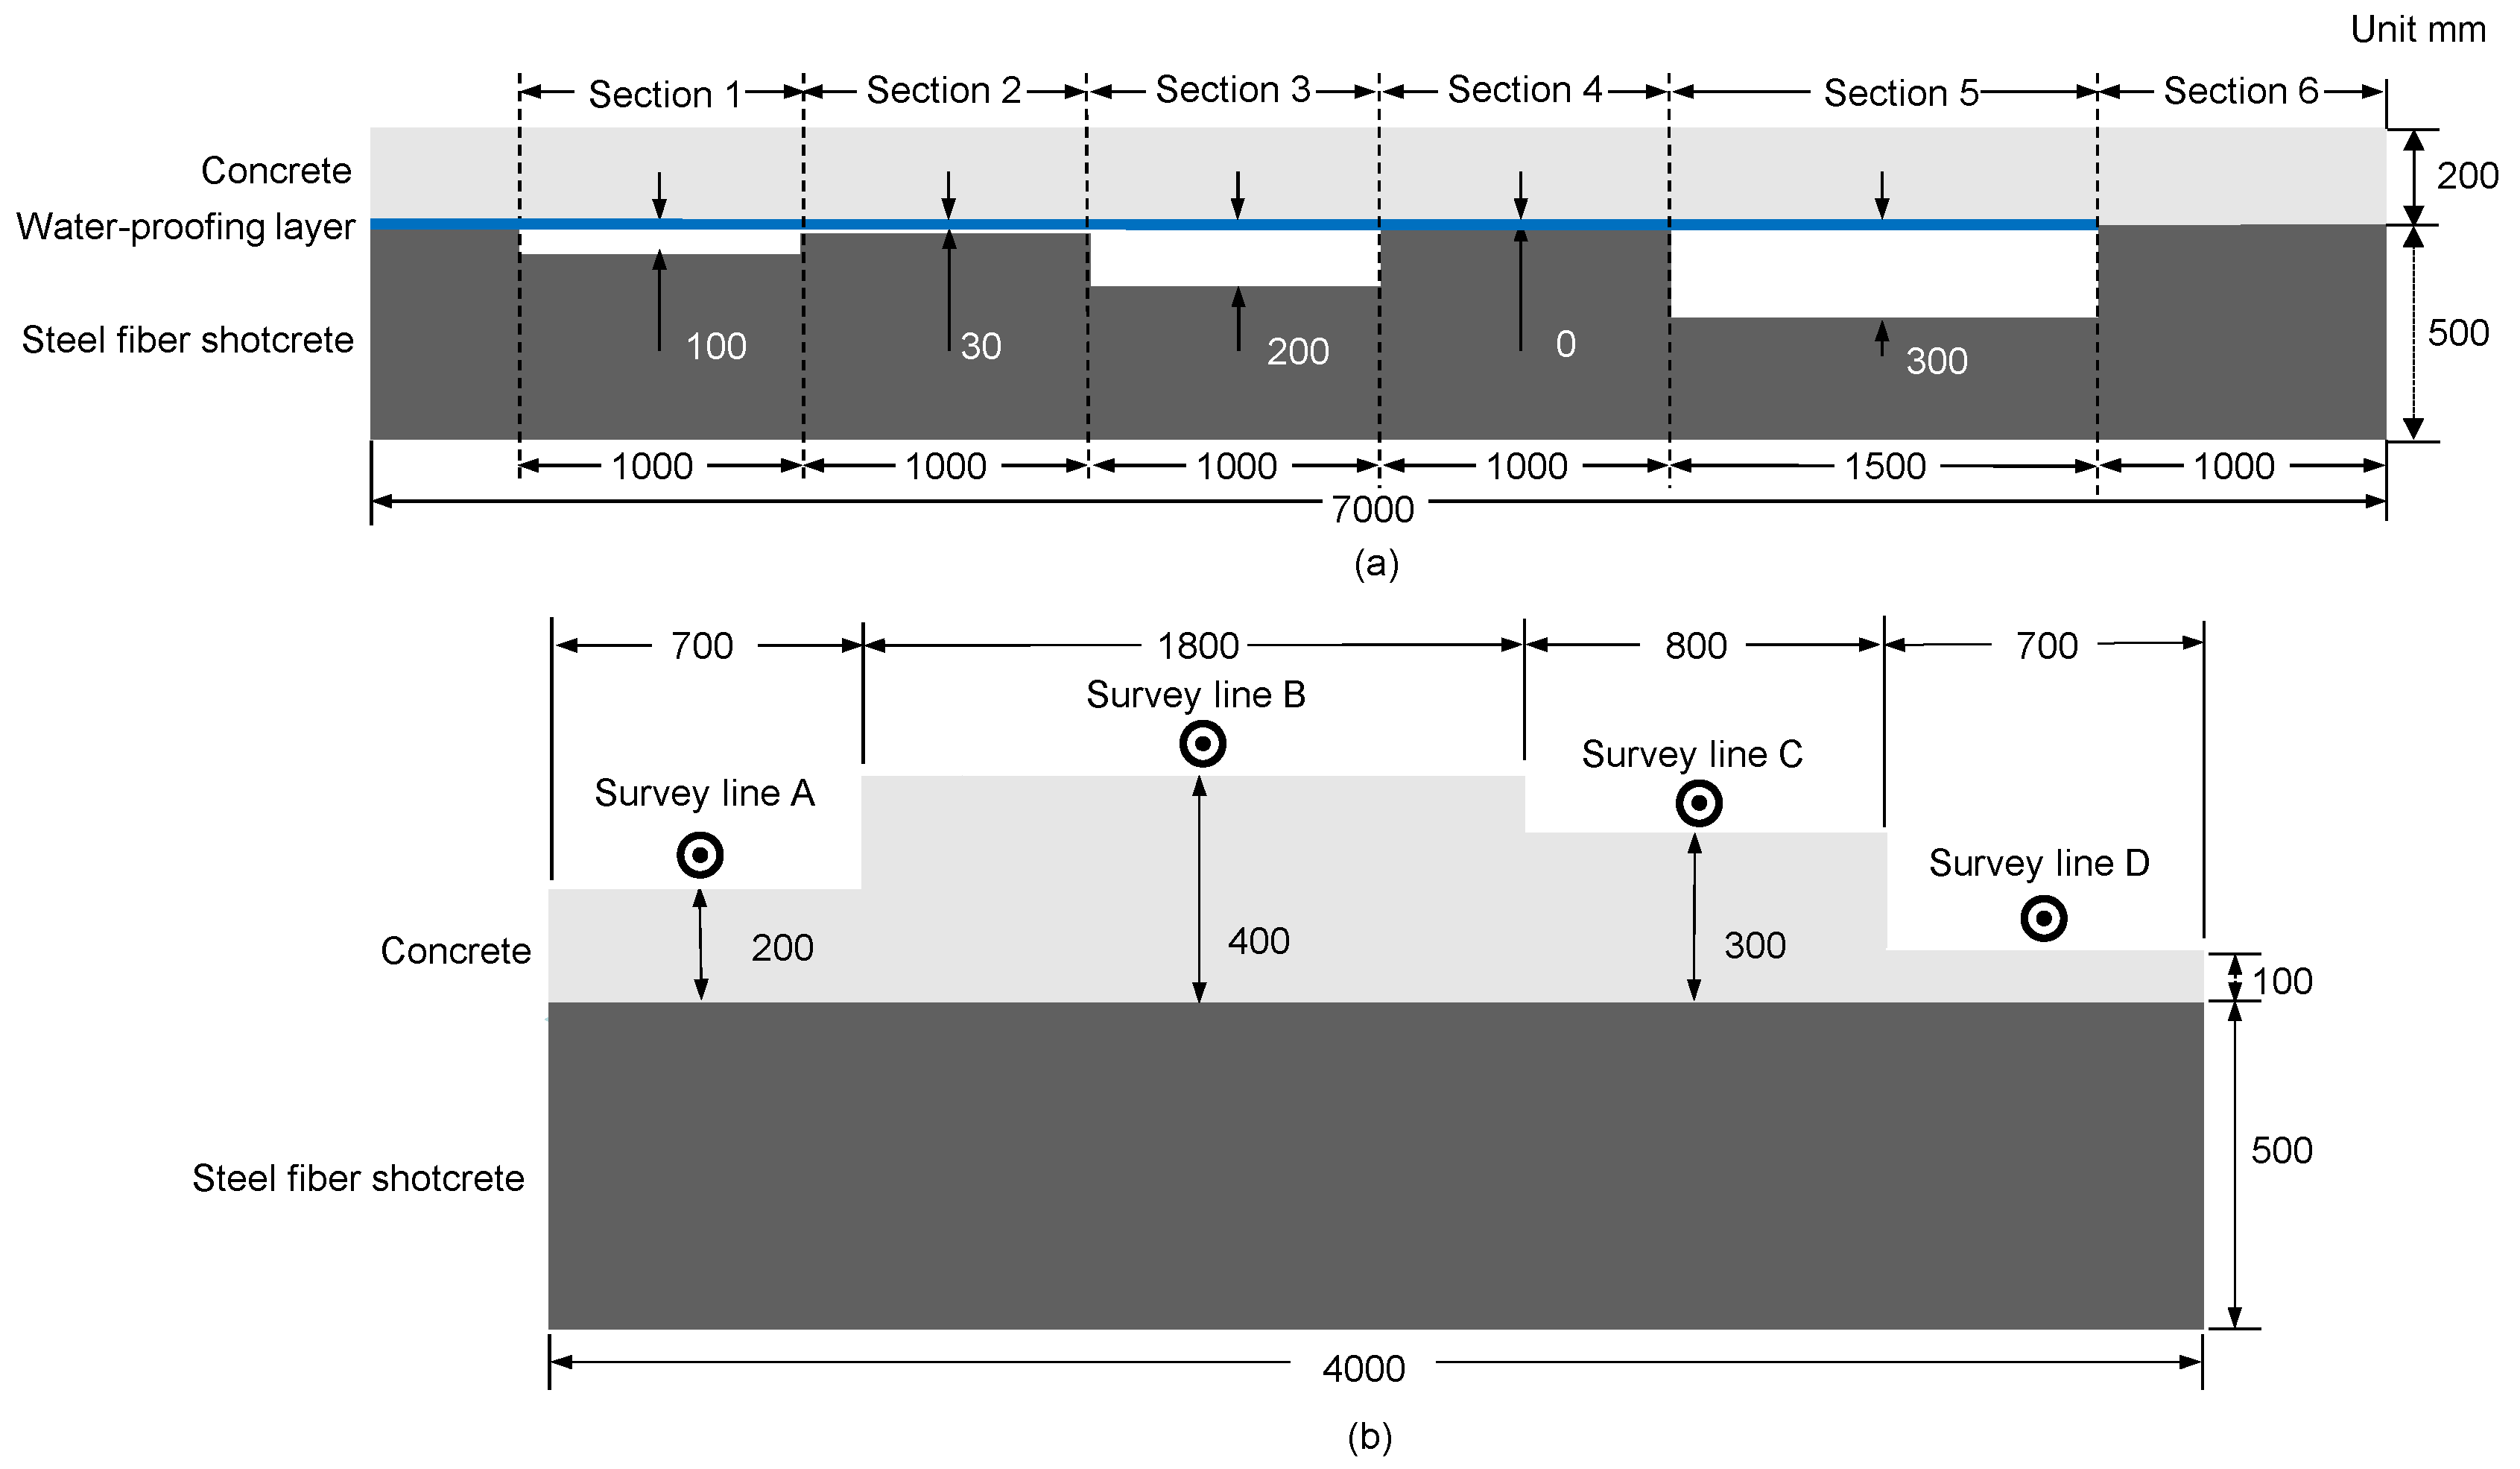
Figure 2 shows a photograph of the overall view of a concrete tunnel lining model specimen (hereafter referred to as concrete model specimen) fabricated and used for GPR exploration in this study. The concrete model specimen was designed and fabricated in accordance with the standard specification for tunnels in Korea [23]. The model specimen is composed of two layers, each of which represents the concrete lining and the shotcrete in tunnel structures. The upper layer was made of concrete without reinforcing steel, and the average compressive strength measured for 28 days was evaluated to be 30.5 MPa. The lower shotcrete layer was fabricated by mixing a 30 kg/m3 steel fiber as specified in the design code [23]. The average compressive strength and tensile strength of the shotcrete measured for 28 days were 28.3 MPa and 5.1 MPa, respectively. A water-proofing layer was installed between the concrete and shotcrete layers. Figure 3a,b show the longitudinal (section A-A in Figure 2) and transverse sections (section B-B in Figure 2) of the model specimen, respectively. In the longitudinal section, sections 1, 2, 3, 4 and 5 were constructed, with cavity thicknesses of 100 mm, 30 mm, 200 mm, 0 mm (no cavity), and 300 mm, respectively. The air-cavity in the concrete model specimen was fabricated by installing expanded polystyrene blocks as large as the designed size of cavities in the wooden form before pouring concrete. Furthermore, section 6 was identical to section 4 except that it was constructed without a water-proofing layer. It was intended to investigate the effect of the water-proofing layer on the GPR signals. The transverse section of the model specimen was divided into four sections according to the thickness of the lining concrete (i.e., 100 mm, 200 mm, 300 mm, and 400 mm). The critical components in the model specimen (e.g., concrete, shotcrete, and cavities) were designed to properly reflect the actual tunnel lining concrete in Korea that has been observed by field inspections performed by KRRI in the last decade. All the materials used for the construction of the model specimen were carefully selected to have equivalent performance of those used in actual railway tunnel construction in Korea. Concrete was provided by a batch plant that supplies the concrete for the actual tunnel construction sites. Furthermore, prefabricated materials, such as plastic sheets for water-proofing layer and steel fibers for the shotcrete, were supplied from a construction company for the tunnel construction.
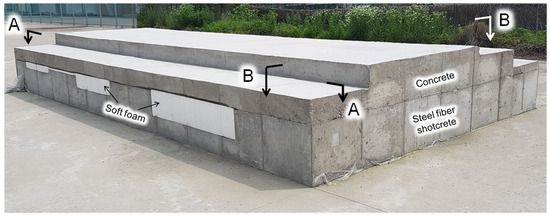
Figure 2.
Photograph presenting overall view of the concrete tunnel lining concrete model specimen fabricated and used for GPR survey in this study.
2.2. GPR Measurements
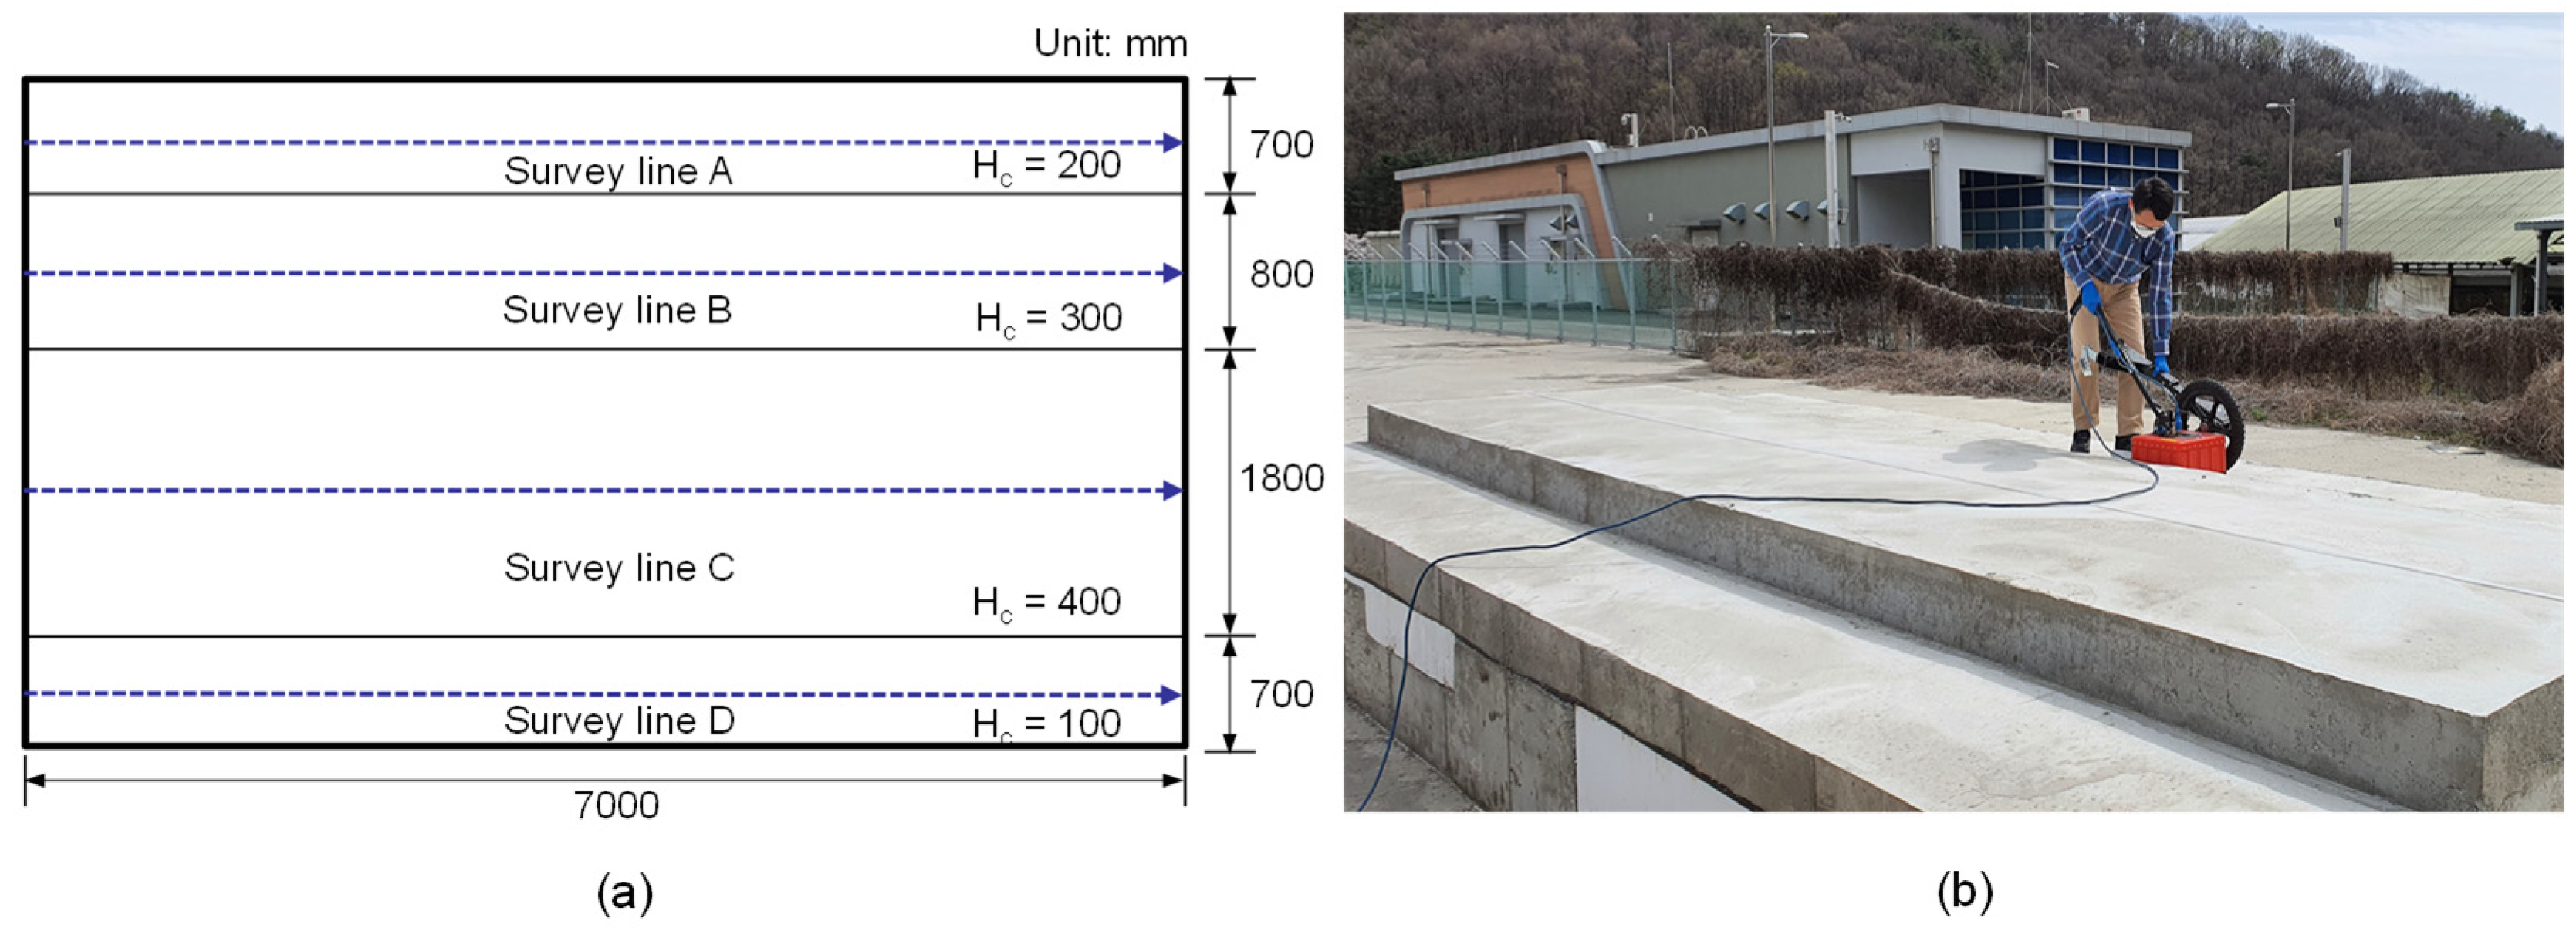
GPR signals were collected using a single-channel SIR-30 system manufactured by GSSI (Geophysical Survey Systems, Inc., Nashua, NH, USA) in the US. Three GPR antennas (400 MHz, 900 MHz, and 1600 MHz) were used to investigate the frequency-dependent features of the GPR signals with the experimental variables in this study (i.e., lining concrete thickness and cavity thickness). The measurements were directly conducted on the surface of each concrete layer thickness. The GSSI instrument used a wheel as a trigger to collect the data continuously. The measurement parameters for each antenna were set in considering the testing variables. The parameters of measurement were already set consistently for each data collection with a 20 ns time window span. The GPR signals were measured by a scanning speed of 120 scans/s at 512 samples. In addition, the penetration depth can be set up to 1000 mm depending on the user preferences. The GPR survey was performed in the longitudinal direction on the four concrete layers with different lining concrete thicknesses in the concrete model specimen (see Figure 4). Each longitudinal GPR survey covered the six sections that included different cavity thicknesses and the presence of a waterproofing layer. As such, the test plan in this study enabled us to collect various GPR signals, reflecting a total of 24 different test conditions according to the concrete thickness, cavity thickness, presence of water-proofing layer, and GPR antenna frequency. In this study, GPR surveys were repeated on the three different concrete ages (7 days, 28 days, and 70 days after casing concrete). However, it was difficult to properly evaluate the features of air-cavities behind lining concrete by using GPR signals obtained at the 7 days and 28 days due to substantial attenuation in reflected EM waves. This phenomenon can be explained by the fact that the electrical properties of concrete had not reached stabilization at such early ages of the concrete due to the influence of free water in concrete pores, which is strongly dependent on the degree of cement hydration in concrete [24,25]. In contrast, it was observed that the penetration depth of the GPR signals at 70 days was significantly improved compared to those measured in the two early ages, and clear enough to evaluate the characteristics of air-cavities behind concrete with various thicknesses. Note that the results of this study are described based on the GPR signals measured at 70 days of concrete.
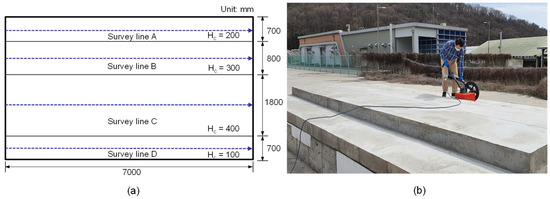
Figure 4.
GPR survey on the concrete tunnel lining model specimen in this study: (a) plan for the GPR line scanning on the surface of concrete, and (b) photograph of GPR lining scanning through the test line B on the 300 mm thick concrete.
3. GPR Signal Analysis
3.1. Principle of GPR Survey for the Concrete Tunnel Lining Inspection
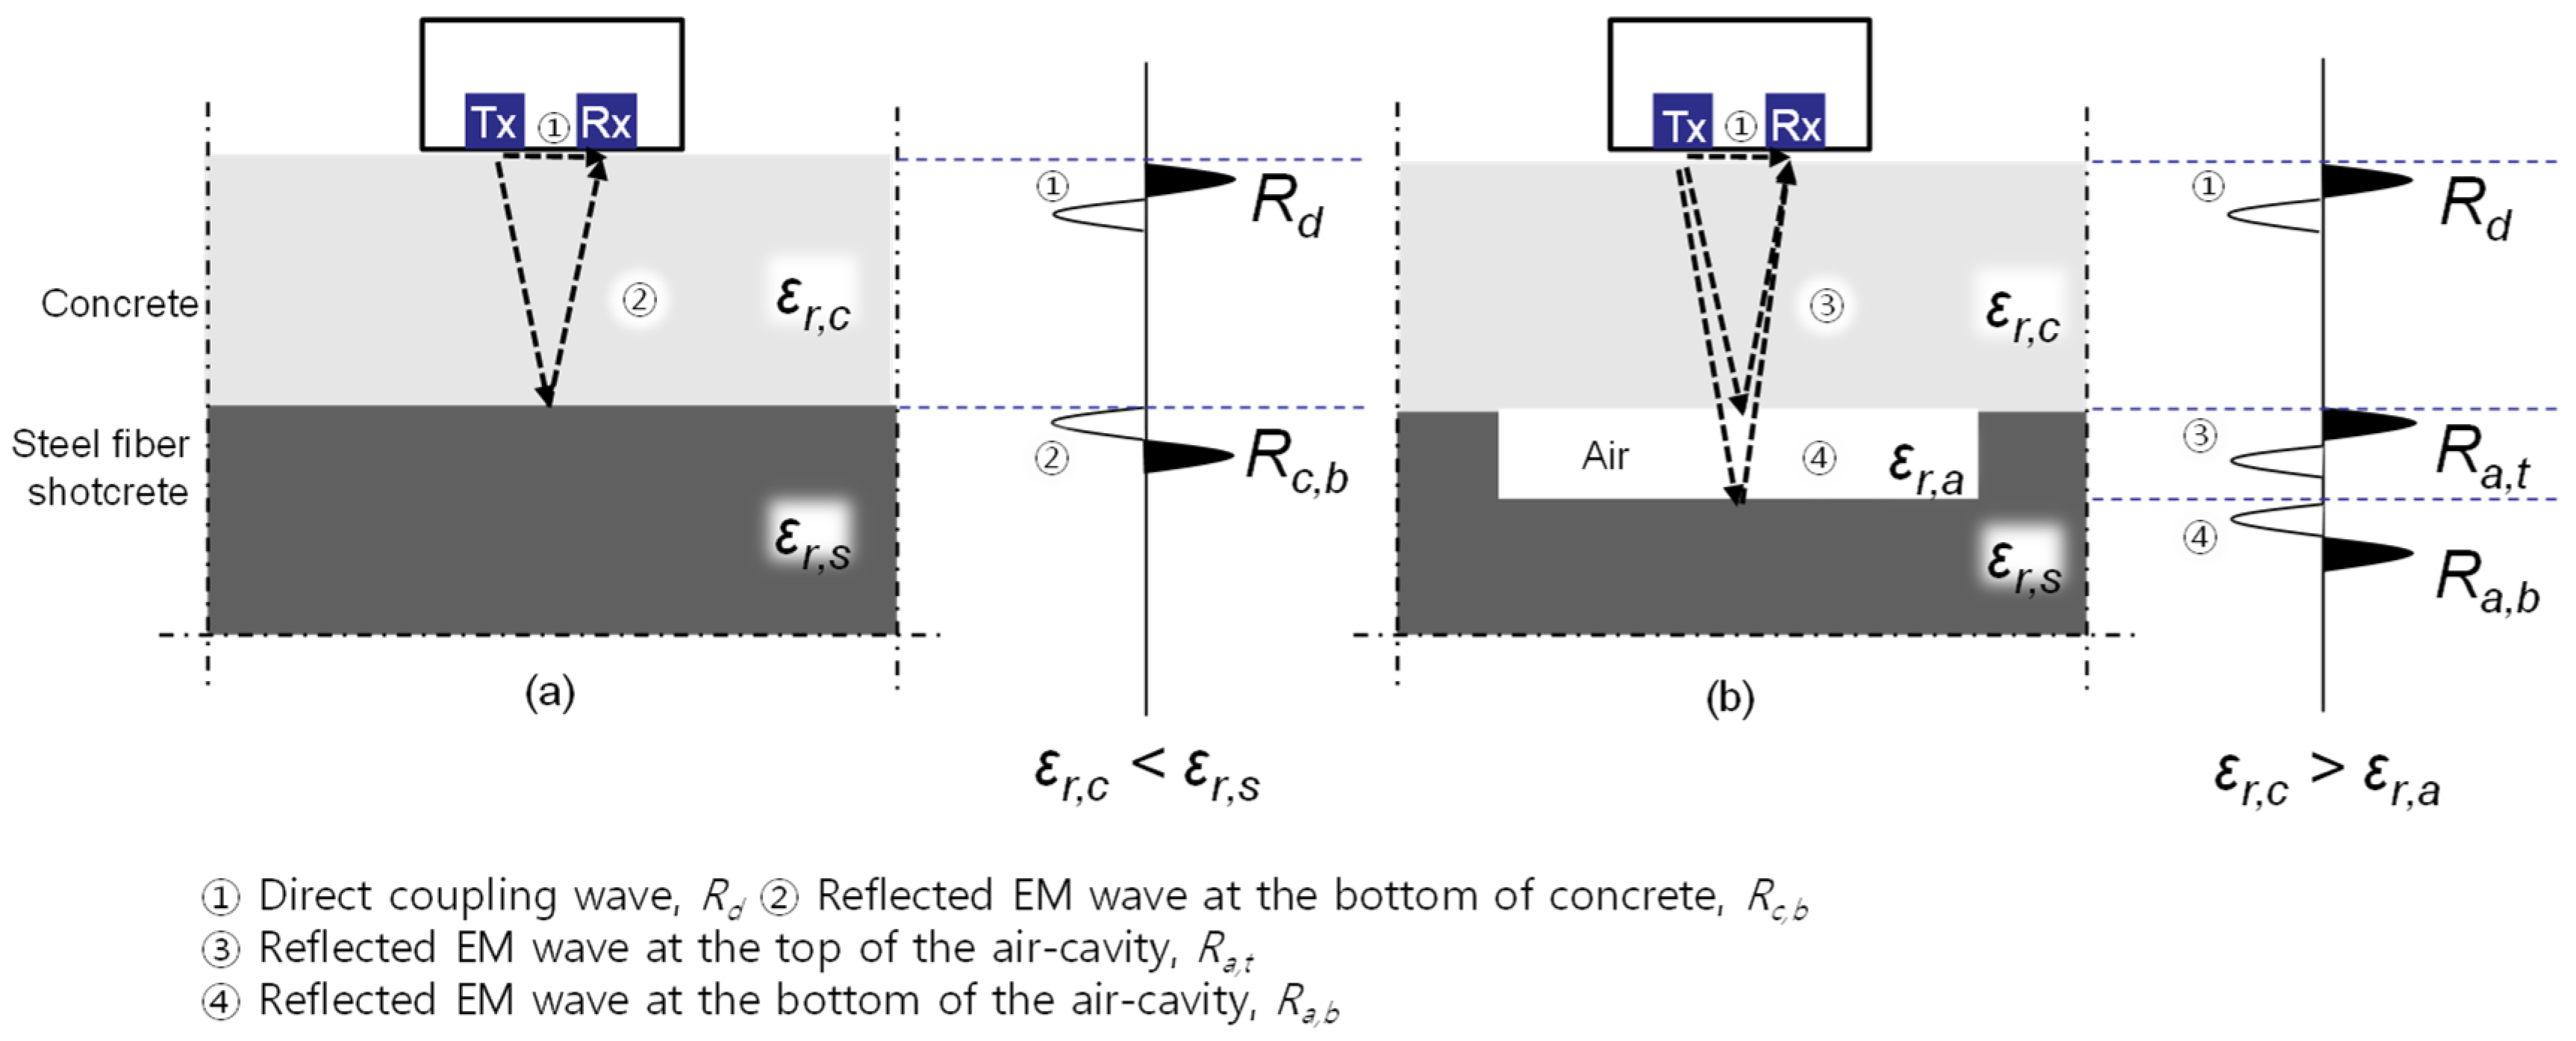
GPR is a nondestructive testing (NDT) method that basically uses two radar antennas. A transmitting antenna generates a transient electromagnetic (EM) pulse, which penetrates the concrete lining. A receiving antenna detects reflected EM pulses from the internal reflectors within or behind the concrete lining. Figure 5a illustrates the typical wave paths of the EM pulse within solid concrete lining. The first signal is a direct-coupling wave, Rd (① in Figure 5a), that is a consequence of interference between a direct EM pulse, propagating from the transmitting antenna to the receiving antenna through air, and a reflected EM pulse at the top surface of the concrete. The direct-coupling wave is followed by the EM pulse reflected at the bottom of the concrete, Rc,b (② in Figure 5a), if there is no internal reflector within the concrete. Based on the wave reflection theory, the thickness of the concrete lining, Hc, can be expressed using the EM wave velocity in air, ; relative permittivity of concrete,; and two-way travel time of EM reflection at the bottom of concrete (or interface between the concrete and shotcrete in tunnel structures), tTWTT,c, as follows:
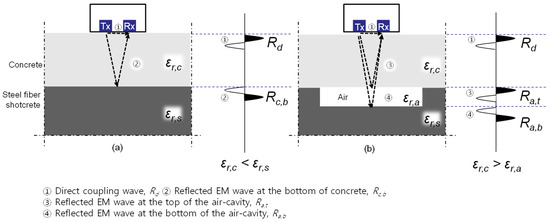
Figure 5.
Typical paths of electromagnetic waves propagating: (a) in the solid tunnel structure without air-cavity, and (b) in the defected tunnel structure with air-cavity behind concrete.
In contrast, Figure 5b illustrates the typical wave paths of EM pulses behind concrete with an air-cavity. Similarly, an EM reflection occurs at the top of the air-cavity (or the interface between the concrete and air), Ra,t (③ in Figure 5b), which follows the direct coupling wave in the time signal. In addition, an EM pulse is reflected at the bottom of the air-cavity (or the interface between the air and shotcrete), Ra,b (④ in Figure 5b), which appears in the time signal just after Ra,t.
It is well known that the sign of the reflected EM waves is dependent on the relative permittivity of the propagation medium (concrete in this study), and that of the medium to which the EM waves transmit (air or shotcrete in this study), as follows:
where and are the relative permittivity of medium 1 and medium 2 (i.e., concrete and shotcrete, respectively, in Figure 5). The reflection coefficient, , will be positive (or negative) if the relative permittivity of medium 1 (concrete) is less (or greater) than that of medium 2 (shotcrete). Therefore, the phases of EM reflections are informative on the dielectric properties of internal reflectors, which is discussed in more detail in Section 4.3 of this article.
3.2. Typical GPR Signals
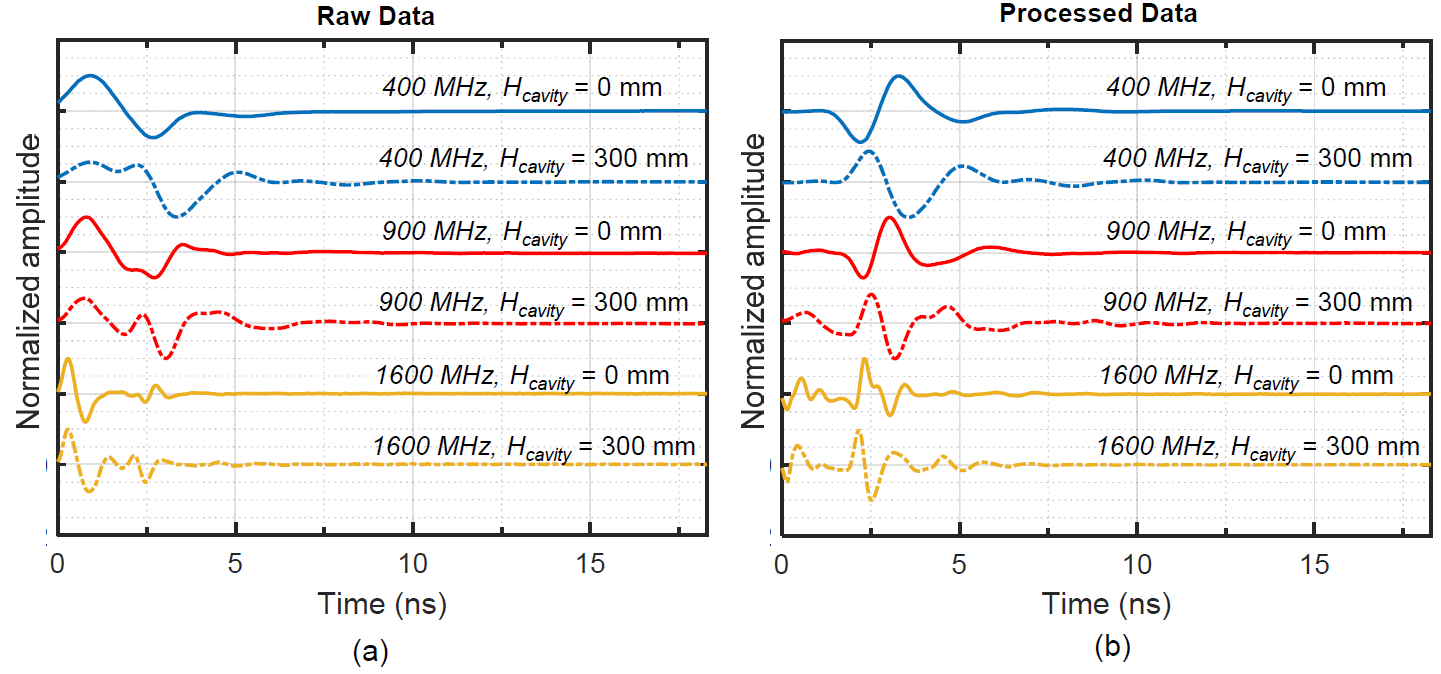
Figure 6a shows typical raw GPR signals measured on the 100 mm thick concrete in test section 4 (non-cavity region), presented as solid lines, and section 5 (over the 300 mm thick air-cavity), as dashed lines. In contrast, Figure 6b shows the GPR signals after three steps of signals processing: time zero-correction, DC component (bias by direct current voltage) removal, and background noise removal by using mat GPR3.0 [26]. In this study, the first arrival time of the direct coupling waves was defined as the zero time of the GPR signals so that the depth of the reflector in the concrete could be accurately determined [27]. In the raw GPR signals in Figure 6a, it was difficult to clearly observe the important EM reflections described in Section 3.1. This is mainly because the direct coupling waves interfere with the EM reflections from the internal reflectors (i.e., concrete-shotcrete interface, and the top and bottom surfaces of air-cavities). In contrast, the processed signals in Figure 6b clearly show the critical EM reflection behind the concrete. Therefore, it can be demonstrated that the signal processing procedure used in this study is effective for preparing a high-quality signal for the evaluation of air-cavities behind concrete in this study.
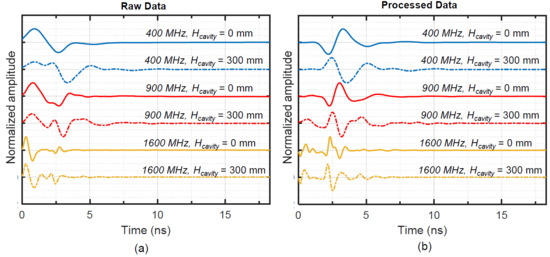
Figure 6.
Typical GPR signals measured on the section 4 (non-cavity region) and section 5 (defected test region with a 300 mm thick air-cavity) behind 100 mm concrete by the three GPR antennas (400 MHz, 900 MHz, and 1600 MHz), presented as blue, red, and yellow lines, respectively: (a) raw GPR signals and (b) processed GPR signals.
3.3. Detection of Air-Cavity Using Cross-Correlation Analysis
Typical GPR signals in Figure 6b clearly show that the sign of EM reflections at the concrete–air interface is reversed to that of EM reflections at the concrete–shotcrete interface. Theoretically, it can be explained by the Fresnel’s formula. In this study, the cross-correlation analysis was used to differentiate solid test regions from defected test regions based on the phase reversal of the two reflections from the two different interfaces. Cross-correlation analysis was used to process GPR data based on similarities between two EM waves. The cross-correlation in the time domain of two discrete time series of radar signals, x(m) and y(m), is given as follows:
where is the compared GPR signal, is the reference GPR signal, and is the discrete sampling point of time signals, N is the total numbers of samples involved in the cross-correlation calculation, and τ is the delay time. In this study, a single GPR trace was extracted in the middle of the section 4 (non-cavity region) as a reference signal, y(m), in each GPR radargram. Furthermore, Rxy(τ) was normalized by the autocorrelation of x(m) and y(m) at the time lag 0 as follows:
Consequently, the cross-correlation coefficient, , in this study was in the range of −1 and 1. A test region that resulted in the normalized cross-correlation coefficient closer to 1 was determined as a solid region. In contrast, the test region closer to −1 was interpreted as a defected region including an air-cavity.
3.4. Two-Way Travel Time Method for the Thickness Evaluation of Air-Cavities
Figure 7a–c exhibit typical GPR A-scan data measured over the middle of the air-cavities with thicknesses, Hcavity, of 30 mm, 100 mm, 200 mm, and 300 mm behind the 100 mm thick concrete by each GPR antenna. For a comparison, the test results over solid concrete (i.e., Hcavity = 0) are also shown in the figure. Although not included in this article, the GPR data measured on the concrete with greater thicknesses (i.e., 200 mm, 300 mm, and 400 mm) were comparable to the data shown in Figure 7, except for the time shift, as much of the EM wave travels within the increased concrete thicknesses. It was noticed that the polarity flip was observed in the GPR signals measured over the 30 mm thick air-cavity by the 400 MHz antenna, which was inconsistent with other GPR signals. There are several possible reasons of the inconsistent signal pattern, which include: (1) the destructive interference of the tightly closed two reflections waves from the top and bottom of thin air-cavities, Ra,t and Ra,b; (2) imperfect performance of the background-noise-removing filter used in this study; and (3) some experimental uncertainties caused by construction errors in the concrete model specimen.

Figure 7.
Typical GPR A-scan signals measured over the center of the air-cavities with thicknesses of 30 mm, 100 mm, 200 mm, and 300 mm behind the 100 mm thick concrete by using the three GPR antennas with a center frequency of (a) 400 MHz, (b) 900 MHz, and (c) 1600 MHz. The first peaks of the top and bottom reflections from air-cavities were determined by the improved two-way travel time method, and denoted as open circles in the figures.
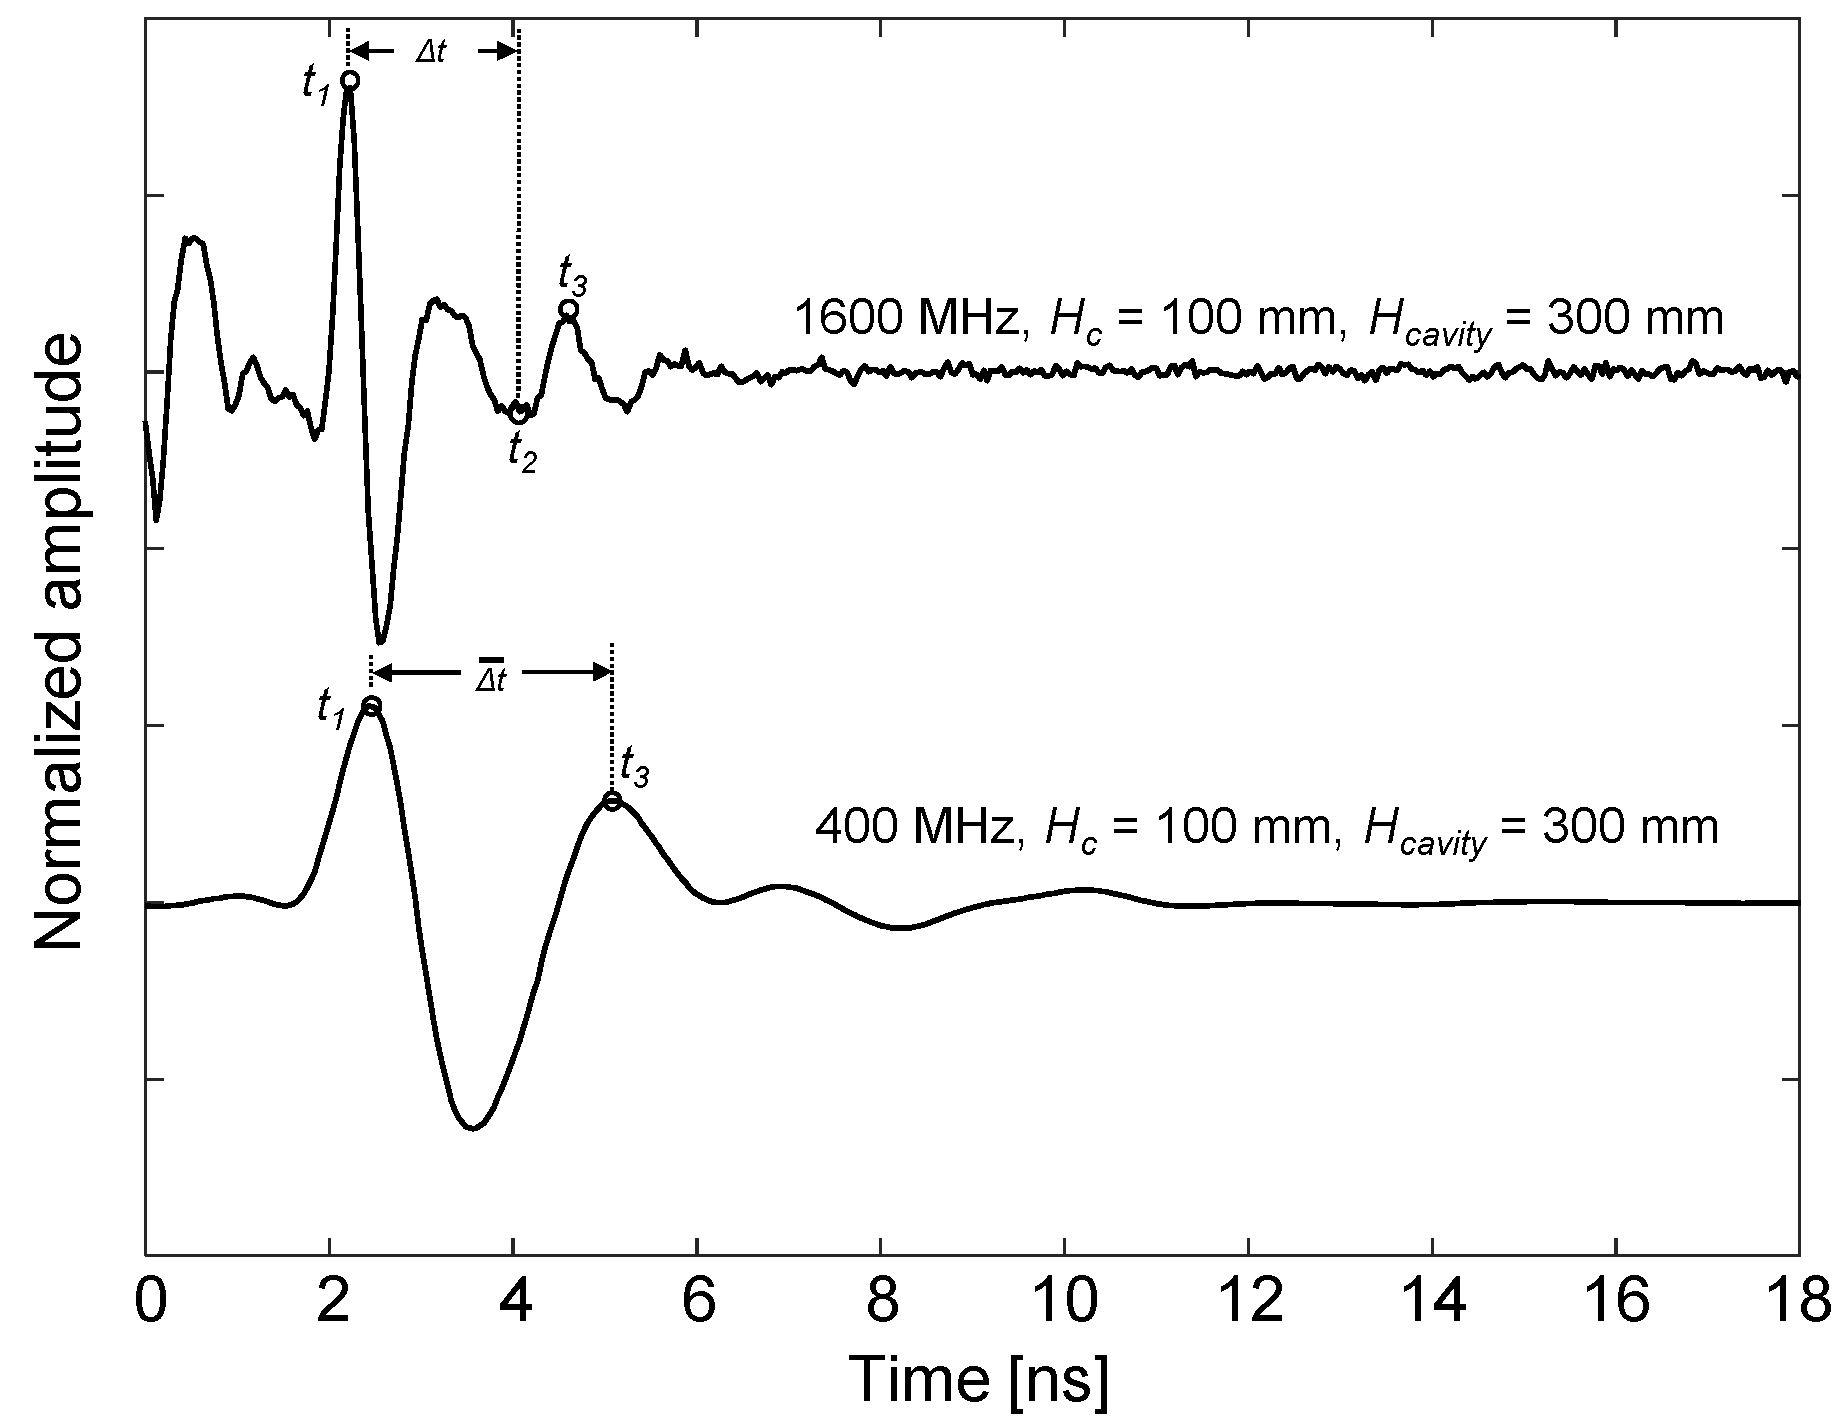
By inspection, the GPR A-scan signals measured in this study can be divided into two groups by the normalized cavity thickness (the thickness of an air-cavity normalized by the wavelength of primary GPR signals, Hcavity/λGPR). In this study, GPR measurement was categorized into the high-frequency conditions when Hcavity/λGPR was greater than 0.5, in which the top reflection, Ra,t, can be separated from the bottom reflection, Ra,b, in the time signals. Otherwise, it was categorized into the low-frequency conditions. The upper and lower GPR signals presented in Figure 8 are typical GPR signals measured in the high- and low-frequency GPR measurement conditions, respectively. In the high-frequency conditions, the top and bottom reflections from the air-cavity are clearly separated in the time domain. The thickness of the air-cavity can be estimated by incorporating the time delay, Δt, into Equation (1), as follows:
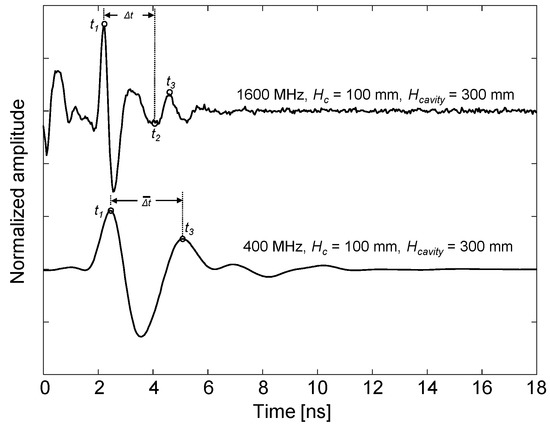
Figure 8.
Typical GPR data categorized into the high- and low-frequency conditions. The upper and lower signals were measured over the 300 mm thick air-cavity behind the 100 mm thick concrete by 1600 MHz and 400 MHz antennas, respectively.
For example, the arrival times to the first peaks of the top and bottom reflections (Ra,t and Ra,b, respectively), t1 and t2 in Figure 8, are 2.19 ns and 4.27 ns, which results in Δt of 2.07 ns. Consequently, the predicted cavity thickness was 310.93 mm, which has a good agreement with the true value (or as-built dimension) of 300 mm, with an error of about 4%.
In contrast, it is difficult to read t2, the first negative peak of Ra,b, in the GPR data measured in the low-frequency conditions because of the interference of the two reflections (Ra,t and Ra,b). The constructive interference of the two reflections resulted in a single waveform with an apparent period of . In this study, the apparent period, was defined as the time delay between the two positive peaks ( of the combined reflection wave. Theoretically, the thickness of the air-cavity can be related to as follows:
where TGPR(f) is a period of a GPR pulse, which is dependent on the GPR antenna frequency and electrical properties of propagating media. Equation (7) is a novel expression proposed in this study that enables us to evaluate the thickness of an air-cavity behind concrete lining using GPR data measured in the low-frequency conditions. The validity of this formula, called the improved two-way travel time method in this study, will be demonstrated in the later part of this study.
4. Results and Discussions
This section describes the experimental results of GPR measurements on the concrete model specimen in this study. Discussions are made on the effects of the three experimental variables (GPR antenna frequency, concrete thickness, and air-cavity thickness) for the evaluation of important engineering parameters (thickness of concrete, and length and thickness of air-cavities) for tunnel structure inspection using GPR. First, all GPR data collected in this study are visualized in the GPR B-scan images (or radargram) in Section 4.1, which enables us to understand the effect of the three experimental variables on the quality of the GPR signals. Second, in Section 4.2, the relative permittivity of the concrete is evaluated by measuring the two-way travel time of the EM reflection by the bottom of concrete, Rc,b, which leads to a useful range of relative permittivity of the concrete for the evaluation of the thickness of the lining concrete. Third, a binary classification model based on the cross-correlation of GPR signals is used to identify the air-cavities behind the concrete in Section 4.3 and to characterize the lengths (horizontal dimensions) of the detected air-cavity regions in Section 4.4. Fourth, in Section 4.5, the thickness (vertical dimensions) of the detected air-cavity regions is evaluated by measuring the apparent time delay, , in the partially overlapped GPR signals. Proper GPR antenna frequencies are recommended for the evaluation of the critical engineering parameters after a compromise between the accuracy of data interpretation methods and the quality of GPR signals subjected to the dimensions of concrete linings and air-cavities.
4.1. GPR Radargram
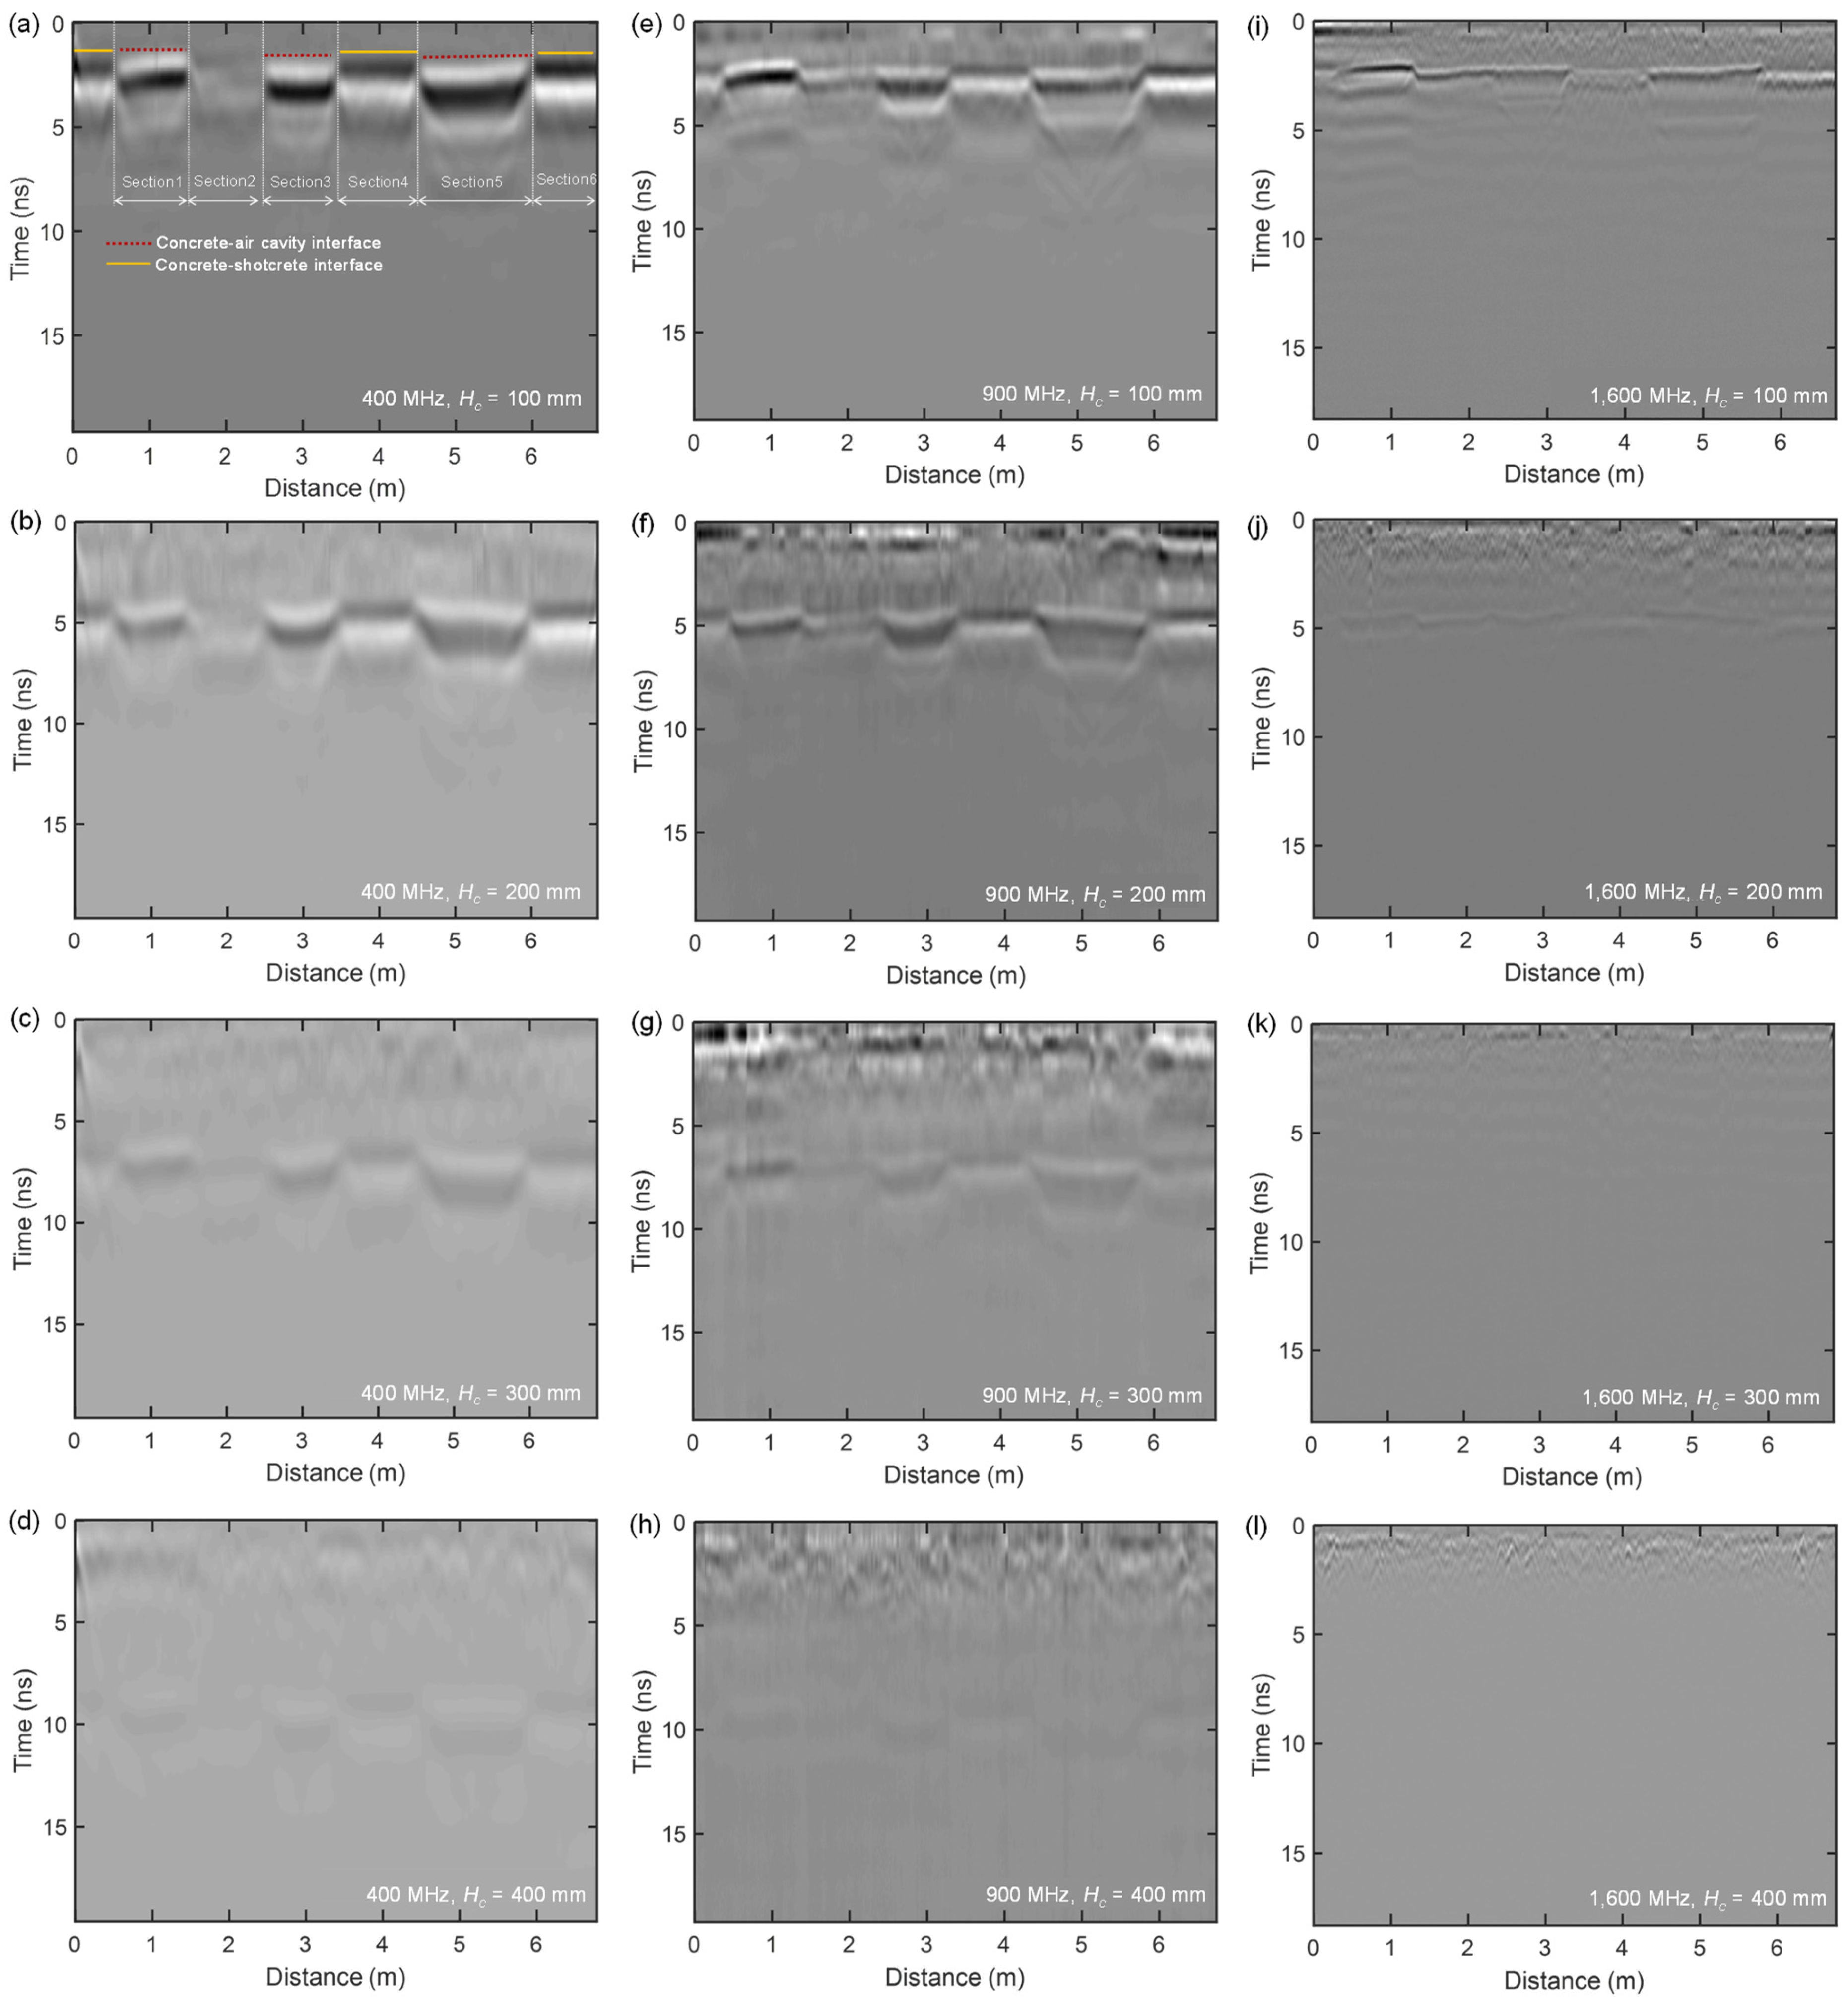
Figure 9 shows twelve GPR B-scan images (or radargrams) obtained from the GPR measurements on the surface of the model specimen through the four longitudinal survey lines, A~D in Figure 4a, by the three GPR antennas. The GPR radargrams were constructed based on the processed EM signals described in Section 3.2. The four survey lines, A~D, were on the concrete with four different thicknesses: 200 mm, 300 mm, 400 mm, and 100 mm, respectively. The horizontal axis of the GPR radargrams presents the distance from the starting point of each GPR survey, which was measured by the external encoder wheel of the GPR equipment. The vertical axis represents the two-way travel time (TWTT) of the EM waves reflected from the reflectors in the model specimen. Overall, GPR radargrams effectively visualize the important features of the concrete and the air-cavities behind concrete.
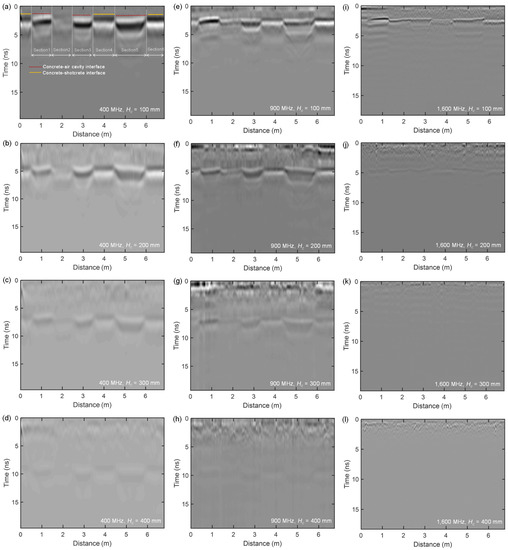
Figure 9.
GPR B-scan radargrams measured on the surface of concrete with various thicknesses, Hc, (100 mm, 200 mm, 300 mm, and 400 mm from top to bottom rows) in the concrete model specimen in this study using the three GPR antennas (400 MHz, 900 MHz, and 1600 MHz, from left to right columns): (a–d) using 400 MHz antenna, (e–h) using 900 MHz antenna, and (i–l) using 1600 MHz antenna on concrete with thicknesses Hc = 100 mm, 200 mm, 300 mm, and 400 mm, respectively.
First, the variation of concrete thickness can be clearly observed in the GPR radargrams. Figure 9a–d, representing the GPR radargrams measured on the concrete with thicknesses of 100 mm~400 mm measured by the 400 MHz GPR antenna, show that the two-way travel time of the first EM reflections at the bottom of the concrete increases when increasing the thickness of the concrete. In practice, the thickness of the tunnel lining is usually estimated by incorporating the measured two-way travel time from the GPR radargram into Equation (2), assuming a constant relative permittivity of the concrete in a tunnel structure. More discussion on the relative permittivity of concrete is described in Section 4.2 in this study.
Furthermore, the presence of air-cavities behind concrete lining can be identified by the phase reversal of EM reflections from the concrete–shotcrete (solid) and the concrete–air (defected) interfaces. Figure 9a,e,i, representing the GPR radargrams over 100 mm thick concrete by each frequency, show that the solid regions (sections 4 and 6) are characterized by the pattern of black–white–black on the GPR radargrams. The first black area in the pattern indicates the negative signal of the EM reflections from the concrete and shotcrete interface, Rc,b. In contrast, the GPR signals measured over air-cavities (i.e., on sections 1, 2, 3, and 5 in this study) are manifested as the pattern of white–black–white. The first white in the pattern indicates the positive signal of the EM reflections from the concrete and air interface, Ra,t. The phase reversal between Rc,b and Ra,t can be explained by the fact that the relative permittivity of shotcrete is greater than concrete in this study. Shotcrete in this study, as in actual tunnel constructions, was mixed with at least 3 kg/m3 steel fibers, leading to the higher relative permittivity of the material compared to that of normal concrete. In addition, shotcrete, as covered by concrete and directly exposed to bedrock and ground water, would be in higher moisture conditions in the actual tunnel structures than concrete lining. As such, it would further increase the contrast of relative permittivity values between the shotcrete and concrete lining. Therefore, the phase reversal phenomenon could be a good indicator for evaluating the presence of air-cavities behind lining concrete in the actual tunnel structures. More discussion on the automated data interpretation method on the evaluation of air-cavities will be described in the later chapters of this study: the detection of air-cavities in Section 4.3, length estimation in Section 4.4, and thickness estimation in Section 4.4.
However, it should be noted that the success of the GPR survey for tunnel lining inspection is dependent on a combination of important experimental parameters (i.e., GPR antenna frequency, lining concrete thickness, and air-cavity thickness in this study). Figure 9 shows that the resolution of the GPR radargrams became weaker as the thickness of the concrete increased from 100 mm to 400 mm. The use of lower frequency antennas enables us to effectively evaluate air-cavities behind concrete with greater thicknesses. GPR radargrams from the 400 MHz antenna show that the important reflection signals are still discernible even over the 400 mm thick concrete. Considering the design thickness of concrete tunnel lining is 300 mm in railway tunnels in Korea, the 400 MHz antenna would be effective for most tunnel GPR surveys in practice. In contrast, the maximum thickness of concrete for effective GPR tunnel surveys behind lining decreases to 300 mm and to 200 mm as GPR antenna frequencies increase to 900 MHz and 1600 MHz, respectively. This phenomenon is mainly explained by the fact that the penetration depth of the GPR signal is strongly dependent on the frequency contents of GPR signals, which is consistent with observations by previous researchers [25].
4.2. Relative Permittivity of Concrete
The relative permittivity of concrete, εr,c, can be expressed in terms of the thickness of concrete and the two-way travel time (TWTT) of EM reflections at the bottom of concrete by rearranging Equation (2) as follows:
Given the thickness of the concrete, Hc, εr,c can be determined by incorporating the measured tTWTT,c into Equation (8). Table 2 summarizes the relative permittivity of the concrete (εr,c) in the concrete model specimen in this study. As observed in the GPR radargrams in Figure 9, it was sometimes difficult to distinguish clear EM reflection signals from GPR A-scan data, which were dependent on the GPR antenna frequency and the concrete thickness. Consequently, the result in Table 2 is only the values from the valid GPR radargrams described in Section 4.1. The first arrivals of Rc,b were clearly observed in the valid GPR radargrams, as shown in Figure 9. The TWTT of Rc,b appears to be consistent over each testing section for the fixed concrete thickness. The εr,c values in Table 2 are based on GPR A-scan signals extracted in the middle of each section in the valid GPR radargrams.

Table 2.
Relative permittivity of concrete in the tunnel model specimen.
The estimated εr,c values obtained in the tunnel model specimen are consistent regardless of the GPR antenna frequency and concrete thickness once the EM signals are clear enough to determine the TWTT of the bottom reflections. The εr,c values estimated using the 400 MHz antennas are in the range of 7.28 to 9.49, with an average of 8.84 and a coefficient of variation (COV) of 5.77%. The GPR signals measured from the 900 MHz antenna result in εr,c values in the range of 8.12 to 9.66, with an average of 8.67 and a COV of 4.06%. Furthermore, the εr,c values determined from the 1600 MHz antenna vary from 7.94 to 9.35, with an average of 8.75 and a COV of 5.45%. The relatively low COV values indicate that the concrete in the model specimen has consistent electrical properties, which demonstrates that the quality of concrete in this study was controlled well. Furthermore, the εr,c values of the model specimen in this study are comparable to the values observed in the actual tunnel lining concrete [6,9]. The model specimen was exposed to the air for 70 days before GPR measurements. Therefore, it would be reasonable to use the values between 8~9 for the relative permittivity of the concrete, as measured in this study, for the concrete lining in the normal dry conditions in actual concrete tunnel lining. The use of greater values of relative permittivity is recommended for concrete with more wet conditions. However, it is necessary to know the actual value of the relative permittivity of concrete to accurately estimate the thickness of the concrete lining. A couple of core samples can be extracted from the tunnel lining to evaluate the actual thickness of concrete in tunnel structures, which is effective to estimate the more accurate relative permittivity values.
4.3. Detection of Air-Cavities behind Lining Concrete
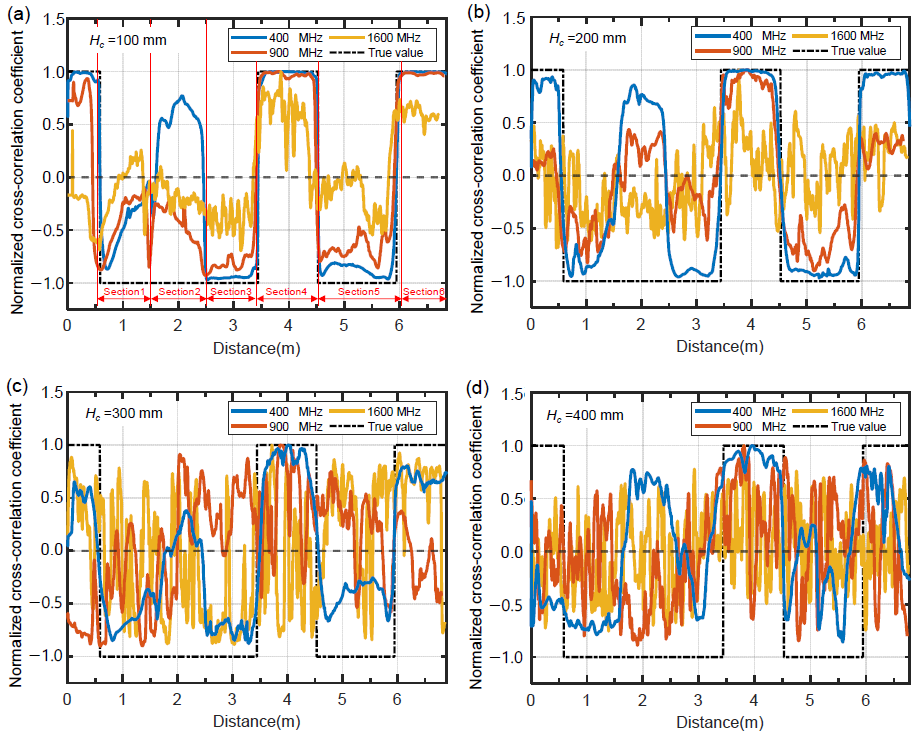
Figure 10a–d show the variation of the cross-correlation coefficient of GPR signals measured by each GPR antenna frequency over various test sections in the concrete model specimen with four different concrete thicknesses (100 mm, 200 mm, 300 mm, and 400 mm). The cross-correlation coefficient was calculated by using Equation (5). For a comparison, the true value of the cross-correlation coefficient of each section (i.e., ‘1’ for solid sections and ‘−1’ for air-cavity sections) is presented as black dashed lines. Overall, the use of the cross-correlation coefficient of GPR signals appears to be effective for the detection of air-cavity defects behind lining concrete. However, the performance of the method is affected by the GPR antenna frequency and concrete thickness.
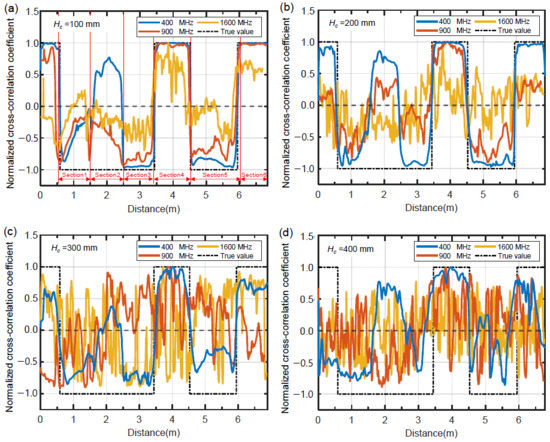
Figure 10.
Variation of cross-correlation coefficient of GPR signals measured by the three GPR antennas (400 MHz, 900 MHz, and 1600 MHz) over various test sections in the concrete specimens with various concrete thicknesses, Hc: (a) 100 mm, (b) 200 mm, (c) 300 mm, and (d) 400 mm.
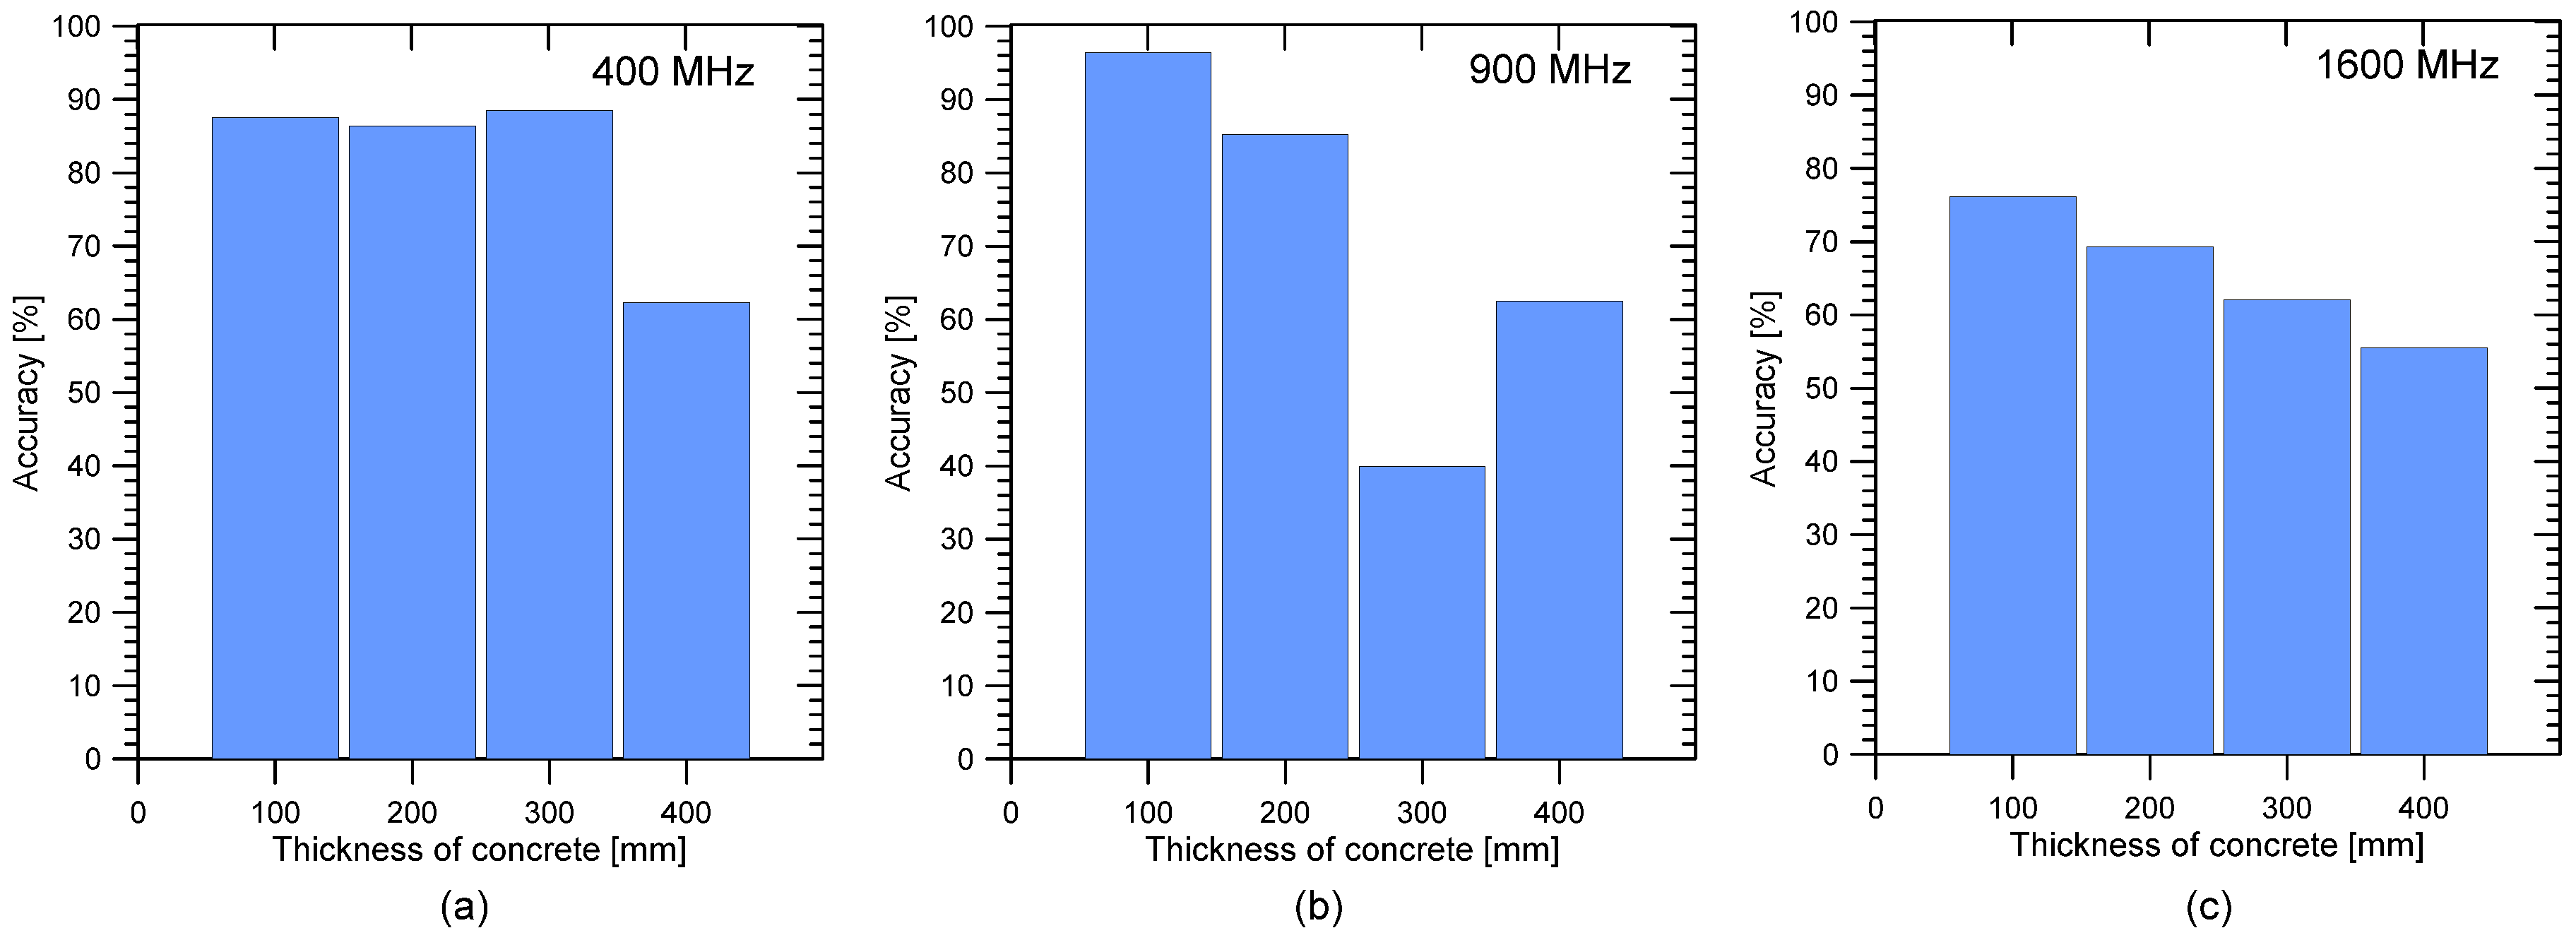
In this study, a binary classification model was used to evaluate the effects of the two parameters (antenna frequency and concrete thickness) on the effectiveness of using the cross-correlation of GPR signals for air-cavity detection more clearly. Test regions with the cross-correlation coefficient greater than 0 were determined to be solid (or non-cavity) regions. Otherwise, it was determined to be defected regions with air-cavities. Consequently, test regions were divided into four groups: true positive (TP), false negative (FN), true negative (TN), and false positive (FP). TP and TN represent results where the model correctly predicts the positive (air-cavity) and negative (solid) classes, respectively. Similarly, FN and FP represent results where the model incorrectly predicts the negative and positive classes, respectively. The performance of the binary classification model was quantitatively evaluated by using the accuracy (ACC) of the model (see Table 3 and Figure 11). Accuracy was determined based on the confusion matrix summarized in Table 3 by Equation (9) as follows:

Table 3.
Confusion matrix for classification based on cross-correlation coefficient of GPR signals.
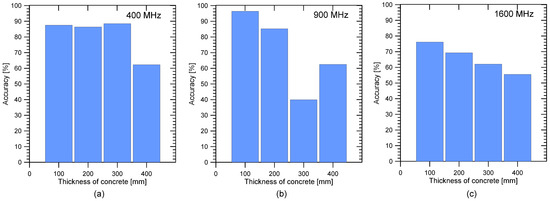
Figure 11.
Accuracy of the binary classification model based on cross-correlation coefficient of GPR signals measured on the surface of concrete with various thicknesses (Hc = 100 mm, 200 mm, 300 mm, and 400 mm) by using three GPR antenna frequencies: (a) 400 MHz, (b) 900 MHz, and (c) 1600 MHz.
Figure 11 clearly shows that the accuracy of the classification model varies with the GPR antenna frequency and concrete thickness. The use of the 400 MHz GPR antenna appears to be effective for identifying all solid sections and most air-cavities in the concrete model specimen (see Figure 11a). The accuracy of the classification results from the 400 MHz antenna are greater than 85%, which is an acceptable value for the evaluation of tunnel lining using the GPR survey when GPR measurements were performed on concrete with thicknesses 100 mm, 200 mm, and 300 mm. One possible reason of the reducing accuracy can be explained by the misclassification of the test sections over the 30 mm thick air-cavities (section 2) to the solid region (see blue lines in Figure 10). It can be inferred that the 400 MHz GPR antenna is not sufficiently sensitive to detect such a thin air-cavity with a thickness of 30 mm [19]. In contrast, the use of a 900 MHz antenna successfully identified all air-cavities in this study, including the 30 mm thick air-cavity, when GPR measurements were performed on the 100 mm thick concrete (see red line in Figure 10a). This results in excellent accuracy value, 96%, which is the best in this study. Consequently, it can be said that the use of a higher-frequency antenna could improve the resolution of the classification method; that is, it increases the minimum detectable thickness of the air-cavities behind the concrete lining. However, care is needed to use the higher frequency antenna, since the accuracy of the classification model decreases to 0.85, 0.36, 0.65 as the thickness of concrete increases to 200 mm, 300 mm, and 400 mm, respectively. Furthermore, the accuracy of the classification results was only 75% when using the 1600 MHz GPR antenna, even on the minimum thickness of concrete 100 mm in this study. Therefore, special care is needed to select a proper antenna frequency to obtain a reliable and consistent classification of air-cavity defects in tunnel structures.
4.4. Length of Air-Cavities behind Lining Concrete
B-scan radargrams visualize the sectional information of air-cavities behind concrete in the concrete model specimen. In this study, the lengths of air-cavities were evaluated from the spatial distribution of cross-correlation coefficients, as shown in Figure 10. The predicted length of an air-cavity or solid section, L, was determined by Equation (10) as follows:
where is the number of A-scan data that results in the cross-correlation coefficient equal to or less than 0 for air-cavity sections or greater than 0 for solid sections, and is the horizontal resolution of the GPR signal (=0.0033 m in this study).
Table 4 summarizes the predicted length of air-cavities based on the cross-correlation coefficient. The results in Table 4 were based on the six effective GPR radargrams that resulted in at least 70% of accuracy for air-cavity detection using the binary classification model (see Figure 11). The predicted results show a good agreement with the actual lengths, with an average error less than 8%. It can be demonstrated that the use of the cross-correlation of GPR signals is effective for estimating the length (horizontal dimension) of air-cavities or solid regions in tunnel concrete lining structures. The average error within 10% can be acceptable in practice. The use of higher antenna frequencies, such as 900 MHz and 1600 MHz, tends to decrease average errors. However, the higher-frequency antennas could be useful only for thin-concrete lining: 200 mm thick concrete for 900 MHz and 100 mm thick concrete for 1600 MHz antennas. Based on the results in this study, the use of a 400 MHz antenna, among the three antenna frequencies, is recommended to evaluate the horizontal dimension of air-cavities behind concrete with various thicknesses up to 400 mm.

Table 4.
Summary of predicted length of solid section and air-cavities behind concrete based on the spatial variation of cross-correlation coefficient of GPR signals.
4.5. Thickness of Air-Cavities behind Concrete
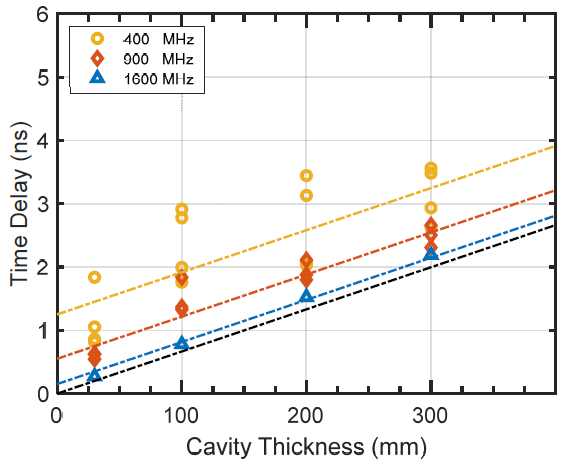
It is of interest to demonstrate the validity of the improved two-way travel time method, measuring the apparent time delay, , of partially overlapped GPR signals measured in the low-frequency conditions, for the evaluation of the thickness of an air-cavity behind concrete. Figure 12 shows the relationship between the measured apparent time delay, , and the true thickness of an air-cavity, Hcavity. In this study, was determined by the difference between the two positive peaks of the combined EM waves from the air-cavities. Times for the first and second positive peaks (t1 and t3, respectively, shown by open circles in Figure 7) were read from each individual GPR A-scan data measured in the middle of each test section using the three GPR antennas. Note that the effect of concrete thickness was not obvious on the determination of for the same air-cavity thickness and GPR antenna frequency. However, some data sets were ruled out in this analysis because of poor-quality GPR signals from relatively thin concrete by higher GPR frequencies (i.e., concrete thickness of 400 mm for 900 MHz, and from 200 mm to 400 mm for 1600 MHz). For a comparison, three color dashed lines in Figure 12 represent the relationship between the predicted apparent delay time, , and Hcavity for each antenna, where values were determined by Equation (7). The black dashed line presents the relationship between the true delay time,, and Hcavity, which was determined by Equation (2), assuming the relative permittivity of the air-cavity, , is 1. For simplicity, TGPR(f) values in Equation (7) were determined by the reciprocal of each antenna frequency: 2.50 ns, 1.11 ns, and 0.63 ns for the 400 MHz, 900 MHz, and 1600 MHz GPR antennas, respectively. Overall, the measured apparent delay time, , values show a positive correlation with the predicted apparent delay time, , values in the theoretical curves, especially for the data from 900 MHz and 1600 MHz GPR antennas. Although greater variability was observed, the measured data from the 400 MHz GPR antenna still showed a positive correlation with Hcavity. Therefore, it can be inferred that the thickness of the air-cavity, Hcavity, behind the concrete can be evaluated by measuring the apparent time delay, , even in the partially overlapped GPR signals measured in the low-frequency conditions. Specifically, the theoretical relationship described in Equation (7) would be useful to evaluate Hcavity by measuring . However, it is also noticed that the performance of Equation (7) is dependent on the GPR antenna frequency and air-cavity thickness.
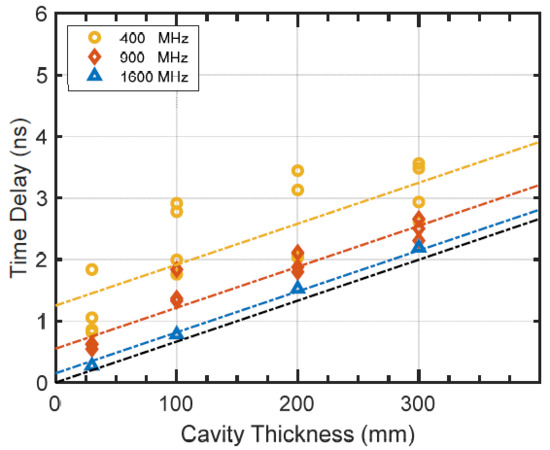
Figure 12.
Relationship between apparent time delay, of combined GPR reflection waves of the top and bottom of air-cavities (or time delay, = t3 − t1) and the thickness of air-cavities, Hcavity. Three color dashed lines represent the theoretical relationship between apparent delay time and cavity thickness (yellow, red, and blue for 400 MHz, 900 MHz, and 1600 MHz GPR signals, respectively). A black dashed line represents the theoretical relationship between true delay time and cavity thickness.
Figure 13 shows the variation of the predicted thickness evaluated by the improved two-way travel time method, using Equation (7), with varying air-cavity thickness and GPR antenna frequency. Box plots were used to simplify the distribution of the results by several statistical parameters: ‘min’ and ‘max’ for the minimum and maximum, ‘Q1’ and ‘Q3’ for the first and third quartile, and the median of each resulting data set. In addition, the mean value was also denoted as green cross symbols in the box plots. The results shown in Figure 13 were based on all A-scan data measured by each frequency. In each data set for the same air-cavity defect, the amount of A-scan data was 600 traces and 900 trances for the 1000 mm (sections 1, 2, and 3) and 1500 mm (section 5) long air-cavities, respectively. Consistent with Figure 12, some of the data sets measured on the relatively thin concrete with higher frequency antennas were excluded in Figure 13 because of the poor quality of the GPR. For a comparison, the variation of errors in the thickness prediction is presented in Figure 14. Table 5 and Table 6 summarize the statistical parameters of the box plots in Figure 13 and Figure 14, respectively. Overall, Figure 13 shows that the average predicted thicknesses of air-cavities have a positive correlation with the true thicknesses. However, it is evident that the performance of the improved two-way travel time method is strongly dependent on the antenna frequency and the thickness of the cavity. It is obvious that the predictions for the relatively thin air-cavities (Hcavitiy = 30 mm and 100 mm) resulted in greater error levels, especially for the 400 MHz antenna. This is an intrinsic limitation of the proposed method in this study that uses apparent time delay. According to EM wave theory, the location of t3 in the partially overlapped signal could be shifted due to destructive interference of the two signals when the normalized cavity thickness (Hcavitiy/λGPR) is less than 0.125 (=1/8) [19]. Furthermore, the combined EM waves could be distorted as Hcavitiy/λGPR further decreases. In this study, the GPR data measured over the 30 mm thick air-cavity by the 400 MHz and 900 MHz antennas, with Hcavitiy/λGPR ~ 0.04 and 0.09, respectively, show different waveforms compared to those measured over a thicker air-cavity, as shown in Figure 7a,b. In contrast, the use of 1600 MHz antenna over the same location, Hcavitiy/λGPR ~0.16, resulted in GPR data compatible to the typical signal measured in the low-frequency conditions. Therefore, it can be said that the improved two-way travel time method may not be effective for evaluating the thickness of a too-thin air-cavity compared to the wavelength of GPR signals.

Figure 13.
Variation of the predicted thickness of air-cavities based on the improved two-way travel time method applied to A-scan data measured by three different GPR antennas: (a) 400 MHz, (b) 900 MHz, and (c) 1600 MHz.

Figure 14.
Variation of errors in predicted thicknesses of air-cavities determined based on GPR data measured by three different GPR antennas: (a) 400 MHz, (b) 900 MHz, and (c) 1600 MHz.

Table 5.
Summary of statistical parameters for distribution of predicted thicknesses of air-cavities shown in Figure 13.

Table 6.
Summary of statistical parameters for distribution of errors in predicted thicknesses of air-cavities shown in Figure 14.
Nevertheless, there are some supporting data in this study that the new method proposed in this study could improve the capability of the conventional two-way travel method that is only effective for GPR signals measured in the high-frequency conditions. First, the use of the 400 MHz antennas resulted in an average error about 15% when it was applied to a 300 mm thick air-cavity. The distribution of the thickness prediction results in Figure 13a decreased as the thickness of the air-cavities increased. These statistical results demonstrate a potentiality of using 400 MHz GPR signals for screening out relatively thick air-cavities in tunnel structure inspection. As discussed in this study and prior research works (see Table 1), a 400 MHz GPR antenna is a powerful tool for evaluating the critical engineering parameters in tunnel structure inspection (e.g., lining concrete thickness, and the presence and length of air-cavities). In addition, the approximate thickness information of air-cavities would extend the capability of a 400 MHz GPR antenna in tunnel structure inspection. Second, the use of 900 MHz and 1600 MHz antennas apparently decreased error levels and the variability of the predicted thickness results from each air-cavity. The use of 900 MHz and 1600 MHz antennas results in errors within 10% when applied to relatively thick air-cavities greater than 200 mm. The error levels increased to about 60~70% as the thickness of air-cavities decreased to 30 mm, which is beyond the marginal acceptable range in the field applications. However, the distribution of the predicted thickness for each air-cavity was sufficiently narrow to separate it from each other (see Figure 13). Therefore, it can be inferred that the predicted air-cavity thickness determined by Equation (7) could be effective for classifying the severity of air-cavities according to the air-cavity thickness. For example, by using 900 MHz antenna, air-cavity defects can be determined to be ‘minor’ for the predicted thickness, ,< 100 mm; to be intermediate for < 200 mm; or to be severe for . Based on the results in this study, the use of a 900 MHz antenna is recommendable as a primary GPR tool for the evaluation of air-cavity thickness behind concrete after a compromise between the accuracy and penetration depth of the GPR signals.
5. Conclusions
An experimental study was performed to better understand the interference of ground penetrating radar (GPR) signals with air-cavities behind concrete in a concrete tunnel lining model specimen in this study. It was observed that the successful use of GPR for the evaluation of air-cavities behind concrete tunnel lining is dependent on a combination of several experimental parameters: GPR antenna frequency, concrete thickness, and thickness of air-cavities. The specific conclusions based on the results in this study can be drawn as follows:
- (1)
- The test regions over an air-cavity behind concrete were identified by the phase reversal of electromagnetic waves from the concrete–shotcrete (solid) and the concrete–air (defected) interfaces. In this study, a bilinear classification model based on the normalized cross-correlation coefficient of GPR signals was used to automatically identify the air-cavity regions from the solid ones (non-cavity regions), and characterize the length of the air-cavity regions. The accuracy of the classification model depends on the GPR frequency and concrete thickness.
- (2)
- The conventional two-way travel time method was effective for evaluating the thickness of concrete when the normalized thickness of air-cavities (the thickness of an air-cavity, Hcavitiy, normalized by the wavelength of primary GPR signals, λGPR) is greater than 0.5 (=Hcavitiy/λGPR ≥ 0.5). The thickness was estimated with an error within 5% for 1600 MHz data, and 10% for 900 MHz data.
- (3)
- The improved two-way travel time method, measuring the apparent time delay, , in the partially overlapped GPR waves, may not be effective as a deterministic tool for evaluating the thickness of air-cavities because of relatively great error levels, especially for relatively thin air-cavities. However, the statistical results in this study showed that the improved two-way travel time method could be effective for classifying the severity of an air-cavity according to its thickness. In this study, the use of a 900 MHz antenna led to the most promising results for the evaluation of the thickness of air-cavities after a compromise between the accuracy and penetration depth of the GPR signals.
- (4)
- The results of this study were obtained based on the GPR data on the concrete model specimen fabricated in the laboratory, with limited experimental variables (i.e., thickness of concrete, thickness of air-cavity, and GPR antenna frequency). The results in this study can provide a fundamental basis for better understanding the interference of a GPR signal with air-cavities behind concrete in tunnel structures. More studies are still needed to understand the effects of some important parameters (e.g., presence of reinforcing steel in concrete lining, types of materials filling cavities, water contents of concrete, and age of concrete) to obtain general conclusions on the use of GPR for concrete lining inspection in actual tunnel structures.
Author Contributions
S.-J.L. designed the experimental program and GPR testing setup, and performed experiments on the tunnel lining concrete model specimen. S.-J.L. and S.-H.K. supervised the project. R.W.H., S.K. and S.-H.K. processed the experimental data, performed the analysis, drafted the original manuscript, and designed the figures. S.-J.L. acquired research funding. All authors have read and agreed to the published version of the manuscript.
Funding
This is supported by a research fund of the Korea Railroad Research Institute (Development of GPR based inspection method for railway tunnel structure and backside, PK2204B3).
Data Availability Statement
Data are contained within the article. However, the data presented in this study are also available on request from the corresponding author.
Conflicts of Interest
The authors declare that there is no conflict of interests regarding the publication of this manuscript.
References
- Wimsatt, A.; White, J.; Leung, C.; Scullion, T.; Hurlebaus, S.; Zollinger, D.; Grasley, Z.; Nazarian, S.; Azari, H.; Yuan, D.; et al. Mapping Voids, Debonding, Delaminations, Moisture, and Other Defects Behind or Within Tunnel Linings. In SHRP 2 Report S2-R06G-RR-1; Transportation of Research Board of the National Academies: Washington, DC, USA, 2014. [Google Scholar]
- Meguid, M.A.; Dang, H.K. The effect of erosion voids on existing tunnel linings. Tunn. Undergr. Space Technol. 2009, 24, 278–286. [Google Scholar] [CrossRef]
- Lalagüe, A.; Lebens, M.A.; Hoff, I.; Grøv, E. Detection of Rockfall on a Tunnel Concrete Lining with Ground-Penetrating Radar (GPR). Rock Mech. Rock Eng. 2016, 49, 2811–2823. [Google Scholar] [CrossRef]
- Chiu, Y.-C.; Lee, C.-H.; Wang, T.-T. Lining crack evolution of an operational tunnel influenced by slope instability. Tunn. Undergr. Space Technol. 2017, 65, 167–178. [Google Scholar] [CrossRef]
- Li, C.; Li, M.-J.; Zhao, Y.-G.; Liu, H.; Wan, Z.; Xu, J.-C.; Xu, X.-P.; Chen, Y.; Wang, B. Layer recognition and thickness evaluation of tunnel lining based on ground penetrating radar measurements. J. Appl. Geophys. 2011, 73, 45–48. [Google Scholar] [CrossRef]
- Choo, J.H.; Yoo, C.K.; Oh, Y.C.; Lee, I.M. Assessment of NATM tunnel lining thickness and its behind state utilizing GPR survey. J. Korean Tunn. Undergr. Space Assoc. 2019, 21, 717–733. [Google Scholar]
- Zan, Y.; Li, Z.; Su, G.; Zhang, X. An innovative vehicle-mounted GPR technique for fast and efficient monitoring of tunnel lining structural conditions. Case Stud. Nondestruct. Test. Eval. 2016, 6, 63–69. [Google Scholar] [CrossRef]
- Parkinson, G.; Berger, K. Ground Penetrating Radar Evaluation of Concrete Tunnel Linings. In Proceedings of the 12th International Conference on Ground Penetrating Radar, Birmingham, UK, 16–19 June 2008. [Google Scholar]
- Kim, S.-I.; Chae, D.H.; Park, J.P.; Park, Y.J.; Song, C.H.; Kim, C.Y.; Lee, S.J. Applicability of ground penetrating radar antenna fre quency of tunnel lining structure. In Proceedings of the 2017 Spring Conference and Annual Meeting of the Korea Society for Railway, Daegu, Korea, 26–28 April 2017. [Google Scholar]
- Xiang, L.; Zhou, H.-L.; Shu, Z.; Tan, S.-H.; Liang, G.-Q.; Zhu, J. GPR evaluation of the Damaoshan highway tunnel: A case study. NDT E Int. 2013, 59, 68–76. [Google Scholar] [CrossRef]
- Cardarelli, E.; Marrone, C.; Orlando, L. Evaluation of tunnel stability using integrated geophysical methods. J. Appl. Geophys. 2003, 52, 93–102. [Google Scholar] [CrossRef]
- Zhang, F.; Xie, X.; Huang, H.-W. Application of ground penetrating radar in grouting evaluation for shield tunnel construction. Tunn. Undergr. Space Technol. 2010, 25, 99–107. [Google Scholar] [CrossRef]
- Davis, A.G.; Lim, M.K.; Petersen, C.G. Rapid and economical evaluation of concrete tunnel linings with impulse response and impulse radar non-destructive methods. NDT E Int. 2005, 38, 181–186. [Google Scholar] [CrossRef]
- Maekawa, S.; Fenner, T.J. Study of Cavity Depth Estimation behind Concrete Tunnel Lining Using GPR. In Proceedings of the Fifth International Conferention on Ground Penetrating, Kitchener, Canada, 12–16 June 1994; European Association of Geoscientists & Engineers: Kitchner, ON, USA, 1994. [Google Scholar]
- Rhim, H.C.; Lee, S.J.; Woo, S.K.; Song, Y.C. Detection of Delamination inside Concrete Using Ground Penetrating Radar. J. Korea Inst. Struct. Maint. Insp. 2003, 7, 177–184. [Google Scholar]
- Park, S.-K. An Experimental Study on Estimation of Size and Thickness of Cavitation(Void)s under Concrete Slabs and Tunnel Linings Using Law Frequency Type Radar (GPR). Korea Inst. Struct. Maint. Insp. 2006, 10, 95–104. [Google Scholar]
- Al-Qadi, I.L.; Lahouar, S. Measuring layer thicknesses with GPR—Theory to practice. Constr. Build. Mater. 2005, 19, 763–772. [Google Scholar] [CrossRef]
- Zhao, S.; Shangguan, P.; Al-Qadi, I.L. Application of regularized deconvolution technique for predicting pavement thin layer thicknesses from ground penetrating radar data. NDT E Int. 2015, 73, 1–7. [Google Scholar] [CrossRef]
- Liu, H.; Deng, Z.; Han, F.; Xia, Y.; Liu, Q.H.; Sato, M. Time-frequency analysis of air-coupled GPR data for identification of delamination between pavement layers. Constr. Build. Mater. 2017, 154, 1207–1215. [Google Scholar] [CrossRef]
- Dinh, K.; Gucunski, N. Factors affecting the detectability of concrete delamination in GPR images. Constr. Build. Mater. 2021, 274, 121837. [Google Scholar] [CrossRef]
- Takayama, J.-Y.; Ohara, Y.; Sun, W. Nondestructive evaluation of air voids in concrete structures using microwave radar technique. SCIE J. Control Meas. Syst. Integr. 2022, 15, 36–47. [Google Scholar] [CrossRef]
- Le Bastard, C.; Baltazart, V.; Dérobert, X.; Wang, Y. Support vector regression method applied to thin pavement thickness estimation by GPR. In Proceedings of the 14th International Conference on Ground Penetrating Radar (GPR 2012), Shanghai, China, 4–8 June 2012; IEEE: New York, NY, USA, 2012; pp. 349–353. [Google Scholar]
- Ministry of Land, Infrastructure, Transport and Tourism. Standard Specification of Tunnel; Ministry of Land, Infrastructure, Transport and Tourism: Sejong City, Korea, 2015.
- Rhim, H.C.; Buyukozturk, O. Electromagnetic Properties of Concrete at Microwave Frequency Range. ACI Mater. J. 1998, 95, 262–271. [Google Scholar]
- Rhee, J.Y.; Kee, S.-H.; Kim, H.-S.; Choi, J.-J. Seasonal Variation and Age-related Changes in the Relative Permittivity of Concrete Bridge Decks on Korea Expressways. Int. J. Concr. Struct. Mater. 2018, 12, 2. [Google Scholar] [CrossRef]
- Tzanis, A. MATGPR Release 2: A freeware MATLAB® package for the analysis & interpretation of common and single offset GPR data. FastTIMES 2010, 15, 17–43. [Google Scholar]
- Yelf, R. Where is true time zero? In Proceedings of the Tenth International Conference on Grounds Penetrating Radar 2004, GPR 2004, Delft, The Netherlands, 21–24 June 2004. [Google Scholar]
Publisher’s Note: MDPI stays neutral with regard to jurisdictional claims in published maps and institutional affiliations. |
© 2022 by the authors. Licensee MDPI, Basel, Switzerland. This article is an open access article distributed under the terms and conditions of the Creative Commons Attribution (CC BY) license (https://creativecommons.org/licenses/by/4.0/).

