Article

Regional Typhoon Track Prediction Using Ensemble k-Nearest Neighbor Machine Learning in the GIS Environment

1
Department of ICT Integrated Ocean Smart Cities Engineering, Dong-A University, Busan 49315, Korea
2
Department of Meteorology, Institut Teknologi Bandung, Bandung 40132, Indonesia
3
University Core Research Center for Disaster-free & Safe Ocean City Construction, Dong-A University, Busan 49315, Korea
*
Author to whom correspondence should be addressed.
Remote Sens. 2022, 14(21), 5292; https://doi.org/10.3390/rs14215292
Submission received: 29 August 2022 / Revised: 19 October 2022 / Accepted: 19 October 2022 / Published: 22 October 2022

Abstract

:
This paper presents a novel approach for typhoon track prediction that potentially impacts a region using ensemble k-Nearest Neighbor (k-NN) in a GIS environment. In this work, the past typhoon tracks are zonally split into left and right classes by the current typhoon track and then grouped as an ensemble member containing three (left-center-right) typhoons. The proximity of the current typhoon to the left and/or right class is determined by using a supervised classification k-NN algorithm. The track dataset created from the current and similar class typhoons is trained by using the supervised regression k-NN to predict current typhoon tracks. The ensemble averaging is performed for all typhoon track groups to obtain the final track prediction. It is found that the number of ensemble members does not necessarily affect the accuracy; the determination of similarity at the beginning, however, plays an important key role. A series of tests yields that the present method is able to produce a typhoon track prediction with a fast simulation time, high accuracy, and long duration.

Graphical Abstract

1. Introduction

Typhoons are extreme weather events that normally harm coastal areas [1]. Typhoon disasters cause heavy winds, floods, and extreme waves [2], which can damage infrastructure, transportation, and human activity [3,4]. The city of Busan, located on the borders of the Korea/Tsushima Strait, is often impacted by many typhoons [5,6], the impacts of which are felt during direct landfalls or passage through surrounding areas, namely Ulsan city [7] and Gyeongsangnam-do [8]. To reduce these greater severe impacts, typhoon prediction is essential. However, there are still problems related to the accuracy, especially in predicting the track, intensity, and impact risk. Improvements or developments of a new approach are required to produce a more accurate prediction of typhoons. This work aims to develop a new approach to predict the more accurate typhoon tracks approaching or making landfall in a region.
The following forecasting models have been developed for operational and research use to anticipate typhoon impacts [9]: (a) averaging across occurrences, (b) numerical and dynamical modeling, (c) statistical model, (d) pattern similarities, (e) data assimilation, and (f) microseismic signal. Firstly, the averaging technique is to extrapolate typhoon tracks in which performance depends on past typhoon position selection. Secondly, numerical and dynamical modeling aims to predict typhoons using a numerical approximation of mathematical equations describing the physical forces affecting the cyclone [10,11]. To utilize the method, supercomputers that repetitively calculate values in every grid using input data, such as global weather forecasts and static geographical data as initialization and boundary conditions, are required [12]. In addition, there is still a lack of accuracy in this method due to the inaccurate vortex initialization of typhoons, incomplete representation of complex physical processes, and coarse resolution [1,13]. Thirdly, the statistical method considers combinations of parameters or variables in the observed data. This technique can yield robust and reliable results when available data are given. Fourthly, the pattern similarity method uses checking techniques of previous typhoon tracks using statistical methods or image processing in a geographical information system (GIS) environment. Fifthly, the accuracy is improved by assimilating data from various sources into the existing predictive model [14]. Lastly, the modern approaches are able to identify the typhoon based on microseismic signals [15,16].
The incorporation of GIS and machine learning could be a suitable candidate, which has recently been developing because it can solve complex problems that can not be explained by common approaches. The GIS approach has long been used to map and analyze objects on a spatial scale. The following studies have carried out the use of machine learning and GIS to predict typhoon tracks. Song et al. [17] introduced a support vector machine (SVM) as an artificial intelligent algorithm in nonlinear system modeling with input dimension reductions to forecast typhoon tracks. However, this method requires that programmers need to optimize SVM for the improvement of typhoon track forecasts. The similarity approach to GIS processing was conducted by Zhen et al. [18] to generate typhoon track predictions for 24∼48 h. In this technique, the forecast results from the similarities of key typhoon track points are continuously corrected by the latest current position. However, it still remains insufficient since a typhoon track forecast longer than 48 h is needed. Wang et al. [19] proposed the similarity algorithm for tropical cyclones using the deep learning approach based on 500 hPa weather conditions extracted using a deep belief network (DBN) termed the SA_DBN. The algorithm aims to obtain a similar typhoon track that can be used as the initial step to improve the forecast. Ren et al. [20] also examined track similarity using the TC track similarity area index (TSAI) for predicting precipitation from tropical cyclones making landfall. Because this method requires two similar tracks, it probably cannot be used for typhoon tracks far from historical ones.
Based on the aforementioned problems, a faster, more accurate, and long-duration typhoon track forecasting approach is needed. In addition, to the best of the authors’ knowledge, regional typhoon track prediction that utilizes machine learning, in particular, a k-NN algorithm and track similarity-based ensemble, is scarce in the literature. Hence, the present study employs machine learning using a k-nearest neighbor (k-NN) algorithm to analyze multiple track similarities of past typhoon tracks to obtain the most accurate track prediction in a GIS environment with a forecast duration longer than 48 h. The proposed framework consists of typhoon track prediction steps that equalize the starting point, construct ensemble members, determine the similarity tendency of the current typhoon to other typhoons, and construct the machine learning dataset.
This study attempts this approach in the Korean region, especially in the typhoon occurrences that affected the city of Busan. From the diverse tests, the main contributions of this paper can be outlined as follows:
  • To introduce a new approach of ensemble techniques in machine learning for typhoon prediction;
  • As a benchmark problem to providing a fast simulation, high accuracy, and long duration results of typhoon track prediction methods compared to several existing approaches;
  • To provide a detailed algorithm for readers to use in their future studies;
  • To provide an early warning to reduce the higher risk of typhoon impact.
This study is organized into four sections: after the introduction section, the data and methods are given in Section 2. The results with verification are discussed in Section 3. Lastly, the conclusions and future communication are given in Section 4.

2. Materials and Methods

2.1. Data

The data used in this study consist of past typhoon tracks accessed from the National Institute of Informatics (NII) from 1951 to 2020 based on the official best track data issued by the Japan Meteorological Agency (JMA) [21]. The best track dataset is a record of typhoons at intervals of a few hours that includes information on geographical location, central pressure, and maximum wind (data at http://agora.ex.nii.ac.jp/digital-typhoon/, accessed on 5 July 2022). The present work uses typhoon tracks as points in GeoJSON format.

2.2. Methods

The proposed method adopts the machine learning algorithm based on conformity with the specific problem [22]. The k-nearest neighbor (k-NN) is employed in this study since it stores all variable cases and categorizes new cases adjusted with a similarity factor, including distance functions, as required in the typhoon track problem. The supervised classification and regression problem with a training set Γ = x 1 , y 1 , , x n , y n containing n observations are taken into account in this work. For the regression problem, each observation x , y consists of an instance x χ and coordinate value y ω in zonal or meridional components. For the classification problem, each observation x , y consists of an instance x χ and a label y ω .
In the k-NN, the best selection is conducted by selecting a number of training data points with the smallest Euclidean distance (D) from the observation [23]:
D = i = 1 k x i y i 2
where x i and y i are the training data and the predicted point, respectively.
The k-NN has been used as a non-parametric technique for statistically predicted data to recognize a pattern. In the regression problem, the estimated values are taken as the average (centroid) of its k nearest neighbors [24]:
y j i + 1 = 1 k l = 1 k y j l i
In the k-NN classification, the algorithm assigns the feature vector to a pre-eminent class based on the number of k nearest neighbors in the training set [25]. Thus, the selected class is identified by a majority vote of its neighbors based on the following distance function [26]:
f x = arg max l ω x i , y i D k | y i = l
It is noticed that the k-NN produces a prediction based on the larger weight of the k-NN [27]. The algorithm achieves fast processing with a small training size for simple classification [28]. In this work, the k-NN classification is used to determine the similarity of the current typhoon to the past typhoon, and the k-NN regression is used to predict the typhoon tracks, respectively.
The proposed scheme is explained in detail from the initial to the end step, which is mostly processed using Quantum GIS (QGIS) software and Python programming [29]. The Scikit-Learn library in Python [30] is used to implement the k-NN algorithm. The scheme for obtaining the predicted typhoon tracks impacting a region is conducted in the following steps: retrieval of past and current typhoons, determination of ensemble members, determination of class tendency, typhoon track prediction, and ensemble averaging (see Figure 1).

2.2.1. Retrieval of All Typhoon Tracks

Typhoon data from the best track are downloaded and saved to the PostGIS database. This is performed to continually obtain updated typhoon tracks, including the sample typhoon (assumed as a current typhoon) to be predicted.

2.2.2. Selection of Typhoon Tracks Impacting the Study Region

The proposed method focuses on the regional prediction of typhoon tracks. To limit the number of typhoon tracks affecting this region, a selection process is conducted through the following steps: (a) including point-to-line conversion, (b) region buffering, and (c) the intersection of the track lines to the buffer region. The point-to-line conversion is used to change the basic data of the tracks as points to become the line. This line is essential because the points of the track have a time step of 3∼6 h, which may not overlap with the polygon of the study region. The region buffering means an area that is still affected by past typhoons, whether they passed directly over or not. The intersection of the track lines to the buffer region aims to select the lines that overlap with the buffer region. Therefore, the selected typhoons can be obtained by using all these processes.
The following steps are performed for the point-to-line conversion: each geometric coordinate of a typhoon track from the database is inputted into an array, and an empty array line is created and filled by points in the x and y variables for longitude and latitude, respectively. The pairs of current x i and y i and previous x i 1 and y i 1 points are processed to obtain the distance as follows:
d = x i x i 1 2 y i y i 1 2
where d is the distance, x i and y i are the current longitude and latitude, and x i 1 and y i 1 are the previous longitude and latitude. The line array is created and filled with a new line by adding the current points x and y. To draw a line between the two points, the process uses the addGeometry function from the ogr.Geometry library. The iteration is processed starting with distance calculation to the line array arrangement to produce the full line array. Lastly, the result of the line conversion is stored in the database to be used in the intersection process. Figure 2 shows the converted result of typhoon tracks from a point shape to a line vector, which identifies all typhoon tracks that impact a region.
The buffer region is subsequently created based on the recorded impact of typhoons in the study region, as shown in LHS of Figure 3. It is impact record data from the Korean Meteorological Agency (KMA) and Reference [5], which investigated typhoon-induced coastal inundation, including typhoons impacting the Busan region and the surrounding areas. Recorded from 1951 to 2020, four typhoon centers were outside the Busan region; however, their eyes intersected with that area. The distance from those centers to the border of the Busan is about 0.03 map units or about 10.65 km. In the same period, the 16 farthest typhoon centers from the border of Busan region still had a significant impact on the region. The distance from the typhoon center to the border of Busan is about 71 km, which is equivalent to 0.2 map units. Therefore, based on the distance of typhoon centers to the study region, there are two types of impacted regions, namely direct and indirect impacts. A direct impact region is defined as a region that is impacted by typhoons that directly pass over the region. An indirect impact region is defined as a region that is impacted by typhoons, although the paths are outside the region. Based on this identification, two buffer regions are created with sizes of 0.03 map units (as a direct impact region) and 0.2 map units (as an indirect impact region).
The intersection of the track lines to the buffer region is performed if two segments between one shape and the plane to which the other shape belongs overlap [31]. In the present study, the intersection of the track lines to the buffer region is performed to select past typhoons that directly and indirectly impact the Busan area (see the right side of Figure 3). The selected past typhoons are stored in the PostGIS database. Therefore, the database involves the storing and calling process of several quantities. The quantities are tracks of the past and sample typhoons, the buffer regions, and the selected typhoon tracks.

2.2.3. Equalizing the Starting Points of Historical and Sample Typhoons

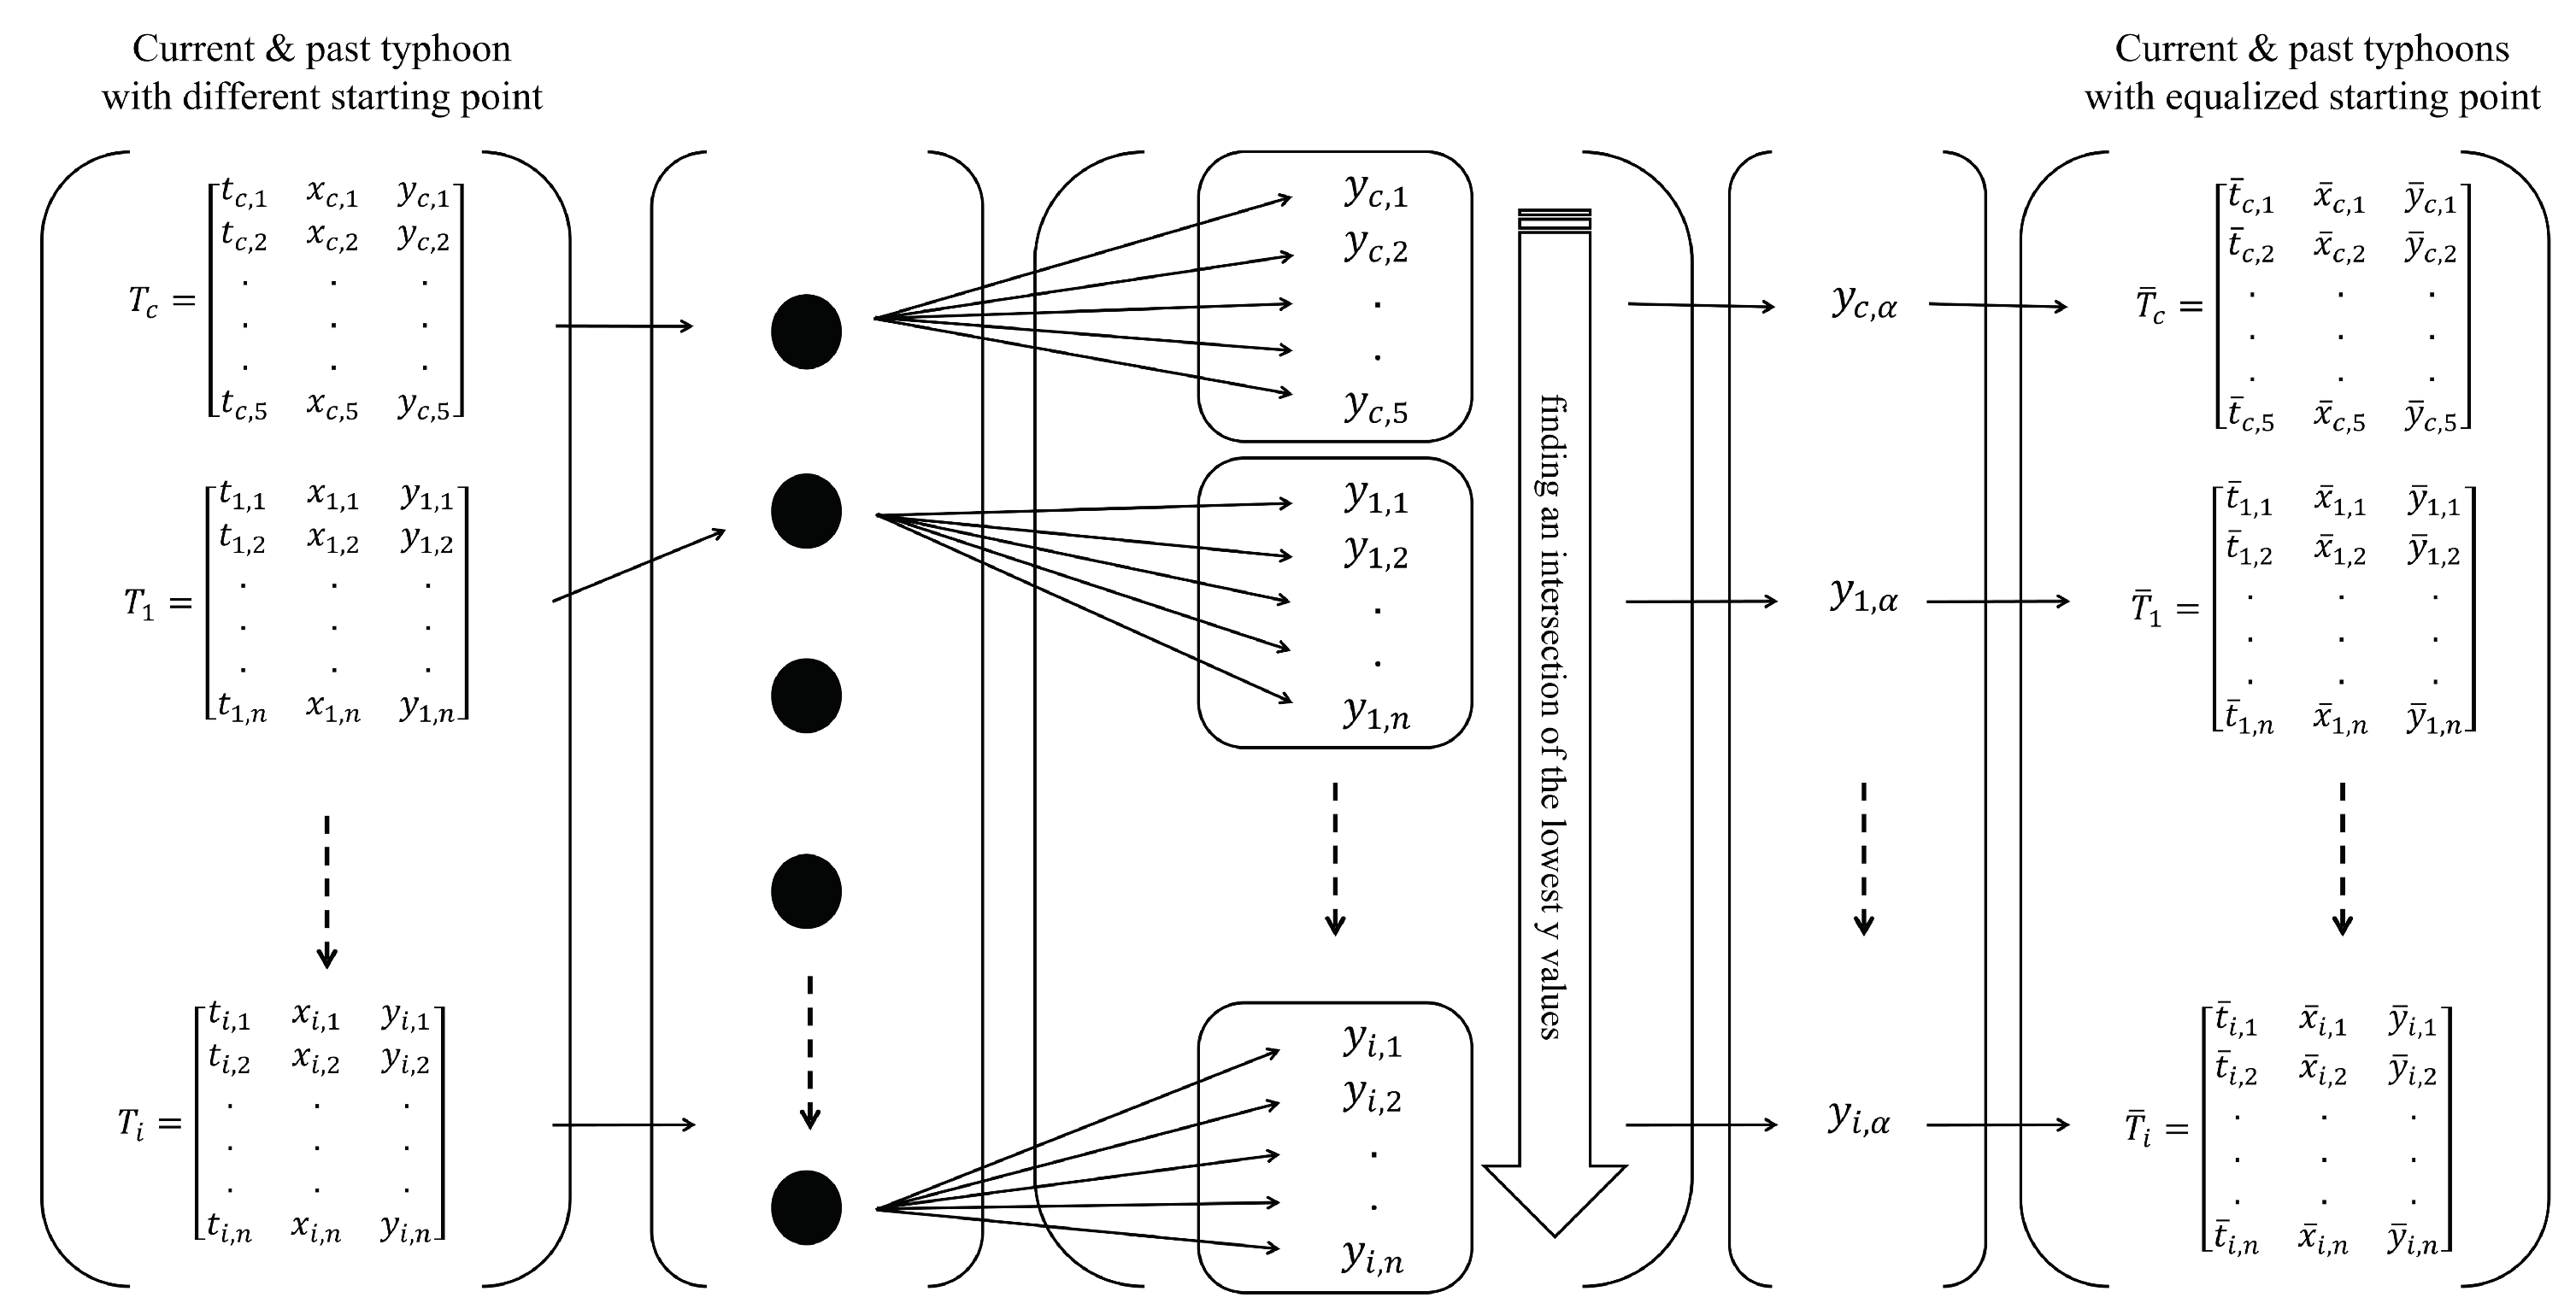
To create the training datasets in machine learning for typhoon track prediction, the starting point of each selected past and sample typhoon needs to be equalized. In this present study, building a training data set is difficult if every past typhoon has its distinct starting point with its starting sequence. It is assumed that the sample typhoon is a current typhoon. The starting points are taken from the meridional coordinate component since the movement is frequently in the meridional direction. Figure 4 depicts the diagram indicating the steps to equalize the starting points for all involved typhoons. Three variables are used as inputs in typhoon track prediction, viz. time step, zonal component (x-coordinate), and meridional component (y-coordinate). Let T c be the sample typhoon with an original starting point time step t c 1 , zonal component x c 1 , meridional component y c 1 , temporary endpoint t c 5 , x c 5 , y c 5 , and continuously moving predicted track. Note that subscript 5 indicates the typhoon track reached the 5 th track point. T n is the n th historical typhoon with an original starting point sequence t n 1 , zonal component x n 1 , meridional component y n 1 , traveled track, and endpoint t n n , x n n , y n n .
The starting point is the result of finding an intersection of the smallest meridional values among all typhoons, where y c α is the sample (current) typhoon and y 1 α is the 1 st past typhoon up to the n th past typhoon y n α , to obtain a new sequence ( t ¯ c n for the sample typhoon and t ¯ n n for the nth past typhoon), similar meridional component ( y ¯ c n for the sample typhoon and y ¯ n n for the nth past typhoon), and zonal component ( x ¯ c n for the sample (current) typhoon, x ¯ n n for the n th past typhoon).
Until this step, the starting points of several past typhoons are equalized. However, not all past typhoons can be involved in the simulation. Several past typhoons are close to sample (current) typhoons and several others are not. Distant past typhoons from a sample (current) typhoon are assumed to represent an error factor in the machine learning training process. Hence, they are excluded from the study since they are assumed to cause a larger error.
Let us assume that the past and sample (current) typhoon contains the distance of zonal components from the starting point to the 5 th step point. The average distance D i c can be obtained by the past typhoons T i and the sample typhoon T c :
D i c = T ¯ i T ¯ c , i = 1 , , 5
where
T ¯ i = x ¯ 1 , 1 x ¯ 1 , 2 x ¯ 1 , 3 x ¯ 1 , 5 and T ¯ c = x ¯ c , 1 x ¯ c , 2 x ¯ c , 3 x ¯ c , 5
Thus, each zonal matrix of past typhoons is subtracted from the zonal matrix of the sample (current) typhoon to obtain the distance using Equation (5). Note that when D i c 1 degree, the typhoon is excluded from the simulation. This is intended so as not to complicate the preparation of training datasets for the k-NN regression and to avoid larger errors.

2.2.4. Ensemble Prediction Using k-NN Algorithm

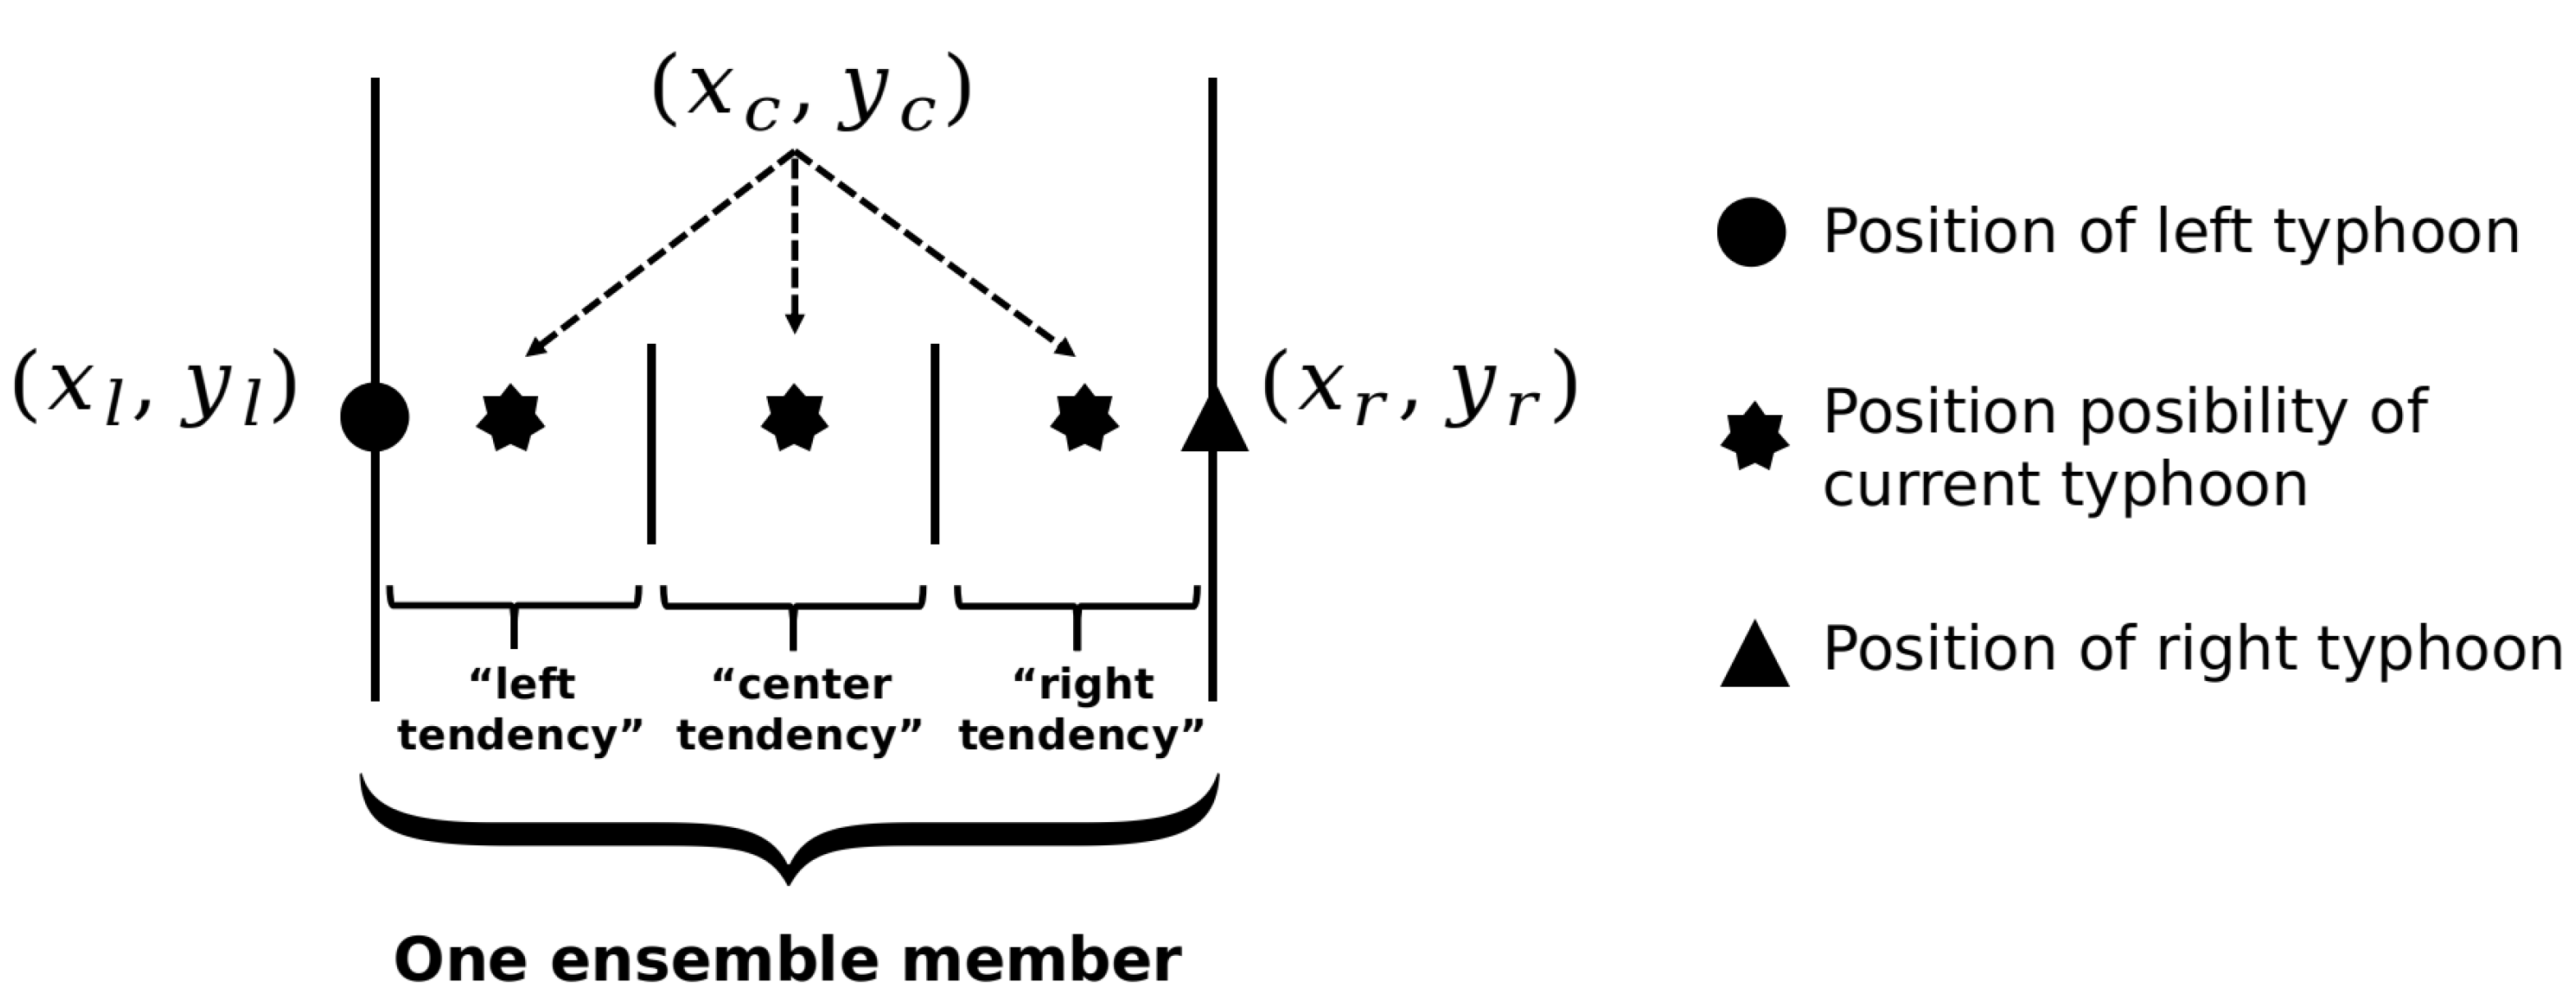
In this present method, the future tracks of the current typhoon are predicted using the k-NN regression by multiple ensemble members. Since the coordinate of a position consists of two components, i.e., zonal (longitude) and meridional (latitude), the analysis is split for both. Each ensemble member is composed of three typhoon classes: “left” past typhoon, “right” past typhoon, and current typhoon, as seen in Figure 5. Left past typhoons and right past typhoons are determined by the zonal position of the current typhoon. Then, the class possibility of the current typhoon is required to determine whether its tendency is “left” or “right” because it will affect the arrangement of the training dataset for k-NN regression.
In five initial time sequences, the class tendency of the current typhoon is determined by comparing its distance to the left past typhoon and the right past typhoon, as seen in Figure 5.
Criteria are created to determine the tendency class of the current typhoon. The category values of the criteria are separated into zonal x and meridional y components. The following are the rules for determining the tendency class of the sample typhoon:
  • The class value of the sample typhoon is “left”, when:
    y l < y c y l + Δ y / 6 x l < x c x l + Δ x / 6
  • The class value of the sample typhoon is “right”, when:
    y l Δ y / 6 < y c y r x l Δ x / 6 < x c x r
  • The class value of the current typhoon is “center”, when:
    y l + Δ y / 6 < y c y r Δ y / 6 x l + Δ x / 6 < x c x r Δ x / 6
where y l is the meridional component of the left typhoon, y c is the meridional component of the current typhoon, y r is the meridional component of the right typhoon, x l is the zonal component of the left typhoon, x c is the zonal component of the current typhoon, and x r is the zonal component of the right typhoon, respectively.
For predicting the future class tendency of the current typhoon, the k-NN classification algorithm is required. Table 1 provides the training dataset scheme, which consists of two columns, i.e., the t training column for the predictor taken from the time sequences and the x training / y training column for the class labels as the target, whereas the typhoon column is only used as an explanation. The predictor consists of the following variables: time sequence i of the current typhoon t ¯ i c ; time sequence i of the left typhoon t ¯ l i n ; and time sequence i of the right typhoon t ¯ r i n . The classification target column has class “left” (i.e., value from left typhoon), class “right” (i.e., value from right typhoon), and class possibility of the current typhoon.
If the k-NN classification has been performed, the training dataset for k-NN regression can be arranged based on the class tendency of the current typhoons. The training dataset scheme for this algorithm can be seen in Table 1. The input variables of the predictor are similar to k-NN classification. However, the regression target for the zonal component consists of x ¯ i c , which is the longitude of the current typhoon at sequence i, x ¯ l i n , which is the longitude of the left typhoon at sequence i, and x ¯ r i n , which is the longitude of right typhoon at sequence i, respectively. The regression target for the meridional component includes the latitude of the current typhoon at sequence i y ¯ i c , the latitude of the current typhoon at sequence i y ¯ i c , the latitude of the left typhoon at sequence i y ¯ l i n , and y ¯ r i n , which is the latitude of the right typhoon at sequence i.
If the class tendency of the sample typhoon is predicted as “center”, the training dataset for the k-NN regression contains coordinate values of the combination of the left typhoon, right typhoon, and current typhoon. If the class tendency of the sample typhoon is predicted as “left”, the training dataset is only filled with the coordinate values of the current and left typhoons. Likewise, if the class tendency of the sample typhoon is predicted as “right”, the scheme will only include the coordinate values of the current and right typhoons. The final prediction is conducted by averaging each ensemble prediction of typhoon tracks in the regression.
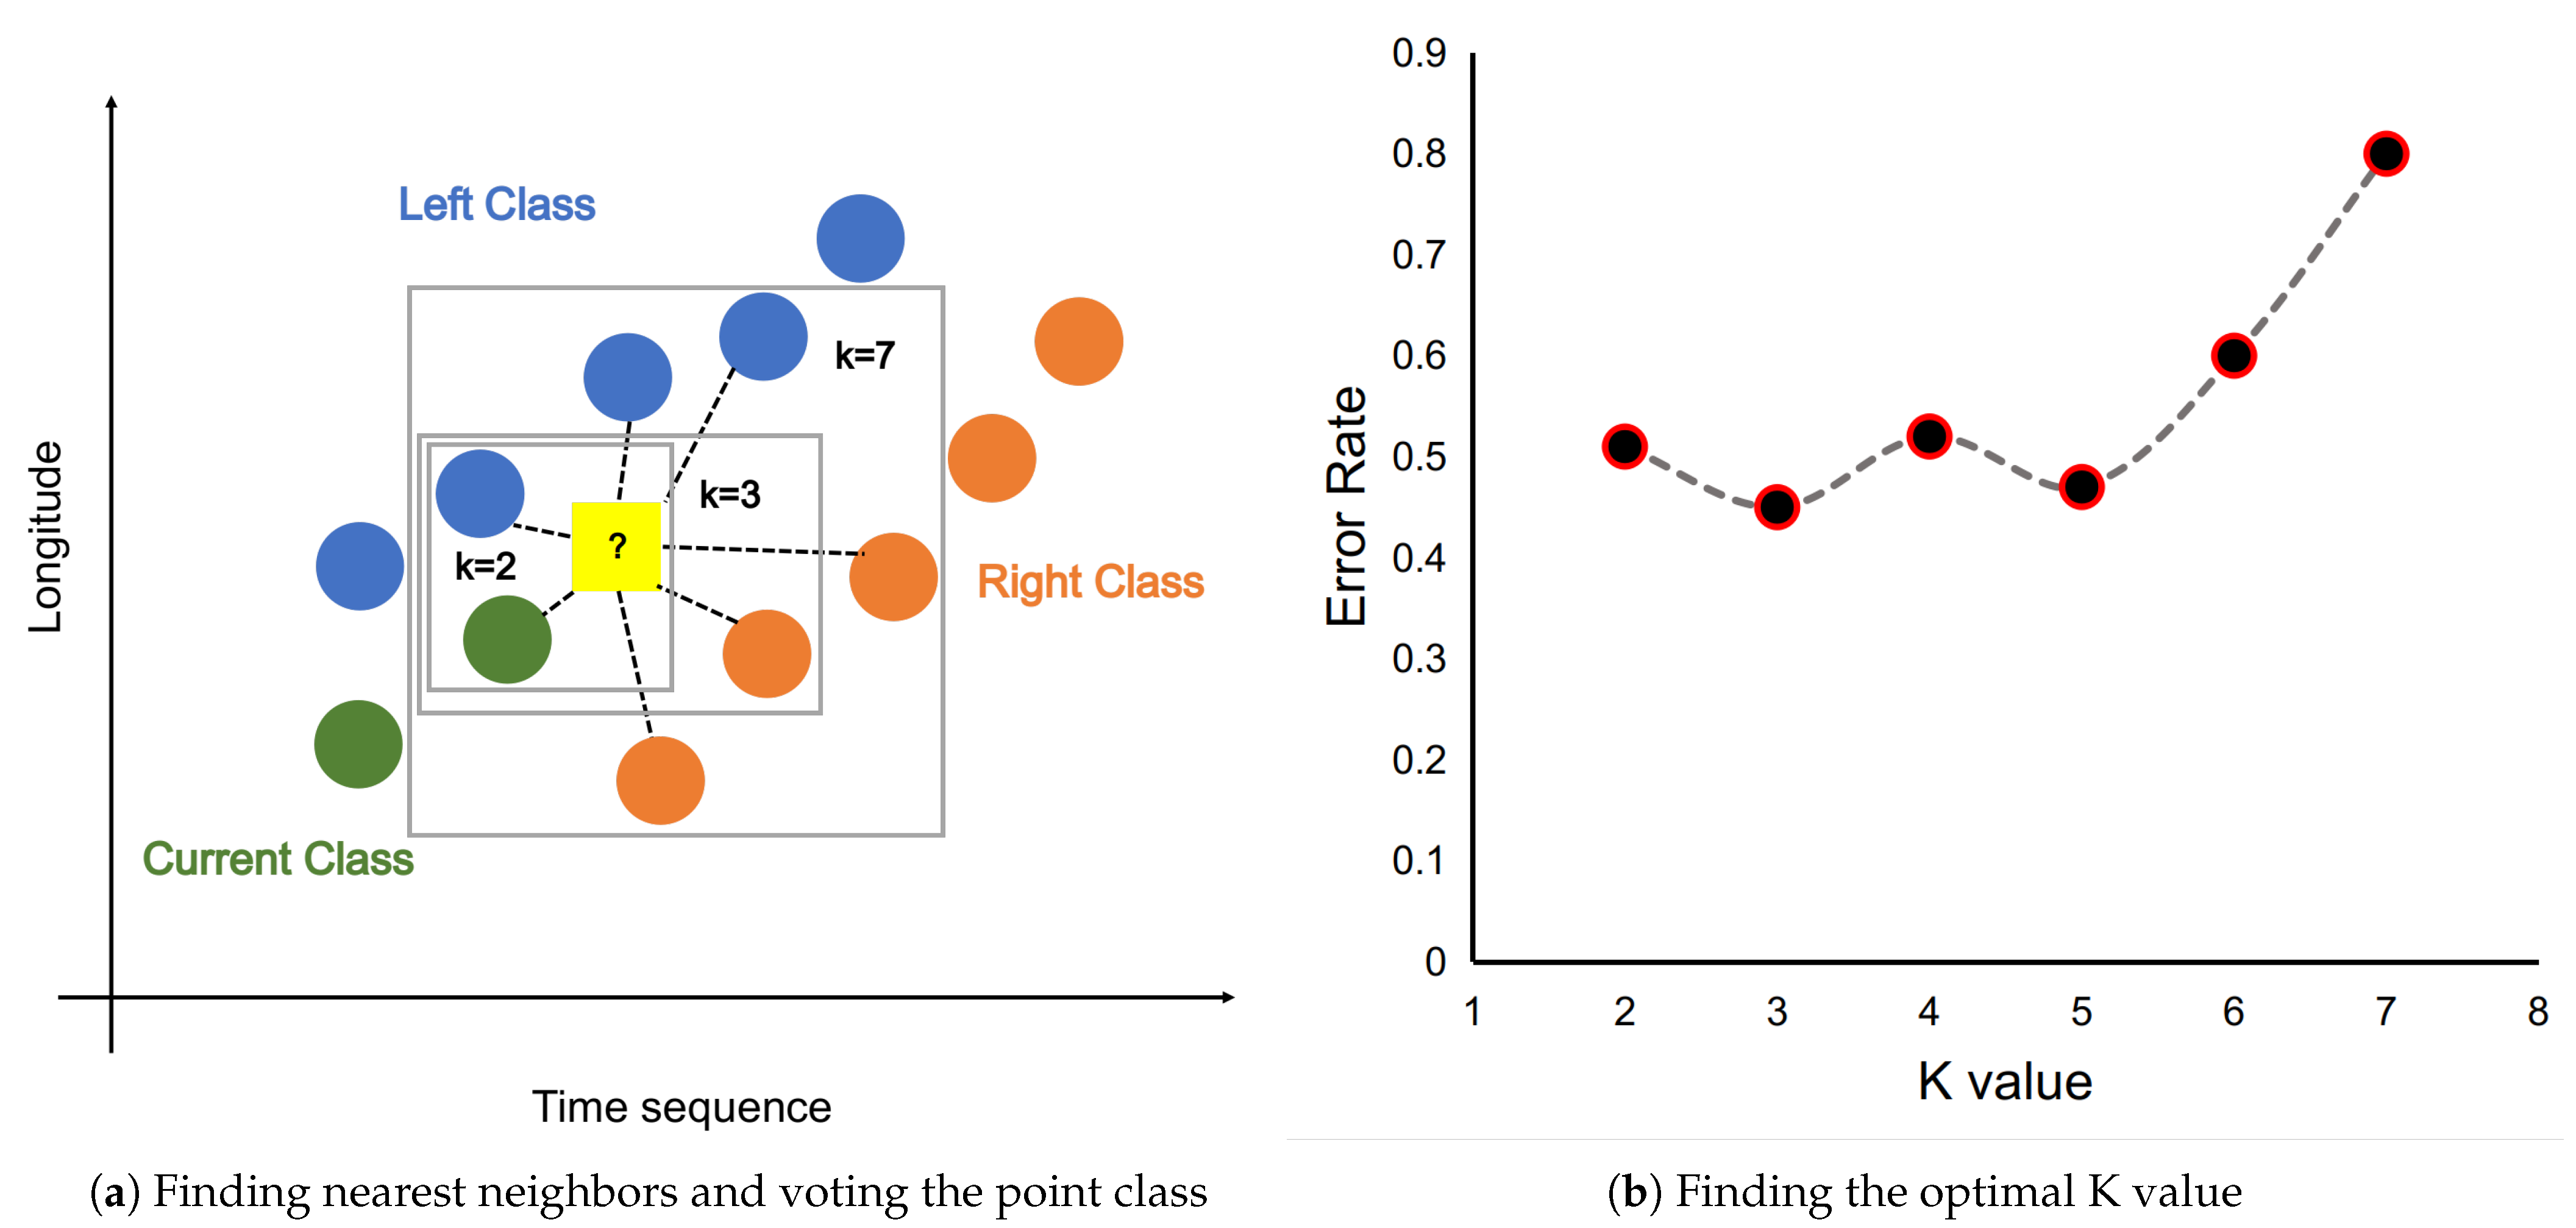
As seen in Figure 6, the determination of class tendency of the current typhoon is obtained by using the k-NN classifier. The distance is calculated between points from the left typhoon, points from the right typhoon, and initial/last updated points from the present typhoon to the next point from the present typhoon (see Figure 6a). The k value is defined as the number of neighbor points that involve the class determination of the current point. Then, the tendency of the present class is calculated by taking the majority of votes. Note that the optimal number of the hyperparameter of k-NN was investigated, viz. 2 to 7 neighbors. The optimal three neighbors yield and affect the optimal performance since the present point is only assumably affected by the nearest current, left, and right points. This condition was tested by mean error by comparing the testing result and actual data, as seen in Figure 6b. Based on this condition, there is an assumption that if the number of neighbors is larger than three neighbors, the error of the predicted value will be larger in the k-NN regression.

2.2.5. Evaluation Method

Since typhoon track simulations always include errors, the error is evaluated as follows [32]:
e i = x a i x p i 2 + y a i y p i 2
where e i is the error distance, x a i and y a i are the zonal and meridional components of the actual typhoon track and x p i and y p i are the zonal and meridional components of the predicted typhoon track, respectively.

3. Results

This work aims to create a new approach to accurately predict the typhoon tracks that have the potential to impact a region, with Korea as a case study. The simulations are carried out on five sample typhoons that impacted the Busan area, namely Megi 2004, Malou 2010, Namtheun 2016, Tapah 2019, and Omais 2021. To predict each sample typhoon, the ensemble members can be different from one another. This is because each predicted typhoon seeks similar patterns from typhoons in the past and then forms a member ensemble.
As explained in Section 2, an ensemble consists of a left class typhoon, a right class typhoon, and a sample typhoon. The class determination of past typhoons results from the first five sequences since the predicted typhoon began to move forward. The sample typhoon is classed as left, right, or center class depending on the closeness distance to the left and right past typhoons. If the sample typhoon follows the left class, then the training dataset for regression prediction will only include the zonal and meridional coordinates of the predicted typhoon and the left class typhoon and vice versa. However, if the sample typhoon is in the center class, the zonal and meridional coordinate values of the two typhoon classes (left and right) must be included in the training dataset for regression prediction.
The order of discussion in this section starts with the results of the ensemble classification and then the ensemble for regression of zonal and meridional components to the final track prediction. This discussion presents prediction results for five typhoon samples. The past typhoons involved in the ensemble k-NN simulation are provided in Table A2.
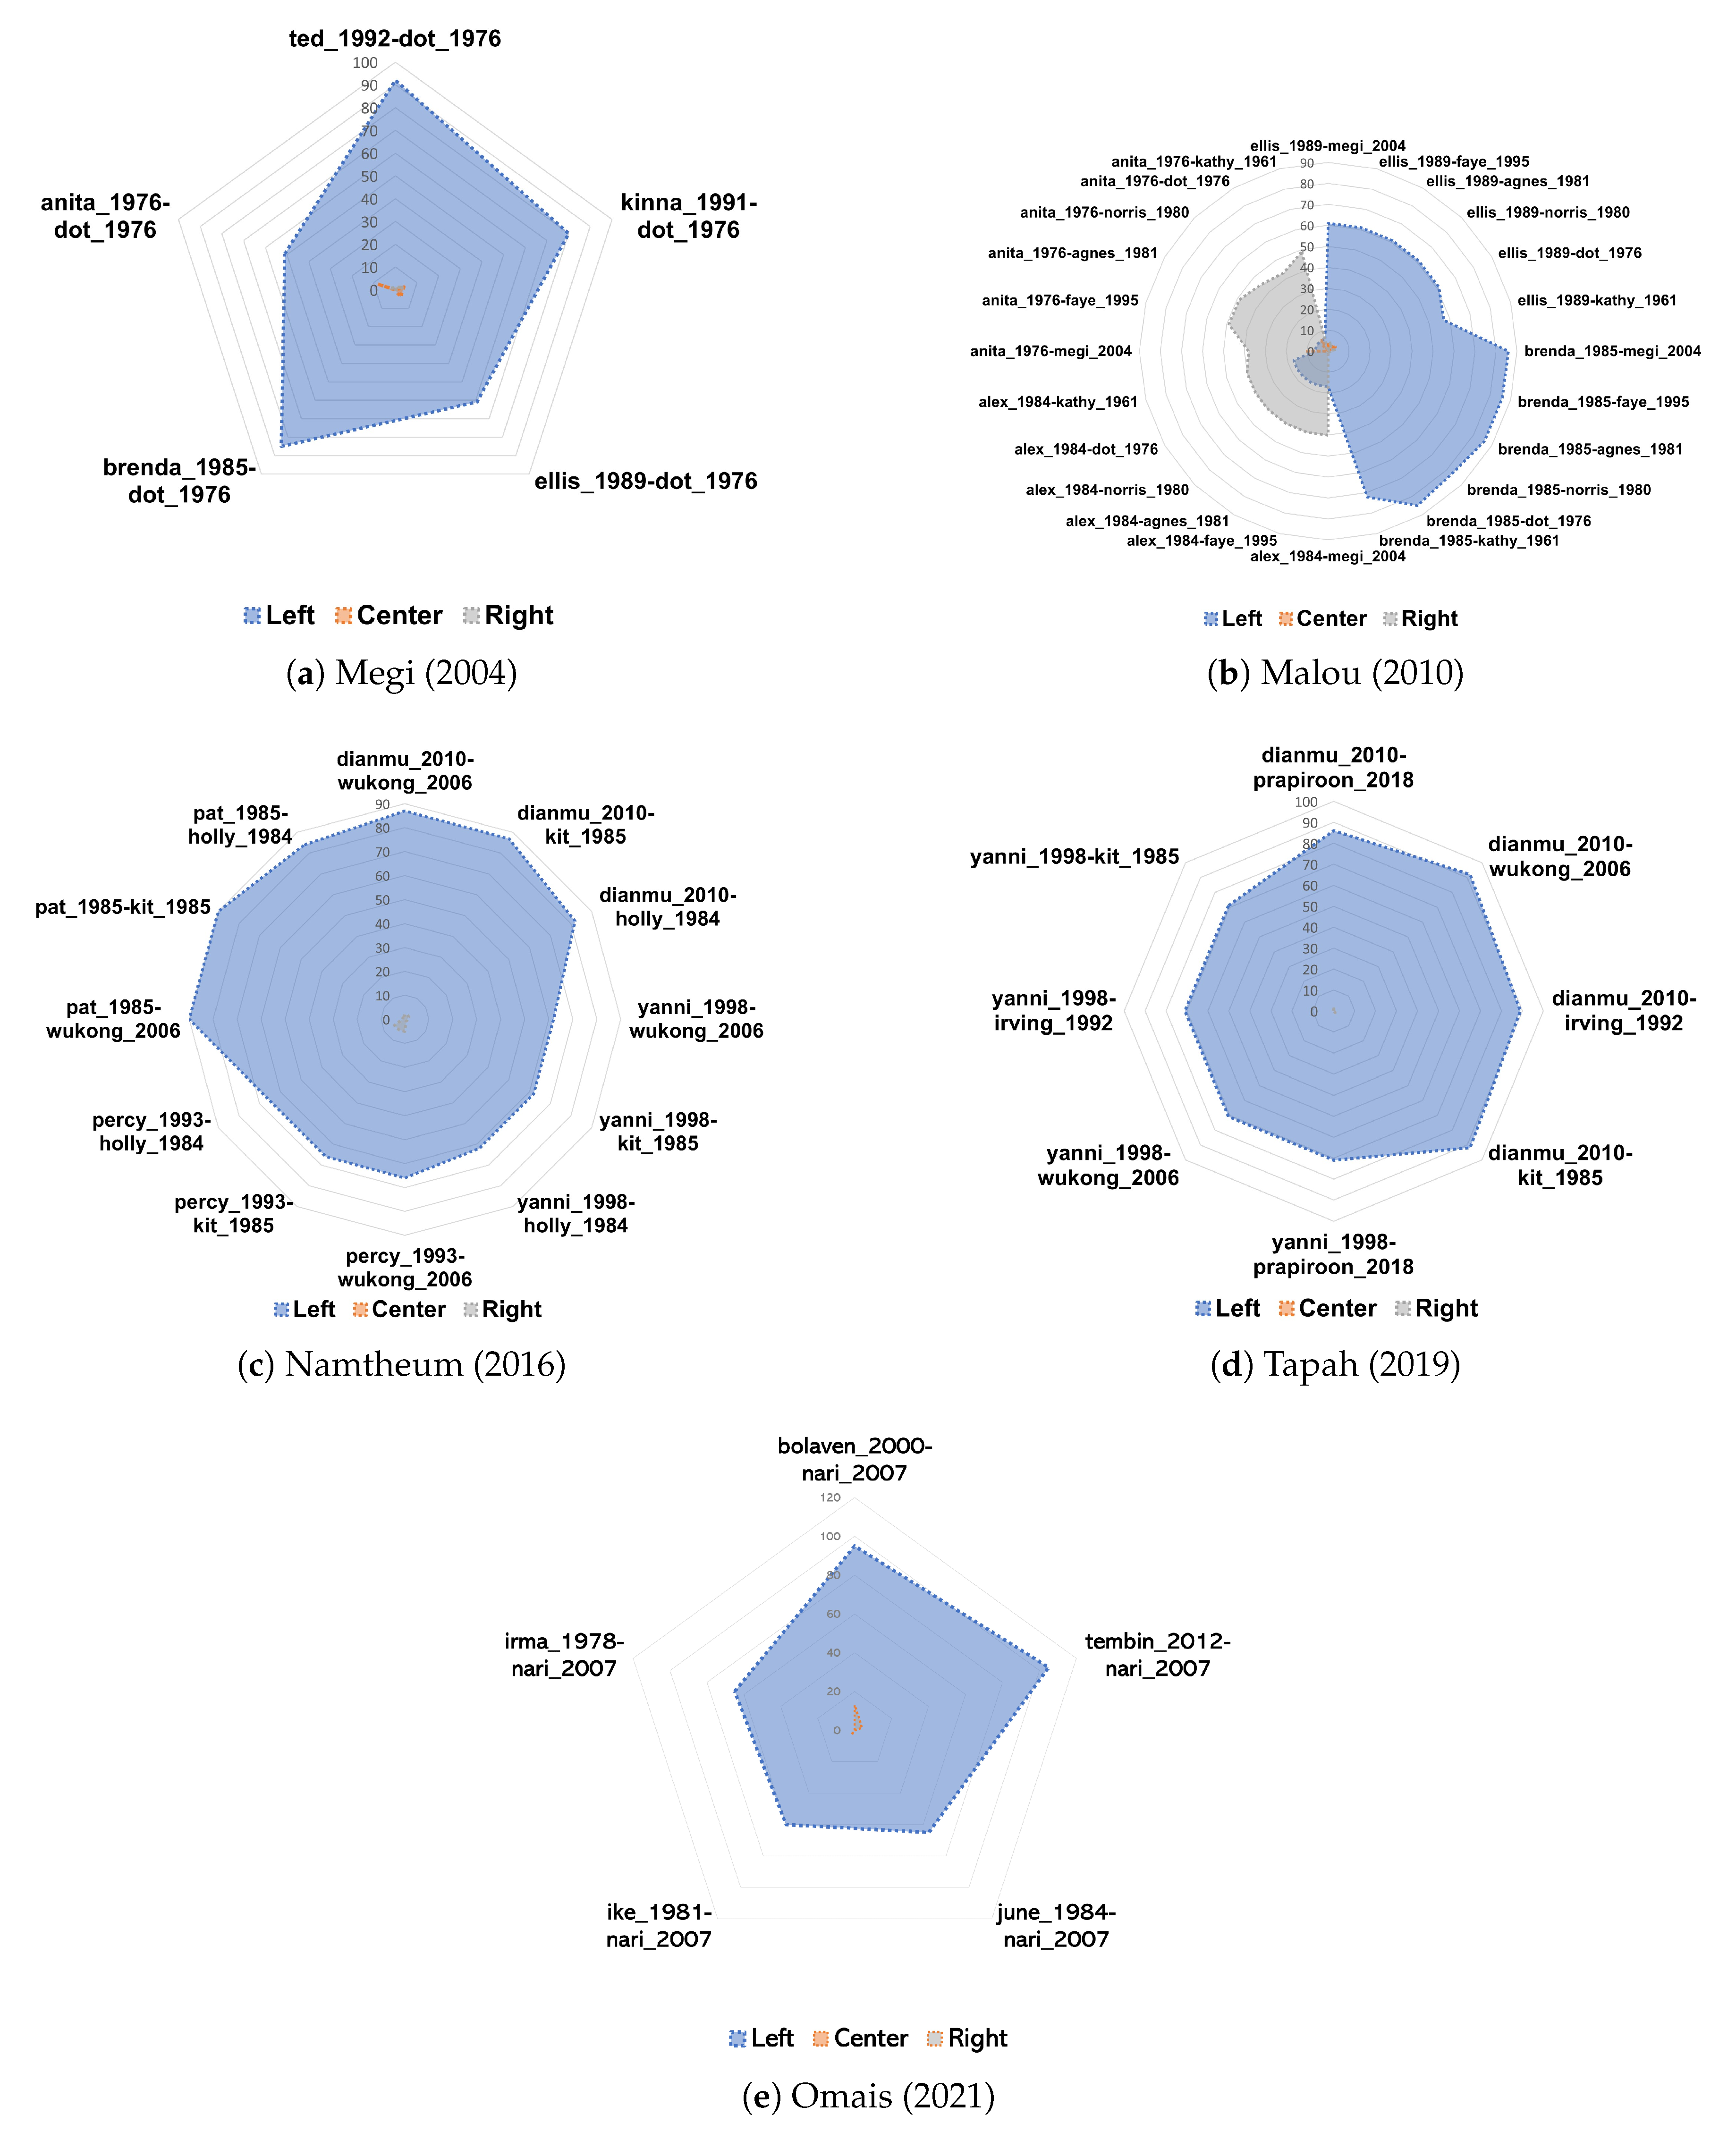
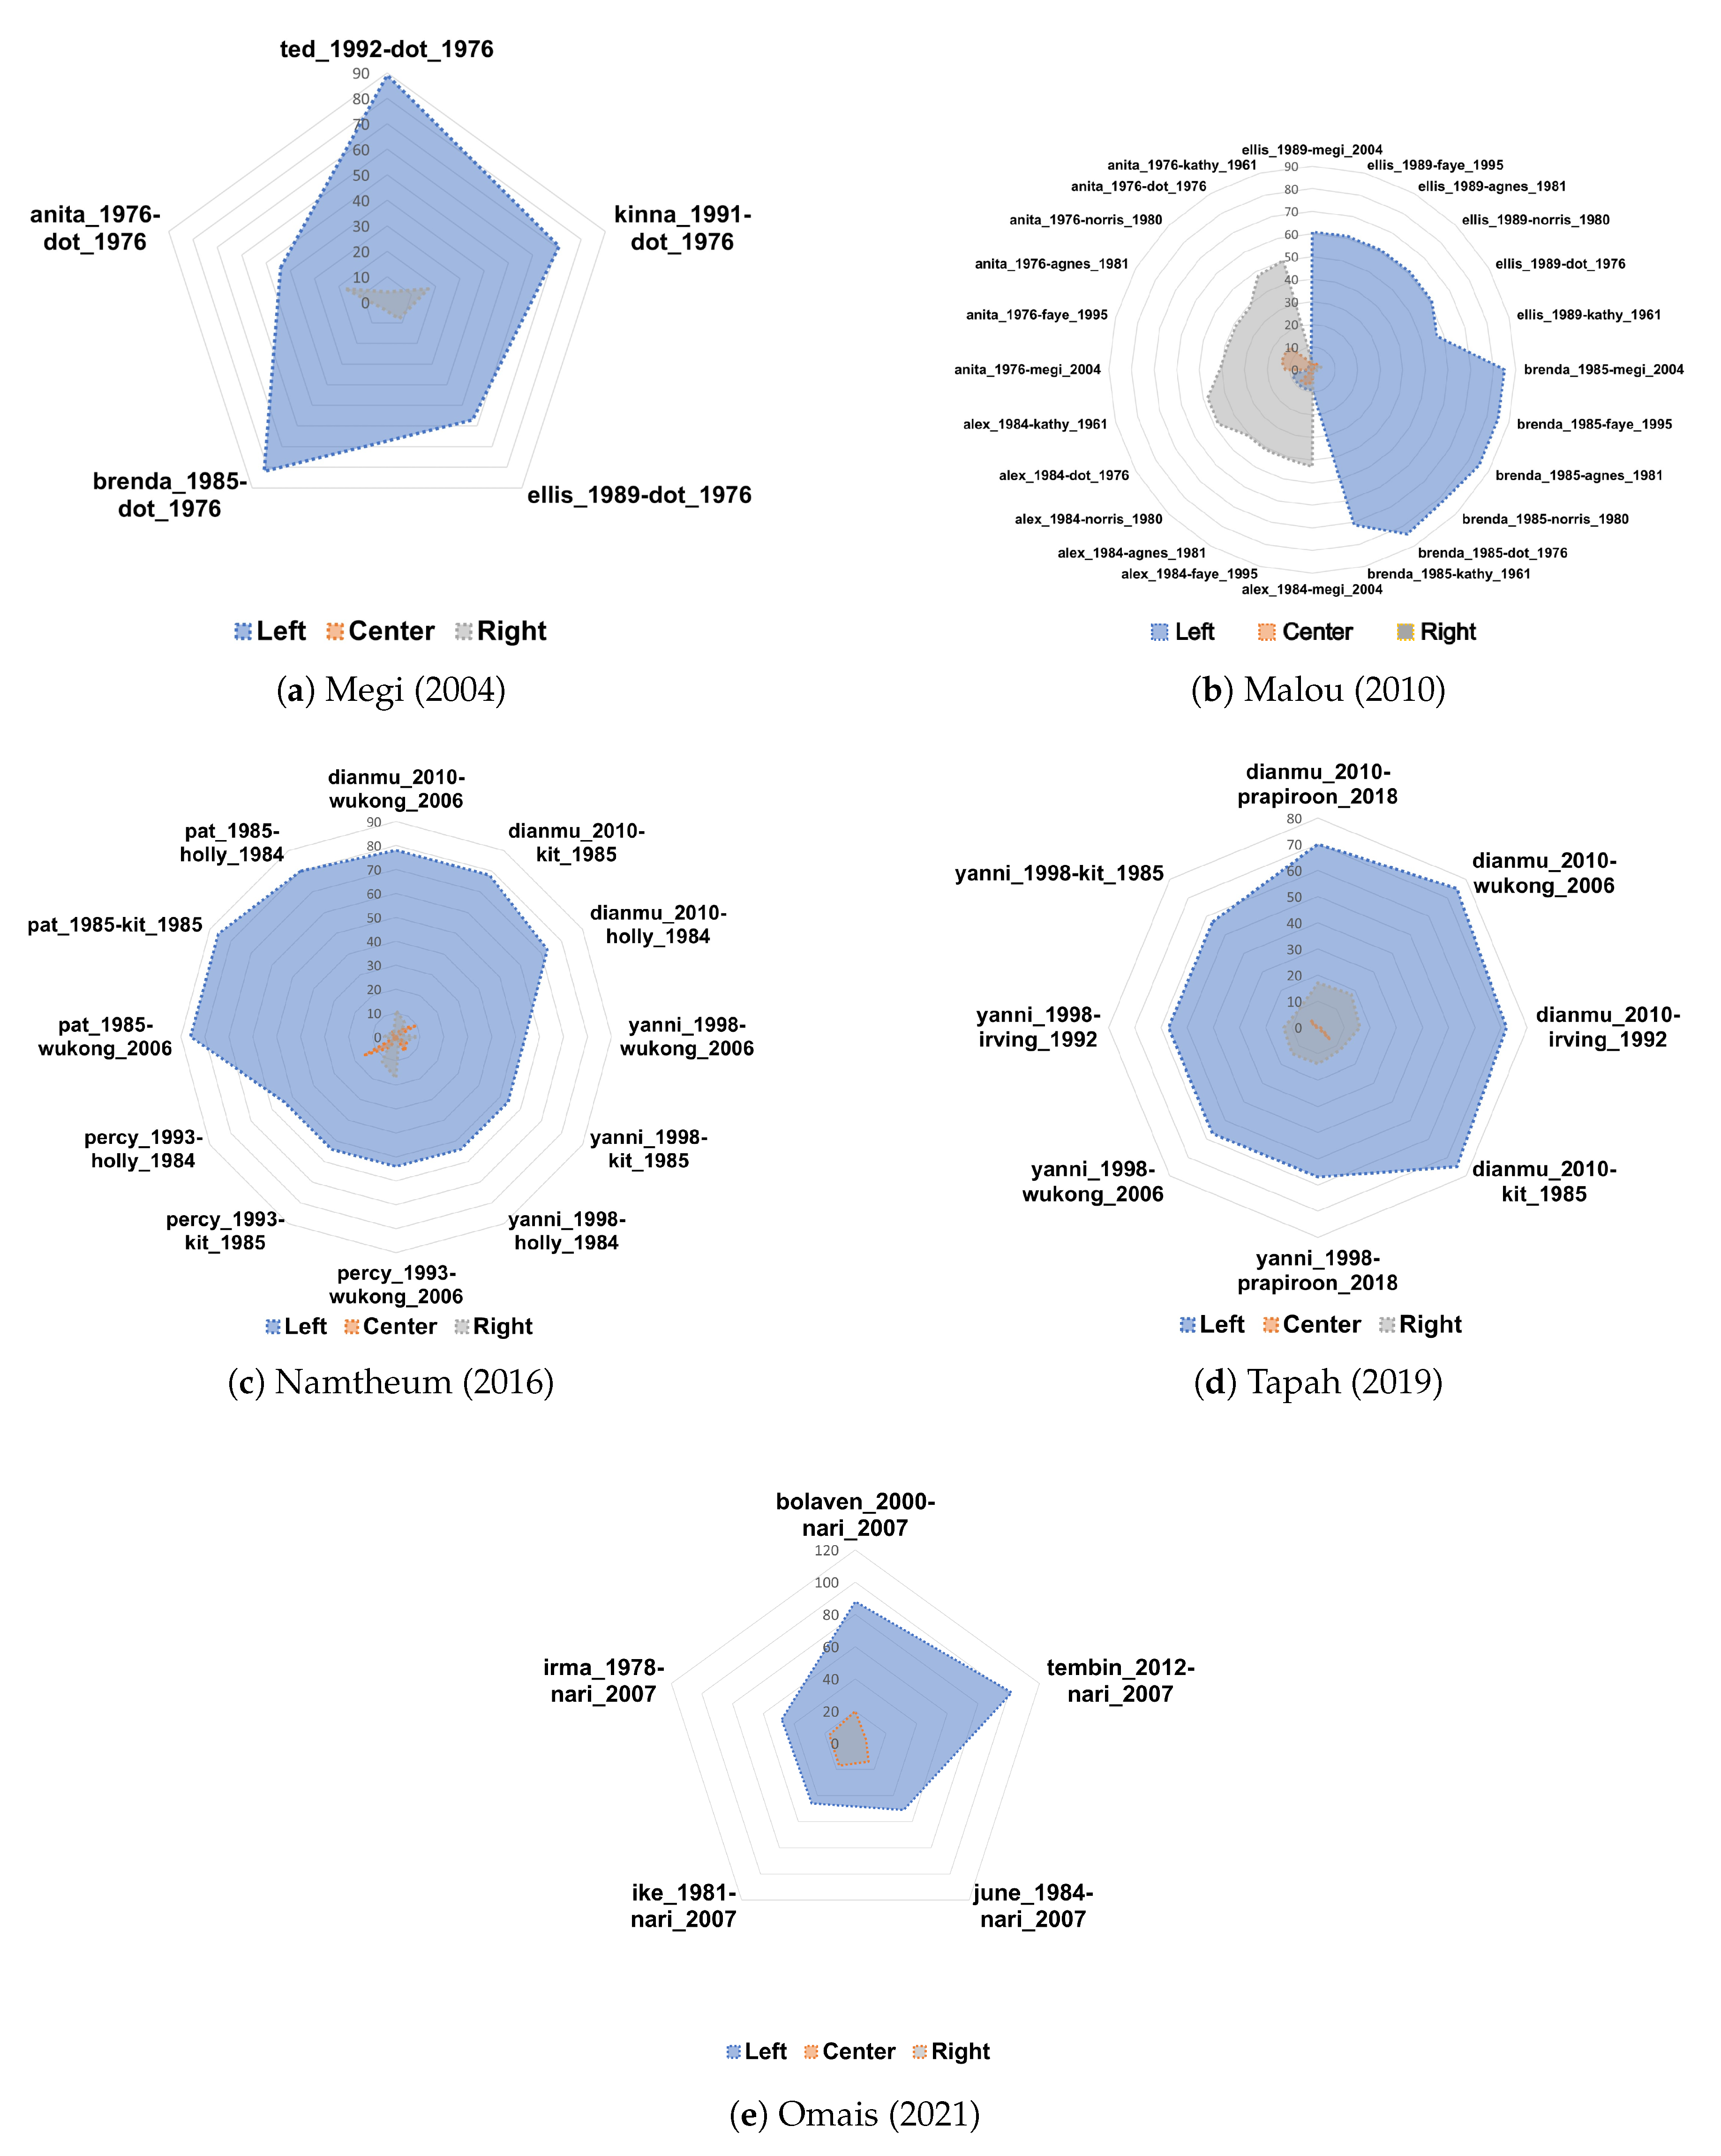
Figure 7a shows that the classification results of five ensemble members predict the tendency class of typhoon Megi 2004 for the zonal component. It can be seen that typhoon Megi 2004 mostly follows the track pattern of the left typhoon. Past typhoons in the left class include Ted 1992, Kinna 1991, Ellis 1989, Brenda 1985, and Anita 1976, while the past typhoons in the right class include only Dot 1976. Although there are a number of center classes, namely in the ensemble member anita_1976-dot_1976, the number is too small compared to the left class. Therefore, this ensemble shows that the tracks of typhoon Megi 2004 follow the left class track pattern.
For typhoon Malou 2010, the number of ensemble members is larger than the previous sample typhoon (Figure 7b). This is due to the large number of past typhoons in which the genesis was close to the initial track of typhoon Malou 2010. Different from typhoon Megi 2004, the simulation of typhoon Malou 2010 shows reasonably similar results between the right and left classes. However, 12 ensemble members determined the tendency of typhoon Malou 2010 to approach the left typhoon. This is because most of the members in the left class appear larger than the right class. A small number of results for the center class are neglected in predicting the track for Typhoon Malou 2010. As shown in Figure 7c, the ensemble members of typhoon Namtheun 2016 show a typhoon tendency to approach a track pattern from the left typhoon. For typhoon Tapah 2019, eight ensemble members are involved in predicting the sample typhoon track (see Figure 7d). In this sample typhoon, the tendency mostly approaches the path of the left typhoon. In the zonal component, the left class is very dominant. As seen in Figure 7e, there are five ensemble members involved in predicting the track of this typhoon. Most ensemble members predict the tendency class of typhoon Omais 2021 to follow the left typhoon.
The result of the k-NN classification for the meridional component is shown in Figure 8. Of five sample typhoons, four typhoons show the tendency of left class, i.e., Megi 2004, Namtheum 2016, Tapah 2019, and Typhoon 2021, as seen in Figure 8a–e, respectively. As shown in these figures, although several ensemble members show several tendencies of the right class, the number is too small compared to the left class. In Figure 8b, the simulation results of typhoon Malou 2010 show a fairly balanced right and left class. Twelve ensemble members determined the tendency of typhoon Malou 2010 to exist in the middle of both the left class and right classes.
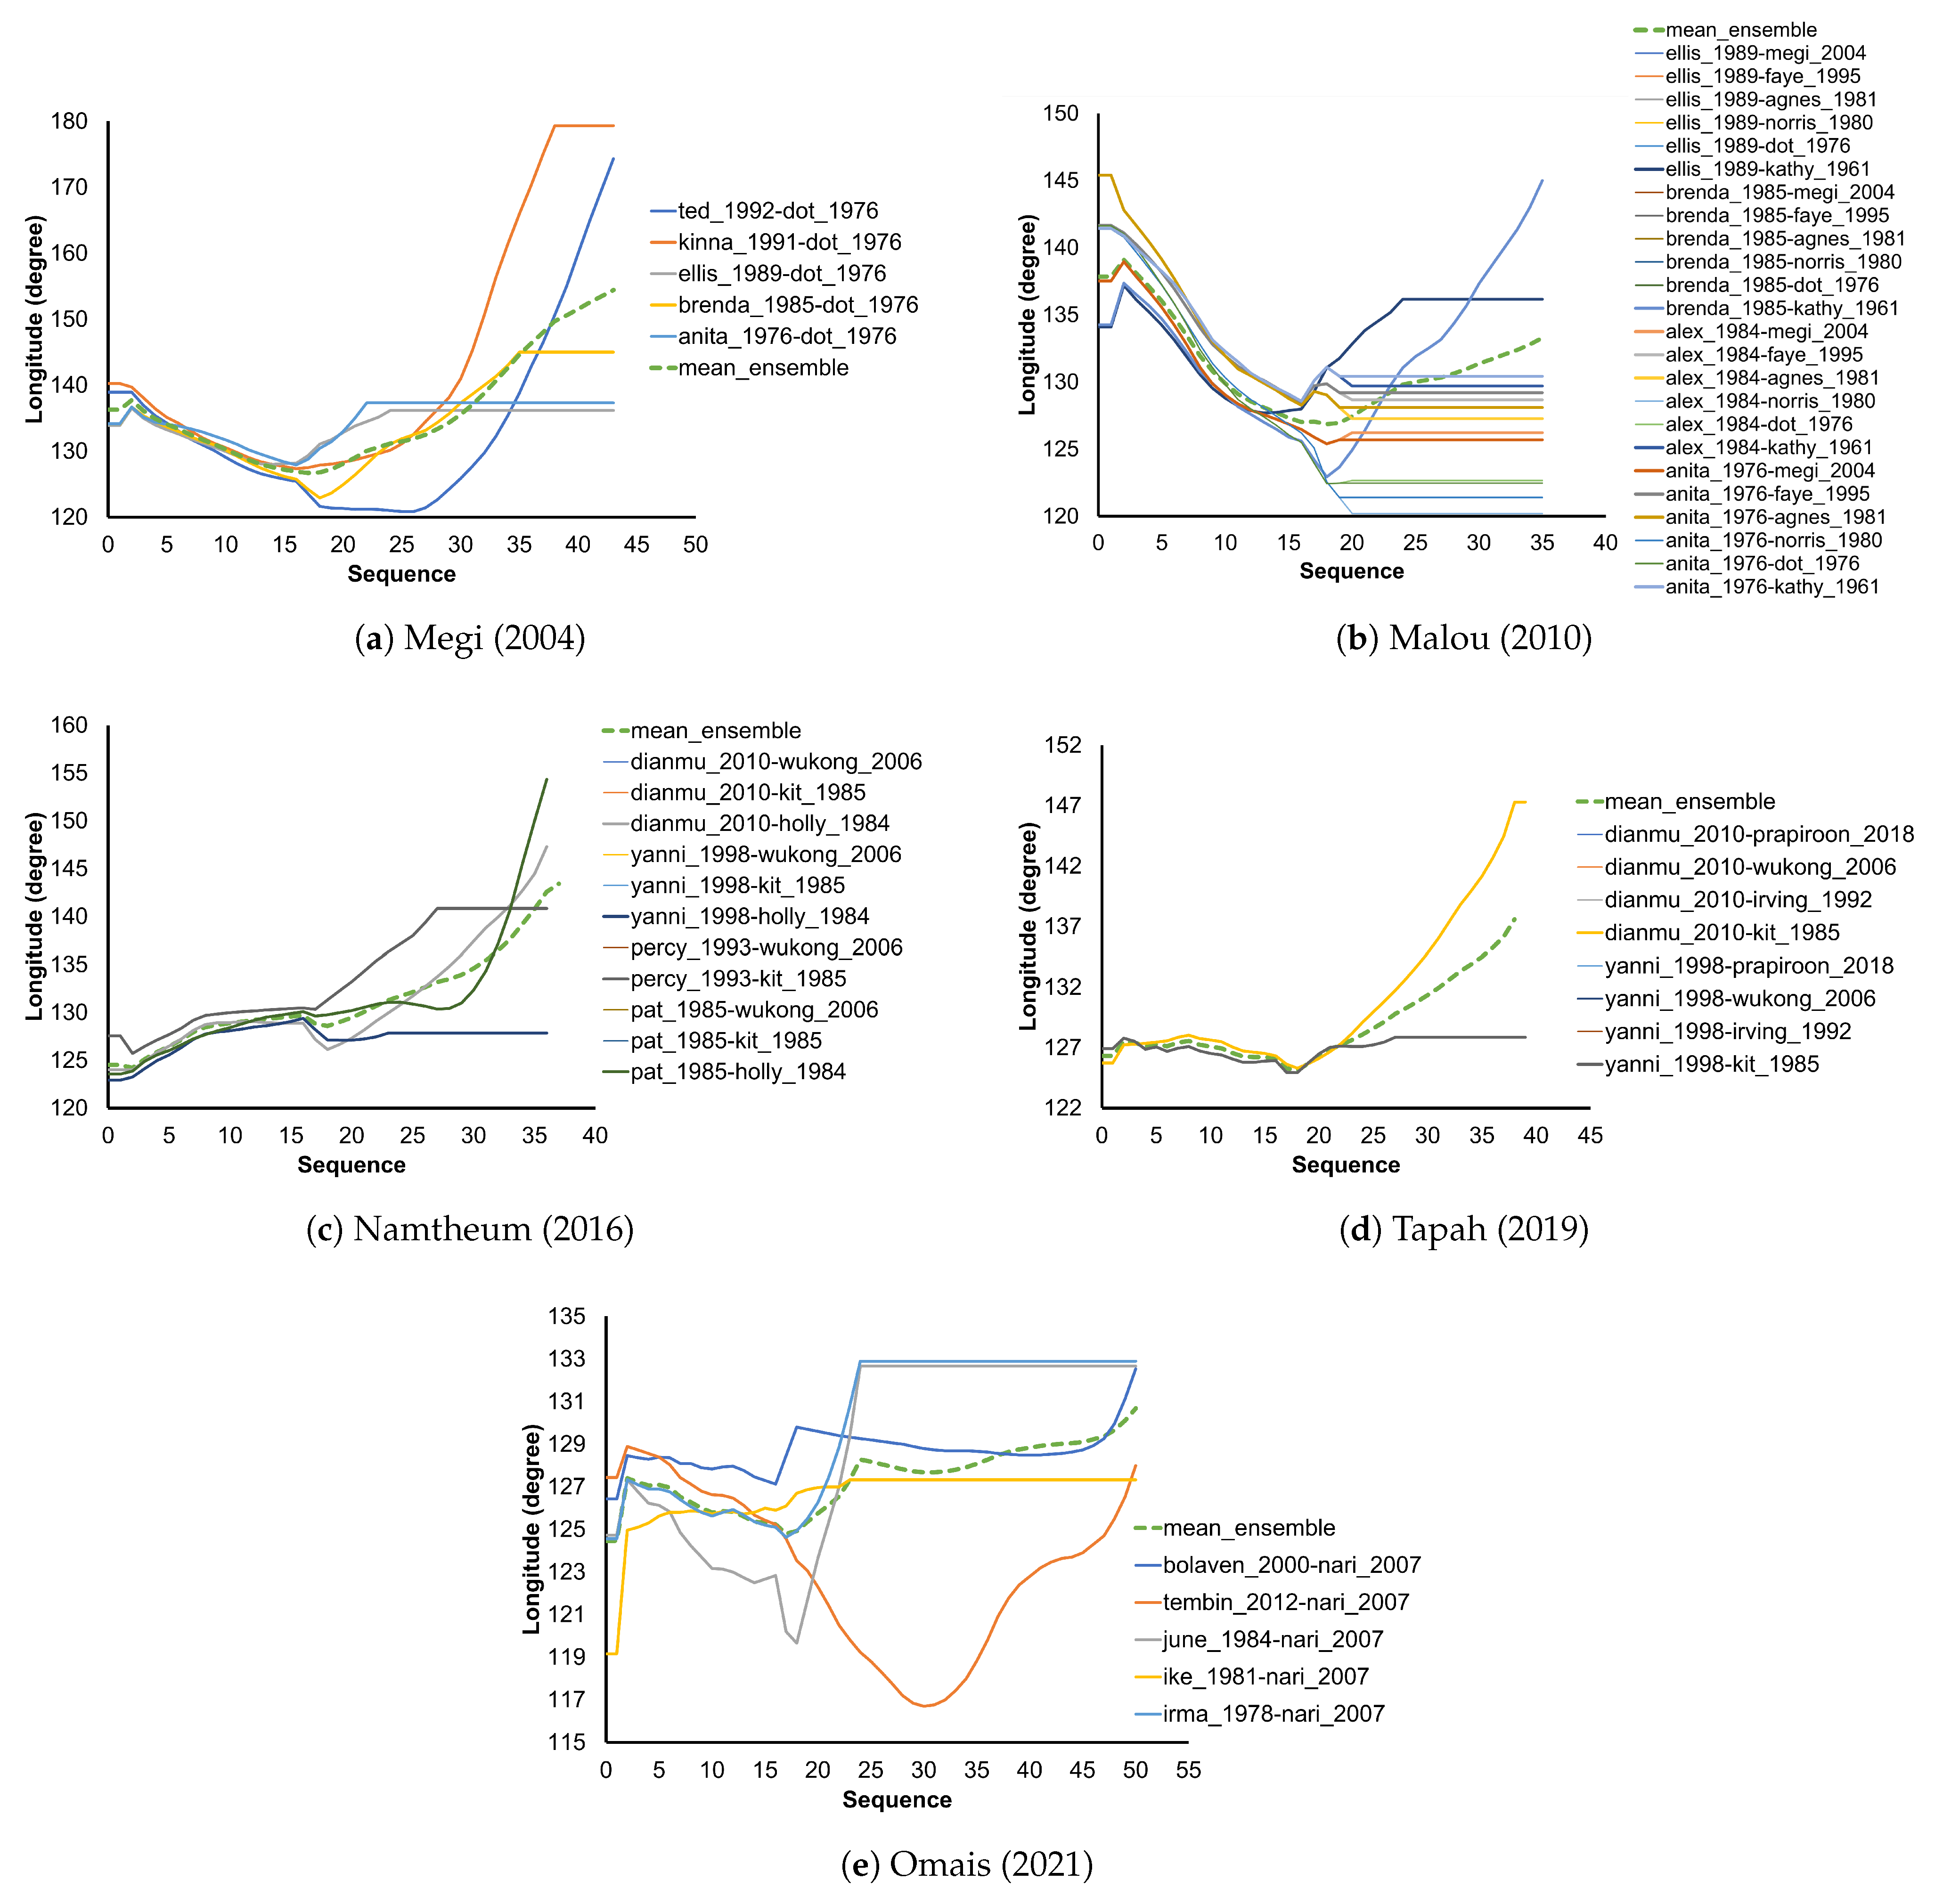
Now the results of the k-NN regression simulation based on the training dataset formed from the results of class tendency determination are discussed. The track predictions for the zonal components are shown in Figure 9. Figure 9a shows typhoon track prediction for typhoon Megi 2004 from each ensemble member. It can be seen that the predicted longitude coordinates for all ensemble members are in the range of 121 to 179.33 degrees. Furthermore, the prediction of the zonal coordinates of each ensemble member varies quite significantly, especially after exceeding sequence 16. This is reasonable because several early tracks are still influenced by the actual initial value of typhoon Megi 2004. The huge difference in values is shown in sequence 30 by the prediction in the ensemble member Brenda_1985-dot_1976. Due to the variation in the predicted value, the determination of the final ensemble track is carried out by calculating the average value. As shown in Figure 9 for all typhoons, the average track prediction value for all ensemble prediction results in a dotted green line.
Figure 9b represents the track prediction of typhoon Malou 2010 for the zonal component. The values of predictions starting from sequence 20 are constant. On the other hand, several predictions from other members start to be constant in the next sequence. The constant values are caused by the limited sequence of several members. Therefore, as the k-NN regression predicts the next track, it refers to the last value since it is the closest point. In this condition, only one member has a long sequence, namely ellis_1989-dot_1976. Therefore, these constant prediction values increase the error in the prediction of the end tracks, which can later be seen in the discussion of the zonal-meridional combined track prediction.
For the track predictions from typhoon Namtheun 2016, there are 12 members involved in the process. As seen in Figure 9c, several prediction results have the same value among the members. Therefore, the chart shows as if there are only four members. For the zonal component, it can be seen from the chart that the prediction results for the zonal coordinates increase in a small range of values. This indicates that the track does not move far zonally.
The track prediction for typhoon Tapah 2019 from all ensemble members can be seen in Figure 9d. Although there are eight ensemble members, the prediction values are close to each other for most ensemble members starting from the initial sequence. Therefore, the ensemble for the zonal component seems to be divided into two conditions, namely conditions with zonal values that tend to be constant before sequence 22 and start to increase after sequence 22. The track prediction of typhoon Omais 2021 from all ensemble members can be seen in Figure 9e. Five ensemble members show the variation of the track values. The most significant differences are shown by the member tembin_2012-nari_2007. Two members show constant values after sequence 25. The constant values occur since the lifetime of one member finishes in this sequence.
Figure 10 represents the track prediction for the meridional component. Figure 10a shows a meridional track prediction of typhoon Megi 2004. There are differences in the ensemble prediction results for the meridional component compared to the zonal component. For the meridional component, the variation of the ensemble prediction value is quite high in sequences 16 to 34. For the rest, the variation of the track prediction value is distinctly low. In this component, the ensemble member ted_1992-dot_1976 shows far from the predicted value.
The track prediction of typhoon Malou 2010 for the meridional component is given in Figure 10b. The prediction shows constant values from two members starting from sequence 20. The tracks of other members start to be constant from sequence 35. The predicted tracks are constant because of the limited sequence of the members. Therefore, the k-NN regression refers to the last values to predict the next track that causes the prediction of constant values. There is only one member that has a long sequence, namely el-lis_1989-dot_1976. These constant prediction values increase the error, which can later be seen in the discussion of the zonal-meridional combined track prediction. For the track predictions from typhoon Namtheun 2016, there are 12 members involved. As seen in Figure 10c, the meridional values increase over the sequences. From these values, it can be estimated that the track moves towards the north.
For typhoon Tapah 2019, the track prediction from each ensemble member can be found in Figure 10d. The ensemble of meridional prediction shows incisively increasing values until sequence 25. The next sequences show a gradual increase. Thus, the typhoon always moves to the north. For typhoon Omais 2021, as seen in Figure 10e, five ensemble members show a high variation of the track values in which the member tembin_2012-nari_2007 has the most significant differences. However, two members show constant values after sequence 25, namely june_1984-nari_2007 and irma_1978-nari_2007.
Before discussing the combination of the zonal and meridional components, the correlation of consecutive points is calculated to identify the track pattern similarity between the prediction and actual condition for both zonal and meridional components. As given in Table 2, the average correlation for the zonal component is smaller than the meridional component, meaning that the zonal track variation mostly occurs, whereas the meridional track invariably moves towards the north.
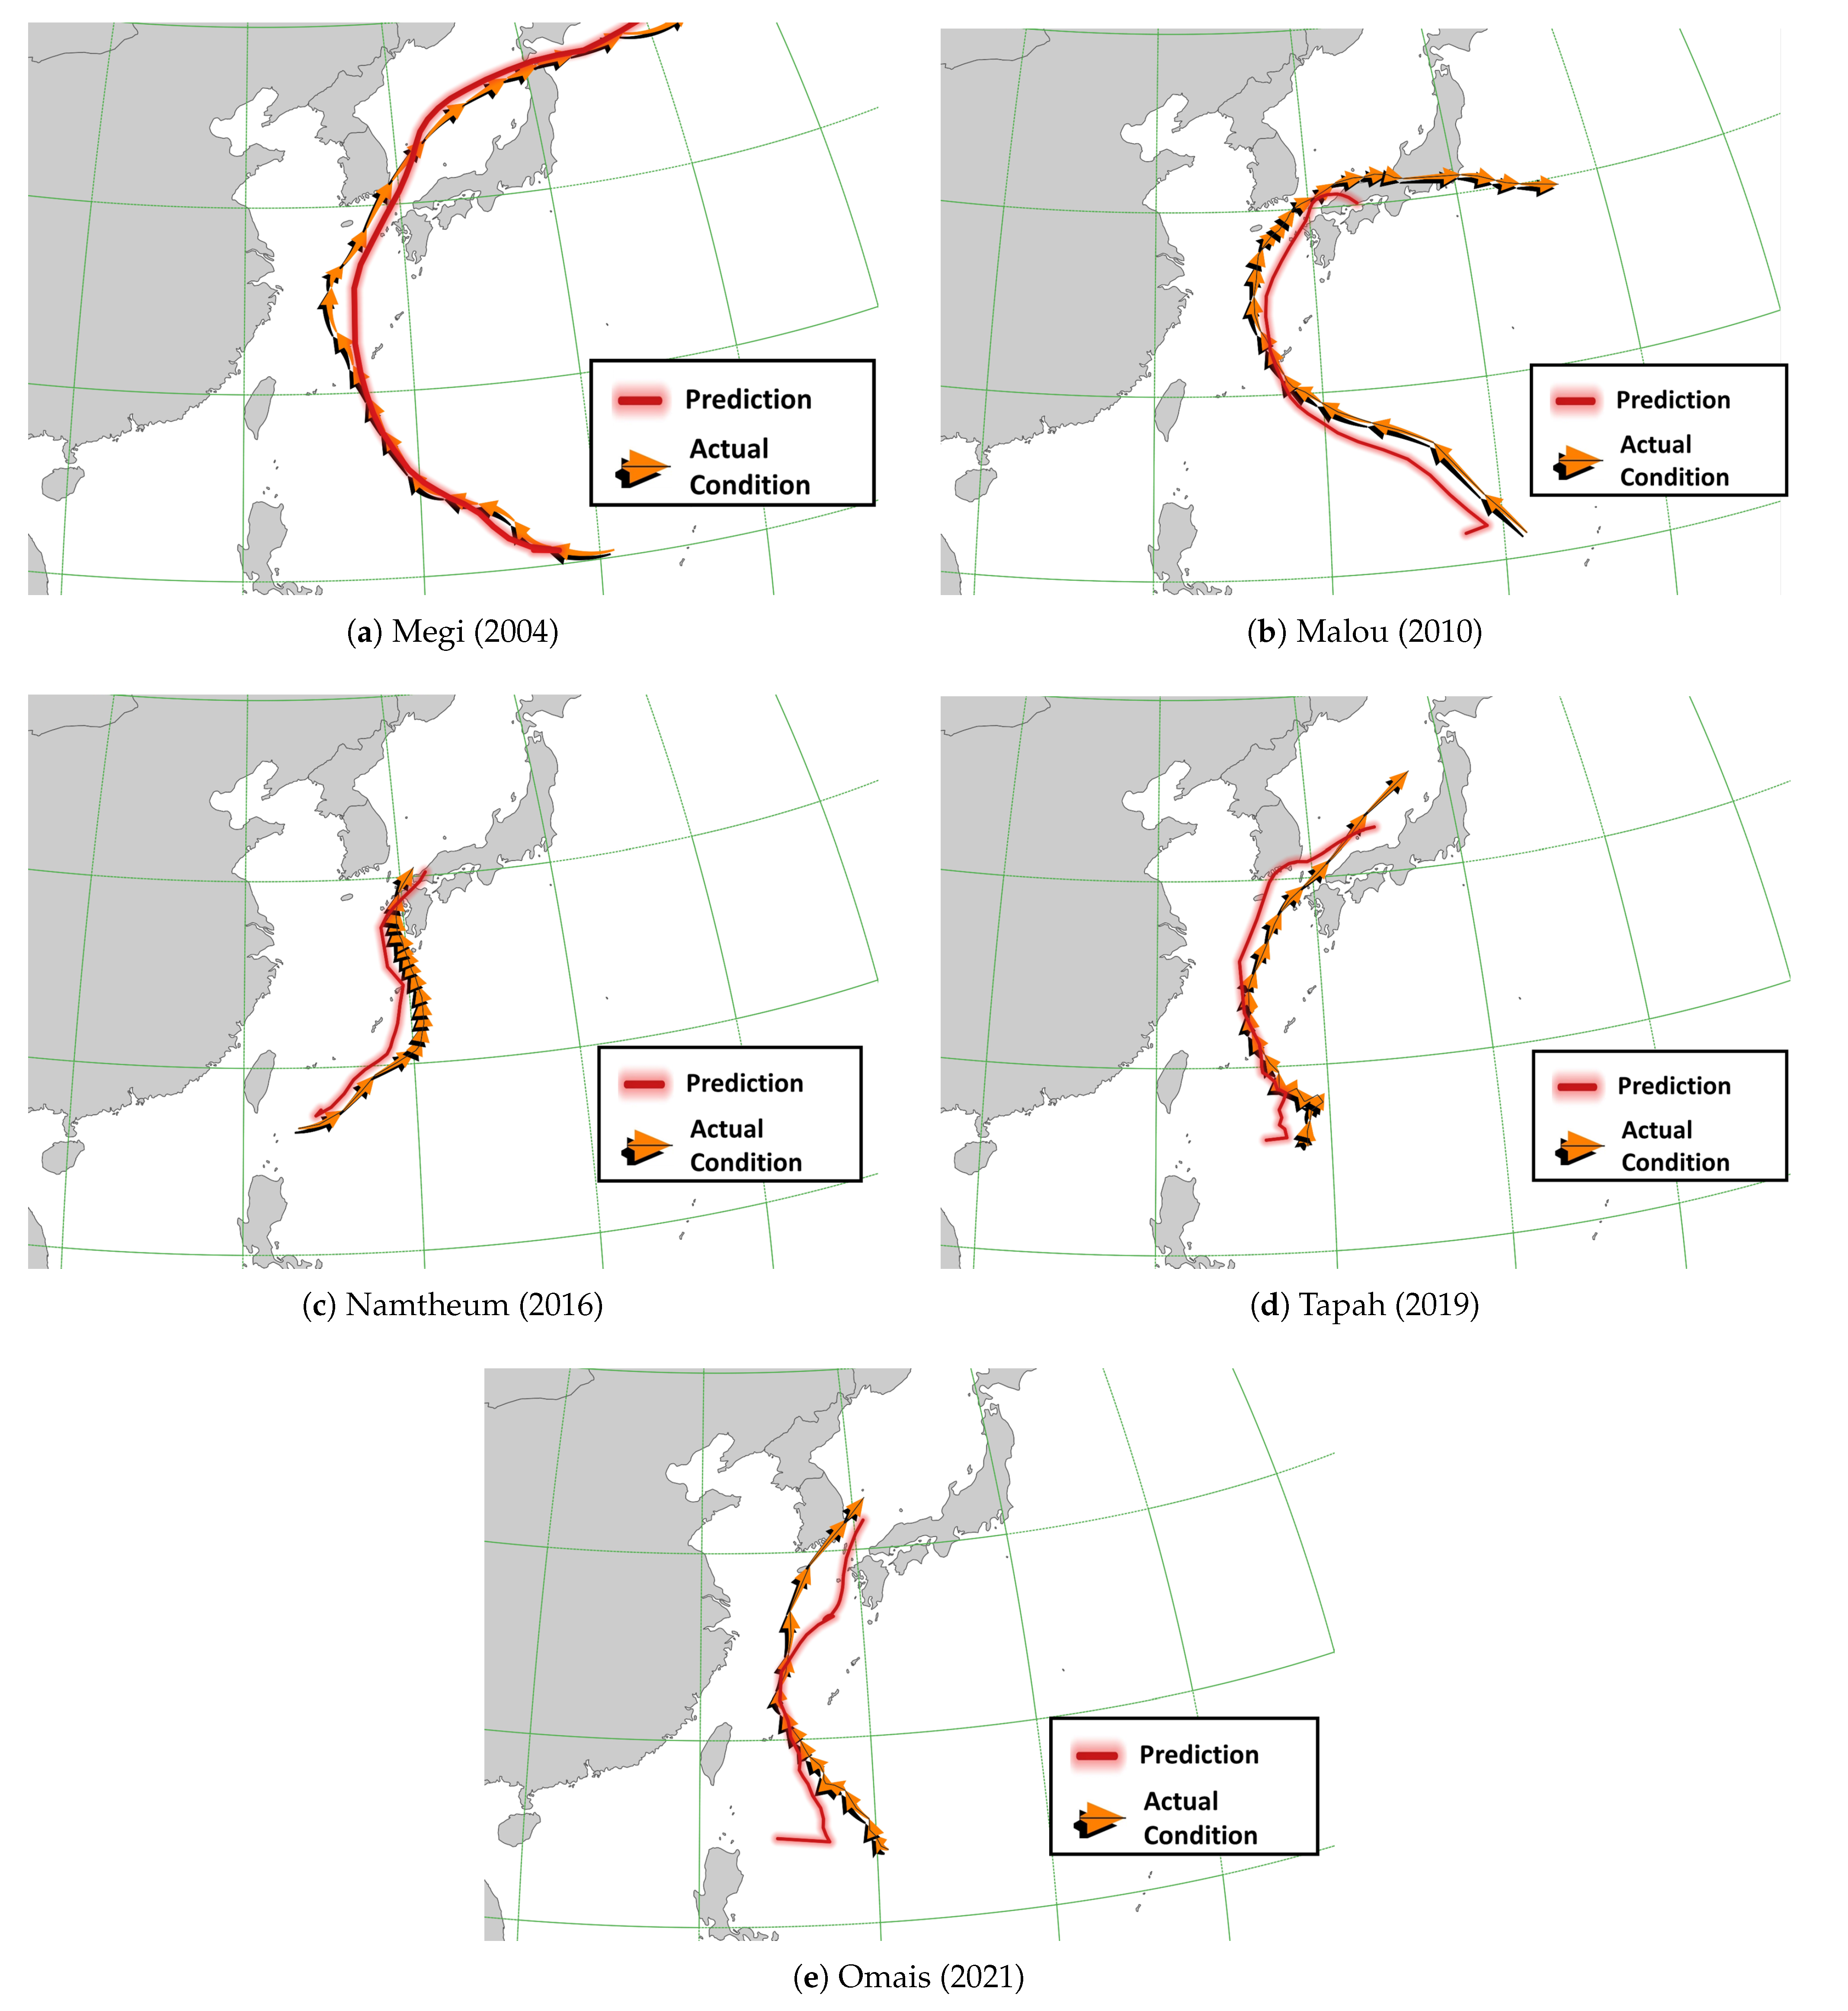
Based on the aforementioned result, the k-NN regression results for the combination of predicted zonal and meridional components, which hereinafter will be referred to as the final track prediction, are respectively discussed. Several ensemble members show final track predictions that are zonally close to the actual conditions; the rest are distant. Based on each ensemble member, there are ending tracks of the past typhoons that are shorter than the other past typhoon in the ensemble. This condition causes the predicted track results in the ensemble to be frequently the same as the previous track. Therefore, this result increases the error when it is averaged to obtain the track prediction of the mean ensemble. Figure 11 depicts that the final prediction shows a small distance between the zonal track prediction results and the actual conditions for five sample typhoons.
First, focusing on the final track prediction of typhoon Megi 2004, it can be seen that the overall errors appear to be small (see Figure 11a). At the beginning of the track, the error is quite large, which is 112.72 km. The same condition is also seen in the initial track of the other typhoon samples. It is also shown that several tracks deviate from the actual track. This is caused by the initial track of each ensemble member, which is far from the initial track of typhoon Megi 2004. The prediction error evaluation shows that the smallest, largest, and average errors are 12.82 km at sequence 12, 825.23 km at sequence 41, and 180.04 km, respectively.
Typhoon track predictions for typhoon Malou 2010 yield relatively larger errors than typhoon Megi 2004, as shown in Figure 11b and Table A1. However, since the number of sequences for typhoon Megi 2004 is larger than for typhoon Malou 2010, the average error for typhoon Megi 2004 is larger. As given in Figure 11b, a large error is also seen at the beginning of the track of the 2010 Malou typhoon. The prediction error evaluation in Table A1 shows that the smallest, largest, and average errors are 6.5 km at sequence 17, 422.58 km at sequence 9, and 172.03 km, respectively. However, the error distance is still acceptable since it is not too far from the actual condition. However, when viewed from the pattern, there is a similarity in the pattern between the predicted results and the actual conditions. The initial track of the predicted result is to the left of the actual condition and then changes to the right of the actual condition. Several points are accurate in predicting this typhoon track, including sequences 14, 15, 16, 17, and 29.
Different from the track from typhoon Malou 2010, the predicted results for typhoon track Namtheun 2016 are mostly on the left side of the actual condition. However, the predictive track patterns show more similarities, as seen in Figure 11c. In this track prediction, the evaluation shows that the smallest, largest, and average errors are 25.92 km at sequence 20, 272.61 km at sequence 27, and 138.73 km, respectively. The detailed values for Namtheum 2016 can be found in Table A1.
The prediction of typhoon Tapah 2019 track is shown in Figure 11d. In this typhoon, at the beginning of the track, there are numerous curvatures of the track line that the model can predict. The model’s ability to capture the past typhoon, which has similarities to the sample typhoon, allows the model to predict a number of captures at the beginning of the track. In this track prediction, as given in Table A1, the evaluation shows that the smallest, largest, and average errors are 5.23 km at sequence 16, 356.59 km at sequence 24, and 148.07 km, respectively.
Lastly, typhoon Omais (2021), which approached the Busan region, is also discussed. In this typhoon track prediction, a large error occurs at the beginning of the track, reaching 614.23 km. Although several tracks are close to the actual condition in the middle travel, the end of this track is extremely long. The comparison of the actual typhoon tracks and their prediction is given in Figure 11e and Table A1.
In addition, the detailed typhoon tracking prediction comparison of the proposed method and the Weather Research and Forecasting (WRF) model [33] can be found in Table 3. The WRF model is a numerical weather prediction system in mesoscale, which is generally used for both atmospheric analysis and operational prediction. The WRF model, in this work, is configured with a double-nested modeling system, in which the mother domain is 27 km spatial resolution and the finer resolution domain is 9 km. The physical parameterization is adjusted with the previous study for the western North Pacific region [34]. The processing time in the proposed method includes time for data preparation, simulation for determining the similarity tendency of each ensemble member, simulation of typhoon track predictions for each ensemble member, and the averaging process to obtain one final typhoon track prediction. Meanwhile, the processing time in the WRF model consists of preprocessing and processing. As shown in Table 3, the proposed method yields a 96.11% smaller average minimum error but 94.36% faster in processing runtime than the WRF model. However, it can be found that the present method produces a worse result in the maximum error than the WRF model. In addition, when more ensemble members are used, the proposed method causes a longer processing runtime.
Based on the simulation results, the spatial map reveals several variations in the distance between the predicted and actual tracks, with some distances closer or more distant at specific sequences. Some of the variances that occur in the typhoon track prediction can be influenced by several factors that should be further analyzed using climatology. The existing study [35] found that the track of a typhoon is strongly influenced by steering flow controlled by the ambient storm environment. The track pattern discrepancy between the predicted typhoon and the past typhoon can be affected by the storm. Therefore, the error can be increased as long as other atmospheric disturbances are still in effect.
It is also found that increasing the ensemble size does not necessarily increase accuracy. This is shown by typhoon Megi 2004, which has the highest accuracy compared to the other three typhoons. Typhoon Megi 2004 has only five ensemble members, which is also the smallest number of ensemble members. In addition, the ability to capture similarities at the beginning before making track predictions is an essential key to increasing prediction accuracy. The track prediction results of typhoon Megi 2004 have the highest accuracy because it is caused by the ensemble member, which has very high similarity compared to other typhoon samples. In general, the typhoon track prediction results for five sample typhoons are accurate even with a short model running time.
Zhen et al. [18] simulated the track prediction with a duration of 48 h, it is about eight sequences for 6 hourly tracks, which is shorter than that of the proposed method. Kim et al. [32] also introduced a method that obtains the track prediction with a duration of 60 h (about 8 sequences), which is also shorter than that of the present method. Shen et al. [36] attempted to assimilate GPM microwave imager radiance data and the WRF hybrid 3DEnVar system to produce a typhoon track prediction with a duration of 48 h and minimum track error of 146 km. Thus, the results obtained by the present algorithm can be an alternative for predicting typhoon tracks with long durations and for maintaining their accuracy. The proposed method can be further developed using various approaches and variables.

4. Conclusions

This work introduces the development of a new method for predicting typhoon tracks through an ensemble k-NN algorithm approach that involves several steps, including retrieval of past typhoons, selection of past typhoons, equalizing the starting points, and ensemble prediction. The results show variations in performance skills in each sample typhoon as the predicted track moves closer to and away from the actual conditions.
It is found that increasing the ensemble size does not necessarily increase the accuracy. This is indicated by the track prediction results from typhoon Megi 2004, which has the highest accuracy compared to the other three typhoon samples even though the number of ensemble members is small. In addition, determining the proximity of the current typhoon to the past typhoon at the beginning before making track predictions is an important key to increasing prediction accuracy. In general, the ensemble k-NN approach involving supervised classification and regression tested on five sample typhoons provides an accurate prediction with a short model running time.
The limitation of the current method is that the model can be used only if the distance between past typhoon tracks and the sampled typhoon track in the initial tracks is less than 1 degree. This constraint ensures that there are some unpredictable typhoon samples, as past typhoons may not meet the requirements of these constraints. The other limitation is that the different lifetime of each past typhoon in an ensemble member affects the increasing error when averaged to obtain the mean track prediction. In future communication, to overcome the limitation of the method, the meteorological parameter is considered [37].

Author Contributions

Conceptualization, M.T.; methodology, M.T.; validation, M.T.; formal analysis, M.T. and C.L.; investigation, M.T.; writing—original draft preparation, M.T. and C.L.; writing—review and editing, C.L. and S.-H.K.; visualization, M.T.; supervision, C.L. and J.-J.Y.; funding acquisition, J.-J.Y. All authors have read and agreed to the published version of the manuscript.

Funding

The authors would like to thank the Basic Science Research Program through the National Research Foundation of Korea (NRF), funded by the Ministry of Education (2016R1A6A1A03012812).

Data Availability Statement

Data are contained within the article. However, the data presented in this study are also available on request from the corresponding author.

Conflicts of Interest

The authors declare no conflict of interest.

Appendix A

In this section, the detailed values of error between actual and predicted typhoon paths of Megi 2004, Malou 2010, Namtheun 2016, Tapah 2019 and Omais 2021 are shown.
Table A1. Errors in degree and distance in kilometers of actual and predicted paths from five typhoons.
TS 1Megi 2004Malou 2010Namtheun 2016Tapah 2019Omais 2019
Error (degree 2)Error (km)Error (degree)Error (km)Error (degree)Error (km)Error (degree)Error (km)Error (degree)Error (km)
01.02112.723.58397.191.28142.602.40266.125.53614.23
11.02112.723.58397.191.28142.602.40266.125.53614.23
20.4954.341.25138.871.60177.931.22135.512.61298.57
31.19131.732.14237.610.7279.671.39154.262.79309.71
40.97108.052.01223.241.03114.511.69187.182.65294.46
51.23137.001.78197.251.26140.371.64182.442.61289.72
60.8897.641.77196.721.88208.521.87207.502.04226.75
70.8189.792.99331.741.06117.871.29142.881.89209.94
80.2325.692.67295.821.72190.870.1920.681.02113.24
90.2729.463.81422.581.78197.980.95105.601.21134.07
100.7482.232.90322.341.73191.481.12123.961.41156.68
110.1618.071.80199.511.64182.261.31145.681.16128.23
120.1314.821.35149.971.58175.240.6572.690.5763.14
130.1820.030.91101.061.47162.390.93103.620.5055.16
140.3134.600.2831.401.36150.780.5257.380.5662.31
150.3336.330.1314.711.13125.450.2628.780.3336.55
160.3033.500.2223.900.8898.090.055.230.2426.50
170.5156.210.066.501.38152.710.3134.560.1011.58
181.40155.060.6875.121.01112.111.40155.720.2730.38
191.07118.510.7785.170.6167.321.30144.410.4549.78
201.14127.071.04115.830.2325.921.13125.280.3740.67
211.35149.681.57173.810.2629.051.66184.080.6572.45
221.48164.111.74193.480.8190.302.28253.340.95105.99
230.93103.061.63180.541.11123.702.77307.461.81201.01
240.2527.391.52168.370.8088.463.21356.592.71301.11
250.7786.021.22135.481.14126.832.70299.792.61289.36
260.5560.561.33147.631.77196.332.15238.662.49276.59
271.09121.000.7381.582.46272.611.50166.512.38263.87
282.06228.501.27140.97 1.03114.072.26251.36
292.81311.610.4651.05 0.6167.752.19243.01
301.56172.990.8897.88 1.44159.80
311.55172.521.21134.71 0.7987.19
322.22246.551.55171.62 0.066.67
333.21356.741.88208.28 0.6875.58
341.26140.06 1.26139.83
350.7785.64
361.68186.08
370.1820.03
384.10455.19
395.33592.08
404.34481.51
417.43852.23
426.50721.59
435.57618.18
1 Time sequence. 2 The standard unit of angular measurement.
Table A2. Life data of past typhoons involved in the ensemble k-NN simulation.
No.Typhoon NameBirth (UTC)Death (UTC)Duration
1Kathy1961-08-15 12:001961-08-17 18:002 Days 6 Hours
2Anita1976-07-23 06:001976-07-25 00:001 Days 18 Hours
3Dot1976-08-19 00:001976-08-21 12:002 Days 12 Hours
4Irma1978-09-11 18:001978-09-15 18:004 Days 0 Hours
5Norris1980-08-25 06:001980-08-28 18:003 Days 12 Hours
6Ike1981-06-09 00:001981-06-14 18:005 Days 18 Hours
7Agnes1981-08-27 00:001981-09-03 18:007 Days 18 Hours
8Holly1984-08-16 00:001984-08-22 12:006 Days 12 Hours
9June1984-08-28 00:001984-08-31 12:003 Days 12 Hours
10Alex1984-07-01 18:001984-07-04 12:002 Days 18 Hours
11Pat1985-08-26 06:001985-09-01 12:006 Days 6 Hours
12Kit1985-08-03 06:001985-08-11 00:007 Days 18 Hours
13Brenda1985-09-30 12:001985-10-05 12:005 Days 0 Hours
14Ellis1989-06-22 18:001989-06-24 03:001 Days 9 Hours
15Kinna1991-09-11 06:001991-09-14 12:003 Days 6 Hours
16Irving1992-08-02 00:001992-08-04 12:002 Days 12 Hours
17Ted1992-09-19 06:001992-09-24 15:005 Days 9 Hours
18Percy1993-07-28 06:001993-07-30 12:002 Days 6 Hours
19Faye1995-07-17 12:001995-07-24 12:007 Days 0 Hours
20Yanni1998-09-28 00:001998-09-30 09:002 Days 9 Hours
21Bolaven2000-07-25 18:002000-07-31 00:005 Days 6 Hours
22Megi2004-08-16 06:002004-08-20 09:004 Days 3 Hours
23Wukong2006-08-13 00:002006-08-19 12:006 Days 12 Hours
24Nari2007-09-13 00:002007-09-17 00:004 Days 0 Hours
25Dianmu2010-08-08 12:002010-08-12 18:004 Days 6 Hours
26Malou2010-09-04 00:002010-09-08 03:004 Days 3 Hours
27Tembin2012-08-19 06:002012-08-30 12:0011 Days 6 Hours
28Namtheun2016-09-01 00:002016-09-04 18:003 Days 18 Hours
29Prapiroon2018-06-29 00:002018-07-04 06:005 Days 6 Hours
30Tapah2019-09-19 00:002019-09-23 00:004 Days 0 Hours
31Omais2021-08-20 12:002021-08-24 00:003 Days 12 Hours

References

  1. Chen, R.; Zhang, W.; Wang, X. Machine learning in tropical cyclone forecast modeling: A review. Atmosphere 2020, 11, 676. [Google Scholar] [CrossRef]
  2. Chen, W.B.; Chen, H.; Hsiao, S.C.; Chang, C.H.; Lin, L.Y. Wind forcing effect on hindcasting of typhoon-driven extreme waves. Ocean Eng. 2019, 188, 106260. [Google Scholar] [CrossRef]
  3. Teng, M.C.; Su, J.L.; Chien, S.W. Transportation infrastructure disaster impact and lessons learned after typhoon MORAKOT. In Proceedings of the 9th Asia Pacific Transportation Development Conference, Chongqing, China, 29 June–1 July 2012; pp. 395–403. [Google Scholar] [CrossRef]
  4. Nishijima, K.; Maruyama, K.; Graf, M. A preliminary impact assessment of typhoon wind risk of residential buildings in Japan under future climate change. Hydrol. Res. Lett. 2012, 6, 23–28. [Google Scholar] [CrossRef] [Green Version]
  5. Jang, D.; Joo, W.; Jeong, C.H.; Kim, W.; Park, S.W.; Song, Y. The Downscaling Study for Typhoon-Induced Coastal Inundation. Water 2020, 12, 1103. [Google Scholar] [CrossRef] [Green Version]
  6. Chun, J.; Ahn, K.; T, Y.J.; Suh, K.D.; Kim, M. Projection of extreme typhoon waves: Case study at Busan, Korea. J. Coast. Res. 2013, 65, 684–689. [Google Scholar] [CrossRef]
  7. You, S.H.; Seo, J.W. Storm surge prediction using an artificial neural network model and cluster analysis. Nat. Hazards 2009, 51, 97–114. [Google Scholar] [CrossRef]
  8. Kim, J.M.; Son, K.; Yoo, Y.; Lee, D.; Kim, D.Y. Identifying risk indicators of building damage due to typhoons: Focusing on cases of South Korea. Sustainability 2018, 10, 3947. [Google Scholar] [CrossRef] [Green Version]
  9. Roy, C.; Kovordányi, R. Tropical cyclone track forecasting techniques—A review. Atmos. Res. 2012, 104, 40–69. [Google Scholar] [CrossRef] [Green Version]
  10. Elsberry, R.L. Recent advancements in dynamical tropical cyclone track predictions. Meteorol. Atmos. Phys. 1995, 56, 81–99. [Google Scholar] [CrossRef]
  11. Jeffries, R.A.; Miller, R.J. Tropical Cyclone Forecasters Reference Guide; Technical Report No. NRL/PU/7515-93-0011; Naval Research Laboratory: Monterey, CA, USA, 1993. [Google Scholar]
  12. Diagne, M.; David, M.; Lauret, P.; Boland, J.; Schmutz, N. Review of solar irradiance forecasting methods and a proposition for small-scale insular grids. Renew. Sustain. Energy Rev. 2013, 27, 65–76. [Google Scholar] [CrossRef] [Green Version]
  13. MA, L.M. Research Progress on China typhoon numerical prediction models and associated major techniques. Prog. Geophys. 2014, 29, 1013–1022. [Google Scholar]
  14. Chien, T.Y.; Chen, S.Y.; Huang, C.Y.; Shih, C.P.; Schwartz, C.S.; Liu, Z.; Bresch, J.; Lin, J.Y. Impacts of Radio Occultation Data on Typhoon Forecasts as Explored by the Global MPAS-GSI System. Atmosphere 2022, 13, 1353. [Google Scholar] [CrossRef]
  15. Dolgikh, G.I.; Chupin, V.A.; Gusev, E.S. Research of the Area of Generation of High-Frequency Infrasound Oscillations in the Sea of Japan, Caused by Typhoons. IEEE Geosci. Remote Sens. Lett. 2020, 19, 1–5. [Google Scholar] [CrossRef]
  16. Dolgikh, G.I.; Chupin, V.A.; Gusev, E.S.; Timoshina, G.A. Cyclonic Process of the “Voice of the Sea” Microseism Generation and Its Remote Monitoring. Remote Sens. 2021, 13, 3452. [Google Scholar] [CrossRef]
  17. Song, H.J.; Huh, S.H.; Kim, J.H.; Ho, C.H.; Park, S.K. Typhoon Track Prediction by a Support Vector Machine Using Data Reduction Methods. In International Conference on Computational and Information Science; Computational Intelligence and Security; Springer: Berlin/Heidelberg, Germany, 2005; pp. 503–511. [Google Scholar] [CrossRef]
  18. Zhen, X.; Liang, Z.; Lu, X. Fast prediction of typhoon tracks based on a similarity method and GIS. Disaster Adv. 2013, 6, 45–51. [Google Scholar]
  19. Wang, Y.; Han, L.; Lin, Y.J.; Shen, Y.; Zhang, W. A tropical cyclone similarity search algorithm based on deep learning method. Atmos. Res. 2018, 214, 386–398. [Google Scholar] [CrossRef]
  20. Ren, F.; Qui, W.; Ding, C.; Jiang, X.; Wu, L.; Xu, Y.; Duan, Y. An Objective Track Similarity Index and Its Preliminary Application to Predicting Precipitation of Landfalling Tropical Cyclones. Weather Forecast. 2018, 33, 1725–1742. [Google Scholar] [CrossRef]
  21. National Institute of Informatics. Digital Typhoon: Typhoon Images and Information. Available online: http://agora.ex.nii.ac.jp/digital-typhoon/index.html.en (accessed on 15 July 2022).
  22. Lee, T.R.; Wood, W.T.; Phrampus, B.J. A Machine Learning (kNN) Approach to Predicting Global Seafloor Total Organic Carbon. Glob. Biogeochem. Cycles 2019, 33, 37–46. [Google Scholar] [CrossRef] [Green Version]
  23. Adeniran, A.A.; Adebayo, A.R.; Salami, H.O.; Yahaya, M.O.; Abdulraheem, A. A competitive ensemble model for permeability prediction in heterogeneous oil and gas reservoirs. Appl. Comput. Geosci. 2019, 1, 100004. [Google Scholar] [CrossRef]
  24. Khelifi, F.; Jiang, J. K-NN Regression to Improve Statistical Feature Extraction for Texture Retrieval. IEEE Trans. Image Process. 2011, 20, 293–298. [Google Scholar] [CrossRef] [PubMed]
  25. Ghaffar, M.S.B.A.; Khan, U.S.; Iqbal, J.; Rashid, N.; Hamza, A.; Qureshi, W.S.; Tiwana, M.I.; Izhar, U. Improving classification performance of four class FNIRS-BCI using Mel Frequency Cepstral Coefficients (MFCC). Infrared Phys. Technol. 2021, 112, 103589. [Google Scholar] [CrossRef]
  26. Shu, H.; Yu, R.; Jiang, W.; Yang, W. Efficient implementation of k-nearest neighbor classifier using vote count circuit. IEEE Trans. Circuits Syst. II Express Briefs 2014, 61, 448–452. [Google Scholar] [CrossRef]
  27. Goodrich, J.P.; Wall, A.M.; Campbell, D.I.; Fletcher, D.; Wecking, A.R.; Schipper, L.A. Improved gap filling approach and uncertainty estimation for eddy covariance N2O fluxes. Agric. For. Meteorol. 2021, 297, 108280. [Google Scholar] [CrossRef]
  28. Du, K.L.; Swamy, M.N.S. Clustering I: Basic Clustering Models and Algorithms. In Neural Networks and Statistical Learning; Springer: London, UK, 2014; pp. 215–258. [Google Scholar] [CrossRef]
  29. Graser, A. Learning Qgis; Packt Publishing Ltd.: Birmingham, UK, 2016. [Google Scholar]
  30. Pedregosa, F.; Varoquaux, G.; Gramfort, A.; Michel, V.; Thirion, B.; Grisel, O.; Blondel, M.; Prettenhofer, P.; Weiss, R.; Dubourg, V.; et al. Scikit-learn: Machine learning in Python. J. Mach. Learn. Res. 2011, 12, 2825–2830. [Google Scholar]
  31. Zhang, F.; Jiang, X.; Zhang, X.; Wang, Y.; Du, Z.; Liu, R. Unified Spatial Intersection Algorithms Based on Conformal Geometric Algebra. Math. Probl. Eng. 2016, 2016, 7412373. [Google Scholar] [CrossRef] [Green Version]
  32. Kim, H.J.; Moon, I.J.; Kim, M. Statistical prediction of typhoon-induced accumulated rainfall over the Korean Peninsula based on storm and rainfall data. Meteorol. Appl. 2020, 27, e1853. [Google Scholar] [CrossRef] [Green Version]
  33. Skamarock, W.C.; Klemp, J.B.; Dudhia, J.; Gill, D.O.; Liu, Z.; Berner, J.; Wang, W.; Powers, J.G.; Duda, M.G.; Barker, D.M.; et al. A Description of the Advanced Research WRF Model Version 4; National Center for Atmospheric Research: Boulder, CO, USA, 2019; p. 145. [Google Scholar]
  34. Cha, D.H.; Jin, C.S.; Lee, D.K.; Kuo, Y.H. Impact of intermittent spectral nudging on regional climate simulation using Weather Research and Forecasting model. J. Geophys. Res. Atmos. 2011, 116, D10103. [Google Scholar] [CrossRef]
  35. Rüttgers, M.; Lee, S.; Jeon, S.; You, D. Prediction of a typhoon track using a generative adversarial network and satellite images. Sci. Rep. 2019, 9, 6057. [Google Scholar] [CrossRef] [PubMed] [Green Version]
  36. Shen, F.; Xu, D.; Li, H.; Min, J.; Liu, R. Assimilation of GPM Microwave Imager Radiance data with the WRF hybrid 3DEnVar system for the prediction of Typhoon Chan-hom (2015). Atmos. Res. 2021, 251, 105422. [Google Scholar] [CrossRef]
  37. Agyakwah, W.; Lin, Y.L. Generation and enhancement mechanisms for extreme orographic rainfall associated with Typhoon Morakot (2009) over the Central Mountain Range of Taiwan. Atmos. Res. 2021, 247, 105160. [Google Scholar] [CrossRef]
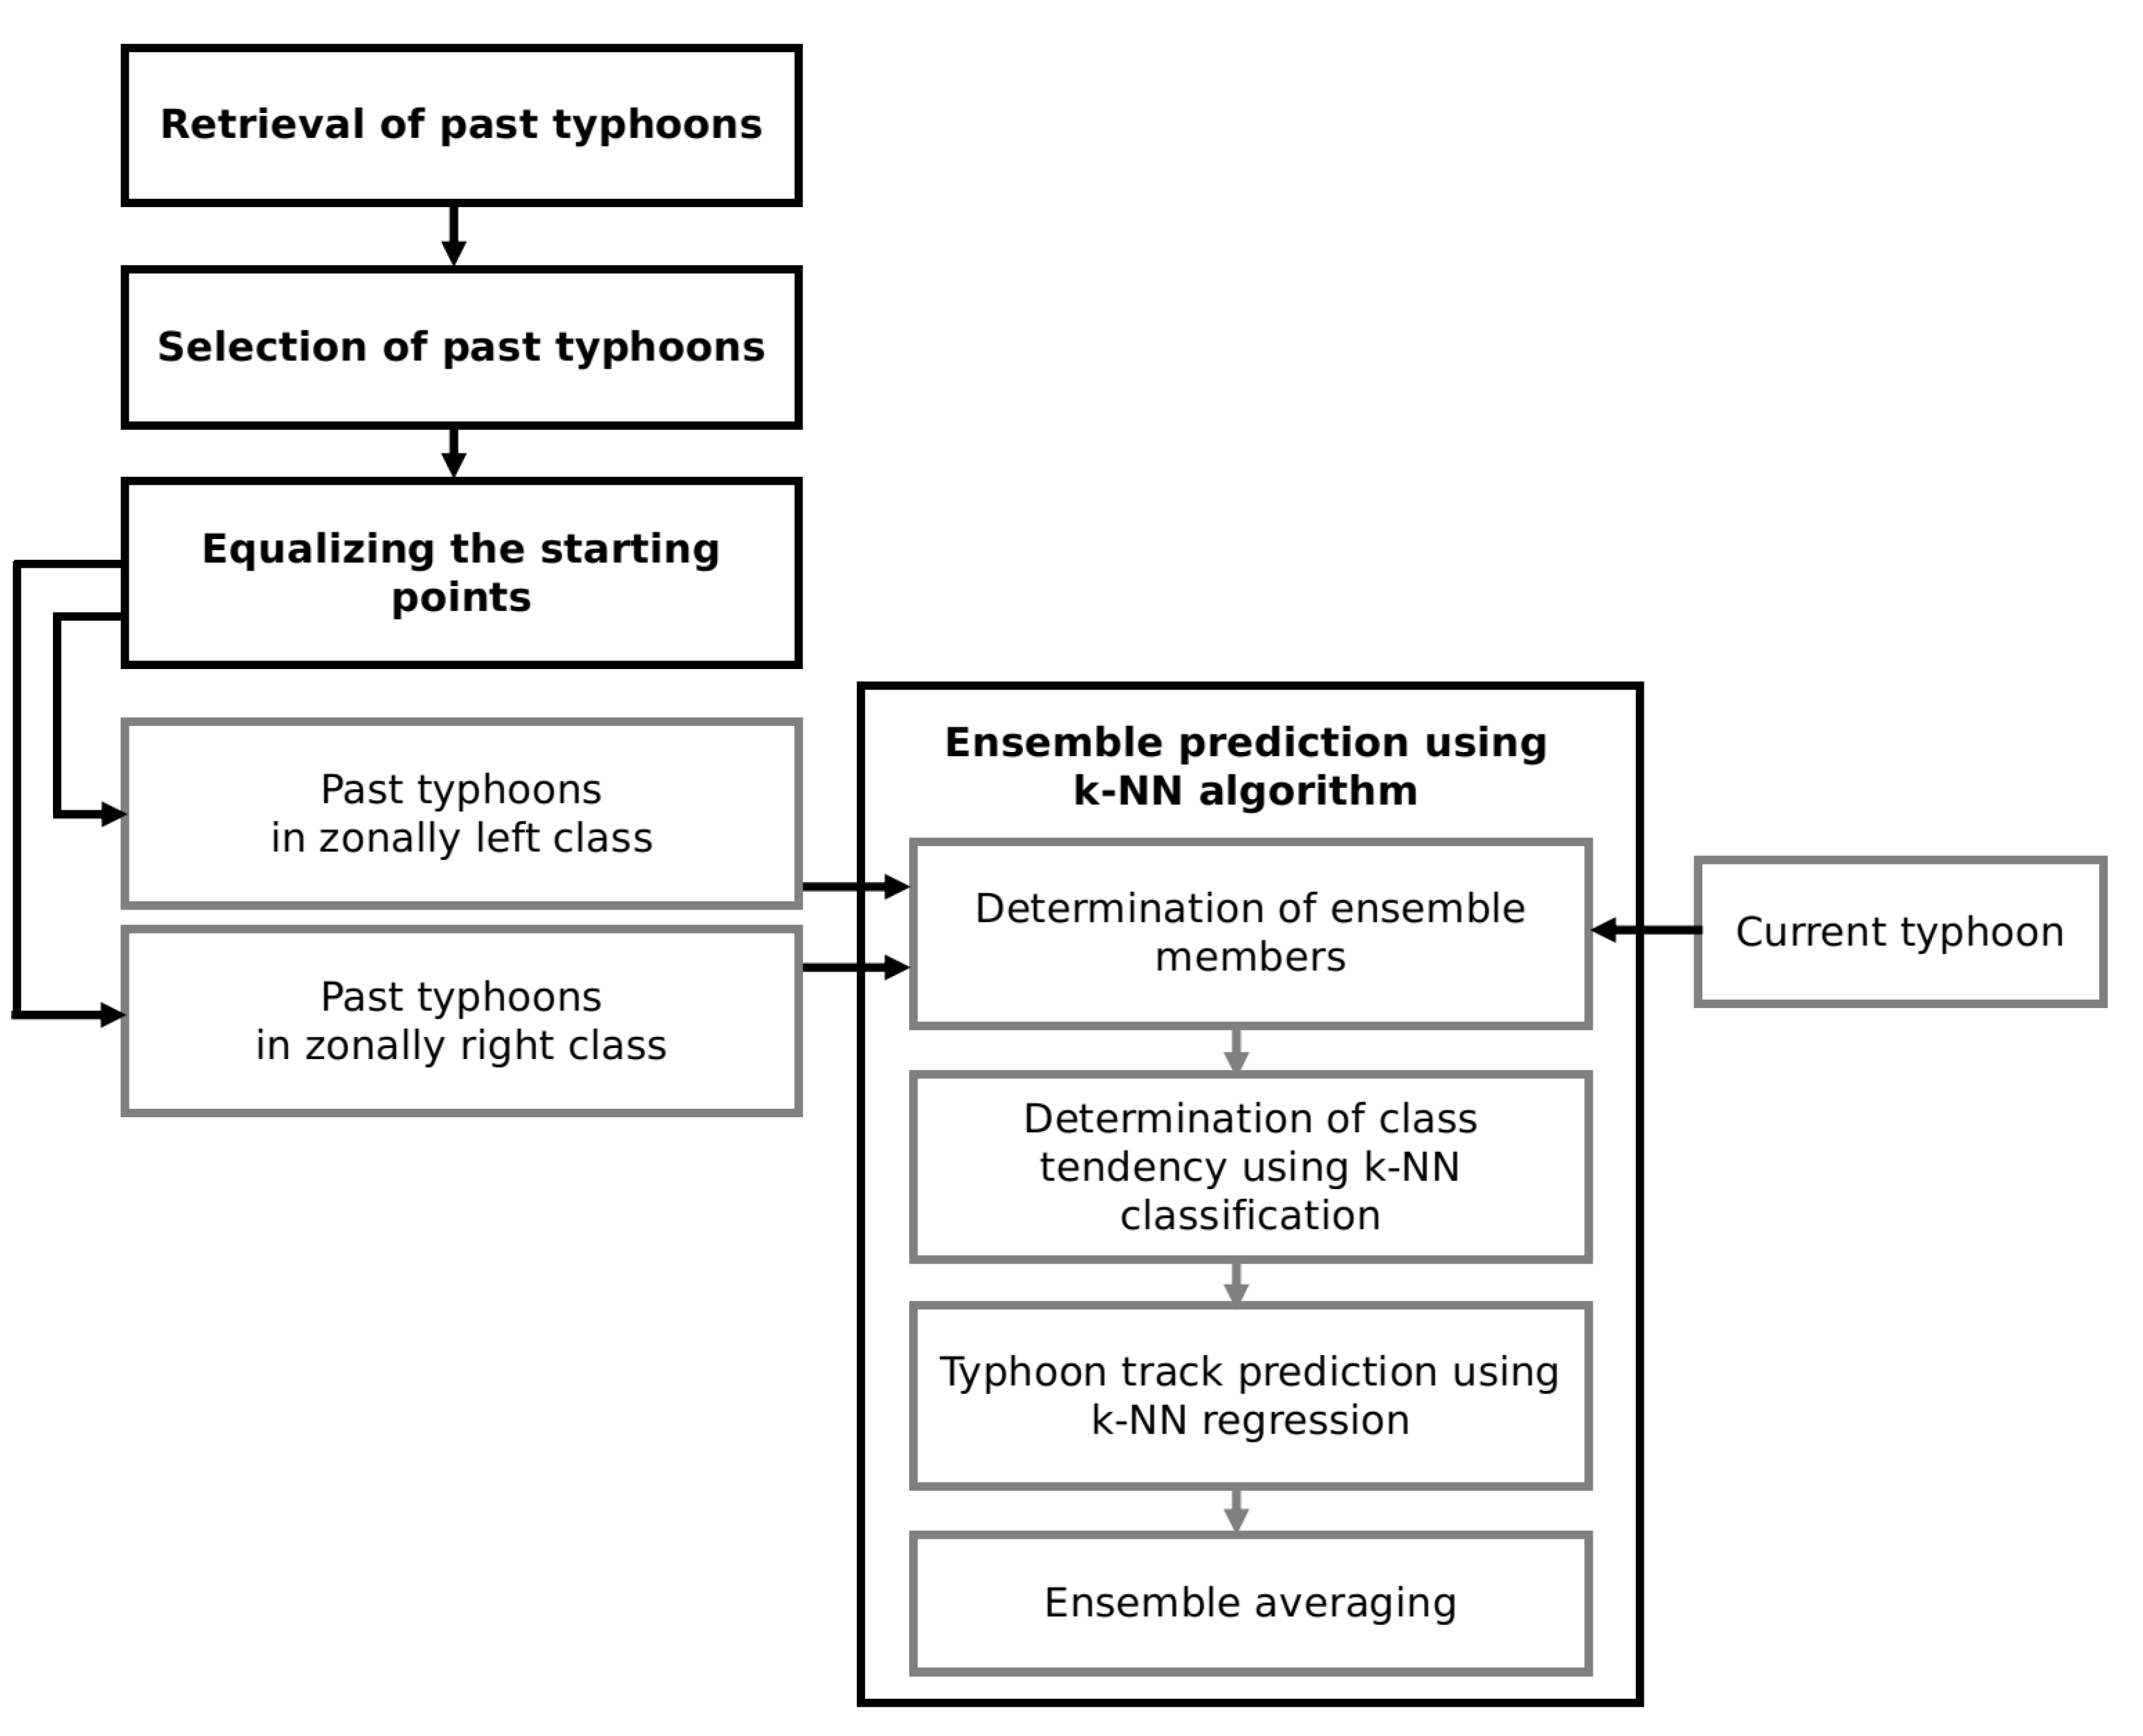
Figure 1. The schematic workflow of regional typhoon track prediction using ensemble k-NN in the context of the GIS environment.
Remotesensing 14 05292 g001
Figure 2. Conversion of typhoon tracks from points (left) to line vectors (right). Approximately 1600 typhoon tracks from 1951∼2020 over the western North Pacific Basin are converted.
Remotesensing 14 05292 g002
Figure 3. Buffer regions (left) and their intersection with typhoon track lines (right). The two buffer regions are for indirect and direct impacts on the Busan region.
Remotesensing 14 05292 g003
Figure 4. Equalization of starting points for past and sample (current) typhoons.
Remotesensing 14 05292 g004
Figure 5. Determination of the class tendency of the current typhoon class and construction of an ensemble member.
Remotesensing 14 05292 g005
Figure 6. Schematic diagram of the process of obtaining the number of neighbors: (a) finding nearest neighbors and voting the point class and (b) finding the optimal K value in k-NN.
Remotesensing 14 05292 g006
Figure 7. Results of k-NN classification for zonal components: (a) Megi 2004, (b) Malou 2010, (c) Namtheum 2016, (d) Tapah 2019 and (e) Omais 2021.
Remotesensing 14 05292 g007
Figure 8. Results of k-NN classification for the meridional component: (a) Megi 2004, (b) Malou 2010, (c) Namtheum 2016, (d) Tapah 2019 and (e) Omais 2021.
Remotesensing 14 05292 g008
Figure 9. Typhoon track prediction for zonal component: (a) Megi 2004, (b) Malou 2010, (c) Namtheum 2016, (d) Tapah 2019 and (e) Omais 2021.
Remotesensing 14 05292 g009
Figure 10. Typhoon track prediction for the meridional component: (a) Megi 2004, (b) Malou 2010, (c) Namtheum 2016, (d) Tapah 2019 and (e) Omais 2021.
Remotesensing 14 05292 g010
Figure 11. Actual versus predicted typhoon tracks: (a) Megi 2004, (b) Malou 2010, (c) Namtheum 2016, (d) Tapah 2019 and (e) Omais 2021.
Remotesensing 14 05292 g011
Table 1. Structure of the training dataset for the k-NN classification and the k-NN regression in zonal (x) and meridional (y) components.
PredictorClassification TargetRegression TargetTyphoon
t training x training | y training x training | y training
t ¯ c 1 “left”/“center”/“right”? x ¯ 1 c | y ¯ 1 c current
t ¯ l 1 n “left” x ¯ l 1 n | y ¯ l 1 n left class
t ¯ r 1 n “right” x ¯ r 1 n | y ¯ r 1 n right class
t ¯ c 2 “left”/“center”/“right”? x ¯ 2 c | y ¯ 2 c current
t ¯ l 2 n “left” x ¯ l 2 n | y ¯ l 2 n left class
t ¯ r 2 n “right” x ¯ r 2 n | y ¯ r 2 n right class
t ¯ i c “left”/“center”/“right”? x ¯ i c | y ¯ i c current
t ¯ l i n “left” x ¯ l i n | y ¯ l i n left class
t ¯ r i n “right” x ¯ r i n | y ¯ r i n right class
Table 2. Correlation of prediction and actual condition for zonal and meridional components.
NoSample TyphoonCorrelation
Zonal ComponentMeridional Component
1Megi 20040.970.98
2Malou 20100.780.97
3Namtheum 20160.810.96
4Tapah 20190.790.94
5Omais 20210.470.96
-Average0.760.96
Table 3. The skill summary of the proposed method and its comparison with the WRF model.
NoSample
Typhoon
The Proposed MethodWRF
Min. Error (km)Max. Error (km)Proc. Runtime (min.)Min. Error (km)Max. Error (km)Proc. Runtime (min.)
1Megi 200414.8852.25.416.6505.8195
2Malou 20106.5422.621.317.4299.2204
3Namtheum 201625.9272.611.685.5402.2154
4Tapah 20195.2356.68.332.5290.9222
5Omais 202111.6614.25.112.6310.3143
-Average12.8503.610.332.9361.7183.6
Publisher’s Note: MDPI stays neutral with regard to jurisdictional claims in published maps and institutional affiliations.