Article

Exploring Spatial Network Structure of the Metropolitan Circle Based on Multi-Source Big Data: A Case Study of Hangzhou Metropolitan Circle

1
Institute of Applied Remote Sensing and Information Technology, College of Environmental and Resource Sciences, Zhejiang University, Hangzhou 310058, China
2
Key Laboratory of Urban Land Resources Monitoring and Simulation, Ministry of Natural Resources, Shenzhen 518000, China
3
Territorial Consolidation Center in Zhejiang Province, Department of Natural Resources of Zhejiang Province, Hangzhou 310007, China
4
Department of Land Resources Management, Zhejiang Gongshang University, Hangzhou 310018, China
5
Zhejiang Shuzhi Space Planning Design Co., Ltd., Hangzhou 310000, China
6
Beijing Presky Technology Co., Ltd., Beijing 100195, China
*
Author to whom correspondence should be addressed.
Remote Sens. 2022, 14(20), 5266; https://doi.org/10.3390/rs14205266
Submission received: 8 September 2022 / Revised: 16 October 2022 / Accepted: 19 October 2022 / Published: 21 October 2022

Abstract

:
The metropolitan circle is the basic unit of regional competition. Enhancing the connection between cities in the metropolitan circle and optimizing the spatial layout of the metropolitan circle is one of the goals of regional high-quality development in the new era. Therefore, it is of great significance to analyze the spatial network structure of the metropolitan circle. Taking Hangzhou metropolitan circle as an example, this study used web crawler technology to obtain data in multiple Internet big data platforms; used centrality analysis, flow data model, and social network analysis to construct the network connection matrix of human flow, goods flow, capital flow, information flow, and traffic flow; and explored the spatial network structure of the metropolitan circle. The results showed that the node intensity of the metropolitan circle presented a distribution pattern of strong in the east and weak in the west. The network connections of each county under the action of different element flows were different, and the skeleton of the integrated flow network connections showed a starfish-shaped feature. Hangzhou, Jiaxing, Huzhou, and Shaoxing cities had strong group effects in goods flow and traffic flow, while Quzhou and Huangshan cities had relatively independent cohesive subgroups in human flow and information flow. This study can provide useful references for regional development and spatial planning implementation.

1. Introduction

With the deepening of economic globalization and regional economic integration, population, industry, resources, and other factors are constantly flowing in the space of cities, which greatly enhances the radiation diffusion function of cities [1,2]. According to the 2018 Revision of World Urbanization Prospects released by the United Nations, the global urbanization rate reached 55.3% in 2018. It is predicted that, in 2050, the urbanization rate in the developed regions will rise from 78.7% to 86.6%, and the urbanization rate in less-developed regions will rise from 50.6% to 65.6%. The metropolitan circle is a regional space constituted by the interaction between a large city with a strong radiation driving function or developed economy, and various surrounding cities of different levels and scales [3]. The metropolitan circle is the main form of the advanced development stage of urbanization, and is an important platform for supporting national economic growth, promoting coordinated regional development, and participating in international competition and cooperation [4]. Compared with a single city, it is more conducive to carrying and reflecting regional and even national competitiveness [5]. The spatial structure is the basic attribute and intuitive reflection of the metropolitan circle and is important to its development [6]. The spatial structure reflects the spatial layout of elements and the rationality of their distribution; furthermore, a reasonable spatial structure can promote the integration of elements and the efficient allocation of resources, which is conducive to the synergistic development of the region and drives the improvement of the economic level of the whole region [7,8]. Therefore, studying the spatial structure of metropolitan circles and realizing regional integration development are issues worthy of attention.
The regional spatial structure is formed by the interconnection of urban nodes in the region, so its research focuses on the urban system and the relationship between cities [9,10]. Early studies on regional spatial structure mostly proceeded from the characteristics within cities [11,12], and regarded the region as a static and relatively independent system. The main theories include the central place theory [13], the core-periphery theory [14], and the growth pole theory [15]. The focus of attention is mostly on urban spatial form [16], urban scale [17], and the hierarchical system [18]. With the continuous development of information technology, various forms of human flow, goods flow, and information flow play a role in different spatial scales and become an important force in shaping the regional spatial structure. In this context, the “space of flow” based on dynamic association emerged. The “space of flow” was first proposed by Manuel Castells in 1989, who believed that social activity is a networked spatial form composed of the flow of various elements between regions [19]. Compared with the previous traditional model, the former emphasizes the limitations of location conditions and ignores the attribute of urban relationships and the flow mechanism of dynamic elements [20,21]. The “space of flow” emphasizes the division of labor and complementarity among cities and the formation of the organizational structure of the urban system by the externalities of the city, focusing on the structure, function, and connection of the urban network, providing a new form of the regional spatial structure [22,23].
The study of urban networks is of great meaning to regional spatial structure research and development planning, and has gradually become the focus of many scholars and policy makers [24,25]. Among these, the world cities network of the GaWC research organization [26] and the polycentric megacities of the POLYNET research team have the most important impact [27]. The quantitative research on the structure of regional spatial network is mainly carried out from the perspectives of enterprise organization [28,29], infrastructure [30,31], population flow [32,33], information flow [34], and transportation flow [35,36]. These studies have explored the hierarchical structure of nodes [37,38], the level of spatial connections [39,40], and the characteristics of the network center structure [41,42]. The research methods include the modified gravity model [43,44], social network analysis [45], and the community detection method [46,47]. However, most of the current studies focus on single relational data to study the spatial network structure. The urban network connection is a comprehensive, interactive, and complex territorial system composed of element flows of human, goods, capital, and information. Each element flow has its own characteristics, reflecting different urban network structures, and is an indispensable part of the urban network structure. Among these, human flow and traffic flow are the expression of the social dimension of urban connection; capital flow and goods flow are the expression of the economic dimension of urban connection; and the flow of information is the expression of the cultural dimension of urban connection [48]. If the study is conducted of a single element flow, it can only reflect the flow relationship between cities from a certain aspect, and cannot reflect the complex network connection in the region. In addition, numerous studies take large cities as the research unit, and there is limited research on the connections between small and medium-sized cities in the region, which may neglect the changes in connections between small and medium-sized cities [29,49]. Especially in China, the urban and regional development can be affected by administrative boundaries. The administrative boundaries of a city contain multiple counties, so it is necessary to study the regional spatial network structure with counties as units [50].
With the development and popularity of technologies such as the Internet, cloud computing, and mobile positioning, multi-source big data can reflect regional spatial development and urban connections due to their wide coverage and fine-grained nature, providing a new vision for the study of the regional spatial network structure [51,52,53]. Scholars have used Internet traffic, open-source network data, data mining, and other sources to obtain urban element flows and conduct research on the regional spatial network structure [54,55,56]. For example, human flow is obtained from user location data [57,58,59]; information flow is captured through search engines [60,61]; and patent data is introduced as technology flow [62,63]. Compared with traditional data, big data can more effectively characterize the complex interaction relationship and network features among cities, provide a reliable data source for comprehensive analysis of the regional spatial network structure, and promote the deepening of spatial network structure research.
The metropolitan circle is an important unit of regional development, but in the process of its rapid development, there are still problems such as weak connection between cities, uncoordinated regional development, and unbalanced resource allocation [64]. Under the strategic background of cultivating and developing metropolitan circles in China’s “14th Five-Year Plan” period, this research attempted to take Hangzhou metropolitan circle, which has a high development level and great potential, as the research object and use multi-source big data to carry out the research. In order to avoid the limitations of single element flow, this research selected five types of element flows, namely, human flow, goods flow, capital flow, information flow, and traffic flow, to quantitatively analyze the spatial structure of each element flow network, and explored the status and role of each small and medium-sized city in the metropolitan circle. The rest of the paper is organized as follows. The second part introduces the study area, data sources, and research methods. The third part analyzes the spatial network structure of the metropolitan circle, including the intensity structure of network nodes, the hierarchical structure of network connections, and the spatial correlation structure of networks. The fourth part presents the discussion and implications for policy. The conclusion is provided in the fifth part.

2. Materials and Methods
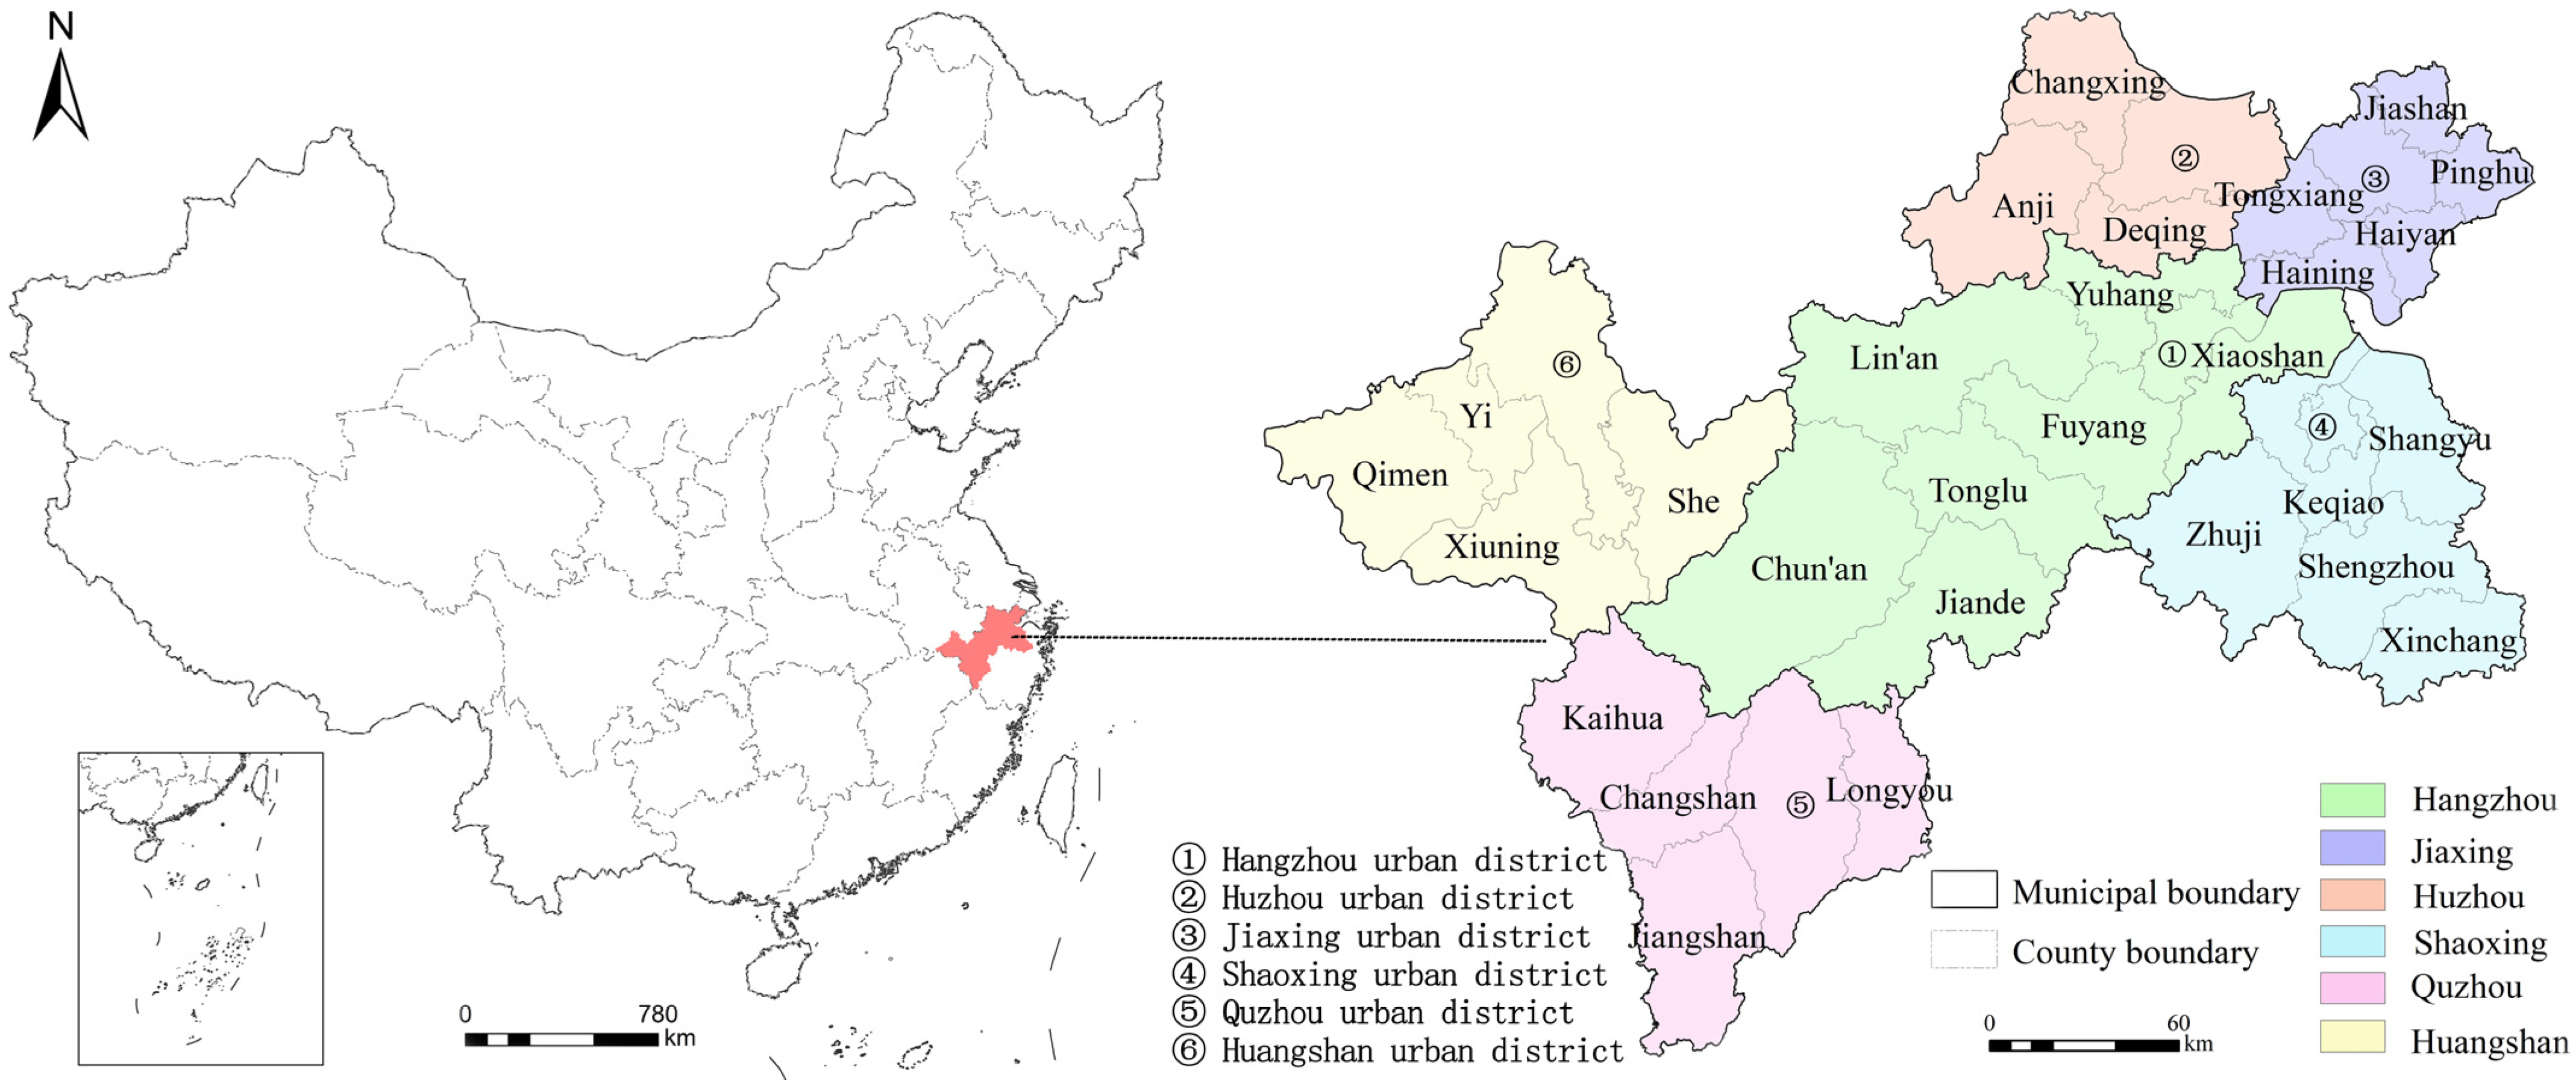
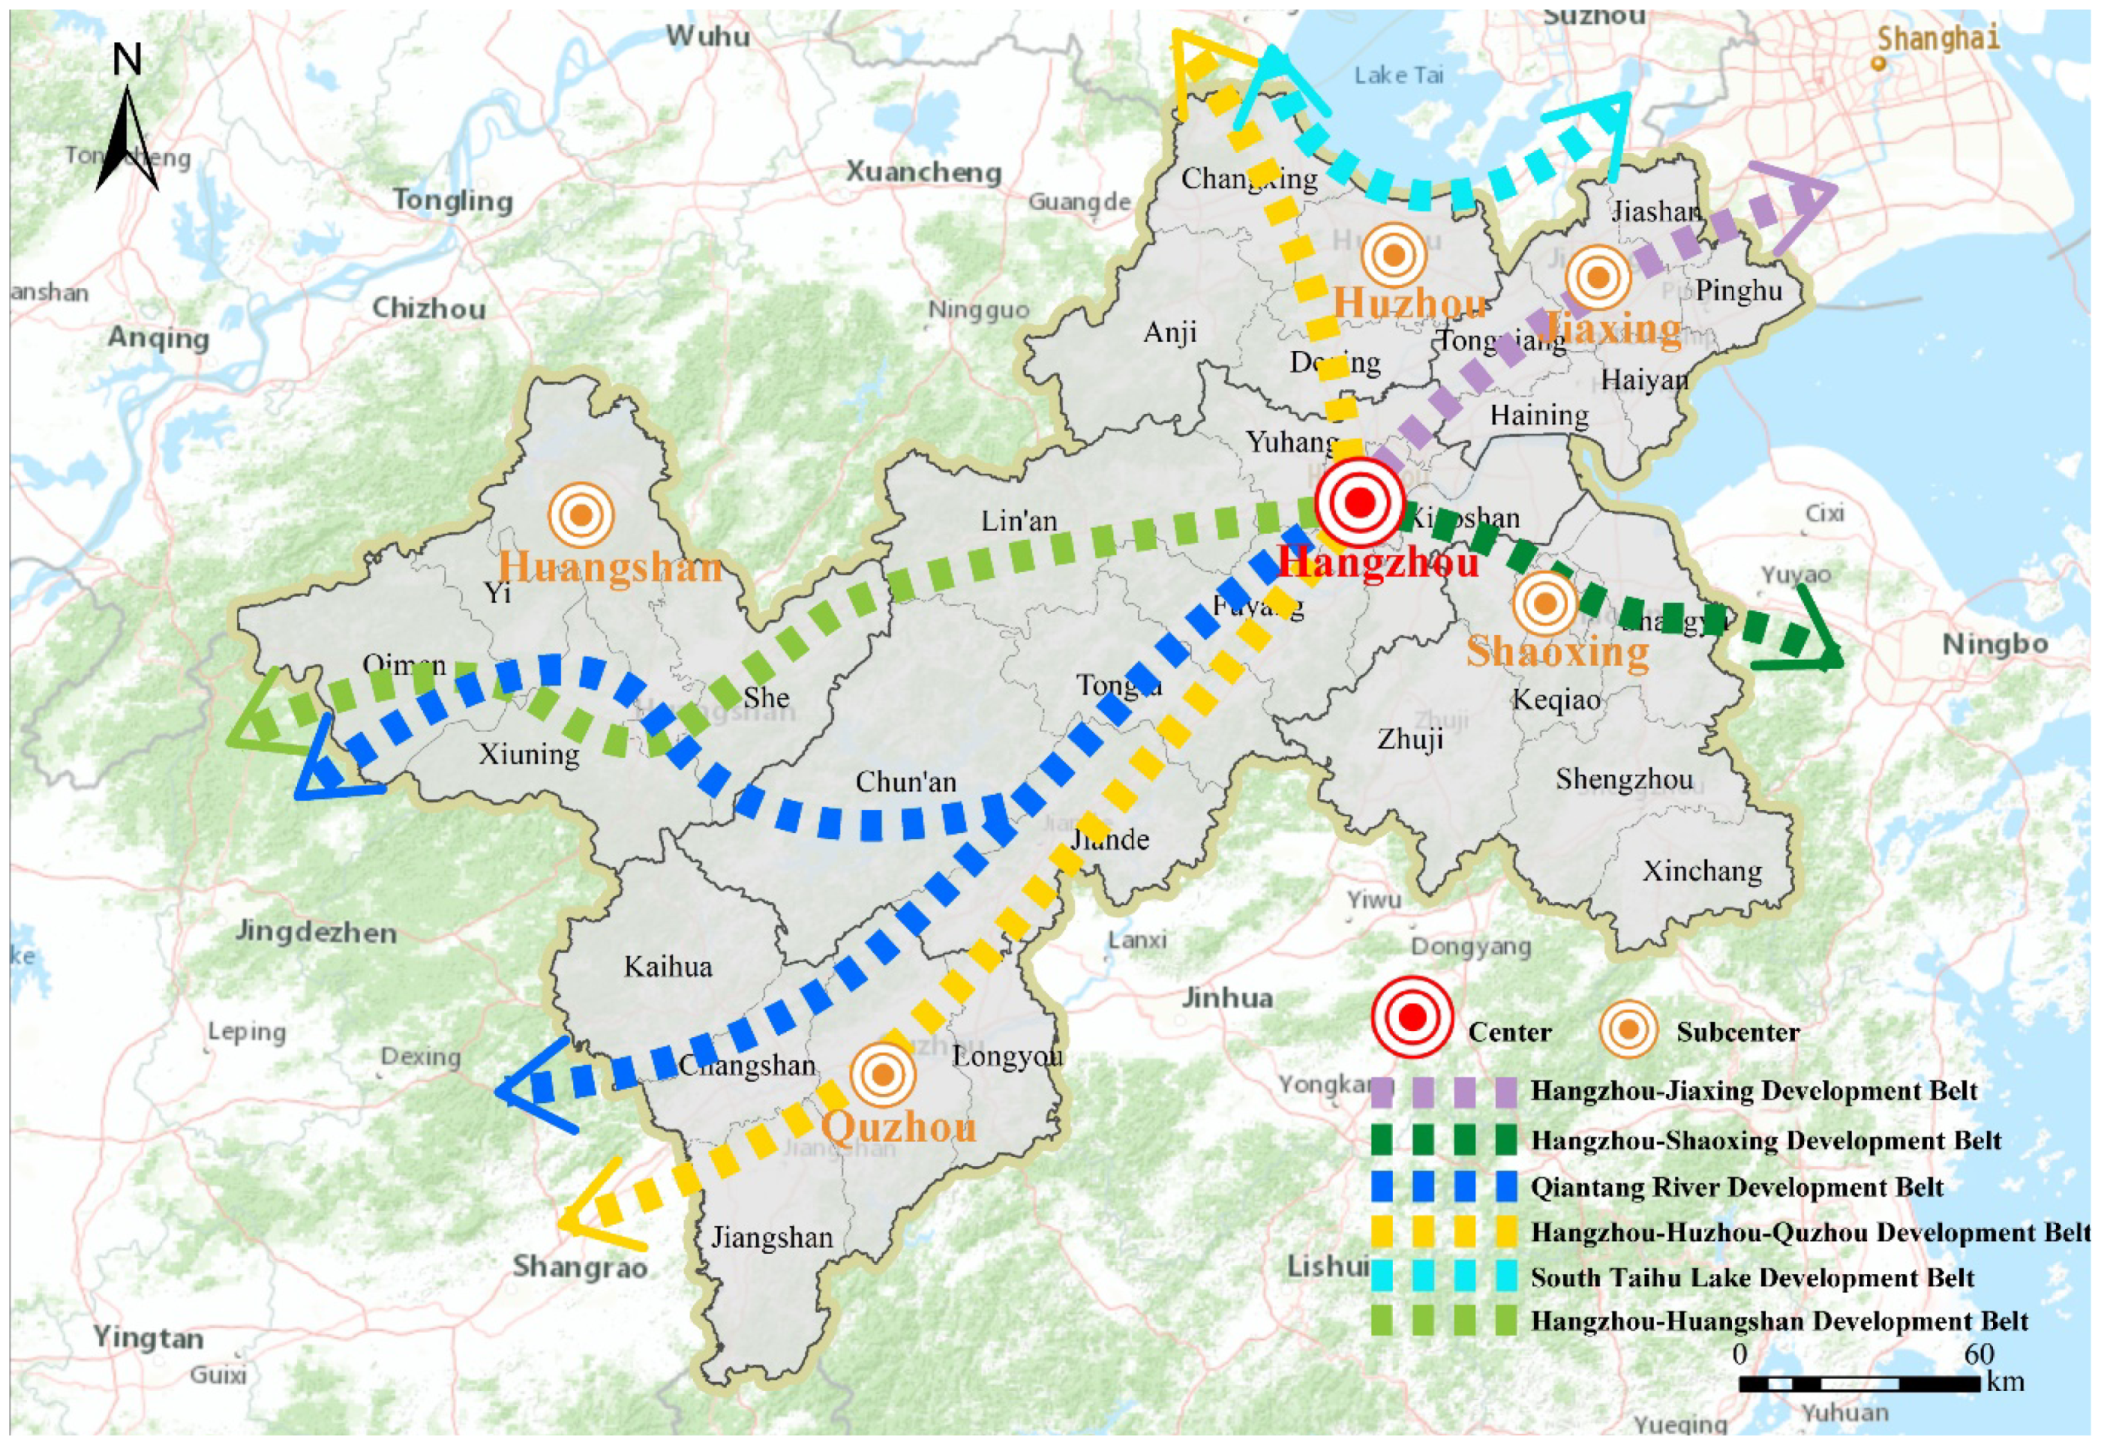
2.1. Study Area

The Hangzhou metropolitan circle, which is located in the north of the Zhejiang Province, is one of the six major metropolitan circles in China. It is positioned as an innovation highland of the global digital economy, an important hub of the Asia-Pacific international gateway, and a core growth pole in the southern wing of the Yangtze River Delta. At present, the Hangzhou metropolitan circle contains six cities: Hangzhou, Huzhou, Jiaxing, Shaoxing, Quzhou, and Huangshan. The research unit in this paper is at the county level, with a total of 34 counties (Figure 1). The Hangzhou metropolitan circle covers an area of 53,441 km2, accounting for about one-third of the Yangtze River Delta region. It has a resident population of 30.183 million, and the total population continues to grow. Its regional GDP was CNY 3.776 trillion. In this region, the main types of element flow are human flow, goods flow, information flow, technology flow, etc. “The Hangzhou Metropolitan Circle Development Plan (2020–2035)” clearly describes the goal of constructing a network spatial pattern described as “one main center and five subcenters, one ring and six belts” (Figure 2). The “one main center and five subcenters” refers to enhancing the main core role of Hangzhou in the metropolitan circle and cultivating five secondary core cities of Huzhou, Jiaxing, Shaoxing, Quzhou, and Huangshan; the “one ring and six belts” refers to creating an urban integration development ring linked by the Hangzhou metropolitan circle highway ring.

2.2. Data Sources and Preprocessing

2.2.1. Data Sources

Table 1 shows the data sources selected in this study, including human flow, goods flow, capital flow, information flow, and traffic flow.

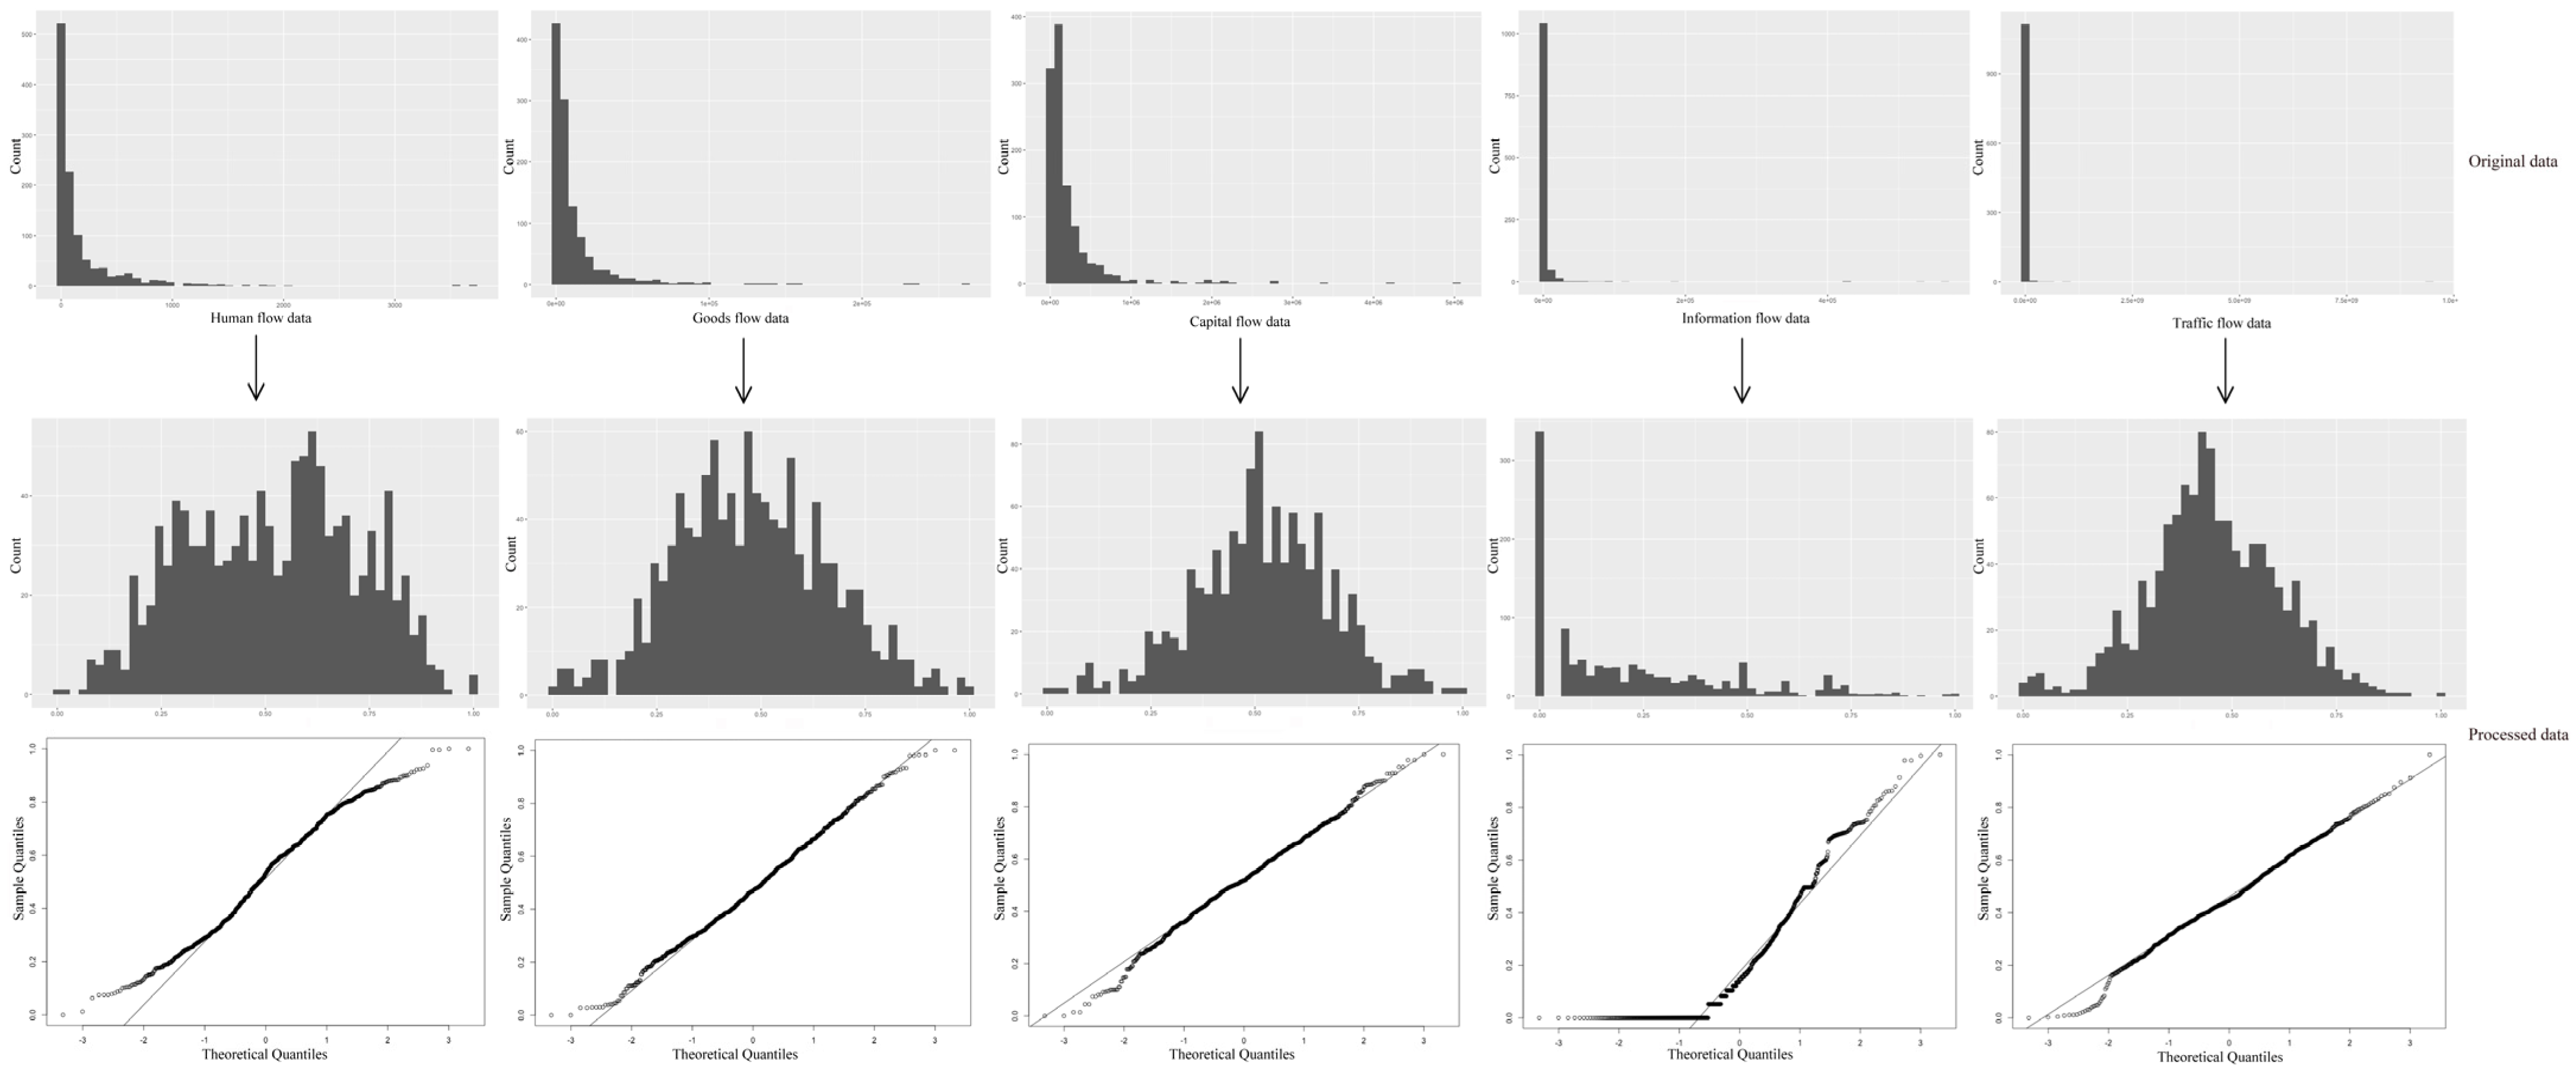
2.2.2. Data Preprocessing

The network matrix data showed a very serious “long tail phenomenon” according to frequency distribution analysis (Figure 3). The logarithm with a base of 10 was taken for the original data to make it follow an approximate normal distribution law, which was beneficial to the visualization of the data. In addition, in order to make different element flow data comparable, the threshold value of all data was unified to [0,1] using the method of min-max normalization [70,79], where 1 means that the two counties are most closely connected, and 0 means that the two counties are the most distantly connected.
X = x min max min
where x is the original data; min is the minimum value of the matrix data; max is the maximum value of the matrix data; X is the normalized data.

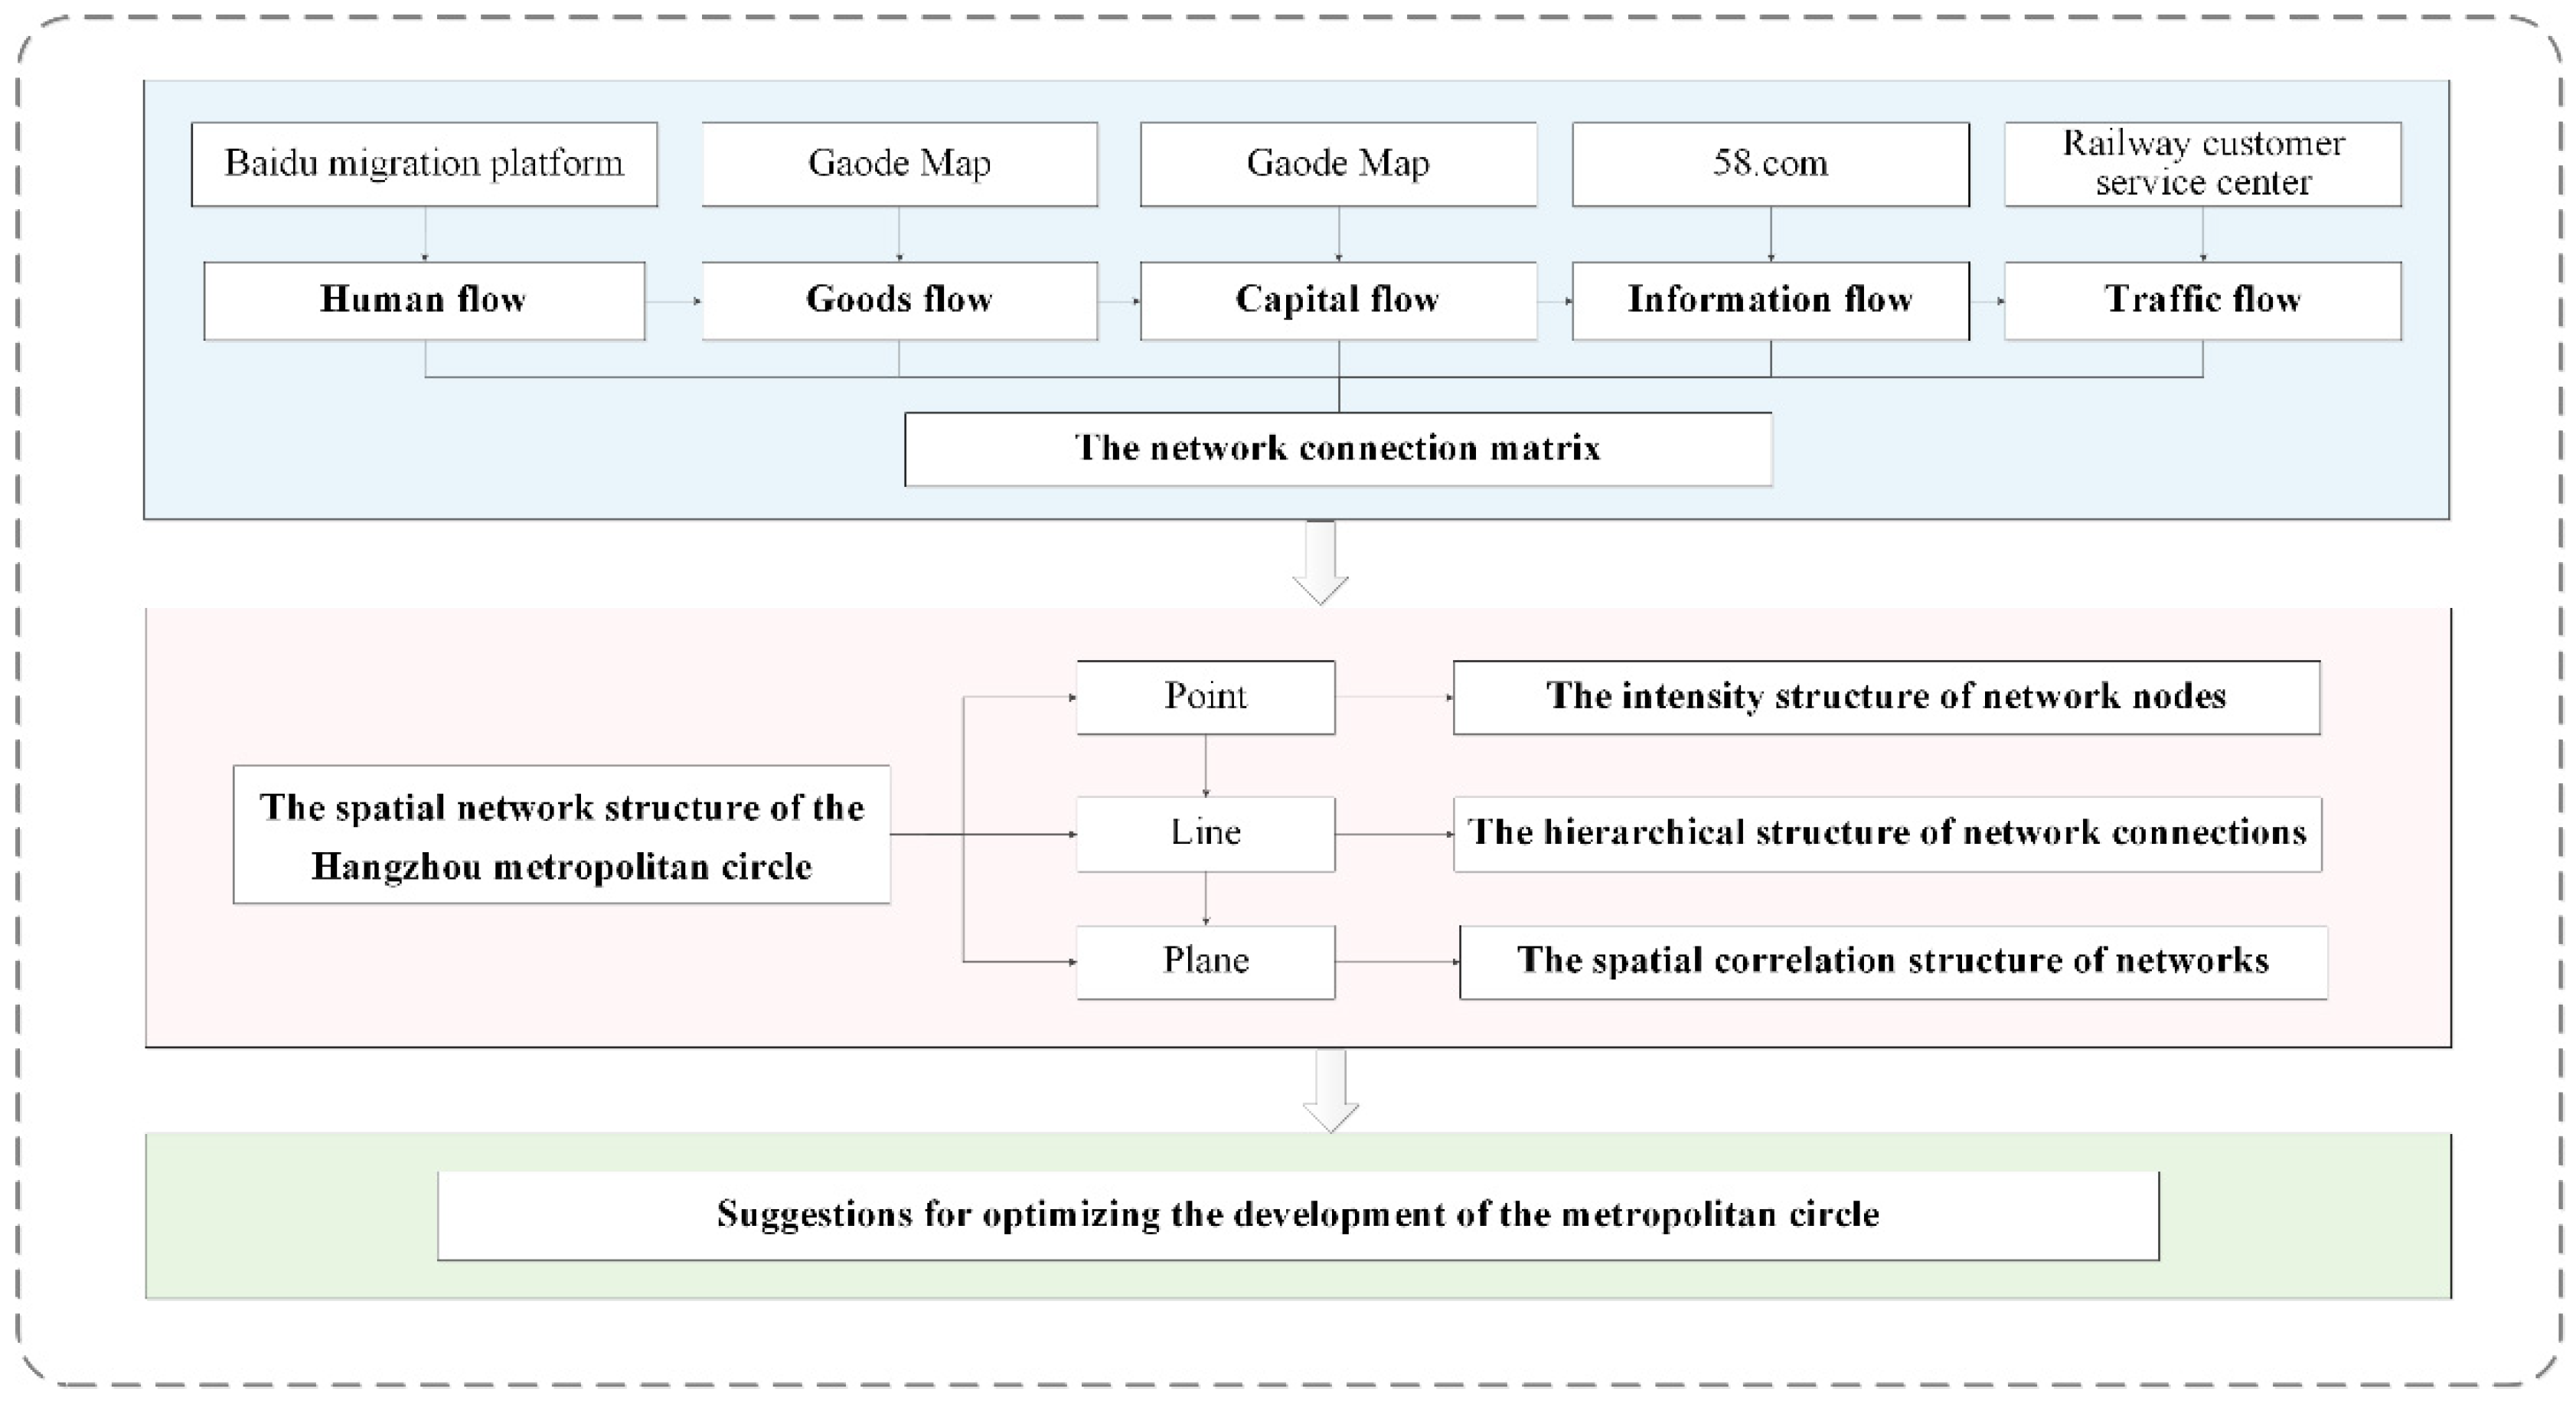
2.3. Analytical Framework and Methods

The point, line, and plane are the basic elements of the regional spatial structure. The spatial network structure under the space of flow is formed by the mapping of city nodes, the connections between nodes, and their networks in geographical space [80]. In this study, we used human flow, goods flow, capital flow, information flow, and traffic flow data to establish the network connection matrix. From the three dimensions of “point-line-plane”, the flow data model, centrality analysis method, QAP correlation analysis, and cohesive subgroup analysis method were used to analyze the intensity structure of network nodes, the hierarchical structure of network connections, and the spatial correlation structure of networks in the Hangzhou metropolitan circle to explore the spatial structure of the region (Figure 4).

2.3.1. Flow Data Model

(1)
Human flow
Since the data displayed on the Baidu migration platform only provide the relative values of the migrant population in the city, they cannot be used as comparative values between cities. They need to be processed to obtain the relative value of the daily migrant population between counties [67]. The data displayed on the front of the web page was firstly crawled and cleaned. Secondly, by obtaining the relative index of daily population movement for each city and the whole country from 1 October 2020 to 18 January 2021, the travel index of each city on that day was calculated using the formula. The migrant population matrix among 6 cities in Hangzhou metropolitan circle was obtained by calculating the average value of the travel index of each city. Then, the population proportions within the 34 counties under their jurisdiction were counted to construct a 34 × 34 population proportion matrix. Finally, through these two matrices, the relative value of the migrant population between each county was calculated to build the 34 × 34 human flow matrix [81]. The specific formula is as follows:
T day   = U 1 × U 2 × U 3
U ij = U AB × K iA × K jB
where U1 is the migrant population data from city X to other cities in the Hangzhou metropolitan circle; U2 is the relative index for the daily migrant population in city X from 1 October 2020 to 18 January 2021 obtained by the Baidu migration platform; U3 is the relative index of the daily migrant population in China from 1 October 2020 to 18 January 2021 obtained by the Baidu migration platform; Tday is the daily travel index of city X. A is the city corresponding to county i; B is the city corresponding to county j; UAB is the intensity of human flow between city A and city B; KiA is the percentage of the population of county i in the total population of city A; KjB is the percentage of the population of county j in the total population of city B; and Uij is the human flow intensity between counties i and j.
(2)
Goods flow
With reference to the method proposed by Taylor for studying the world city network [82,83,84], a goods flow network matrix of the Hangzhou metropolitan circle was constructed to study goods flow. In this research, 10 logistics companies within the study area were selected, namely, Tiantian, Zhongtong, Shentong, Yuantong, Deppon, ShunFeng, Yunda, Best, Jingdong, and Jutu. The logistics intensity among counties was calculated to construct the matrix [70].
W ij , c = X ic × X jc
W ij = c W ij , c
where Xic and Xjc denote the number of logistics company c in counties i and j, respectively; Wij,c denotes the goods flow intensity of logistics company c in counties i and j; and Wij denotes the goods flow intensity between counties i and j.
(3)
Capital flow
Similar to the method for constructing the goods flow network matrix, the capital flow network matrix for the Hangzhou metropolitan circle was constructed. The bank branches at all levels in counties were assigned according to the level, and then the capital flow matrix was constructed using the interlocking network model in urban network analysis. The bank POI data were divided into five levels: the first level was head office and provincial branches; the second level was prefectural branches; the third level was subbranches; the fourth level was 24 h self-service banks; and the fifth level was ATM machines. Corresponding levels of bank POI data were given the score of 0.5, 0.4, 0.3, 0.2, and 0.1 points, respectively [73,85].
R ij , d = V id × V jd
R ij = d R ij , d
where Vid and Vjd represent the scores of bank branch d in counties i and j, respectively; they are used to measure the importance of bank branch d in the capital flow; Rij,d represents the capital flow intensity of bank branch d in counties i and j; and Rij represents the capital flow intensity between counties i and j.
(4)
Information flow
Referring to Xiong’s calculation method [86], the strength of information flow between different counties was expressed by the web search index, and the information flow network was constructed in this way. Through the analysis of http requests searched on 58.com, a 34 × 34 search request matrix was constructed. Then, the selenium library in Python was used to access the http request, and the number of entries of the result was captured to obtain a 34 × 34 search index matrix, namely, the information flow network matrix [75]. The selenium library is an automated testing tool that drives the browser to simulate human actions.
T ij = I j × J i
where Ij is the number of information pieces searched for county i on the page of county j; Ji is the number of information pieces searched for county j on the page of county i; and Tij denotes the information flow intensity between counties i and j.
(5)
Traffic flow
The Railway Customer Service Center of China was used to obtain the number and location of train stations in the Hangzhou metropolitan circle, as well as the daily number of trains stopping at each station. The route planning API provided by Gaode Map calculates the driving time between two geographic points. Firstly, we obtained all the train stations within Hangzhou metropolitan circle through the 12306 website and counted the daily number of trains stopping. Then ArcGIS software was used to create a 6 km × 6 km fishnet covering Hangzhou metropolitan circle, and the travel convenience was calculated by route planning API. Finally, the traffic flow network matrix was constructed by the gravity model [78].
P single   = C T
P ij = P i × P j r ij 2
where C is the daily number of trains stopping at train stations; T is the driving time between the 6 km × 6 km fishnet points and the nearest train station within the land area of the Hangzhou metropolitan circle; Psingle is the travel convenience of the fishnet points; and the Psingle value is proportional to the travel convenience of the fishnet point. Pi is the average travel convenience of county I, and Pj is the average travel convenience of county j. The average travel convenience of each county is obtained by counting the average of Psingle within each county using Python. rij is the distance between counties i and j; Pij is the traffic flow intensity between counties i and j.

2.3.2. Cluster Analysis

County node is the core element of the spatial network structure of the metropolitan circle. Based on the element flow data, the level of counties was divided by the natural breaks cluster analysis method of ArcGIS software. This made a difference within the group’s smallest and the difference between the group’s largest, and the status and external influence of each county in the spatial network of the metropolitan circle were visually identified [87].

2.3.3. Centrality Analysis

Centrality reflects the degree to which a node is at the core of the network [88]. It is used to measure the strength of a node in the network to connect with other nodes. The centrality of each node in the network can be measured by the degree centrality. The larger the value, the more other nodes are directly connected to it, and the closer it is to the core of the network. Otherwise, the more it is on the edge. This paper evaluated the influence and position of each county in different element flow networks by calculating the centrality of each county.
CI ( i ) = j = 1 n S ij n 1
where CI denotes node centrality; Sij represents the intensity of the link between counties i and j; and n is the number of county nodes in the study area.

2.3.4. QAP Correlation Analysis

QAP is a common method of researching network relationships [89]. It compares the values of each unit of the network matrix based on the data replacement of the matrix, and obtains the correlation coefficients between the matrices [90]. In this paper, the similarity between multi-dimensional networks was analyzed through the QAP correlation analysis of the network matrix of different element flows.

2.3.5. Cohesive Subgroup Analysis

Social network analysis, as a sociological research method, relies on sociological theories that regard society as a network of connections, and the network contains the interrelationship between nodes [91]. Cohesive subgroup analysis is an important method in social network analysis, and reveals the actual or potential connections between nodes by analyzing the aggregate subgroups in the regional network structure [92]. It expressed the affinity relationship among counties by identifying the sets with close connections in the network structure of each element flow in the metropolitan circle, and was then used to analyze the spatial association structure and development status of network connections among counties in the region. In this paper, the CONCOR method in UCINET software was adopted, which is an iterative correlation convergence method to represent the phenomenon of small groups existing in the network and the characteristics of the network structure in a tree diagram [93].

3. Results

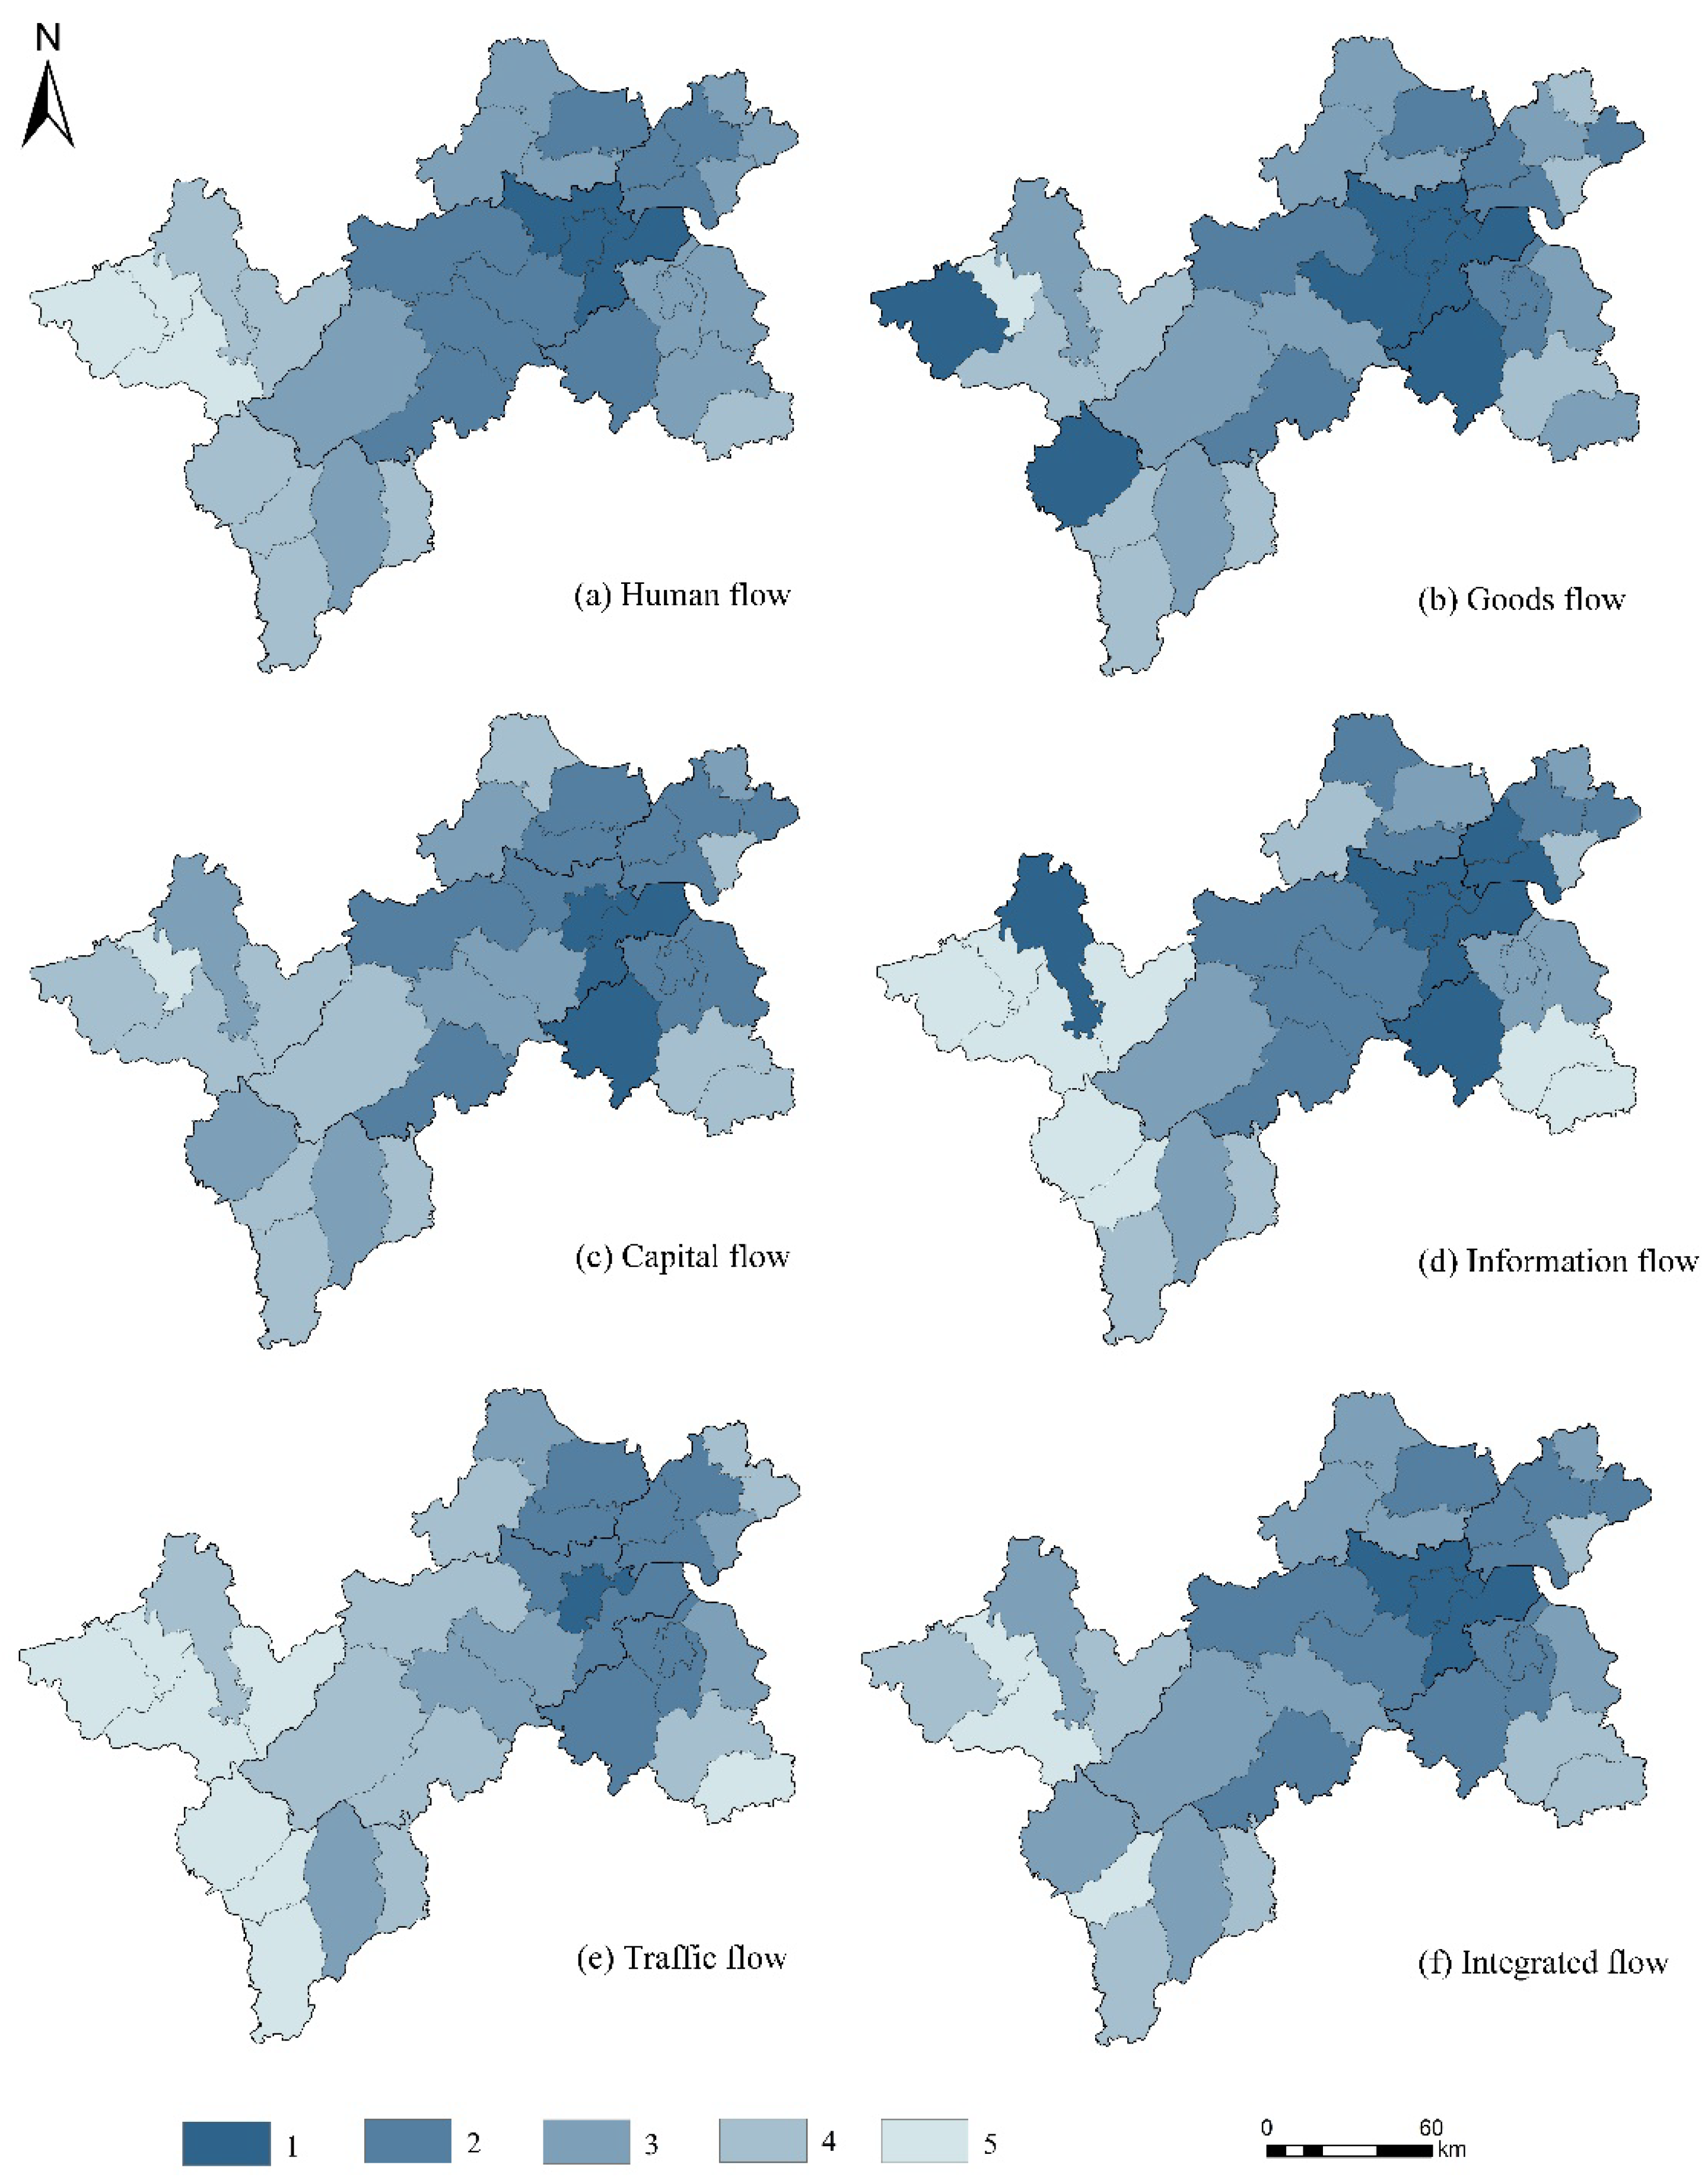
3.1. The Intensity Structure of Network Nodes

Degree centrality was used to measure the status and external influence of each county in the spatial network of the metropolitan circle. Through the analysis of degree centrality, the network node intensity structure of the Hangzhou metropolitan circle under multiple space of flow could be obtained. The cluster analysis method was used to classify the centrality values of the counties into five levels, with the intensity decreasing from the first level (Figure 5). Among the average values of the centrality of each flow in the metropolitan circle, the value of human flow was higher and the value of information flow was the lowest. The counties with high node intensity in the network of human and information flows were Hangzhou urban district, Xiaoshan district, and Yuhang district, indicating that these counties were of high importance in these two networks. Yixian, Xuning, and Qimen counties, which are located at the northwestern edge, play a smaller role in the network of human and information flow. Hangzhou urban district and Zhuji city had a more important position in the network of goods flow. In terms of capital flow, Yixian, Changshan, and Huining counties and other western areas of the metropolitan circle were low-value areas of node intensity. In terms of traffic flow, Hangzhou urban district and Xiaoshan district played a larger role, indicating that these two areas were prominent in the core position of the traffic flow network. Hangzhou urban district was located at the first level of node intensity in the integrated flow and occupied a central position in the metropolitan circle. The node intensities within the municipal boundaries of Quzhou and Huangshan cities were mostly at the third and fourth levels, and their secondary core functions had not been fully developed, so there is a large space for development.
In general, the node intensity structure of Hangzhou metropolitan circle as a whole showed the characteristics of strong in the east and weak in the west. Among these, Hangzhou urban district was located at the first level in all element flow networks, and the network node intensity of Quzhou and Huangshan was generally weak.

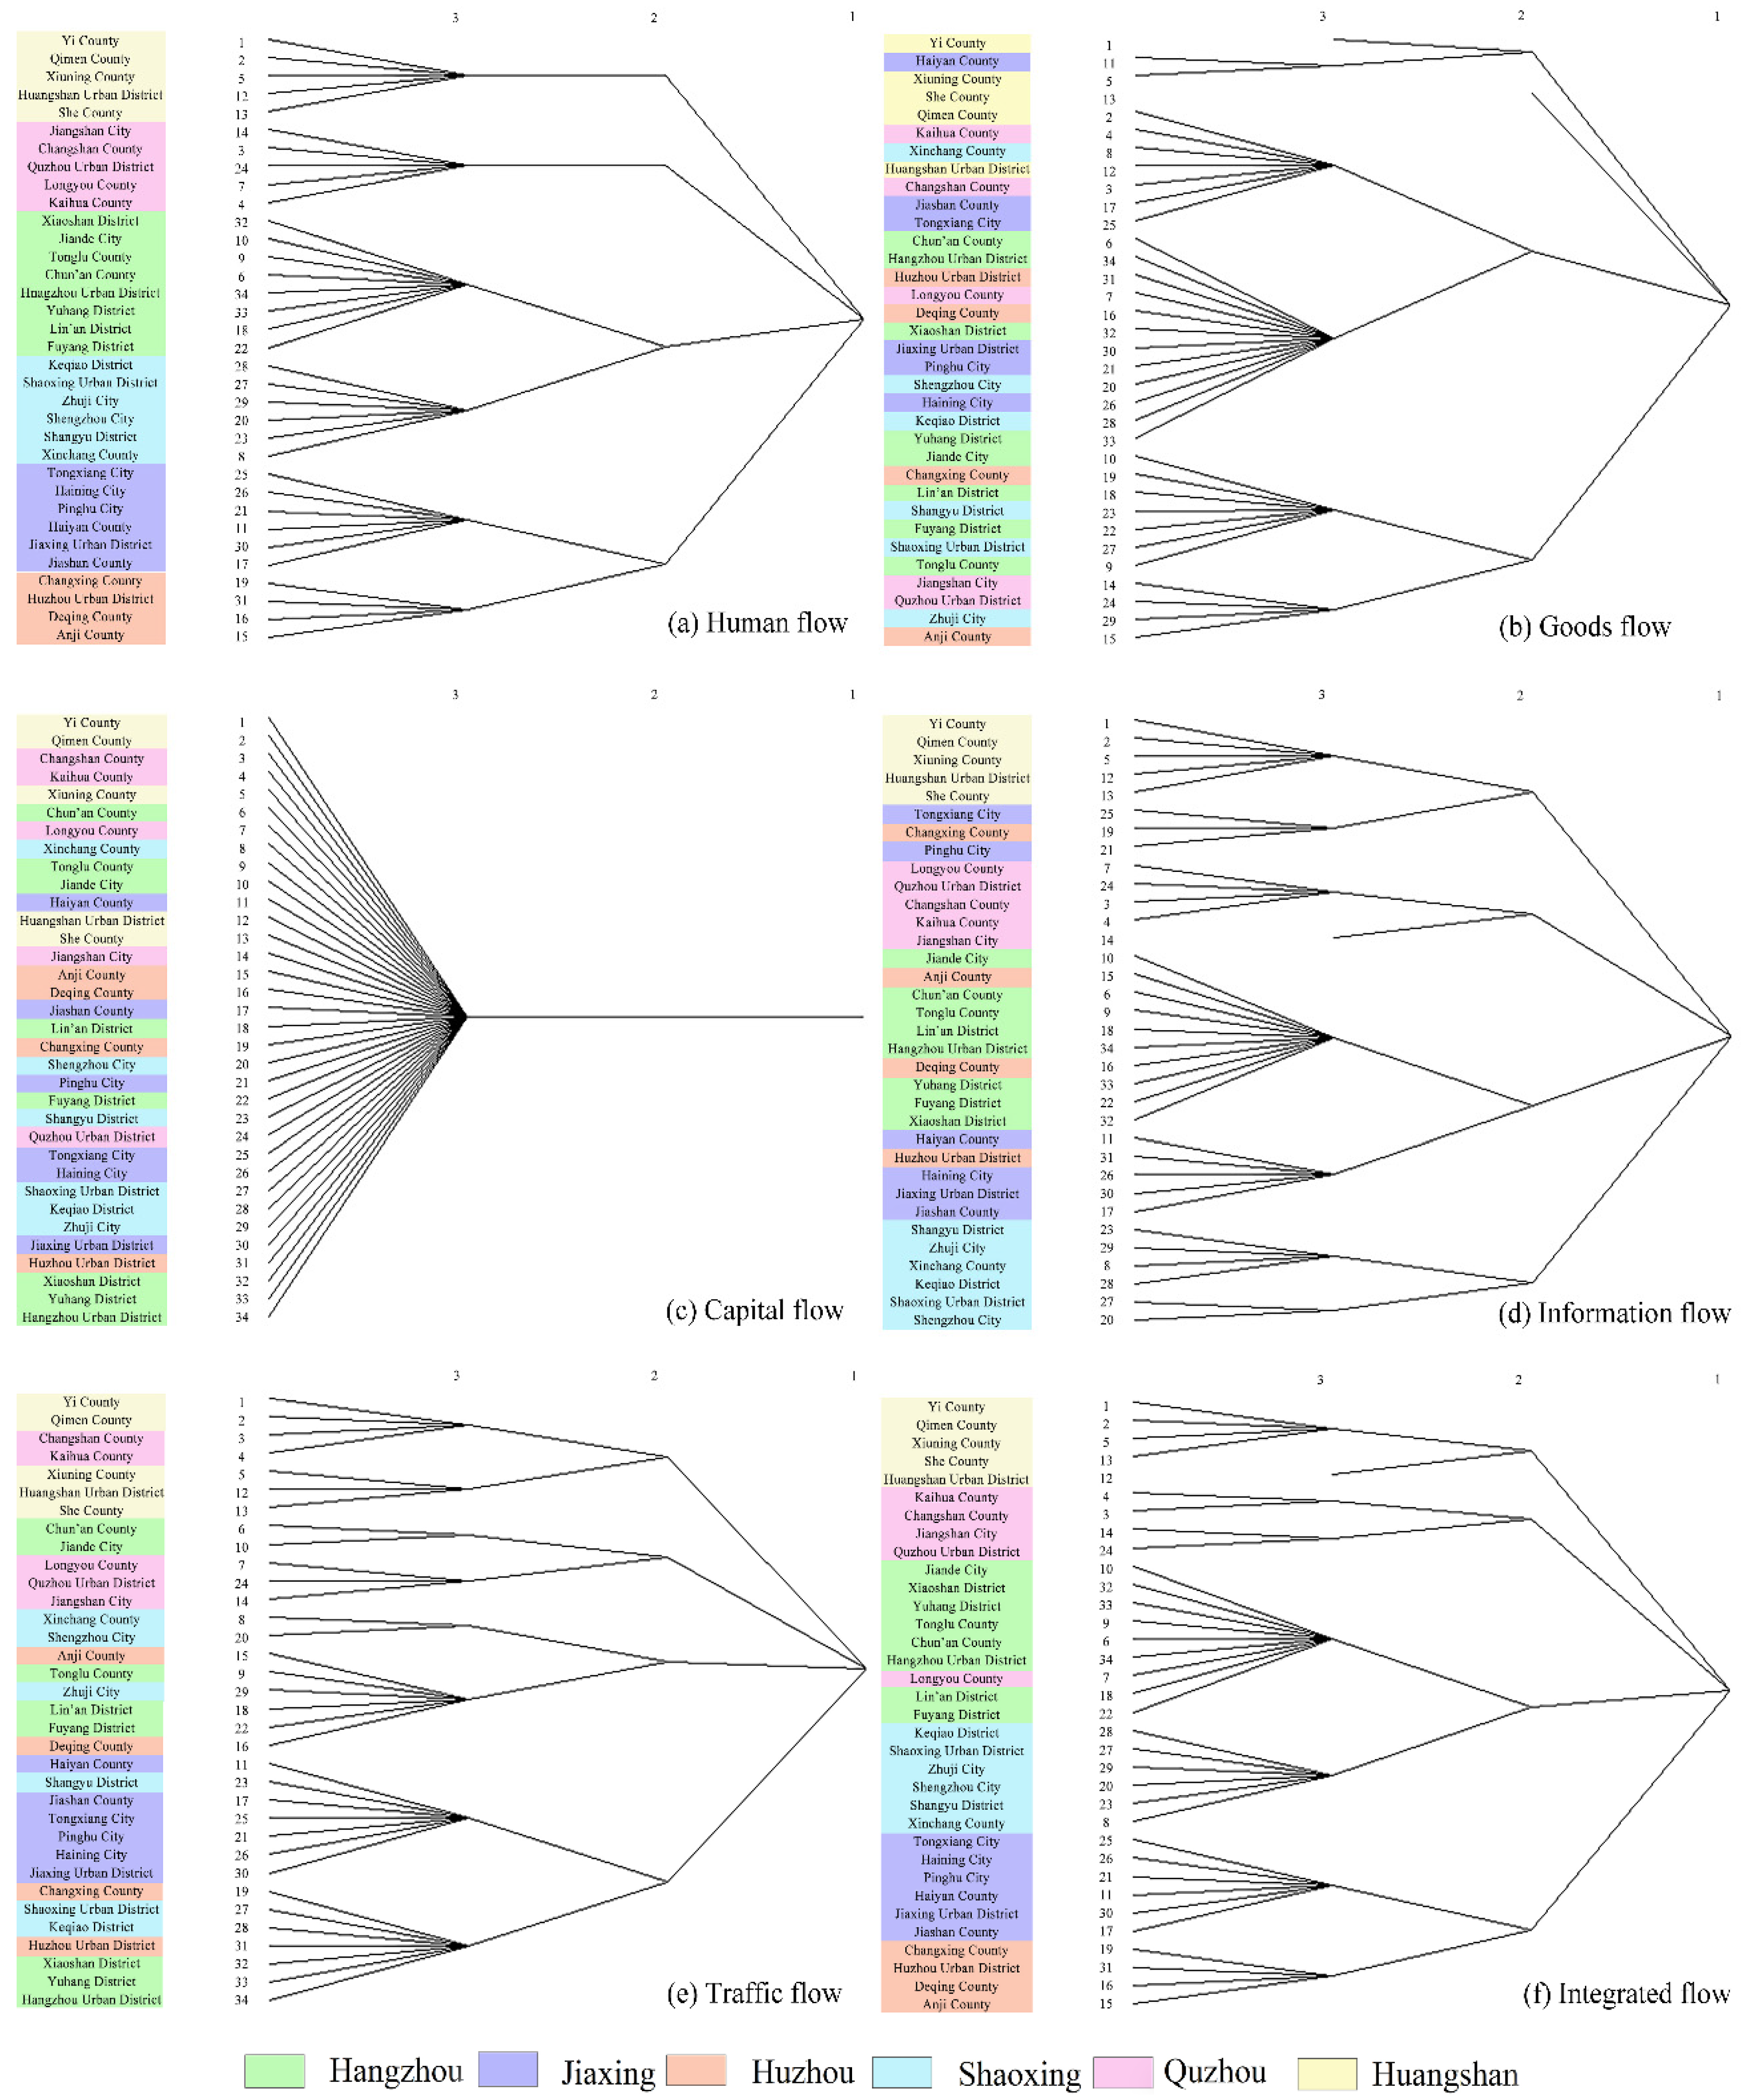
3.2. The Hierarchical Structure of Network Connections

The network connection can reflect the strength of the relative connections between any two counties. The matrix data of each element flow in the Hangzhou metropolitan circle were visualized to obtain the hierarchical structure of the network connection (Figure 6). In terms of human flow, the most closely connected counties were Hangzhou urban district and Yuhang district, Hangzhou urban district and Xiaoshan district, and Hangzhou urban district and Huzhou urban district. The counties within the municipal boundaries of Huangshan had weaker human flow connections with other areas. The human flow connection in the Hangzhou metropolitan circle mainly showed a pattern of Hangzhou urban district as the core and radiating to the surrounding counties. Hangzhou urban district and Xiaoshan district, and Hangzhou urban district and Zhuji city, were ranked in the top two in the goods and capital flow network connections between counties, indicating that Hangzhou urban district and surrounding areas were closely related to goods and capital flow. Regarding the traffic flow, traffic flow connections in the northwestern part of Hangzhou metropolitan circle were relatively weak. In terms of information flow, the stronger information flow connections were between Hangzhou urban district and Yuhang district, Hangzhou urban district and Xiaoshan district, and Hangzhou urban district and Fuyang district. The QAP correlation analysis is often used to explore the relationship between multi-dimensional networks. Table 2 shows that the correlation coefficients all passed the test at the 5% significance level, and the resulting correlation coefficients were statistically significant. Ranking the correlation coefficients, we could obtain capital flow—goods flow > human flow—traffic flow > capital flow—human flow > information flow—human flow > goods flow—human flow > traffic flow—information flow > capital flow—traffic flow > information flow—capital flow > goods flow—information flow. Through the ranking results, it could be found that the similarity between the goods flow and capital flow network, and the human flow and traffic flow network, were high, which indicates that the goods flow and capital flow network connection, and the human flow and traffic flow network connection, had a high degree of synergy. In summary, there were commonalities and differences among the multiple flow networks in Hangzhou metropolitan circle, and the QAP correlation analysis also shows that there were interconnections between different element flow networks.
In order to better identify the spatial network structure of each element flow in Hangzhou metropolitan circle, the first level of network connection was selected to construct the skeleton network. In the skeleton network of human flow, goods flow, capital flow, and traffic flow, the Hangzhou–Jiaxing–Huzhou–Shaoxing area was dominated by the radiation of Hangzhou urban district, and the development axis of “Hangzhou urban district—Fuyang district—Quzhou urban district” was roughly shown. In the skeleton network of goods flow and capital flow, the development axis of “Hangzhou urban district—Lin’an district—Huangshan urban district” also formed. In terms of information flow, most of its skeleton network was concentrated in the municipal boundaries of Hangzhou city, indicating that the skeleton network of information flow had not yet broken through the barrier of administrative division. Overall, in the skeleton network of integrated flow, the Hangzhou metropolitan circle as a whole presented a starfish-shaped development axis of Hangzhou–Jiaxing, Hangzhou–Huzhou, Hangzhou–Shaoxing, Hangzhou–Quzhou, and Hangzhou–Huangshan, namely, the spatial layout with Hangzhou as the core and radiating to Jiaxing, Huzhou, Shaoxing, Quzhou, and Huangshan.

3.3. The Spatial Correlation Structure of Networks

Cohesive subgroup analysis is used to describe the grouping phenomenon of metropolitan circles, which is the spatial correlation situation. The iterative convergent correlation method in Ucinet 6.0 was used for cohesive subgroup analysis, and the depth of analysis was set to 3. As shown in Figure 7, except for capital flow, the other spaces of flow formed four cohesive subgroups at the second level. In the third level, human flow formed six cohesive subgroups, goods flow formed seven cohesive subgroups, and information flow and traffic flow formed eight cohesive subgroups. In the respect of human and information flows, Yixian, Qimen, and Xuning counties located in the northwest of the metropolitan circle formed subgroups, and Jiangshan, Changshan, and Kaihua counties located in the southwest formed subgroups. This shows relatively stable subgroup structures in the human flow and information flow in Quzhou and Huangshan cities, respectively. In the respect of goods and traffic flows, Hangzhou, Huzhou, Jiaxing, and Shaoxing cities all formed polymorphic subgroup structures, indicating that the four cities in the eastern part of the metropolitan circle interacted frequently in goods and traffic flows. Additionally, the human flow overlapped with the municipal boundary in the third-level cohesive subgroup, and had a weak cross-municipal connection. The goods flow and information flow subgroups exhibited jump connections. For example, Longyou County, Hangzhou urban district, and Xiaoshan District, which are not adjacent to each other, constituted the third-level cohesive subgroup of goods flow, and Changxing County, Tongxiang City, and Pinghu City constituted the third-level cohesive subgroup of information flow.
On the whole, Quzhou and Huangshan cities basically formed subgroups individually, with weak cross-provincial and cross-municipal connections. Moreover, Hangzhou, Jiaxing, and Shaoxing cities interacted frequently in the space of flow and formed more cross-municipal subgroups.

4. Discussion

With the advancement of information technology and globalization, the flow of various elements between cities has accelerated, which has further strengthened the internal connection of metropolitan circles and reconstructed the regional spatial structure [94]. Compared with the traditional research model, the regional spatial structure based on “space of flow” is more objective and scientific, and provides a new perspective and direction for its research [95]. This study analyzed the spatial network structure of the Hangzhou metropolitan circle at the county level from the perspective of multi-source big data and multiple element flows, which complemented the depth of research on the spatial network structure of the metropolitan circle under the research background dominated by a single flow.
The results showed that the intensity structure of nodes in the metropolitan circle was stronger in the eastern counties than in the western counties as a whole in all element flows. This may be related to the mountainous terrain blocking the western region. Most of the eastern region is located in the Hangzhou–Jiaxing–Huzhou Plain, where the social connections of the counties are close, the communication is convenient, and the foundation for historical cooperation is profound. This corroborates the conclusions of Chao [96], who found that topographic terrain can have an impact on communication between cities. The Hangzhou urban district occupied a dominant position in the intensity structure of network nodes in the metropolitan circle, and was the gathering center of various element flows. This is in connection with the status of Hangzhou as the capital city, transportation hub, and political and cultural center of Zhejiang Province. It has comparatively concentrated resources, facilities, talents, and other development factors, leading and driving the integration process of the Hangzhou metropolitan circle. Nevertheless, Quzhou and Huangshan had a lower position in the network, and there was still a gap with the subcenter cities in the planning and positioning.
In the analysis of the hierarchical structure of network connections, there was a degree of similarity between the main flow directions of human flow and traffic flow. This was consistent with the research findings of Li [97]. This is due to the fact that population movement is dependent on transportation infrastructure, and transportation connections can promote population movement. The distribution of goods flow and capital flow network connections overlapped, such as in Hangzhou urban district, Xiaoshan district, and Zhuji. This was related to their location in the close circle layer of the Hangzhou metropolitan circle, with perfect infrastructure and great development conditions. Among them, Zhuji has a well-developed manufacturing industry, which complements Hangzhou’s developing digital industrialization. In addition, Xiaoshan District has a large number of high-tech enterprises. These all greatly enhanced the strength of their connections in the network. Furthermore, the network skeleton of the metropolitan circle in the integrated flow was in line with the “one ring and six belts” in the Hangzhou Metropolitan Circle Development Plan (2020–2035), namely, Hangzhou–Huangshan development belt, Hangzhou–Jiaxing development belt, Hangzhou–Huzhou–Quzhou development belt, and Hangzhou–Shaoxing development belt. It demonstrated that the actual development of the Hangzhou metropolitan circle was consistent with the planning, and it also proved the accuracy of this study.
With respect to the spatial correlation structure of the network, there was a strong group effect within the four cities of Hangzhou, Jiaxing, Huzhou, and Shaoxing, and the cross-city connection within the group was strong. This is because Hangzhou, Jiaxing, Huzhou, and Shaoxing signed the “Cooperation framework agreement on jointly building metropolitan circle under the background of Yangtze River Delta Integration Strategy” and established strategic cooperative relations. Cooperation in the fields of public services, comprehensive transportation, cultural tourism, and government services has accelerated exchanges and connections between cities. Quzhou and Huangshan cities generally formed subgroups independently, and the interactive development with other cities in the metropolitan circle was weak. This indicated that Quzhou and Huangshan have not been well merged into the integrated network of the Hangzhou metropolitan circle. Moreover, the distribution of the cohesive subgroups in the metropolitan circle was basically based on the geographic layout. There were also counties that were not geographically adjacent but still formed cohesive subgroups, such as Longyou in the west of the metropolitan circle and Hangzhou urban district and Xiaoshan district in the east. This illustrates that, with the development of modern communication technology, the communication between regions was no longer restricted by the space of places, which was also reflected and verified the core idea of space of flow [98].
Based on these research results, some policy implications can be proposed for the connection of small and medium-sized cities and regional integration development in the metropolitan circle from the perspective of element flow. First, through multi-source big data, this study found that the connections of information flow network among small and medium-sized cities was mainly concentrated within the city area, without breaking through the boundaries of administrative divisions. Therefore, the government should strengthen the integration of urban information, improve the construction of information network infrastructure within the metropolitan circle [99], and build a regional digital network platform. Second, in view of the differences in the spatial network structure under the action of each type of element flow, the government ought to consider different levels when formulating regional development plans, and pay attention to the differences between the implementation of planning and the actual development situation. Finally, the results of this study revealed that the spatial network structure of the metropolitan circle presented an unbalanced pattern of strong in the east and weak in the west, and the elements mostly flowed into Hangzhou urban district and its neighboring areas. Hence, the government should build a unified, open, and orderly market environment, form cross-regional service sharing and industrial collaboration channels in multiple fields [77], and promote the unhindered flow of various elements in the metropolitan circle. In addition, the ultimate goal of the coordinated development of metropolitan circles is not to eliminate intra-regional differences, but to improve the overall connectivity, coordination, and competitiveness of the region. Consequently, edge cities are supposed to cultivate their own characteristic industries, actively cooperate and exchange with other regions, and strengthen the ability to attract element flows. Core cities are supposed to play a radiating role and guide the metropolitan circle towards networked and integrated development.
The findings of this paper provide implications for regional development and spatial planning. For example, this study provides an analytical framework for the study of regional spatial structure, which helps the administration to better grasp the current situation of regional development and adjust planning and related policies in time. This study provides a quantitative analysis of the regional spatial structure by multiple element flows among small and medium-sized cities, which provides some reference for the refinement of the regional polynuclear system. The regional planning should focus on the policies of element mobility and regional network development, in addition to considering the policies of urban attributes such as administrative level and population size, so as to promote the coordination of regional spatial structure. For example, the mobility of capital, information, labor, and other elements in the region should be enhanced through the promotion of infrastructure interconnection. Furthermore, the data of this study were all taken from open source data websites on the Internet, and the data were easily accessible. With the rapid development of the Internet, Internet traffic, open network data, data mining, and other channels can be used to obtain data, such as social platforms including Weibo and Facebook, and shopping platforms including Taobao and Amazon, and combine the definition of “space of flow” to transform the data into relationship data between cities.

5. Conclusions

Taking the Hangzhou metropolitan circle as an example, this study built the connection matrix of human flow, goods flow, capital flow, information flow, and traffic flow based on multi-source big data, and the characteristics of the spatial network structure of the metropolitan circle were investigated at the county scale. The main conclusions of this study can be formulated as follows. The node intensity in the metropolitan circle gradually weakened from the eastern coast to the western interior. The core position of the Hangzhou urban district was apparent in all types of spaces of flow, and the county edge effect of Quzhou city and Huangshan city was equally evident. The network skeleton of the integrated flow network connection of the metropolitan circle showed a starfish development pattern, and the group effect of Hangzhou, Jiaxing, Huzhou, and Shaoxing was obvious in the spatial correlation structure of the network.
The contributions of this study have two main aspects. First, this study avoided the singularity of element flow selection that was used in previous studies. Based on the flow of humans, goods, capital, information, and traffic, this study systematically analyzed and discussed the structural characteristics of spatial networks in the metropolitan circle. Second, this study attempted to lower the level of research units through multi-source big data, which could reveal the position of small and medium-sized cities in the urban connections of the metropolitan circle and improve the micro-basis of regional research. Furthermore, this study could provide a reference for the study of the spatial network structure in other metropolitan circles.
However, there are still some limitations in this study, which need to be improved in future research. First, the original data used for flow data can be more diversified, such as Tencent Yichuxing data and mobile phone signaling data. Richer flow data types can further enhance the reliability of the research. Second, the analysis of flow data can be carried out based on the time scale. In future research, longitudinal comparisons can be made by combining various types of element flow data among counties over the years to obtain the evolutionary characteristics of the regional spatial network structure in the time series. This will better combine policy and the environment to support more suitable optimization strategies. Finally, no fixed paradigm has been created for the processing and analysis methods of flow data, and the methods that can be used to maximize the value of flow data are a direction that needs further research in the future.

Author Contributions

Conceptualization, J.Z. and M.G.; data curation, Q.H.; formal analysis, J.Z.; methodology, J.Z. and M.G.; resources, X.C.; software, Q.H.; validation, Q.H. and C.Z.; visualization, L.Z.; writing—original draft, J.Z.; writing—review & editing, Q.H., X.C., C.Z., M.H., J.W. and M.G.; project administration, J.Z. All authors have read and agreed to the published version of the manuscript.

Funding

The Open Fund of Key Laboratory of Urban Land Resources Monitoring and Simulation Ministry of Natural Resources. Grant number: KF-2020-05-073.

Informed Consent Statement

Not applicable.

Data Availability Statement

Not applicable.

Conflicts of Interest

The authors declare no conflict of interest.

References

  1. Taylor, P.J.; Derudder, B. World City Network: A Global Urban Analysis, 2nd ed.; Routledge: Abingdon, UK, 2015. [Google Scholar]
  2. Shen, L.Z.; Gu, C.L.; Zhen, F. A study on the structural modes of space of flows. Urban Plan. Forum 2010, 5, 26–32. [Google Scholar]
  3. Fang, C.L. China’s urban agglomeration and metropolitan area construction under the new development pattern. Econ. Geogr. 2021, 41, 1–7. [Google Scholar]
  4. Fridemann, J.R. The world city hypothesis. Dev. Chang. 1986, 17, 69–83. [Google Scholar] [CrossRef]
  5. Yi, R.; Xue, D.; Wang, B. Integration of the Pearl River Delta in 1999-2019: An analysis of news media on government portal site. Hum. Geogr. 2022, 37, 113–121. [Google Scholar]
  6. Dadashpoor, H.; Malekzadeh, N. Driving factors of formation, development, and change of spatial structure in metropolitan areas: A systematic review. J. Urban Manag. 2020, 9, 286–297. [Google Scholar] [CrossRef]
  7. He, D.; Yin, Q.; Zheng, M.; Gao, P. Transport and regional economic integration: Evidence from the Chang-Zhu-tan region in China. Transp. Policy 2019, 79, 193–203. [Google Scholar] [CrossRef]
  8. Gao, X.; Zhang, A.; Sun, Z. How regional economic integration influence on urban land use efficiency? A case study of Wuhan metropolitan area, China. Land Use Policy 2020, 90, 104329. [Google Scholar] [CrossRef]
  9. Cai, W.; Smith, B.; Wang, M. Simulating the urban spatial structure with spatial interaction: A case study of urban polycentricity under different scenarios. Comput. Environ. Urban Syst. 2021, 89, 101677. [Google Scholar]
  10. Chen, T.; Hui, E.; Wu, J.; Lang, W.; Li, X. Identifying urban spatial structure and urban vibrancy in highly dense cities using georeferenced social media data. Habitat Int. 2019, 89, 102005. [Google Scholar] [CrossRef]
  11. Ke, S.Z.; Feser, E. Count on the growth pole strategy for regional economic growth? spread-backwash effects in greater central China. Reg. Stud. 2010, 44, 1131–1147. [Google Scholar] [CrossRef]
  12. Zhang, Z.B.; Chen, Y.R.; Zhao, L. The analysis of metropolitan areas spatial self-organization evolution in China based on the theory of central place. Econ. Geogr. 2014, 34, 44–51. [Google Scholar]
  13. Christaller, W. Central Places in Southern Germany; Prentice Hall: Englewood Cliffs, NJ, USA, 1966. [Google Scholar]
  14. Friedmann, J.R. Regional Development Policy: A Case Study of Venezuela; MIT Press: Cambridge, UK, 1966. [Google Scholar]
  15. Francois, P. Economic space: Theory and applications. Q. J. Econ. 1950, 64, 89–104. [Google Scholar]
  16. Lu, Y.Q. The mechanism of the model of dual-nuclei structure. Acta Geogr. Sin. 2002, 57, 85–95. [Google Scholar]
  17. Ioannides, Y.; Skouras, S. US city size distribution: Robustly Pareto, but only in the tail. J. Urban Econ. 2013, 73, 18–29. [Google Scholar] [CrossRef]
  18. Van Meeteren, M.; Poorthuis, A. Christaller and “big data”: Recalibrating central place theory via the geoweb. Urban Geogr. 2018, 39, 122–148. [Google Scholar] [CrossRef] [Green Version]
  19. Castells, M. The Information City: Information Technology, Economic Restructuring and the Urban-Regional Process; Blackwell: Oxford, MS, USA, 1989. [Google Scholar]
  20. Meijers, E. From central place to network model: Theory and evidence of a paradigm change. Tijdschr. Voor Econ. En Soc. Geogr. 2007, 98, 245–259. [Google Scholar] [CrossRef]
  21. Wang, S.J.; Feng, Z.X.; Liu, D.P.; Zhang, Z.W. Basic perspective and preliminary framework for the theoretical innovation and development of Central Place Theory in new times. Prog. Geogr. 2012, 31, 1256–1263. [Google Scholar]
  22. Batten, D.F. Network cities: Creative urban agglomerations for the 21st century. Urban Stud. 1995, 32, 313–327. [Google Scholar] [CrossRef]
  23. Wang, Y.; Niu, X.Y.; Song, X.D. Research progress of regional spatial structure under the perspective of space of flow. Urban Plan. Int. 2017, 32, 27–33. [Google Scholar] [CrossRef] [Green Version]
  24. Chong, Z.; Pan, S. Understanding the structure and determinants of city network through intra-firm service relationships: The case of Guangdong-Hong Kong-Macao Greater Bay Area. Cities 2020, 103, 102738. [Google Scholar] [CrossRef]
  25. Sun, Q.; Tang, F.; Tang, Y. An economic tie network-structure analysis of urban agglomeration in the middle reaches of Changjiang River based on SNA. J. Geogr. Sci. 2015, 25, 739–755. [Google Scholar] [CrossRef] [Green Version]
  26. Taylor, P.J. Specification of the world city network. Geogr. Anal. 2001, 33, 181–194. [Google Scholar] [CrossRef]
  27. Hall, P.G.; Pain, K. Polycentric Metrop. Learn. Mega-City Reg. Europe; EarthScan: London, UK, 2006. [Google Scholar]
  28. Yeh, A.G.; Yang, F.F.; Wang, J. Producer service linkages and city connectivity in the mega-city region of China: A case study of the Pearl River Delta. Urban Stud. 2015, 52, 2458–2482. [Google Scholar] [CrossRef]
  29. Zhao, M.; Derudder, B.; Huang, J. Examining the transition processes in the Pearl River Delta polycentric mega-city region through the lens of corporate networks. Cities 2017, 60, 147–155. [Google Scholar] [CrossRef]
  30. Limtanakool, N.; Schwanen, T.; Dijst, M. Developments in the Dutch urban system on the basis of flows. Reg. Stud. 2009, 43, 179–196. [Google Scholar] [CrossRef]
  31. Wang, S.; Song, Y.; Wen, H.; Li, J. Network structure analysis of urban agglomeration in the Yangtze River Economic Belt under the perspective of bidirectional economic connection: Based on time distance and social network analysis method. Econ. Geogr. 2019, 39, 73–81. [Google Scholar]
  32. Xu, J.; Li, A.; Li, D.; Liu, Y.; Du, Y.; Pei, T.; Ma, T.; Zhou, C. Difference of urban development in China from the perspective of passenger transport around Spring Festival. Appl. Geogr. 2017, 87, 85–96. [Google Scholar] [CrossRef]
  33. Huang, Y.; Shi, K.; Zong, H.; Zhou, T.; Shen, J. Exploring spatial and temporal connection patterns among the districts in Chongqing based on highway passenger flow. Remote Sens. 2020, 12, 27. [Google Scholar] [CrossRef] [Green Version]
  34. Wang, Q.; Zhao, M. Research on the city network of Guangdong, Hongkong and Macao from the perspective of information flow: Analysis based on Baidu index. J. Reg. City Plan. 2018, 29, 281. [Google Scholar] [CrossRef]
  35. Yang, H.; Dijst, M.; Witte, P.; Ginkel, H.V.; Wang, J. Comparing passenger flow and time schedule data to analyze High-Speed Railways and urban networks in China. Urban Stud. 2019, 56, 1267–1287. [Google Scholar] [CrossRef] [Green Version]
  36. Yang, H.; Dobruszkes, F.; Wang, J.; Dijst, M.; Witte, P. Comparing China’s urban systems in high-speed railway and airline networks. J. Transp. Geogr. 2018, 68, 233–244. [Google Scholar] [CrossRef]
  37. Zhang, H.; Zhuge, C.; Jia, J.; Shi, B.; Wang, W. Green travel mobility of dockless bike-sharing based on trip data in big cities: A spatial network analysis. J. Clean. Prod. 2021, 313, 127930. [Google Scholar] [CrossRef]
  38. Yu, H.; Yang, J.; Li, T.; Jin, Y.; Sun, D. Morphological and functional polycentric structure assessment of megacity: An integrated approach with spatial distribution and interaction. Sustain. Cities Soc. 2022, 80, 103800. [Google Scholar] [CrossRef]
  39. Zhang, X.; Guo, Q.; Cheung, D.M.; Zhang, T. Evaluating the institutional performance of the Pearl River Delta integration policy through intercity cooperation network analysis. Cities 2018, 81, 131–144. [Google Scholar] [CrossRef]
  40. Fang, C.; Yu, X.; Zhang, X.; Fang, J.; Liu, H. Big data analysis on the spatial networks of urban agglomeration. Cities 2020, 102, 102735. [Google Scholar] [CrossRef]
  41. Cai, J.; Huang, B.; Song, Y. Using multi-source geospatial big data to identify the structure of polycentric Cities. Remote Sens. Environ. 2017, 202, 210–221. [Google Scholar] [CrossRef]
  42. Liu, X.; Yan, X.; Wang, W.; Titheridge, H.; Wang, R.; Liu, Y. Characterizing the polycentric spatial structure of Beijing Metropolitan Region using carpooling big data. Cities 2021, 109, 103040. [Google Scholar] [CrossRef]
  43. Sun, Q.; Wang, S.; Zhang, K.; Ma, F.; Guo, X.; Li, T. Spatial pattern of urban system based on gravity model and whole network analysis in eight urban agglomerations of China. Math. Probl. Eng. 2019, 2019, 6509726. [Google Scholar] [CrossRef]
  44. Zhou, H.L.; Wang, F.Y. Research on structure characteristics of the inter-provincial tourist flow spatial network in China based on the modified gravity model. Geogr. Res. 2020, 39, 669–681. [Google Scholar]
  45. Zhang, P.; Zhao, Y.; Zhu, X.; Cai, Z.; Xu, J.; Shi, S. Spatial structure of urban agglomeration under the impact of high-speed railway construction: Based on the social network analysis. Sustain. Cities Soc. 2020, 62, 102404. [Google Scholar] [CrossRef]
  46. He, D.; Chen, Z.; Pei, T.; Zhou, J. The regional and local scale evolution of the spatial structure of high-speed railway networks—A case study focused on Beijing-Tianjin-Hebei Urban Agglomeration. ISPRS Int. J. Geo-Inf. 2021, 10, 543. [Google Scholar] [CrossRef]
  47. Wang, Y.; Deng, Y.; Ren, F.; Zhu, R.; Wang, P.; Du, T.; Du, Q. Analysing the spatial configuration of urban bus networks based on the geospatial network analysis method. Cities 2020, 96, 102406. [Google Scholar] [CrossRef]
  48. Huang, L.; Hu, D.; Zhao, Y. Research progress on urban agglomerations from the perspective of “flow space”. Sci. Technol. Ind. 2022, 22, 194–200. [Google Scholar]
  49. Long, Y.; Liu, L. Four Transformations of Chinese quantitative urban research in the new data environment. Urban Plan. Int. 2017, 32, 64–73. [Google Scholar] [CrossRef] [Green Version]
  50. Zhang, W.; Fang, C.; Zhou, L.; Zhu, J. Measuring megaregional structure in the Pearl River Delta by mobile phone signaling data: A complex network approach. Cities 2020, 104, 102809. [Google Scholar] [CrossRef]
  51. Zhou, Y.; He, X.; Zhu, Y. Identification and evaluation of the polycentric urban structure: An empirical analysis based on multi-source big data fusion. Remote Sens. 2022, 14, 2705. [Google Scholar] [CrossRef]
  52. Lou, G.; Chen, Q.; He, K.; Zhou, Y.; Shi, Z. Using nighttime light data and POI big data to detect the urban centers of Hangzhou. Remote Sens. 2019, 11, 1821. [Google Scholar] [CrossRef] [Green Version]
  53. He, X.; Yuan, X.; Zhang, D.; Zhang, R.; Li, M.; Zhou, C. Delineation of urban agglomeration boundary based on multisource big data fusion—A case study of Guangdong–Hong Kong–Macao Greater Bay Area (GBA). Remote Sens. 2021, 13, 1801. [Google Scholar] [CrossRef]
  54. Martí, P.; Serrano-Estrada, L.; Nolasco-Cirugeda, A. social media data: Challenges, opportunities and limitations in urban studies. Comput. Environ. Urban Syst. 2019, 74, 161–174. [Google Scholar] [CrossRef]
  55. Jendryke, M.; Balz, T.; Liao, M. Big location-based social media messages from China’s Sina Weibo network: Collection, storage, visualization, and potential ways of analysis. Trans. GIS 2017, 21, 825–834. [Google Scholar] [CrossRef]
  56. Tu, W.; Zhu, T.; Xia, J.; Zhou, Y.; Lai, Y.; Jiang, J. Portraying the spatial dynamics of urban vibrancy using multisource urban big data. Comput. Environ. Urban Syst. 2020, 80, 101428. [Google Scholar] [CrossRef]
  57. Cui, H.; Wu, L.; Hu, S.; Lu, R.; Wang, S. Recognition of urban functions and mixed use based on residents’ movement and topic generation model: The case of Wuhan, China. Remote Sens. 2020, 12, 2889. [Google Scholar] [CrossRef]
  58. Zhang, W.; Chong, Z.; Li, X.; Nie, G. Spatial patterns and determinant factors of population flow networks in China: Analysis on Tencent location big data. Cities 2020, 99, 102640. [Google Scholar] [CrossRef]
  59. Jia, T.; Luo, X.; Li, X. Delineating a hierarchical organization of ranked urban clusters using a spatial interaction network. Comput. Environ. Urban Syst. 2021, 87, 101617. [Google Scholar] [CrossRef]
  60. Devriendt, L.; Boulton, A.; Brunn, S.; Derudder, B.; Witlox, F. Searching for cyberspace: The position of major cities in the information age. J. Urban Technol. 2011, 18, 73–92. [Google Scholar] [CrossRef]
  61. Deng, C.; Song, X.; Xie, B.; Li, M.; Zhong, X. City network link analysis of urban agglomeration in the middle Yangtze River basin based on the Baidu post bar data. Geogr. Res. 2018, 37, 1181–1192. [Google Scholar]
  62. Matthiessen, C.W.; Schwarz, A.W.; Find, S. World cities of scientific knowledge: Systems, networks and potential dynamics. An analysis based on bibliometric indicators. Urban Stud. 2010, 47, 1879–1897. [Google Scholar] [CrossRef]
  63. Guo, J.; Qin, Y. Coupling characteristics of coastal ports and urban network systems based on flow space theory: Empirical evidence from China. Habitat Int. 2022, 126, 102624. [Google Scholar] [CrossRef]
  64. Guo, W.; Liu, W. Study on the problems’ international reference and development path of constructing modern metropolitan circle. Econ. Probl. 2021, 8, 104–109. [Google Scholar]
  65. Wang, Z.; Hu, Y.; Zhu, P.; Qin, Y.; Jia, L. Ring aggregation pattern of metro passenger trips:A study using smart card data. Phys. A Stat. Mech. Its Appl. 2018, 491, 471–479. [Google Scholar] [CrossRef]
  66. Widhalm, P.; Yang, Y.; Ulm, M.; Athavale, S.; González, M. Discovering urban activity patterns in cell phone data. Transportation 2015, 42, 597–623. [Google Scholar] [CrossRef] [Green Version]
  67. Ye, Q.; Zhang, L.; Peng, P.; Huang, J. The network characteristics of urban agglomerations in the middle reaches of the Yangtze River based on Baidu migration data. Econ. Geogr. 2017, 37, 53–59. [Google Scholar]
  68. Verhetsel, A.; Sel, S. World maritime cities: From which cities do container shipping companies make decisions? Transp. Policy 2009, 16, 240–250. [Google Scholar] [CrossRef]
  69. Akhavan, M.; Ghiara, H.; Mariotti, I.; Sillig, C. Logistics global network connectivity and its determinants. A European City network analysis. J. Transp. Geogr. 2020, 82, 102624. [Google Scholar] [CrossRef]
  70. Wang, S.; Gao, S.; Wang, Y. Spatial structure of the urban agglomeration based on space of flows: The study of the Pearl River Delta. Geogr. Res. 2019, 38, 1849–1861. [Google Scholar]
  71. Arthur, S.; Beckfield, A.J. Power and position in the world city system. Am. J. Sociol. 2004, 109, 811–851. [Google Scholar]
  72. Van Oort, F.G.; Burger, M.J.; Raspe, O. On the economic foundation of theurban networkparadigm: Spatial integration, functional integration and economic complementarities within the Dutch Randstad. Urban Stud. 2010, 47, 725–748. [Google Scholar] [CrossRef] [Green Version]
  73. Chen, C.; Xiu, C. Research on city network of northeast China based on space of flows. Areal Res. Dev. 2014, 33, 82–89. [Google Scholar]
  74. Zhen, F.; Cao, Y.; Qin, X.; Wang, B. Delineation of an urban agglomeration boundary based on Sina Weibo microblog “check-in” data: A case study of the Yangtze River Delta. Cities 2017, 60, 180–191. [Google Scholar] [CrossRef]
  75. Yao, W.; Zhou, J.; Chen, H.; Chen, Q. Spatial structure of regional network based on Internet public information flow. Econ. Geogr. 2017, 37, 10–16. [Google Scholar]
  76. Derudder, B.; Witlox, F. Mapping world city networks through airline flows:Context, relevance, and problems. J. Transp. Geogr. 2008, 16, 305–312. [Google Scholar] [CrossRef]
  77. Seya, H.; Zhang, J.; Chikaraishi, M.; Jiang, Y. Decisions on truck parking place and time on expressways: An analysis using digital tachograph data. Transportation 2018, 47, 555–583. [Google Scholar] [CrossRef] [Green Version]
  78. Qiu, J.; Liu, Y.; Chen, H.; Gao, F. Urban network structure of Guangdong-Hong Kong-Macao Greater Bay Area with the view of space of flows: A comparison between information flow and transportation flow. Econ. Geogr. 2019, 39, 7–15. [Google Scholar]
  79. Chen, X.; Wu, S. Research on the regional spatial pattern of Nanjing-Hefei double metropolitans: Based on the perspective of urban flow. East China Econ. Manag. 2021, 35, 35–44. [Google Scholar]
  80. Gu, W.; Ou, X.; Ye, L.; Yang, B. Spatial structure of urban agglomeration in the Yangtze River Delta based on the analysis of element flow. Trop. Geogr. 2015, 35, 833–841. [Google Scholar]
  81. Zhou, J.; Bi, X.; Zou, W. Driving mechanism of urban-rural integration in Huaihai Economic Zone: Based on the space of flow. J. Nat. Resour. 2020, 35, 1881–1896. [Google Scholar]
  82. Taylor, P.; Catalano, G.; Walker, D. Measurement of the world city network. Urban Stud. 2002, 39, 2367–2376. [Google Scholar] [CrossRef]
  83. Taylor, P.; Evans, D.; Pain, K. Application of the interlocking network model to mega-city-regions: Measuring polycentricity within and beyond city-regions. Reg. Stud. 2008, 42, 1079–1093. [Google Scholar] [CrossRef]
  84. Taylor, P.; Derudder, B.; Hoyler, M.; Ni, P.; Witlox, F. City-dyad analyses of China’s integration into the World City Network. Urban Stud. 2014, 51, 868–882. [Google Scholar] [CrossRef] [Green Version]
  85. Xing, L.; Du, S.; Sun, G.; Chen, Q. Analysis on network structure characteristics and its influencing factors in Hubei province based on the perspective of multi-dimensional feature flow. Resour. Environ. Yangtze Basin 2022, 1–13. Available online: http://kns.cnki.net/kcms/detail/42.1320.X.20220822.1731.004.html (accessed on 23 August 2022).
  86. Xiong, L.; Zhen, F.; Wang, B.; Xi, G. The research of the Yangtze River Delta core area’s city network characteristics based on Baidu index. Econ. Geogr. 2013, 33, 67–73. [Google Scholar]
  87. Wang, Z.; Yang, S.; Gong, F.; Liu, S. Identification of urban agglomerations deformation structure based on urban-flow space: A case study of the Yangtze River Delta urban agglomeration. Sci. Geogr. Sin. 2017, 37, 1337–1344. [Google Scholar]
  88. Liu, J. Introduction to Social Network Analysis; Social Sciences Academic Press: Beijing, China, 2004. [Google Scholar]
  89. Barnett, G.A. Encyclopedia of Social Networks; Sage Publications: London, UK, 2011. [Google Scholar]
  90. Liu, J. QAP: A method of measuring the relationship between “relationships”. Society 2007, 4, 164–174. [Google Scholar]
  91. Cidell, J. Cooperating on urban sustainability: A social network analysis of municipalities across Greater Melbourne. Urban Policy Res. 2020, 38, 150–172. [Google Scholar] [CrossRef]
  92. Kenneth, A.F. Identifying cohesive subgroups. Soc. Netw. 1995, 17, 27–56. [Google Scholar]
  93. Liu, J. Lectures on Whole Network Approach: A Practical Guide to Ucinet; Truth & Wisdom Press: Shanghai, China, 2009. [Google Scholar]
  94. Shi, L.; Bai, Y. Factor Agglomeration and diffusion, spatial network evolution and urban function orientation: Empirical evidence from 108 cities in the Yangtze River Economic Belt. Reg. Econ. Rev. 2022, 3, 107–117. [Google Scholar]
  95. Ren, Z. On the trend of the development of great and small cities of China. Urban Dev. Stud. 2010, 17, 1–7. [Google Scholar]
  96. Cao, H.; Ma, X.; Li, G. Characteristics and Changes of the Polycentric Spatial Structure in the Pearl River Delta Region. Areal Research and Development. Areal Res. Dev. 2014, 33, 12–18. [Google Scholar]
  97. Li, Z.; Wang, S.; Cheng, L.; Shi, X.; Guan, H.; Shu, C. Differences and relationship between population flow and transportation networks in Northeast China. Prog. Geogr. 2022, 41, 985–998. [Google Scholar] [CrossRef]
  98. Qin, J. A study on the governance framework and model of cooperation zone types metropolitan areas from the perspective of factor flow. Planners 2022, 38, 12–19. [Google Scholar]
  99. Liu, H.; Fang, C.; Sun, S. Digital inequality in provincial China. Environ. Plan. A 2017, 49, 2179–2182. [Google Scholar] [CrossRef]
Figure 1. Location of Hangzhou metropolitan circle in China.
Remotesensing 14 05266 g001
Figure 2. The schematic diagram of “Hangzhou Metropolitan Circle Development Plan (2020–2035)”.
Remotesensing 14 05266 g002
Figure 3. Frequency distribution diagram and Q-Q diagram of data before and after pre-processing.
Remotesensing 14 05266 g003
Figure 4. The workflow for implementing the analytical framework.
Remotesensing 14 05266 g004
Figure 5. Intensity grading diagram of network nodes.
Remotesensing 14 05266 g005
Figure 6. The hierarchical distribution diagram of network connections.
Remotesensing 14 05266 g006
Figure 7. The division diagram of cohesive subgroups.
Remotesensing 14 05266 g007
Table 1. Basic information and data sources for element flows.
NameDefinitionGeneral Expressive FormData SourceAcquisition Time
Human flowHuman flow is the abbreviation of population movement, which refers to the migration phenomenon of the population moving from one location to any other location in geographic space within a certain period of time.Mobile phone signaling data and daily train passenger data [65,66]Baidu migration platform [67]1 October 2020, to 18 January 2021
Goods flowGoods flow is the process of transferring goods from the place of supply to the place of receipt.Container data and logistics company data [68,69]Gaode Map [70]1 October 2020, to 18 January 2021
Capital flowCapital flow is the flow process of funds, which usually occurs due to the transfer of goods or their ownership between members.Enterprise organization data and interenterprise relationship data [71,72]Gaode Map [73]1 October 2020, to 18 January 2021
Information flowInformation flow refers to information movement through the information infrastructure in the urban network.Weibo punch card data and the Baidu index [74]The search data of 58.com [75]1 October 2020, to 18 January 2021
Traffic flowTraffic flow refers to the flow process of major transportation modes between cities through the corresponding transportation infrastructure.Airline data and expressway data [76,77]The Railway Customer Service Center of China and the route planning API provided by Gaode Map [78]1 October 2020, to 18 January 2021
Table 2. QAP correlation analysis of multi-dimensional networks.
A/BHuman FlowGoods FlowCapital FlowInformation FlowTraffic Flow
Human flow10.55290.69430.59750.7260
Goods flow0.552910.83170.33090.2946
Capital flow0.69430.831710.40920.4622
Information flow0.59750.33090.409210.5257
Traffic flow0.72600.29460.46220.52571
Publisher’s Note: MDPI stays neutral with regard to jurisdictional claims in published maps and institutional affiliations.

