Article

A Local-Sparse-Information-Aggregation Transformer with Explicit Contour Guidance for SAR Ship Detection

1
Radar Research Lab, School of Information and Electronics, Beijing Institute of Technology, Beijing 100081, China
2
Chongqing Innovation Center, Beijing Institute of Technology, Chongqing 401120, China
*
Author to whom correspondence should be addressed.
Remote Sens. 2022, 14(20), 5247; https://doi.org/10.3390/rs14205247
Submission received: 14 August 2022 / Revised: 8 October 2022 / Accepted: 14 October 2022 / Published: 20 October 2022

Abstract

:
Ship detection in synthetic aperture radar (SAR) images has witnessed rapid development in recent years, especially after the adoption of convolutional neural network (CNN)-based methods. Recently, a transformer using self-attention and a feed forward neural network with a encoder-decoder structure has received much attention from researchers, due to its intrinsic characteristics of global-relation modeling between pixels and an enlarged global receptive field. However, when adapting transformers to SAR ship detection, one challenging issue cannot be ignored. Background clutter, such as a coast, an island, or a sea wave, made previous object detectors easily miss ships with a blurred contour. Therefore, in this paper, we propose a local-sparse-information-aggregation transformer with explicit contour guidance for ship detection in SAR images. Based on the Swin Transformer architecture, in order to effectively aggregate sparse meaningful cues of small-scale ships, a deformable attention mechanism is incorporated to change the original self-attention mechanism. Moreover, a novel contour-guided shape-enhancement module is proposed to explicitly enforce the contour constraints on the one-dimensional transformer architecture. Experimental results show that our proposed method achieves superior performance on the challenging HRSID and SSDD datasets.

Graphical Abstract

1. Introduction

Synthetic aperture radar (SAR) is an active remote sensing imaging system. Compared with optical sensors, the main advantage of SAR sensors is that they can perform an observation task without being affected by factors such as light intensity and weather conditions. The transmitted microwave signal of SAR sensors, with strong penetration ability, can obtain remote-sensing images without clouds or fog occlusion [1]. With the continuous increase in SAR platforms, such as aircraft and satellites, a large number of SAR images have been generated. The automatic-detection technology for targets in SAR images has become an important research topic. Recently, ship detection in SAR images has received increased attention because of its wide range of applications. In the civilian field, it is helpful for ocean freight detection and management, while in the military field, it is conducive to tactical deployment and improves the early warning capabilities of coastal defense.
Traditional SAR target-detection methods are mainly based on a statistical distribution of background clutter, difference in contrast, and polarization information. The constant-false-alarm Rate (CFAR) method [2], based on statistical modeling of clutter, is one of the most widely used methods. The CFAR method obtains an adaptive threshold according to the statistical distribution of background clutter under a constant-false-alarm rate, then compares the pixel intensity with the threshold to distinguish the object’s pixel intensity from that of the background. Traditional methods mostly rely on manual design, with too much prior information to extract complex features, and the generalization ability of the obtained results is poor.
There are also some detection methods based on the machine learning method. Machine learning methods need to use target images for feature learning and pay more attention to feature extraction. The features extracted by machine learning are generally more interpretable [3] using a boosting decision tree to complete the detection task. To obtain more rotation-invariant features [3], a spatial-frequency channel feature is artificially designed by integrating the features constructed in the frequency domain and the original spatial channel features. This method also refines the features by subspace learning. Although the features extracted by the machine learning method are more representative, the sliding window operation reduces the efficiency of detection.
With the development of deep learning, deep convolutional neural networks (CNNs) have become mainstream methods in object detection. Deep neural networks have more powerful feature-extraction capability than traditional methods. At present, the target detection algorithms based on deep learning are mainly divided into two categories. The first type is a two-stage target detection algorithm represented by Faster R-CNN [4], which generates candidate regions on the bounding box containing the target and then performs target detection. The detection accuracy is high, but the efficiency is low. The second type is a one-stage target detection algorithm, mainly represented by the single-shot multiBox detector (SSD) [5] and the You-Only-Look-Once (YOLO) [6] series. This type of algorithm does not generate candidate regions and directly detects targets through regression; the detection efficiency is high, but the accuracy is not as good as that of the first type.
Object-detection methods based on CNNs can also be divided into anchor-based and anchor-free categories. Faster-RCNN, SDD, and YOLOv3 [7] are anchor-based methods; they adopt anchors, which is a group of rectangular boxes clustered on the training set using methods, such as K-means, before training. Anchors can represent the main distribution of the length and width scales of an object in the dataset and help the network find region proposals. In comparison, anchor-free methods, such as CenterNet [8] and a fully convolutional one-stage object (FCOS) [9], use other strategies for modeling the object in the detection head instead of adopting predefined anchors. However, object-detection methods based on CNN lose some spatial information in feature extraction because of the locality of convolution and the down-sample operation in pooling. Some structures fuse deep and shallow features, such as the feature pyramid network (FPN) [10], to enhance the information-capture ability of a model, but this architecture increases the parameters of the model and the model becomes more time-consuming.
In remote-sensing data processing and analysis, there are also many state-of-the-art deep learning models. These methods use multimodal remote-sensing data, including SAR data, hyperspectral (HS) data, multispectral (MS) data [11], and light-detection-and-ranging (LiDAR) data. [12], to design a multimodal deep learning framework for remote-sensing image classification. In [13], the authors used two-branch feature fusion CNN, including a branch of two-tunnel CNN, to extract spectral–spatial features from HS imagery, and another CNN with a cascade block to extract features from LiDAR or high-resolution visual images.
As a novel neural network structure, a transformer structure [14] provides a new way of thinking for the vision task. Initially, a transformer is used in a natural-language processing (NLP) field. It uses an acyclic network structure, calculating with an encoder–decoder and a self-attention mechanism [15] to achieve the best performance for machine translation. The successful application of a transformer in the field of NLP has caused scholars to begin to discuss this structure and to test its application in the field of computer vision. Some backbones using a transformer structure, such as ViT [16] and the Swin Transformer [17], instead of convolution, have been proved to have better performance than CNN. Transformers exchange information in a local range, which can rapidly expand the effective receptive field of features.
However, there are two main problems to be addressed in using transformers as backbones in SAR ship detection. First, the background of off-shore SAR-detected ship images is very simple, so the global relation modeling mechanism in a transformer will correlate some redundant background information. In addition, inshore SAR-detected ships are similar to the coast, with blurred contour, which makes it difficult to distinguish ship targets from background. The features extracted by a transformer need to be rebuilt with more object details to focus on SAR-detected ship targets with similar backgrounds.
Therefore, in this paper, we propose a backbone with a local-sparse-information-aggregation transformer and a contour-guided shape-enhancement module. First, we introduce the Swin Transformer as the basic backbone architecture. In order to effectively aggregate the sparse meaningful cues of small-scale ships, a deformable attention mechanism is incorporated to change the original self-attention mechanism by generating a data-dependent offset and sampling more meaningful keys for each query. As for the problem of the cyclic-shift in the SW-MSA of the Swin Transformer causing error attention calculation, we adopt a sampled query to acquire exchanged information of adjacent windows. Second, we take the fully convolutional one-stage object detector (FCOS) framework as the basic detection network. In order to enforce the contour constraints on a transformer, the shallowest feature of FPN is input into the contour-guided shape-enhancement module. Then, the enhanced feature is incorporated into the detection head of the FCOS framework to obtain the detection results.
The main contributions of this paper are summarized as follows:
  • Aiming at the problem of SAR detection for ships of small scale, we propose a local-sparse-information-aggregation transformer as the backbone, based on Swin Transformer architecture. It can effectively fuse meaningful cues of small ships by the sparse-attention mechanism of deformable attention.
  • When replacing the self-attention mechanism with the deformable attention mechanism, a data-dependent offset generator is incorporated to obtain more salient features for small-scale SAR-detected ships
  • To better enhance the SAR-detected ships with blurred contour in the features extracted by the transformer and to distinguish them from interference, we propose a contour-guided shape-enhancement module for explicitly enforcing the contour constraints on the one-dimensional transformer architecture.

2. Related Work

2.1. CNN-Based SAR Object Detection Method

CNN-based SAR object detection has achieved significant results. Dai et al. [18] fused adjacent-feature layer information to make full use of semantic and spatial information to improve the detection performance for small targets. Simple features were fused in the feature layer after fusion; small objects still only responded in a small area, and there were still missed detections and false alarms for weak targets or low-intensity targets. In response to this problem, Kang et al. [19] increased the resolution of the network by fusing an intermediate layer, a downscaled shallow layer, and an up-sampled deep layer to generate region proposals, increasing the spatial resolution of the RPN to the same level as the intermediate layer and expanding the response area for small ships in the feature map. Chen et al. [20] deployed a forward connection block from shallow features to mid-level features and a reverse connection block from deep features to conv7_2 in the base network, which was connected with the original-feature con7_2 to generate enhanced intermediate feature layers. Li et al. [21] proposed an improved Faster R-CNN method for ship detection, adding a feature-fusion module to the network and using strategies such as migration learning and hard-case mining to improve accuracy. Zhao et al. [22] proposed a dilated attention block to enhance the feature-extraction capability of the detector.
With the rapid development of target detection technology, many SAR-image target-detection technologies begin to apply the anchor-free method. Fu et al. [23] proposed an anchor-free method with an attention-guided balanced pyramid and a feature-refinement module to balance and enhance multiple features. This method directly learned the encoded bounding boxes, which eliminated the effect of anchors. Hu et al. [24] proposed an anchor-free framework based on a balance-attention network (BANet) to balance local features and nonlocal features. This method had good performance with respect to accuracy and generalization ability for multiscale ship detection. Ma et al. [25] proposed an anchor-free framework with skip connections and aggregation nodes, based on key-point estimation and an attention mechanism. This method eliminated false alarms when detecting multiscale and dense ship targets in complex inshore scenes. Xiao et al. [26] utilized a power-based convolution block and a feature-alignment block with an anchor-free framework to suppress speckle noise to enhance the ship targets. Niu et al. [27] presented an anchor-free encoder–decoder model with estimated ship direction, which weakly supervised and benefitted ship detection. Cui et al. [28] introduced the spatial shuffle-group enhanced (SSE)-attention module into CenterNet to detect ships in large scale. SSE can suppress some noise to reduce false positives that are caused by inshore and inland interferences.

2.2. Object Detection with Transformer

As a feature extractor, a transformer network has a larger receptive field and more flexible representation than CNN. Some works have proved that using a transformer in feature extraction is effective for object detection. PVT [29] (based on hierarchical structure design), CMT [30] (based on the fusion of convolution and transformer), Cross Former [31], Conformer [32] (based on local-global interaction), and the Swin Transformer (based on local window design) have all been successfully applied to typical target-detection networks, such as RetinaNet [33], Mask R-CNN [34], Cascade R-CNN [35], ATSS [36], RepPoints-v2 [37], and Sparse RCNN [38]. Compared with a convolutional neural network, such as ResNet, the transformer network has achieved better results. This method is based on the typical target-detection process, using the transformer as a new feature learner to replace the original convolutional neural network backbone, so as to complete the target-detection task.
Other works have combined the CNN model with a transformer structure, or inserted the self-attention module of transformers into the CNN network to enhance it. The self-attention layers can complement backbones [39,40] or head networks [41,42] by providing the capability to encode distant dependencies or heterogeneous interactions. More recently, the encoder–decoder design in transformers has been applied for object-detection and instance-segmentation tasks. DETR [43] first extracts image features through an encoder, then uses a randomly initialized target-query mechanism to interact with image features and a mutual-attention mechanism to extract target-level information. The information of the target is predicted from each target query to form the detection result.
In order to improve the problem of slow convergence of DETR, TSP [44] uses the CNN network to generate the initial target query, and learns from FCOS and RCNN [45], respectively, the proposed TSP-FCOS and TSP-RCNN to estimate the target information in the image; it uses the transformer encoder to optimize the target estimation. Efficient DETR [46] used the token features learned by the transformer-based encoder network. Dense prediction is performed to obtain the position, size, and category information of possible targets at the corresponding position, and the result with higher confidence is selected as the initial state of the target query; then, the decoder is used to perform sparse prediction to obtain the final result. Deformable DETR [47] and SMCA [48] predict the coordinates of the reference point corresponding to each query from the target query to improve the localization ability. Conditional DETR [49] uses the target query to predict the two-dimensional coordinate information and uses content embedding to learn the transformation of the coordinate-embedding information that identifies the position embedding and content embedding in the unified space; then, it identifies the target query and the key value in the unified space, thereby improving the similarity of the discrimination and positioning ability.
There are also some methods using transformers in SAR ship detection. Zha et al. [50] proposed a multi-featured transformation and fusion method for SAR ship detection. It can pass the low-level feature information to a high level and obtain rich contextual information via an improved transformer structure. Qu et al. [51] introduced a transformer-encoder module into an anchor-free model to focus on the contextual relationship between the target object and the global image and to enhance the dependence between ship targets. In addition, the mas- guide feature in that article was used to highlight the positions of the target in the feature map.
We also found some novel methods using the ransformer structure for object detection in fields other than SAR object detection. Zhou et al. [52] proposed a new algorithm for anchor-free small object detection, which uses the channel-attention module and the transformer as the spatial-attention module to help the network efficiently obtain global information. Cheng et al. [53] proposed an effective anchor-free model with a transformer-attention mechanism that was integrated to enhance the representation ability of the network.

3. Proposed Method

A fully convolutional one-stage object detector (FCOS) is an efficient anchor-free method in object detection, and the Swin Transformer has proved its effectiveness as a backbone in object detection. However, we found that when FCOS uses the Swin Transformer backbone in an SAR ship dataset, its precision declines. Therefore, in this paper, we propose a local-sparse-information-aggregation transformer block with the FCOS detection model to cause the feature to focus on more relevant information and a shape-enhancement module to enhance the ship in the feature. The overall framework is shown in Figure 1.

3.1. Local-Sparse-Information-Aggregation Transformer

Because the SAR image does not have as much color information as the optical image, the background information will be relatively simple. If the transformer is directly applied to the SAR image, its global long-distance-attention mechanism may be associated with some redundant information. This will lead to a sharp increase in the amount of network computation and a slower convergence speed, and the target information of small ships in the single background of off-shore SAR images will be more easily submerged, resulting in a large number of missed detections of small targets. Therefore, we consider adopting the window-based self-attention method proposed in the Swin Transformer, which focuses on the correlation between local parts. This mechanism reduces the amount of calculation and suits the inherent characteristics of SAR ship detection.
On this basis, we noticed that the Swin Transformer has already achieved good performance on the object detection task via its novel design. In order to further reduce redundant information in the window to improve the detection ability for small ships, we applied the deformable attention in deformable DETR to the window-attention calculation. This attention mechanism uses sparse calculation to speed up the convergence speed of the original DETR detection network. The attention calculation at the head level allows the query to sparsely associate fewer keys and reduce computational redundancy. Of course, if this mechanism is directly applied to the transformer backbone network, the features extracted by the backbone network will be insufficient, due to too little associated information. Therefore, we thought it is more reasonable to add this attention-calculation mechanism to the window of the Swin Transformer and we proposed the local-sparse-information-aggregation transformer based on the above analysis.

3.1.1. Standard Swin Transformer

The Swin Transformer is proposed to overcome the significant challenges in transferring the high performance of transformers in the language domain to the visual domain and to expand the applicability of transformers for computer vision. As shown in Figure 2a, the architecture of the Swin Transformer is very similar to the CNN. The Swin Transformer consists of four stages, each of which is a similar repeating unit. As in ViT, the size of the input image is H × W × 3;if the patch partition module divides it into a non-overlapping patch of 4 × 4, then the feature dimension of each patch is 4 × 4 × 3 = 48, and the number of patch blocks is H/4 × W/4. In the stage 1 part we first convert the feature dimension into C via a linear-embedding layer, and then send it to the Swin Transformer block. Stages 2 to 4 operate in the same way as stage 1. They merge the input according to 2 × 2 adjacent patches via a patch-merging module. The number of patch blocks becomes H/8 × W/8, and the feature dimension becomes 4C. Patch merging is an operation similar to pooling. Pooling takes the maximum or average value in a small window, so that it will lose information. However, patch merging takes the value of the same position in each small window and spells it into a new patch, then contacts all the patches so that patch merging will not lose information.
When existing transformer-based models are used for some vision tasks operating at the pixel level, the computational complexity of its self-attention is quadratic to image size, so the Swin Transformer has achieved the linear computational complexity by computing self-attention locally within non-overlapping windows. The number of patches in each window is fixed; thus, the complexity becomes linear to the image size. The structure of the Swin Transformer block is shown in Figure 2b; it is basically similar to the transformer block. The difference is that the multi-head self-attention (MSA) is replaced by the window multi-head self-attention(W-MSA) and the shift window multi-head self-attention (SW-MSA). These elements are described in detail below.
W-MSA performs the transformer operation in a small window. Due to the locality of the visual task itself, the transformer can pay attention to all pixels, which will cause redundancy. The local part is enough for a SAR-detected ship in the picture, W-MSA takes this into account and allows the transformer to operate in fixed-sized windows.
On the other hand, a window transformer can save resources. For an image with h   ×   w patches, its MSA computational complexity is as follows:
Ω MSA = 4 h w C 2 + 2 h w 2 C
For the computational complexity of W-MSA, assume that each window contains M × M patches. The computational complexity of each window is expressed by Equation (1). With a total of ( h /M) × ( w /M) windows, the computational complexity of WMSA is as follows
Ω W MSA = 4 h w C 2 + 2 M 2 h w C
Although W-MSA reduces the computational complexity, it lacks an information exchange between non-overlapping windows. Shifted window partition can solve the problem of information exchange between different windows. W-MSA and SW-MSA alternate in two consecutive Swin Transformer blocks.
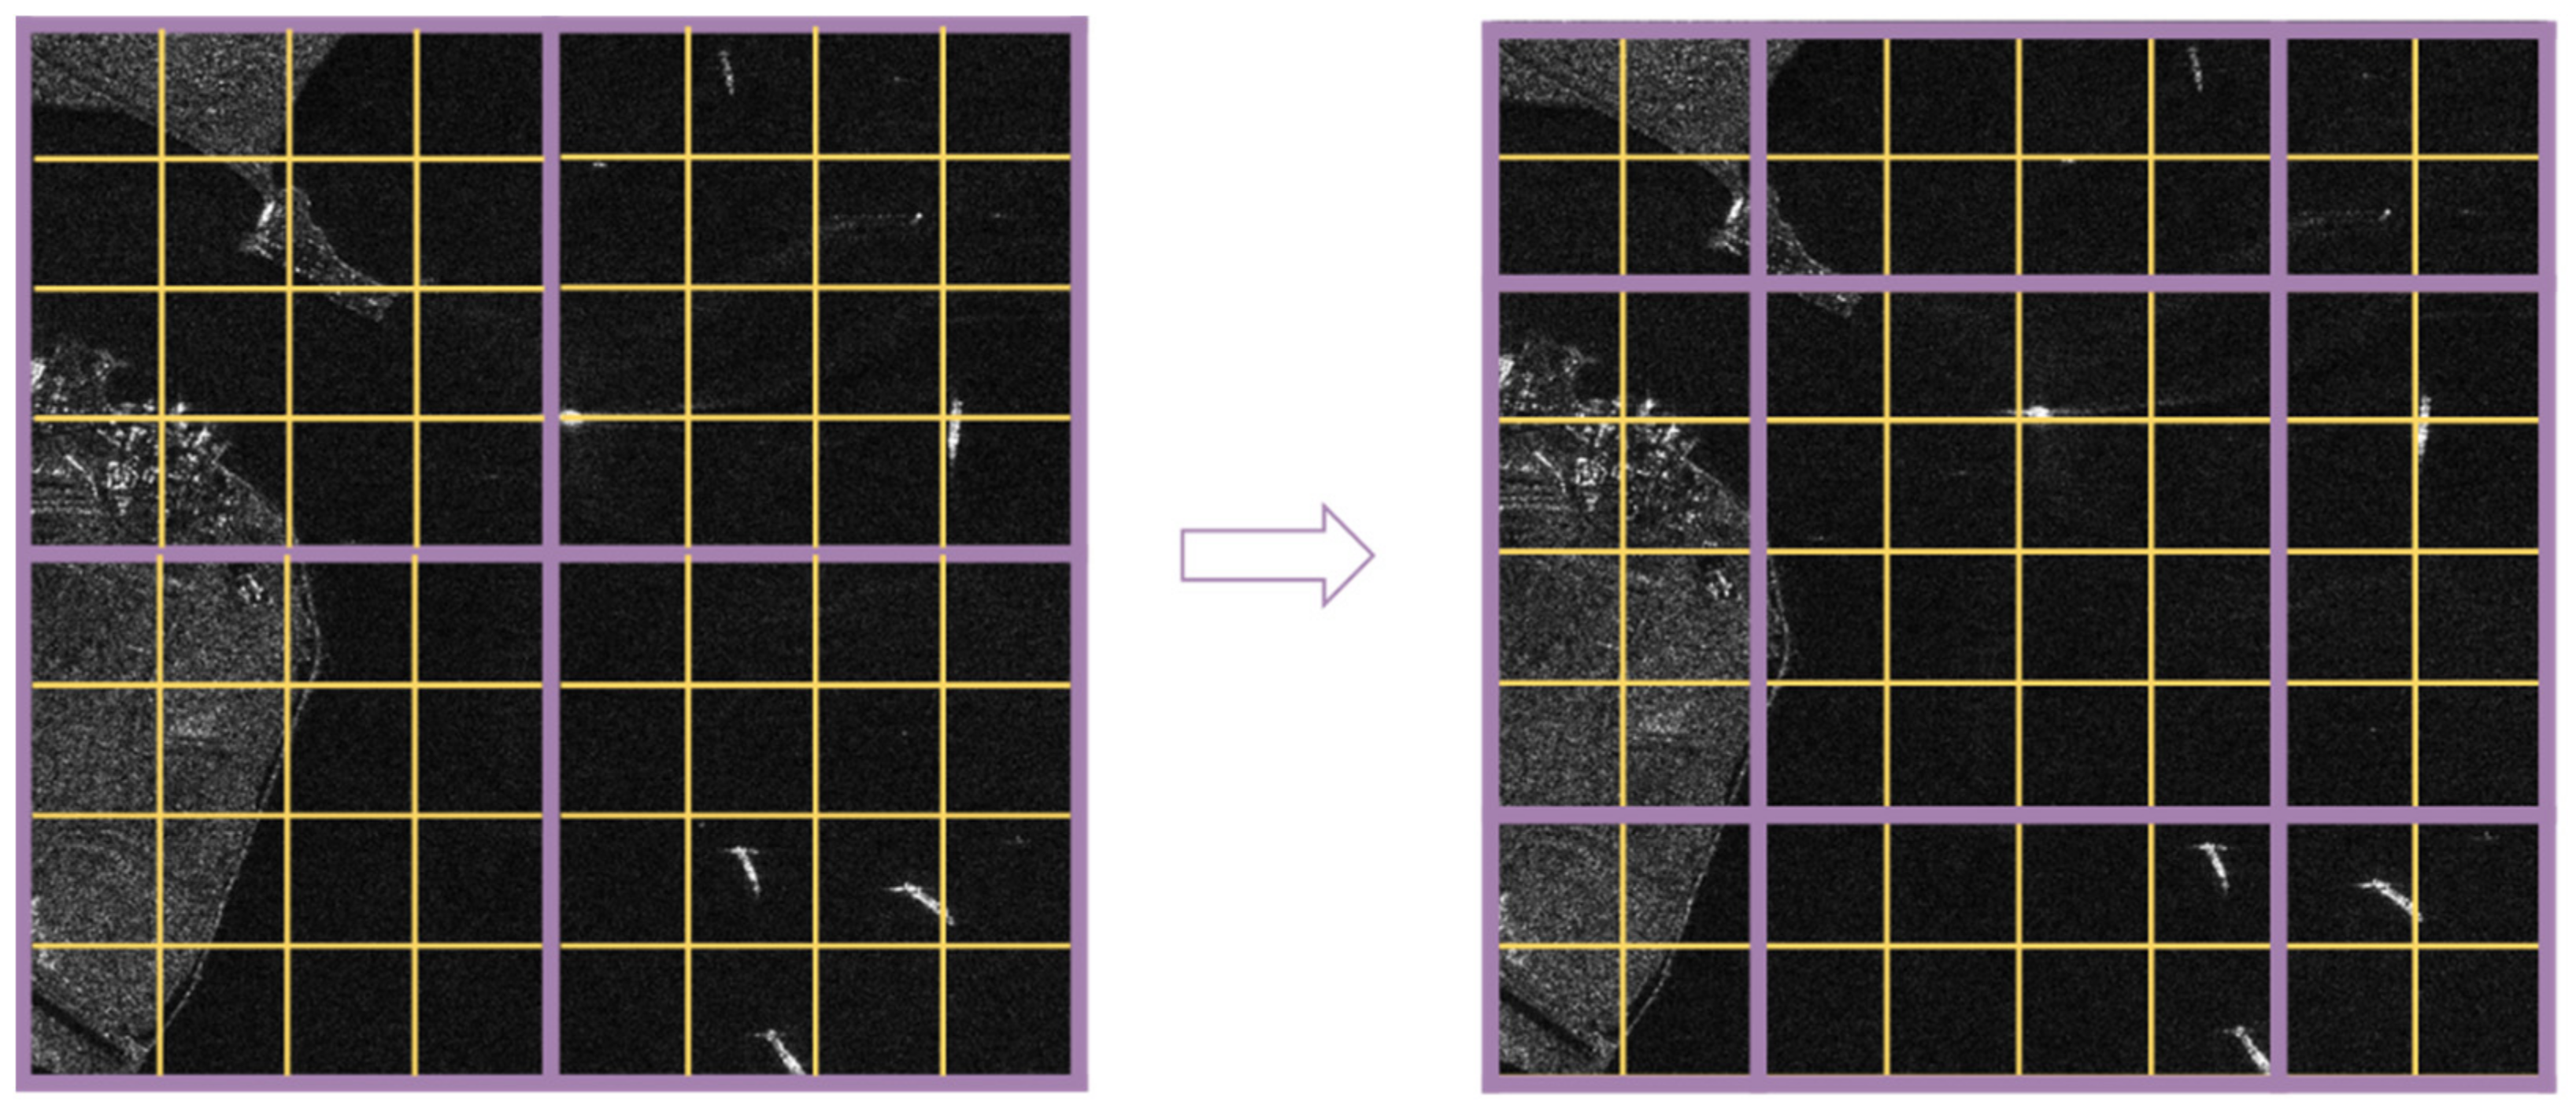
As shown in Figure 3, SW-MSA divides the 8 × 8 size feature map of the previous layer of the Swin Transformer block into 2 × 2 patches, and each patch is 4 × 4 in size. Then, the window position of the next layer of the Swin Transformer block is moved to obtain 3 × 3 non-overlapping patches. The division method of the shift windows introduces connections between adjacent non-overlapping windows in the upper layer, which greatly increases the receptive field.
However, the shifted window division method also introduces another problem. More windows will be generated and some of the windows are smaller than ordinary windows. As shown in Figure 3, the number of patches is changed from 2 × 2 to 3 × 3. The number of windows has more than doubled. Therefore, the cyclic shift along the upper-left direction can solve this problem. After shifting, a batched window consists of several sub-windows with non-adjacent features, so a masking mechanism is used to limit the self-attention calculated within a sub-window. After the cyclic shift, the number of batched windows and regular windows remain the same, which greatly improves the computational efficiency of the Swin Transformer.
Therefore, the features obtained by the Swin Transformer are 4×, 8×, 16×, and 32× down-samplings of the original image. With these hierarchical feature maps, the structure of the Swin Transformer can conveniently leverage advanced techniques for a dense prediction, such as feature pyramid networks (FPN) [10].
The linear computational complexity and the hierarchical structure make the Swin Transformer suitable as a general-purpose backbone for various vision tasks, in contrast to previous transformer-based architectures that produce feature maps of a single resolution with quadratic complexity. Experiments haven show that the Swin Transformer achieves strong performance in the recognition tasks of image classification, object detection, and semantic segmentation. It outperforms the ViT/DeiT [16,54] and ResNe(X)t models [55,56] significantly, with similar latency on the three tasks.

3.1.2. Deformable Attention Module in Deformable DETR

For the calculating mechanism of self-attention, query and key are all of the pixels in the image. Every query is a weighted sum with all keys. This approach generates some redundant information. Referring to the sparse calculation mechanism in CNN, deformable DETR proposes deformable attention. It can make the calculation of the attention mechanism focus more on the effective information, so that the amount of calculation is reduced and the convergence speed of the model is accelerated.
M u t i H e a d A t t n z q , x k = m = 1 M W m k Ω k A m p k W m x k
D e f o r m A t t n z q , p q , x = m = 1 M W m k = 1 K A m p k W m x k p q + Δ p m q k
Formulas (3) and (4) are the formulae for self-attention and deformable attention, respectively. In the self-attention module, k Ω k which means to consider all keys. In deformable attention, k 1 , K   K H W , which means only a small part of the keys is considered. Every query is sampled only K times, and only K keys need to be considered. In self-attention, N k are the numbers of x k . x k is taken, respectively, to be the weighted sum. In deformable attention, x C × H × W and p q is any point on the 2D space of x . First, add the point to a 2D real value Δ p m q k ; then, obtain a point of the new feature map via bilinear interpolation.
For each query, all positions are used as keys when focusing on all spatial positions. Deformable attention uses less positions and a fixed number of positions as keys, focusing on more meaningful positions that the network considers to contain more local information and alleviating the problem of the large computational complexity that is caused by large-feature maps.
The calculation process of deformable attention is shown in Figure 4. We assumed that the dimension of the input feature is ( N q , C). The feature (I) is multiplied by the corresponding transition matrix to obtain the offset matrix of the reference points ( Δ x , Δ y ), whose dimension is ( N q , M K , 2 ) with attention weights matrix A, whose dimension is ( N q , M K ). The value matrix is obtained by multiplying the input feature (I) by the transition matrix, and the dimension is ( N q , M , C ). The reference points and the offset are added to obtain the position of the sampling points on the value matrix. Then, the value matrix samples the keys (K) for every query in the M heads, and the dimension obtained after sampling is ( N q , M , K , C ). The attention weights matrix is also divided into a matrix of dimension ( N q , K ), according to the number of heads, M. Each row and a set of ( K , C ) in the value matrix are a weighted sum; finally, the M heads are spliced together to obtain an output dimension of ( N q , C ). It can be seen that the deformable attention is not obtained by the dot-product of the query-and-key matrix, but is obtained directly from the input feature (I) through linear transformation, which avoids the huge amount of calculation caused by the dot-product for all q and k numbers. The computational complexity of Deformable attention is as follows:
Ω Deformable   attention = N q C 2 + min H W C 2 , N q K C 2 + 5 N q K C + 3 N q C M K
The division-window calculation of self-attention in the Swin Transformer block realizes the conversion from global to local calculation, reducing the extra calculation amount caused by redundant information. In order to further reduce the redundant information in the window, we used deformable attention in the window of the W-MSA module. This module was added to the detection head in deformable DETR, and all keys with less global attention did not produce greater accuracy. However, if it was directly applied to the backbone, due to the large loss of information, the extracted features would be biased; therefore, paying attention to a certain number of keys in each window can reduce this loss. The W-MSA module and deformable attention combined applications achieved a trade-off of accuracy and speed.
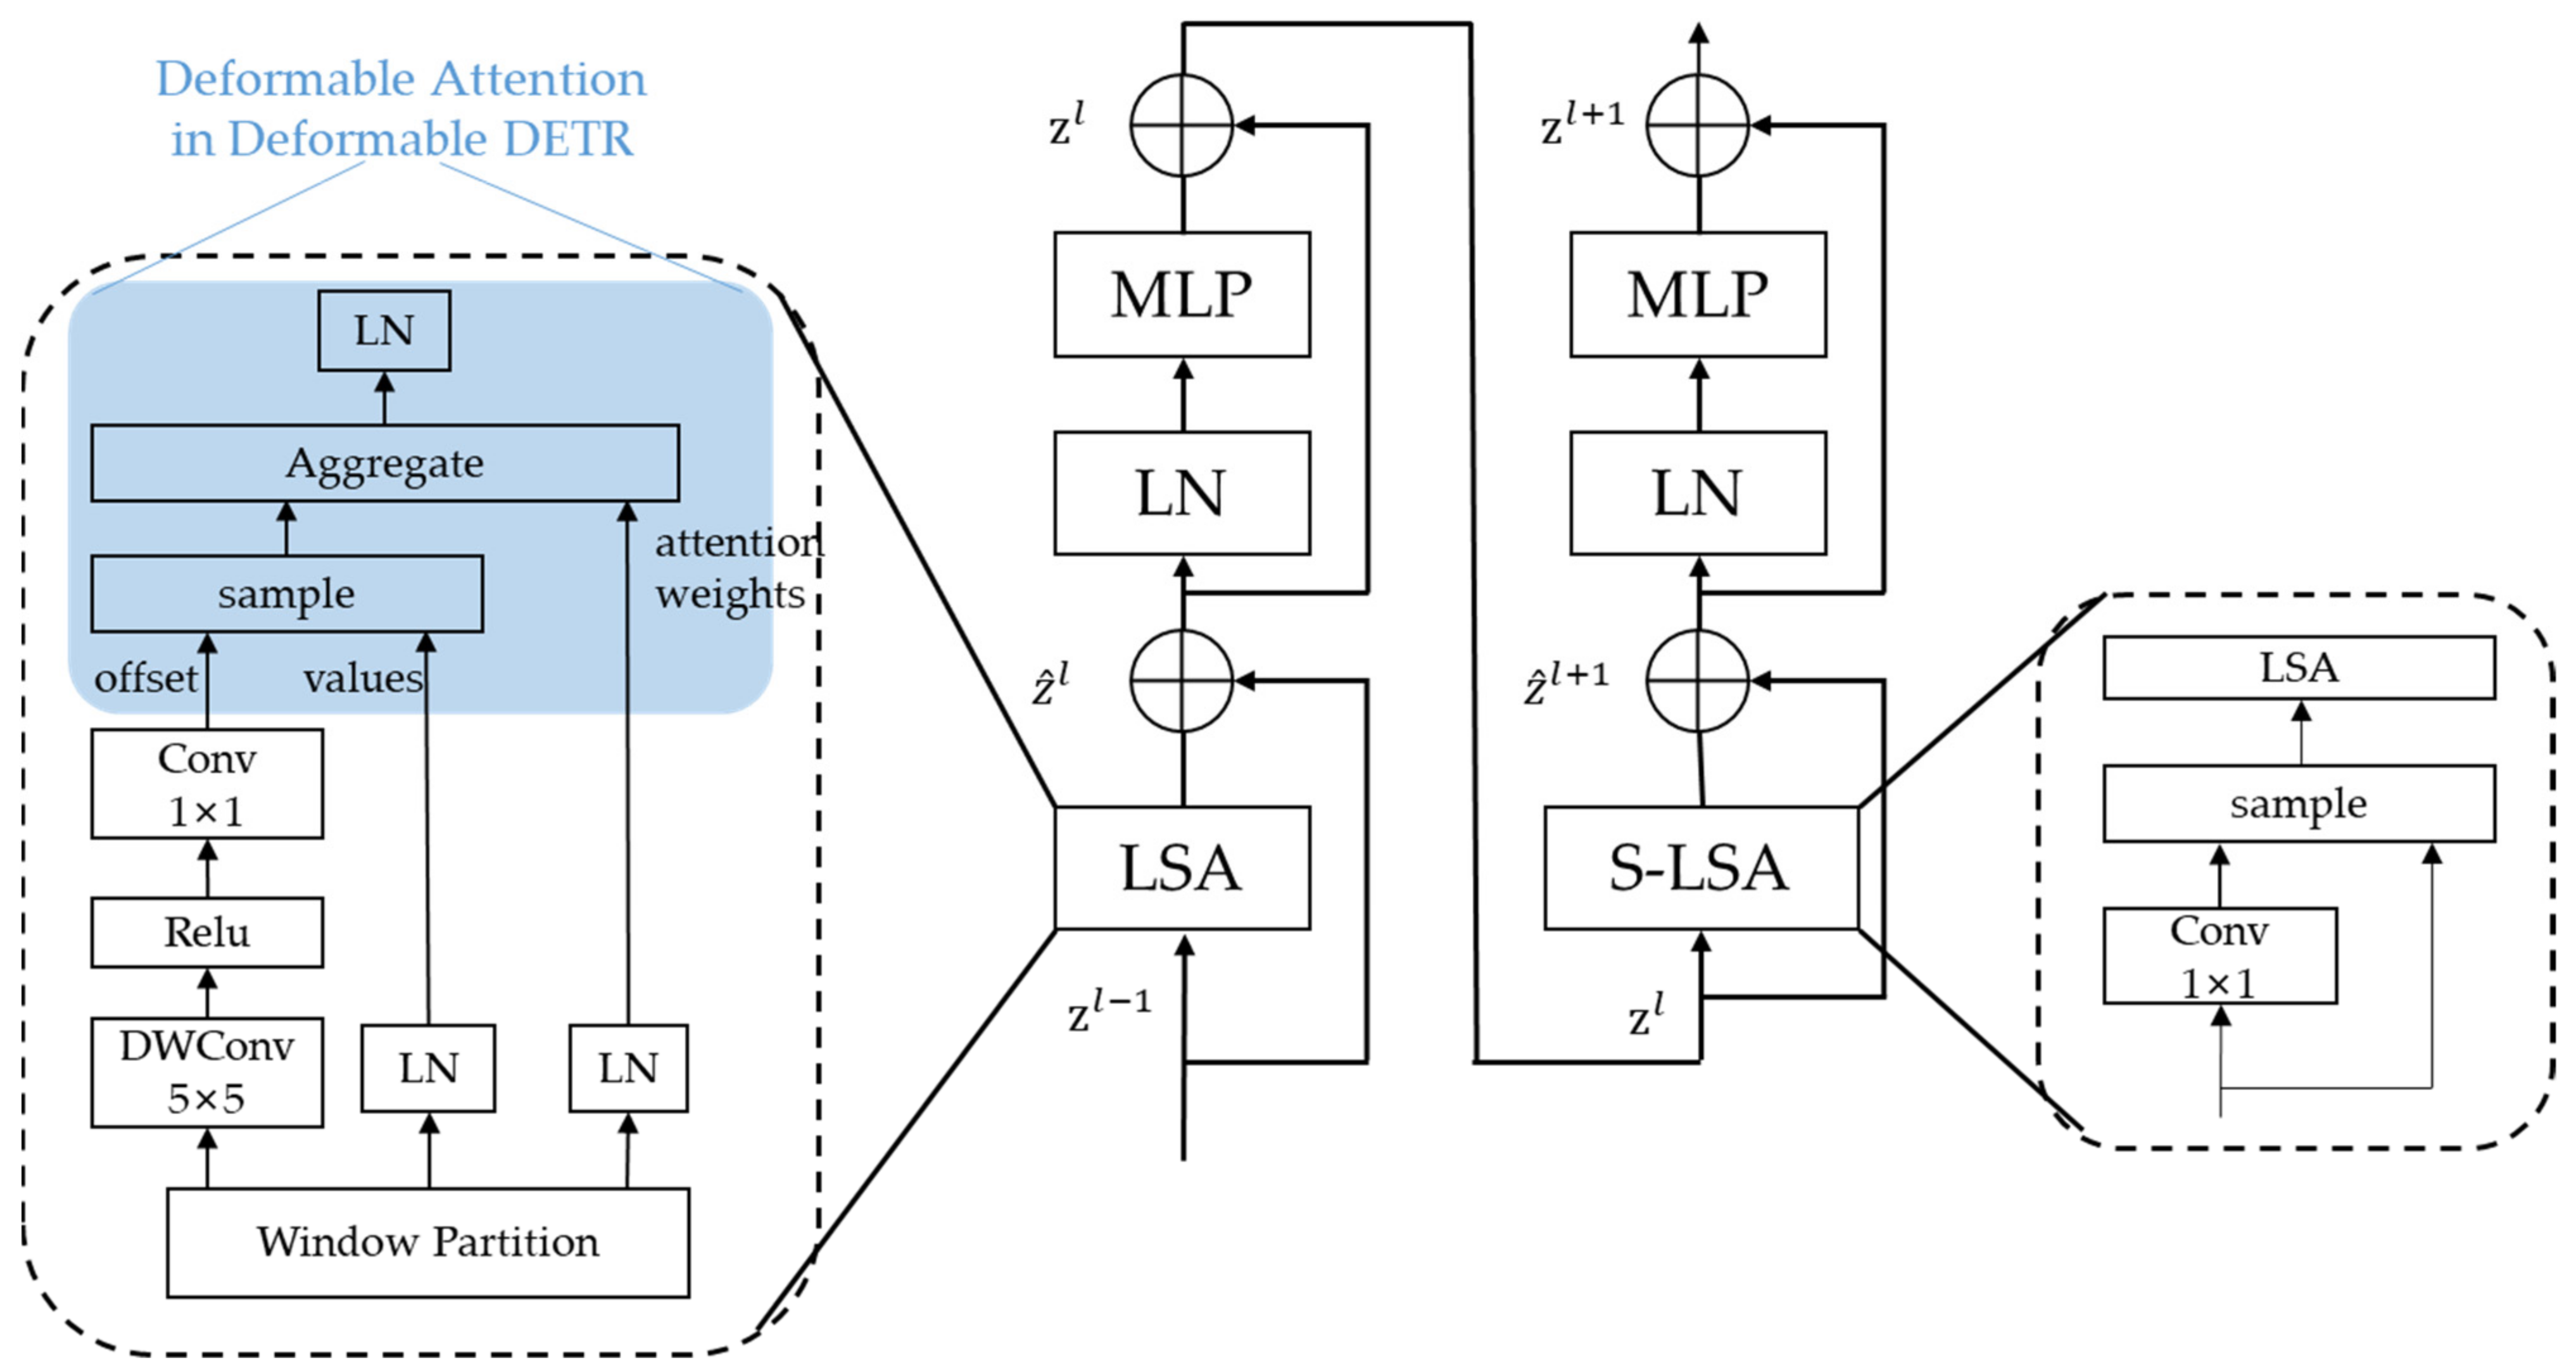
The structure of the local-sparse-information-aggregation transformer is shown in Figure 5. In the branch of generating the offsets of reference points, a combination of 5 × 5 depth-wise convolution, RELU, and 1×1 Conv compress the channel dimension of the input feature to 2; i.e., Δ x and Δ y of the prediction offsets, respectively. In addition, in the branch of generating attention weights, linear transformation was used for the input feature. The computational complexity of the local-sparse-information-aggregation module is as follows:
Ω L S A = 2 H W C 2 + 25 H W C + 5 H W K C + H W C M K
Due to the lack of connection between the windows, the SW-MSA method was proposed in the Swin Transformer to solve this problem. The deformable attention cannot be directly embedded in this module because the cyclic shift would cause the irrelevant parts to be used to calculate the deformable attention, thus producing an error. Therefore, in order to create a connection between each window, the input query was resampled. The query-sampled module performed data-dependent bilinear interpolation sampling on the query before dividing the window, and used the same method as for the W-MDA to generate the reference point and offset for sampling the query; therefore, the sampled query fused the information of the surrounding pixels. The sampled query then calculated the deformable attention in the window. This method increased the information exchange between the current window and the surrounding windows.

3.2. Shape Enhancement Module

3.2.1. FCOS Detection Head

In this paper, the structure of an anchor-free detection method, FCOS, was adopted. The features extracted by the backbone were fused through the FPN structure to obtain multiscale features, named P1, P2, P3, P4, and P5. The features of each scale were the output through the same detection head. Each point on the feature was considered to be an anchor point, and all anchor points needed to be divided into positive and negative samples. In FCOS, the anchor points inside the ground-truth bounding box that met the corresponding feature scale regression range were used as positive samples, and the rest were used as negative samples.
The structure of the detection head consisted of two branches, one for predicting classification and center-ness, and the other for regression. In the branch of classification, the concept of center-ness was introduced, calculated as Formula (5). Each anchor point on the feature map predicted a center-ness. The center-ness was multiplied by the classification score predicted by the anchor point. Thereby, the classification score predicted by the anchor points farther from the target center were reduced, and the performance of model was improved.
c e n t e r n e s s * = min l * , r * max l * , r * × min t * , b * max t * , b *

3.2.2. The Contour-Shape-Enhancement Module

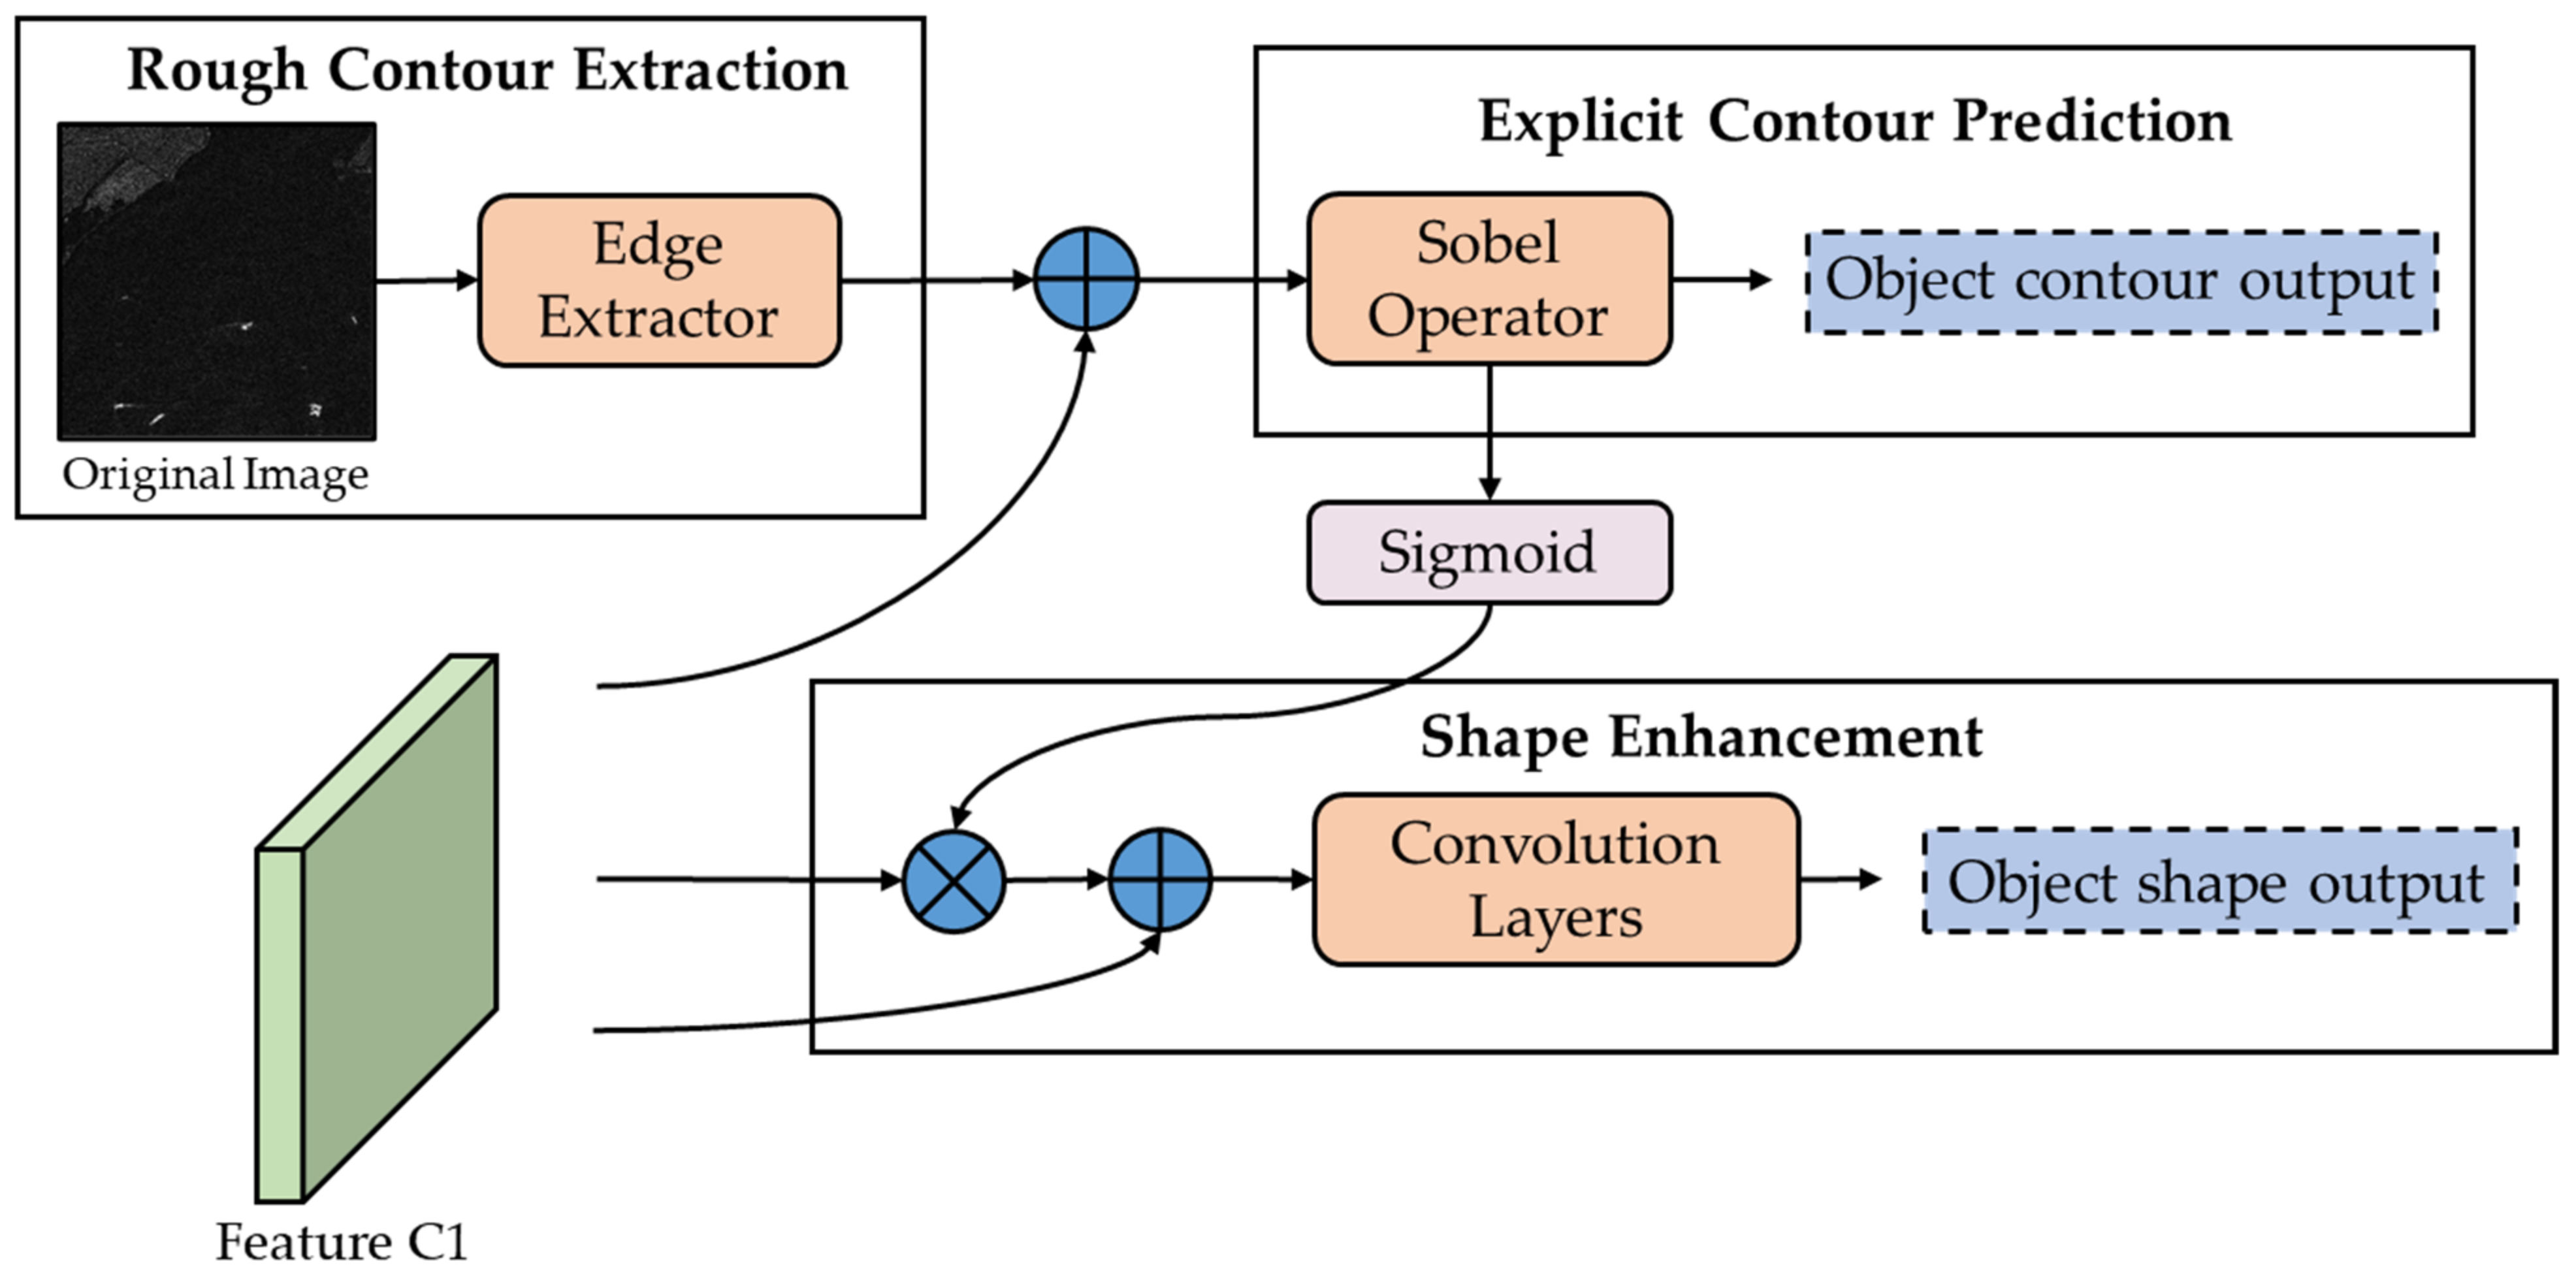
The contour-shape-enhancement module is shown in Figure 6. First, the canny operator was used inside the bounding box part of the image to obtain the rough extraction edge of the target. The part of the image outside the bounding box was set to 0, and the result was a rough-contour image of the target. The feature P1 of the FPN was interpolated to the same size as the input image; then, the feature-enhancement module was input. In the feature-enhancement module, the input feature and the target’s rough-contour image were first fused to calculate the two-dimensional gradient. The result was the predicted contour that input two branches: one branch directly calculated the contour loss between the predicted contour and the ground truth; the other branch normalized the predicted contour by sigmoid. Each point of the predicted contour corresponded to weighted corresponding pixel in input feature. The weighted feature generated the predicted object shape’s binary image through two convolutional layers. This module caused the contour information in the feature to be enhanced. It aggregated and enhanced the rich contour information from different layers to improve the contrast between the target and the background, and also provided a foundation for extracting shape information via mathematical interpretation.

3.2.3. Loss Function

The loss function of the contour-shape-enhancement module was divided into two parts: one was shap- enhancement loss; the other was contour-enhancement loss.
As shown in Formulas (6) and (7), the shape-enhancement loss consisted of binary classification loss and dice loss. It added the two losses with different weights. y i was the truth pixel value of the shape and p i was the probability of the i -th pixel being classified as a shape pixel. In contrast, 1 y i was the truth pixel value of the background and 1 p i was the probability of the i -th pixel being classified as the background pixel. α determined the weights of the two losses. In this paper, we set it to 0.5.
L o s s s e = α 1 N i = 1 N y i log p i + 1 y i log 1 p i 1 α L o s s D i c e
L o s s D i c e = 1 i = 1 N p i y i + ϵ i = 1 N p i + y i + ϵ i = 1 N ( 1 p i ) 1 y i + ϵ i = 1 N 2 p i y i + ϵ
The contour enhancement loss was defined as follows:
L o s s c e = 1 N n = 1 N w c y i log p i + 1 y i log 1 p i
where w c = N N c N , N c is the number of the pixels of contour ground truth. This is a weighted binary cross-entropy loss. The weight coefficient penalizes the model if the contour pixels are wrongly predicted; the points in the contour part can obtain a larger loss, meaning that the model will pay more attention to learning the contour.

4. Experiments

To better evaluate our proposed method, experiments were implemented on public SAR-detected ship datasets: HRSID and SSDD. In this section of the paper, we report on an ablation study using the dataset HRSID to prove the effectiveness of the components of the local-sparse-aggregation transformer and contour-guided shape-enhancement module. We studied the comparison between the proposed method and the current methods on the HRSID and SSDD dataset.

4.1. Datasets and Settings

4.1.1. HRSID Dataset

The original SAR imageries for constructing the HRSID dataset were 99 Sentinel-1B imageries, 36 TerraSAR-X, and 1 TanDEMX imageries. The resolution of SAR images was under 3 m to keep the feature of the ships detailed and accurately represented. One hundred and thirty-six SAR imageries with resolution under 5 m were cropped to 5604 SAR images with 800 × 800 pixels. There were 16,951 ships in it, and 65% of the SAR images were divided into the training set; the remaining 35% of the images were used for the test dataset. We used the same labeling format as is used in the Microsoft Common Objects in Context (MS COCO) dataset.

4.1.2. SSDD Dataset

The SSDD dataset was the first dataset dedicated to ship target detection in SAR images. It contains the images from RadarSat-2, TerraSAR-X, and Sentinel-1 sensors, with multiscale and multi-scene ship targets in both large sea areas and near-shore areas. The dataset covers four polarization modes, with a resolution of 1 m to 15 m. It contained 1160 images and 2456 ships, of which the training set included 928 images and the other 232 images were in the test set. The format of the annotations was MS COCO.

4.1.3. Settings

Our hardware platform was a TITAN RTX GPU with 24 GB, based on the mm detection framework, and an Ubuntu 18.04 operating system with PyTorch1.6.0 and CUDA10.1. Our model was trained with stochastic gradient descent (SGD) for 200 epochs, with a total of two images per minibatch. The initial learning rate was set at 0.0025. We used the weight decay of 0.0001 and the momentum of 0.9. To enhance the dataset, we used data augment RandomFlip in mmdet to train the model. The HRSID dataset remained the size of 800 × 800 to input the network. The original sizes of the SSDD ranged from 200 to 500 and we resized them into 800 × 800 in our experiment. The shape enhancement loss weight α was set to 0.5.

4.2. Evaluation Metrics

We used the AP50 and AP75 in the evaluation metrics of MS COCO to analyze the detection results. AP is defined by precision and recall. Precision refers to the proportion of correctly detected ships in all detection results, and recall refers to the proportion of correctly detected ships in all ground truth. The precision and recall are defined by Equations (9) and (10), respectively.
P r e c i s i o n = T P T P + F P
R e c a l l = T P T P + F N
where TP means true positives and denotes the number of correctly predicted positive samples, FP is false positive and indicates the number of negative samples falsely predicted as positive samples. FN means false negatives and represents the amount of missing positive samples. A detection result was regarded as a true positive when its IoU with the ground truth was higher than a certain IoU threshold.
Based on the different confidence threshold, the precision-recall (PR) curve was drawn. AP was calculated by the area under the PR curve, as shown in Equation (11).
A P = 0 1 P r d r
where r represents recall value and P represents the corresponding precision. In the evaluation metrics of MS COCO, there are AP values under different IoU threshold settings and objects sizes. AP50 is calculated under an IoU threshold of 0.5, which is the same as evaluation metrics of Pascal VOC. AP75 is a stricter metric of IoU thresholds, which denotes the calculation under an IoU threshold of 0.75.

4.3. Ablation Study

4.3.1. Study for Local-Sparse-Information-Aggregation Transformer

To prove the effectiveness of the proposed transformer backbone, we compared the local-sparse-information-aggregation transformer with the original Swin Transformer on the FCOS detection framework. The results are shown in Table 1. The proposed transformer backbone can improve precision by 3.43%, recall by 2.7%, AP50 by 2.1%, AP75 by 6.4%, and F1 by 3.05%. Thus, the proposed backbone is effective in SAR ship detection and optimizes the overall performance of the model.
To further study the influence of the module in a local-sparse-information-aggregation transformer, we added the deformable attention, an offset generator, and a sampled query into the Swin Transformer block, successively. The results are shown in Table 2. We mainly compared the commonly used indicator AP50. After adding the deformable attention obtained by linear transformation, the AP50 dropped by 0.3%, which showed the indiscriminateness of this sparse attention mechanism in calculation, cutting both redundant information and target information, which may have had a certain impact on the performance of the backbone-extracting features. Meanwhile, the false association caused by the shift cyclic also had an impact. On this basis, adding an offset generator composed of a convolutional layer increased the AP50 by 1.3%, which showed that the convolutional layer can extract offsets that are more dependent on the input target, so that the transformer can pay more attention to meaningful information when sampling the keys. We also replaced the shift-cyclic operation in SW-MSA with the sampled query, which improved the AP50 by 0.7%; this showed that the sampled query can reduce the error calculation caused by the shift-cyclic to some extent, but at the same time it may reduce the correlation between different windows.
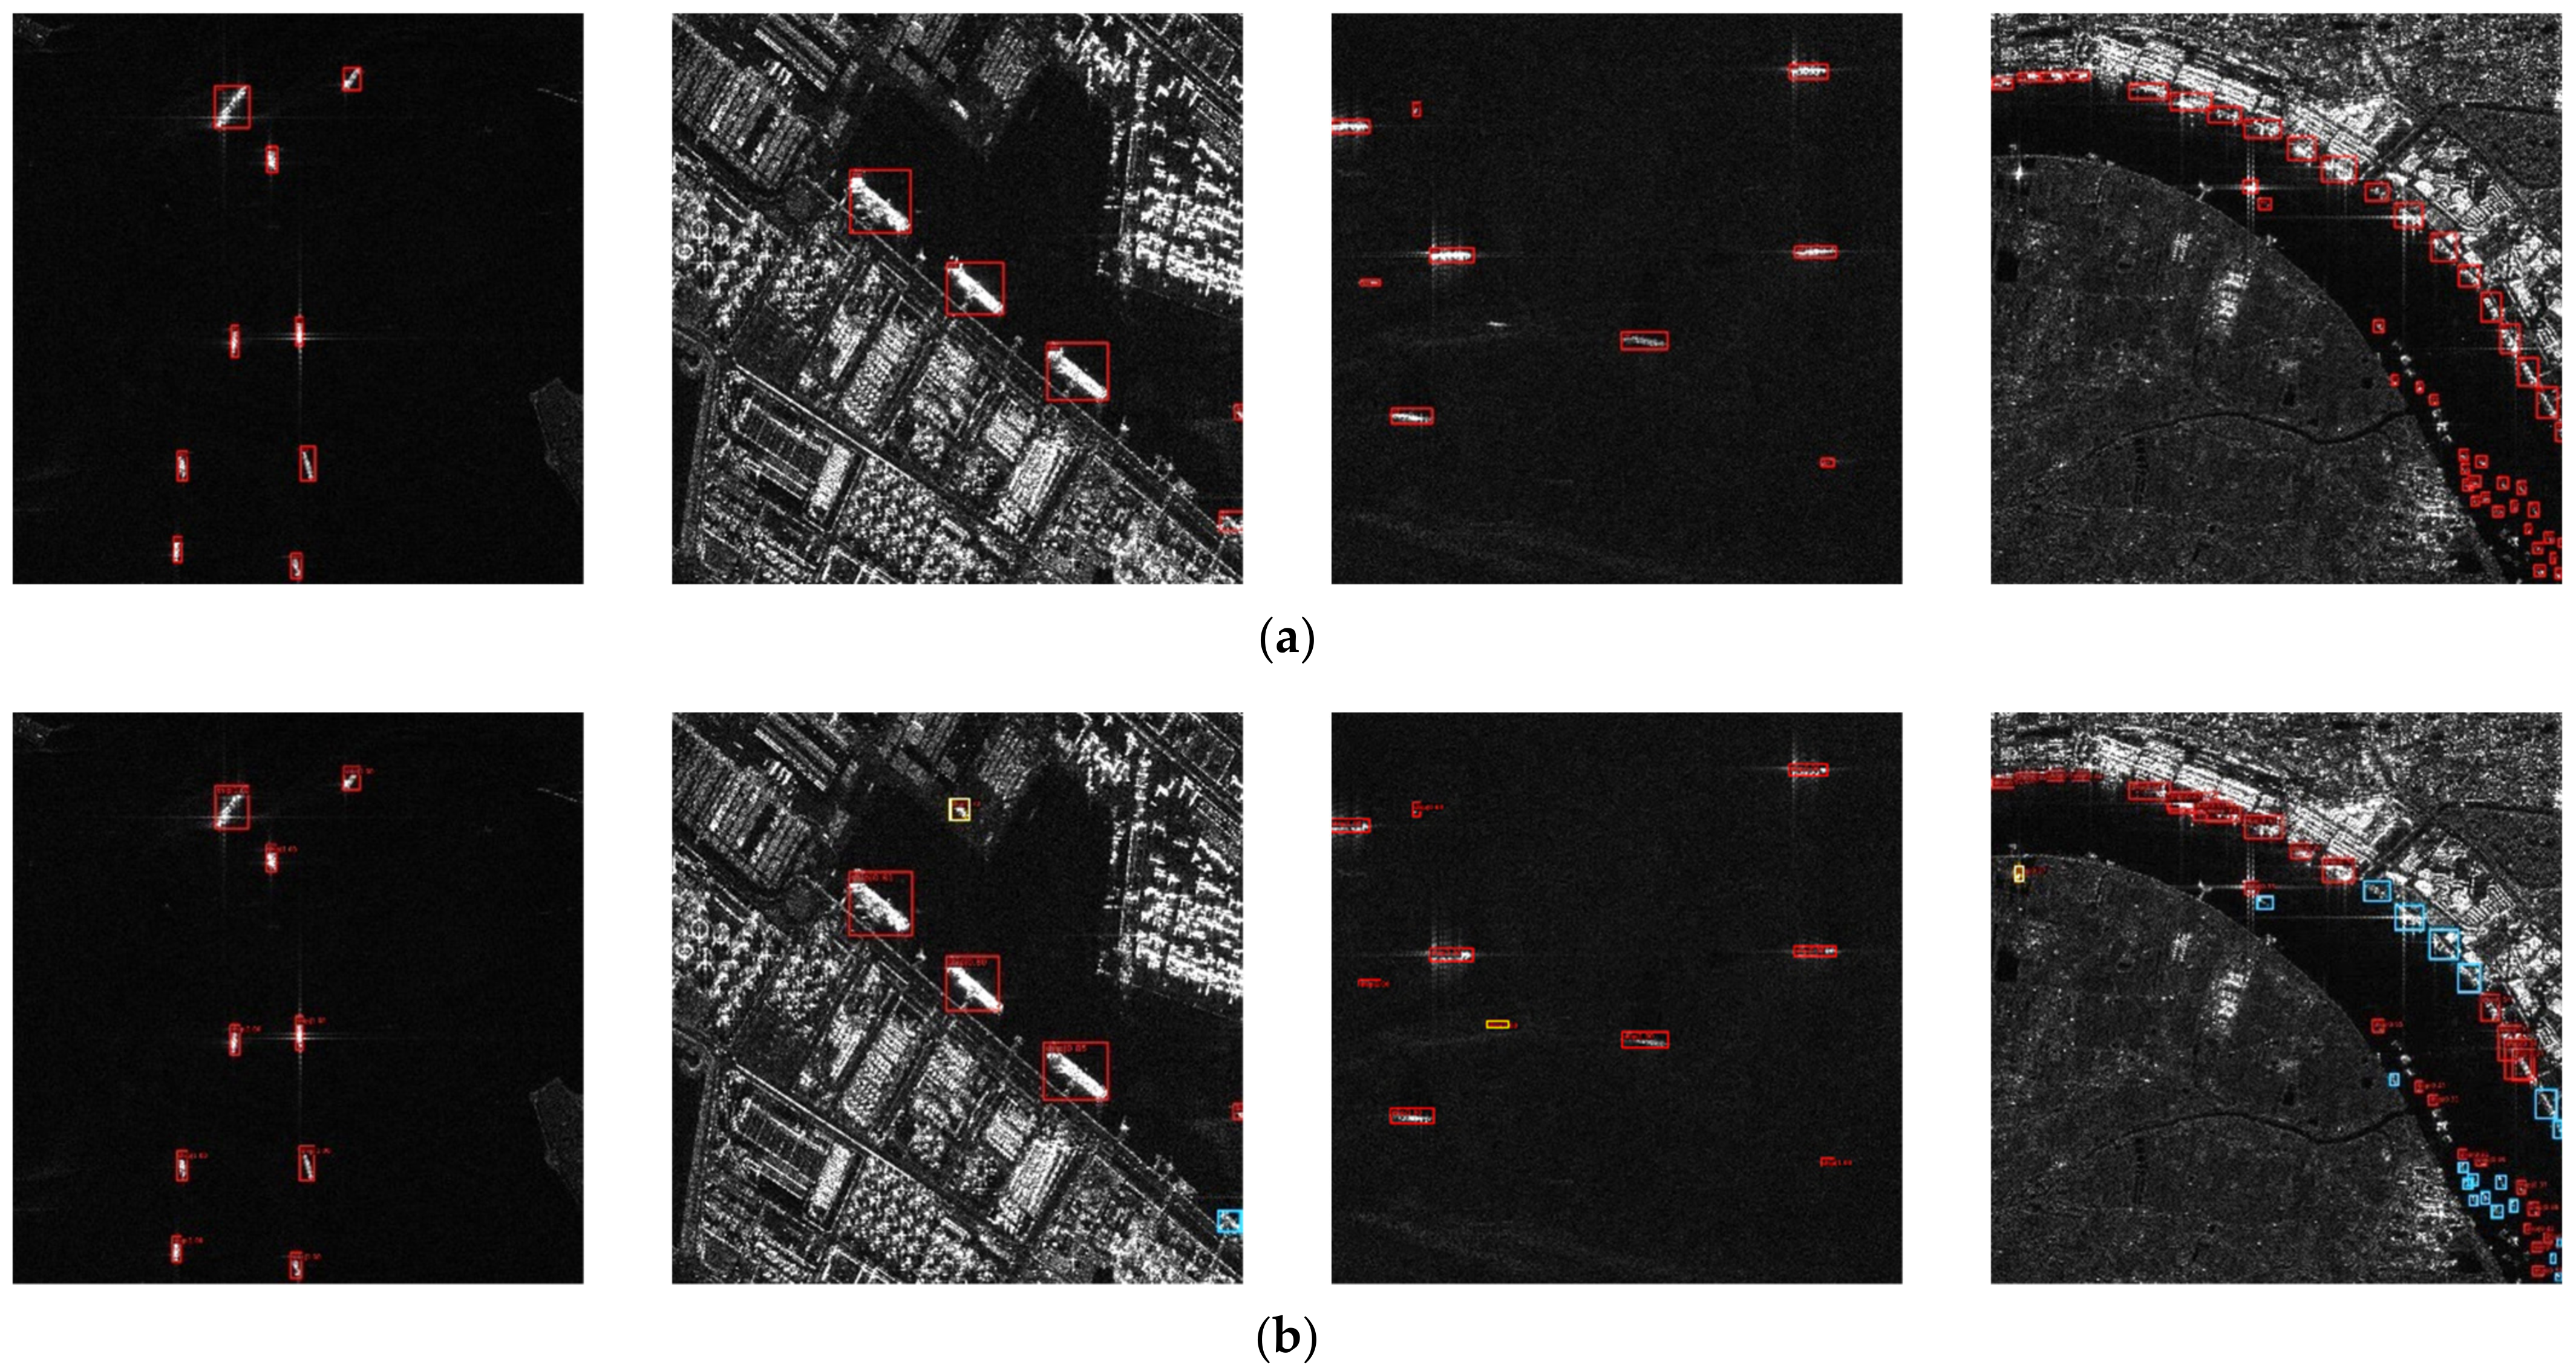
Some visualization detection results are shown in Figure 7. The first one shows an image with less interference in the background of the simple sea surface. In this image, the target is clear and the amount is small. A comparison between the detection results and the true value shows that the detection effect of the method in this paper was perfect in such a scenario and there was no missed detection or false alarm. The second result shows an image with mostly dense small ships at sea, with coastal background interference. The method in this paper had almost no missed detections. Only a few small ships in shore with extremely similar background were missed, and there were some false alarms due to interference from strong scattering points in the inshore background. The third result shows an image with many small targets of ships inshore. Some of the dense small targets with similar scattering intensity to the shore background have several missed detections, and no false alarms appear. In the fourth result, a background image of the coast with strong scattering interference is shown. In this picture, the scattering intensity of the inshore ships is large and their size is medium. There was only one missed detection and one false alarm. As for the small targets on the sea, there was no missed detection and no false alarm.

4.3.2. Study for Contour-Guided Shape-Enhancement Module

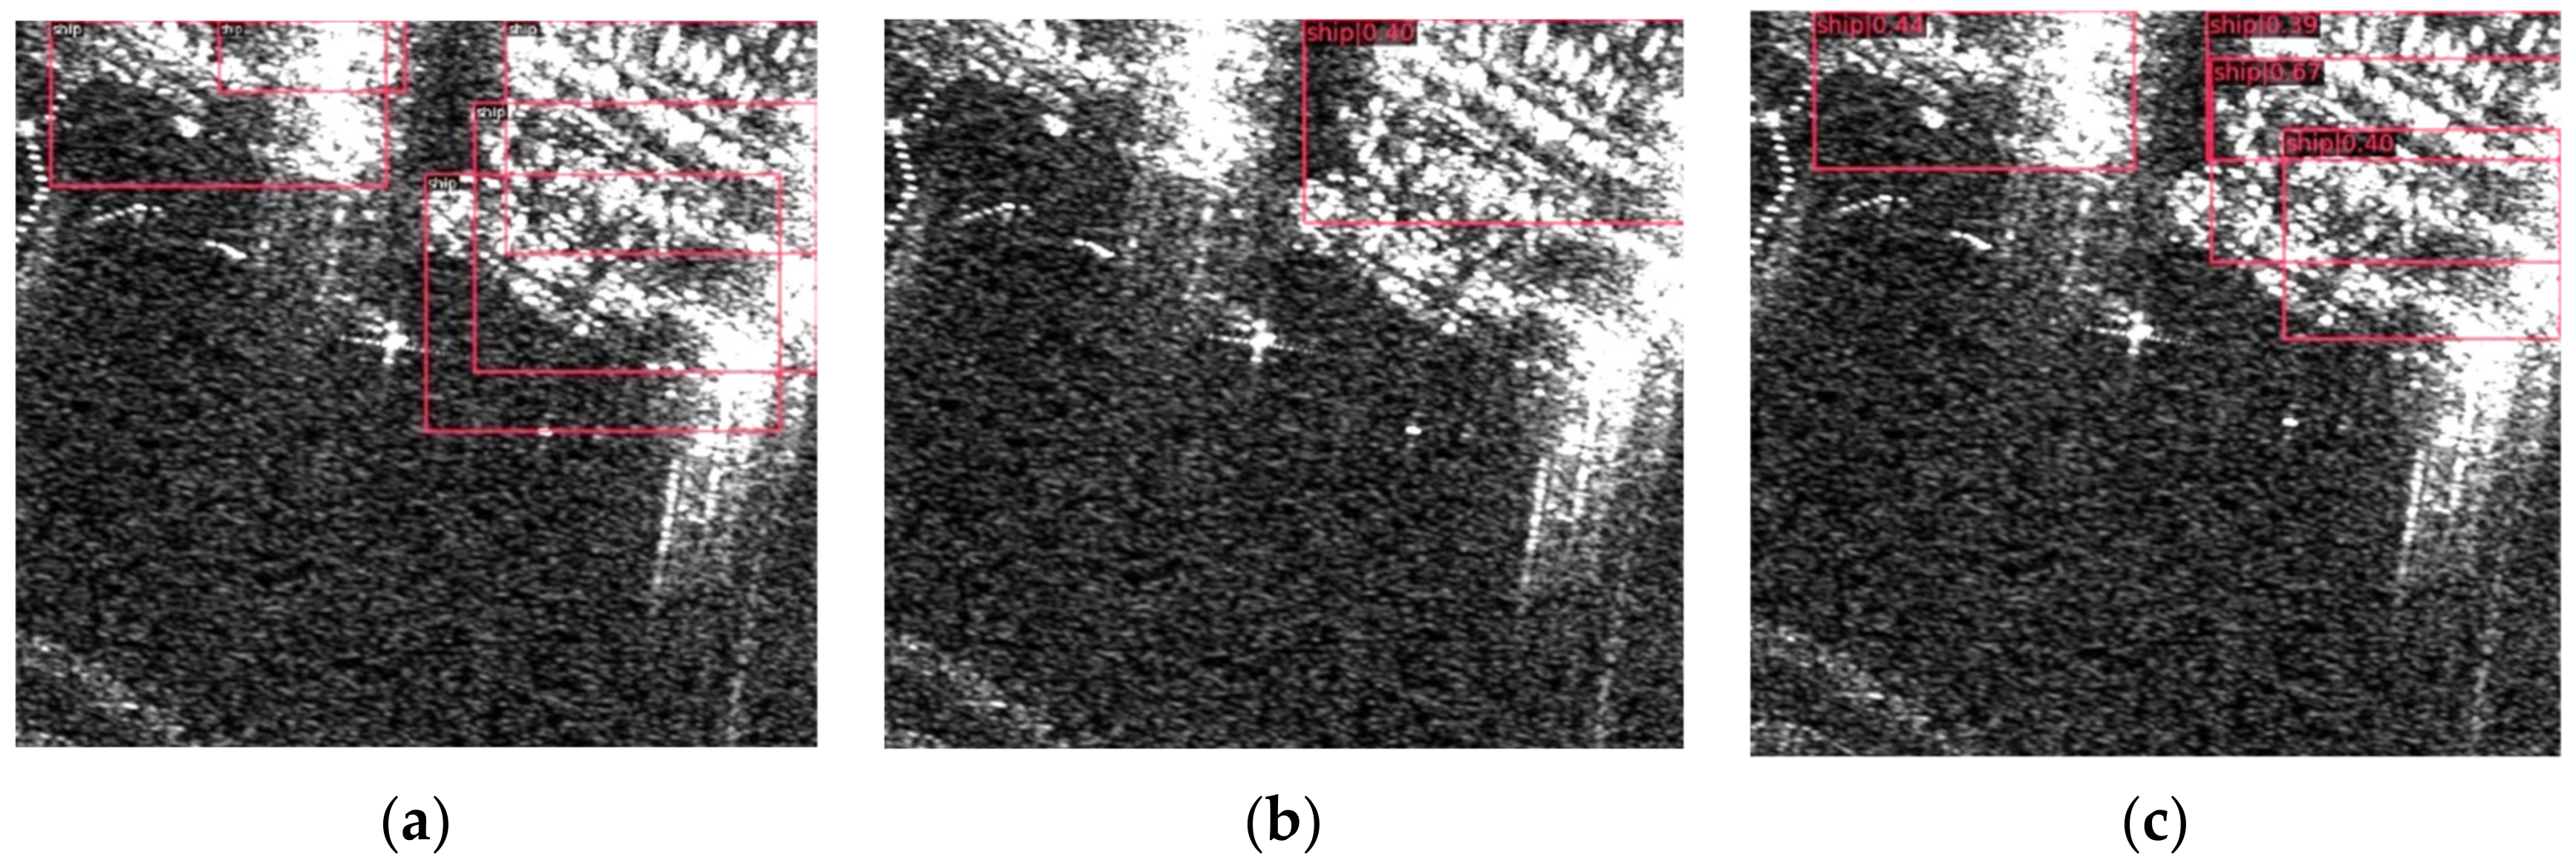
We conducted ablation experiments on the contour-guided shape-enhancement module. As shown in Table 3, after adding this module, AP50 improved by 2.8%, AP75 improved by 6.4%; the two APs were significantly improved. In addition, the APs increased by 4.3%. There were many small targets in the HRSID dataset, which only occupied no more than 10 pixels in 800 × 800 pixels. This kind of target seriously affected the detection effect. This module introduced the instance information and edge information of the target, and used the training-only method to enhance the shallow features. The proposed method increased the detection accuracy of small targets to a certain extent. We also visualized the detection results of one image with a blurred ship contour. As shown in Figure 8, the slice-of-object part obtained by our proposed model can obtain more ships with a blurred contour than the original Swin Transformer.

4.4. Comparison to Current Mehtods

We compared our proposed method with some current object detection methods and evaluated them on the HRSID and SSDD datasets. We chose the same experimental environment and parameters, to obtain more comparable results.

4.4.1. Experiments on the HRSID Dataset

We chose the existing object-detection methods, including the single-stage, two-stage, anchor-free and anchor-base methods, to verify the effectiveness of our proposed method. As shown in Table 4, the detection accuracy of our method was 7% higher than that of Faster R-CNN, 7.6% higher than that of Cascade R-CNN, and 6.7% higher than that of Cascade Mask R-CNN. In addition, the false alarm rate of the proposed method was 1.35% lower than that of Faster R-CNN, 5.76% lower than that of Cascade R-CNN and 4.65% lower than that of Cascade Mask R-CNN. The experimental results demonstrated that the detection AP50 and the false alarm rate of the method proposed in this paper were generally better than those of the two-stage and anchor-base methods. Comparing our results with the single-stage and anchor-base methods, the AP50 was 4% better than that of RetinaNet and 2% higher than that of SSD512. In addition, the false alarm rate of the proposed method was 13.22% lower than that of RetinaNet and 3.31% lower than that of SSD512. We can see that the transformer backbone is powerful in object detection because of its global-modeling ability, and the deformable attention can aggregate more meaningful information for the object. We also compared the most advanced anchor-free methods, and the accuracy of our method was 2.9% higher than that of FCOS and 3.2% higher than that of CenterNet. For the false alarm rate, our method was 1.27% lower than that of CenterNet and 0.23% lower than that of FCOS. We also compared the same methods with the Swin Transformer backbone, and the accuracy of our method was 6.3% higher than that of RetinaNet with the Swin Transformer and 2.5% higher than that of Mask R-CNN with the Swin Transformer. For the false alarm rate, our method was 5.02% lower than that of RetinaNet with the Swin Transformer and 2.26% lower than that of Mask R-CNN with the Swin Transformer. Therefore, changing the self-attention mechanism with deformable attention and adding edge guidance can optimize the Swin Transformer backbone under the FCOS framework.
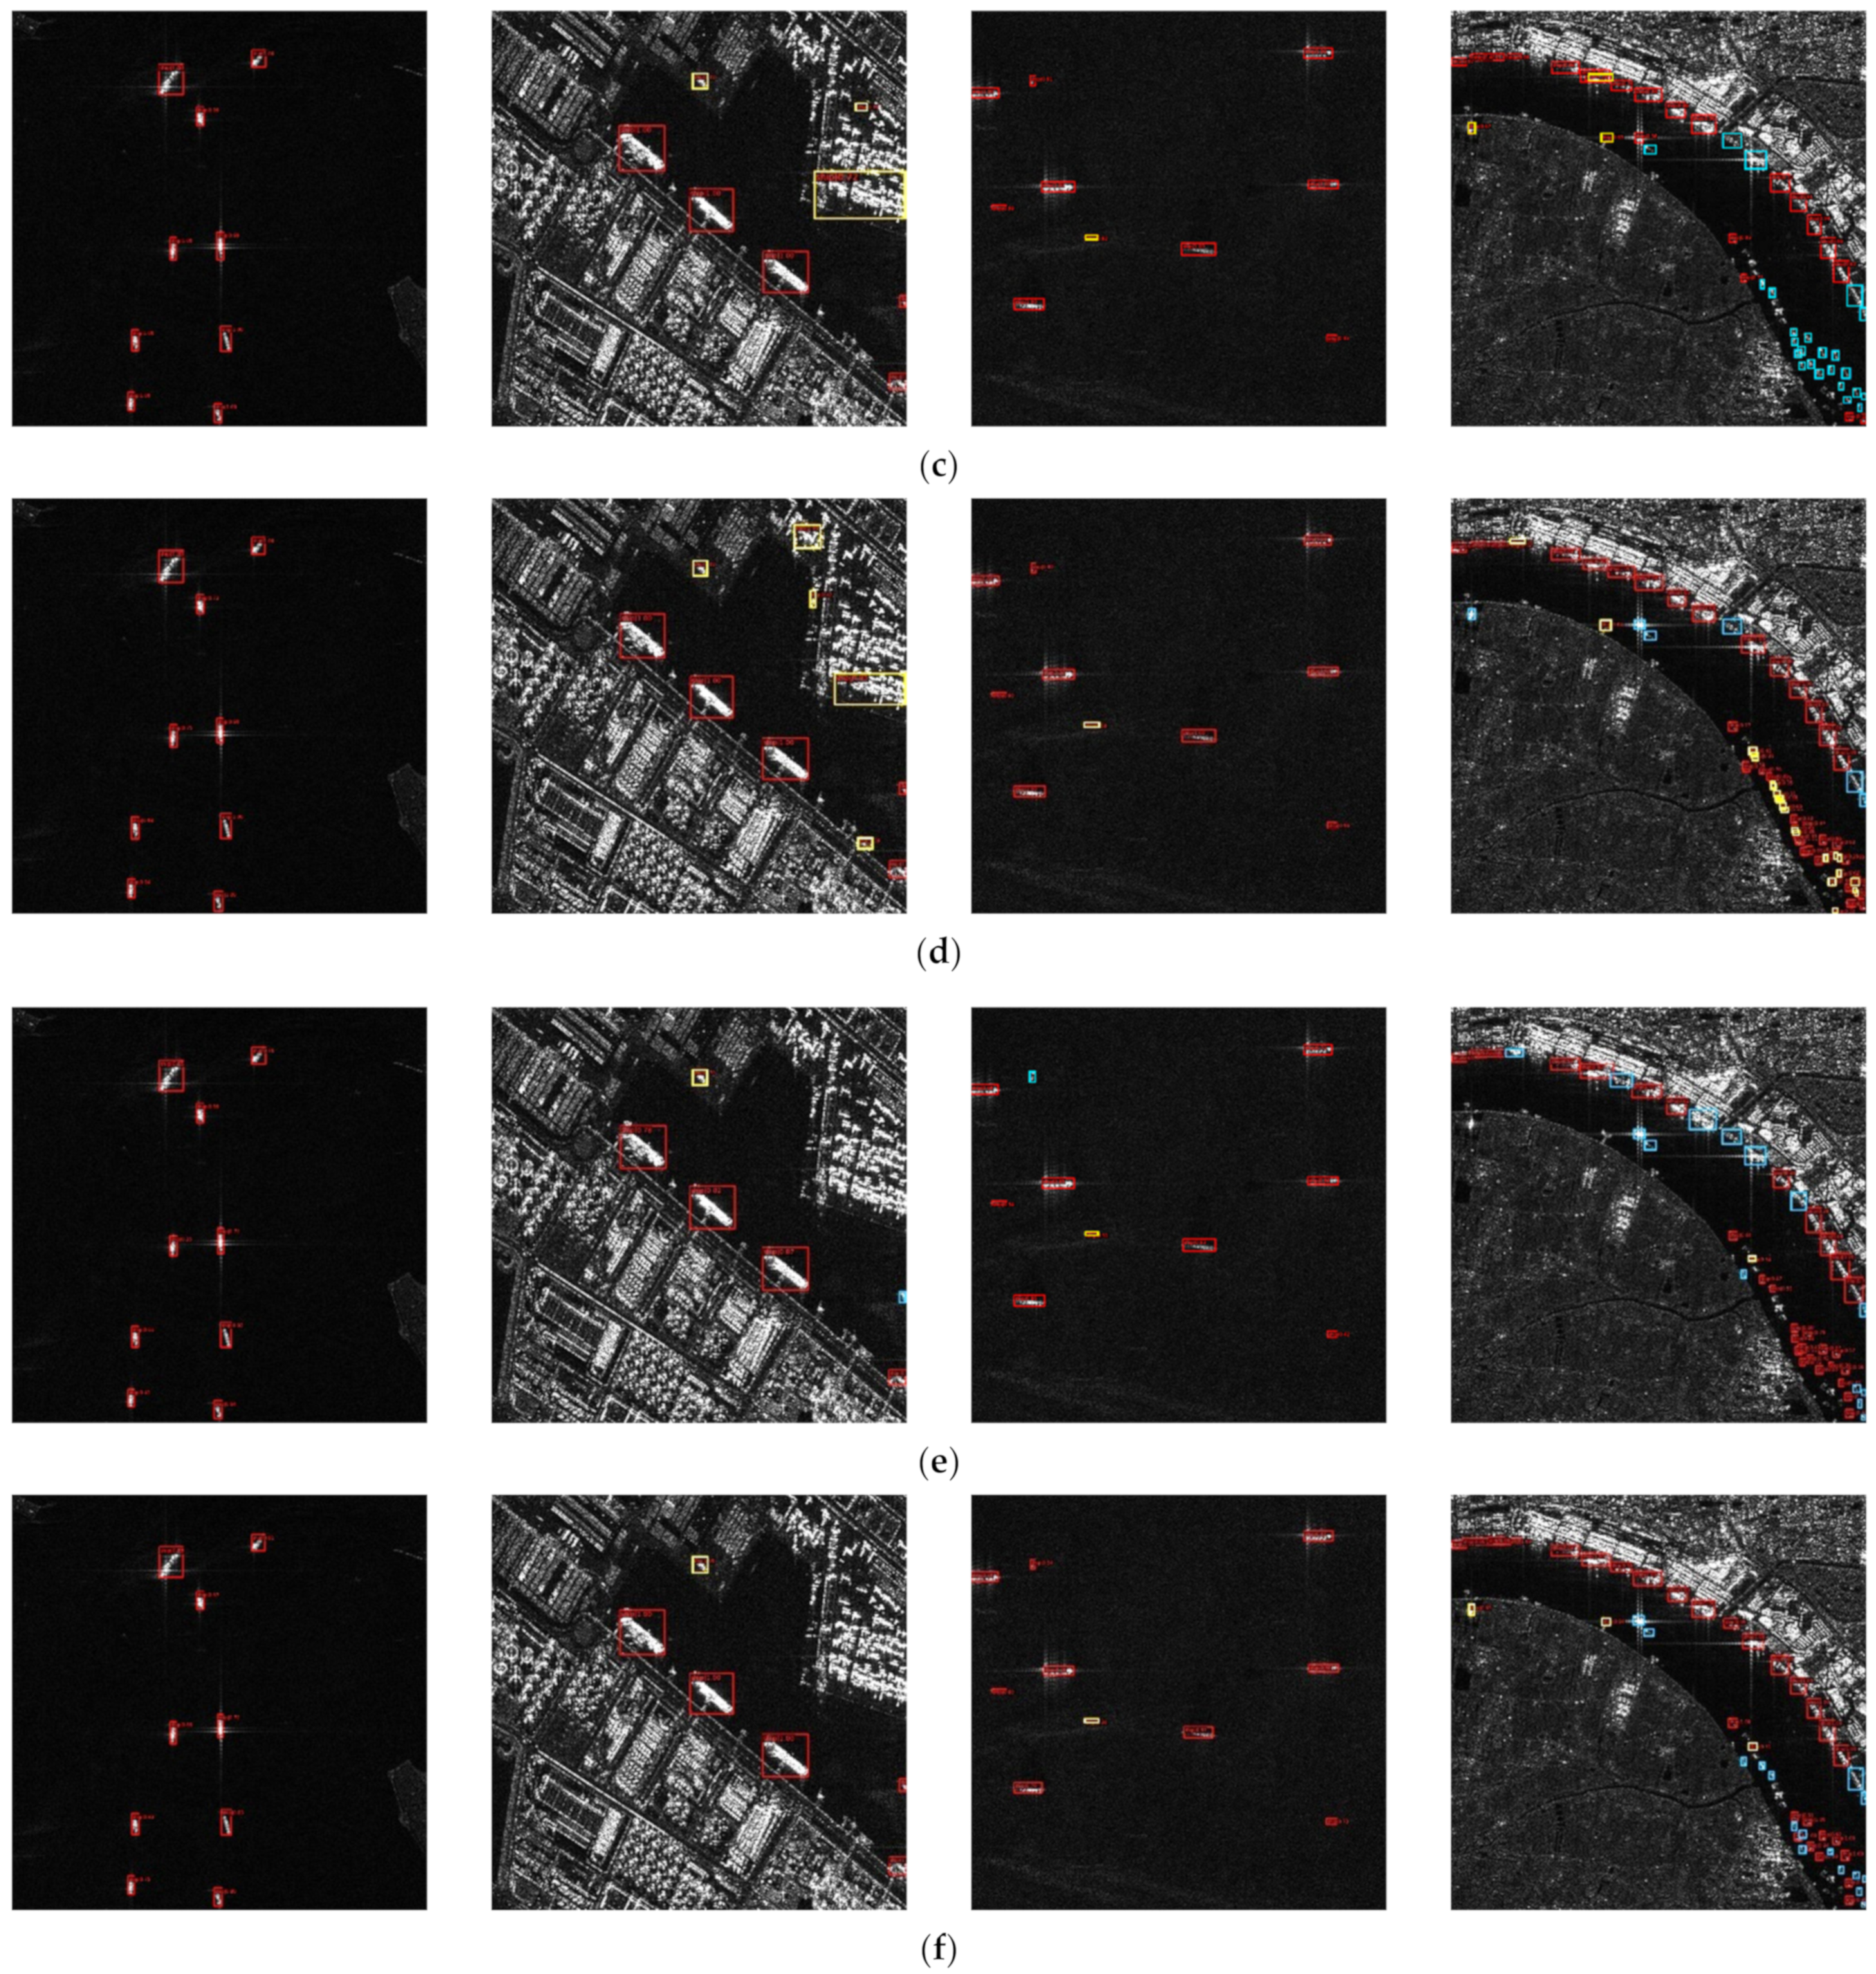
In Figure 9, some visualized detection results of different methods are shown. The first and third images are multiscale ship targets in a pure sea background. The method in this paper and other state-of-art methods correctly detect the ships in the images. However, FCOS a missed detection in the third image. the other detection results are similar, with no false alarms in the first image and the same false alarms in the third image. However, in the second image, containing the port background and larger-scale ship targets, the results of the method proposed in this paper obviously showed fewer false alarms than the other methods, and there was no missed detection. In the fourth image, with coastal background and dense small-scale ship targets, the number of false alarms in the proposed method was slightly more than that of FCOS, but the number of missed detections was much less than that of FCOS. The number of missed detections in the proposed method was slightly more than that of RetinaNet, but the number of false alarms was much smaller than that of RetinaNet. Compared with other methods, the method in this paper had the least number of missed detections and false alarms in the fourth image. It can be seen that our proposed method can achieve better results than the other methods in both off-shore and in-shore scenes.
Table 5 shows a comparison between the proposed method and the state-of-the-art ship-detection methods on the HRSID dataset. These methods include Quad-FPN [57], DAPN [58], ASAFE [59]. We found that our method is comparable to these other methods.
The learning curve of our proposed method on the HRSID dataset is shown in Figure 10. The curve indicates the relationship between classification loss, regression loss, center-ness loss, edge loss, shape loss, and total loss and iterations. We found that our proposed method had a fast convergence. THis shows that our model has good learning ability.

4.4.2. Experiments on the SSDD Dataset

As shown in Table 6, the detection accuracy of our method was 13.6% higher than that of Faster R-CNN, 11.4% higher than that of Cascade R-CNN, and 9.6% higher than that of Cascade Mask R-CNN. The AP50 was 4.4% better than that of RetinaNet and 1.6% higher than that of SSD512. In addition, the accuracy of our method was 4.3% higher than that of CenterNet and 2.8% higher than that of FCOS. We also compared the same methods with the Swin Transformer backbone, and the accuracy of our method was 8.9% higher than that of RetinaNet with the Swin Transformer and 3.5% higher than that of Mask R-CNN with the Swin Transformer. The false alarm rate of the proposed method was 19.95%, 7.99%, 14.28%, 12.98%, 0.57%, 3.86%, 2.71%, 6.44%, and 9.6% lower, respectively, than those of Faster R-CNN, Cascade R-CNN, Cascade Mask R-CNN, RetinaNet, SSD512, CenterNet, FCOS, RetinaNet with Swin Transformer, and Mask R-CNN with Swin Transformer. Therefore, the proposed method was also effective on the SSDD dataset.
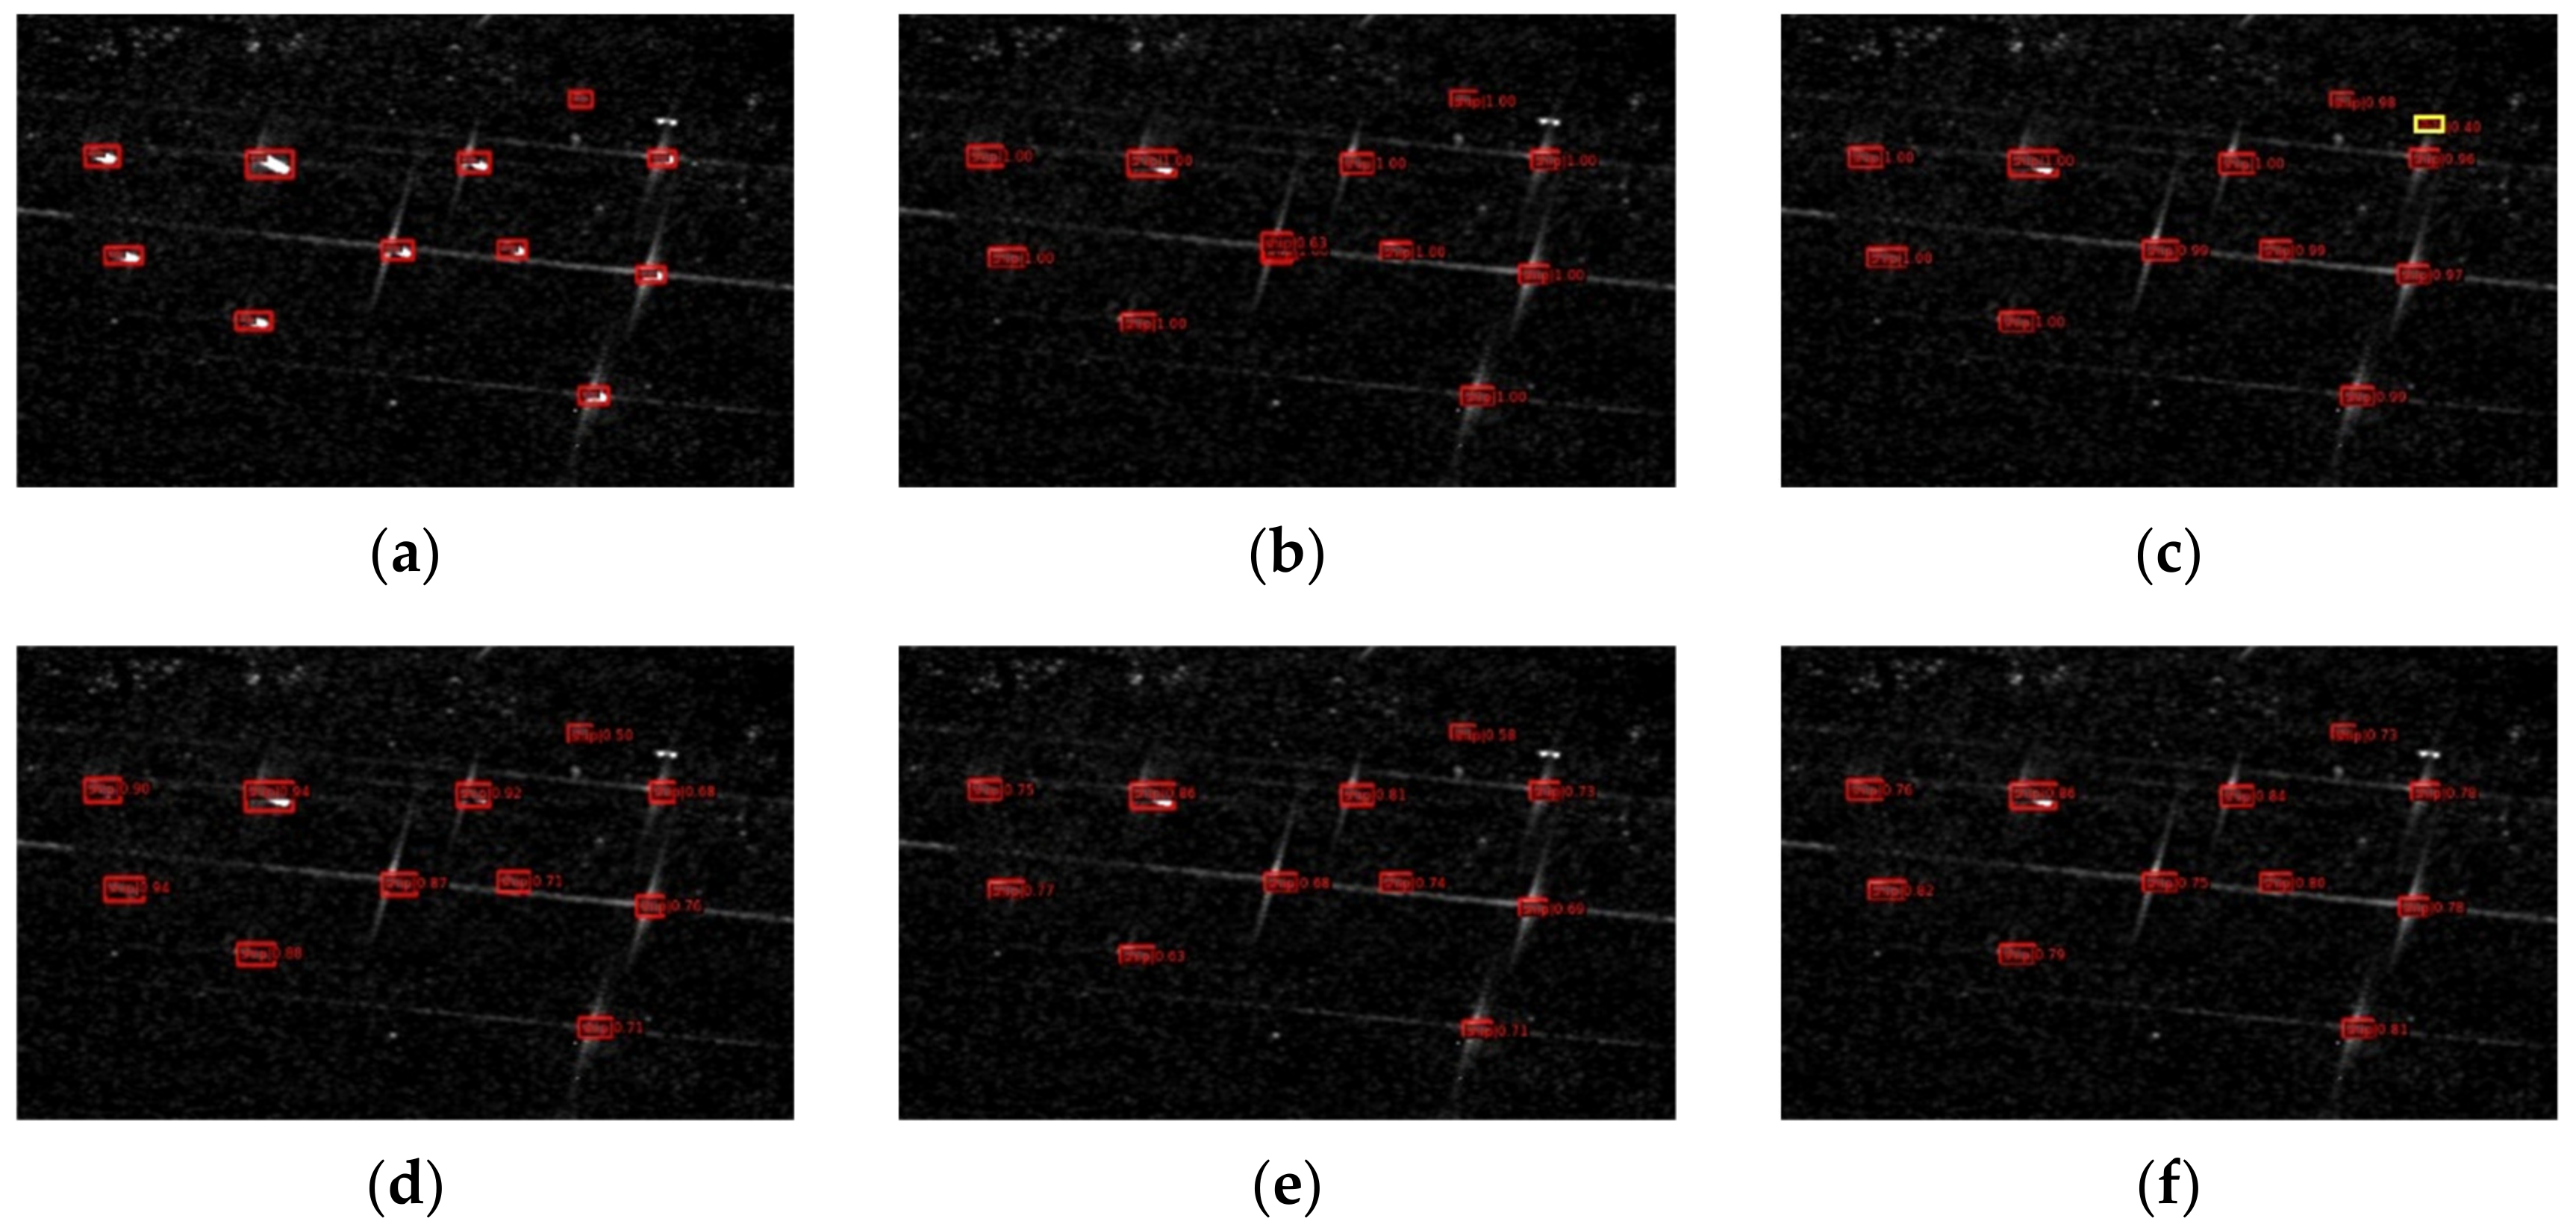
In Figure 11 and Figure 12, some visualized detection results of different methods in two scenes are shown. Figure 11 shows the ship targets that are densely arranged near the coast. The method in this paper had neither false alarms nor missed detections, as shown in this figure, while other methods either had more false alarms or more missed detections, which proved the superiority of our method in this scene. Figure 12 shows the ship targets in the background of pure sea. The results of the various methods were relatively ideal. Only one false alarm appeared in the results of Cascade RCNN, and the method in this paper was more effective in this scene. It can be seen that our proposed method achieved better results than other methods in both off-shore and in-shore scenes in the SSDD dataset.
Table 7 shows a comparison between the proposed method and the state-of-the-art ship-detection methods on the SSDD dataset. We found that our method was comparable to these methods, which showed that our model had good generalizability.

5. Discussion

The shortcomings of the method proposed in this paper can be seen from the comparison between the visualization results and the ground truth of the following two images (Figure 13). First, for ship targets and small ship targets that are densely arranged near the coast, the method in this paper will produce a large number of missed detections when the edges between the targets are extremely blurred, which will seriously affect the detection effect. On that basis, it is necessary to further add edge guidance to the features. Second, it can be seen in the first image that the detection effect of the large-scale target below is not ideal, and the receptive field needs to be increased in the process of feature extraction.

6. Conclusions

Due to the multi-view imaging principle of SAR, its imaging process is not limited by time or bad weather. The detection of ship in SAR images is a very important application in both military and civilian fields. However, the background clutter, such as a coast, an island, or a sea wave, cause previous object detectors to easily miss ships, with blurred contour, which is a big challenge in SAR ship detection. Therefore, in this paper, we proposed a local-sparse-information-aggregation transformer with explicit contour guidance for ship detection in SAR images. This work was based on the excellent Swin Transformer architecture and the FCOS detection framework. We used a deformable-attention mechanism with a data-dependent offset to effectively aggregate sparse meaningful cues of small-scale ships. Moreover, a novel contour-guided shape-enhancement module was proposed to explicitly enforce the contour constraints on the one-dimensional transformer architecture.
We conducted an ablation study and contrast experiments on the HRSID and SSDD datasets. The experimental results showed that the local-sparse-information-aggregation transformer block and the edge-guidance shape-enhancement module we proposed can effectively improve the performance of the transformer as a backbone to extract features, of which AP50 is 3.9% higher than the result of original method. Compared with existing object detection algorithms, the accuracy of our method was improved over single-stage and two-stage methods, as well as anchor-free methods. Via some visualization results, it was proved that our method can better detect ship targets in most scenes, including some scenes with strong interference. Our future work will combine the structure of the transformer with the convolution structure, as the combination of global and local information can extract stronger semantic features in the SAR image. In addition, we will design an edge extractor that is specifically aimed at SAR images. The light-weight factor also needs to be considered. Network training currently takes a long time, and our future work will also focus on improving the problem of low efficiency.

Author Contributions

Conceptualization, H.S. and Y.W.; methodology, B.C. and Y.W.; software, B.C.; validation, H.S., B.C., Y.W. and L.C.; formal analysis, B.C.; writing—original draft preparation, H.S. and B.C.; writing—review and editing, H.S., B.C., Y.W. and L.C.; supervision, H.S.; funding acquisition, L.C. All authors have read and agreed to the published version of the manuscript.

Funding

This research was funded by National Natural Science Foundation of China No. 62101041, the Chang Jiang Scholars Program under Grant T2012122 and the Hundred Leading Talent Project of Beijing Science and Technology under Grant Z141101001514005.

Data Availability Statement

Publicly available datasets were used in this study. HRSID dataset can be found at https://github.com/chaozhong2010/HRSID (accessed on 13 August 2022). SSDD dataset can be found at https://github.com/TianwenZhang0825/Official-SSDD (accessed on 13 August 2022).

Conflicts of Interest

The authors declare no conflict of interest.

References

  1. Moreira, A.; Prats-Iraola, P.; Younis, M.; Krieger, G.; Hajnsek, I.; Papathanassiou, K.P. A tutorial on synthetic aperture radar. IEEE Geosci. Remote Sens. Mag. 2013, 1, 6–43. [Google Scholar] [CrossRef] [Green Version]
  2. Gao, G.; Liu, L.; Zhao, L.; Shi, G.; Kuang, G. An adaptive and fast CFAR algorithm based on automatic censoring for target detection in high-resolution SAR images. IEEE Trans. Geosci. Remote Sens. 2009, 47, 1685–16973. [Google Scholar] [CrossRef]
  3. Wu, X.; Hong, D.; Tian, J.; Chanussot, J.; Li, W.; Tao, R. ORSIm Detector: A novel object detection framework in optical remote sensing imagery using spatial-frequency channel features. IEEE Trans. Geosci. Remote Sens. 2019, 57, 5146–5158. [Google Scholar] [CrossRef] [Green Version]
  4. Ren, S.; He, K.; Girshick, R.; Sun, J. Faster R-CNN: Towards real-time object detection with region proposal networks. IEEE Trans. Pattern Anal. Mach. Intel. 2017, 39, 1137–1149. [Google Scholar] [CrossRef] [Green Version]
  5. Liu, W.; Anguelov, D.; Erhan, D.; Szegedy, C.; Reed, S.; Fu, C.-Y.; Berg, A.C. SSD: Single shot multibox detector. In Proceedings of the European Conference on Computer Vision—ECCV 2016, Amsterdam, The Netherlands, 11–14 October 2016; Springer: Cham, Switzerland, 2016; pp. 21–37. [Google Scholar]
  6. Redmon, J.; Divvala, S.; Girshick, R.; Farhadi, A. You only look once: Unified, real-time object detection. In Proceedings of the 2016 IEEE Conference on Computer Vision and Pattern Recognition (CVPR), IEEE, Las Vegas, NV, USA, 27–30 June 2016; pp. 779–788. [Google Scholar]
  7. Redmon, J.; Farhadi, A. YOLOv3: An incremental improvement. arXiv 2018, arXiv:1804.02767. [Google Scholar]
  8. Zhou, X.; Wang, D.; Krähenbühl, P. Objects as points. arXiv 2019, arXiv:1904.07850. [Google Scholar]
  9. Tian, Z.; Shen, C.; Chen, H.; He, T. FCOS: Fully convolutional one-stage object detection. In Proceedings of the 2019 IEEE/CVF International Conference on Computer Vision (ICCV), IEEE, Seoul, Korea, 27 October–2 November 2019; pp. 9626–9635. [Google Scholar]
  10. Lin, T.-Y.; Dollar, P.; Girshick, R.; He, K.; Hariharan, B.; Belongie, S. Feature pyramid networks for object detection. In Proceedings of the 2017 IEEE Conference on Computer Vision and Pattern Recognition (CVPR), IEEE, Honolulu, HI, USA, 21–26 July 2017; pp. 936–944. [Google Scholar]
  11. Wu, X.; Hong, D.; Chanussot, J.; Xu, Y.; Tao, R.; Wang, Y. Fourier-based rotation-invariant feature boosting: An efficient framework for geospatial object detection. IEEE Geosci. Remote Sens. Lett. 2020, 17, 302–306. [Google Scholar] [CrossRef] [Green Version]
  12. Hong, D.; Gao, L.; Yokoya, N.; Yao, J.; Chanussot, J.; Du, Q.; Zhang, B. More diverse means better: Multimodal deep learning meets remote-sensing imagery classification. IEEE Trans. Geosci. Remote Sens. 2021, 59, 4340–4354. [Google Scholar] [CrossRef]
  13. Xu, X.; Li, W.; Ran, Q.; Du, Q.; Gao, L.; Zhang, B. Multisource remote sensing data classification based on convolutional neural network. IEEE Trans. Geosci. Remote Sens. 2018, 56, 937–949. [Google Scholar] [CrossRef]
  14. Vaswani, A.; Shazeer, N.; Parmar, N.; Uszkoreit, J.; Jones, L.; Gomez, A.N.; Kaiser, L.; Polosukhin, I. Attention is all you need. In Proceedings of the 31st Annual Conference on Neural Information Processing Systems (NIPS), Long Beach, CA, USA, 4–9 December 2017. [Google Scholar]
  15. Luong, M.-T.; Pham, H.; Manning, C.D. Effective approaches to attention-based neural machine translation. arXiv 2015, arXiv:1508.04025. [Google Scholar]
  16. Dosovitskiy, A.; Beyer, L.; Kolesnikov, A.; Weissenborn, D.; Zhai, X.; Unterthiner, T.; Dehghani, M.; Minderer, M.; Heigold, G.; Gelly, S.; et al. An image is worth 16 × 16 words: Transformers for image recognition at scale. arXiv 2021, arXiv:2010.11929. [Google Scholar]
  17. Liu, Z.; Lin, Y.; Cao, Y.; Hu, H.; Wei, Y.; Zhang, Z.; Lin, S.; Guo, B. Swin transformer: Hierarchical vision transformer using shifted windows. In Proceedings of the 2021 IEEE/CVF International Conference on Computer Vision (ICCV), Montreal, QC, Canada, 10–17 October 2021; pp. 9992–10002. [Google Scholar]
  18. Dai, W.; Mao, Y.; Yuan, R.; Liu, Y.; Pu, X.; Li, C. A novel detector based on convolution neural networks for multiscale SAR ship detection in complex background. Sensors 2020, 20, 2547. [Google Scholar] [CrossRef]
  19. Kang, M.; Ji, K.; Leng, X.; Lin, Z. Contextual region-based convolutional neural network with multilayer fusion for SAR ship detection. Remote Sens. 2017, 9, 860. [Google Scholar] [CrossRef] [Green Version]
  20. Shiqi, C.; Ronghui, Z.; Jun, Z. Regional attention-based single shot detector for SAR ship detection. J. Eng. 2019, 2019, 7381–7384. [Google Scholar] [CrossRef]
  21. Li, J.W.; Qu, C.W.; Shao, J.Q. Ship detection in sar images based on an improved faster R-CNN. In Proceedings of the Conference on SAR in Big Data Era—Models, Methods and Applications (BIGSARDATA), Beijing, China, 13–14 November 2017. [Google Scholar]
  22. Zhao, Y.; Zhao, L.; Li, C.; Kuang, G. Pyramid attention dilated network for aircraft detection in SAR images. IEEE Geosci. Remote Sens. Lett. 2021, 18, 662–666. [Google Scholar] [CrossRef]
  23. Fu, J.; Sun, X.; Wang, Z.; Fu, K. An anchor-free method based on feature balancing and refinement network for multiscale ship detection in SAR images. IEEE Trans. Geosci. Remote Sens. 2021, 59, 1331–1344. [Google Scholar] [CrossRef]
  24. Hu, Q.; Hu, S.; Liu, S. BANet: A balance attention network for anchor-free ship detection in SAR images. IEEE Trans. Geosci. Remote Sens. 2022, 60, 1–12. [Google Scholar] [CrossRef]
  25. Ma, X.; Hou, S.; Wang, Y.; Wang, J.; Wang, H. Multiscale and dense ship detection in SAR images based on key-point estimation and attention mechanism. IEEE Trans. Geosci. Remote Sens. 2022, 60, 1–11. [Google Scholar] [CrossRef]
  26. Xiao, M.; He, Z.; Li, X.; Lou, A. Power transformations and feature alignment guided network for SAR ship detection. IEEE Geosci. Remote Sens. Lett. 2022, 19, 1–5. [Google Scholar] [CrossRef]
  27. Niu, Y.; Li, Y.; Huang, J.; Chen, Y. Efficient encoder-decoder network with estimated direction for SAR ship detection. IEEE Geosci. Remote Sens. Lett. 2022, 19, 1–5. [Google Scholar] [CrossRef]
  28. Cui, Z.; Wang, X.; Liu, N.; Cao, Z.; Yang, J. Ship detection in large-scale SAR images via spatial shuffle-group enhance attention. IEEE Trans. Geosci. Remote Sens. 2021, 59, 379–391. [Google Scholar] [CrossRef]
  29. Wang, W.; Xie, E.; Li, X.; Fan, D.-P.; Song, K.; Liang, D.; Lu, T.; Luo, P.; Shao, L. Pyramid vision transformer: A versatile backbone for dense prediction without convolutions. In Proceedings of the 2021 IEEE/CVF International Conference on Computer Vision (ICCV), IEEE, Montreal, QC, Canada, 10–17 October 2021; pp. 548–558. [Google Scholar]
  30. Guo, J.; Han, K.; Wu, H.; Tang, Y.; Chen, X.; Wang, Y.; Xu, C. CMT: Convolutional neural networks meet vision transformers. arXiv 2022, arXiv:2107.06263. [Google Scholar]
  31. Wang, W.; Yao, L.; Chen, L.; Lin, B.; Cai, D.; He, X.; Liu, W. CrossFormer: A versatile vision transformer hinging on cross-scale attention. arXiv 2021, arXiv:2108.00154. [Google Scholar]
  32. Peng, Z.; Huang, W.; Gu, S.; Xie, L.; Wang, Y.; Jiao, J.; Ye, Q. Conformer: Local features coupling global representations for visual recognition. In Proceedings of the 2021 IEEE/CVF International Conference on Computer Vision (ICCV), Montreal, QC, Canada, 10–17 October 2021; pp. 357–366. [Google Scholar]
  33. Lin, T.-Y.; Goyal, P.; Girshick, R.; He, K.; Dollar, P. Focal loss for dense object detection. IEEE Trans. Pattern Anal. Mach. Intel. 2020, 42, 318–327. [Google Scholar] [CrossRef] [PubMed] [Green Version]
  34. He, K.; Gkioxari, G.; Dollar, P.; Girshick, R. Mask R-CNN. In Proceedings of the 2017 IEEE International Conference on Computer Vision (ICCV), Venice, Italy, 22–29 October 2017; pp. 2980–2988. [Google Scholar]
  35. Cai, Z.; Vasconcelos, N. Cascade R-CNN: Delving into high quality object detection. In Proceedings of the 2018 IEEE/CVF Conference on Computer Vision and Pattern Recognition, Salt Lake City, UT, USA, 18–23 June 2018; pp. 6154–6162. [Google Scholar]
  36. Zhang, S.; Chi, C.; Yao, Y.; Lei, Z.; Li, S.Z. Bridging the gap between anchor-based and anchor-free detection via adaptive training sample selection. In Proceedings of the 2020 IEEE/CVF Conference on Computer Vision and Pattern Recognition (CVPR), Seattle, WA, USA, 13–19 June 2020; pp. 9756–9765. [Google Scholar]
  37. Chen, Y.; Zhang, Z.; Cao, Y.; Wang, L.; Lin, S.; Hu, H. RepPoints V2: Verification meets regression for object detection. arXiv 2020, arXiv:2007.08508. [Google Scholar]
  38. Sun, P.; Zhang, R.; Jiang, Y.; Kong, T.; Xu, C.; Zhan, W.; Tomizuka, M.; Li, L.; Yuan, Z.; Wang, C.; et al. Sparse R-CNN: End-to-end object detection with learnable proposals. In Proceedings of the 2021 IEEE/CVF Conference on Computer Vision and Pattern Recognition (CVPR), Nashville, TN, USA, 20–25 June 2021; pp. 14449–14458. [Google Scholar]
  39. Wang, X.; Girshick, R.; Gupta, A.; He, K. Non-local neural networks. In Proceedings of the 2018 IEEE/CVF Conference on Computer Vision and Pattern Recognition, Salt Lake City, UT, USA, 18–23 June 2018; pp. 7794–7803. [Google Scholar]
  40. Cao, Y.; Xu, J.; Lin, S.; Wei, F.; Hu, H. GCNet: Non-local networks meet squeeze-excitation networks and beyond. In Proceedings of the 2019 IEEE/CVF International Conference on Computer Vision Workshop (ICCVW), Seoul, Korea, 27–28 October 2019; pp. 1971–1980. [Google Scholar]
  41. Hu, H.; Gu, J.; Zhang, Z.; Dai, J.; Wei, Y. Relation networks for object detection. In Proceedings of the 2018 IEEE/CVF Conference on Computer Vision and Pattern Recognition, Salt Lake City, UT, USA, 18–23 June 2018; pp. 3588–3597. [Google Scholar]
  42. Gu, J.; Hu, H.; Wang, L.; Wei, Y.; Dai, J. Learning region features for object detection. In Computer Vision—ECCV 2018; Ferrari, V., Hebert, M., Sminchisescu, C., Weiss, Y., Eds.; Lecture Notes in Computer Science; Springer International Publishing: Cham, Switzerland, 2018; Volume 11216, pp. 392–406. [Google Scholar]
  43. Carion, N.; Massa, F.; Synnaeve, G.; Usunier, N.; Kirillov, A.; Zagoruyko, S. End-to-end object detection with transformers. arXiv 2020, arXiv:2005.12872. [Google Scholar]
  44. Sun, Z.; Cao, S.; Yang, Y.; Kitani, K. Rethinking transformer-based set prediction for object detection. In Proceedings of the 2021 IEEE/CVF International Conference on Computer Vision (ICCV), Montreal, QC, Canada, 10–17 October 2021; pp. 3591–3600. [Google Scholar]
  45. Girshick, R. Fast R-CNN. In Proceedings of the 2015 IEEE International Conference on Computer Vision (ICCV), Santiago, Chile, 7–13 December 2015; pp. 1440–1448. [Google Scholar]
  46. Yao, Z.; Ai, J.; Li, B.; Zhang, C. Efficient DETR: Improving end-to-end object detector with dense prior. arXiv 2021, arXiv:2104.01318. [Google Scholar]
  47. Zhu, X.; Su, W.; Lu, L.; Li, B.; Wang, X.; Dai, J. Deformable DETR: Deformable transformers for end-to-end object detection. arXiv 2021, arXiv:2010.04159. [Google Scholar]
  48. Gao, P.; Zheng, M.; Wang, X.; Dai, J.; Li, H. Fast convergence of DETR with spatially modulated co-attention. arXiv 2021, arXiv:2101.07448. [Google Scholar]
  49. Meng, D.; Chen, X.; Fan, Z.; Zeng, G.; Li, H.; Yuan, Y.; Sun, L.; Wang, J. Conditional DETR for fast training convergence. In Proceedings of the 2021 IEEE/CVF International Conference on Computer Vision (ICCV), Montreal, QC, Canada, 10–17 October 2021; pp. 3631–3640. [Google Scholar]
  50. Zha, M.; Qian, W.; Yang, W.; Xu, Y. Multifeature transformation and fusion-based ship detection with small targets and complex backgrounds. IEEE Geosci. Remote Sens. Lett. 2022, 19, 1–5. [Google Scholar] [CrossRef]
  51. Qu, H.; Shen, L.; Guo, W.; Wang, J. Ships detection in SAR images based on anchor-free model with mask guidance features. IEEE J. Sel. Top. Appl. Earth Obs. Remote Sens. 2022, 15, 666–675. [Google Scholar] [CrossRef]
  52. Zhou, W.; Shen, J.; Liu, N.; Xia, S.; Sun, H. An anchor-free vehicle detection algorithm in aerial image based on context information and transformer. IEEE Geosci. Remote Sens. Lett. 2022, 19, 1–5. [Google Scholar] [CrossRef]
  53. Cheng, B.; Duan, H.; Hou, S.; Karim, A.; Jia, W.; Zheng, Y. An effective anchor-free model with transformer for logo detection efficient logo detection via transformer. In Proceedings of the 2021 International Conference on Computer Information Science and Artificial Intelligence (CISAI), Kunming, China, 17–19 September 2021; pp. 198–206. [Google Scholar]
  54. Touvron, H.; Cord, M.; Douze, M.; Massa, F.; Sablayrolles, A.; Jégou, H. Training data-efficient image transformers & distillation through attention. arXiv 2021, arXiv:2012.12877. [Google Scholar]
  55. He, K.; Zhang, X.; Ren, S.; Sun, J. Deep residual learning for image recognition. In Proceedings of the 2016 IEEE Conference on Computer Vision and Pattern Recognition (CVPR), Las Vegas, NV, USA, 27–30 June 2016; pp. 770–778. [Google Scholar]
  56. Xie, S.; Girshick, R.; Dollar, P.; Tu, Z.; He, K. Aggregated residual transformations for deep neural networks. In Proceedings of the 2017 IEEE Conference on Computer Vision and Pattern Recognition (CVPR), Honolulu, HI, USA, 21–26 July 2017; pp. 5987–5995. [Google Scholar]
  57. Zhang, T.; Zhang, X.; Ke, X. Quad-FPN: A novel quad feature pyramid network for SAR ship detection. Remote Sens. 2021, 13, 2771. [Google Scholar] [CrossRef]
  58. Cui, Z.; Li, Q.; Cao, Z.; Liu, N. Dense attention pyramid networks for multi-scale ship detection in SAR images. IEEE Trans. Geosci. Remote Sens. 2019, 57, 8983–8997. [Google Scholar] [CrossRef]
  59. Shi, H.; Fang, Z.; Wang, Y.; Chen, L. An adaptive sample assignment strategy based on feature enhancement for ship detection in SAR images. Remote Sens. 2022, 14, 2238. [Google Scholar] [CrossRef]
Figure 1. Overall framework of proposed method.
Remotesensing 14 05247 g001
Figure 2. Architecture of the Swin Transformer. (a) Swin Transformer structure; (b) Swin Transformer block structure.
Remotesensing 14 05247 g002
Figure 3. The operation of shifted windows.
Remotesensing 14 05247 g003
Figure 4. The calculation process of deformable attention in deformable DETR3.1.3 local parse information- aggregation.
Remotesensing 14 05247 g004
Figure 5. The structure of a local-sparse-information-aggregation transformer.
Remotesensing 14 05247 g005
Figure 6. The structure of the contour-shape-enhancement module.
Remotesensing 14 05247 g006
Figure 7. Visualization detection results of different scene for ablation study: (a) ground truth; (b) the Swin Transformer with FCOS; and (c) proposed model.
Remotesensing 14 05247 g007
Figure 8. The slice of image with blurred ship contour and detection results obtained by baseline method and improved method: (a) ground Truth; (b) the Swin Transformer with FCOS; (b,c) added contour-guided shape-enhancement module.
Remotesensing 14 05247 g008
Figure 9. Detection results of different methods on the HRSID dataset: (a) ground Truth; (b) Faster RCNN; (c) Cascade RCNN; (d) Retinanet; (e) FCOS; and (f) proposed method. (The red boxes represent ground truths and true positive; the yellow boxes represent false alarms;the blue boxes represent missed targets.) We also compared the inference time and computational costs of the current methods with those of the proposed method. For the two-stage methods, the number of parameters of our method was less than those of Faster R-CNN, Cascade R-CNN, and Cascade Mask R-CNN, and the FPS was higher than that of Faster R-CNN but lower than that of Cascade R-CNN and Cascade Mask R-CNN. However, the accuracy of our method was much higher than those of Cascade R-CNN or Cascade Mask R-CNN, which meant a trade-off between speed and accuracy. Our improvements were made based on FCOS, and the performance in speed and computational costs was worse than before improvement, because the transformer improved accuracy but increased the amount of calculation. Our method also cost more computing resources than another anchor-free method, CenterNet, and was slower. The structure of the transformer needs to be slimmed to obtain a higher speed and a lower computational cost.
Remotesensing 14 05247 g009aRemotesensing 14 05247 g009b
Figure 10. The learning curve for the relationship between the different losses and iterations.
Remotesensing 14 05247 g010
Figure 11. Visualization detection results of in-shore scenes in the SSDD dataset: (a) ground truth; (b) Faster RCNN; (c) Cascade RCNN; (d) Retinanet; (e) FCOS; and (f) proposed method. (The red boxes represent ground truths and true positives; the yellow boxes represent false alarms; the blue boxes represent missed targets).
Remotesensing 14 05247 g011aRemotesensing 14 05247 g011b
Figure 12. Visualization detection results of off-shore scenes in the SSDD dataset: (a) ground truth; (b) Faster RCNN; (c) Cascade RCNN; (d) Retinanet; (e) FCOS; and (f) proposed method. (The red boxes represent ground truths and true positives; the yellow boxes represent false alarms).
Remotesensing 14 05247 g012
Figure 13. Images with unsatisfactory detection results: (a) ground truth; (b) detection results of the proposed method.
Remotesensing 14 05247 g013
Table 1. The comparison of proposed transformer backbone with the Swin Transformer.
MethodsPrecisionRecallAP50AP75F1
Swin Transformer backbone83.1480.6483.559.181.87
Proposed transformer backbone86.5783.3485.665.584.92
Table 2. Ablation study of the module in the proposed transformer.
MethodsPrecisionRecallAP50AP75F1
baseline83.1480.6483.559.181.87
+deformable attention82.7380.2283.260.381.46
+deformable attention with offset generator84.6681.7184.862.983.15
+ deformable attention with query sampled83.2380.7384.261.781.96
+ refers to adding the following module based on the baseline method.
Table 3. Ablation study of the edge-guidance shape-enhancement module. + refers to adding the following module based on the baseline method.
MethodsPrecisionRecallAP50AP75F1
baseline83.1480.6483.559.181.87
+shape enhancement86.6384.7686.365.585.68
Table 4. Comparison with current object detection methods on the HRSID dataset.
MethodPrecisionRecallAP50F1Flops(G)FPS(img/s)Parameters(M)
Faster R-CNN86.2279.9480.882.96397.849.341.48
Cascade R-CNN81.8178.6980.280.22262.1822.369.17
Cascade mask R-CNN82.9279.6381.181.24316.6322.077.1
RetinaNet74.3584.8283.879.24127.829.736.1
SSD51284.2685.3685.884.81214.189.436.04
CenterNet86.379.2984.682.9661.8827.814.56
FCOS87.3483.5884.985.42122.9823.831.84
RetinaNet + Swin Transformer82.5580.3281.581.42142.7211.242.02
Mask R-CNN+ Swin Transformer85.3183.6485.384.47283.3124.082.3
Proposed method87.5786.7387.887.14236.8113.033.57
Table 5. Comparison of current SAR ship detection methods on the HRSID dataset.
MethodPrecisionRecallAP50F1
Quad-FPN87.9687.2986.1287.62
DAPN86.9081.2088.2083.90
ASAFE83.4686.7585.1885.07
Proposed method87.5786.7387.887.14
Table 6. Comparison with current object detection methods on the SSDD dataset.
MethodPrecisionRecallAP50F1
Faster R-CNN72.1878.5381.175.22
Cascade R-CNN84.1482.9383.383.53
Cascade mask R-CNN77.8588.1185.182.66
RetinaNet79.1588.2890.383.46
SSD51291.5689.3893.190.45
CenterNet88.2789.5690.488.91
FCOS89.4288.2891.988.85
RetinaNet + Swin Transformer85.6983.3585.884.50
Mask R-CNN+ Swin Transformer82.5389.3191.285.79
Proposed method92.1390.4694.791.29
Table 7. Comparison with current SAR ship detection methods on the SSDD dataset.
MethodPrecisionRecallAP50F1
Quad-FPN89.5295.7795.2992.54
DAPN85.6091.4090.6088.40
ASAFE88.5495.9495.1992.09
Proposed method92.1390.4694.791.29
Publisher’s Note: MDPI stays neutral with regard to jurisdictional claims in published maps and institutional affiliations.