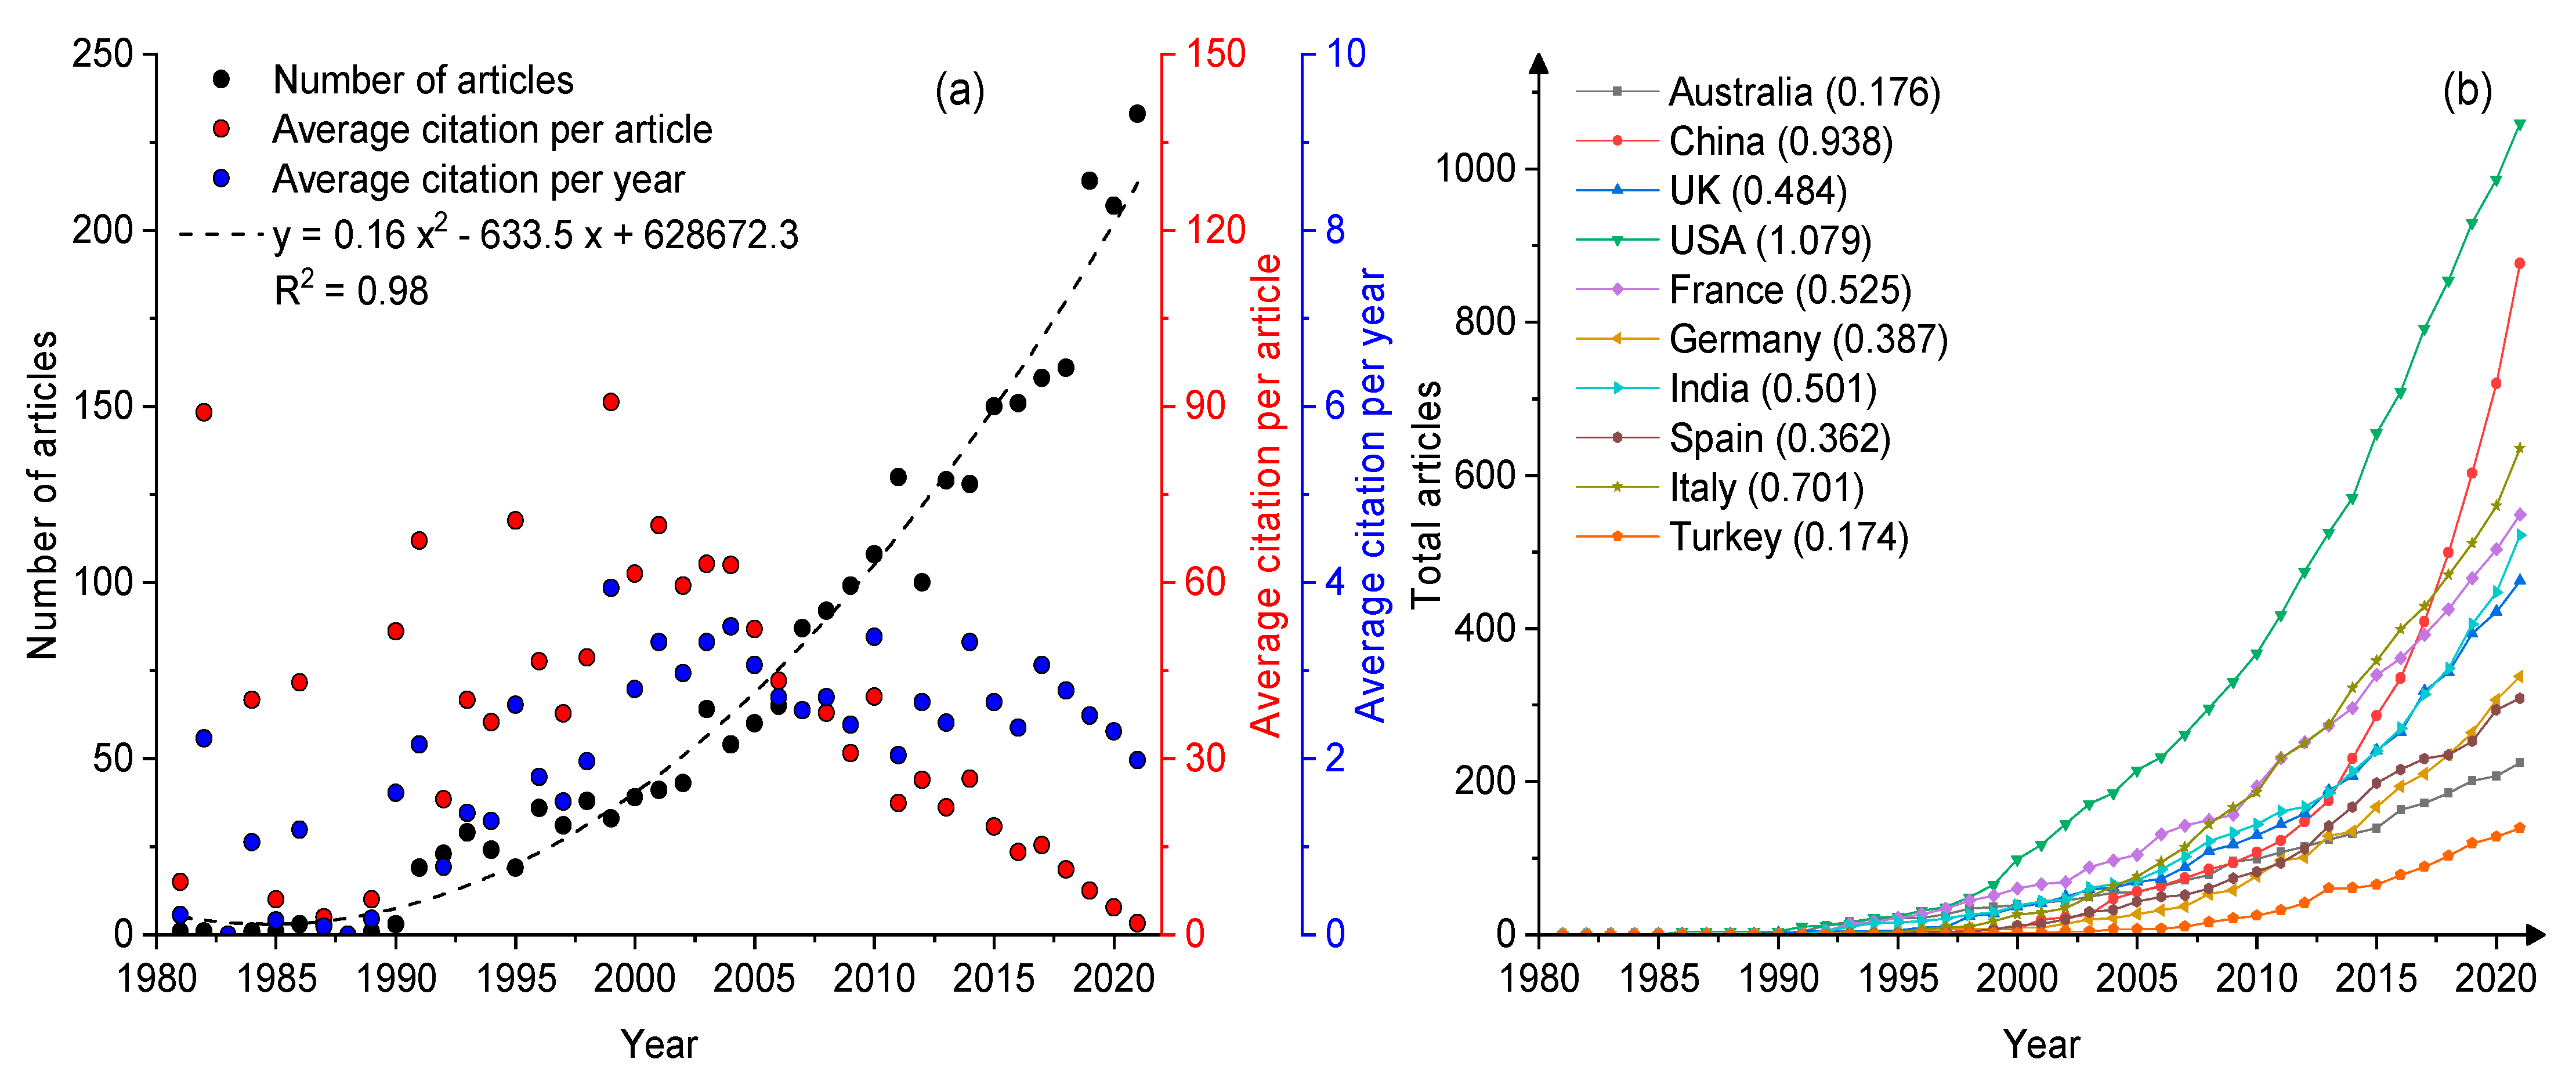
4.1. Basic Results
To obtain the data and results, the literature were collected using the search strategy. As a result, 2796 documents and 11,0111 references were collected, where the earliest article “Morphotectonic analysis of the Hazara arc region of the Himalayas, north Pakistan and northwest India” was published in the journal Tectonophysics [
43]. The annual publications reached 70 articles/year on tectonic geomorphology research (
Table 1), and the mean citations per article is 25.96, showing the rapid development of tectonic geomorphology research (
Figure 1). As shown in
Figure 1a, the number of annual documents (y) on the tectonic geomorphology research increases from 1981 to 2021, showing a polynomial trend with the year (x). The average number of annual articles increase from 31 (1997–2009) to 156 (2010–2021). Since 2010, the average annual number of published articles has exceeded 100. However, the average citation per article or year does not show a similar trend, where increasing since 1981 and decreased since 2000. Due to the continuous improvement and the use of remote sensing technology, more and more researchers have been using remote sensing data and techniques to explore the response of fluvial landforms to the changes in active faulting, which has led to a gradual rise and focus on tectonic geomorphology research since 2010. However, as regional landforms are not formed by tectonics alone, this has led to an inconsistent focus among researchers, resulting in multiple clusters. For example, Chen et al. [
18] used the height and response time of the river terrace to reveal the river incision. Zhang et al. [
44] used the hypsometric integral (HI), the ratio of valley floor width to height (VF), and basin shape (Bs) to reveal the tectonic uplift in the active mountain belt). Liu et al. [
45] used the knickpoints on river longitudinal profiles to constrain the slip rates induced by active faulting. Although these studies all focus on tectonic geomorphology in Qianhe Basin, China, the main concerns are different. Whereas Chen et al. [
18] focus on the river terrace, Zhang et al. [
44] are concerned with geomorphology indexes, while Liu et al. [
45] pay more attention to the river slope. Due to the different impact factors of the journals, the citations per article are different, which are six, 20, and 14, respectively (updated on 6 October 2022). The total articles for the top ten different countries are also included (
Figure 1b) and show a similar increasing trend with the number of annual documents in
Figure 1a. Although the total number of articles in China has not yet surpassed that of the United States, the growth rate for China has ranked second (0.938). suggesting that more Chinese researchers have started to focus on tectonic geomorphology research. The whole database includes 8089 authors, with 240 documents having a single author. Furthermore, there are a total of 6546 keywords generated by these articles (
Table 1).
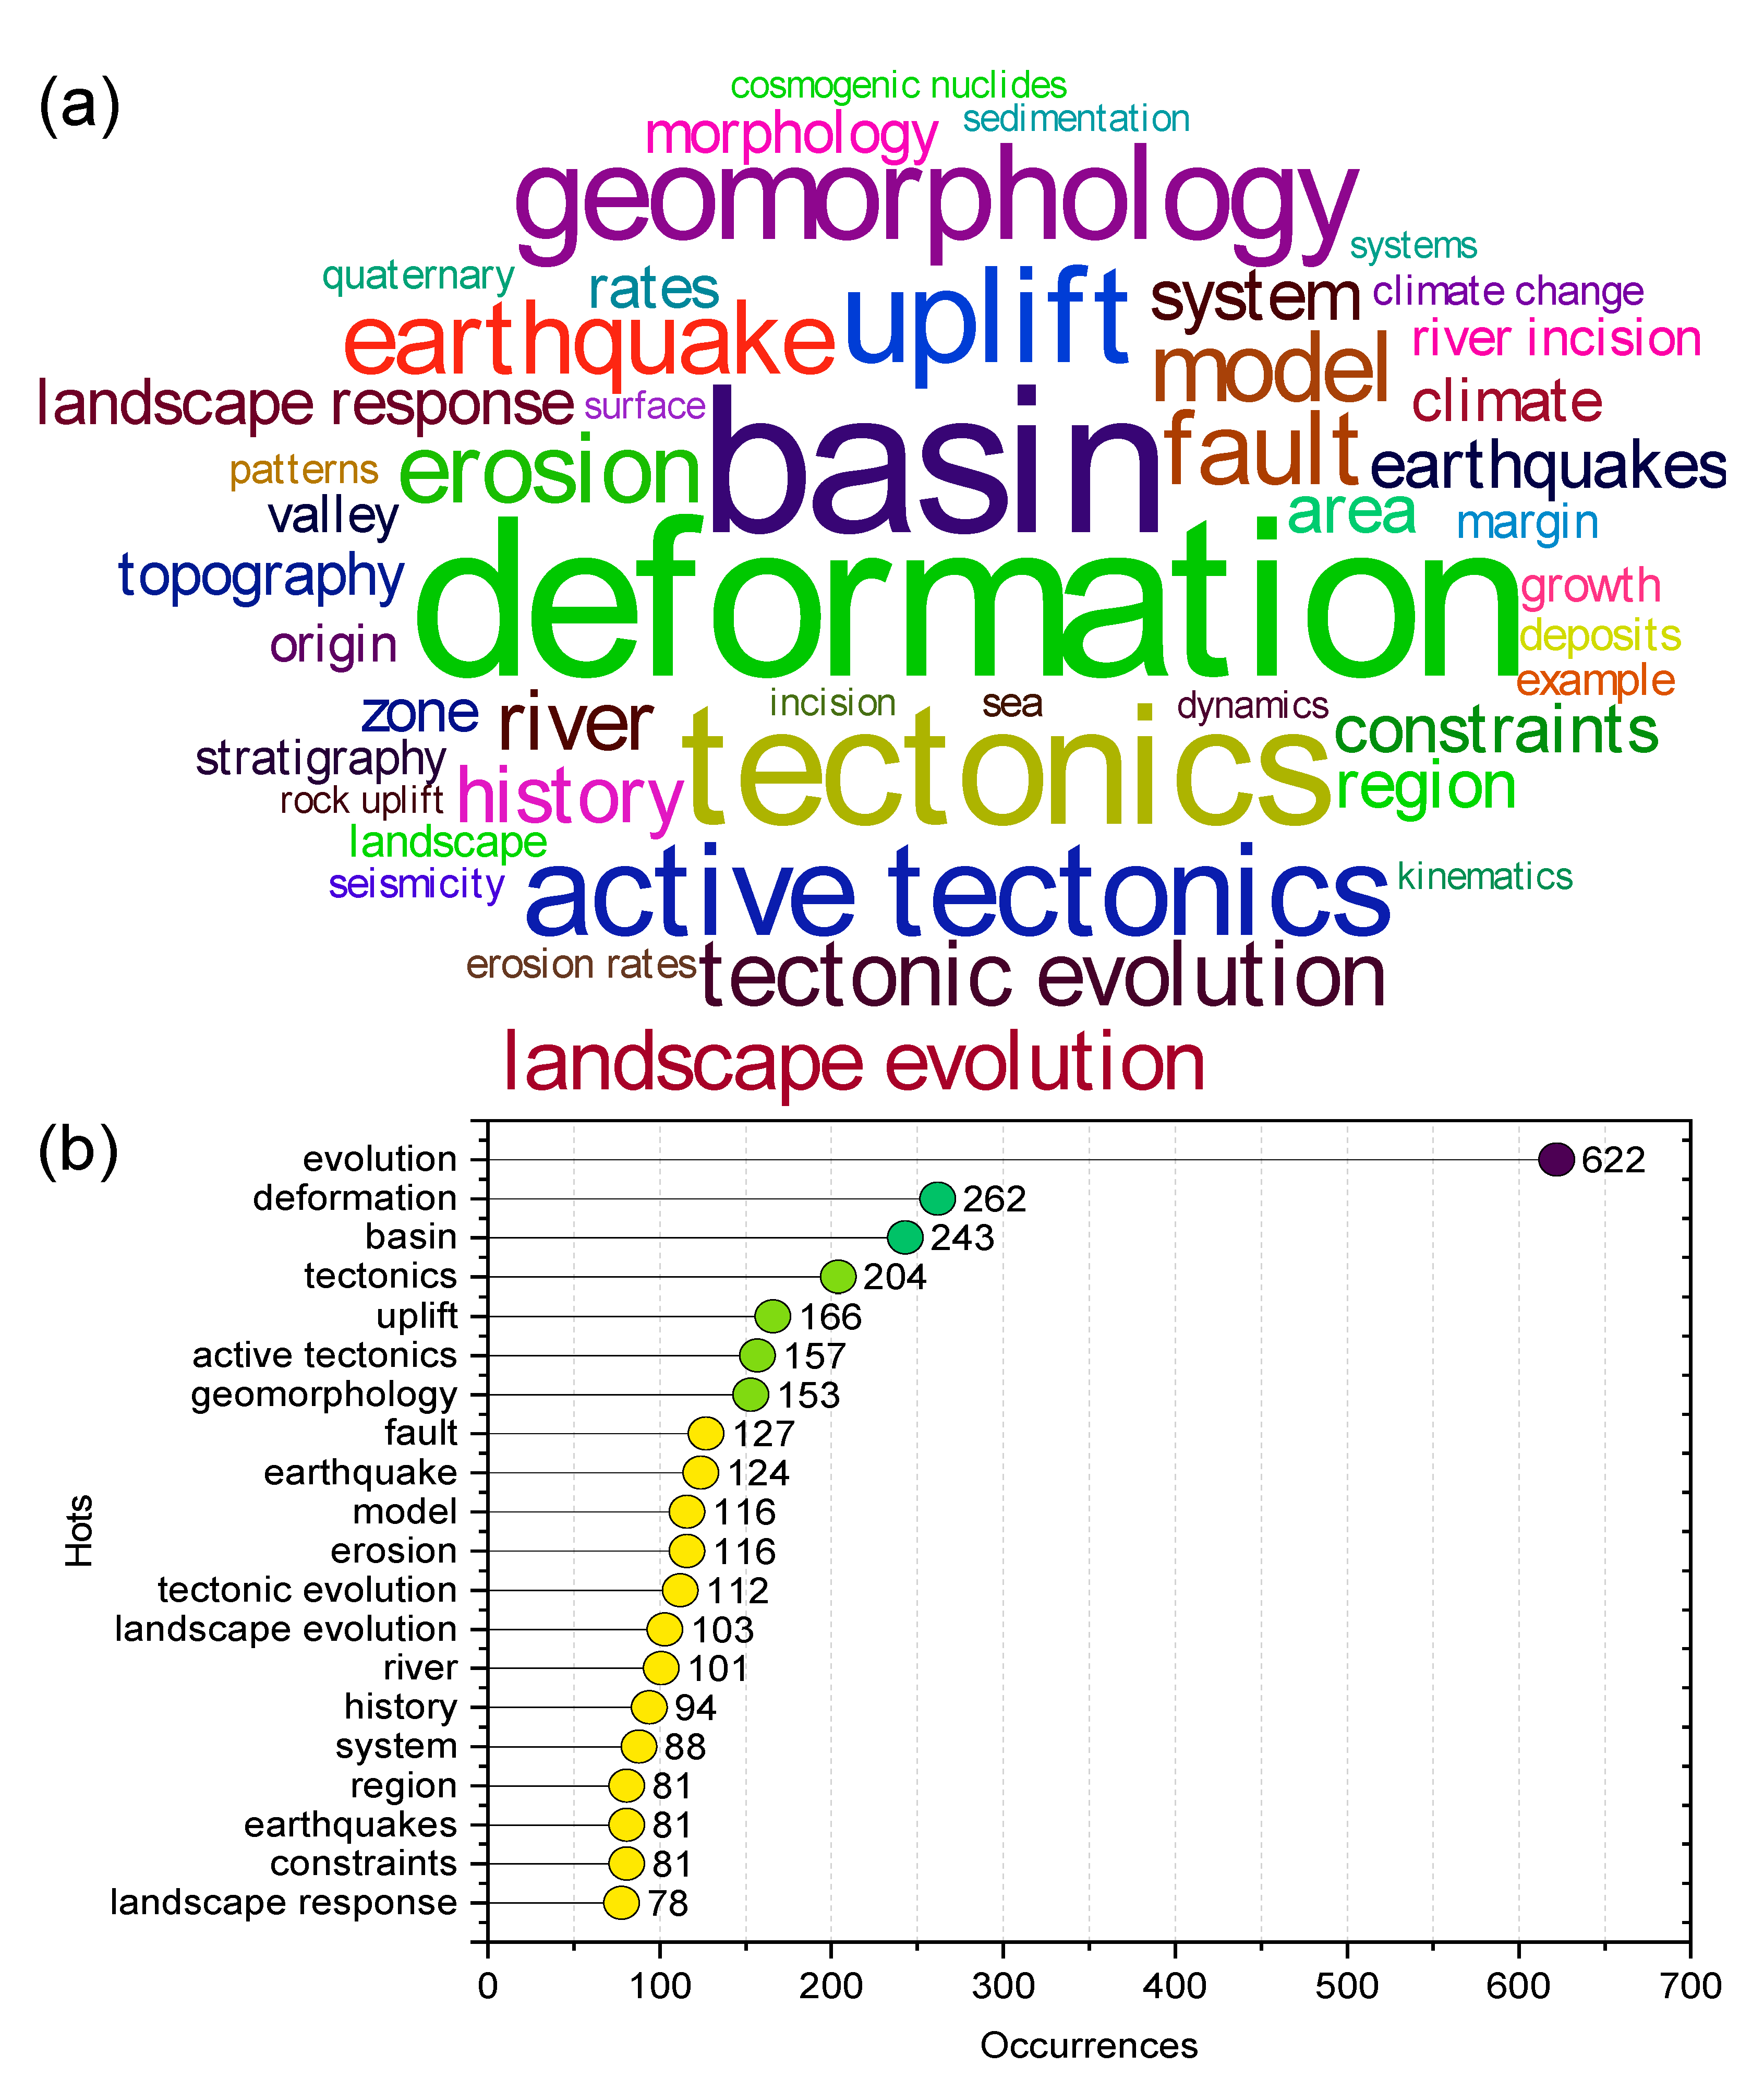
4.2. Research Areas
The research areas of tectonic geomorphology are determined using the Web of Science category field, showing an increase from three to 95. As shown in
Figure 2a, these articles mainly focused on the evolution, deformation, basin, tectonics, uplift, active tectonics, geomorphology, faults, earthquake, model, erosion, tectonic evolution, and landscape evolution, etc. Moreover, the total number of articles in these areas is 2174, accounting for 77.7% of the total articles (
Figure 2b). Specifically, some of the indices, e.g., hypsometric integral (HI), the ratio of valley floor width to height (VF), and basin shape (Bs) are proposed and conducted to reveal the tectonic uplift in the active mountain belt [
44,
46,
47]. Other studies focused on the transient changes in river longitudinal profiles (e.g., the steepness index and knickpoints) to estimate the rates of active faulting [
11,
45,
48,
49]. Furthermore, some studies concerned the climate, tectonic, lithologies, and erosion influence on the fluvial morphology evolution [
50,
51].
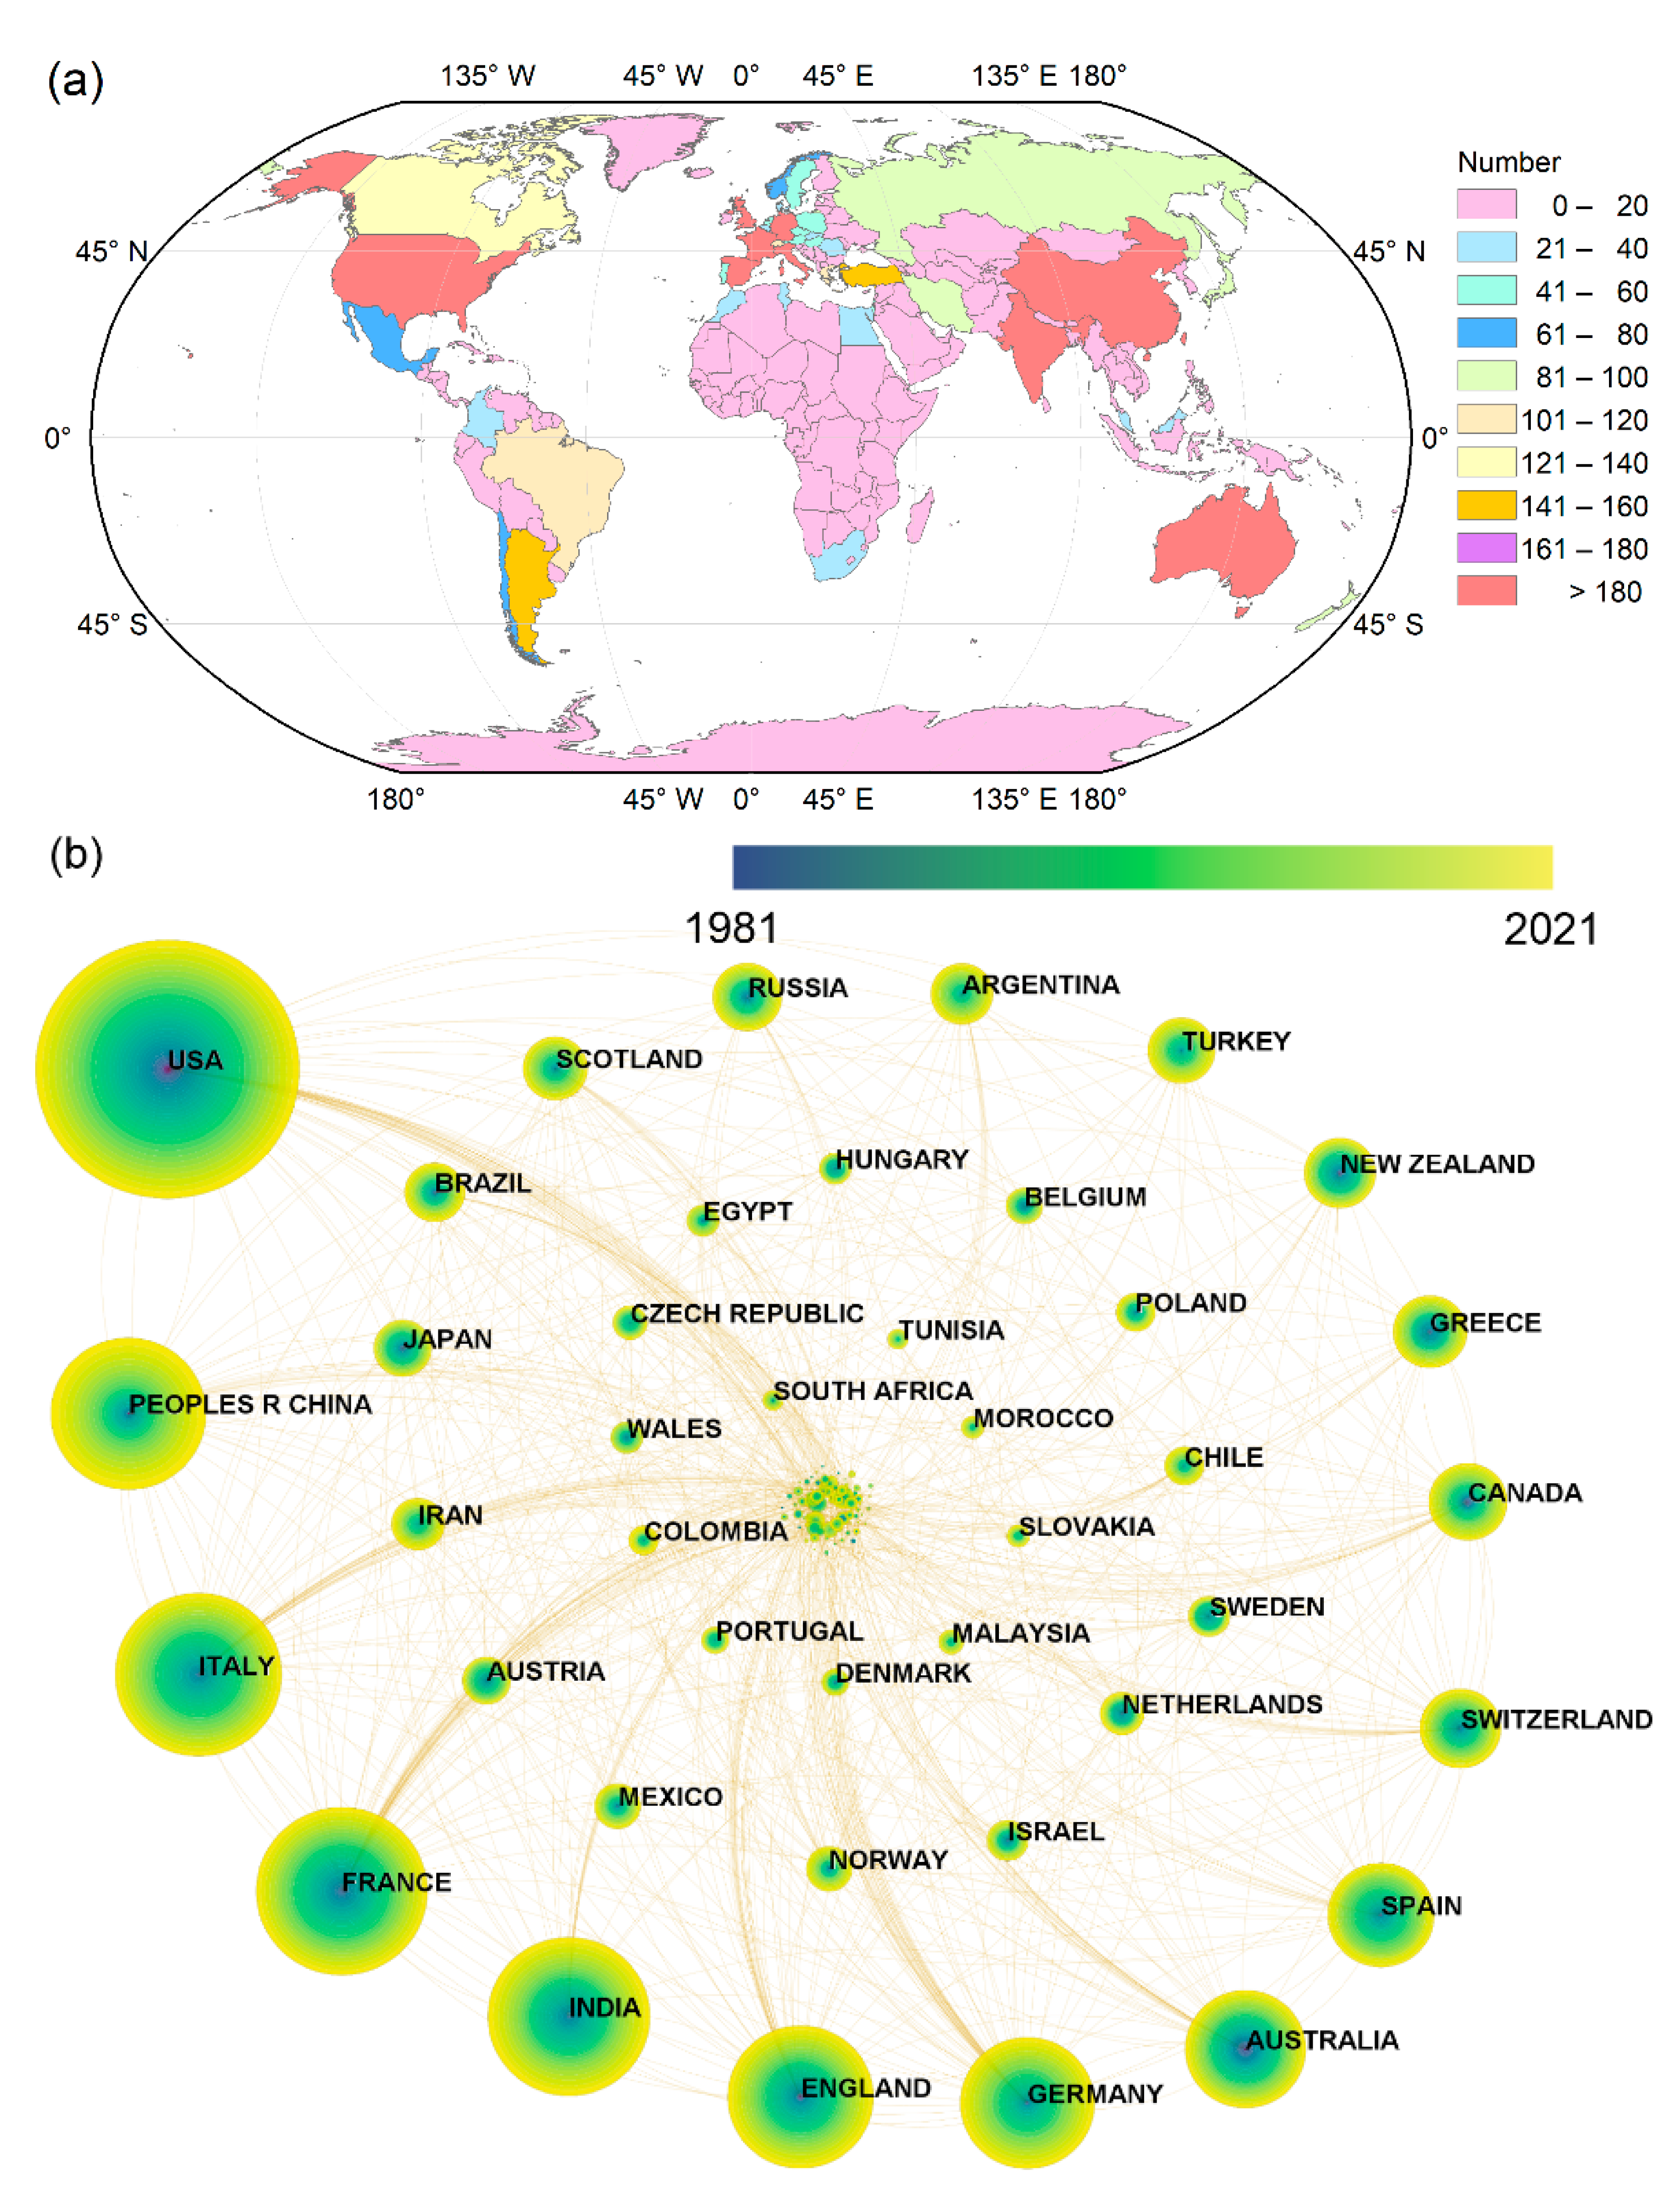
4.3. Research Countries
As shown in
Figure 3a, 113 countries are focusing on the development of tectonic geomorphology research. In these countries, the United States of America (1063), China (892), Italy (635), France (549), and India (525) are the top five countries with the most published articles. As shown in
Figure 3b, countries are also concerned with national cooperation, where the top 10 countries are the USA, Italy, France, India, England, China, Germany, Spain, Australia, and Switzerland, respectively. Since 1981, the USA has been cooperating mostly with China (61), United Kingdom (54), Germany (41), France (39), and Italy (31), respectively, while China cooperates mostly with France (24), Germany (18), Australia (17), United Kingdom (15), and India (10), respectively.
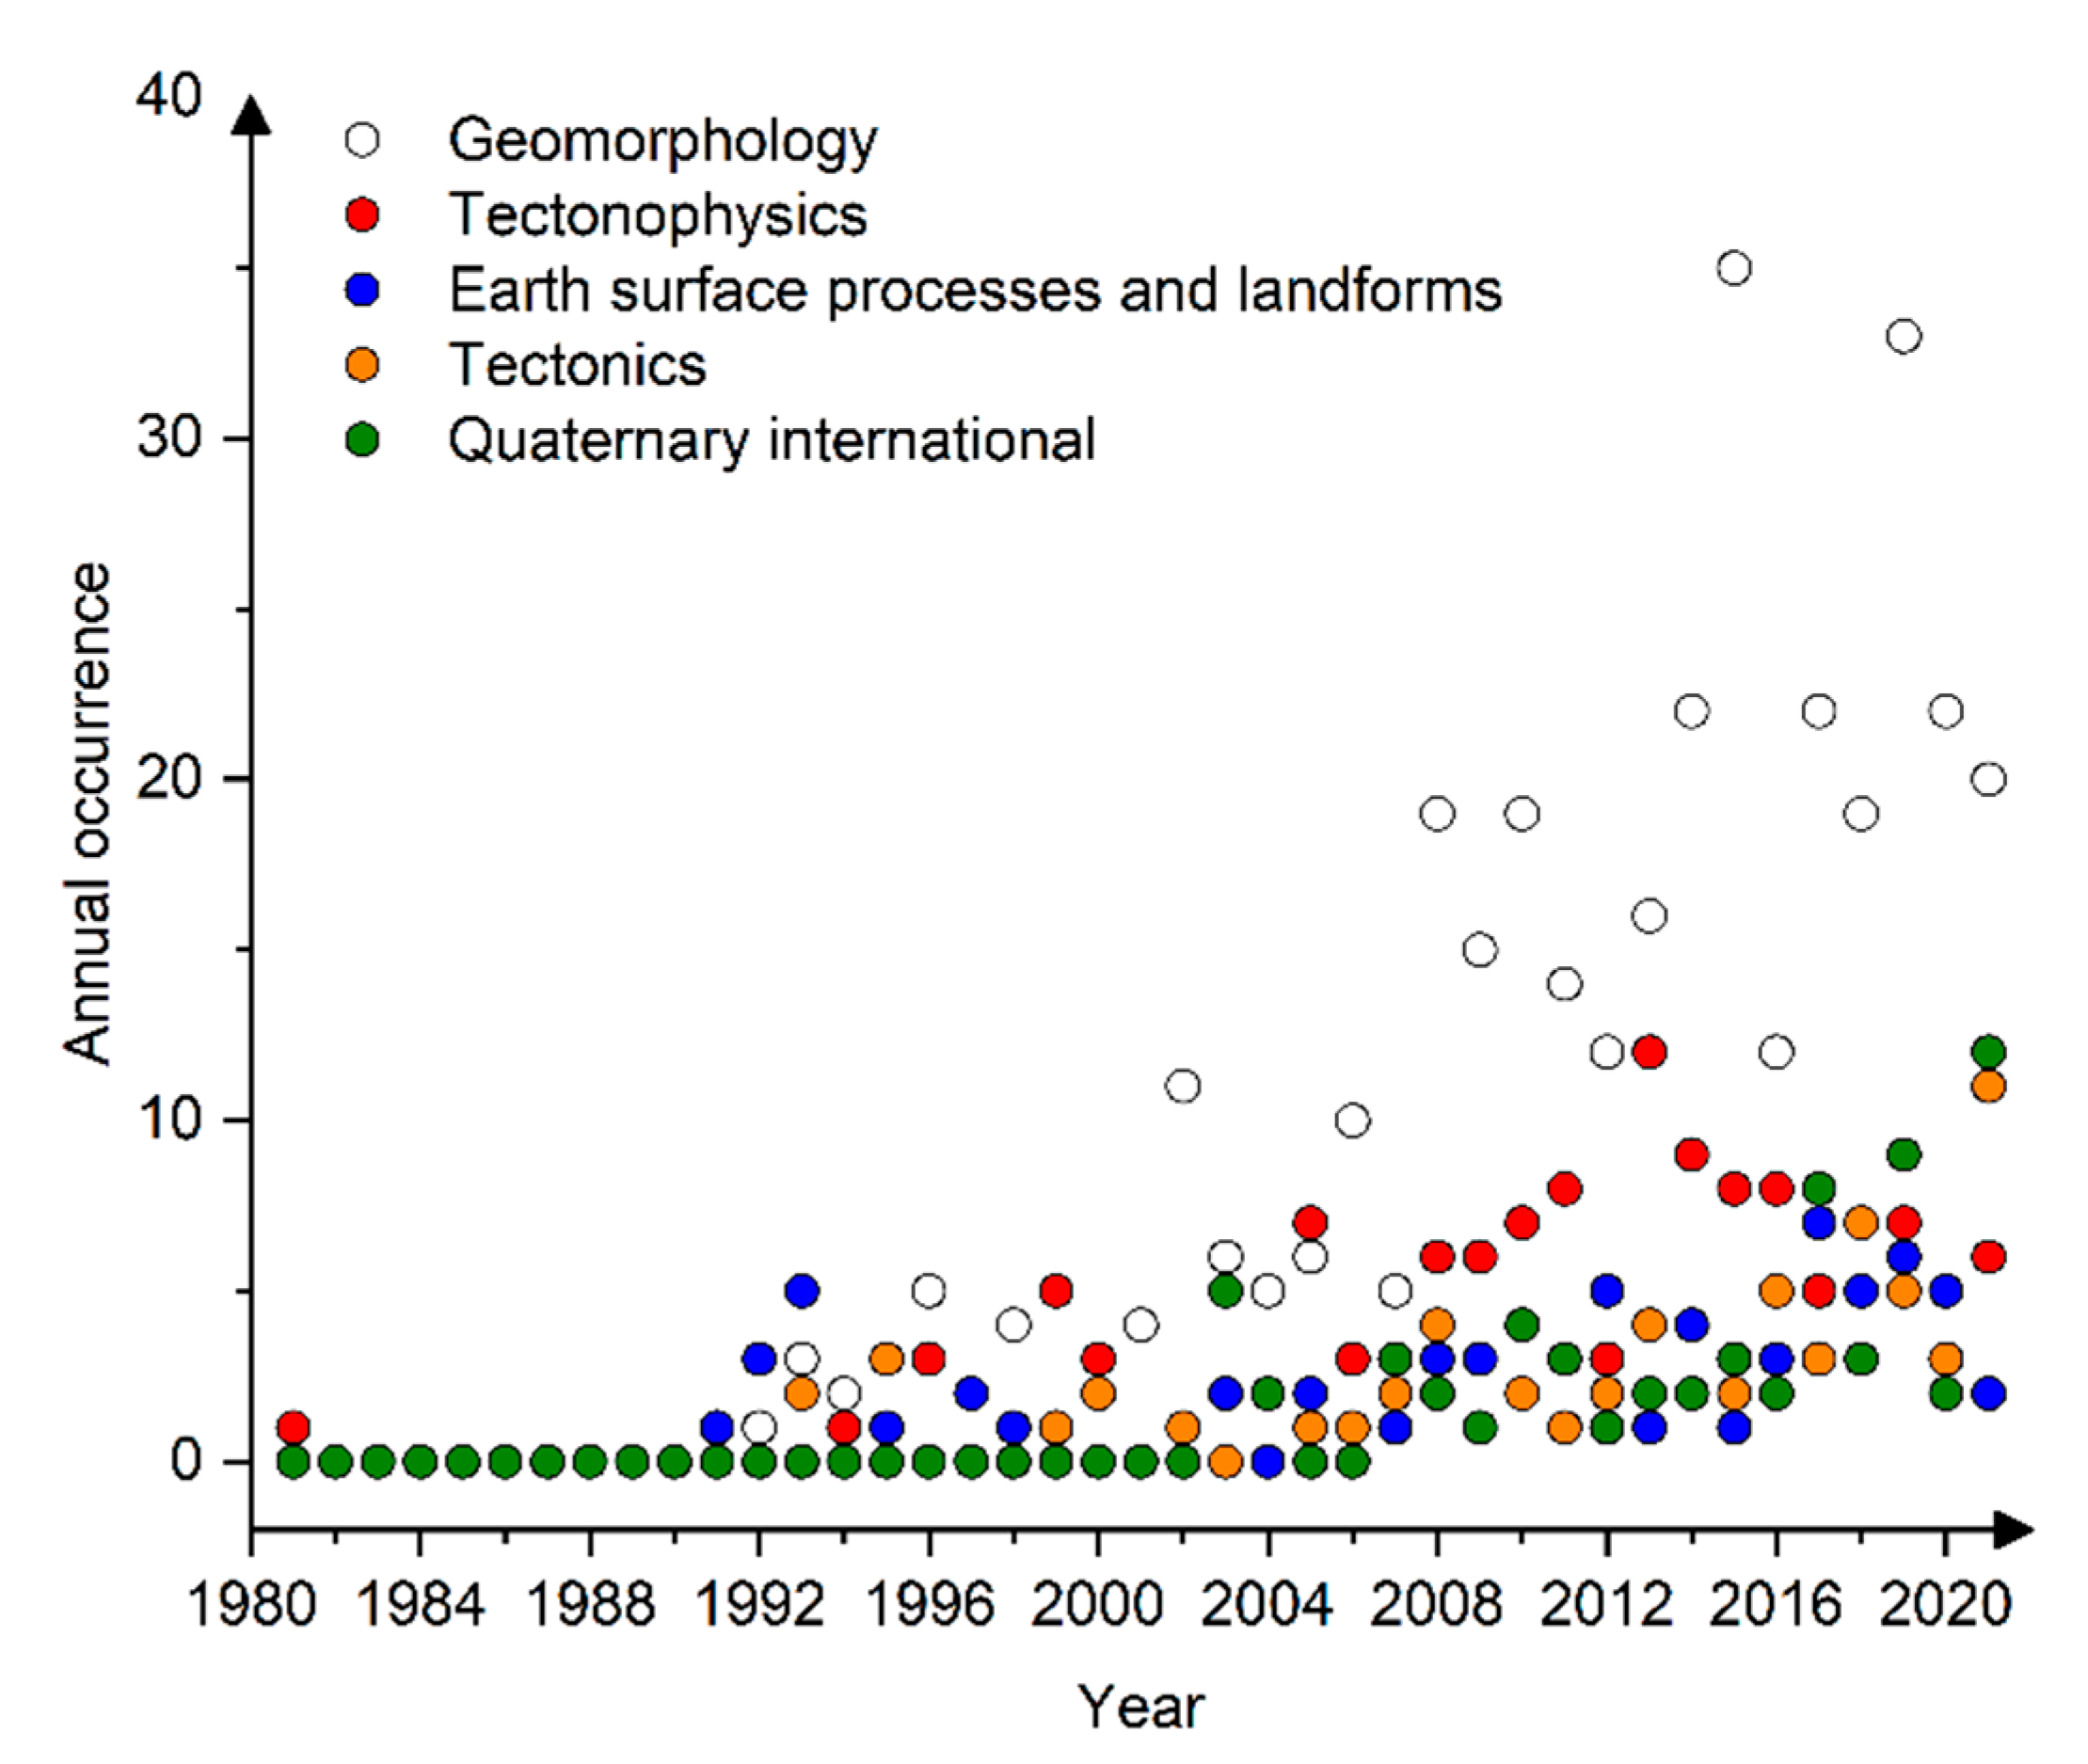
4.5. Journals
The studies about tectonic geomorphology research have been published in 370 journals (
Table 1). There is an increasing trend of journal numbers per year, ranging from four to 21 since 1981. The top 20 journals concerning tectonic geomorphology research have published 1330 articles (5.4%), accounting for 47.6% of the total articles (
Table 3). Each of these 20 journals has published more than 27 articles until 2021. Nevertheless, 291 journals (10.4%) only published 1–5 articles about tectonic geomorphology research. The average impact factor of the top five journals is 3.947, showing the high impact of the tectonic geomorphology research. Therefore, these journals can be recognised as the most powerful source and reference to conduct new tectonic geomorphology research. Moreover, based on Bradford’s Law [
34], the core journals are concentrated in the top 10 journals (
Table 3). As shown in
Figure 4, the journal Geomorphology is an attractive journal with the fastest growth rate. Additionally, as shown in
Table 3, the citations of the top five journals are 10,809, 4737, 4719, 3596, and 2801, respectively, showing the international impact of journals. These results provide effective help to publish and share the main findings in this research area.
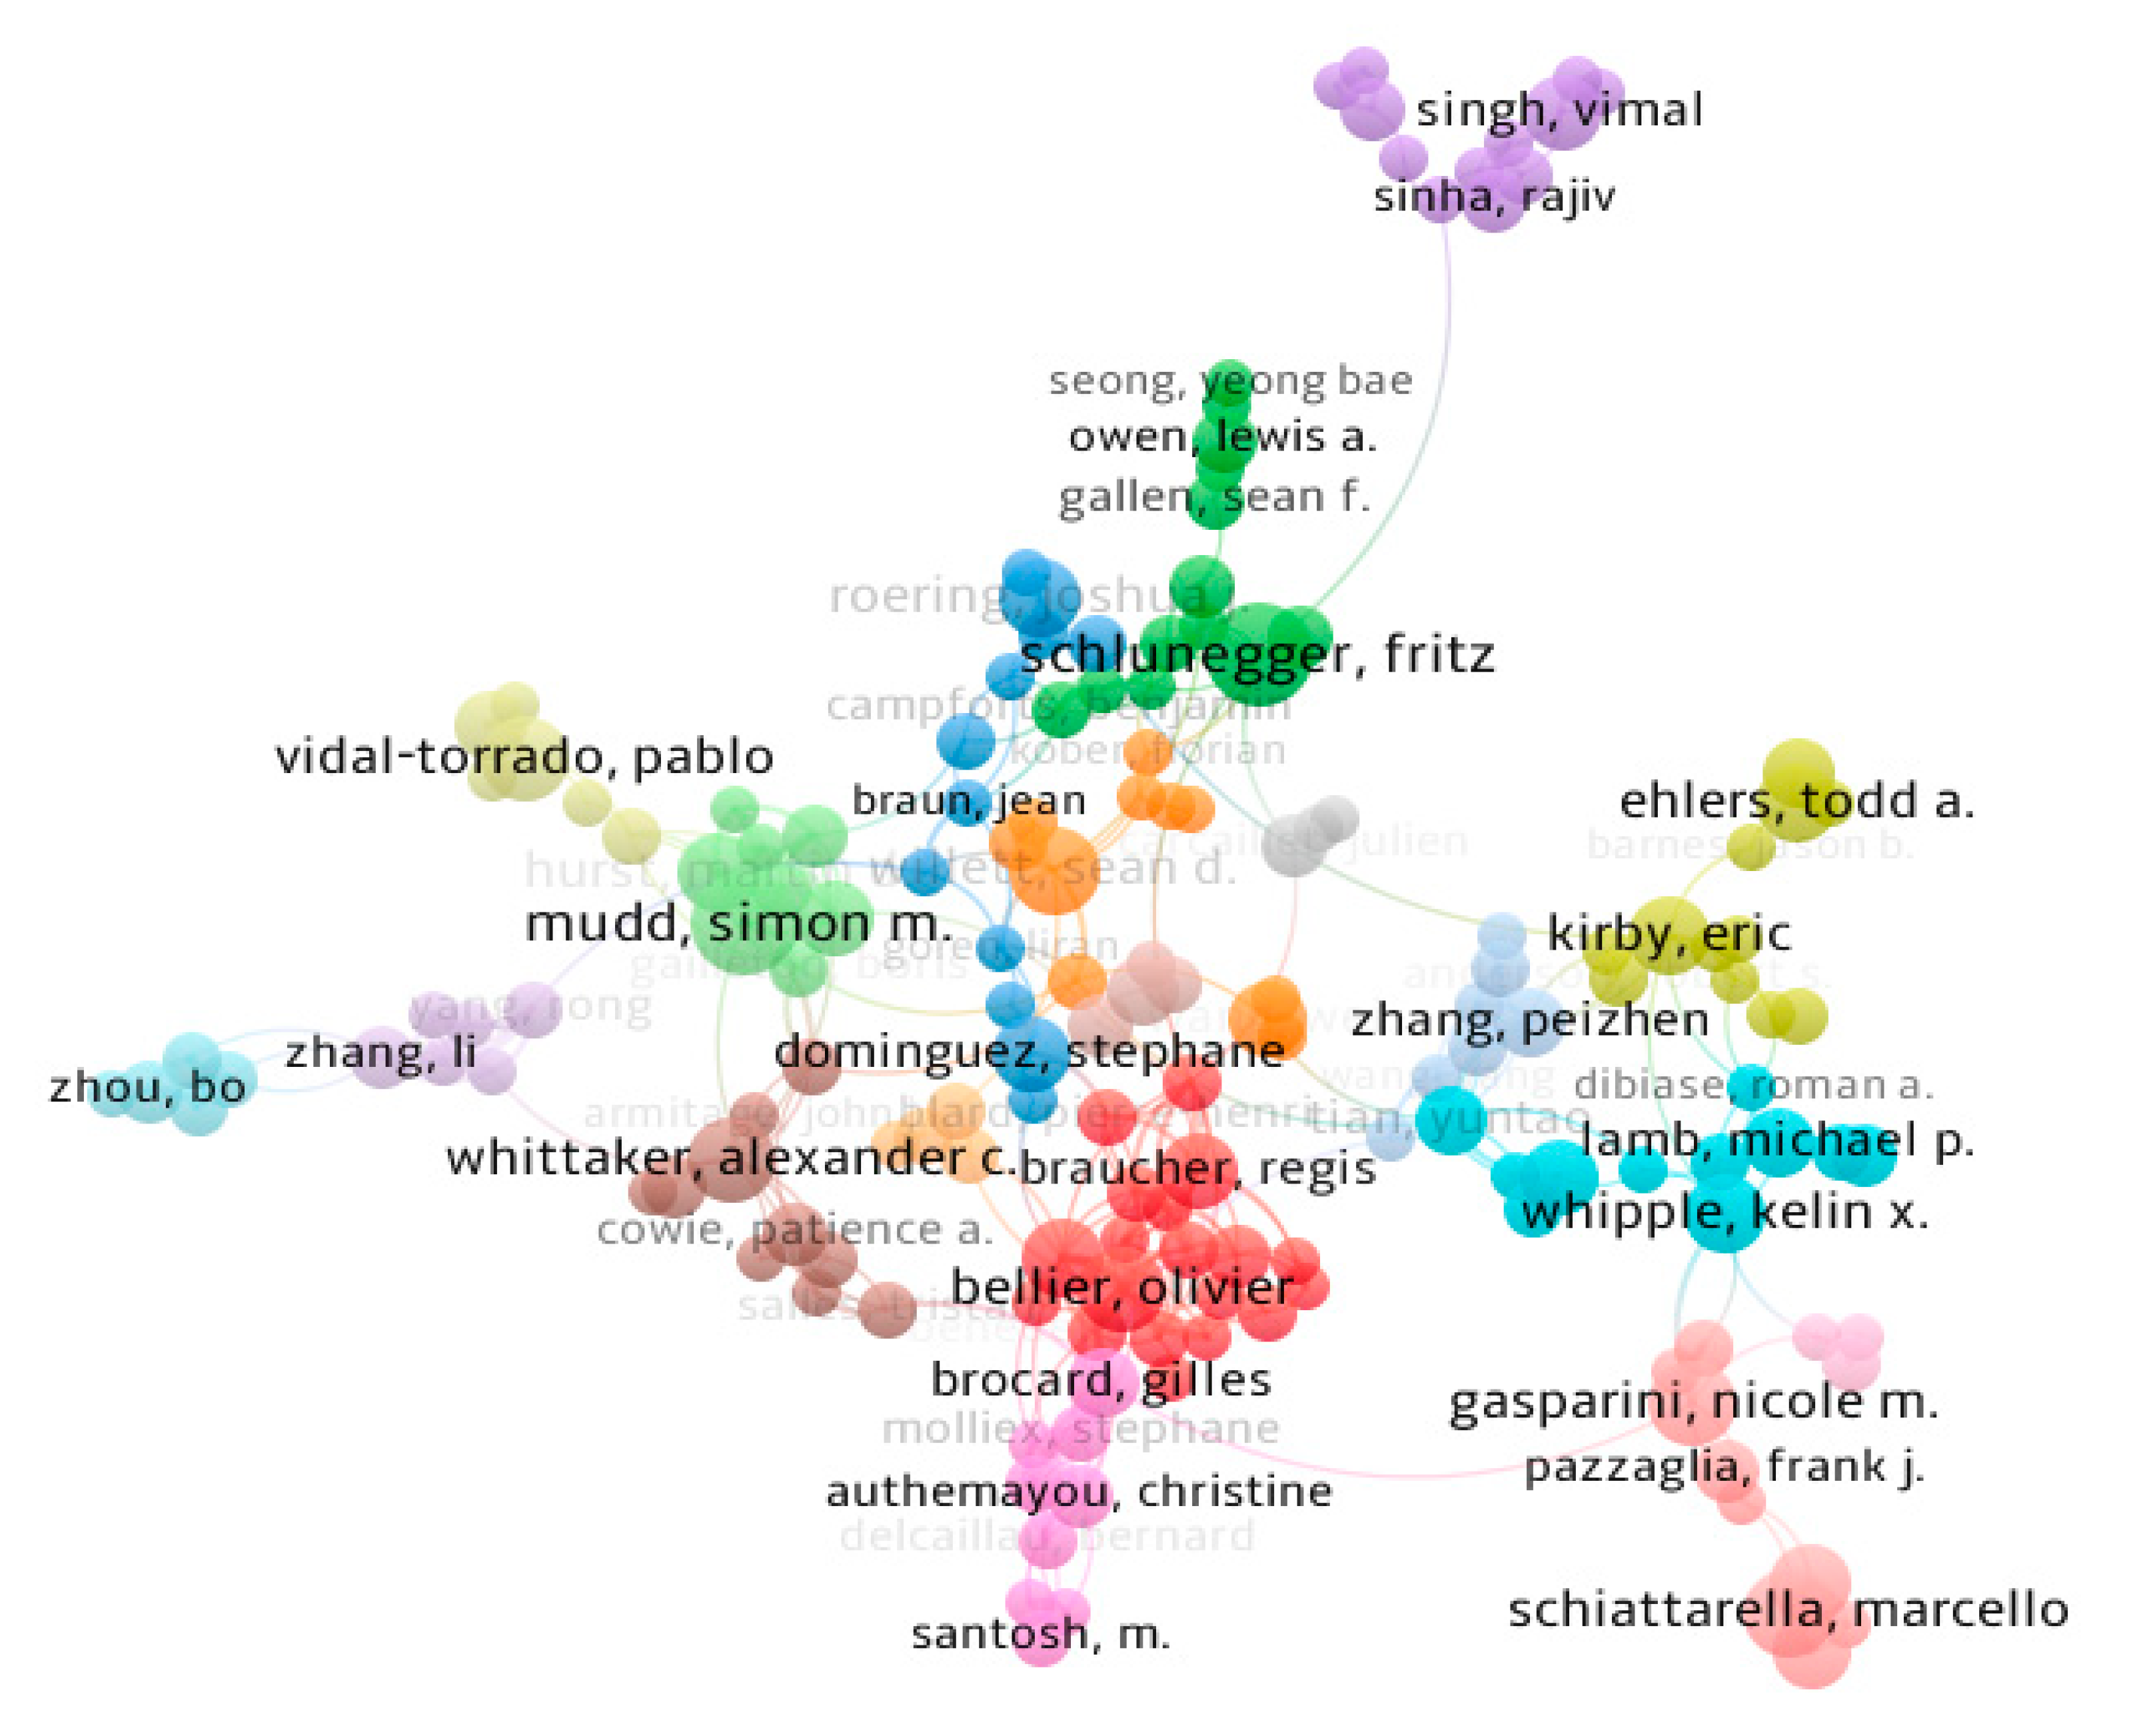
4.6. Authors
There are 8089 authors are focusing on tectonic geomorphology in the dataset (
Table 1). The top 20 most active and productive authors are ranked in
Table 4. The top 10 authors are Whipple K.X. (19), Miccadei E. (20), Caputo R. (14), Kothyari G.C. (22), Piacentini T. (19), Ritz J.F. (15), Strecker M.R. (15), Tucker G.E. (12), Chamyal L.S. (17), and Monaco C. (11), who have published 164 articles. Whipple K.X. has been ranked first and cited 4804 times. The average citation of Whipple K.X. is 9.5 times higher than Miccadei E. Keller E.A. is the first and most productive author since 1982. According to Lotka’s Law [
52] and the M index, Strecker M.R. (0.80), Whipple K.X. (0.79), Kothyari G.C. (0.75), Miccadei E. (0.65), and Whittaker A.C. (0.63) are the top five authors who started to study tectonic geomorphology research. According to the H index, Whipple K.X., Miccadei E., Caputo R., Kothyari G.C., Piacentini T., Ritz J.F., Strecker M.R., and Tucker G.E are the core authors in tectonic geomorphology research, with an average h index of 13 (
Table 4). Although USA, China, and Germany are the top 10 productive countries, there is only one author in these countries ranked in the top 20. Additionally, as shown in
Table 1, there are a total of 240 single-authored articles in tectonic geomorphology research which are generated by 209 authors. The remaining articles are co-authored, with a co-author index per article of 4.28, indicating that the tectonic geomorphology studies need more authors cooperate to achieve an international impact (
Figure 5).
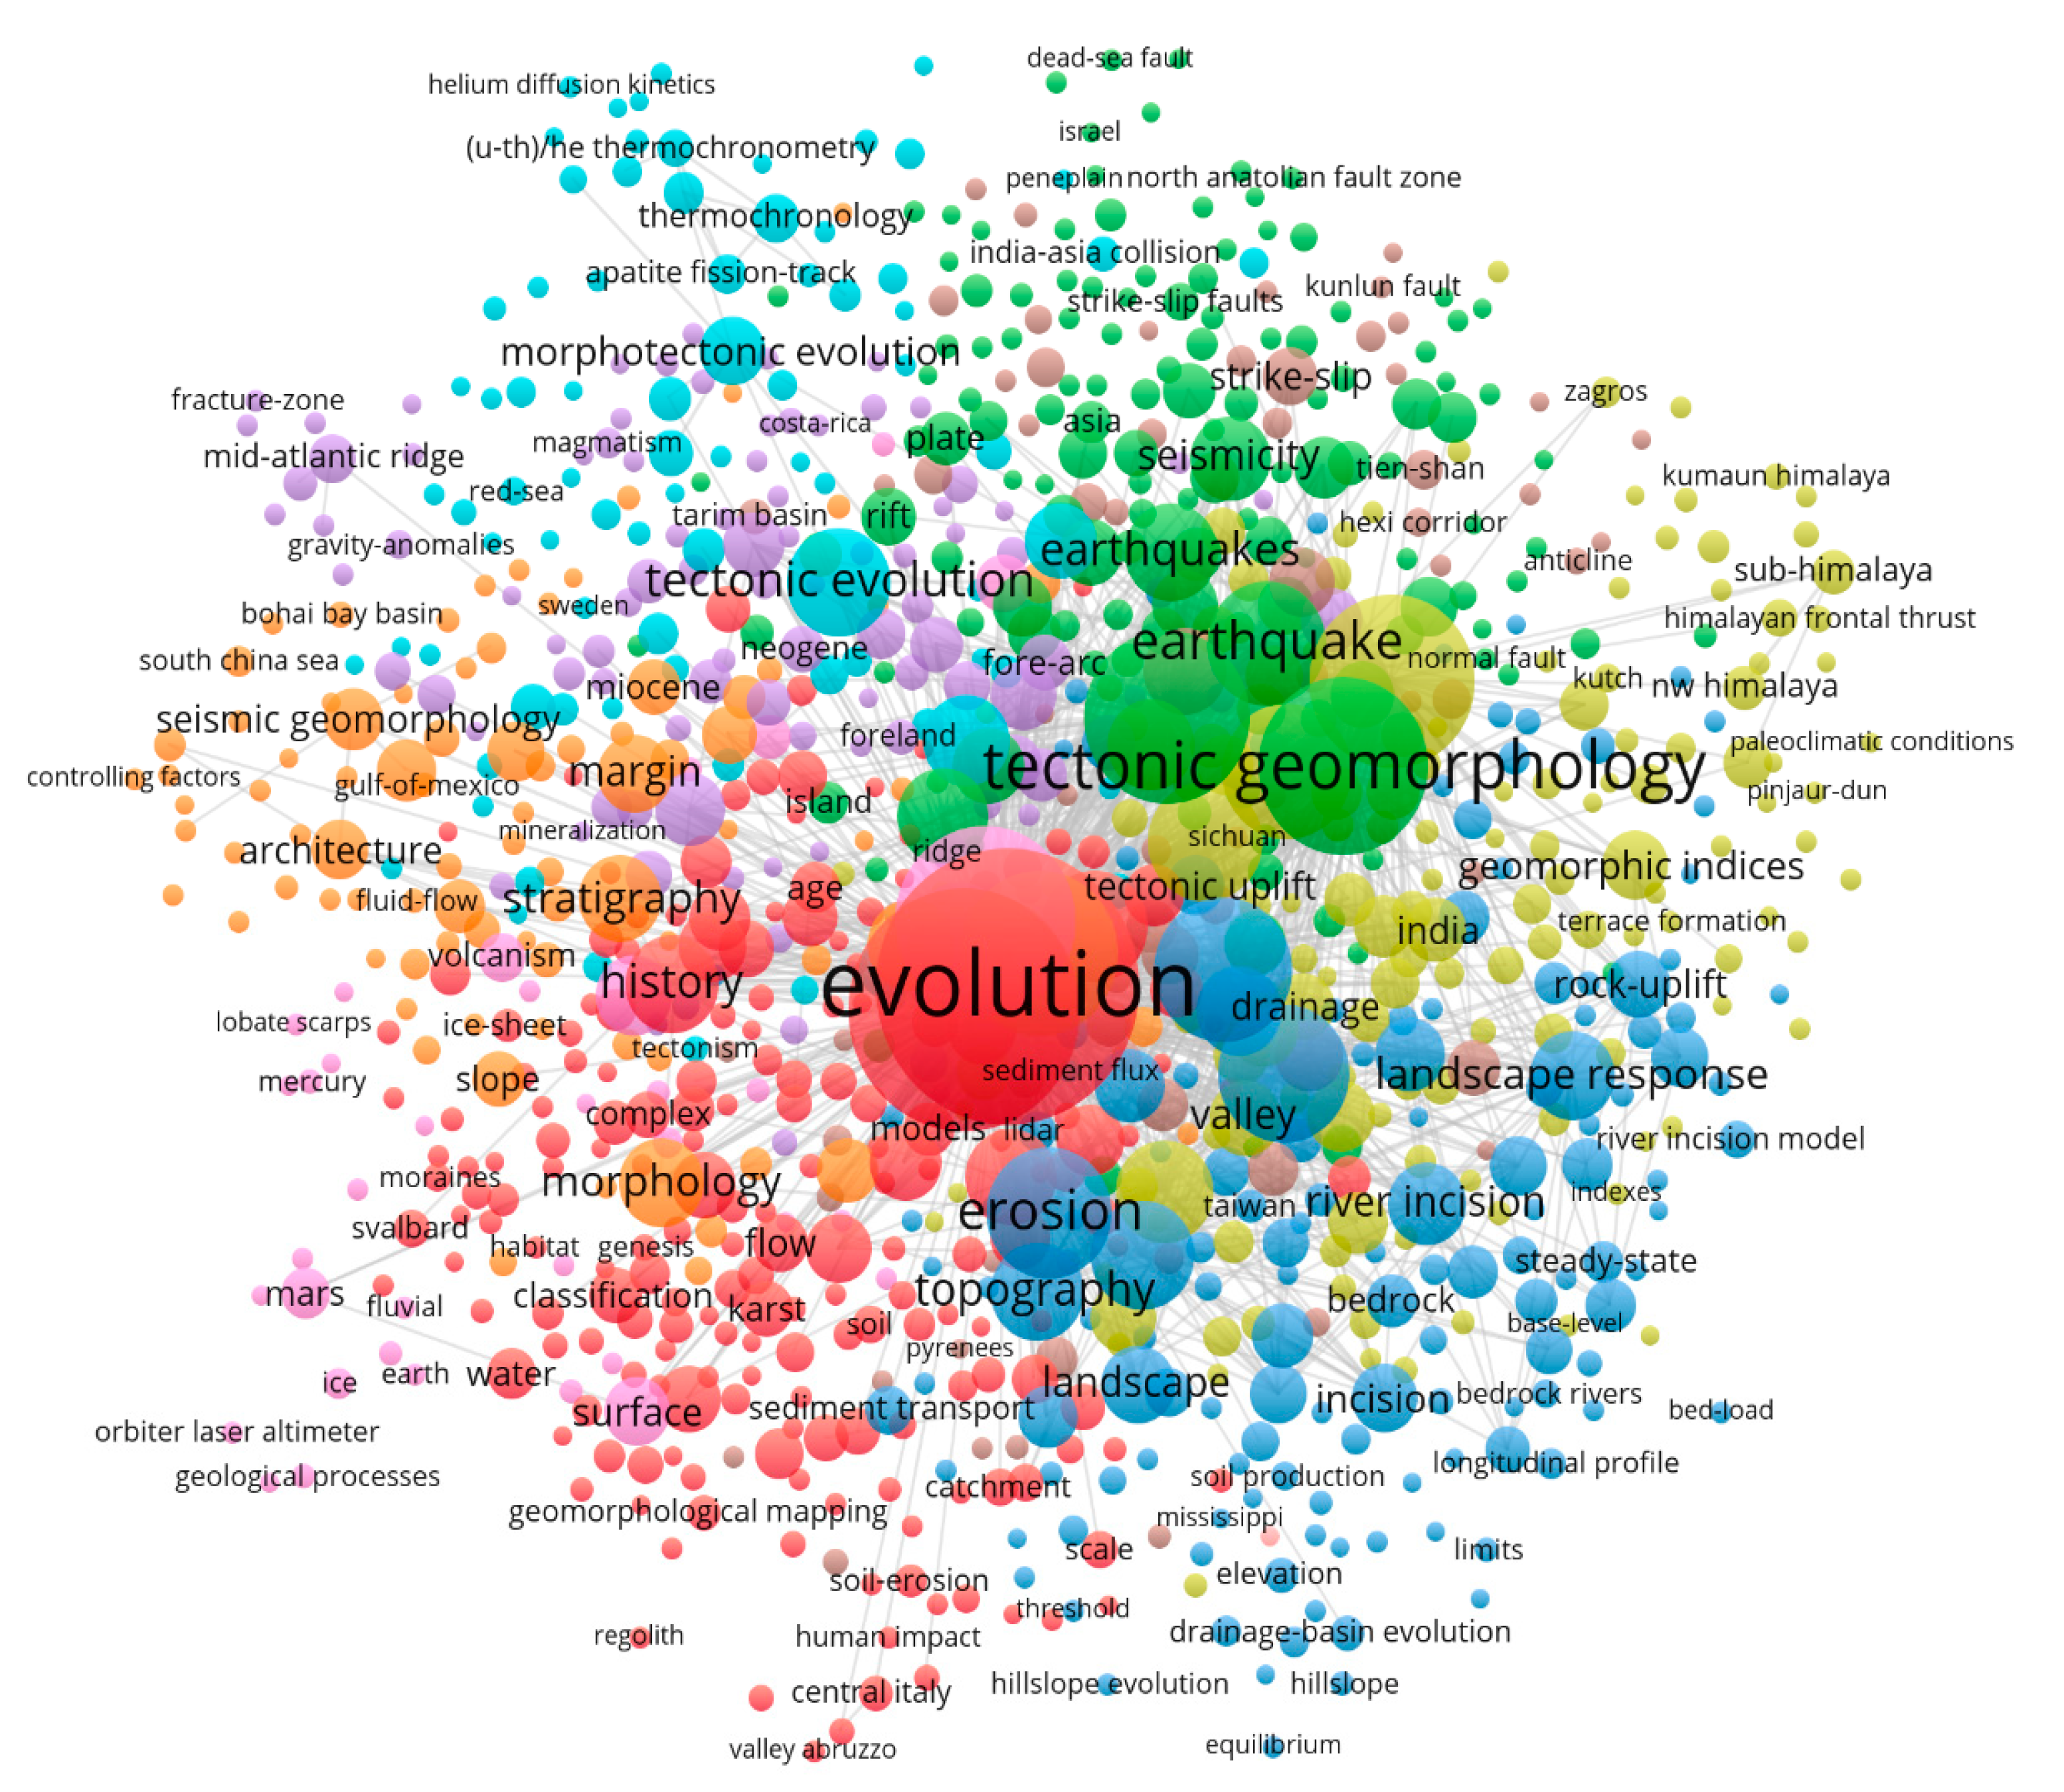
4.7. Keywords
In the past four decades, a total of 6546 keywords (
Table 1) are extracted from the dataset and clustered into a co-occurrence network by the weights link and the total link strength (
Figure 6). All the clusters are grouped into different colours. The larger the cluster node, the bigger the keyword’s contribution to the group. The thicker the connecting line between two clusters, the closer the interaction between the two keywords. As shown in
Table 5, the top 20 keywords are extracted by the co-occurrence in these articles, showing that they are related to four research areas: (1) tectonic evolution processes (Evolution, Deformation, Tectonic evolution, Landscape evolution, Constraints), (2) tectonic geomorphology (Basin, Geomorphology, Erosion, River, Landscape response), (3) tectonics (Tectonics, Uplift, Active tectonics, Fault, Earthquake, Earthquakes), and (4) tectonic structure (Model, History, System, Region).
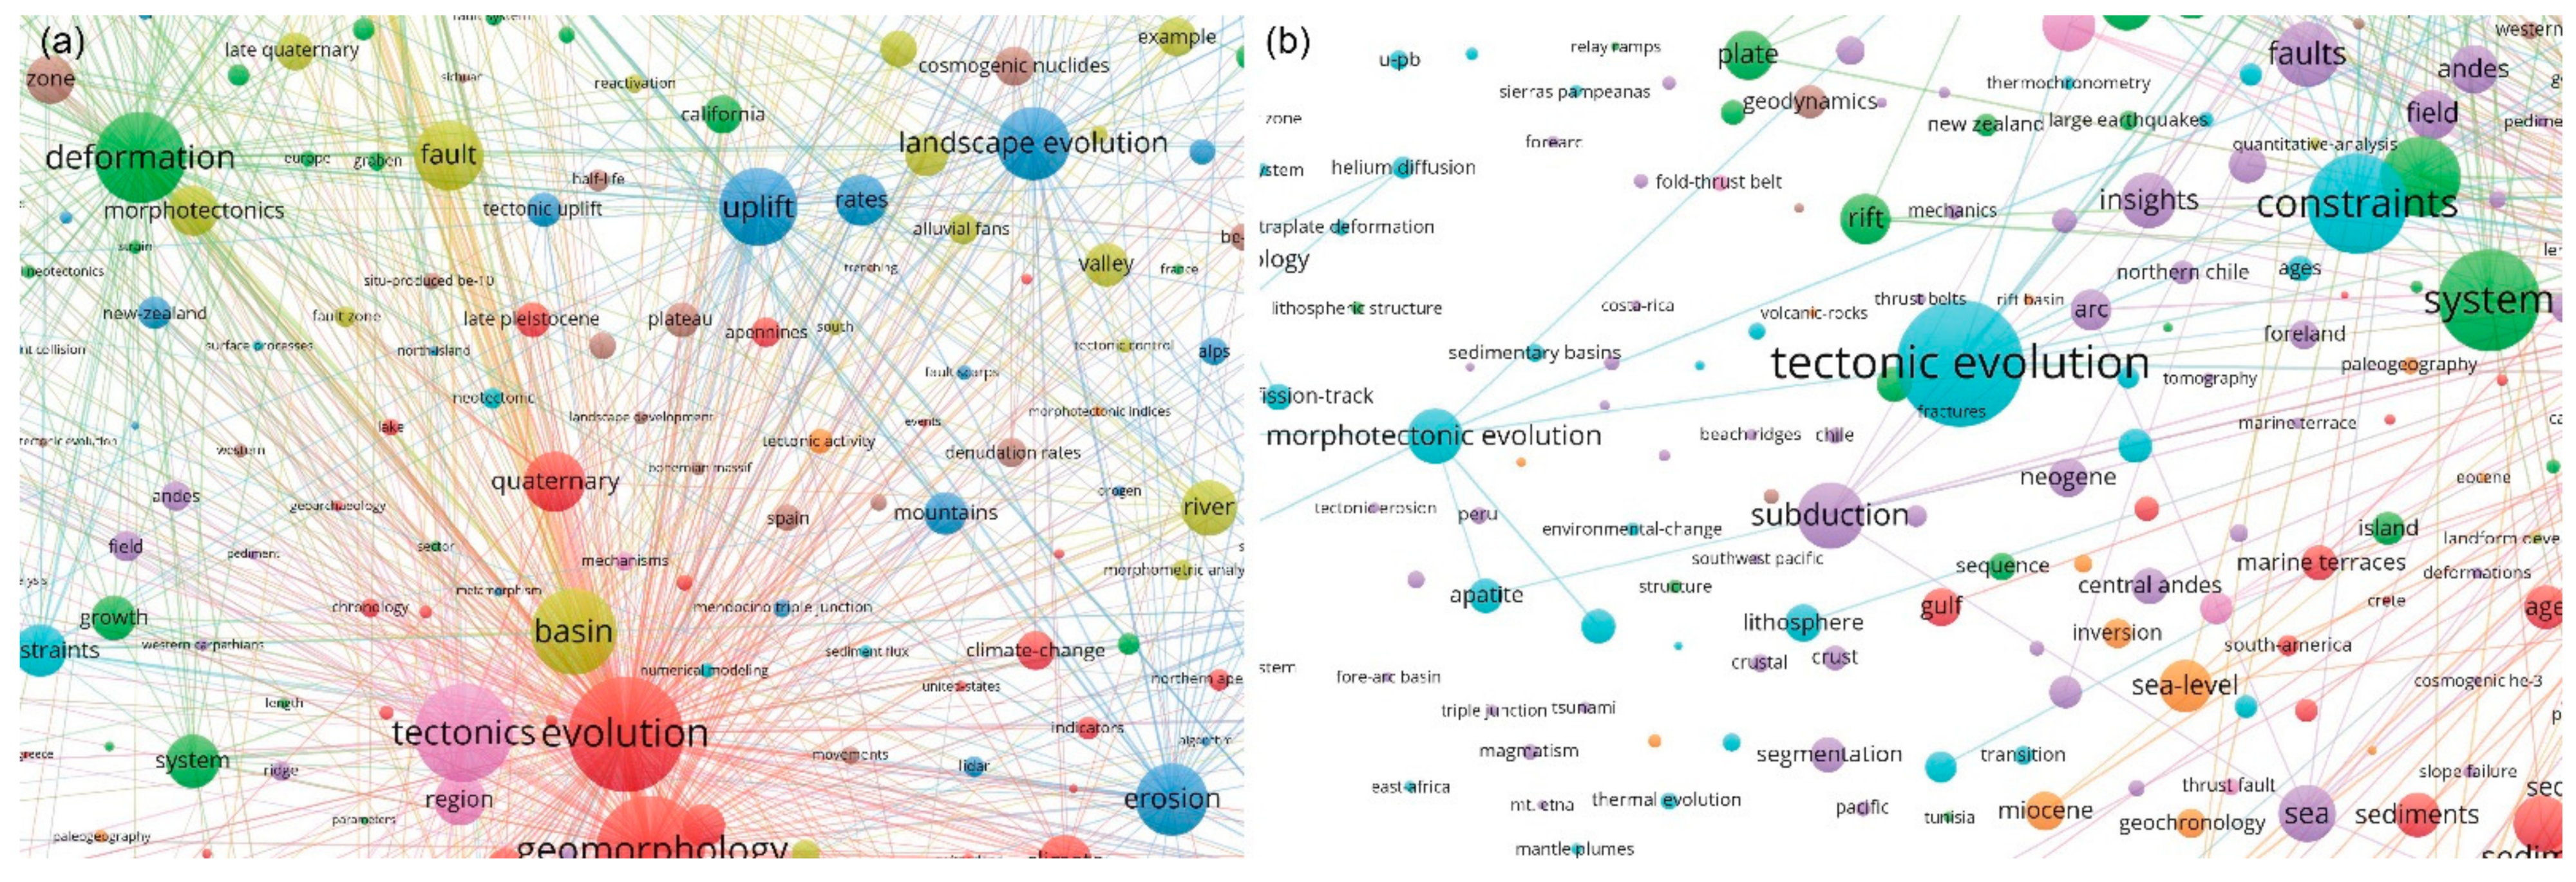
Additionally, the key clusters can also help researchers to understand the relationship between the different hotspots. The top 12 clusters are detected and visualized with different colours (
Figure 6), and labelled by the numbers and co-occurrences (
Table 6). Cluster 11 “Evolution” has the most occurrence (622) and links (771), and the highest weight total link strength with the other clusters (3504). We zoomed in the keywords network to show the relation to other clusters (
Figure 7). As shown in
Table 6, the top two keywords with the most links and highest strength are “Evolution” and “Deformation”, which are consistent with Web of Science. The links and strengths of these keywords are 1311 and 5096, respectively, showing that these keywords are the main hotspots in tectonic geomorphology research (
Figure 7). The keywords with the top link strength to the keyword “Evolution” are “Basin” (Cluster1-92), “Deformation” (Cluster2-75), “Tectonics” (Cluster10-74), “Uplift” (Cluster5-63), and “Active tectonics” (Cluster2-54), respectively. The keywords with the top link strength to the keyword “Tectonic Evolution” are “Deformation” (Cluster2-13), “Basin” (Cluster1-10), “Constraints” (Cluster7-9), “Morphotectonic evolution” (Cluster3-6), and “River” (Cluster1-6). Although the names of the clusters are similar, the components and relation are different, indicating that tectonic geomorphology is a multidisciplinary research area.
4.8. Citations
Based on the co-citation analysis, the top five references with the most frequency from 1981 to 2021 are shown in
Table 7. The frequency can show the academic influence of a specific article. The top article with the highest frequency (54) and centrality (0.12) is that of Kirby and Whipple [
53], showing the importance and position in the co-occurrence network. Based on the SPIM, these researchers use the river long profiles to show the positive and monotonic relationships between channel steepness index and erosion rate at equilibrium. They also find that the knickpoint can be regarded as a marker to show variations induced by active faulting, in which the slope-break knickpoint in the channel long profiles can reveal the transient response induced by the tectonic uplift, while the vertical-step knickpoint does not show the tectonic significance but locate the fault position. Compared with the method based on the geomorphic index, the details of slope deformation are more specific and quantifiable from remote sensing data, therefore, more and more researchers are focusing on slope change. This work establishes the position in the co-occurrence network in tectonic geomorphology studies and is closely linked to other subsequent studies, e.g., the channel width analysis [
7]. Based on the steady-state form of the SPIM, Perron and Royden [
54] propose an alternative index called chi plots (
χ) to identify erosional signals in transient longitudinal profiles. Furthermore, Lague [
55] provides new insights concerning the role of incision with channel width, and also uses a threshold-stochastic simulation model with width (composite transient dynamics) to explain the shortcomings and deficiencies of SPIM, where width may not sensitive to incision rate. Willett et al. [
56] consider the drainage divide migration which can reshape basins and change the topology through river capture. They also use the chi plots to demonstrate the horizontal motion of drainage divides, which complement the dynamic reorganization theory of basins and provide a basis for analysing the interactions between tectonics, erosion, and climate. Whipple et al. [
14] find that the changes in river profiles resulting from drainage divide migration are comparable to the tectonic, climate, and rock properties. They also introduce a nondimensional divide migration number,
NDm, to assess the feedback mechanisms of migration. Furthermore, they find that the interpretation of river profile changes in terms of drainage area associated with divide migration and network reorganization may be inappropriate in tectonically active regions. These findings point out the research hotspots and trends in the tectonic geomorphology research, i.e., how to use the fluvial geomorphic indices and drainage divide migration to quantify the tectonic uplift.
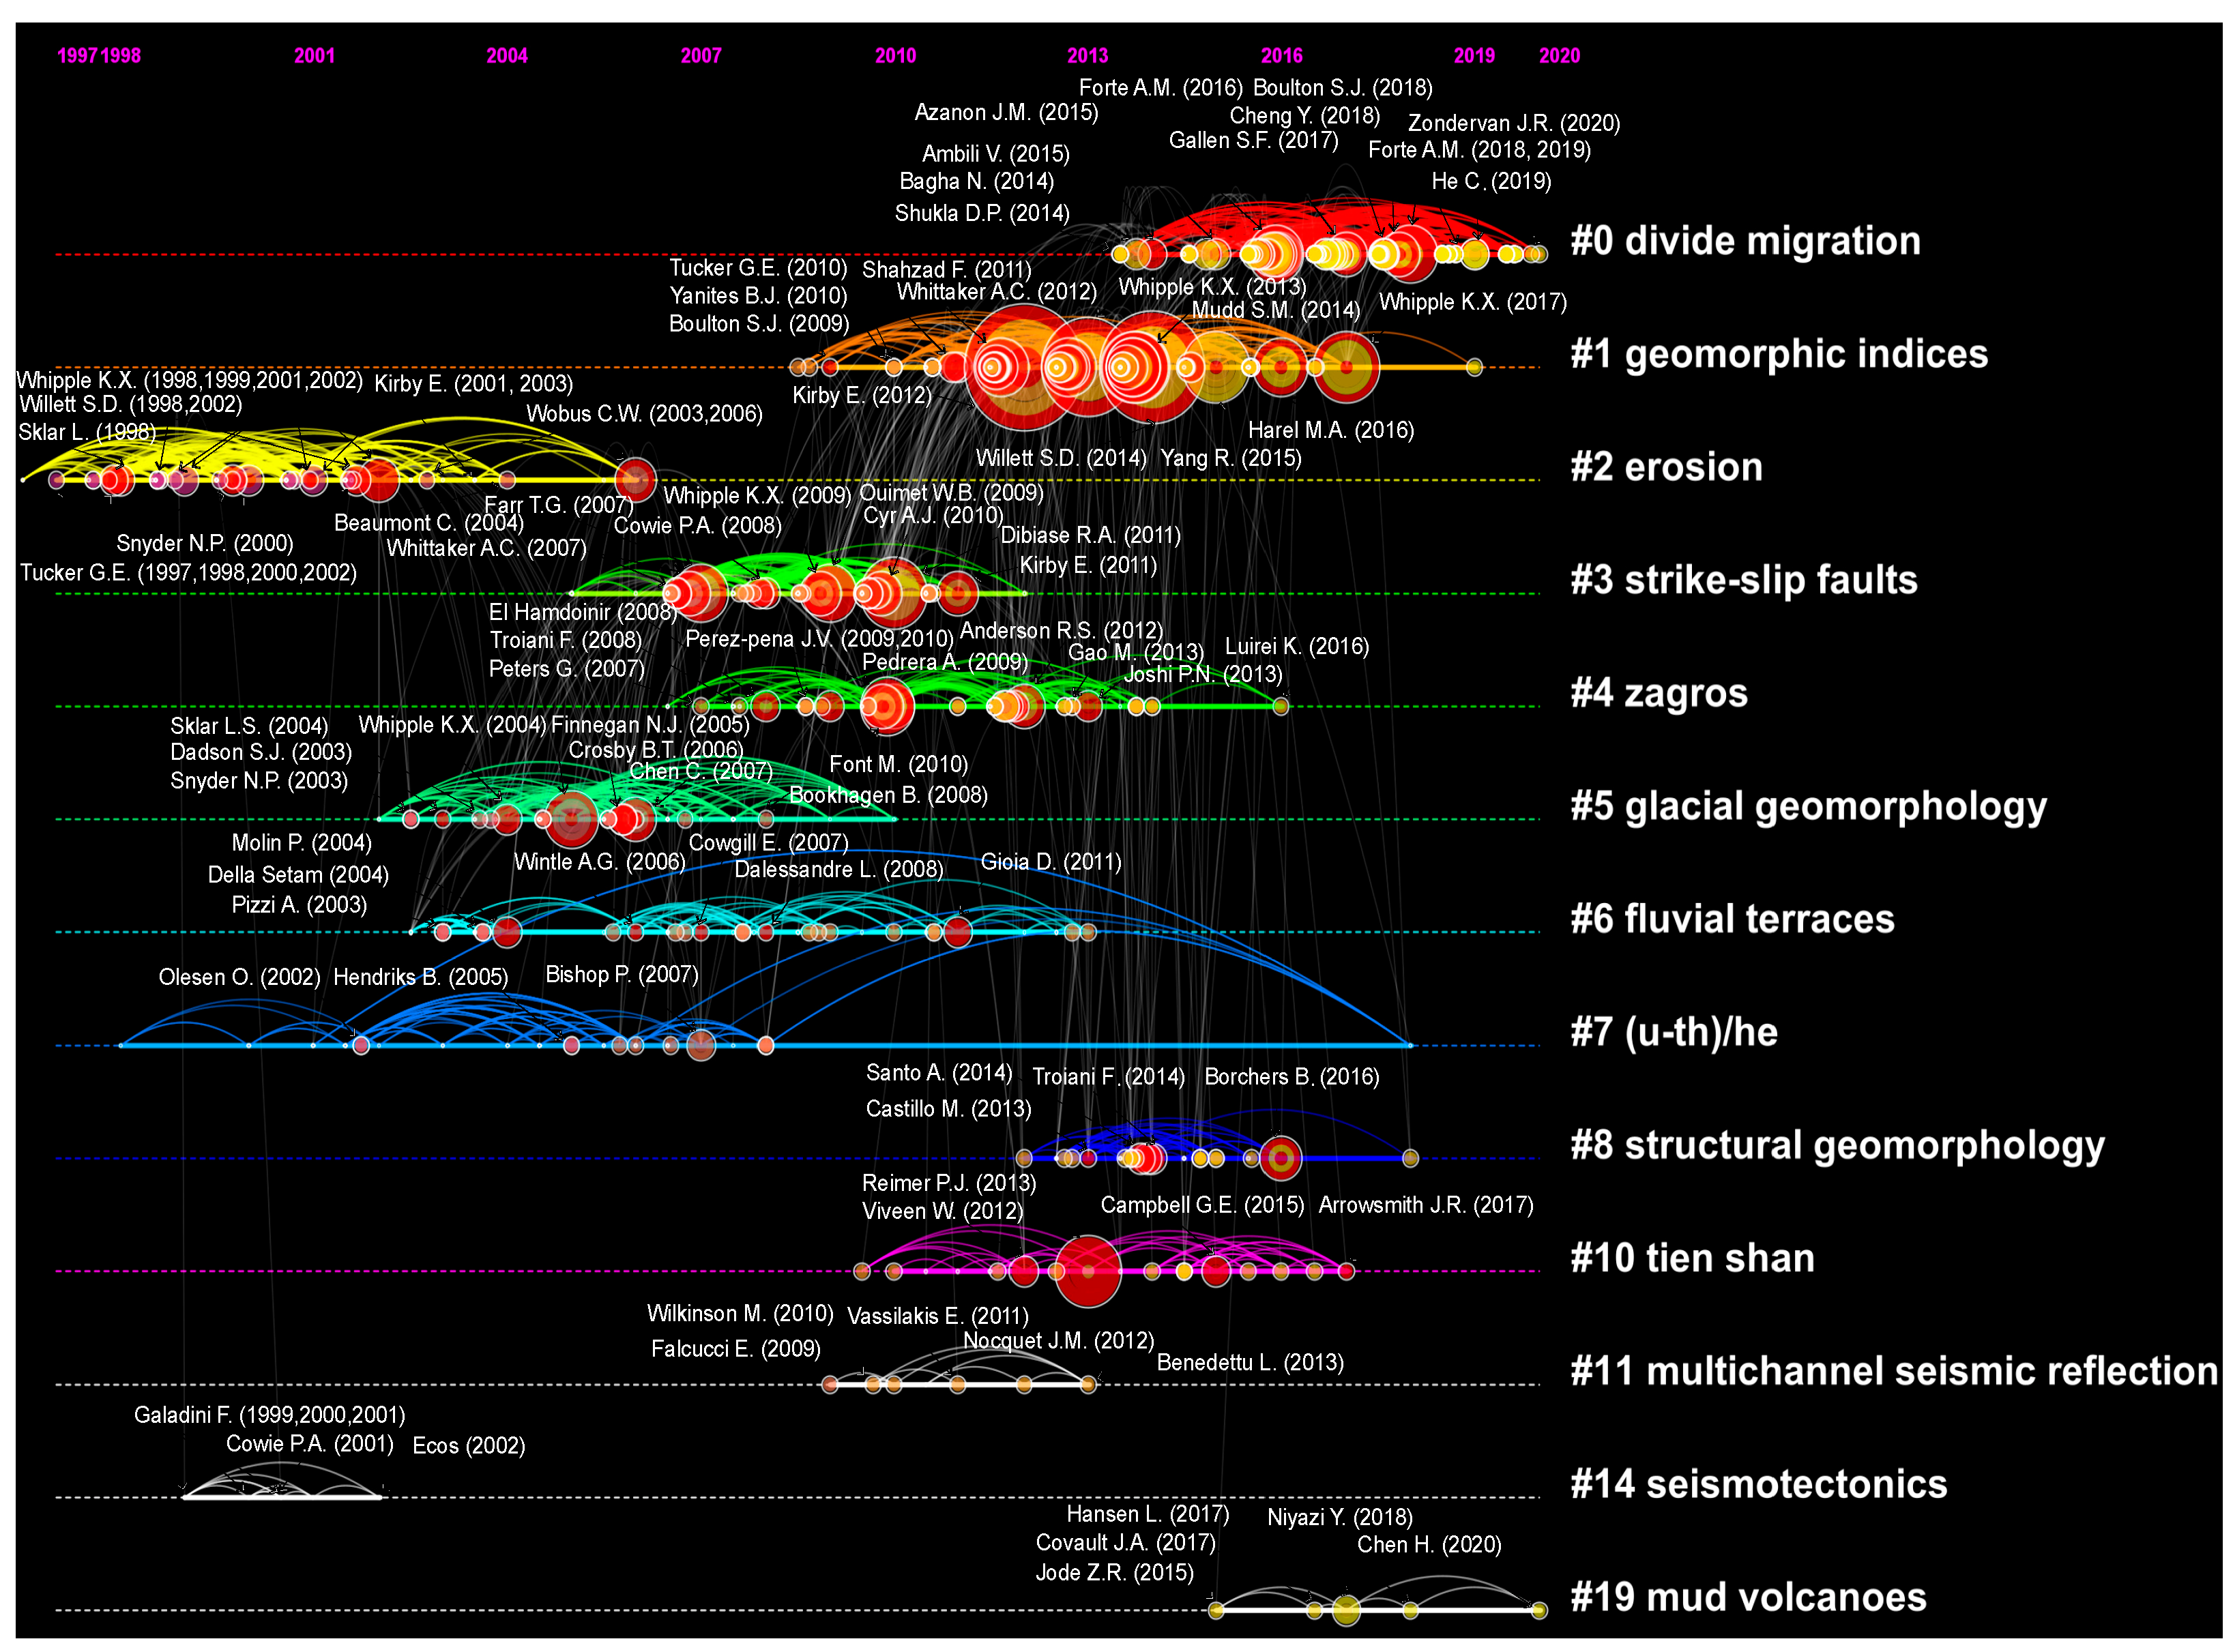
As shown in
Figure 8, the references are clustered and shown by using LLR algorithm in the timeline view. Ten clusters representing the research trends in tectonic geomorphology research are numbered, coloured, and listed according to their co-citations and keywords, where the top cluster being the newest research hotspots and trends. Moreover, each cluster lasts a different timeline. The colourful curves are the co-citation lines linked the two corresponding years. The cluster #0 “Divide migration” has 115 references, while the smallest cluster #19 “Mud volcanoes” only contains five references (
Table 8). There are also some big nodes with red tree rings, which represent the articles with high citations. For example, the node with Boulton and Whittaker [
57] is smaller than the node with Whittaker and Boulton [
50], showing that the former citation has fewer citations, even though the authors are same. Additionally, previous studies have shown that the visualization of clusters is better and the nodes in the cluster are homogeneous when the silhouette is >0.5 [
29,
30,
32]. As shown in
Table 8, the silhouette value of all clusters is larger than 0.85, showing that the cluster is reliable.
Specifically, the largest node to cluster #0 is Forte and Whipple [
15], which mainly provides a series of MATLAB tools to simulate the landscape evolution and show how the drainage divide migrates under different conditions (e.g., climate, tectonic, rock erodibility, etc.). They also find that cross-divide contrasts in chi plots can represent current divide migration when the surrounding conditions are similar. The nodes to cluster #0 mainly result from cluster #1 “Geomorphic indices” with 91 nodes. The silhouette value of cluster #1 is 0.854 and the biggest node is Kirby and Whipple [
53]. In view of their work, more studies start to focus on the geomorphic indices (channel steepness and wideness) extracted from the DEM to determine the interaction of climate, tectonic, and lithology. These nodes overlap and show high impact (i.e., larger nodes and red burst rings) in the timeline view. Therefore, the cluster #0 and #1 are the hotspots in tectonic geomorphology research to date. However, there are some differences between these two clusters. The geomorphic indices are mainly focusing on the extraction of transient geomorphic indices while the divide migration concerned the long-term changes in landforms. Additionally, there are also some links between cluster #3 “strike-slip faults” and the top 2 clusters (cluster #0 and #1), showing a strong correlation between them. Cluster #3 has 61 members and a silhouette value of 0.92. The active period of this cluster is from 2007 to 2011. The most representative node to cluster #3 is Whittaker, et al. [
58], as they find that the loss of hydraulic scaling is an intrinsic response to tectonic forcing.
The third-largest cluster #2 “Erosion” has 70 members, and the silhouette value is 0.978. Through the timeline view, it is interesting to see that clusters #0, #1, #3, and #4 started at the end of cluster #2. Previous studies have shown that the interaction between erosion and active tectonics has driven researchers to explore the erosion rates by using the tectonic uplift difference from channel morphological features, such as
ksn,
kwn, HI, VF, and Bs, etc. [
11,
44,
45,
59,
60]. These members and links imply that the clusters #0, #1, #3, and #4 may start or generate from cluster #2.
Clusters #5 (labeled glacial geomorphology), #6 (labeled fluvial terraces), and #7 (labeled (u-th)/he) are mainly focused on using current landform extrapolating the ancient morphology. Therefore, the start time of these clusters is similar. Specifically, our previous work [
45] chose the time measured by optical stimulated luminescence (OSL) dating from the paleosol along the river terraces [
18] as the knickpoint formation time to estimate the fault initiation. These clusters support and complement each other in tectonic geomorphology research.
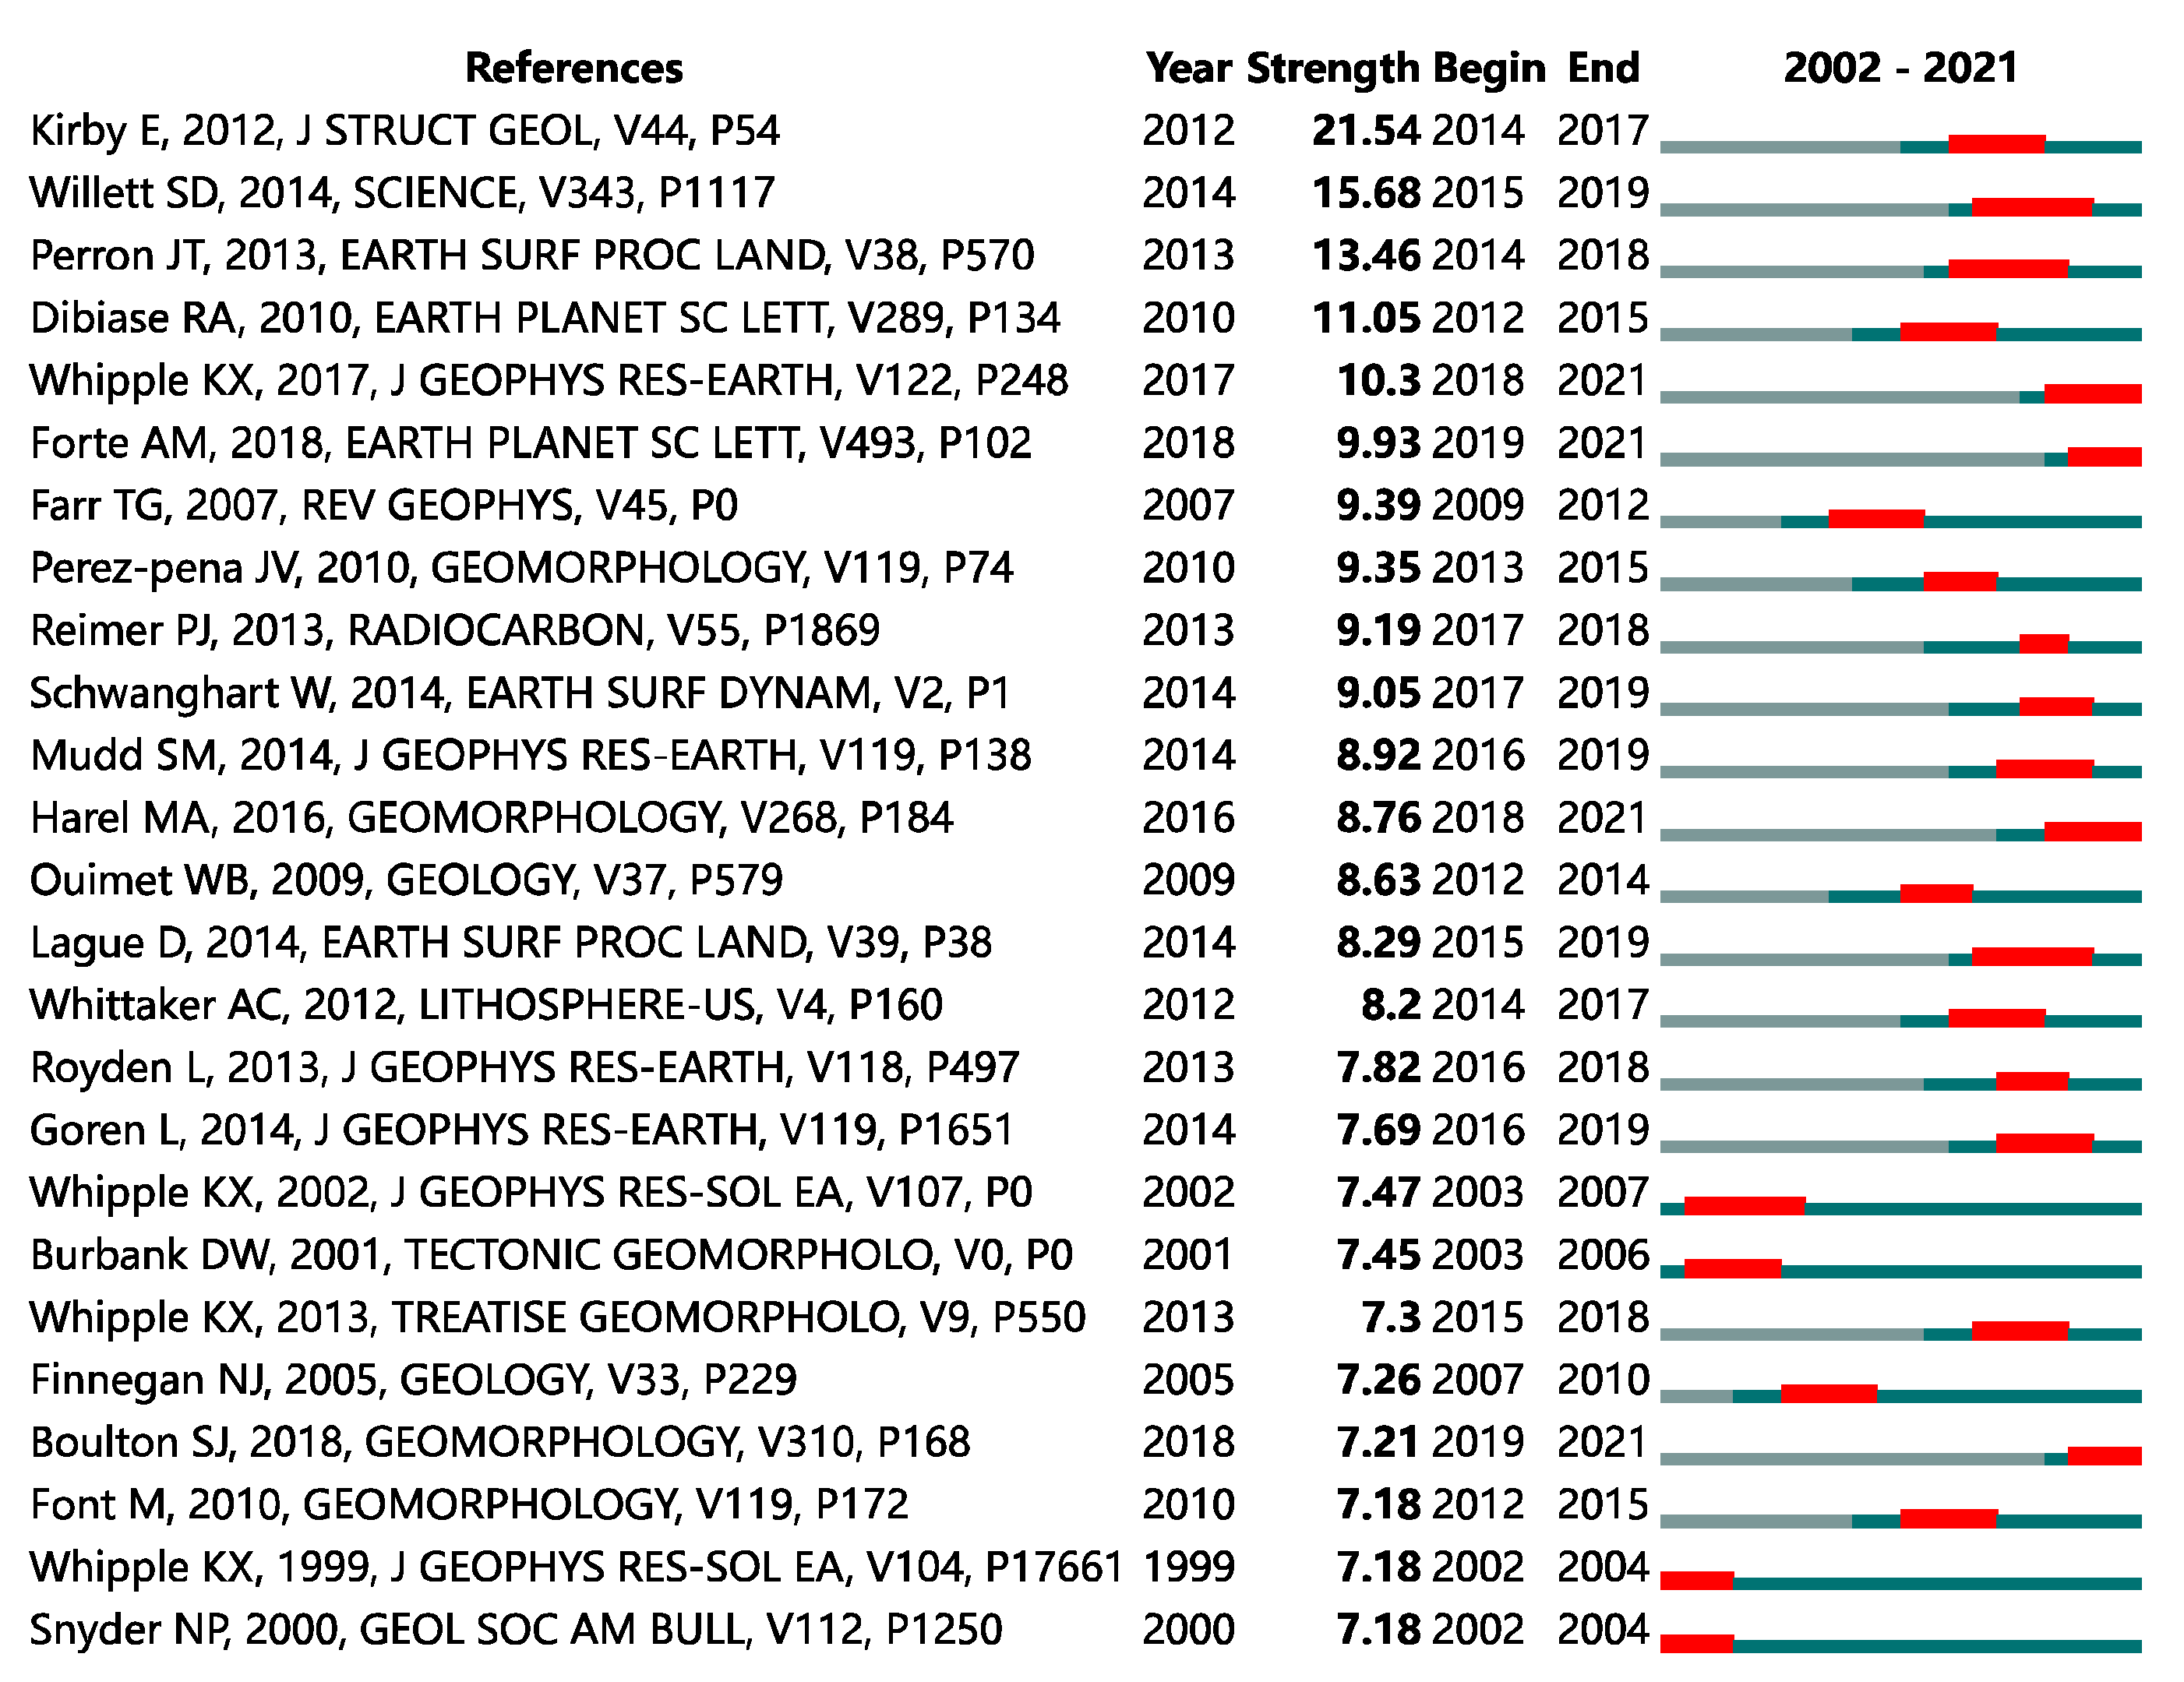
Based on the burst analysis [
29,
30], the top 25 references are extracted and ranked by strength (
Figure 9). These studies are mainly focused on the changes in fluvial landforms induced by the active faulting and climate, where 13 burst articles (52%) focus on cluster #1 (
Table 9). These works can help researchers find the hotspots and trends in the tectonic geomorphology research, understand the paleoclimatic state of the study area, and achieve the goal of prediction and dynamic monitoring of geological hazards.


 ,
, 


