Article

Optimizing Radar-Based Rainfall Estimation Using Machine Learning Models

1
WSP Global Inc., Ottawa, ON K2E 7K5, Canada
2
Weather Impacts Consulting Incorporated, Barrie, ON L4M 4Y8, Canada
3
Center for Research in Earth and Space Science, York University, Toronto, ON M3J 1P3, Canada
4
Environment and Climate Change Canada, Toronto, ON L7B 1A3, Canada
*
Author to whom correspondence should be addressed.
Remote Sens. 2022, 14(20), 5188; https://doi.org/10.3390/rs14205188
Submission received: 28 August 2022 / Revised: 6 October 2022 / Accepted: 12 October 2022 / Published: 17 October 2022

Abstract

:
Weather radar research has produced numerous radar-based rainfall estimators based on climate, rainfall intensity, a variety of ground-truthing instruments and sensors (e.g., rain gauges, disdrometers), and techniques. Although each research direction gives improvement, their collective application in an operational sense still yields uncertainty in rainfall estimation at times. This study aims to explore the concept of implementing Machine Learning (ML) models in optimizing the radar-based rainfall estimations at the bin level from a group of estimator. The Canadian King City C-Band radar was used with a GEONOR T-200B rain gauge (a total of 263 sample points) to establish a group of polarimetric-based rainfall estimators (R(Z), R(Z, ZDR), R(KDP)). The estimators were used to train three ML models, namely Decision Tree, Random Forest, and Gradient Boost, to choose the optimal rainfall estimators based on radar variables (Z, ZDR, KDP). Data from the Canadian Exeter C-Band radar and a Texas Electronics TE525 tipping bucket gauge at a different location were used to verify the ML models and compare their results to the most commonly used Z-R relations. The verification process shows promising results for the ML models, specifically the Gradient Boost model. These encouraging results need to be further explored with more sample points to further refine the ML models.

1. Introduction

Globally, severe weather events cause injuries, fatalities, and substantial economic damage every year. Since weather events are inevitable, monitoring and forecasting such events with accuracy can help reduce their impacts. One of the main tools that forecasters use for nowcasting is weather radar. Hydrologists also rely on weather radars to quantitatively estimate precipitation amounts over an area (e.g., drainage basin, city, etc.). Furthermore, polarimetric weather radars can detect and help identify different non-meteorological targets such as wind farms, smoke plumes, insects, and birds. For example, [1] used C-band polarimetric radar located at the National University of Córdoba, Argentina, to study bat migration.
Decades of research (e.g., [2,3,4]) confirmed that polarimetric radar-based rainfall algorithms add value in comparison to conventional Z-R relationships. Although there is no consensus on the degree of improvement and the choice of an optimal polarimetric-based relation for rainfall estimation [5] due to the different rainfall regimes, all studies confirm that polarimetric-based rainfall algorithms outperform conventional Z-R algorithms in moderate-to-heavy rainfall events.
Comparing different rainfall algorithms during two flash floods in the Ligurian Apennines, Italy, using a network of tipping buckets and C-band radar [6], Cremonini et al. concluded that algorithms based on Specific Differential Phase (KDP) and using ZPHI (a differential phase shift between two range gates on the same ray) perform significantly better than non-polarimetric algorithms. While studying polarimetric rainfall retrieval from C-band weather radar in a tropical environment in the Philippines, Crisologo et al. [7] found that rainfall retrieval from KDP improved rainfall estimation at both daily and hourly time scales. The daily KDP-based rainfall accumulations showed a very low estimation bias and small random errors despite random scatter in hourly accumulations.
Using an Indo-Pacific warm pool disdrometer dataset, Thompson et al. [8] derived new X-, C-, and S-band rainfall estimators. The authors found that the best performing estimators were R ( KDP ,   ξ dr ) ,   R ( A h ,   ξ dr ) ,   and   R ( z ,   ξ dr ) , where ξdr is the linear form of differential reflectivity ( ξ dr = 10 log 10 ( z h ) 10 log 10 ( z v ) ) and Ah is the specific attenuation. The authors noticed that as the radar wavelength decreased (S- to X-band), the R ( KDP ,   ξ dr ) was more often used.
While determining the accuracy of C-band radar rainfall estimation, Schleiss et al. [9] compared radar-based rainfall estimations to rainfall gauge data in Denmark, the Netherlands, Finland, and Sweden during heavy rainfall events and peak events. The algorithms are mostly Z-R except for Finland where KDP is added. These authors deduced that radar underestimation is 29% to 39.8% during heavy rain and 45.9% to 66.2% during peak rainfall events.
There are difficulties in developing Quantitative Precipitation Estimate (QPE) using radar in southern Ontario, including problems associated with ground clutter, attenuation, radome wetting, beam blocking, partial beam filling, etc. [10,11]. Using C and S-band radars and gauge data, Wijayarathne et al. [12,13] developed methods for quantitative estimates of rainfall in the same area.
Several ML-based research papers were published on the weather radar subject that were focused on image processing for nowcasting techniques. The Convolutional Neural Network (CNN) method was studied to improve radar-based weather nowcasting [14]. The outcome showed good results in mild to moderate intensity storms. Cuomo and Chandrasekar agreed with previous authors that the CNN smoothing effect does not allow capturing intense storms correctly.
Recurrent Neural Networks (RNN) and Long Short-Term Memory (LSTM) techniques were used [15] to improve the performance of hourly forecast rainfall using weather radar data. Video Prediction Deep Learning (VPDL) algorithms with sequences of radar reflectivity images were used [16] to predict 1 h lead reflectivity images in Sao Paulo, Brazil. The authors verified the feasibility use of a VPDL model in providing precipitation trends regardless of the weather event.
In this study we explore the benefit of Machine Learning (ML) to optimize the radar-based rainfall estimation from a group of estimators at the radar bin level. For this purpose, rainfall data collected from Toronto Pearson International Airport (YYZ) and radar data from the C-band King City polarimetric radar (WKR) were used to determine a set of rainfall estimators, R(Z), R(Z, ZDR), and R(KDP). The data were used to train three ML models (Decision Tree, Random Forest, and Gradient Boosting) to choose the optimal rainfall estimator based on the radar variables (Z, ZDR, KDP). The ML models were verified using the C-band Exeter polarimetric radar (WSO) and rainfall data from the Waterloo University in Ontario. The ML models have been compared to the currently employed rainfall estimators by the Canadian radar network [17] and the composite estimator produced by Bringi et al. [18]. Figure 1 shows the location of the considered sites in the current study.

2. Radar Data and Ground Observations

2.1. Radar Data

The King City (WKR) and Exeter (WSO) radars are part of the Canadian weather radar network located in Ontario, Canada. The WKR radar is located north of Toronto (43.9670N, −79.5670W) and the WSO radar is located to the north of London (43.3667N, −81.3833W). The C-Band WKR and WSO radars were replaced with S-Band radars in 2020 and 2021, respectively. Both C-Band radars were designed to simultaneously transmit and separately receive horizontally and vertically polarized signals with several scan strategies [19], of which CONVOL and POLPPI are used in this study. CONVOL is a 24-sweep polar volume containing non-Doppler processed reflectivity only. POLPPI collects equivalent horizontal reflectivity factor (ZH), differential reflectivity (ZDR), phase shift (φDP), specific differential phase shift (KDP), and co-polar correlation coefficient (ρHV). Different authors use different conventions of the polarimetric subscripts and in this study, the capital letter subscripts are used here for reflectivity (ZH) and differential reflectivity (ZDR) for values in the linear scale (e.g., mm6 m−3 for ZH) while the small letters subscripts express the logarithmic form [ Z h ( dBz ) = 10 log 10 Z H ] .
The Canadian C-Band Radar Network scan strategy was designed to produce conventional and Doppler cycles every 10 min [20]. The WKR, like the National Weather Service radars in the USA, uses the Simultaneous Transmit And Receive (STAR) mode with a slant-linear 45° technique to transmit the two orthogonally polarized waves. This technique would not be affected by the variability of the standard deviation of the hydrometeors’ canting angles.
Data from the POLPPI scan were used at the 0.5° elevation angle. The radar’s spatial resolution is 0.5° (azimuth) × 0.125 km (range). For each sweep, the radar products were averaged over 3 × 3 bin ranges. Both radars use a least-square fit method to calculate KDP over a 6 km range. The radar data used in this research have been produced by Environment and Climate Change Canada based on the moment data acquired by the radar.
In a separate study comparing winter snow radar reflectivity over Lake Ontario, ref. [21] compared 90,000 point-by-point Zh (dBZ) and Zdr (dB) values from WKR and the Buffalo NEXRAD S-band (BUF) for common locations over the lake. ZH values from both radars showed good agreement while Zdr comparisons showed a less than 0.1 dB mean difference of the upper 50% dataset.

2.2. Rain Gauges

2.2.1. Pearson International Airport

Rainfall data were collected from a suite of gauges and sensors (GEONOR T-200B, Tipping Bucket, Belfort gauge, and FD12P) at 1 min resolution during the period of May-September of 2011 and 2012 from the CAN-NOW project [22] at Pearson International Airport (YYZ) near Toronto (43.6602N, −79.6064W) were used. The aerial distance between YYZ and WKR is 33 km (20.5 mi), this ensures that the radar beam remains below 1 km AGL. The YYZ air temperature and upper-air soundings from Buffalo Airport (BUF) were used to ensure that the radar data are not contaminated by the bright band by establishing the air temperature within 1 km AGL is above 10 °C.
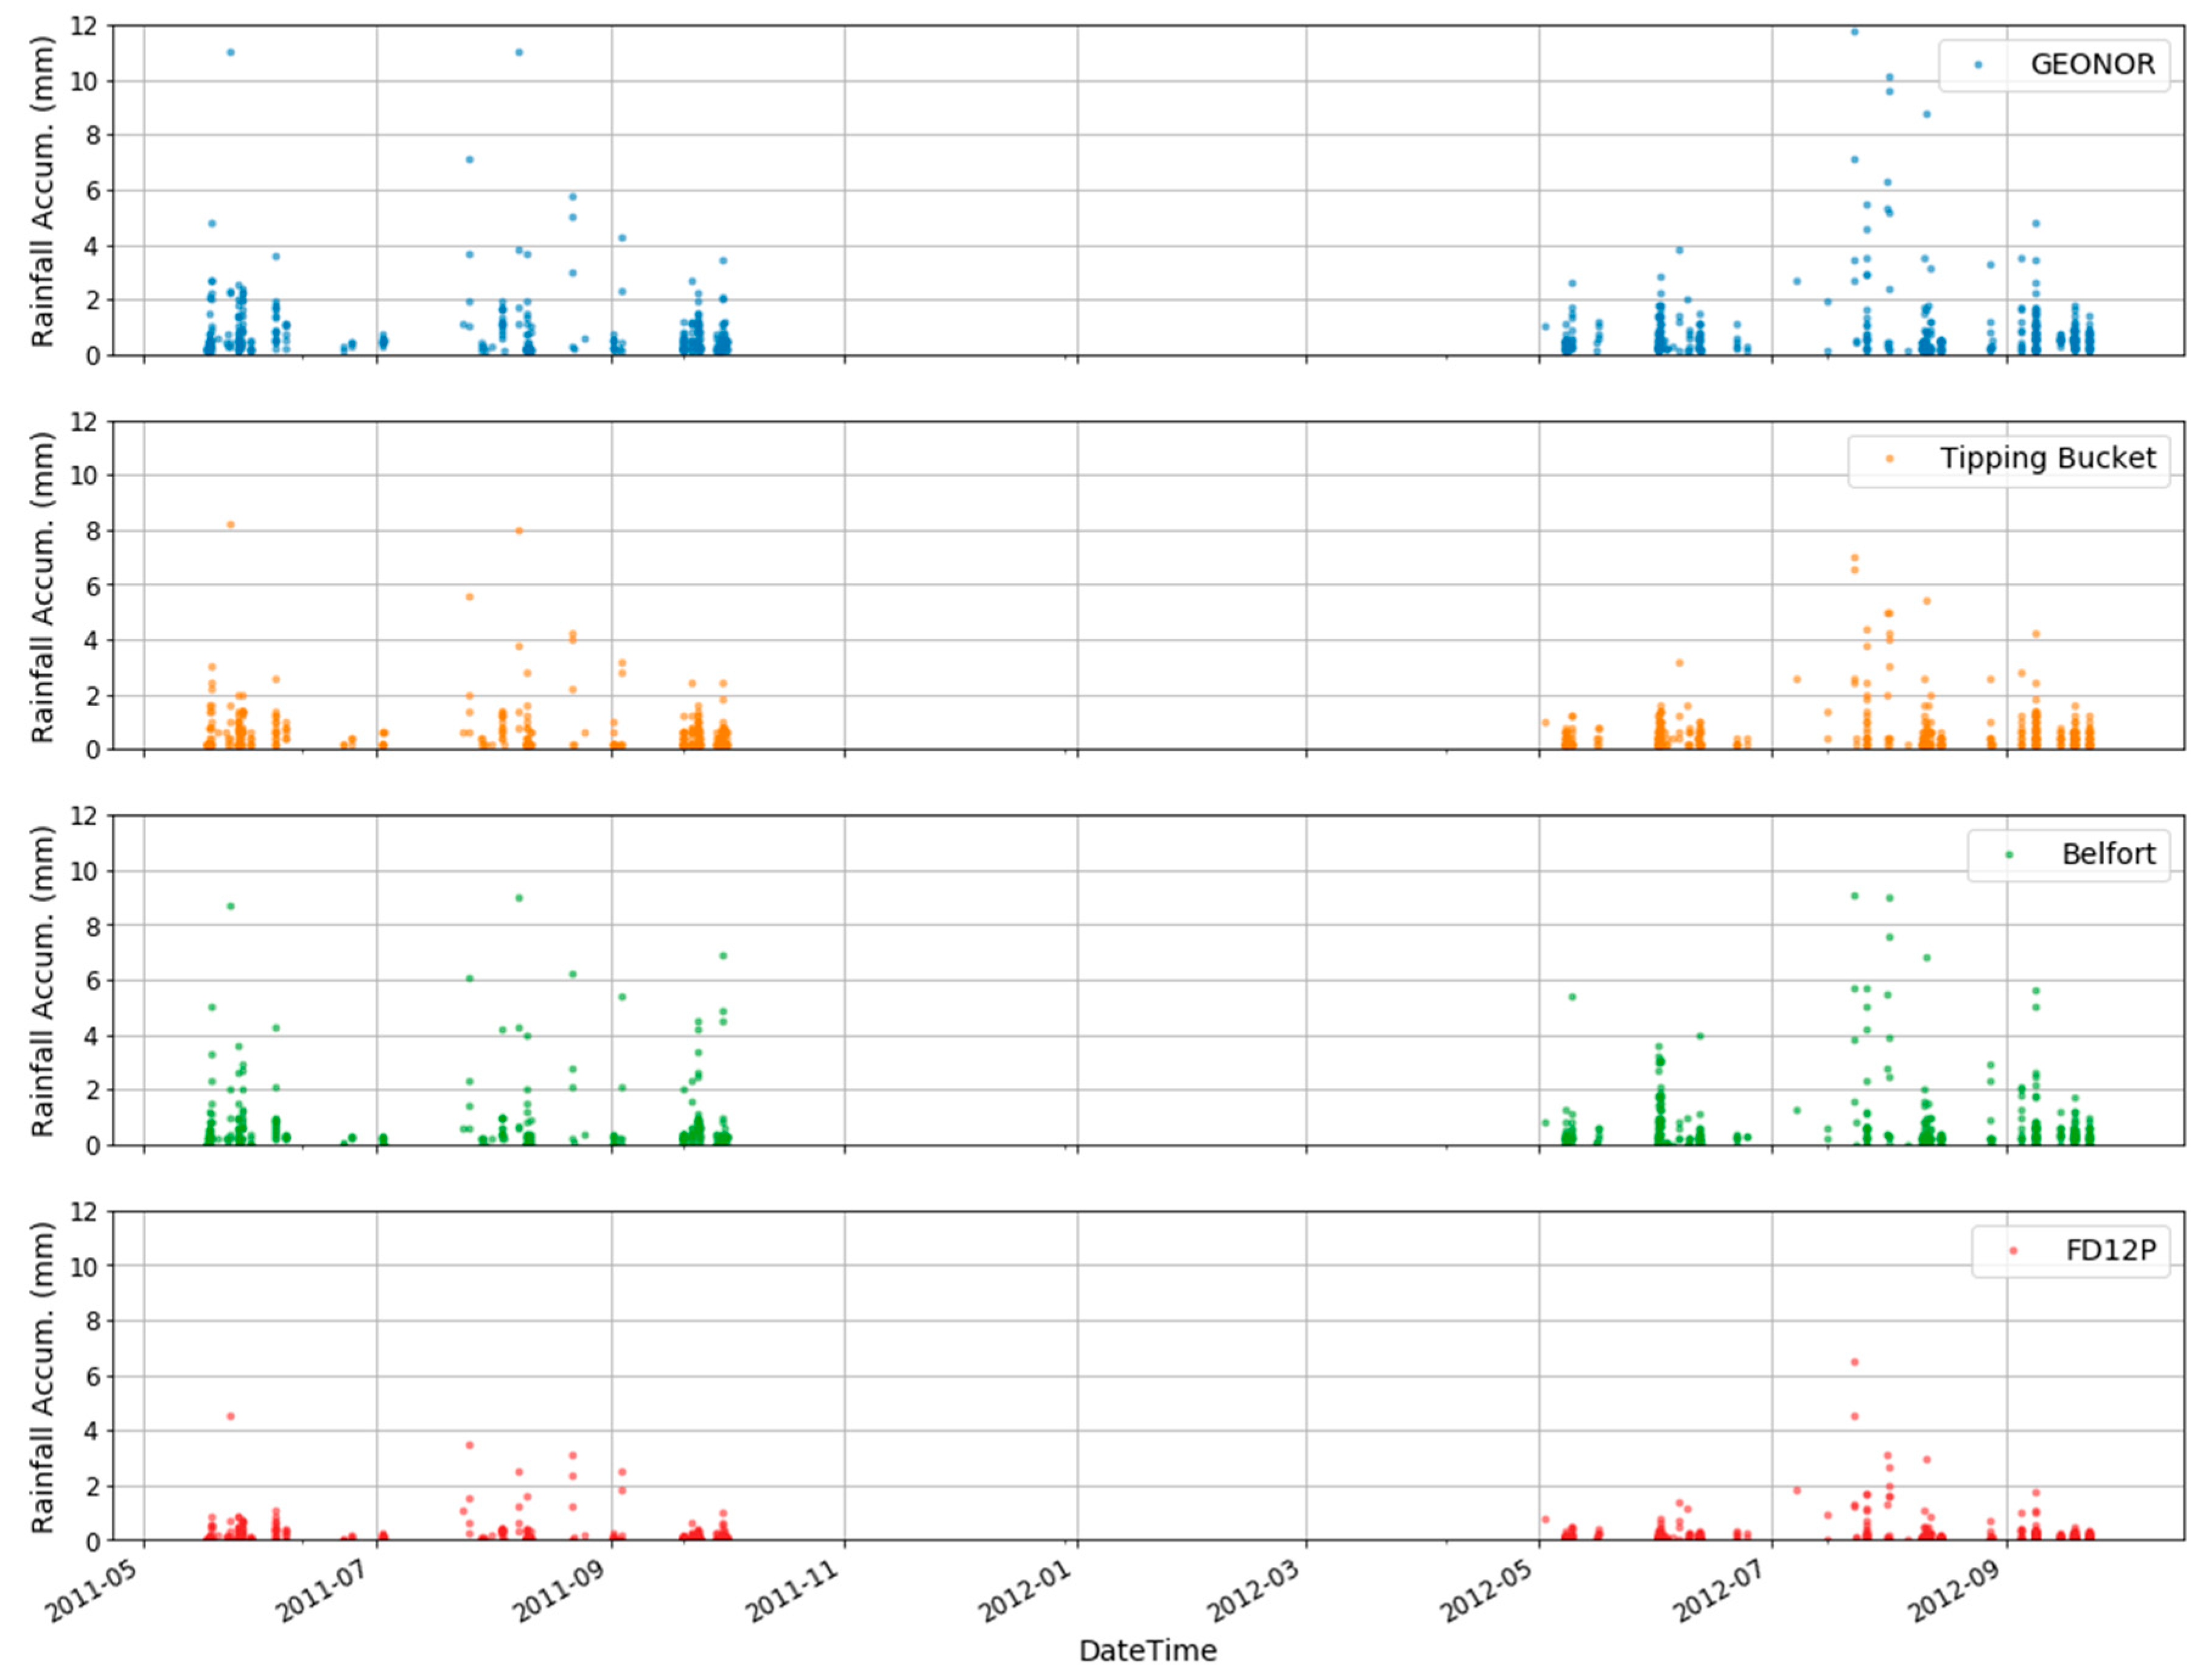
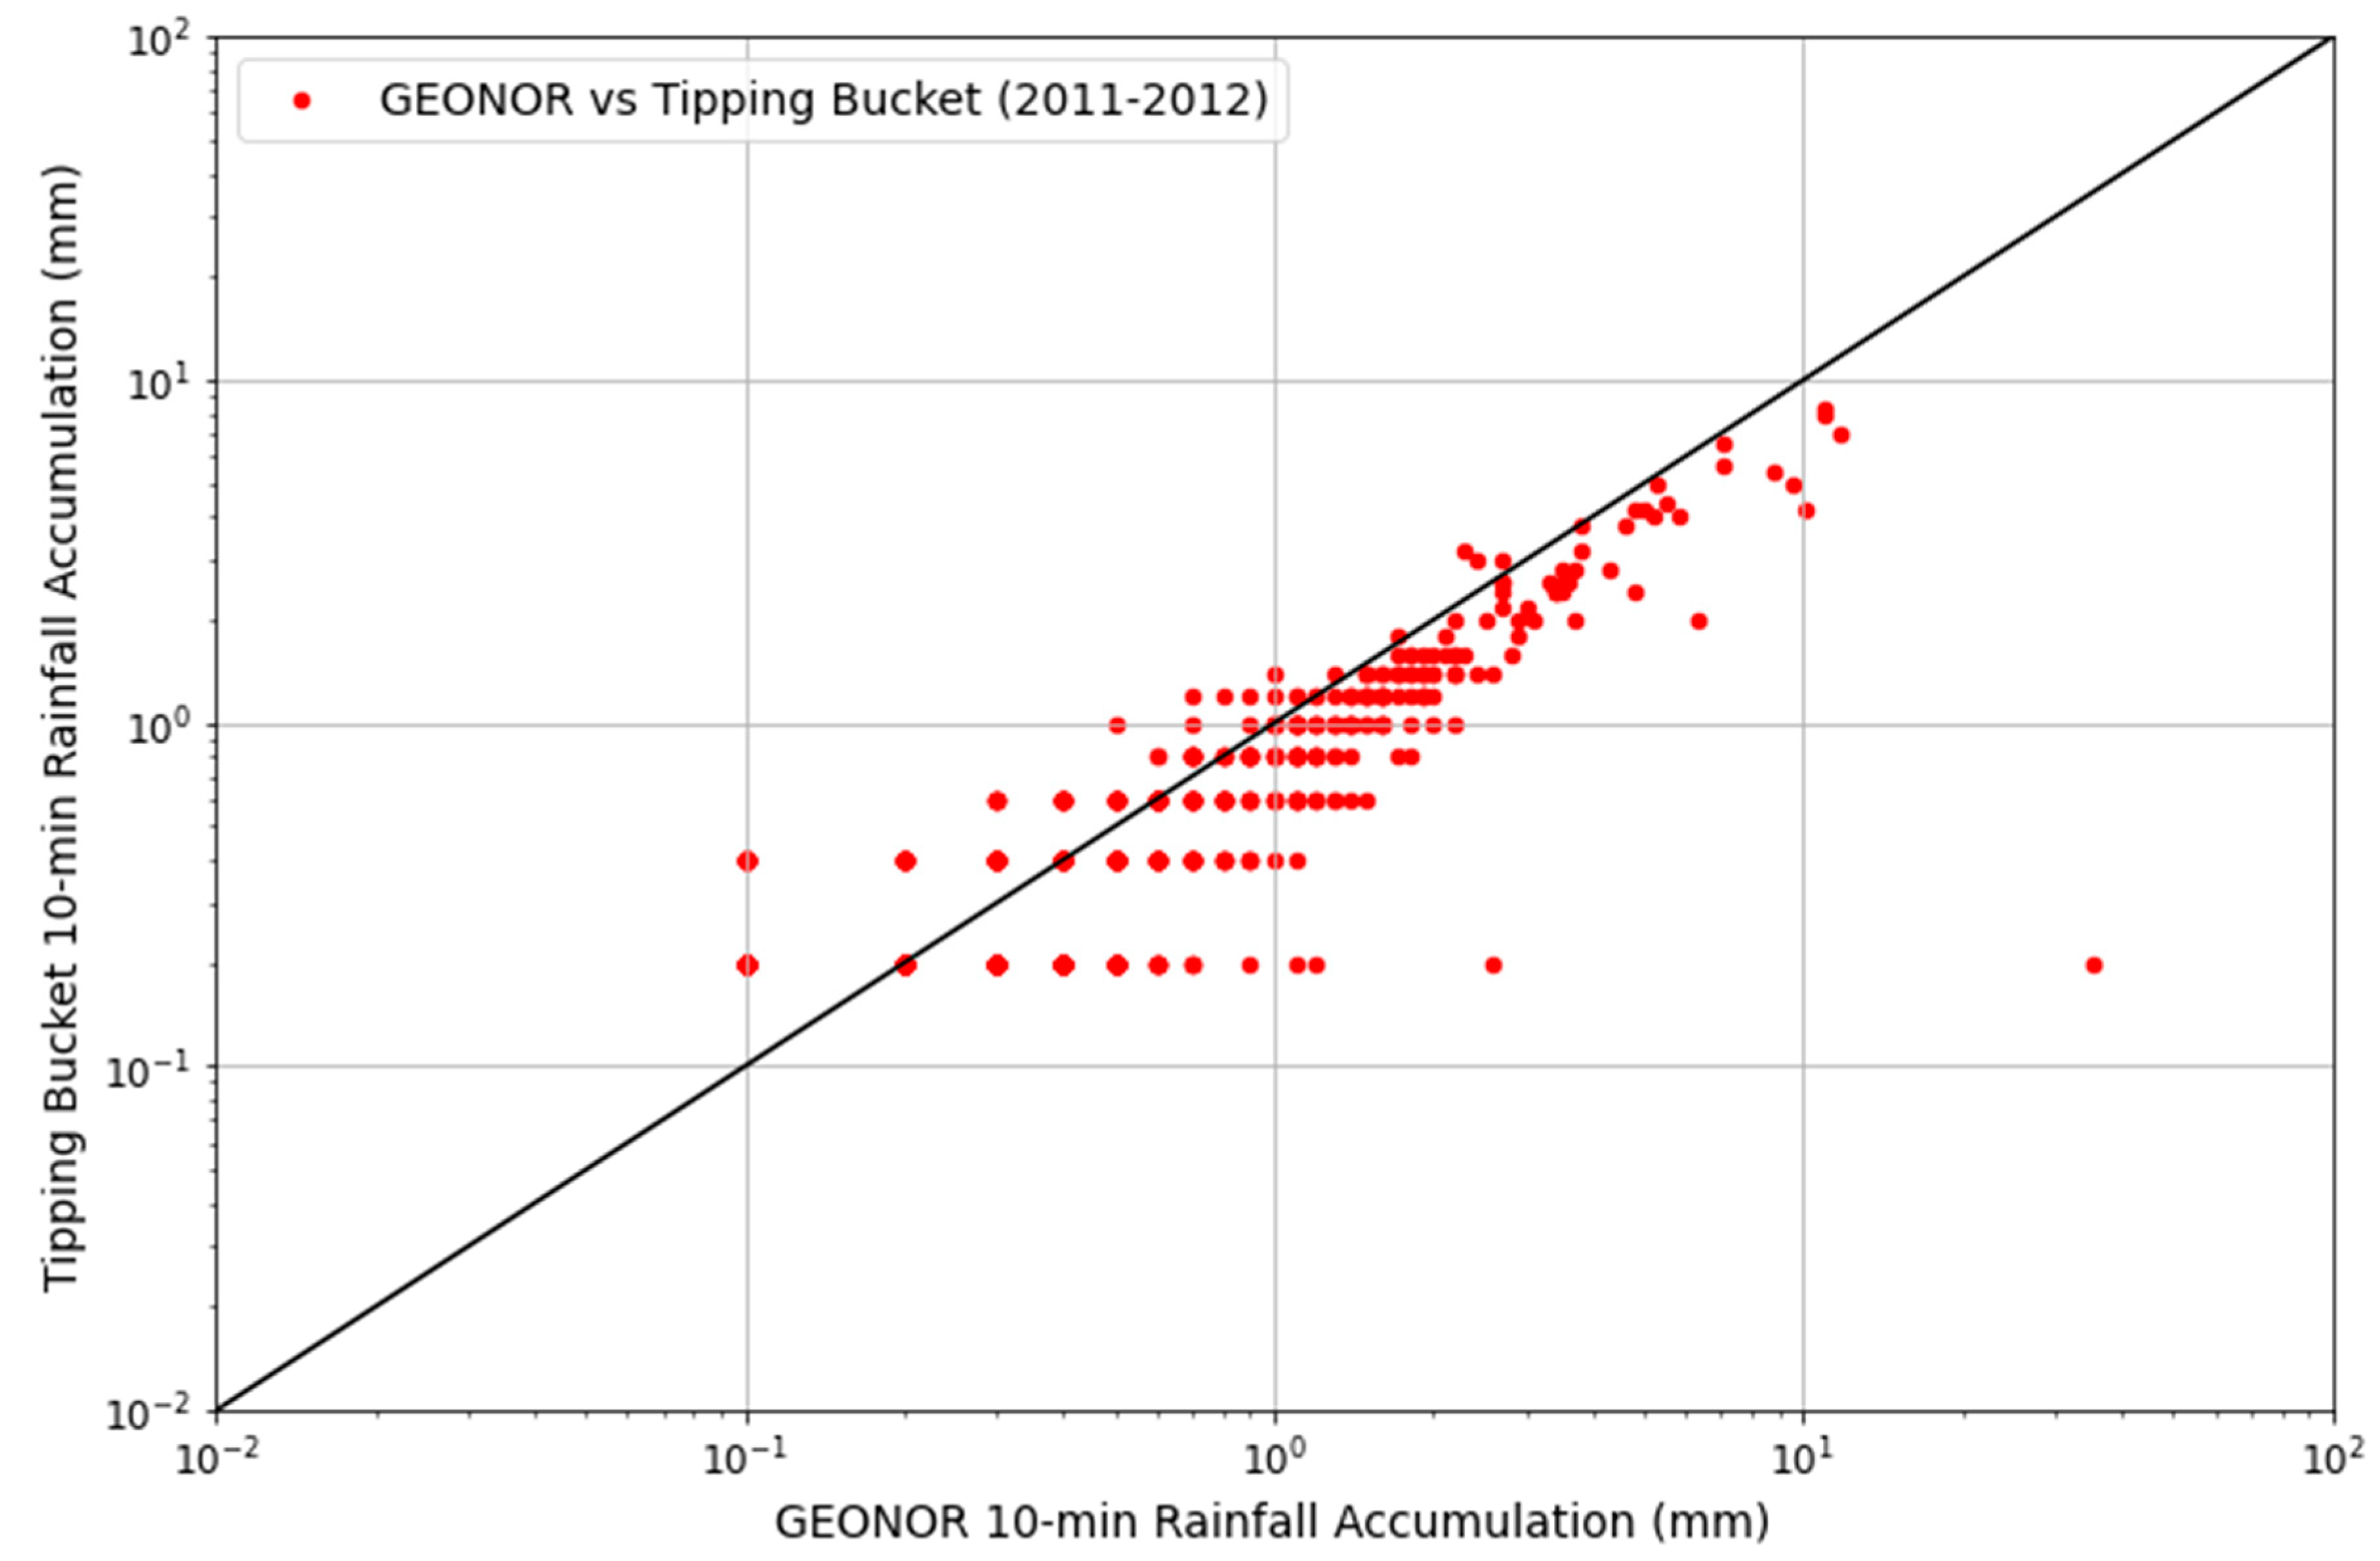
Rainfall data from all the gauges were accumulated at 10 min intervals producing (263) data point as shown in Figure 2. There is one 10 min dataset that was removed from two gauges in Figure 2 (GEONOR 35.5 mm and Belfort 26.9 mm) on 4 September 2012, at 17:30 UTC. This makes it easier to compare the different gauges. The points were only removed from Figure 2 for visual purposes but were included in the methodology. Figure 2 shows that the data selected when all the gauges or sensors have simultaneously reported precipitation; the precipitation amounts between the gauges or sensors vary due to the differences in the measuring technique by each gauge or sensor as seen in Figure 3. The Reference Climate Stations (RCS) and the Canadian Meteorological Service of Canada Surface Weather and Climate Network (MSC SWCN) have been using the GEONOR and Pluvio automated weighing gauges as part of the standard configuration of climate monitoring since the early 2000s [23]. Despite the error associated with the GEONOR weighing gauge [24] it is considered more reliable and accurate and was used in the current study.

2.2.2. Waterloo University Weather Station

The Waterloo University weather station (https://weather.uwaterloo.ca/, accessed on 1 May 2022). in Ontario (43.47341N, −80.5585W) is comprised of a variety of sensors including a Texas Electronics TE525 tipping bucket rain gauge. The aerial distance between the weather station and WSO is 67 km (41.6 mi). A 1 min dataset (e.g., rainfall and air temperature) was obtained for May to September 2016. Despite the Meteorological Service of Canada (MSC) adopting the TB3 tipping bucket rain gauge and upgrading 119 sites with the TB3 rain gauge, twenty-four Texas Electronics tipping bucket rain gauges remained in operation after 2007 [24]. The Waterloo University site was chosen due to its proximity to the second operational C-band polarimetric radar (WSO) in Canada. The Doppler WSO radar was upgraded to C-band polarimetric radar in 2015. Similar to YYZ, the Waterloo data were filtered by ensuring the air temperature within the 1 km AGL is above 10 °C by using surface air temperature from Waterloo and upper-air data from the Buffalo Airport (BUF) and White Lake (KDTX) in Michigan. The 1 min data were accumulated to 10 min producing (451) data points with precipitation measurement.

3. Methodology: Rainfall Estimators and Decision Tree Models

3.1. Rainfall Estimators

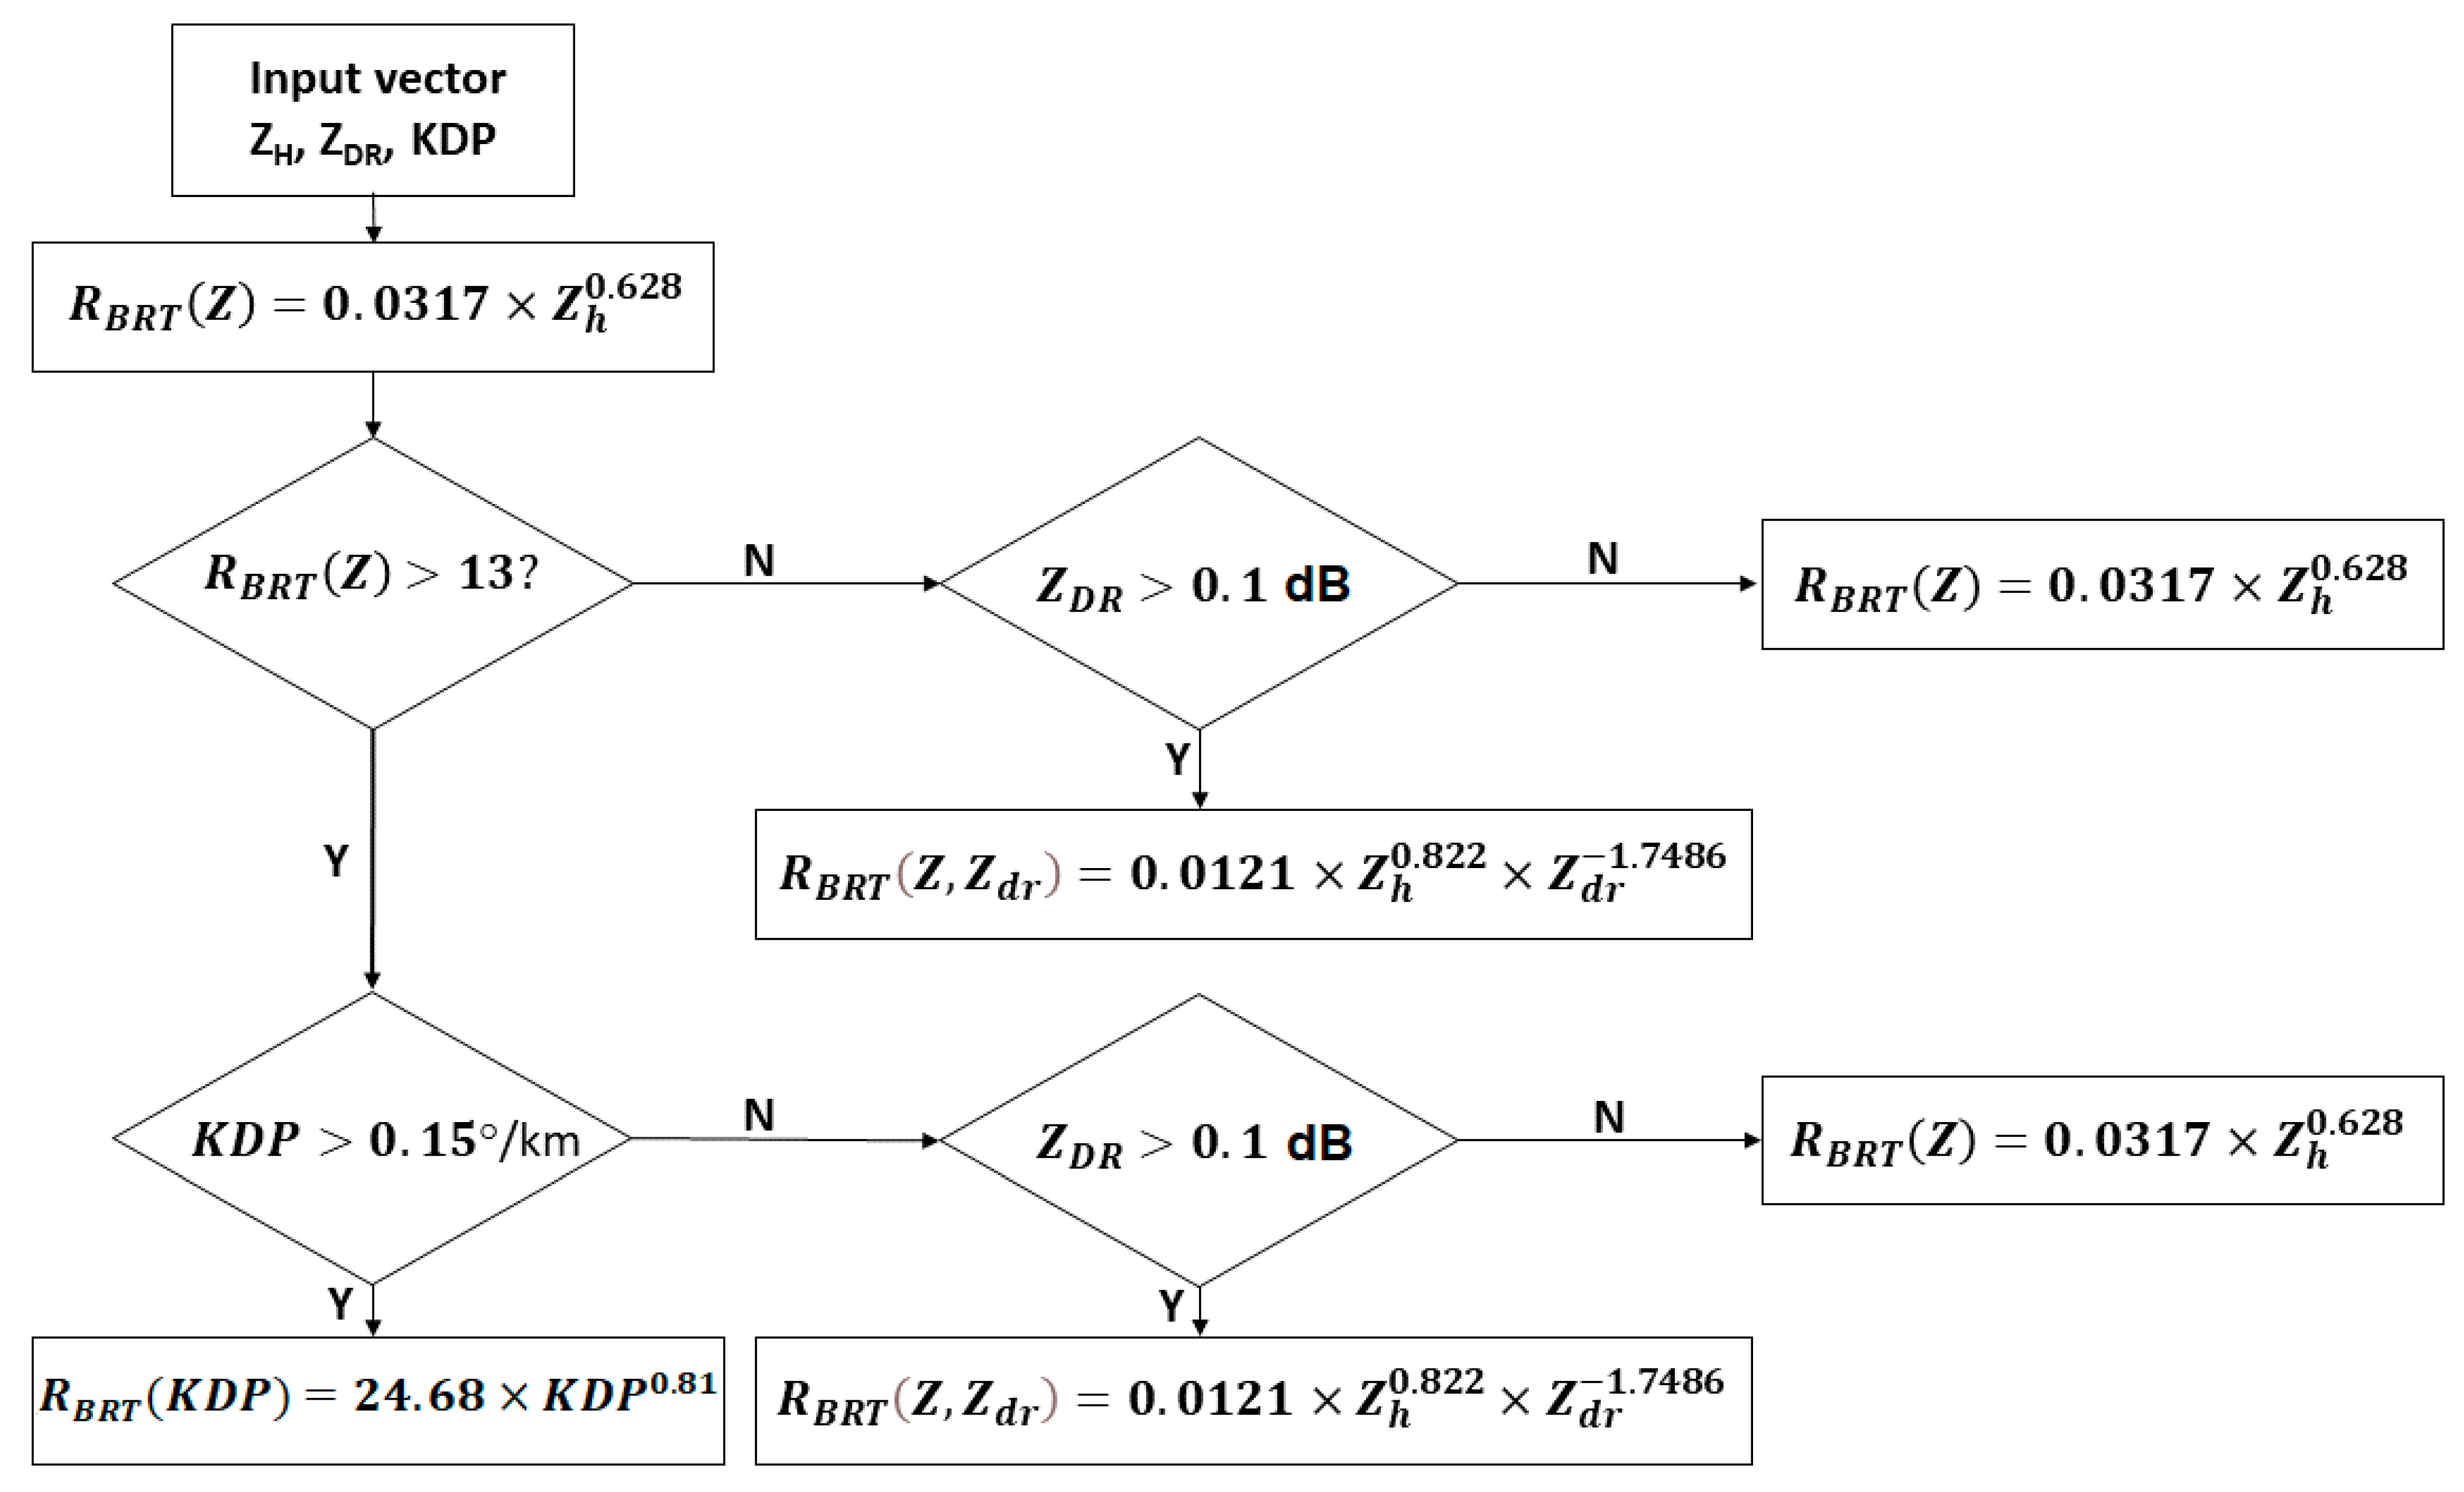
The Marshall and Palmer [25] Z-R relation (using the form Z = ARb) is recognized as the most ubiquitous radar-based rainfall rate estimator. The first mention of the relationship using coefficients A = 200 and b = 1.6 was made in Marshall and Gunn [17] (hereafter referred to as RMG), but convention refers to this as the Marshall and Palmer estimator. In 2011, a group of rainfall estimators (RBRT(Z), RBRT(Z, ZDR), and RBRT(KDP)) were developed using Joss disdrometer data from Chilbolton, UK, and a C-band radar in convective storms during the three summer months of 2007 [18]. The authors derived a composite rain rate using disdrometer drop size distribution data and scattering simulations (T-matrix model). The decision tree based composite estimator (hereafter referred to RBRT(RC) as described in [18]), uses different thresholds to choose the optimal rain estimator as described in Figure 4.
To establish new rainfall estimators, the method of minimizing the sum of squared error between the 10 min WKR and the YYZ GEONOR data from the summers of 2011 and 2012 was used to derive three rain estimators (hereafter referred to as RHITM), which can be given as:
R HITM ( Z ) = 0.287 × Z H 0.450
R HITM ( Z , Z DR ) = 0.0460 × Z H 0.718 × Z DR 1.73
R HITM ( KDP ) = 24.2 × KDP 0.639
where, R is in mm h−1 and ZH in (mm6 m−3), ZDR is dimensionless, and KDP is in (° km−1).
Three Machine Learning (ML) methods were utilized to optimize the process of selecting the optimal RHITM estimator for each radar bin per radar sweep using the radar variables (Z, ZDR, KDP). The sci-kit-learn software package was used in the three ML models [26].

3.2. Supervised Decision Tree Machine Learning Method

The Machine Learning (ML) Decision Tree (DT) algorithm is a supervised machine learning algorithm that is used to solve categorial and regression problems and is used in pattern identifications and image processing. DT is made up of a root node that represents the entire data set before splitting (branching) into decision nodes and sub-tree until it reaches the leaf where a decision has been reached.
This method uses a goodness of split criterion derived from an impurity function [27]. The function can be represented by Entropy or Gini Index which represents impurity or randomness. Ultimately, this function is used to calculate a gain function which in turn determines the branching of the tree. This is done by measuring the entropy before and after the split and the average entropy to determine the branching of the tree.
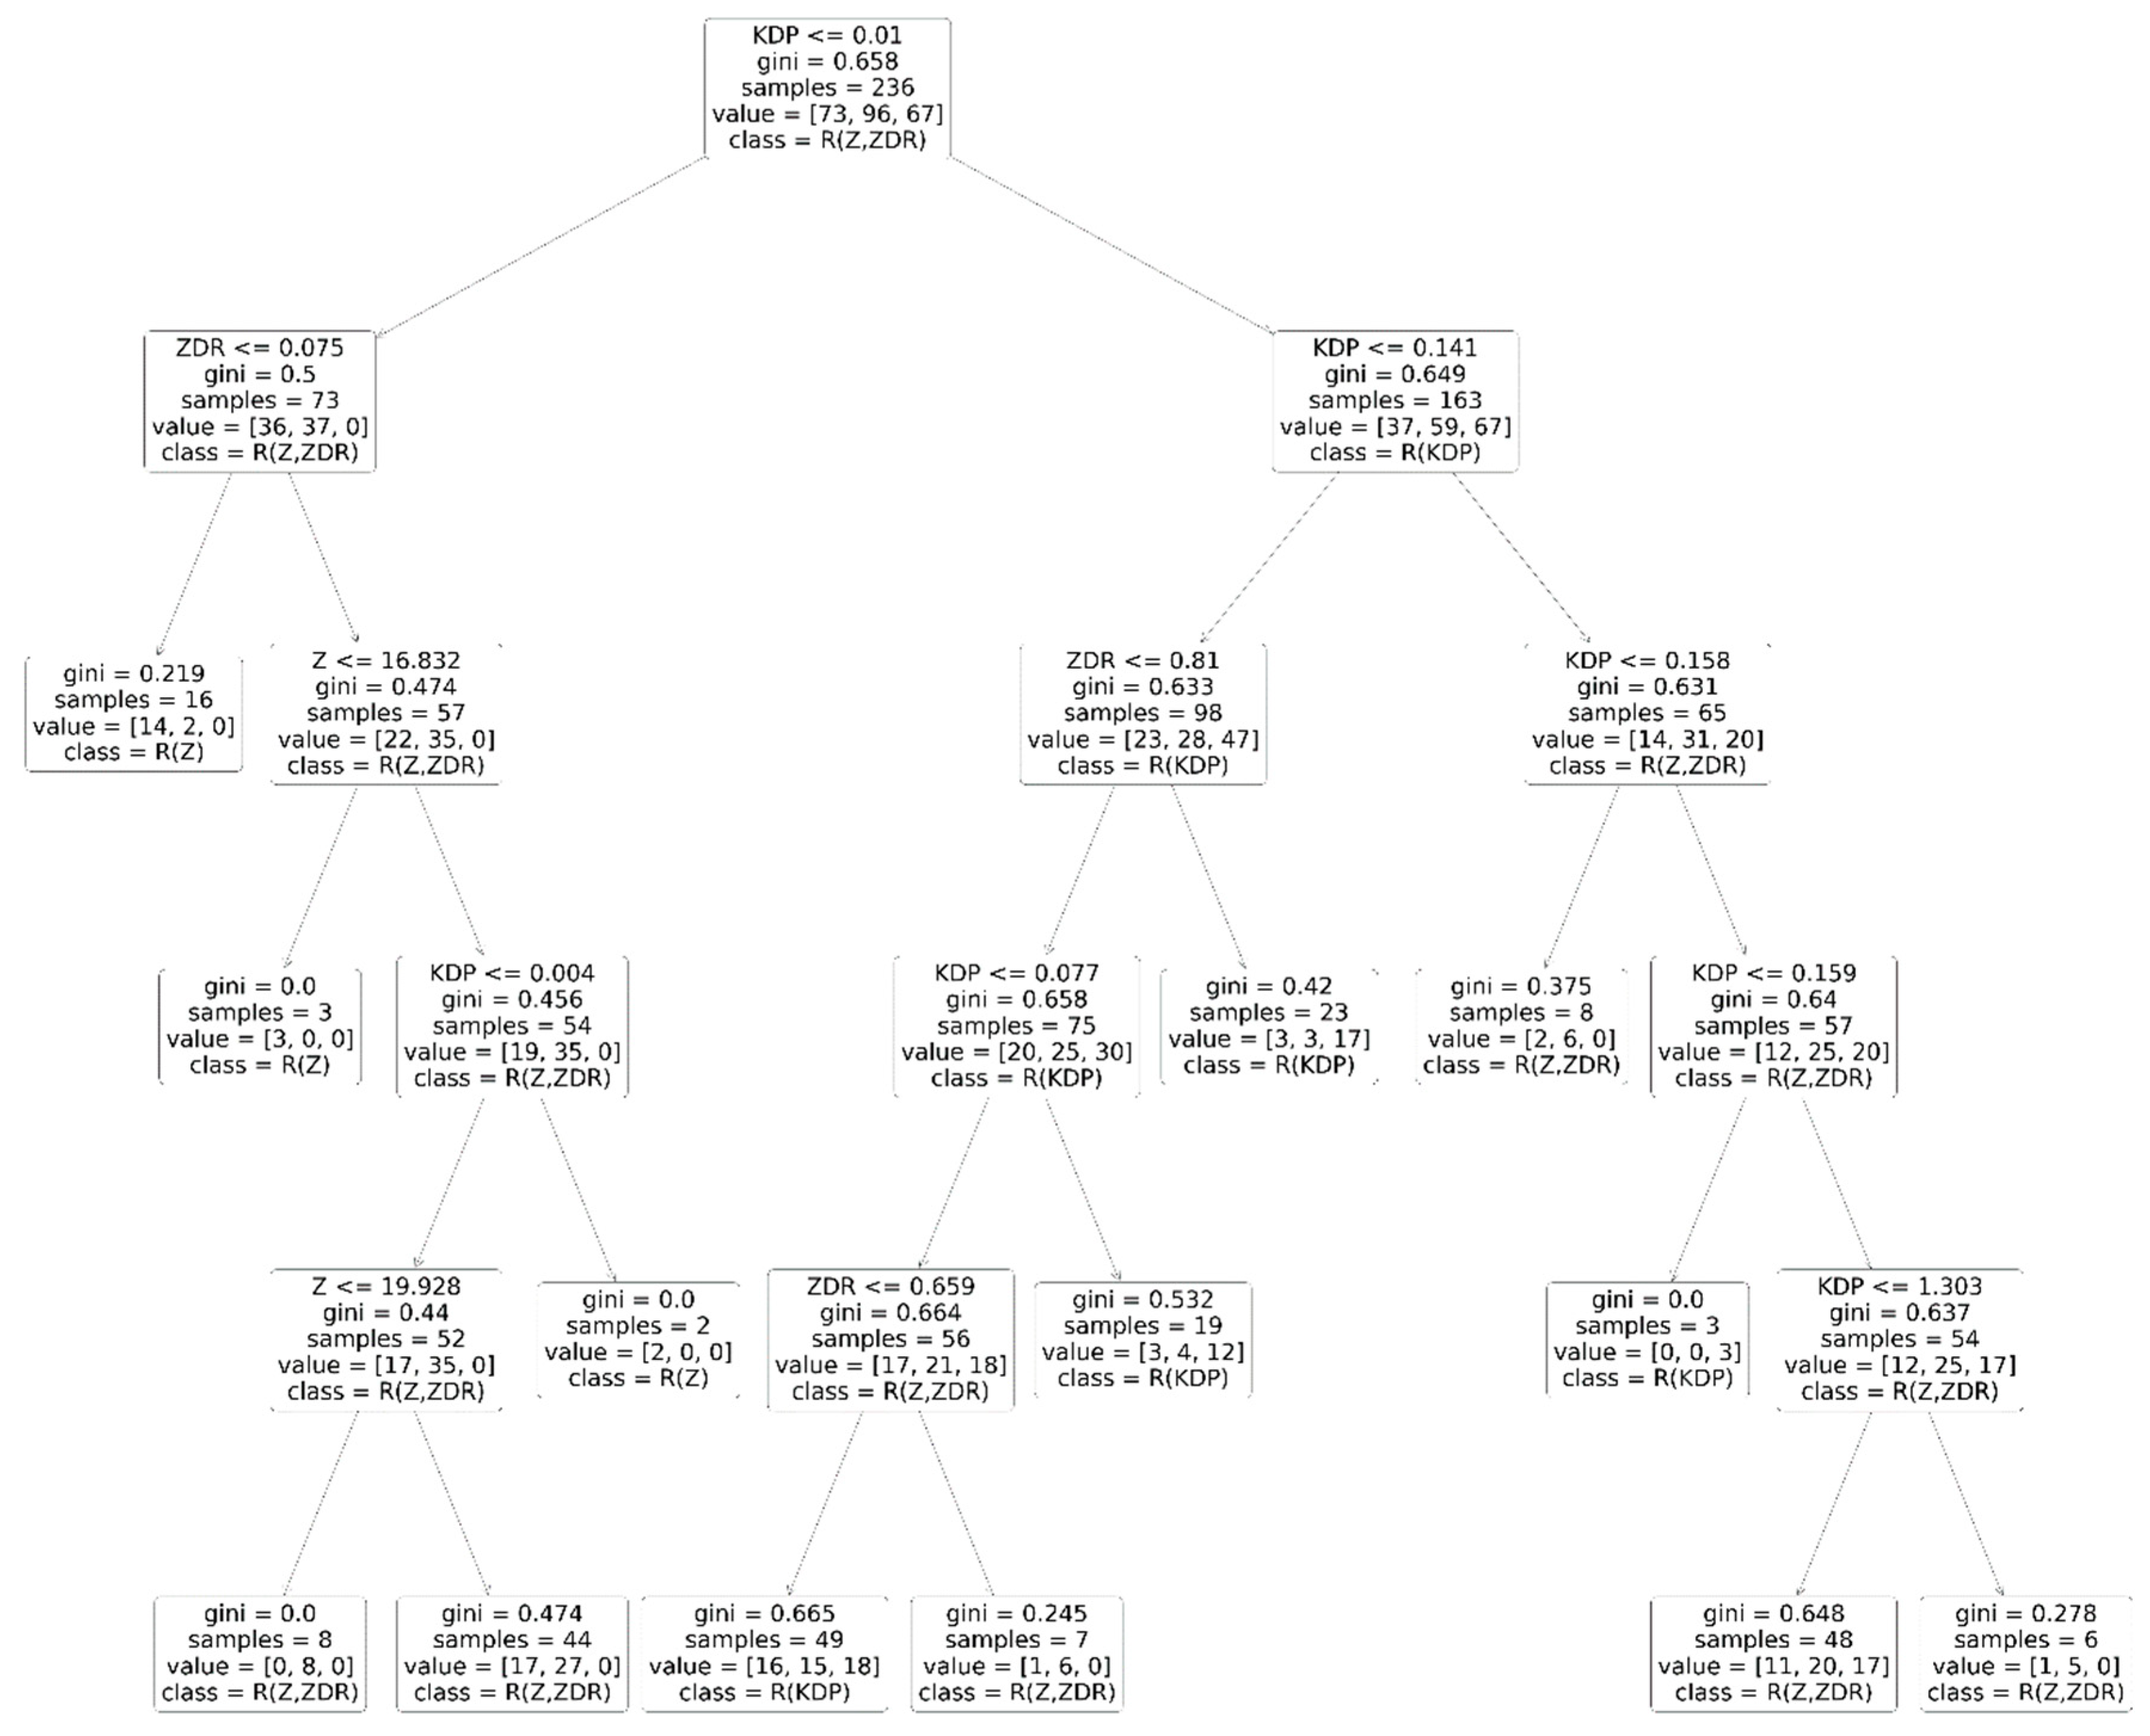
In our case, the featured variables were ZH, ZDR, and KDP. There seemed to be no weight for the ρHV when included in the featured variables. The target variable was the categorial selection of one of the three different estimators (RHITM(Z), RHITM (Z, ZDR), RHITM (KDP)) established in this study. The DT method selects the best RHITM estimator based on its closeness to the 10 min GEONOR gauge data. Since we have three featured variables in our example, the DT has three possible split types at the root node (i.e., the beginning of the tree). The DT calculates the gain function for each possible split and starts with the feature with the highest function; in our case, it is KDP at the rood node as seen in Figure 5. At each following node (Decision Node), a new question is asked, based on the same or a different featured variable, and the data is split into smaller subsets as seen in the figure. Each decision node would be answered by “True” or “False” (or Yes/No) based on the gain function. The “True” answers always split to the left and “False” to the right. The final split of each branch leads to a leaf or terminal node.
In this study, the branching of the tree was limited to a minimum of 50 samples to provide a higher sampling rate to increase the model accuracy. The rainfall estimation from this method will be referred to as RHITM(DT).

3.3. Supervised Random Forest Machine Learning Method

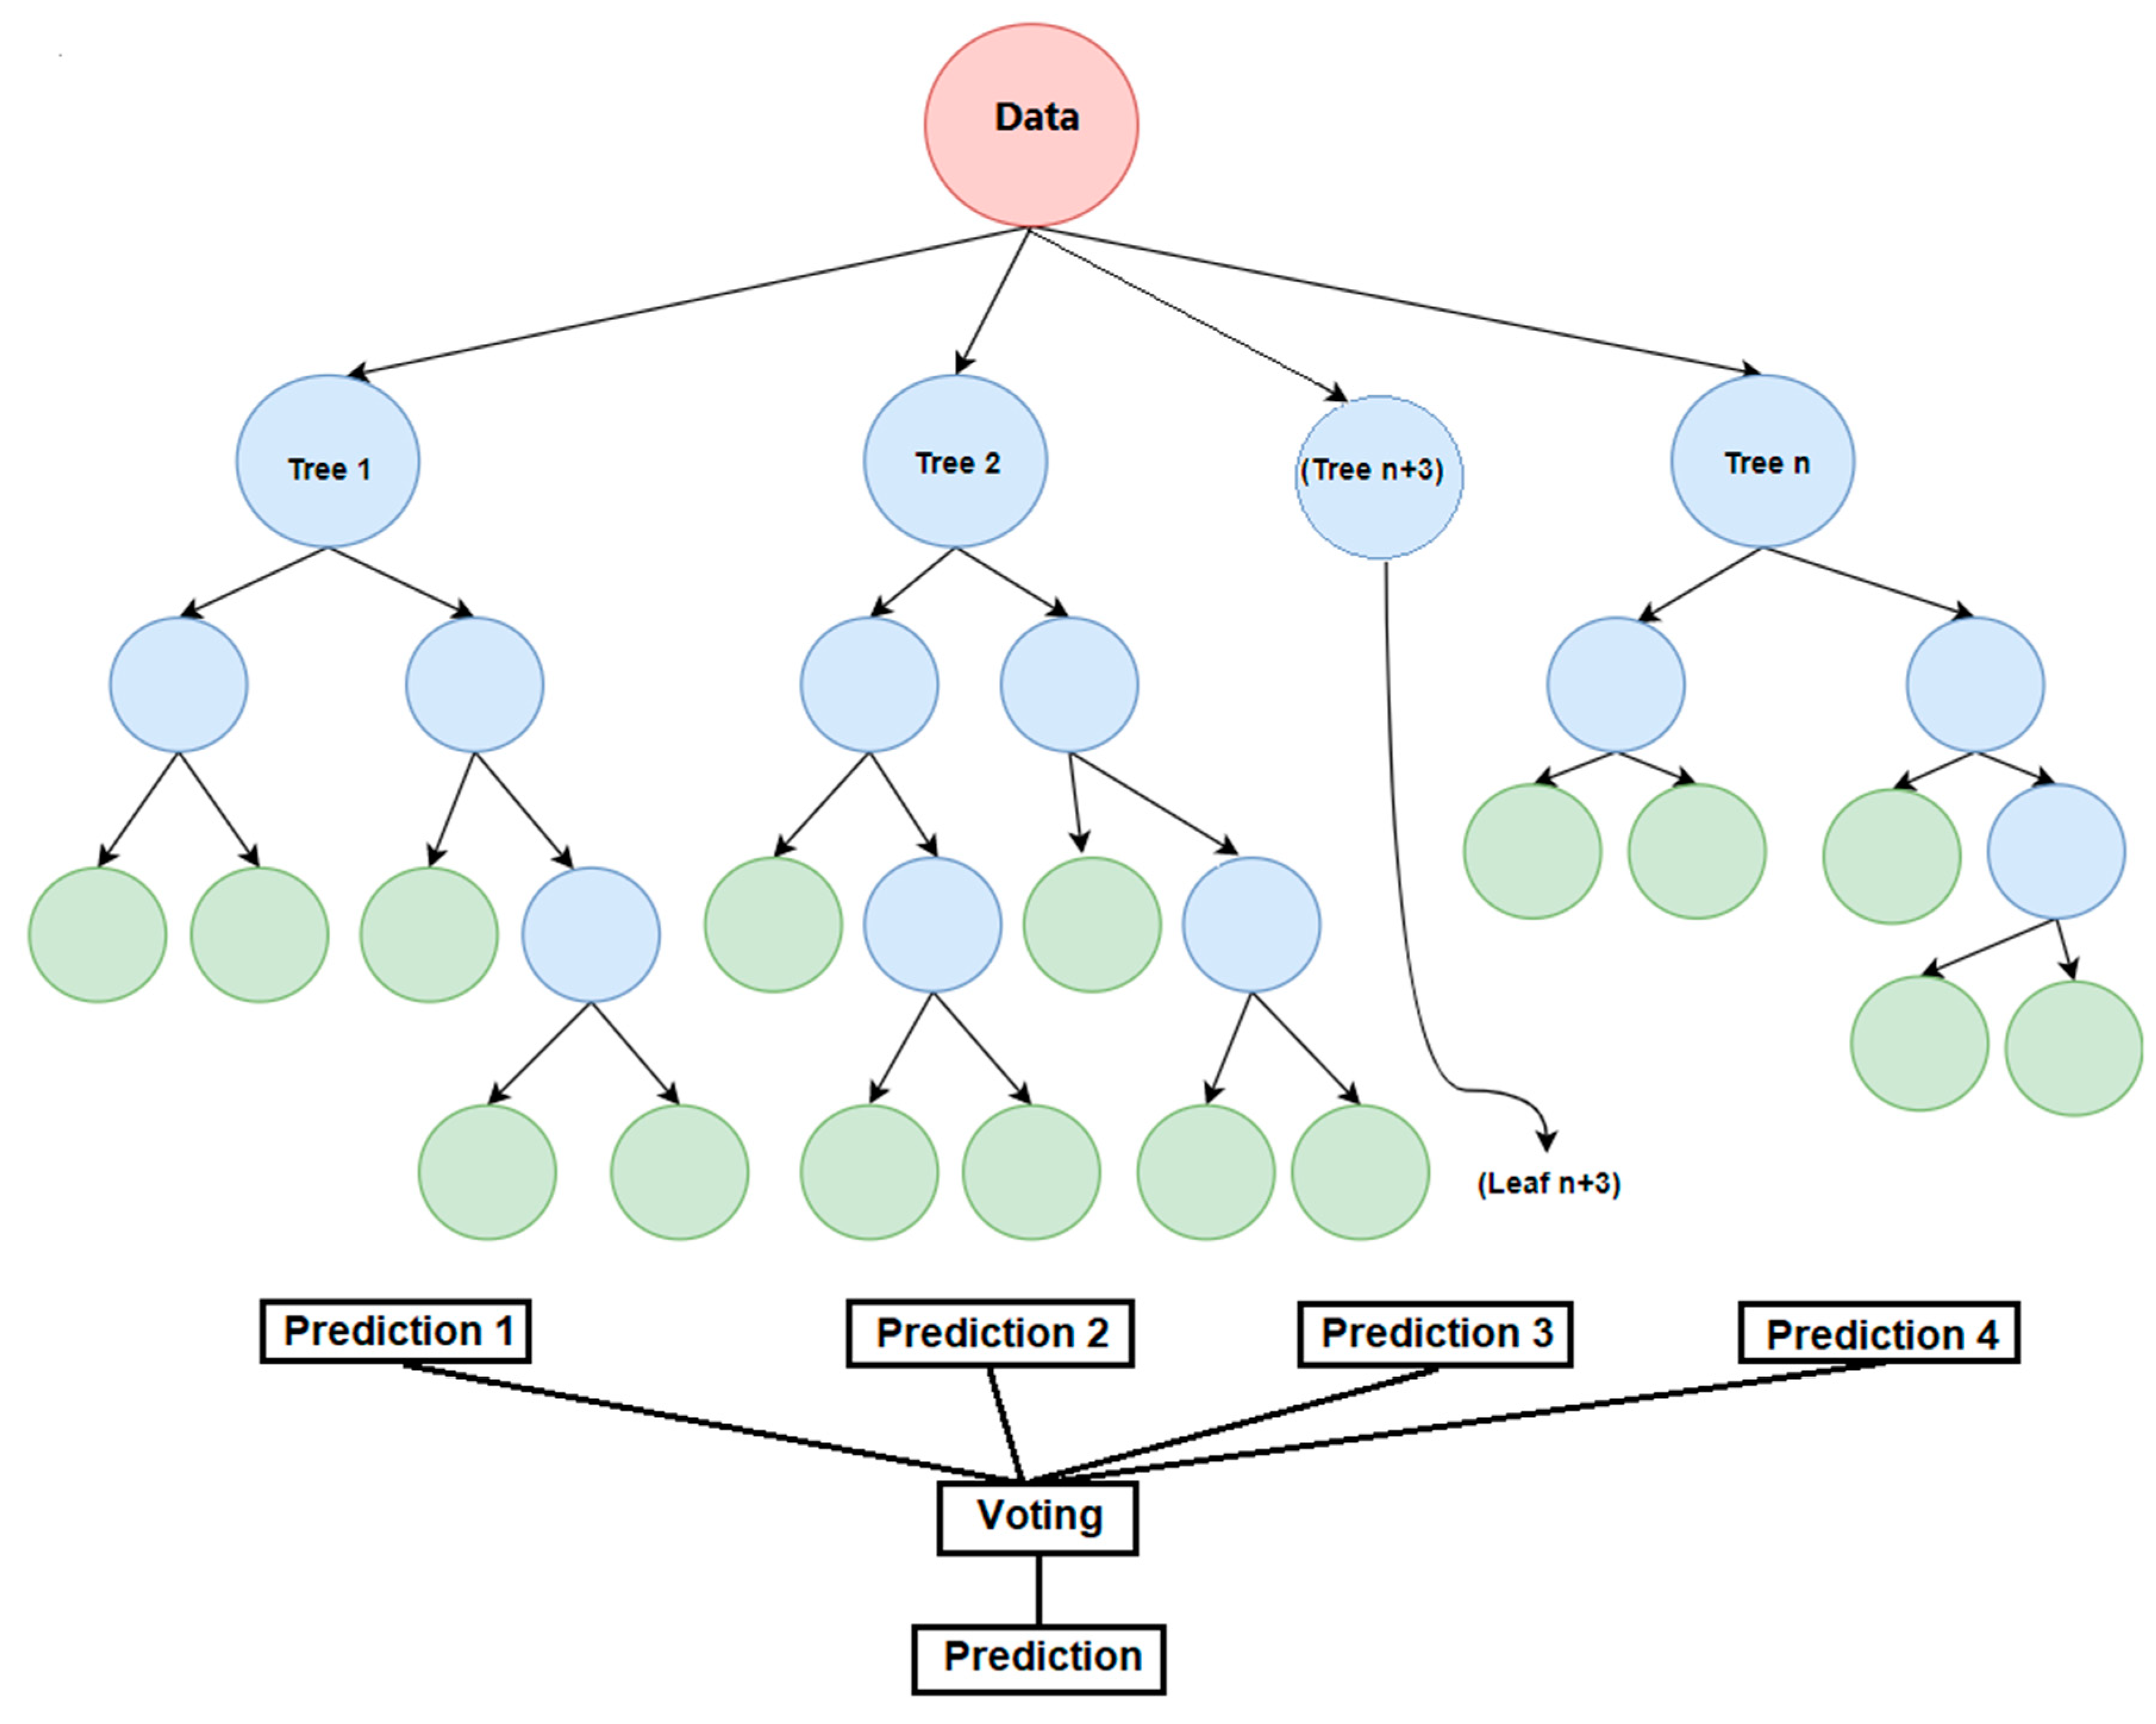
The Random Forest (RF) machine learning method is a collection of multiple Decision Trees. To compare it to the DT above, the RF could have hundreds of trees that are different from each other at the root node, thus each tree would end up having different branching decisions. In other words, the RF randomness is higher than the DT as each tree could have different decision nodes and thresholds to branch [28]. In the RF, the prediction of each tree is calculated, and the tree with the lowest error rate will be the final predictor. Figure 6 shows the schematic of the RF model.
The RF model uses the default or user set hyperparameters, such as node size, number of trees, and the number of features sampled. In this study the default settings produced similar results as the tuned ones and the forest contained 100 trees. The model selects multiple data samples from the training data that is equal to the number of determined trees. In this study, the sampled data was set with replacement, i.e., same data point can be present in multiple sampled training data, due to the relatively smaller size data point in this study. Each tree in the forest will then select a feature or subset of features, calculate the Gini Index before and after splitting and continue branching until reaching the leaf state. The voting process will be based on the tree with the most frequent features in it.
Similar to the DT model, the features were the same in the RF model (i.e., ZH, ZDR, KDP) and the target variables were the RHITM estimators, and the best estimator is selected as being closer to the 10 min GEONOR gauge data. The rainfall estimation from this method will be referred to as RHITM(RF)

3.4. Gradient Boosting, Ensemble Learning

The Gradient Boosting (GB) methodology [29] can be described as a set of variables (or parameters) serving as an input to determine a target variable by training a dataset. The GB model is based on using weak predictor models (trees) to build a stronger one but iteratively learning from each of the weak predictor models, i.e., these predictors (trees) are added to the model over time. Similar to the DT and RF models, the GB performs this iteration by minimizing a loss function. The difference between the RF and GB is that the latter does not add an entire tree at each iteration, rather creates and adds a single split tree (also known as decision stumps). The added decision stumps are choses by their ability to classify easy and difficult instances among the observation with more weight given to the stumps that are able to classify difficult ones.
The featured and target variables in the GB model were similar to that of the DT and RF models. The rainfall estimation from this method will be referred to as RHITM(GB).

3.5. Statistical Scores

A set of statistical scores were used to evaluate quantitative precipitation estimate accuracies: Pearson Correlation Coefficient (r), Mean Absolute Error (MAE), Root Mean Square Error (RMSE), and the Normalized Mean Error (NME). The NME was normalized by the mean of the observation. Since radar-based rainfall estimation can be used in hydrological models, the Nash-Sutcliffe Efficiency coefficient (NSE) [30] was used in the verification process as it evaluates the predictive skills of the estimated rainfall. Table 1 provides the NSE score [31].

3.6. Study Data and ML Models

The data used in this paper and the three trained ML models that were established and used in the paper are available on an openly available project repository and can be accessed via this URL (https://doi.org/10.5281/zenodo.6979720, accessed on 1 September 2022). The data and models were made available to achieve reproducibility [32].

4. Evaluation Process

Data from the Waterloo University Weather Station tipping bucket for the summer of 2016 were used with polarimetric variables from the WSO radar to evaluate the RMG, RBRT(RC), RHITM(DT), RHITM(RF), and RHITM(GB) rainfall estimators. After calculating the 10 min rain accumulation, the data were resampled to hourly rainfall accumulation.
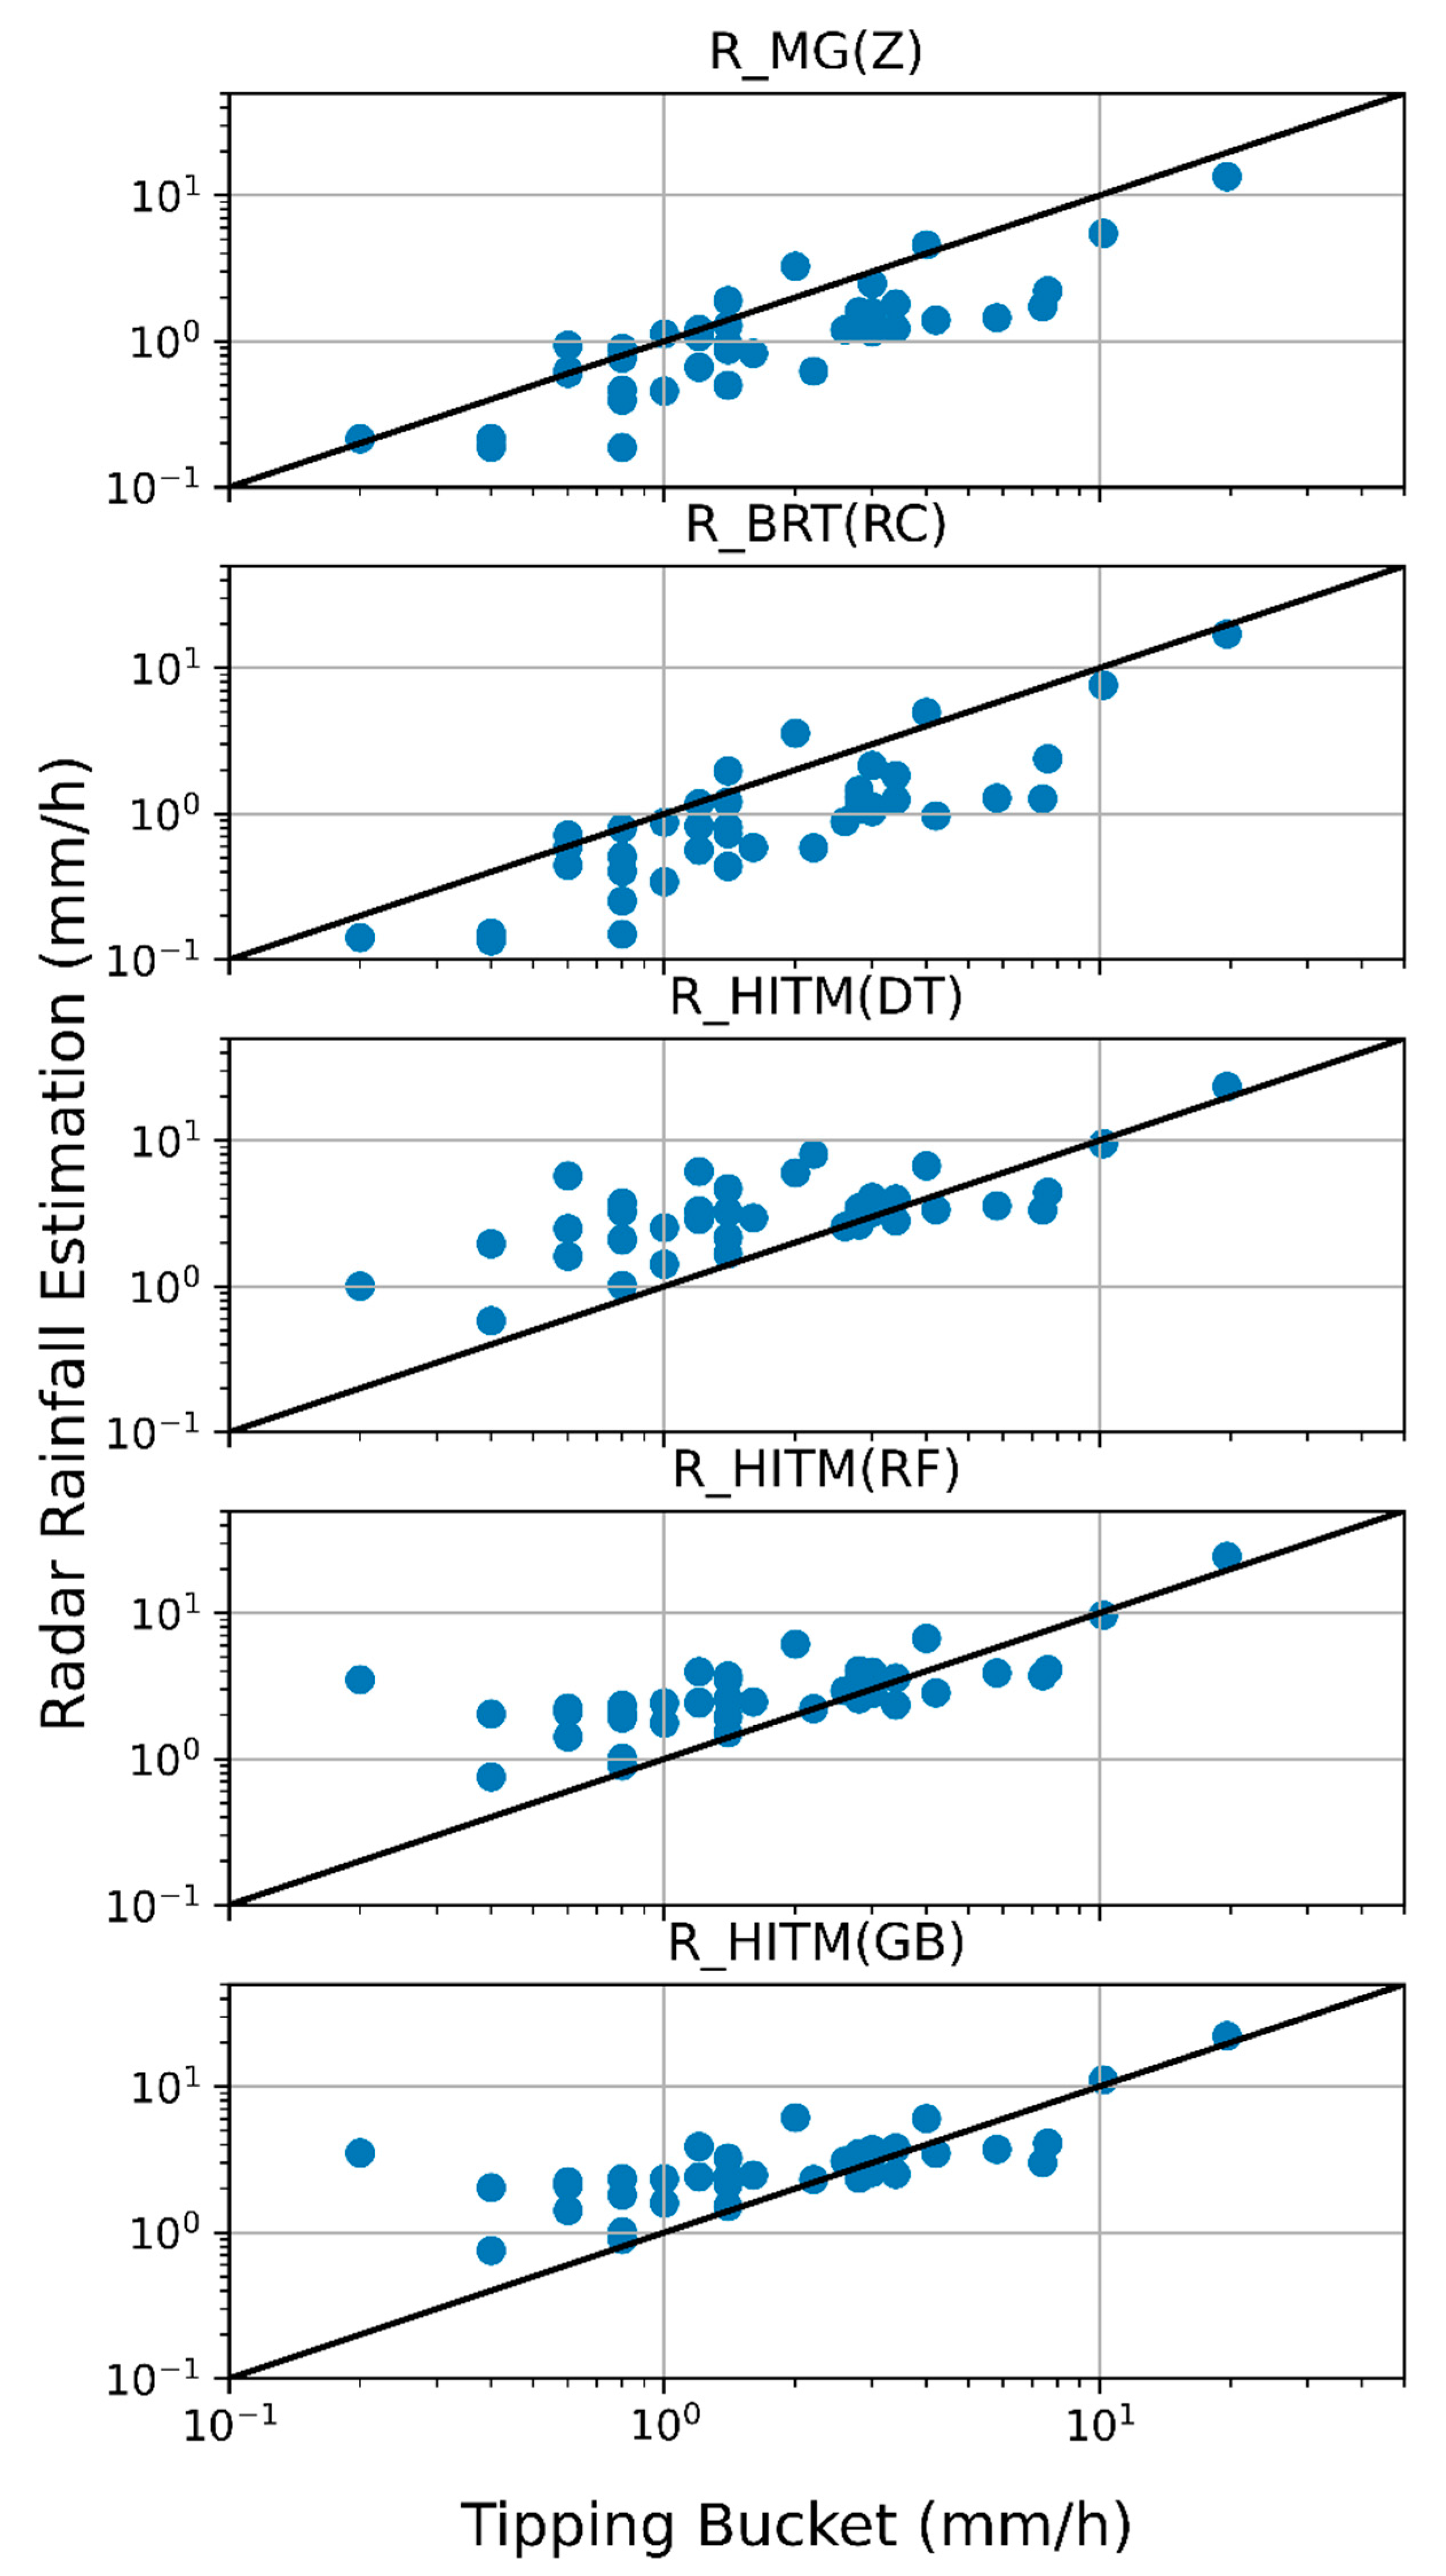
Figure 7 shows the hourly tipping bucket accumulation versus the radar estimator obtained from each method. The figure generally shows a persistent underestimation for the RMG and the RBRT(RC) estimators, while the ML methods tend to slightly overestimate the rainfall at the very low rain rates (below 1 mm h−1). The ML models show promising results in light-to-moderate and heavy rainfall (e.g., ~≥ 1 mm h−1).
Table 2 present the statistical skills of the RMG, RBRT(RC), RHITM(DT), RHITM(RF), and RHITM(GB). The NSE values can be between zero (no skill model) to one (perfect model).
The table shows that the statistical scores from the RHITM(RF) and RHITM(GB) show superior results when compared to RMG and RBRT(RC) due to the ML techniques used in each method that relies on multiple learning steps. The RF method relies on an ensemble approach from multiple trees while the GB relies on a sequential learning approach from each branched tree. In other words, the RF and GB methods were not produced using a single logic gate (e.g., RBRT(RC)). The data shows that the RMG and RBRT(RC) are severely underestimating the total seasonal rainfall by nearly ~60% (Est.% in Table 2). If the Tipping bucket underestimation were to be considered here, perhaps RMG and RBRT(RC) could have shown worst underestimation than what is presented in Table 2 and the RHITM(RF) and RHITM(GB) could have been closer to the perfect (100%) estimation. The NSE score shows “good” results (Table 1) for RMG, RBRT(RC), RHITM(DT), and RHITM(RF), while the NSE score shows “very good” results for RHITM(GB). It is worth noting that RHITM(GB) showed slightly better statistical scores than each of the individual RHITM(Z), RHITM(Z, ZDR), and RHITM(KDP).

5. Case Study

This case study is presented to verify that the ML methods, GB in this case, do not produce any artifacts and to compare the RMG and RHITM(GB) rainfall estimations using any available nearby gauge observations (ground truthing).
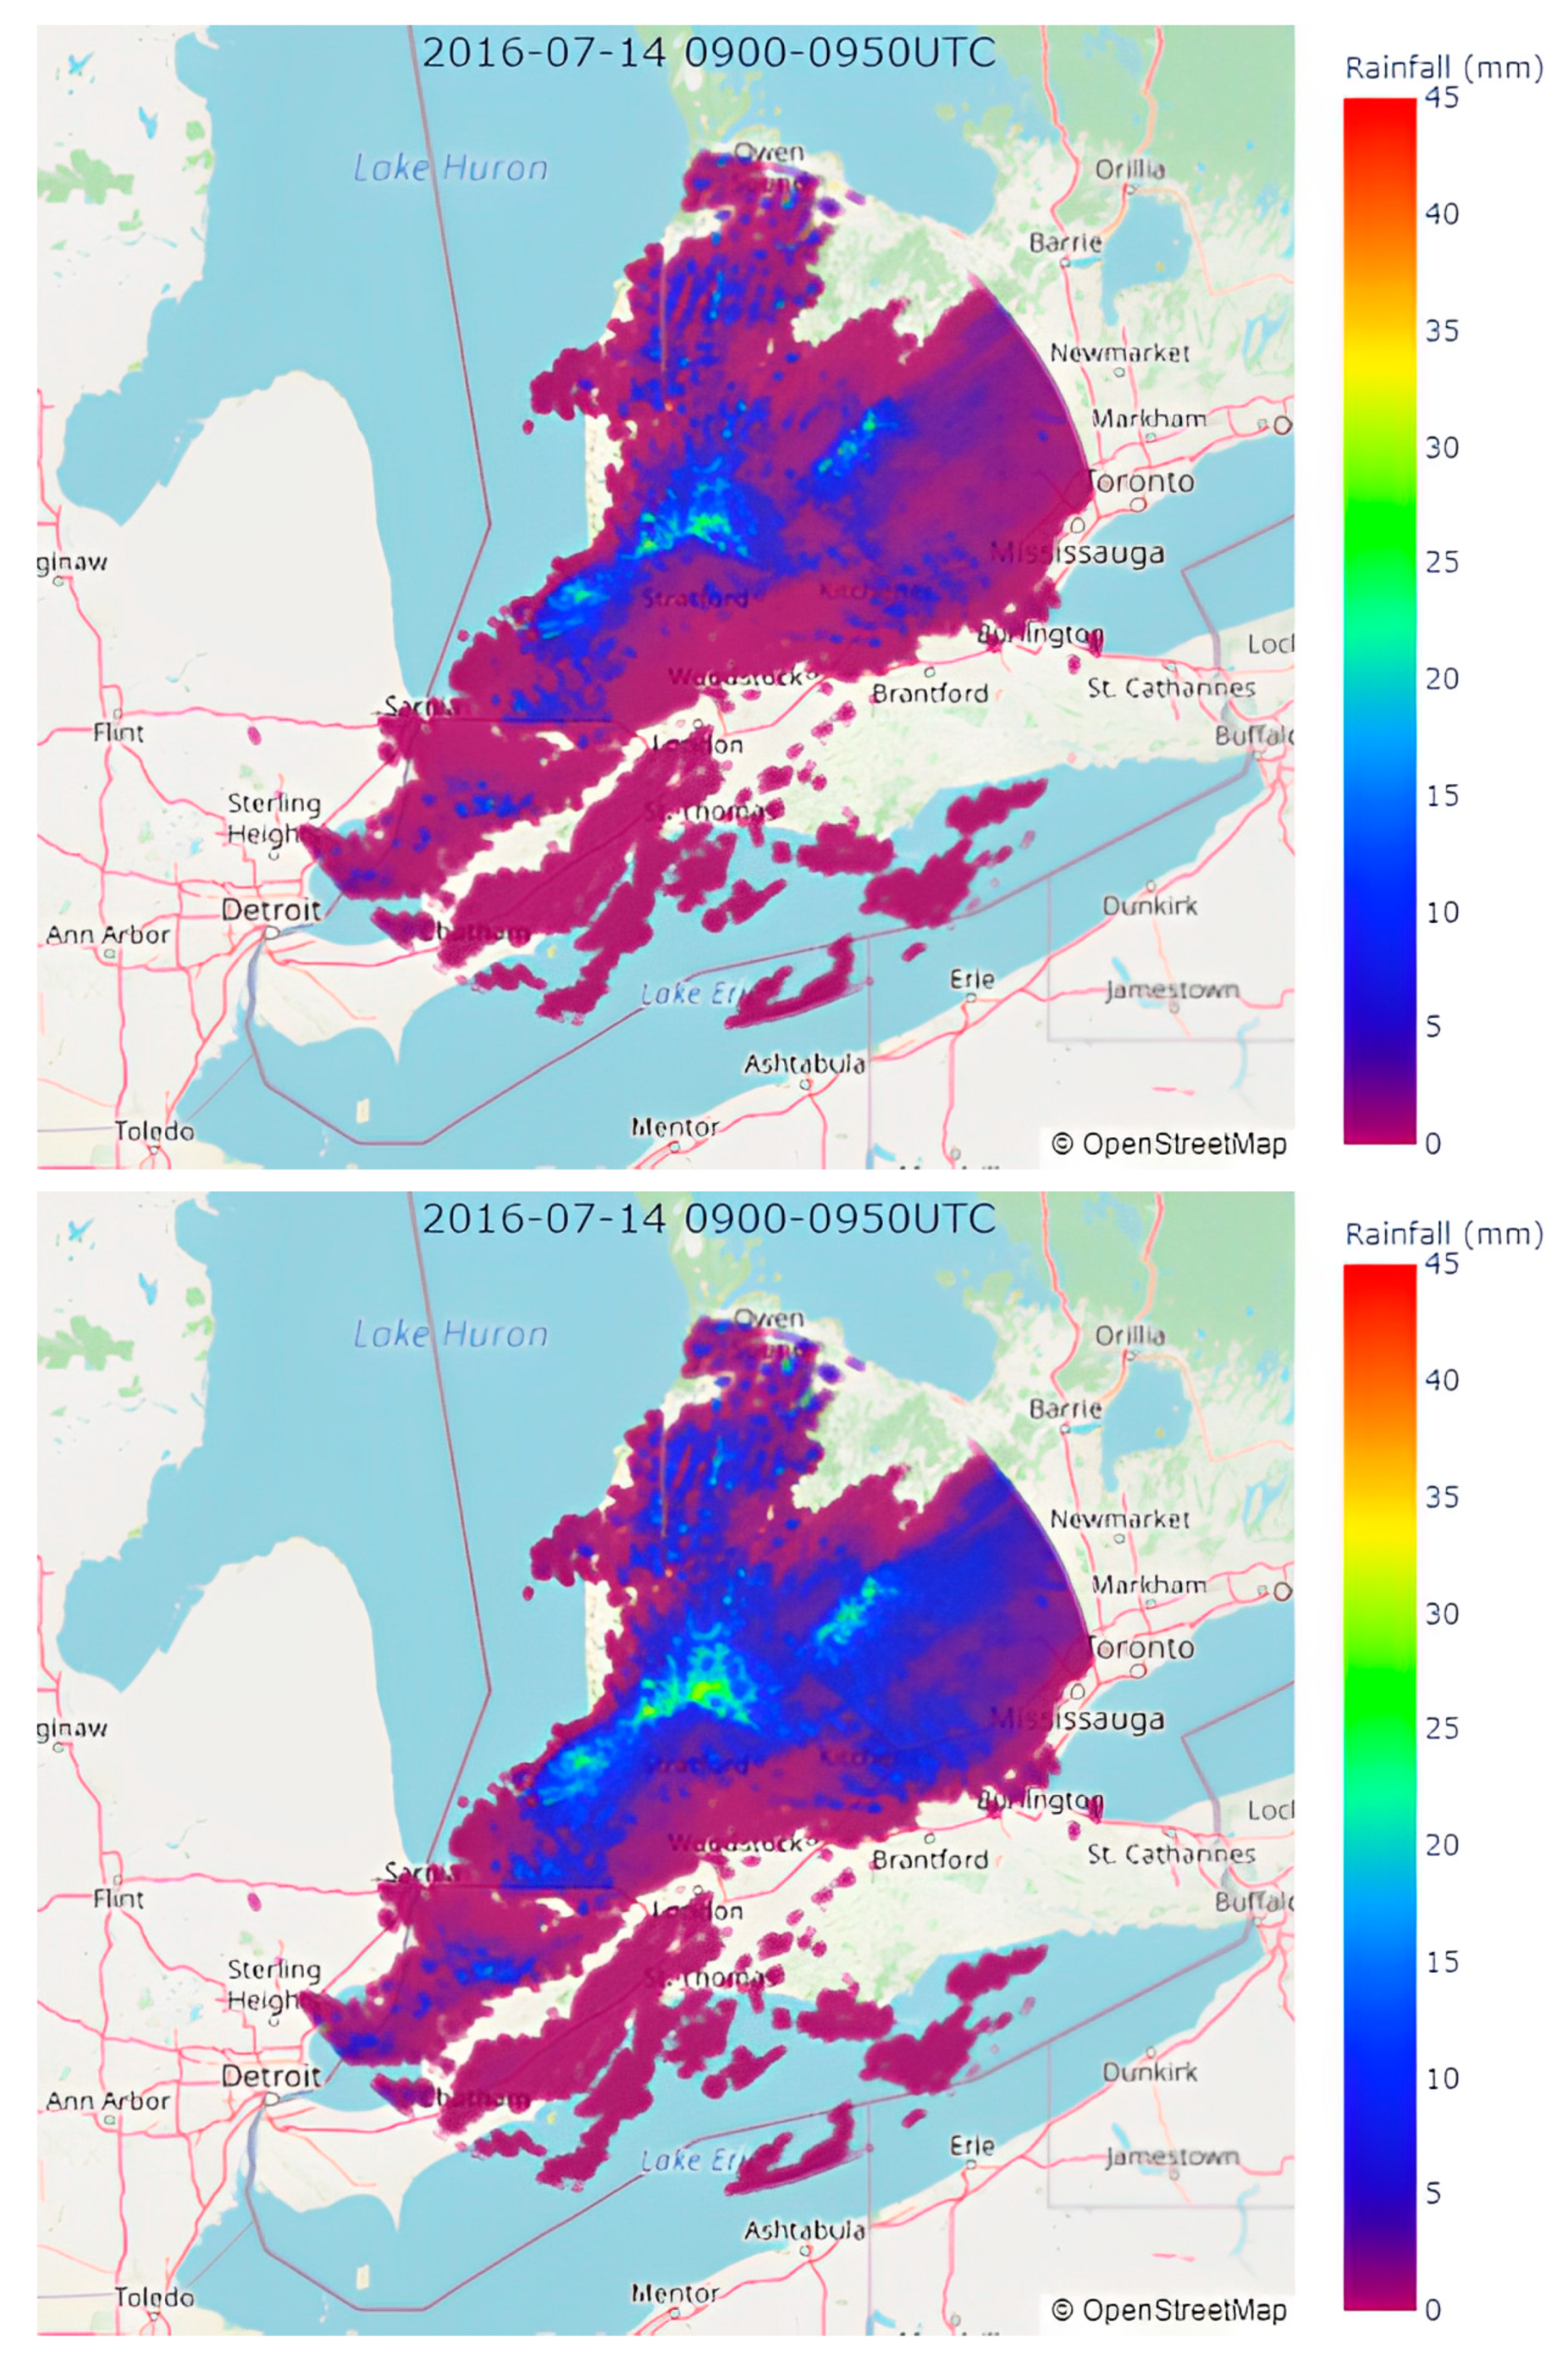
A hot and humid airmass tracked across southern Ontario during the early hours of 14 July 2016. The airmass was ahead of a cold front and was associated with thunderstorms, high winds, and heavy rain. The high winds brought down trees and power lines across the Greater Toronto Area. Figure 7 shows the 1 h (0900-0950 UTC) radar-based rainfall estimation using the RMG estimator and the RHITM(GB) model. It is important to note that the figure shows that the RHITM(GB) does not produce any artifacts that are visually unphysical or unreasonable. Furthermore, there were no artifacts or unreasonable results observed at the radar bin level per each sweep. This confirms that this ML method can be applied in real-time operations.
The Waterloo University gauge measured 3 mm rainfall during that hour while RMG and RHITM(GB) estimated 1.1 mm and 3.3 mm, respectively. Furthermore, the Region of Waterloo International Airport (YKF) located 14.6 km (9.1 mi) to the east of the Waterloo University measured 8.1 mm during that hour and the RMG and RHITM(GB) estimations were 3.8 mm and 7.3 mm, respectively. This further confirms the severe underestimation of the RMG estimator. The underestimation is also evident in Figure 8.

6. Conclusions

Decades of research in radar meteorology have led to an upgraded generation of radars that use polarimetric capabilities, replacing single (horizontal) polarization radars (e.g., [33,34,35,36,37]), in addition to producing dozens of polarimetric rainfall estimators. The rapid advancement in computer science and computing speed opens the door to the implementation of Machine Learning (ML) in radar-based rainfall estimation, thus improving upon radar Quantitative Precipitation Estimation (QPE). This research aimed to explore the ML classification capabilities to choose the optimal rainfall estimator at the radar bin level for each radar scan.
Rainfall measurements from Pearson International Airport (YYZ) were collected at 1 min temporal resolution for two summer seasons (May-Sep), 2011 and 2012, using a GEONOR weighing gauge. The radar data were checked for bright band contamination. The data were accumulated at 10 min intervals and combined with polarimetric variables (Z, ZDR, KDP) from the C-band King City Radar (WKR) to produce three power-law-based rainfall estimators RHITM(Z), RHITM(Z, Zdr), RHITM(KDP).
The polarimetric variables and the rainfall estimators were used in training three ML models, namely Decision Tree (DT), Random Forest (RF), and Gradient Boosting (GB) that use different classification techniques. The rainfall estimation produced from each of the ML models was referred to as RHITM(DT), RHITM(RF), and RHITM(GB).
The ML rainfall estimators were verified using 1 min data from the tipping bucket at Waterloo University during the 2016 summer (May-Sep) and radar data from the C-band Exeter radar (WSO). The tipping bucket data were resampled to 10 min accumulation to be compared to the radar and the latter data were checked for bright band contamination. The ML rainfall estimators were compared to the Marshall-Gunn [17] estimator (RMG) and the composite rain estimator produced by [18] (RBRT(RC)). A study found that RMG severely underestimates rainfall amounts while using data from the WSO radar [38]. Using drop size distribution (DSD) data, a composite rainfall estimator was derived using a scattering simulation [2]. Although disdrometers are often used to develop radar-based rainfall estimators, the errors involved in calculating rainfall rates from DSDs are considerable due to the different raindrop size spectra and the number of detected drops per spectrum by each disdrometer type [39]. The assumptions used in the scattering simulations can also introduce additional errors.
The results show that among the three ML models, the GB provides the ultimate improvements followed by RF, especially in the Root Mean Square Error (RMSE), Nash-Sutcliff coefficient (NSE), and the total seasonal rainfall estimation. The analysis also showed that the RMG and RBRT(RC) estimators underestimate the total seasonal rainfall accumulation by nearly 60%.
The results also showed that all three ML models do not produce any artifacts or unreasonable results when mapping the radar-based rainfall estimation per sweep or producing hourly accumulation maps. It is worth noting that the data used in this work (testing and validation) were vetted for virga, anomalous propagation, and bright band contamination to eliminate outliers in the process. This was done by comparing the data variables to the gauge and using upper air sounding from nearby station. It is important to eliminate outliers during the model training phase. The one limitation that was left unaddressed was the known underestimation of the tipping bucket data (validation data from the Waterloo University) due to the lack of a correction formula. Despite that, if applying any correction to the tipping bucket, it would have revealed further underestimation of the RMG and RBRT(RC) method with a better statistical scores for the three ML methods (RHITM(DT), RHITM(RF), and RHITM(GB)).
This research provides an insight to the implementation of ML in optimizing radar-based rainfall estimation. Groups of estimators, regionally or seasonally, can efficiently be used to train an ML model to optimize the rainfall estimation process at the bin level per radar sweep.

Author Contributions

Conceptualization, D.H.; methodology, D.H., G.A.I., P.A.T. and D.M.; software, D.H.; validation, D.H., G.A.I., P.A.T. and D.M.; formal analysis, D.H., G.A.I., P.A.T. and D.M.; investigation, D.H., G.A.I., P.A.T. and D.M.; resources, D.H., G.A.I., P.A.T. and D.M.; data curation, P.A.T., G.A.I. and D.M.; writing—original draft preparation, D.H., G.A.I., P.A.T. and D.M.; writing—review and editing, D.H., G.A.I., P.A.T. and D.M.; visualization, D.H., G.A.I., P.A.T. and D.M.; supervision, D.H., project administration, D.H. All authors have read and agreed to the published version of the manuscript.

Funding

This research received no external funding.

Data Availability Statement

The data used in this work and the three machine learning models can be found at https://doi.org/10.5281/zenodo.6979720, accessed on 1 September 2022.

Acknowledgments

The authors would like to thank Sudesh Boodoo from the King City Weather Radar Research Station, ECCC, for providing the radar data.

Conflicts of Interest

The authors declare no conflict of interest.

References

  1. Boero, L.; Poffo, D.; Damino, V.; Villalba, S.; Barques, R.M.; Rodriguez, A.; Suarez, M.; Beccacece, H.M. Monitoring and characterizing temporal patterns of a large colony of Tadarida brasiliensis (Chiroptera: Molossidae) in Argentina using field observations and the weather radar RMA1. Remote Sens. 2020, 12, 210. [Google Scholar] [CrossRef] [Green Version]
  2. Ryzhkov, A.V.; Schuur, T.J.; Zrnic, D.S. Radar rainfall estimation using different polarimetric algorithms. In Proceedings of the 30th International Conference on Radar Meteorology, Munich, Germany, 19–24 July 2001; pp. 641–643. [Google Scholar]
  3. Baldini, L.; Gorgucci, E.; Romaniello, V. An integrated procedure for rainfall estimation using C-band dual-polarization weather radars. In Proceedings of the 2008 IEEE Radar Conference, Rome, Italy, 26–30 May 2008; pp. 1–4. [Google Scholar] [CrossRef]
  4. Vulpiani, G.; Giangrande, S.; Marzano, F.S. Rainfall estimation from Polarimetric S-Band Radar Measurements: Validation of a Neural Network Approach. J. Appl. Meteorol. Climatol. 2009, 48, 2022–2036. [Google Scholar] [CrossRef]
  5. Ryzhkov, A.V.; Giangrande, S.E.; Schuur, T.J. Rainfall estimation with a polarimetric prototype of WSR-88D. J. Appl. Meteorol. 2005, 44, 502–515. [Google Scholar] [CrossRef] [Green Version]
  6. Cremonini, R.; Bechini, R. Heavy rainfall monitoring by polarimetric C-band weather radars. Water 2010, 2, 838–848. [Google Scholar] [CrossRef] [Green Version]
  7. Crisologo, I.; Vulpiani, G.; Abon, C.C.; David, C.P.C.; Bronster, A.; Heistermann, M. Polarimetric rainfall retrieval from a C-band weather radar in a tropical environment (The Philippines). Asia Pac. J. Atmosp. Sci. 2014, 50, 595–607. [Google Scholar] [CrossRef]
  8. Thompson, E.J.; Rutledge, S.A.; Dolan, B.; Thurai, M.; Chandrasekar, V. Dual-polarization radar rainfall estimation over tropical oceans. J. Appl. Meteorol. Climatol. 2018, 57, 755–775. [Google Scholar] [CrossRef]
  9. Schleiss, M.; Olsson, J.; Berg, P.; Niemi, T.; Kokkonen, T.; Thorndahl, S.; Nielsen, R.; Nielsen, J.E.; Bozhinova, D.; Pulkkinen, S. The accuracy of weather radar in heavy rain: A comparative study for Denmark, the Netherlands, Finland and Sweden. Hydrol. Earth Syst. Sci. 2019, 427, 1–42. [Google Scholar] [CrossRef]
  10. Boodoo, S.; Hudak, D.; Ryzhkov, A.; Zhang, P.; Donaldson, N.; Sills, D.; Reid, J. Quantitative precipitation estimation from a C-band dual-polarized radar for the 8 July 2013 flood in Toronto, Canada. J. Hydrometeorol. 2015, 16, 2027–2044. [Google Scholar] [CrossRef] [Green Version]
  11. Boodoo, S.; Hudak, D.; Donaldson, N.; Reid, J.; Michelson, D.; Rodriguez, P.; Couture, M.; Stojanovic, V. The development of a Canadian operational dual-polarization rainfall estimation algorithm. In Proceedings of the 10th European Conference on Radar in Meteorology & Hydrology, Wageningen, The Netherlands, 1–6 July 2018. [Google Scholar]
  12. Wijayarathne, D.; Boodoo, S.; Coulibaly, P.; Sills, D. Evaluation of radar quantitative precipitation estimates (QPEs) as an input of hydrological models for hydrometeorological applications. J. Hydrometeorol. 2020, 21, 1847–1864. [Google Scholar] [CrossRef]
  13. Wijayarathne, D.; Coulibaly, P.; Boodoo, S.; Sills, D. Use of Radar Quantitative Precipitation Estimates (QPEs) for Improved Hydrological Model Calibration and Flood Forecasting. J. Hydrol. 2021, 22, 2033–2053. [Google Scholar] [CrossRef]
  14. Cuomo, J.; Chandrasekar, V. Use of deep learning for weather radar Nowcasting. J. Atmosp. Ocean. Technol. 2021, 38, 1641–1656. [Google Scholar] [CrossRef]
  15. Srinivas, T.A.S.; Somula, R.; Govinda, K.; Saxena, A.; Reddy, A.P. Estimating rainfall using machine learning strategies based on weather radar data. Int. J. Commun. Syst. 2019, 33, e3999. [Google Scholar] [CrossRef]
  16. Bonnet, S.M.; Evsukoff, A.; Rodriguez, C.A.M. Precipitation nowcasting with weather radar images and deep learning in Sao Paulo, Brasil. Atmosphere 2020, 11, 1157. [Google Scholar] [CrossRef]
  17. Marshall, J.S.; Gunn, K.L.S. Measurement of snow parameters by radar. J. Meteorol. 1952, 9, 322–327. [Google Scholar] [CrossRef]
  18. Bringi, V.N.; Rico-Ramirez, M.A.; Thurai, M. Rainfall estimation with an operational polarimetric C-band radar in the United Kingdom: Comparison with gauge network and error analysis. J. Hydrometeorol. 2011, 12, 935–954. [Google Scholar] [CrossRef]
  19. Hudak, D.; Rodriguez, P.; Lee, G.W.; Ryzhkov, A.V.; Fabry, F.; Donaldson, N. Winter precipitation studies with a dual-polarized C-band radar. In Proceedings of the ERAD 4th European Conference on Radar in Meteorology and Hydrology, Barcelona, Spain, 18–22 September 2006; pp. 9–12. [Google Scholar]
  20. Joe, P.; Lapczak, S. Evolution of the Canadian operational radar network. In Proceedings of the ERAD 2nd European Conference on Radar in Meteorology and Hydrology, Delft, The Netherlands, 18–22 November 2002; pp. 370–382. [Google Scholar]
  21. Taylor, B.M. Direct Comparisons of Polarimetric C-Band and S-Band Radar in Snow. Master’s Thesis, York University, Toronto, CA, USA, 2018. Available online: http://hdl.handle.net/10315/35034 (accessed on 1 June 2022).
  22. Isaac, G.A.; Bailey, M.; Boudala, F.; Cover, S.G.; Crawford, R.; Donaldson, N.; Gultepe, I.; Hansen, B.; Heckman, I.; Huang, L.; et al. The Canadian airport nowcasting systems (CAN-Now). Meteorol. Appl. 2014, 21, 30–40. [Google Scholar] [CrossRef]
  23. Milewska, E.J.; Vincent, L.A.; Hartwell, M.M.; Charlesworth, K.; Mekis, E. Adjusting precipitation amount from Geonor and Pluvio automated weighing gauges to preserve continuity of observations in Canada. Can. Water Resour. J. 2019, 44, 127–145. [Google Scholar] [CrossRef]
  24. Devine, K.A.; Mekis, É. Field accuracy of Canadian rain measurements. Atmosp. Ocean 2008, 46, 213–227. [Google Scholar] [CrossRef]
  25. Marshall, J.S.; Palmer, W.M.K. The distribution of raindrops with size. J. Meteorol. 1948, 5, 165–166. [Google Scholar] [CrossRef]
  26. Pedregosa, F.; Varoquaux, A.; Michel, V.; Thirion, B. Scikit-learn: Machine learning in Python. J. Mach. Learn. Res. 2011, 12, 2825–2830. [Google Scholar]
  27. Raileanu, L.E.; Stoffel, K. Theoretical comparison between the Gini Index and Information Gain criteria. Ann. Math. Artif. Intell. 2004, 41, 77–93. [Google Scholar] [CrossRef]
  28. Breiman, L. Random Forests. Mach. Learn. 2001, 45, 5–32. [Google Scholar] [CrossRef] [Green Version]
  29. Friedman, J.H. Greedy boosting approximation: A gradient boosting machine. Ann. Stat. 2001, 20, 1189–1232. [Google Scholar] [CrossRef]
  30. Nash, J.E.; Sutcliffe, J.V. River flow forecasting through conceptual models Part 1—A discussion of principles. J. Hydrol. 1970, 10, 282–290. [Google Scholar] [CrossRef]
  31. Moriasi, D.N.; Arnold, J.G.; van Liew, M.W.; Bingner, R.L.; Harmel, R.D.; Veith, T.L. Model evaluation guidelines for systematic quantification of accuracy in watershed simulations. Trans. ASABE 2007, 50, 885–900. [Google Scholar] [CrossRef]
  32. Irving, D. A Minimum Standard for Publishing Computational Results in the Weather and Climate Sciences. Bull. Am. Meteorol. Soc. 2016, 97, 1149–1158. [Google Scholar] [CrossRef]
  33. McCormick, G.C.; Hendry, A. Principles for the radar determination of the polarization properties of precipitation. Radio Sci. 1975, 10, 421–434. [Google Scholar] [CrossRef]
  34. McCormick, G.C.; Hendry, A. Techniques for the determination of the polarization properties of precipitation. Radio Sci. 1979, 14, 1027–1040. [Google Scholar] [CrossRef]
  35. McCormick, G.C. Polarization errors in a two-channel system. Radio Sci. 1981, 16, 67–75. [Google Scholar] [CrossRef]
  36. Fabry, F. Radar Meteorology, Principles and Practice, CUP; Cambridge University Press: Cambridge, UK, 2015; ISBN 9781108460392. [Google Scholar] [CrossRef]
  37. Bringi, V.; Zrnic, D. Polarization weather radar development from 1970–1995: Personal Reflections. Atmosphere 2019, 10, 714. [Google Scholar] [CrossRef] [Green Version]
  38. McKee, J.L. Evaluation of Gauge-Radar Merging Methods for Quantitative Precipitation Estimation in Hydrology: A Case Study in the Upper Thames River Basin. Master’s Thesis, University of Western Ontario, London, ON, Canada, 2015; p. 135. [Google Scholar]
  39. Adirosi, E.; Bladini, L.; Roberto, N.; Gatlin, P. Improvement of vertical profiles of raindrop size distribution from micro rain radar using 2D video disdrometer measurements. J. Atmosp. Res. 2018, 160, 404–415. [Google Scholar] [CrossRef]
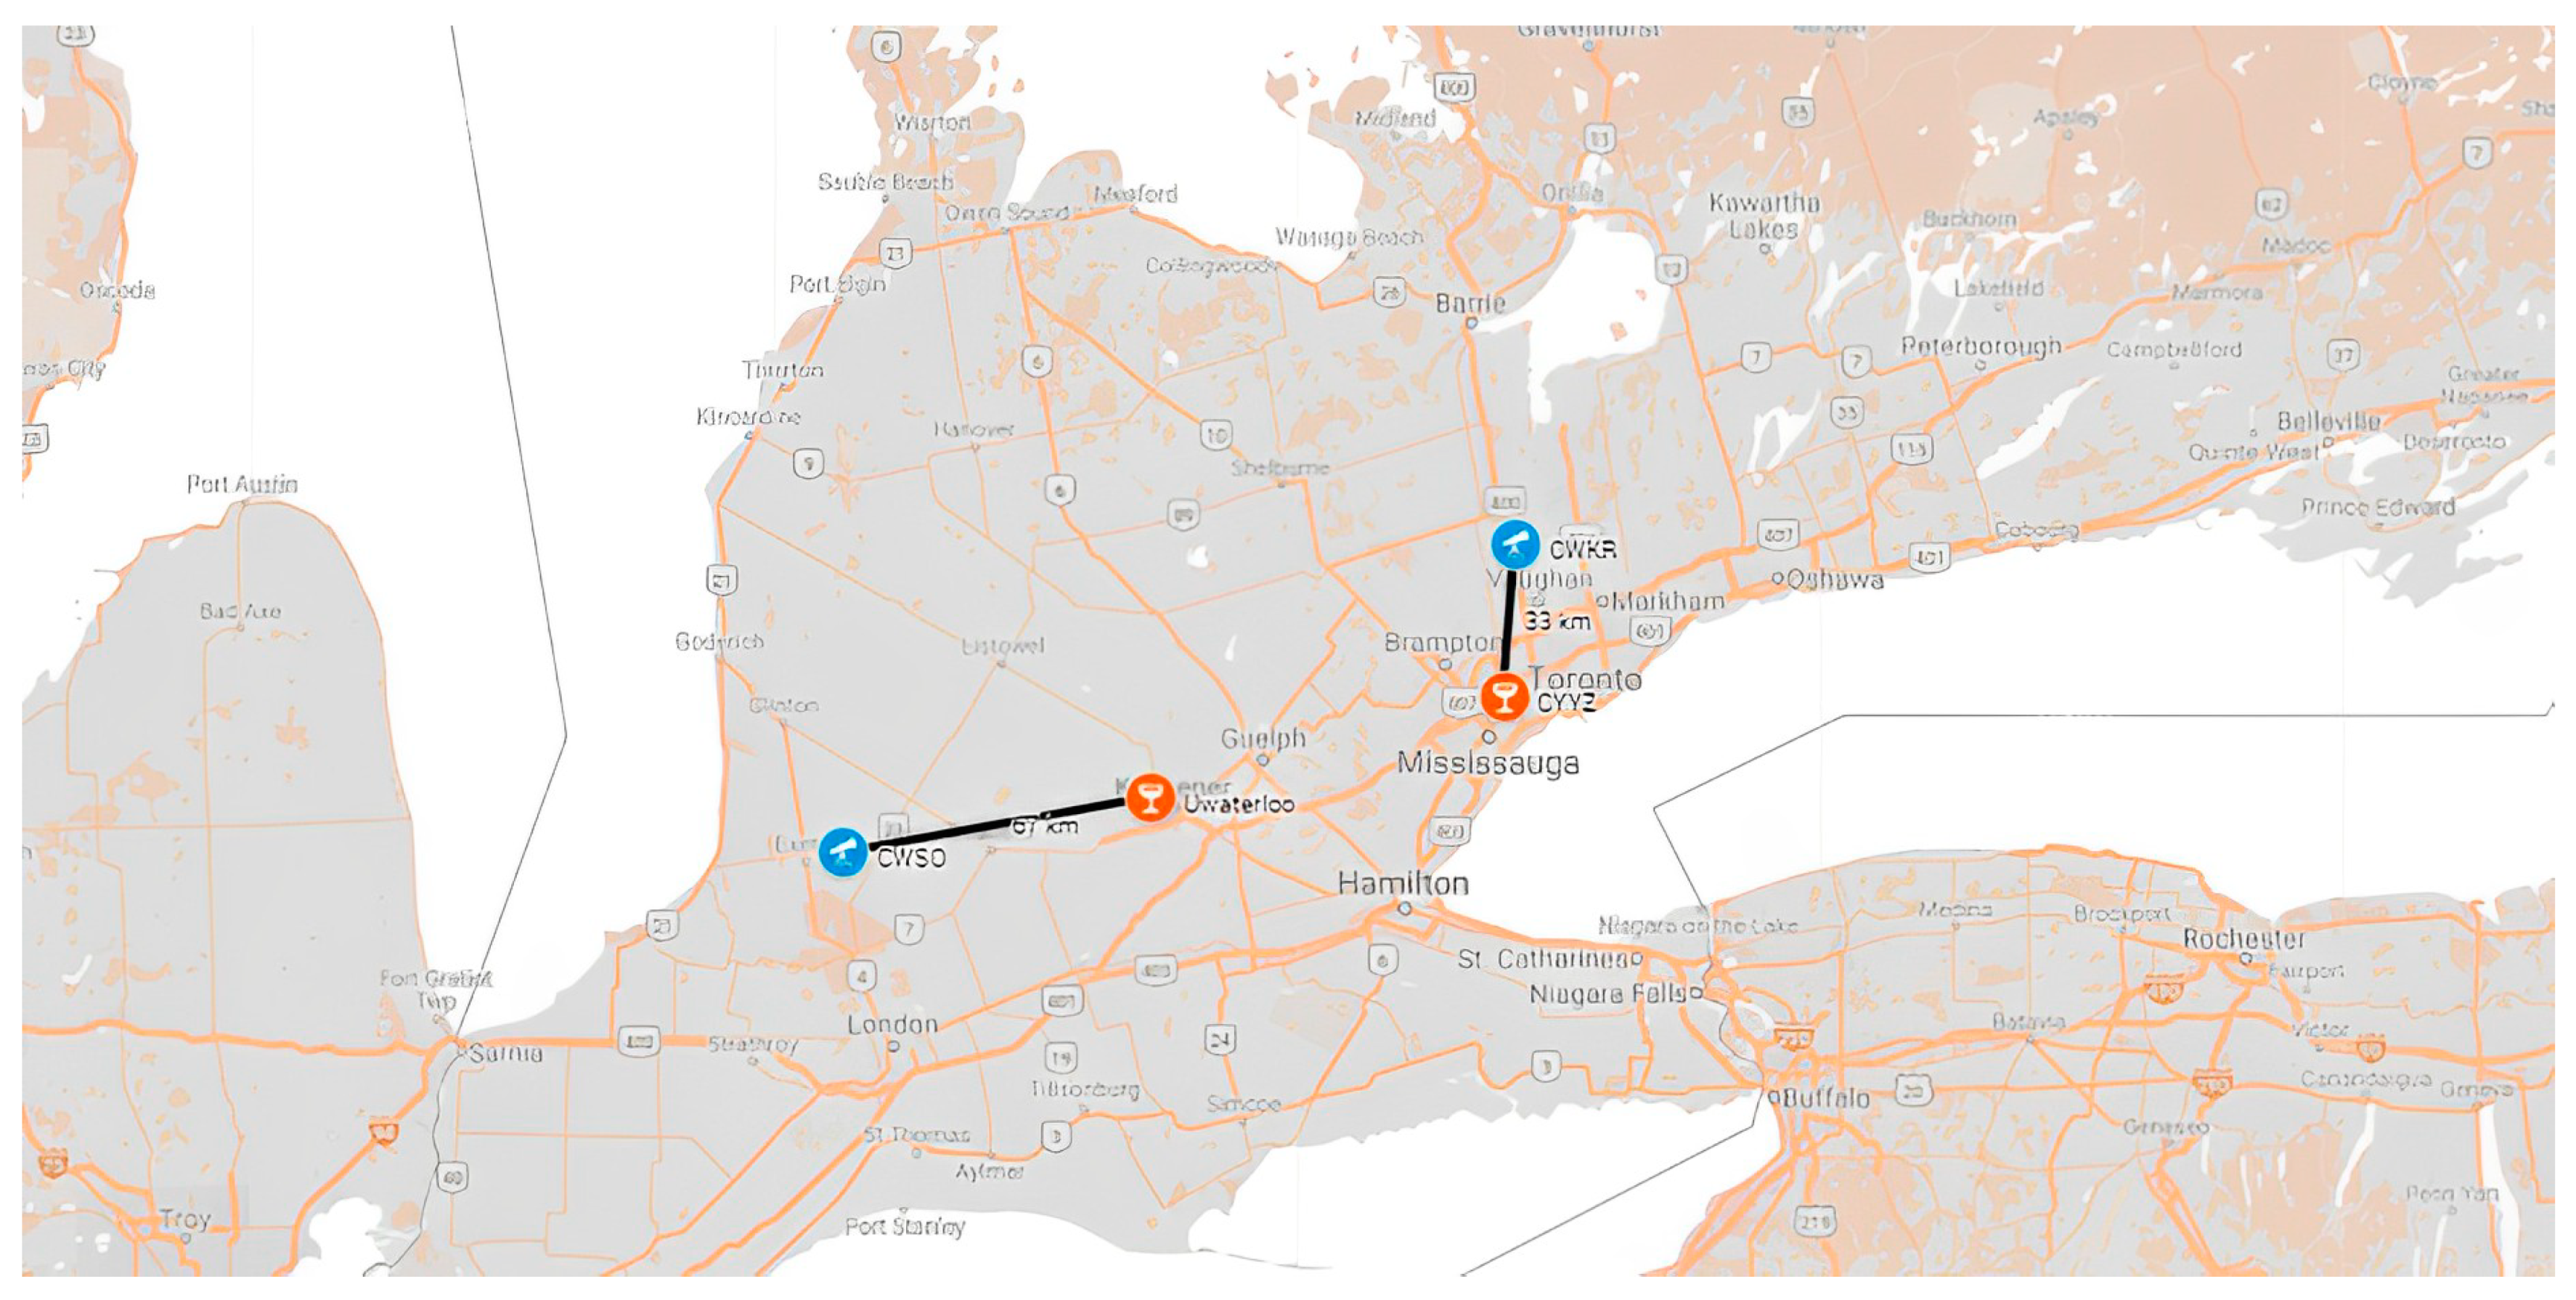
Figure 1. The location of the King City radar in comparison to the Pearson Airport (33 km) and the Exeter radar to the Waterloo University (67 km).
Remotesensing 14 05188 g001
Figure 2. The 10 min rainfall rates comparison from all the gauges and sensors (GEONOR, Tipping Bucket, Belfort, and FD12P) for the period between May 2011 to September 2012.
Remotesensing 14 05188 g002
Figure 3. Rainfall accumulation (10 min) from the GEONOR T200B and Tipping Bucket for Pearson International Airport (YYZ) for the period May-September 2011 and 2012.
Remotesensing 14 05188 g003
Figure 4. Bringi et al. 2011 [18] composite rain-rate estimator RBRT(RC).
Remotesensing 14 05188 g004
Figure 5. Machine Learning Decision Tree. Each box shows the featured variables, the Gini Index, the number of samples used, the value shows the number of samples each target variable produced close estimation to the rain gauge, while the class shows the best target variable.
Remotesensing 14 05188 g005
Figure 6. Schematic of the Random Forest model.
Remotesensing 14 05188 g006
Figure 7. Hourly tipping bucket (mm/h) versus radar estimation from [1,2], and the Decision Tree, Random Forest, and Gradient Boost obtained from the Machine Learning (ML) models.
Remotesensing 14 05188 g007
Figure 8. One-hour radar-based accumulated rainfall estimates on 14 July 2016 (0900-0950 UTC) using the RMG (top) and RHTIM(GB) (bottom) estimation methods.
Remotesensing 14 05188 g008
Table 1. The Nash-Sutcliffe Efficiency Coefficient values.
Performance EvaluationNSE
Very good0.75 < NSE ≤ 1.00
Good0.65 < NSE ≤ 0.75
Satisfactory0.5 < NSE ≤ 0.65
UnsatisfactoryNSE ≤ 0.50
Table 2. The statistical skills of (RMG), (RBRT(RC)), and the three Machine Learning (ML) models (DT, RF, GB). The statistical scores are the Pearson Correlation coefficient (Corr), Mean Absolute Error (MAE), Root Mean Square Error (RMSE), Normalized Mean Bias (NMB), the Nash-Sutcliffe coefficient (NSE), and the percentage of the total seasonal rainfall estimation to the total rainfall measured by the gauge (Est.%).
RMGRBRT(RC)RHITM(DT)RHITM(RF)RHITM(GB)
Corr0.9010.8980.8420.8950.901
MAE1.321.301.711.371.27
RMSE2.091.902.271.811.66
NME0.6500.6420.8460.6770.626
NSE0.6230.6880.5530.7160.763
Est.%57.858.9141128124
Publisher’s Note: MDPI stays neutral with regard to jurisdictional claims in published maps and institutional affiliations.