Article

Interpreting Mangrove Habitat and Coastal Land Cover Change in the Greater Bay Area, Southern China, from 1924 to 2020 Using Historical Aerial Photos and Multiple Sources of Satellite Data

1
Institute of Environment, Energy and Sustainability, The Chinese University of Hong Kong, Shatin, Hong Kong, China
2
Joint Centre of Environmental Sustainability and Resilience (ENSURE), The Chinese University of Hong Kong, Shatin, Hong Kong, China
3
Simon F S Li Marine Science Laboratory, School of Life Sciences, The Chinese University of Hong Kong, Shatin, Hong Kong, China
*
Author to whom correspondence should be addressed.
Remote Sens. 2022, 14(20), 5163; https://doi.org/10.3390/rs14205163
Submission received: 11 July 2022 / Revised: 26 September 2022 / Accepted: 28 September 2022 / Published: 15 October 2022
(This article belongs to the Special Issue Remote Sensing of Wetland Vegetation Patterns and Dynamics)

Abstract

:
Coastal habitat dynamics and ecosystem function in response to human-induced disturbance, especially urbanization, are of increasing concern. However, how changes in landscape composition as well as habitat quantity and quality may affect the long-term sustainability of rapidly urbanizing coasts remains unclear. This study aimed to quantify the extent, change rate, patterns, change process and interrelationships of mangrove habitats, impervious surfaces, and other land cover types in Deep Bay in the Guangdong-Hong Kong-Macau Greater Bay Area (GBA), China, the world’s largest megalopolis, from 1924 to 2020. We processed historical aerial photos (1924–2020) and multiple sources of satellite data (1973–2020) for different types of land cover mapping. Post-classification analysis, including correlation analysis and change detection analysis, was conducted based on the long time-series land cover classification results. Mangrove habitats increased in Deep Bay from 1924 to 2020, except for a large area decrease from 1954 to 1964 due to the construction of tidal aquaculture ponds. Mudflat areas contributed most to the expansion of mangrove habitats of about 275 ha from 1987 to 2020. During this period, reclamation and urbanization for the construction of the megacity of Shenzhen turned large areas of water and mudflat (about 4000 ha) on the northern shore into impervious surface and urban vegetation. Overall, the landscape pattern of mangrove habitats in Deep Bay showed increasing connectivity and decreasing degree of fragmentation from 1987 to 2020. These changes have significant implications for the ecosystem services, e.g., supporting migratory waterbirds, supported by these wetlands.

Graphical Abstract

1. Introduction

Located in the tropical and subtropical intertidal regions, mangrove ecosystems are among the most productive ecosystems in the world and play essential ecological functions in nearshore ecosystems and the global carbon cycle [1,2,3]. Mangrove forests provide breeding areas and nursery habitats for their associated faunal and floral assemblages. The mangrove communities provide commercial products like food, timber, fuel, and medicines for human society, as well as services like filtering pollution, protecting coastal regions from natural disasters and coastal erosion, and carbon storage [4]. However, because of human impacts such as urbanization, aquaculture, and wood harvesting, mangrove habitats have been continuously destroyed worldwide for decades [5]. Once covering over 20 million ha in the world, mangrove forests have declined sharply with nearly 30% lost in recent decades and continue to disappear worldwide [5], although there are signs that the loss rate has decreased in recent years [6]. Given the many key ecosystem services of mangroves, continued mangrove deforestation could cause significant ecological and economic losses for coastal regions, with wide-ranging long-term implications for global sustainability [5,7].
Mangroves live close to tolerance limits in an extreme and dynamic environment. Often distributed in tropical estuaries where human settlement occurs, mangroves are sensitive and vulnerable to natural and human disturbances [3]. Due to their high vulnerability and important ecological and societal values, monitoring the extent and dynamics of mangrove habitats is necessary for mangrove conservation and restoration [8], as well as the sustainability of coastal regions. With rapid global coastal urbanization, particularly in the tropics, the future of mangrove and other soft-sediment ecosystems and their capacity for services require specific attention [9]. Remote sensing is an efficient and reliable way to obtain real-time, long-term, and large-scale data on mangrove areas and their spatial and temporal dynamics. With the development of new sensor and satellite technologies, remote sensing images can monitor mangrove changes in different spatial and temporal scales, addressing questions and knowledge gaps relevant to ecosystem sustainability.
One consequence of continued population growth is that the composition of natural landscapes is largely influenced by human activities, resulting in the transformation between different land use and land cover types of natural, semi-natural, agricultural, urban, and semi-urban areas [10]. Urbanization can drive fast-changing land use and land cover, especially in areas around coastal megacities (“peri-urban” coasts), significantly impacting local ecosystems, such as wildlife use of the habitats and nutrient dynamics. Apart from coastal mangrove habitats, urban areas, agricultural and other land cover types can also act as carbon emitters/ exporters [11]. It is vital to incorporate human influences into the study of the structure and function of ecosystems associated with coastal megacities [11].
This study aimed to assess how urbanization may result in changes in landscape composition as well as habitat quantity and quality and explore the implications of such changes for the long-term sustainability of tropical, mangrove-dominated coasts and their capacity for ecosystem services such as wildlife conservation. To achieve this aim, we used the example of the Greater Bay Area in southern China, the world’s largest megalopolis with a 70-million population and followed the change of land cover during the period 1924 to 2020 using a diversity of remote sensing data sources. Despite their association with the megacity, the wetlands in the study area also support many ecosystem services, including acting as a refueling ground for migratory birds every winter along the East Asia-Australasia Flyway. With the rapid urbanization of the global coastline, the pattern of land cover change reported here will be of reference value to the management of similar coastal wetlands being transformed by urbanization.

2. Study Area and Datasets
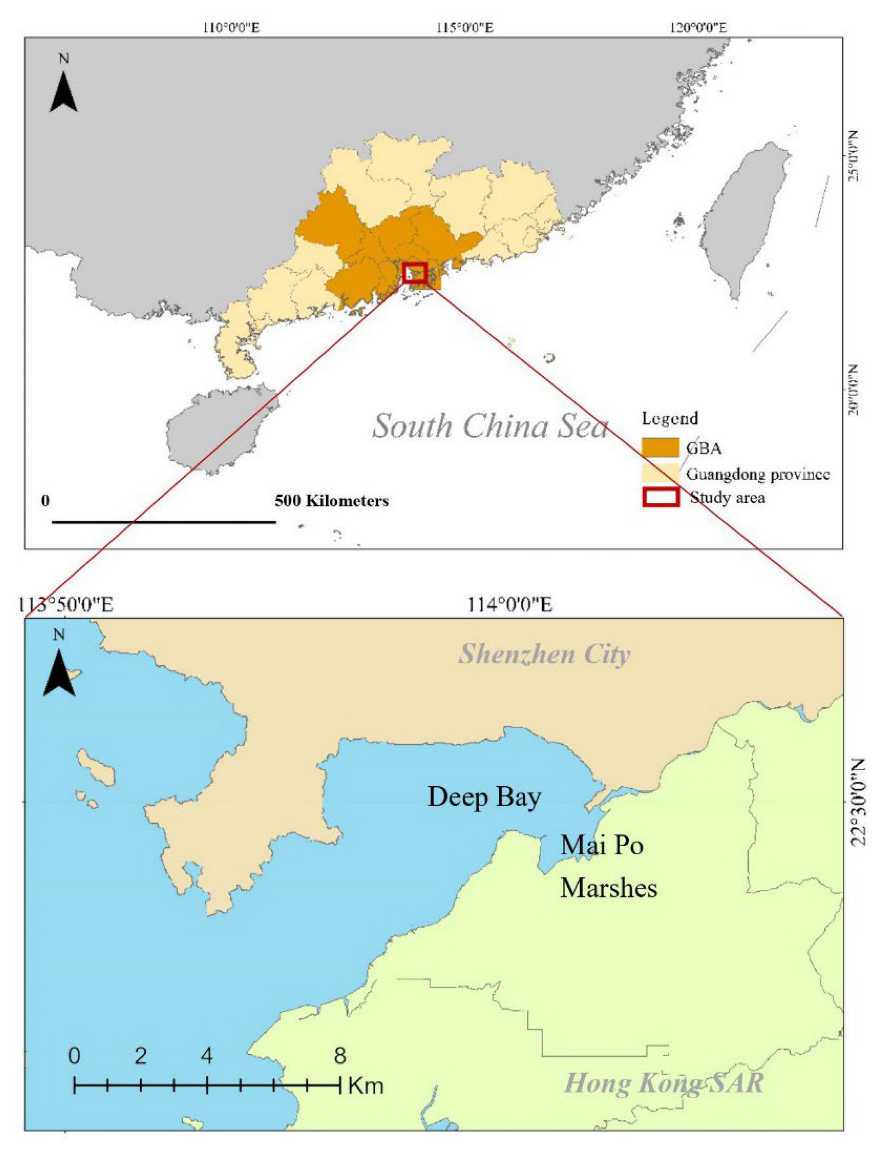
2.1. Study Area

The Guangdong-Hong Kong-Macau Greater Bay Area (GBA), located in southern China, is the world’s largest megalopolis with a 70 million population (Figure 1). This megalopolis contains nine cities and two special administrative regions: Guangzhou, Shenzhen, Foshan, Zhuhai, Huizhou, Dongguan, Zhongshan, Zhaoqing, Jiangmen (cities of Guangdong Province), Hong Kong and Macao (Special Administrative Regions of China). Under the Chinese national development strategy, this megacity region has experienced rapid development during the last four decades. The large increase in spatial connection of human movements, traffic flow, and transport network greatly contributed to the degree of regional integration in the GBA [12]. The development of Shenzhen city (13 million) and Hong Kong Special Administrative Region (7.5 million) as two main core cities in GBA is a microcosm illustrating the interplay between urbanization and coastal wetlands in the tropics.
Deep Bay (Shenzhen Bay, 112 km2) is a shallow, mangrove-fringed embayment in the eastern Pearl River estuary, fringed by Shenzhen city and Hong Kong Special Administrative Region (SAR), in the southeast region of the Greater Bay Area. There are four major landscape components in this shallow embayment: a shallow brackish water body (<2 m at high tide), intertidal mudflat, tidal mangroves, and traditional gei wai (traditionally operated tidal shrimp ponds) where the vegetation is largely preserved [11]. This area includes two mangrove nature reserves: Mai Po Nature Reserve, Hong Kong SAR, and Futian Nature Reserve, Shenzhen. Mai Po Nature Reserve in Hong Kong has been designated as a ‘Site of Special Scientific Interests’ since 1976. It has been included in the ‘List of Wetlands of International Importance’ under the Ramsar Convention since 1995. The mangrove area in Hong Kong had been destroyed due to human activity a few decades before 1997 [13]. Historically, the wetlands originally in the Mai Po Reserve were used for shrimp farming ponds and fishponds. By the late 1990s, only about 15% of the original mangrove stands remained in the intertidal areas of Mai Po [13]. In Deep Bay, eight species of mangroves have been recorded, with Avicennia marina and Kandelia obovata being dominant in the tidal area, whereas only K. obovata is common in the gei wais.
Deep Bay offers a mosaic of wetland types (mangrove forest, tidal ponds, mudflat) for supporting waterbird conservation. Collectively, the Deep Bay wetlands are a critically important stopover and refueling ground for migratory birds along the East Asia-Australasia Flyway. Historical records maintained by the Hong Kong Bird Watching Society report wintering bird numbers up to 100,000, including some globally endangered species such as the Blackfaced Spoonbill (Platalea minor). Not all wetland types are of the same value to migratory birds, and the replacement of one land cover by another (e.g., mangrove forests/fishponds replaced by impervious urban areas) would have significant implications for bird use of the area. Hence, the evolution of land cover in this wetland complex, part of the world’s largest megalopolis, is of particular interest to the long-term ecological sustainability of rapidly urbanizing coastlines.

2.2. Datasets

Multi-source, long-time-series satellite datasets in the Greater Bay Area from 1973–2020 were used in this study, including multispectral sensors of Landsat Multi-spectral Scanner (MSS), Thematic Mapper (TM), Enhanced Thematic Mapper Plus (ETM+), and Operational Land Imager (OLI); SPOT-HRV, HRVIR, HRG; Quickbird-02, GeoEye-01, as well as WorldView-01,03 (see Tables S1–S4 in Supplementary Materials). In addition, historical aerial photos from 1924–2020 for the Hong Kong part of the system were also selected and obtained from the Hong Kong Lands Department for precise land cover sample collection and mapping (Figure 2). Analysis of land cover change for the period 1924 to 1973 was primarily conducted using aerial photographs.
We first selected aerial photos from the Lands Department of Hong Kong with no clouds and high resolution. Each photo was first scanned in 1000 dpi resolution, and the photo scale, sensor, and features were identified. The image was then processed using enhancement, trimming, brightness, and grayscale adjustment to ensure the historical photos had consistent properties. The origin of the coordinate system point was set up using ArcGIS. Control points were selected to position the image overlay on a current reference satellite image by identifying permanent features. Transformation with 1st order polynomial (Affine) function was used to align the historical photo and reference satellite image. The historical photo then underwent georeferencing and registration with multi-source long time-series satellite datasets from 1973 to 2020, and geometric correction was performed to align the photos with the current dataset. Each photo was then mapped out using framing and mosaic for each year. The mosaic was vectorized into different land cover types for further analysis. The following tables provide information on the satellite data and historical aerial photos processed in this study for constructing the land cover maps. Historical aerial photos from 1972 to 2020 were used for sample selection, details of which are discussed in Section 3.1.3 and Section 3.1.4.
Theoretically, images are selected preferably when the phenological characteristics of different mangrove species are significantly different. However, the study area of this research is often cloudy and rainy, which greatly limits the availability of high-quality data. Therefore, in this study, we selected most of the images from the dry season (October to March) to eliminate cloud contamination.

3. Methodology

3.1. Land Cover Mapping

The overall methodology framework of this study is summarized in Figure 3. Overall, Landsat data were mapped and analyzed for spatial and time-series analysis, while SPOT data, other high-resolution data and historical aerial photos mapping results were used to qualitatively interpret the land cover situation dating back to 1924 and to supplement the land cover information for the Landsat data results.

3.1.1. Image Preprocessing

All Landsat data were processed as Level-1, terrain-corrected data by the United States Geological Survey (USGS), with prior systematic radiometric and geometric corrections. The correction accuracy was assessed by incorporating ground control points and a digital elevation model (DEM) [14]. For other satellite images, radiometric calibration was conducted to eliminate the errors produced by variations in sensors. Geometric correction was conducted for all images using image-to-image registration, with a Universal Transverse Mercator (UTM) projection and World Geodetic System-84 (WGS-84) datum. Landsat Level-1 data preprocessing was conducted through geometric correction by USGS. The image-to-image registration process for medium-resolution and high-resolution images was based on the SPOT 5 image in 2011, and Worldview-02 image in 2010, respectively, and the co-registration employed a polynomial transformation method. The correction accuracy was assessed by ground control points, which were selected from fixed surface buildings and geometric corners in the images. In the geometric correction process of medium-resolution images, all the Landsat MSS images of 60 m resolution were resampled to 30 m resolution, and SPOT data (20 m resolution) were resampled to 10 m resolution. In the geometric correction process of high-resolution images, all the Quickbird-02, GE-01, WorldView-03 data (of 2.4 m, 2.4 m, and 1.6 m resolution, respectively) were resampled to 2 m. The co-registration adopted a polynomial transformation method, and the resampling was an interpolation process using the nearest-neighbor method. We assumed that this resampling does not have a significant impact on the final mangrove species discrimination and statistical analysis. Layer stacking was used to stack all the bands together for further processing of Landsat OLI data. Pan-sharpening was conducted on the other high-resolution data. The areas covered by the high-resolution data were included in the study area. For historical aerial photos, all the paper version photos were scanned, geo-referenced and registered to Universal Transverse Mercator (UTM) projection and World Geodetic System-84 (WGS-84) datum based on Landsat images.

3.1.2. Spectral and Texture Feature Extraction

Three spectral indices—Normalized Difference Vegetation Index (NDVI), Normalized Difference Water Index (NDWI), and Modified Normalized Difference Water Index (MNDWI) were calculated for Landsat images:
N D V I = R N I R R R E D R N I R + R R E D
N D W I n = R N I R R S W I R n R N I R + R S W I R n , n = 1 , 2
M N D W I n = R G R E E N R S W I R n R G R E E N + R S W I R n , n = 1 , 2
where RRED, RGREEN, RNIR and RSWIR represent the surface reflectance of the red band, green band, near-infrared band, and short-wave infrared band, respectively. NDVI was calculated for all Landsat images. NDWI and MNDWI were calculated for Landsat TM, ETM+, and OLI images.
Texture features were extracted through co-occurrence measures. The popular grey level co-occurrence matrix (GLCM) approach was applied to analyze the texture features [15,16]. Homogeneity (HOM), dissimilarity (DISS), entropy (ENT), and the angular second moment (ASM) were calculated for every band of the Landsat data (including calculated spectral feature bands), SPOT and other high-resolution data, and stacked to the original images since these four texture features were reported as effective indicators for texture description of different land cover types [16,17]. The processing window size for SPOT and high-resolution images was set at 7 × 7 pixels since this setting was reported to be suitable for processing the images of spatial resolution from 2.5 m × 2.5 m to 10 m × 10 m [16,17]. For Landsat images, the window size was set to be 9 × 9 pixels. The co-occurrence shift was set to be (1, 1), and greyscale quantization levels were set to 64 by default after calculating the texture features of every band and combining them with the original bands.

3.1.3. Classification of Mangrove Habitats and Other Land Cover Types

For the series of Landsat data and high-resolution data, seven land cover types were set as classification categories in this study: (1) mangrove habitat; (2) other vegetation; (3) water body; (4) bare land; (5) impervious surface; (6) mudflat; and (7) shadow and mask (Table 1). These seven land cover types constitute the bulk of the land cover composition in this study area. For the series of SPOT data, five land cover types were set as classification categories: (1) mangrove habitat; (2) other vegetation; (3) water body; (4) bare soil and mudflat; and (5) impervious surface. Samples were systematically and precisely selected for the land cover types based on the historical aerial photo in ‘Hong Kong Map Service 2.0’ of Hong Kong Lands Department (https://www.hkmapservice.gov.hk/OneStopSystem/home, accessed from October 2019 to January 2022), high spatial resolution satellite images in Google Earth platform, literature data as well as fieldwork data. The numbers of pixel and polygon of selected samples for Landsat data and SPOT data are displayed in Table 2, with the number of pixels being the sum across all the polygons for each class. These samples for each land cover type were randomly divided into 80% training samples and 20% as testing samples.
The Random Forest (RF) algorithm was applied to conduct the classification. Random Forest is a widely used algorithm in remote sensing with high efficiency, especially when dealing with large-sized, medium- and high-resolution images [18,19,20]. An important advantage of using RF in high-scale image classification is that it can handle situations where the training dataset is small while the predicted data set is large [16,21]. The Random Forest algorithm classifies a dataset by integrating votes from a multitude of decision trees, which are constructed by fitting random subsets of training samples and features [22]. For Landsat data, spectral and texture features input in the RF classifier and texture features were calculated based on the original bands and spectral bands. For SPOT data and high-resolution data, texture features were calculated based on the original bands and input in the RF classifier (see Section 3.1.2). The parameter for the number of trees was set as 200 after testing and comparing classification accuracy as well as time took under different tree numbers from 100 to 1000. The parameter for the number of features was set as the square root, and the impurity function was set as the Gini coefficient.
For all the images, the classification process after preprocessing was conducted by the following main steps. First, extracted spectral and texture features were added to the original image bands through layer stacking. Second, the false-color composites combined with the Red band, Near Infrared band and Green band of the images of each sensor were used to assist the selection of samples (displayed in Table 1 and Table 2, using Landsat data and SPOT data as examples). Third, samples for each land cover type were selected using the Region of Interest (ROI) tools in ENVI 5.3 software and were then randomly divided into 20% and 80%. Fourth, 80% of the samples were used to train the Random Forest classifier to run the classification, and 20% of them were used as testing samples to test the accuracy of classification results, which is discussed in Section 3.1.4.

3.1.4. Accuracy Assessment

Reference data (Table 3) were collected via historical aerial photos available from ‘Hong Kong Map Service 2.0’ of Hong Kong Lands Department, field surveys data from Agriculture, Fisheries and Conservation Department (AFCD), Hong Kong Government (from 2004 to 2007), field validation data in 2013, 2015 and 2016, and Google Earth high spatial resolution images as well as other literature data [14]. Field data were collected with the support of the Real Time Kinematic Global Positioning System (RTKGPS), which has an accuracy of <1 m, recording the upper-canopy species in each survey point. The field data offered by AFCD recorded dominant mangrove species in each survey point. In addition, historical aerial photos, high-resolution satellite images, and Google Earth high-resolution images were taken as reference data to assist in judging the land cover types. Since this is a multi-temporal study of the long-term land cover changes with a post-classification analysis strategy, it was difficult to collect multi-temporal field validation datasets. Therefore, the multi-temporal high-resolution historical aerial photos and satellite images from Google Earth, to which we applied visual interpretation, supplemented the field validation data. Finally, testing samples were used as the 20% of sample sets selected based on all the reference data. The accuracy was then assessed by the producer’s accuracy, the user’s accuracy, and the overall accuracy with the Kappa coefficients based on the confusion matrix. In addition, five-fold cross-validation was conducted to test the modal accuracy. The evaluation of this study was through a model-based assessment of the classifier only and the actual overall and class-specific map accuracies for each time step have not been evaluated.

3.2. Post-Classification Analysis

Change Detection Analysis on Mangrove Habitats and Other Land Cover Types

Change detection statistics were calculated every three to six years for each series of satellite data set. For Landsat images, change detection statistics were calculated for 1987–1993, 1993–1999, 1999–2004, 2004–2009, 2009–2013, 2013–2017, and 2017–2020. For SPOT images, change detection statistics were calculated for 1991–1997, 1997–2002, 2002–2008, and 2008–2011. For high spatial resolution images, change detection was conducted from 2003–2008, 2008–2013, and 2013–2017.

4. Results

4.1. Accuracy Assessment

The results of the model-based accuracy assessment, including producer’s accuracy, user’s accuracy of each land cover type as well as overall accuracy and Kappa coefficient of the classification results of each selected year and the results of five-fold cross validation are displayed in Table 4 and Table 5. The producer’s accuracy and user’s accuracy of each land cover type are generally >90% for all the selected years. The overall accuracy is typically >99%, and the Kappa coefficient reached 0.99 for all the study years.

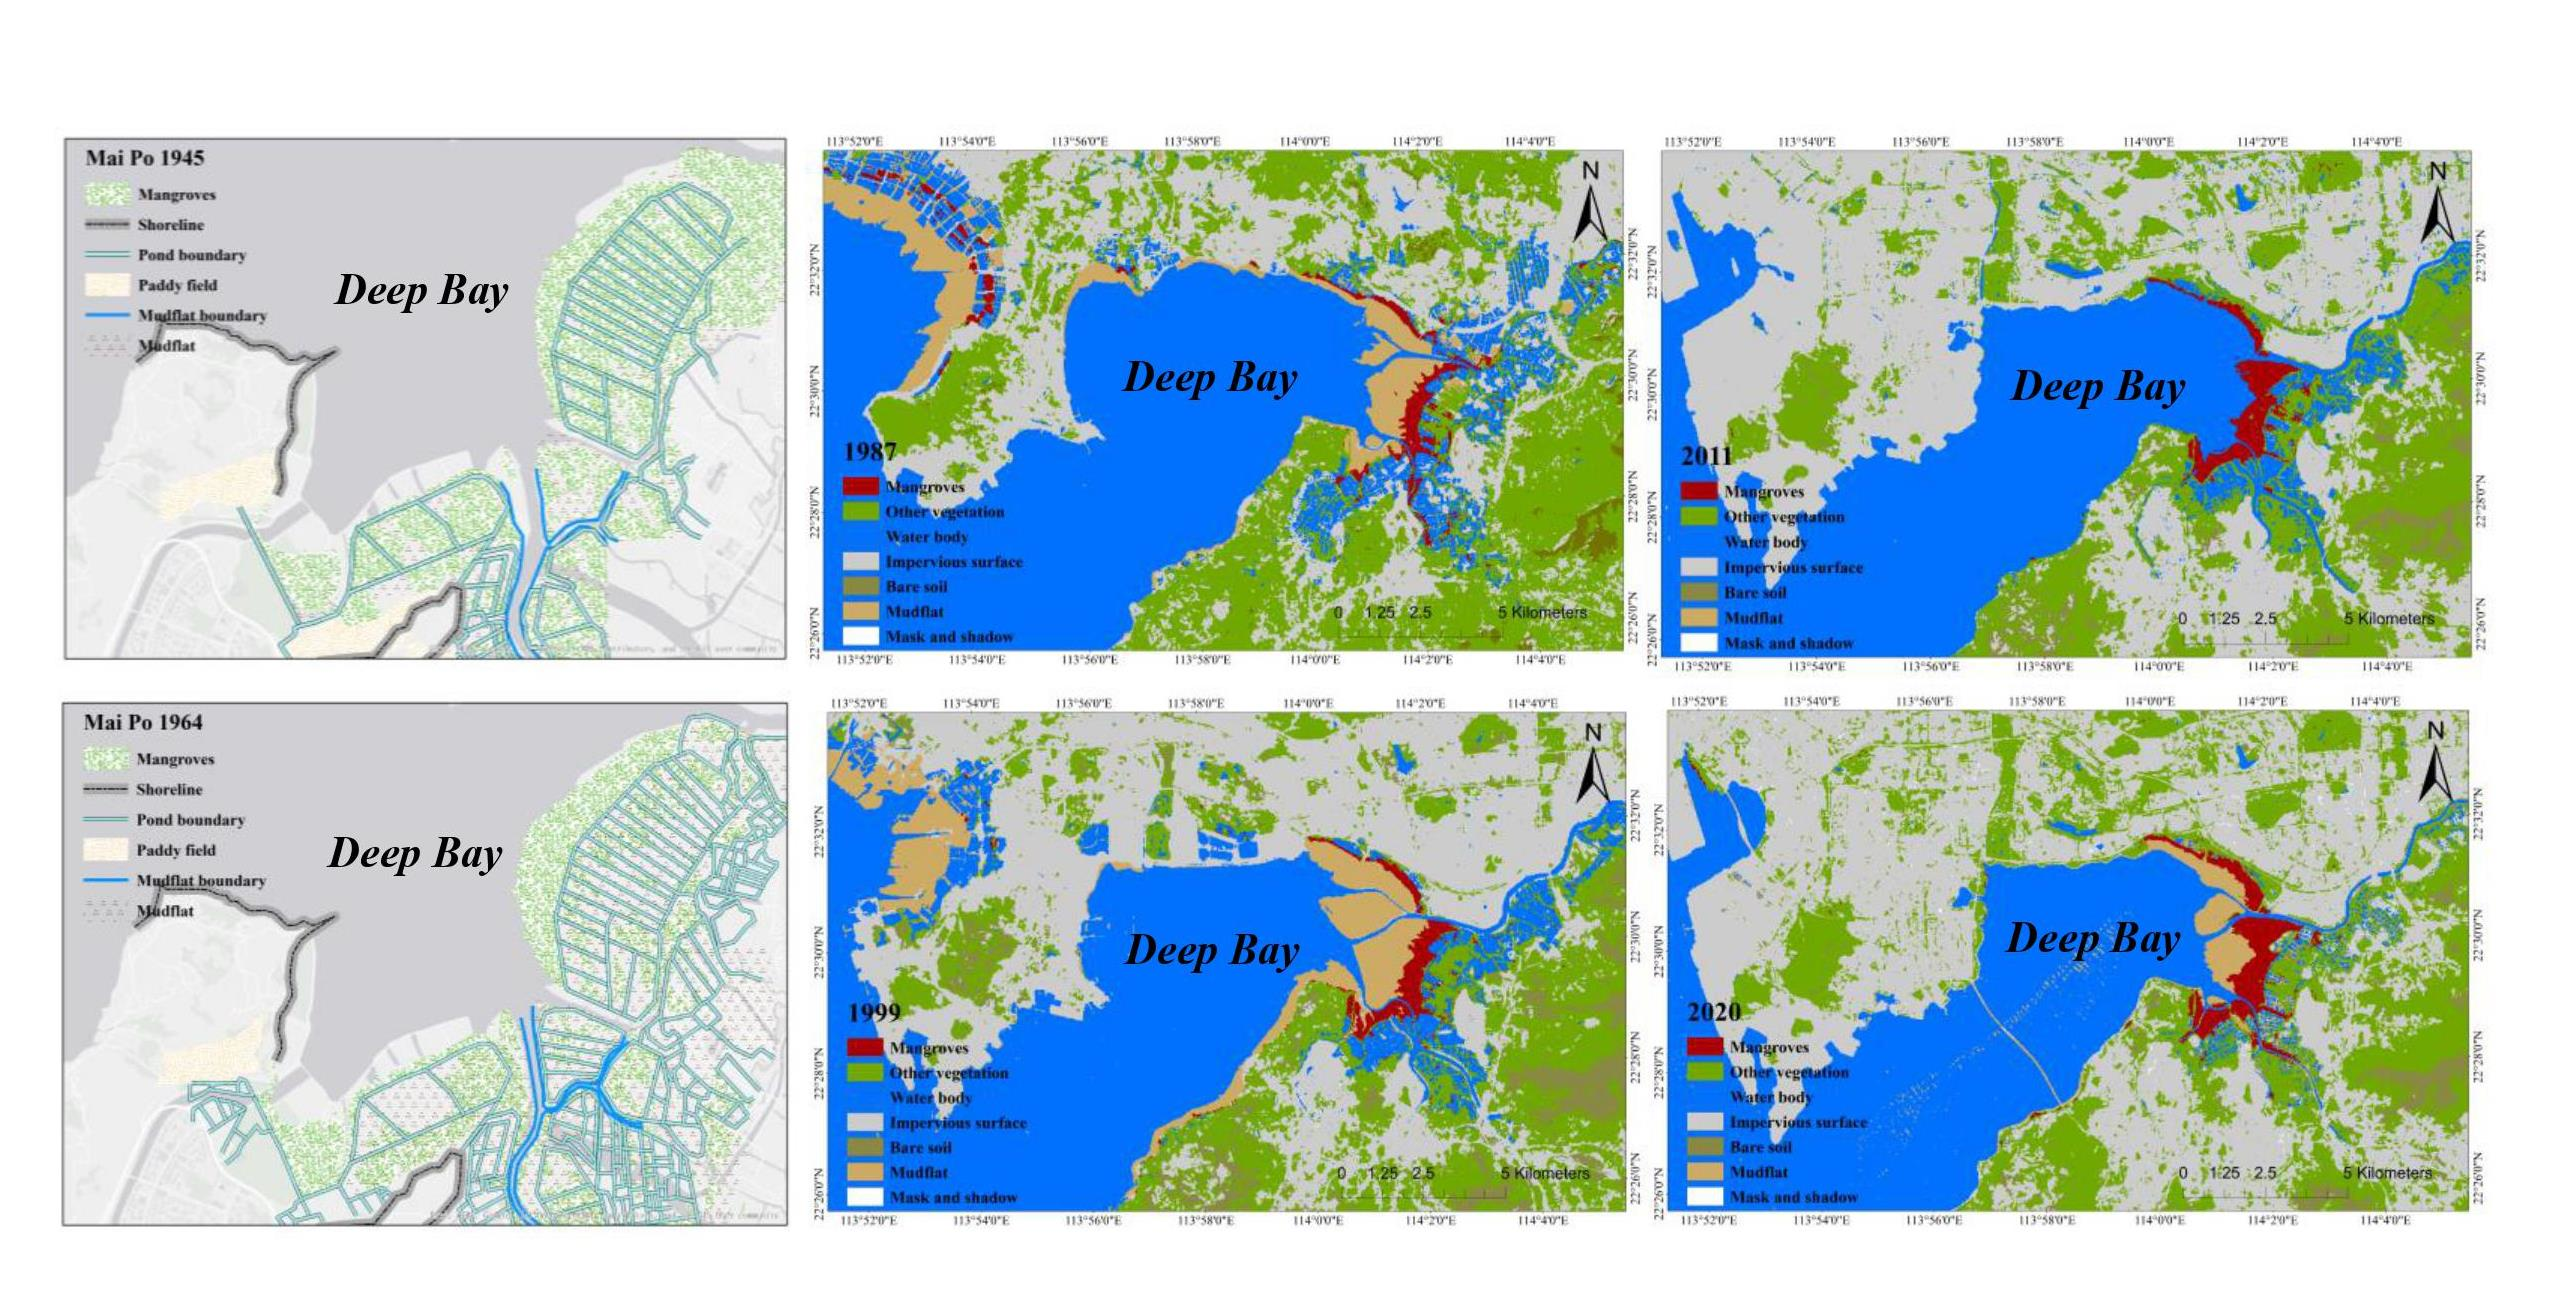
4.2. Mangrove Habitats and Other Land Cover Types Classification Results

Figure 4 shows the land cover mapping results based on historical aerial photos from 1924 to 1964. In 1924, there were already some fishponds built near Nam Sang Wai and along the Shan Pui River. Large areas of mudflats were distributed around the Shan Pui River. Only a few mangroves were distributed inside the fishponds where data were available. By 1945, mangroves were largely distributed in the coastal area, including locations that used to be mudflats in 1924. The establishment of fishponds in mangrove habitats at Mai Po had already occurred by 1945. By 1954, the establishment of fishponds continued. Mangroves expanded and fully covered the gei wai area. By 1964, large areas of mangroves in the gei wai had changed into open mudflats, and mangrove losses can also be observed in other fishponds at Mai Po. In the tidal areas seaward to the fishponds, some expansion of mangroves can be observed on the mudflats in the seaward direction.
Land cover classification results from 1987 to 2020 are displayed in Figure 5. Mangrove habitats in Deep Bay kept expanding toward the sea both on the Hong Kong and Shenzhen sides during this period. In some parts of gei wai and Futian, mangrove habitats can be observed to have disappeared over time. By 1987, there was a large area of mangrove habitats on the west shore of Shekou (arrow), but this habitat gradually decreased, then was not present in 2004 due to the land reclamation project in Shenzhen. Other vegetation areas can be observed to gradually decrease and disperse in the study area from 1987 to 2020. The area of the water body also gradually decreased both for the coastal sea area and landward fishponds during the study period. Conversely, the impervious surface greatly expanded both along the coastal area toward the sea and in the inland area in the same period. The areas of mudflat changed sharply in some years due to the different tide levels when each image was captured.

4.3. Interrelationship between Mangrove Habitat and Urban Area Change

The temporal areal changes of mangrove habitats in Deep Bay, including both the Hong Kong and Shenzhen sides, are displayed in Figure 6a. In the whole Deep Bay area, there is an overall increasing trend for mangrove forests from around 300 ha to around 500 ha between 1987 and 2020. When looking at Deep Bay from the Hong Kong and Shenzhen sides separately, the rate of mangrove increase in Hong Kong was higher than that of Shenzhen. In Hong Kong, mangrove habitats increased from around 250 ha to around 400 ha, with a net increase of about 150 ha and a rate of increase of about 4.5 ha per year. In Shenzhen, mangrove habitats decreased from about 90 ha to 50 ha from 1987 in 1991 and then gradually increased to about 110 ha in 2020, with a net increase of about 60 ha and an increasing rate of about 2 ha per year.
The temporal changes in the area of impervious surfaces in Deep Bay, on both the Hong Kong and Shenzhen sides, are displayed in Figure 6b. In the whole Deep Bay area, there is an overall increasing trend from around 13,000 ha to around 18,000 ha from 1987 to 2020, with a net increase of about 5000 ha (38.5%) and an increasing rate of 150 ha (1.15%) per year. On the Hong Kong side, the area of impervious surfaces increased from about 5000 ha to about 7000 ha (a 40% increase). Impervious surfaces in Hong Kong experienced a sharp increase especially from 2006 to 2015. For the Shenzhen side, the area of impervious surfaces increased from about 8000 ha to about 11,000 ha (37.5% increase). The period of a sharp increase in Shenzhen happened between 1987 and 1993.
The temporal area changes of water and mudflat coverage in Deep Bay, both on the Hong Kong and Shenzhen sides, are displayed in Figure 6c. In the whole Deep Bay area, there is an overall decreasing trend of water and mudflat areas from about 14,000 ha to about 10,000 ha (28.6% decrease) from 1987 to 2020, with a net decrease of about 4000 ha and a rate of decrease at about 120 ha (0.9%) per year. The rate of decrease of water and mudflat areas in Shenzhen is higher than that in Hong Kong. In Hong Kong, water and mudflat coverage decreased from about 7000 ha to about 6000 ha, with a net decrease of about 1000 ha and a rate of decrease at about 30 ha per year. In Shenzhen, water and mudflat areas decreased from about 7000 ha to about 4000 ha, with a net decrease of about 3000 ha and a rate of decrease at about 90 ha per year.

4.4. Land Cover Change Process: Natural and Anthropogenic Drivers

Mangrove habitat coverage grew significantly along the original coastline and river drainages in 1987 landward compared to the coastline today (Figure 7a–c). In Mai Po and Futian, mangrove habitats were distributed along the coastline, Shan Pui River, and Shenzhen River, as well as in some landward areas like gei wai. In Shenzhen, mangrove habitats were also largely distributed along the old coastline of the west shore of Shekou. From 1987 to 1999, the mangrove forest in Deep Bay expanded seaward, especially near Nam Sang Wai, where large areas of mangrove growth occurred. From 1999 to 2006, mangrove expansion was evident near the estuary of Shenzhen River. From 2006 to 2020, mangrove habitats continued to expand seaward in Deep Bay, and some landward expansion in Mai Po can also be observed. Overall, mudflat areas contributed most to the increase of mangrove habitat areas, especially from 1987 to 1993, from 1993 to 1999, from 1999 to 2004, from 2004 to 2009, with about 60 ha, 80 ha, 70 ha, and 50 ha of mudflat areas changed into mangrove habitats, respectively (Figure 7d). From 2009 to 2013, 2013 to 2017, and 2017 to 2020, mudflat and water coverage together also contributed an increase of about 20 ha of mangrove habitats. Other vegetated areas also contributed to increases of about 20 ha and 60 ha of mangroves from 1993 to 1999 and from 2017 to 2020, respectively, while mangrove habitats changed into other vegetation areas in other periods. Increase in impervious surfaces and water coverage also resulted in some decrease in mangrove habitats from 1987 to 1993, from 1993 to 1999, and from 2017 to 2020.
From 1987 to 1999, a large expansion of impervious surfaces can be observed in Deep Bay, especially in Shenzhen city (Figure 8a–c). Along the coastline in Shenzhen, a large increase of impervious surfaces occurred on the seafront due to the land reclamation project. Significant expansion of impervious surfaces occurred on both the west and east shores of Shekou as well as in the coastal area on the Shenzhen side of Deep Bay. In the inland area, impervious surfaces also expanded both in Shenzhen and Hong Kong from 1987 to 1999. From 1999 to 2006, a large expansion of impervious surfaces continued along the west and east shores of Shekou in Shenzhen due to reclamation. From 2006 to 2020, some expansion of impervious surfaces can be observed continually on the west shore of Shekou in Shenzhen and in the inland area of Hong Kong. From 1987 to 1993, 2009 to 2013, and 2017 to 2020, water coverage largely contributed to the increase of impervious surfaces for about 160 ha, 40 ha and 30 ha, respectively, due to the land reclamation project along the coastline (Figure 8d). Mudflat and other vegetation areas also contributed to the expansion of impervious surfaces in other periods. From 1993 to 1999, 1999 to 2004, 2004 to 2009 and 2013 to 2017, about 20 ha, 90 ha, 30 ha, and 40 ha of impervious surfaces changed into other vegetation areas, respectively.
In 1987, water coverage can be observed much more landward than at present, especially on the west and east shores of Shekou and along the Shenzhen side of Deep Bay (Figure 9a–c). Fishponds were widely distributed along the west shore of Shekou and the north estuary of Shenzhen River, as well as in Mai Po. In 1999 and 2006, the water coverage area in Shenzhen retreated towards the sea due to the land reclamation project. In 2020, water coverage area expanded because of the relatively higher tide level, while the coastline still expanded largely seaward compared to 1987. Fishponds along the coastal area in Shenzhen had largely disappeared by 2020. On the Hong Kong side, fishponds were still present along Shenzhen and Shan Pui Rivers as well as in the gei wai in 2020, albeit reduced to much smaller areas compared to the past. Water coverage decreased greatly and changed largely into impervious surfaces and other vegetation areas in most of the periods, especially from 1987 to 1993, from 1999 to 2004, from 2004 to 2009, from 2009 to 2013, from 2013 to 2017 and from 2017 to 2020, with losses of about 120 ha, 100 ha, 70 ha, 50 ha, 40 ha and 80 ha, respectively (Figure 9d). From 1993 to 1999, about 20 ha of mangrove habitats and other vegetation areas changed into water coverage areas. In addition, from 2009 to 2013, about 30 ha of other vegetation areas changed into water-covered areas.

5. Discussion

We used a combination of historical aerial photographs and recent remote sensing satellite imagery to document and analyze land cover changes in an embayment that has undergone dramatic changes over the last 100 years. This study on a microcosm of intense coastal urbanization illustrates how the construction of a coastal megacity and associated anthropogenic activities have driven changes in wetland habitats and how the other different land cover types have changed during the last century in Deep Bay GBA. Mangrove habitat decreased and transformed to fishponds in Mai Po from 1954 to 1964, and through conversion to impervious surfaces, fishponds, water coverage and other vegetation areas on the landward side in Deep Bay from 1987 to 2020, despite a continued expansion happened on the seaward side in the same period. The major decrease was observed due to the expansion of aquaculture and urban areas on both the Shenzhen and Hong Kong sides, with a major driver being the reclamation project in Shenzhen, which was completed around 2003/4. This finding matches the results of recent studies that large-scale mangrove habitat loss happened through conversion to fishponds and impervious surfaces during the 1990s, and the coastline length of GBA gradually increased from the 1980s to 2017 due to reclamation [23,24].
The performance of our analysis may be reflected by recent studies that used a similar approach. Previous studies such as Liu et al. (2018) [25] used time-series satellite imagery to determine the zonation and directional dynamics of mangroves in Mai Po in the past three decades. Liu et al. (2018) [25] found that mangrove coverage increased from around 150 ha to more than 350 ha from 1991 to 2015. The same study successfully identified the distribution change of four different mangrove species by using historical satellite imagery. A more recent study [24] estimated the mangrove area changes at GBA during 1990–2018 using remote sensing imagery. They also found two contrasting periods, in which mangrove areas decreased during 1990–2000 but increased rapidly during 2000–2018. The increase is mainly due to the restoration and protection effort and the introduction of exotic mangrove species, as well as changes in the hydrographic environment in inner Deep Bay.
Despite the mangrove loss in some parts of Deep Bay due to urbanization and anthropogenic activities, there was an overall increasing trend for mangrove areas on both the Hong Kong and Shenzhen sides from 1987 to 2020. Mudflat areas contributed most to the increase of mangrove area, and seaward expansion of mangroves was also observed in both Hong Kong and Shenzhen, especially within the nature reserves, corroborating with recent studies in the same area [25]. This gradual increase in the mangrove area is probably due to the protection strategies in both the Mai Po reserve in Hong Kong and Futian reserve in Shenzhen [14]. The expansion occurred through the gradual filling of the gaps among previously isolated patches, resulting in increased connectivity and decreased fragmentation. This finding is in accordance with recent studies showing that mangrove area has been increasingly protected, and mangrove areas gradually have increased in Guangdong Province within the nature reserves [23,24,25,26].
The rapid expansion of mangroves concomitant with the construction of the megacity of Shenzhen was also facilitated by the unexpected effect of reclamation for Shenzhen, which caused significant loss of mangroves on the northern shores of inner Deep Bay. The dramatic increase in mangrove area in southern Deep Bay more than compensated for this direct loss due to the reclamation. The increase in mangrove area on the southern shores may be attributed to the changed sedimentation and water circulation patterns associated with the reclamation of Shenzhen. Yang and Chui (2021) [27] demonstrated through simulations that reclamation in the northern shores of Deep Bay for the construction of Shenzhen significantly altered the hydrodynamics of Deep Bay, influencing flushing and thus sediment load. The current velocity in Deep Bay from flushing by the Pearl River discharge was significantly changed as a result of the Shenzhen reclamation, which reduced the width of the entry into Deep Bay by 30% [28]. The rapid rise in mangrove forest areas particularly on the southern shores of Deep Bay, may reflect this increased sedimentation alongside the increase in impervious urban areas in Shenzhen. With stringent protection in place in the Mai Po Nature Reserve and the Futian Reserve, the expansion of mangroves occurred rapidly once sedimentation breached the threshold for mangrove colonization. Contemporaneously, the area of mudflats decreased significantly, as the need to maintain navigable channels and water bodies effectively limited the lower tidal extent of the mudflat areas.
The increase in mangrove area in Deep Bay goes against the general decreasing trend of mangroves in the tropics, particularly in Asia, where the combined impact of urban development, agriculture and aquaculture has historically inflicted significant losses [29]. Although such direct habitat loss has largely been decelerating in tropical Asia [6], actual expansion of mature forests is still relatively rare in the region. Attempts to increase mangrove area through large-scale planting have generally been cost-ineffective [30]. Even when planting is successful, establishing mangroves is expected to deliver the full suite of ecosystem services, e.g., carbon storage and support for biodiversity, only after a long period of ecosystem development. Studying the rate of carbon and nitrogen accumulation with forest age in the managed Matang forest in Malaysia, Adame et al. reported that it takes >15 years to achieve near steady-state ecosystem carbon and nitrogen stocks [31]. Given also the extra effort required for restoration through planting, our study indicates that the benefits of increased mangrove area are best achieved through natural expansion of the forest, and this may even be achievable in the setting of rapid urban development if suitable protection is available.
Although sound protection strategy has promoted a gradual increase of mangrove habitats in the GBA region, exotic species Sonneratia caseolaris, Sonneratia apetala, and Laguncularia racemosa, were introduced for restoration, which may also cause potential damage to the function and services of the native mangrove species in GBA [29]. The expansion of exotic mangrove species has resulted in a widespread apparent increase in forest area but a latent loss of functionality and ecosystem quality [25,32].
Our study also illustrates the balance in land cover that is critical to achieving multiple objectives for tropical estuarine wetlands. The intertidal region is of limited spatial extent and shifts in land cover imply growth of some and loss of others. The pattern in Deep Bay over the past 100 years has demonstrated progressive but sometimes abrupt shifts from natural wetlands (particularly mangroves and tidal flats) to urban and modified wetlands (tidal/fishponds). The balance of the mangroves and tidal flats also has changed in response to the prevailing hydrographic and sedimentary conditions, often triggered by external land use changes, e.g., developments in the Pearl River catchment.
These shifts alter the capacity of the series of wetlands for various ecosystem services. For example, the overall shifts in the extent and diversity of the land cover types in Deep Bay, i.e., the increase in impervious urban area and mangrove forests but a decrease in tidal mudflat extent, have significant potential implications for the capacity of this shallow embayment for supporting migratory birds. Periodic monitoring of the mudflat fauna during the period 1996 to 2014 suggested significant shifts in the balance of surface and in-sediment species occurred around 2005 when the reclamation work at Shenzhen was completed [33]. As mudflat animals are the main food sources for migratory waterbirds, this change has profound implications for the capacity of the wetlands to support the migratory bird populations. Notwithstanding, the increase in mangrove cover at the expense of tidal flats would result in an increased capacity for carbon storage, which could be beneficially used as a mitigation for the carbon emissions from the nearby urban development. Such balances will increasingly be commonplace in the management of wetlands on peri-urban coasts.

6. Conclusions

In this study, the change in wetland habitats and coastal land cover in GBA, the world’s largest megalopolis and a rapidly urbanizing area in the Pearl River estuary, was traced back to the earliest image data available (~100 years). The changes were mapped and quantified from 1924 to 2020. Mangrove habitats showed an overall increasing trend in Deep Bay, except from 1954 to 1964 when there was a large area decrease due to the construction of tidal aquaculture ponds in Mai Po and mangrove areas converted to impervious surfaces, fishponds, water coverage and other vegetation areas mainly on the northern shores to form Shenzhen megacity (13 million) from 1987 to 2020. Change in circulation and sedimentation pattern after the reclamation resulted in mudflat areas contributing most to the expansion of mangrove habitats of about 275 ha from 1987 to 2020, which indicates most of the mangrove expansion happened in the seaward mudflat area. Reclamation and urbanization for the construction of the megacity of Shenzhen also turned large areas of water and mudflat (about 4000 ha) on the northern shore into the impervious surface and urban vegetation, which caused part of mangrove loss. Overall, the landscape pattern of expanding mangrove habitats in Deep Bay showed increasing connectivity and decreasing degree of fragmentation from 1987 to 2020, which is a result of habitat expansion from effective protection of mangrove habitats. This expansion, however, also resulted in a significant decrease in the tidal mudflat area, the prime feeding ground for wintering migratory birds for which the wetlands are managed. This continual and rapid shift of land cover composition is fundamentally through changes in current flow and sedimentation driven by reclamation for urbanization.

Supplementary Materials

The following supporting information can be downloaded at: https://www.mdpi.com/article/10.3390/rs14205163/s1, Table S1. General information on Landsat images employed in this study, Table S2. General information on SPOT images employed in this study, Table S3. General information on very high-resolution images, including QuickBird, GeoEye, as well as WorldView, employed in this study, Table S4. General information on historical aerial photos employed in this study.

Author Contributions

Conceptualization, S.-Y.L.; Methodology, M.L. and S.-Y.L.; Analysis, M.L.; Writing, M.L.; Review and Editing, M.L., S.-Y.L. and F.L.; Funding Acquisition, S.-Y.L. All authors have read and agreed to the published version of the manuscript.

Funding

This research was funded by the Chinese University of Hong Kong—University of Exeter Joint Centre for Environmental Sustainability & Resilience (ENSURE) fund.

Data Availability Statement

Data reported in this study are available on request to the corresponding author.

Conflicts of Interest

The authors declare no conflict of interest.

References

  1. Alongi, D.M. Present state and future of the world’s mangrove forests. Environ. Conserv. 2002, 29, 331–349. [Google Scholar] [CrossRef] [Green Version]
  2. Duke, N.C.; Ball, M.C.; Ellison, J.C. Factors influencing biodiversity and distributional gradients in mangroves. Glob. Ecol. Biogeogr. Lett. 1998, 7, 27–47. [Google Scholar] [CrossRef] [Green Version]
  3. Kathiresan, K.; Bingham, B.L. Biology of mangroves and mangrove ecosystems. Adv. Mar. Biol. 2001, 40, 81–251. [Google Scholar]
  4. Lee, S.Y.; Primavera, J.H.; Dahdouh-Guebas, F.; McKee, K.; Bosire, J.O.; Cannicci, S.; Diele, K.; Fromard, F.; Koedam, N.; Marchand, C.; et al. Ecological role and services of tropical mangrove ecosystems: A reassessment. Glob. Ecol. Biogeogr. 2014, 23, 726–743. [Google Scholar] [CrossRef]
  5. Duke, N.C.; Meynecke, J.O.; Dittmann, S.; Ellison, A.M.; Anger, K.; Berger, U.; Cannicci, S.; Diele, K.; Ewel, K.C.; Field, C.D.; et al. A world without mangroves? Science 2007, 317, 41–42. [Google Scholar] [CrossRef] [Green Version]
  6. Richards, D.R.; Friess, D.A. Rates and drivers of mangrove deforestation in Southeast Asia, 2000–2012. Proc. Natl. Acad. Sci. USA 2016, 113, 344–349. [Google Scholar] [CrossRef] [Green Version]
  7. Donato, D.C.; Kauffman, J.B.; Murdiyarso, D.; Kurnianto, S.; Stidham, M.; Kanninen, M. Mangroves among the most carbon-rich forests in the tropics. Nat. Geosci. 2011, 4, 293–297. [Google Scholar] [CrossRef]
  8. Dahdouh-Guebas, F.; Verheyden, A.; De Genst, W.; Hettiarachchi, S.; Koedam, N. Four decade vegetation dynamics in Sri Lankan mangroves as detected from sequential aerial photography: A case study in Galle. Bull. Mar. Sci. 2000, 67, 741–759. [Google Scholar]
  9. Lee, S.Y.; Khim, J.S. Hard science is essential to restoring soft-sediment intertidal habitats in burgeoning East Asia. Chemosphere 2017, 168, 765–776. [Google Scholar] [CrossRef]
  10. Massad, R.S.; Lathière, J.; Strada, S.; Perrin, M.; Personne, E.; Stéfanon, M.; Stella, P.; Szopa, S.; Noblet-Ducoudré, N.D. Reviews and syntheses: Influences of landscape structure and land uses on local to regional climate and air quality. Biogeosciences 2019, 16, 2369–2408. [Google Scholar] [CrossRef] [Green Version]
  11. Li, M.S.; Lee, S.Y. Carbon dynamics of Deep Bay, eastern Pearl River Estuary, China. I: A mass balance budget and implications for shorebird conservation. Mar. Ecol. Prog. Ser. 1998, 172, 73–87. [Google Scholar] [CrossRef] [Green Version]
  12. Hui, E.C.; Li, X.; Chen, T.; Lang, W. Deciphering the spatial structure of China’s megacity region: A new bay area—The Guangdong-Hong Kong-Macao Greater Bay Area in the making. Cities 2020, 105, 102168. [Google Scholar] [CrossRef]
  13. Tam, N.F.; Wong, Y.S.; Lu, C.Y.; Berry, R. Mapping and characterization of mangrove plant communities in Hong Kong. In Asia-Pacific Conference on Science and Management of Coastal Environment; Springer: Dordrecht, The Netherlands, 1997; pp. 25–37. [Google Scholar]
  14. Jia, M.; Liu, M.; Wang, Z.; Mao, D.; Ren, C.; Cui, H. Evaluating the effectiveness of conservation on mangroves: A remote sensing-based comparison for two adjacent protected areas in Shenzhen and Hong Kong, China. Remote Sens. 2016, 8, 627. [Google Scholar] [CrossRef] [Green Version]
  15. Haralick, R.M.; Shanmugam, K.; Dinstein, I.H. Textural features for image classification. IEEE Trans. Syst. Man Cybern. 1973, 6, 610–621. [Google Scholar] [CrossRef] [Green Version]
  16. Zhang, Y.; Zhang, H.; Lin, H. Improving the impervious surface estimation with combined use of optical and SAR remote sensing images. Remote Sens. Environ. 2014, 141, 155–167. [Google Scholar] [CrossRef]
  17. Puissant, A.; Hirsch, J.; Weber, C. The utility of texture analysis to improve per-pixel classification for high to very high spatial resolution imagery. Int. J. Remote Sens. 2005, 26, 733–745. [Google Scholar] [CrossRef]
  18. Gislason, P.O.; Benediktsson, J.A.; Sveinsson, J.R. Random forests for land cover classification. Pattern Recognit. Lett. 2006, 27, 294–300. [Google Scholar] [CrossRef]
  19. Guo, L.; Chehata, N.; Mallet, C.; Boukir, S. Relevance of airborne lidar and multispectral image data for urban scene classification using Random Forests. ISPRS J. Photogramm. Remote Sens. 2011, 66, 56–66. [Google Scholar] [CrossRef]
  20. Ham, J.; Chen, Y.; Crawford, M.M.; Ghosh, J. Investigation of the random forest framework for classification of hyperspectral data. IEEE Trans. Geosci. Remote Sens. 2005, 43, 492–501. [Google Scholar] [CrossRef] [Green Version]
  21. Cutler, D.R.; Edwards Jr, T.C.; Beard, K.H.; Cutler, A.; Hess, K.T.; Gibson, J.; Lawler, J.J. Random forests for classification in ecology. Ecology 2007, 88, 2783–2792. [Google Scholar] [CrossRef]
  22. Hu, L.; Li, W.; Xu, B. Monitoring mangrove forest change in China from 1990 to 2015 using Landsat-derived spectral-temporal variability metrics. Int. J. Appl. Earth Obs. Geoinf. 2018, 73, 88–98. [Google Scholar] [CrossRef]
  23. Ai, B.; Zhang, R.; Zhang, H.; Ma, C.; Gu, F. Dynamic process and artificial mechanism of coastline change in the Pearl River Estuary. Reg. Stud. Mar. Sci. 2019, 30, 100715. [Google Scholar] [CrossRef]
  24. Wang, H.; Peng, Y.; Wang, C.; Wen, Q.; Xu, J.; Hu, Z.; Jia, X.; Zhao, X.; Lian, W.; Temmerman, S.; et al. Mangrove loss and gain in a densely populated urban estuary: Lessons from the Guangdong-Hong Kong-Macao Greater Bay Area. Front. Mar. Sci. 2021, 8, 693450. [Google Scholar] [CrossRef]
  25. Liu, M.; Zhang, H.; Lin, G.; Lin, H.; Tang, D. Zonation and directional dynamics of mangrove forests derived from time-series satellite imagery in Mai Po, Hong Kong. Sustainability 2018, 10, 1913. [Google Scholar] [CrossRef] [Green Version]
  26. Wang, W.; Fu, H.; Lee, S.Y.; Fan, H.; Wang, M. Can strict protection stop the decline of mangrove ecosystems in China? From rapid destruction to rampant degradation. Forests 2020, 11, 55. [Google Scholar] [CrossRef] [Green Version]
  27. Yang, Y.; Chui, T.F.M. The role of the Pearl River flow in Deep Bay hydrodynamics and potential impacts of flow variation and land reclamation. J. Hydro-Environ. Res. 2021, 34, 1–10. [Google Scholar] [CrossRef]
  28. Yang, Y.; Chui, T.F.M. Hydrodynamic and transport responses to land reclamation in different areas of semi-enclosed subtropical bay. Cont. Shelf Res. 2017, 143, 54–66. [Google Scholar] [CrossRef]
  29. FAO. The World’s Mangroves 1980–2005; FAO Forestry Paper 153; Food and Agriculture Organization, United Nations: Rome, Italy, 2007. [Google Scholar]
  30. Lee, S.Y.; Hamilton, S.; Barbier, E.B.; Primavera, J.; Lewis, R.R. Better restoration policies are needed to conserve mangrove ecosystems. Nat. Ecol. Evol. 2019, 3, 870–872. [Google Scholar] [CrossRef]
  31. Adame, M.F.; Zakaria, R.M.; Fry, B.; Chong, V.C.; Then, A.H.A.; Brown, C.J.; Lee, S.Y. Loss and recovery of carbon and nitrogen after mangrove clearing. Ocean Coast. Manag. 2018, 161, 117–126. [Google Scholar] [CrossRef]
  32. He, Z.; Peng, Y.; Guan, D.; Hu, Z.; Chen, Y.; Lee, S.Y. Appearance can be deceptive: Shrubby native mangrove species contributes more to soil carbon sequestration than fast-growing exotic species. Plant Soil 2018, 432, 425–436. [Google Scholar] [CrossRef]
  33. Cai, L.Z. Zoobenthic Ecology in Shenzhen Bay; Xiamen University Press: Xiamen, China, 2015. [Google Scholar]
Figure 1. A map of the study area illustrating the local environment of Deep Bay and its position as part of the Greater Bay Area (GBA), supporting a population of 70 million. The lower diagram indicates the area analyzed in this study. This map was made on Universal Transverse Mercator (UTM) projection and World Geodetic System-84 (WGS-84) datum.
Remotesensing 14 05163 g001
Figure 2. Aerial photo no. 1964-2793R taken on 14 December 1964, by Hong Kong Lands Department, showing the Mai Po Nature Reserve (area enclosed by white line) and the various wetland habitats: Mangroves (M), mudflat (MF) and gei wai (GW).
Remotesensing 14 05163 g002
Figure 3. The methodology framework of this study. Multi-source optical data from 1970 to 2020 and historical aerial photos from 1924 to 2020 were separately processed for mapping. Spatial analysis and time-series analysis were conducted based on the mapping results.
Remotesensing 14 05163 g003
Figure 4. Mapping results are based on historical aerial photos from 1924 to 1964. The scales are: 1:14,332 (1924); 1:12,000 (1945); 1:25,029 (1954); and 1:25,029 (1964). Relevant locations are indicated: Deep Bay (DB), Mai Po (MP), Shan Pui River (SPR), Nam Sang Wai (NSW), and Shenzhen (SZ) in the top right panel for reference.
Remotesensing 14 05163 g004
Figure 5. Landsat image mapping results from 1987 to 2020.
Remotesensing 14 05163 g005aRemotesensing 14 05163 g005b
Figure 6. Areal changes of (a) mangrove habitats, (b) impervious surfaces, and (c) water and tidal mudflat in Deep Bay from 1987 to 2020.
Remotesensing 14 05163 g006
Figure 7. Mangrove habitats and other land cover types in Deep Bay between 1987 and 2020. (ac), Change detection maps; and (d) Change detection statistics of mangrove habitats and other land cover types.
Remotesensing 14 05163 g007aRemotesensing 14 05163 g007b
Figure 8. Impervious surfaces in Deep Bay from 1987 to 2020. (ac) Change detection maps; and (d) Change detection statistics of impervious surfaces and other land cover types.
Remotesensing 14 05163 g008aRemotesensing 14 05163 g008b
Figure 9. Water coverage in Deep Bay from 1987 to 2020. (ac) Change detection maps; and (d) Change detection statistics of water coverage and other land cover types.
Remotesensing 14 05163 g009aRemotesensing 14 05163 g009b
Table 1. Land cover classification categories for Landsat data.
Land Cover TypeSatellite Image
Mangrove habitatRemotesensing 14 05163 i001
Other vegetationRemotesensing 14 05163 i002
Water bodyRemotesensing 14 05163 i003
Bare landRemotesensing 14 05163 i004
Impervious surfaceRemotesensing 14 05163 i005
MudflatRemotesensing 14 05163 i006
Shadow and maskRemotesensing 14 05163 i007
Table 2. The numbers of polygon and pixel samples selected for training and testing classification rules for Landsat and SPOT data, presented as polygon/pixel.
YearMangrove HabitatOther VegetationWater BodyBare LandImpervious SurfaceMudflatShadow and Mask
198764/108262/88335/40910/15229/43417/1401/24
198875/1093101/118225/22618/24648/121254/11522/130
199155/64778/182932/80731/20165/49841/4472/46
199349/124650/107716/4728/9329/92618/1922/109
199565/76554/101023/37423/19555/85042/65514/136
199746/94949/172917/6316/5453/6651/66/344
200097/442270/533020/142510/14920/140810/6311/71
200274/96189/160726/70624/25658/105335/5564/48
2004123/409366/327532/110212/27419/139633/5225/219
200668/101359/103128/46220/15548/56336/5516/48
200884/386346/230216/7694/16815/162715/8174/79
2011149/639776/372920/81814/22323/166324/13811/107
201359/114728/128916/75118/28227/54412/4662/54
201566/1723101/164753/82713/6175/96722/4102/41
201756/102456/196722/79710/8938/6315/712/54
201956/177648/120521/55218/17358/85911/15512/80
202050/140759/166029/82714/16822/101218/4867/154
Table 3. Reference data sample selection in this study.
Date of Landsat DataSources of Reference Data
1987Aerial photos in 1987.
1988Aerial photos in 1988.
1991Aerial photos in 1991; SPOT1 HRV data in 1991; high-resolution satellite data in 1991 from Google Earth.
1993Aerial photos in 1993; SPOT1 HRV data in 1993.
1995Aerial photos in 1995.
1997Aerial photos in 1997; SPOT1 HRV data in 1997.
1999Aerial photos in 1999; SPOT4 HRIVR data in 2000; high resolution satellite data in 2000 from Google Earth.
2001Aerial photos in 2001; SPOT4 HRIVR data in 2000; high resolution satellite data in 2000 from Google Earth.
2002Aerial photos in 2002; SPOT4 HRIVR data in 2002; QuickBird-02 data in 2003; high resolution satellite data in 2002 from Google Earth.
2004Aerial photos in 2004; SPOT5 HRG data in 2004; QuickBird-02 data in 2003; high resolution satellite data in 2004 from Google Earth; AFCD data.
2006Aerial photos in 2006; AFCD data.
2009Aerial photos in 2009; SPOT5 HRG data in 2008; QuickBird-02 data in 2008; Worldview-02 data in 2010; high resolution satellite data in 2008 from Google Earth.
2011Aerial photos in 2011; SPOT5 HRG data in 2010; Worldview-02 in 2010; high resolution satellite data in 2011 from Google Earth.
2013Aerial photos in 2013; GE-01data in 2013; high resolution satellite data in 2013 from Google Earth; field validation data.
2015Aerial photos in 2015; Worldview-03 data in 2015; high resolution satellite data in 2015 from Google Earth; field validation data.
2017Aerial photos in 2017; Worldview-02 data in 2017; high resolution satellite data in 2017 from Google Earth; field validation data.
2019Aerial photos in 2019; high resolution satellite data in 2019 from Google Earth.
2020Aerial photos in 2020; high resolution satellite data in 2020 from Google Earth.
Table 4. Results of the model-based accuracy assessment (PA: producer’s accuracy; UA: user’s accuracy).
YearMangrove HabitatsOther VegetationWater BodyImpervious SurfaceBare SoilMudflatOverall AccuracyKappa Coefficient
PAUAPAUAPAUAPAUAPAUAPAUA
1987100%99.5%98.9%100%100%97.6%97.7%100%100%100%100%100%99.4%0.99
198899.1%100%100%99.2%100%100%100%100%100%100%100%100%99.8%0.99
199197.7%100%100%99.2%100%100%100%100%100%100%100%100%99.7%0.99
199399.6%100%100%99.5%100%98.9%99.5%100%100%100%100%100%99.7%0.99
199598.7%99.3%99.5%99.1%97.5%100%100%99.4%97.4%100%100%98.5%99.2%0.99
199797.9%100%100%98.9%100%100%100%100%100%100%100%100%99.5%0.99
199998.8%98.2%98.4%99.4%100%100%100%100%100%94.3%100%100%99.2%0.99
200198.8%100%100%99.7%100%100%100%99.5%98.0%100%100%98.8%99.7%0.99
2002100%98.5%99.4%99.7%100%100%100%100%100%100%99.1%100%99.7%0.99
200499.5%99.0%99.0%98.6%100%100%100%100%94.6%100%100%100%99.3%0.99
200698.5%99.5%99.5%98.6%100%98.9%99.1%100%100%100%100%100%99.3%0.99
200996.6%97.8%98.3%96.6%100%100%100%99.1%89.2%100%100%100%97.9%0.97
2011100%99.8%99.4%99.7%99.3%98.0%97.3%98.2%94.6%100%100%100%99.5%0.99
2013100%100%100%100%100%100%100%99.1%98.2%100%100%100%99.8%0.99
201598.5%100%99.7%98.6%100%100%100%99.1%83.3%100%100%98.8%99.3%0.99
201798.0%99.0%99.5%99.3%100%100%100%99.3%100%100%100%100%99.4%0.99
201998.9%100%100%98.4%100%100%100%98.8%94.1%100%100%100%99.4%0.99
202099.3%99.6%99.7%99.4%100%100%100%99.5%97.0%100%100%100%99.6%0.99
Table 5. Results of five-fold cross validation (SD: Standard deviation).
YearOverall AccuracyKappa Coefficient
MinimumMaximumMeanSDMinimumMaximumMeanSD
198799.68%100%99.84%0.1130.99610.9980.001
198899.52%99.91%99.71%0.1510.9940.9990.9960.002
199199.55%100%99.73%0.1870.99410.9960.002
199399.76%99.88%99.83%0.0670.9970.9980.9980.001
199599.26%99.75%99.55%0.2250.9910.9970.9950.003
199798.40%99.77%98.97%0.5930.9790.9970.9860.008
199998.83%99.79%99.28%0.3480.9850.9970.9910.004
200199.49%99.79%99.65%0.1380.9930.9970.9960.002
200299.04%99.90%99.54%0.3560.9880.9990.9940.004
200499.48%99.74%99.61%0.0920.9930.9970.9950.001
200699.35%99.87%99.58%0.1940.9920.9980.9950.002
200998.54%98.99%98.77%0.210.980.9860.9830.003
201198.76%99.44%99.08%0.2190.9830.9920.9870.004
201399.67%100%99.85%0.1260.99610.9980.002
201599.22%99.83%99.57%0.260.990.9980.9940.003
201799.16%99.69%99.39%0.2020.9880.9960.9920.003
201999.69%99.76%99.71%0.0470.9960.9970.9960.001
202099.40%100%99.69%0.2160.99210.9960.003
Publisher’s Note: MDPI stays neutral with regard to jurisdictional claims in published maps and institutional affiliations.

