Article

L2AMF-Net: An L2-Normed Attention and Multi-Scale Fusion Network for Lunar Image Patch Matching

1
School of Instrumentation and Optoelectronic Engineering, Beihang University, Beijing 100191, China
2
Key Laboratory of Precision Opto-Mechatronics Technology, Ministry of Education, Beihang University, Beijing 100191, China
*
Author to whom correspondence should be addressed.
Remote Sens. 2022, 14(20), 5156; https://doi.org/10.3390/rs14205156
Submission received: 1 August 2022 / Revised: 11 October 2022 / Accepted: 12 October 2022 / Published: 15 October 2022
(This article belongs to the Special Issue Cartography of the Solar System: Remote Sensing beyond Earth)

Abstract

:
The terrain-relative navigation (TRN) method is often used in entry, descent and landing (EDL) systems for position estimation and navigation of spacecraft. In contrast to the crater detection method, the image patch matching method does not depend on the integrity of the database and the saliency of the crater features. However, there are four difficulties associated with lunar images: illumination transformation, perspective transformation, resolution mismatch, and the lack of texture. Deep learning offers possible solutions. In this paper, an L2-normed attention and multi-scale fusion network (L2AMF-Net) was proposed for patch descriptor learning to effectively overcome the above four difficulties and achieve lunar image patch matching accurately and robustly. On the one hand, an L2-Attention unit (LAU) was proposed to generate attention score maps in spatial and channel dimensions and enhance feature extraction. On the other hand, a multi-scale feature self and fusion enhance structure (SFES) was proposed to fuse multi-scale features and enhance the feature representations. L2AMF-Net achieved a 95.57% matching accuracy and excellent performance compared with several other methods in lunar image patch dataset generated in this paper. Experiments verified the illumination, perspective and texture robustness of L2AMF-Net and the validity of the attention module and feature fusion structure.

Graphical Abstract

1. Introduction

The entry, descent and landing (EDL) system is responsible for position estimation and navigation during the approach, descent and landing of a spacecraft. The inertial measurement unit (IMU) was used for this task previously, but it led to a 3.2 km deviation of the landing site due to the accumulation of error [1]. Terrain-relative navigation (TRN) obtains terrain information through a camera or laser radar and refers to a database with prior position information for position estimation and navigation. TRN was first proposed by the Jet Propulsion Laboratory (JPL) to reduce the deviation of the landing site on the lunar surface to 100 m [2], and it was also used by Chang’E-4 for related visual measurements [3]. TRN for EDL is always implemented based on a landing camera (LCAM) [4] and consists of two types of methods: crater detection and image patch matching. Due to the sufficient number of craters, less memory required for quantitative crater shape parameters, and affine invariance, crater detection methods have attracted much attention as TRN methods for EDL [4,5,6,7,8]. However, this method has two significant shortcomings. On the one hand, it depends on the integrity of the database. Matching errors may occur if detected craters do not exist in the database or have never been recorded. On the other hand, it depends on the saliency of the crater features, and has poor performances in lunar areas where craters are not evident.
The image patch matching methods choose several patches in an LCAM image and match them with global map (MAP) patches. Several pairs of matched center points between the LCAM image and the global map will be used for subsequent location estimation in TRN for EDL. In this paper, lunar image patch matching was studied so that the database relies on published lunar global maps and no database integrity issues exist. The matching process only requires pixel grayscale instead of any significant terrain such as craters to achieve the same performances in any lunar area. There has been some related work, such as the lander vision system (LVS) [1,9] in the Mars 2020 and TRN research on Titan [10]. However, there are four difficulties in lunar image patch matching. The first issue is illumination transformation due to the variety of sun altitudes at different times and sites. The second issue is perspective transformation due to the variety of spacecraft attitudes. The third issue is resolution mismatch between the LCAM and MAP patches. MAP patches with lower and identical resolution are obtained in the higher lunar orbit beforehand, while the LCAM patches with higher and variable resolution are obtained in the lower lunar orbit in real time. The fourth issue is the lack of texture due to the natural lunar topography and imaging with a low resolution.
The traditional image patch matching methods can be divided into two types: area-based methods and feature-based methods. The area-based methods are mostly based on the grayscale cross-correlation for template matching [11,12,13]. However, illumination and perspective transformation lead to significant differences of the grayscale between the LCAM and MAP patches. The resolution mismatch and lack of texture issues further increase the challenge of matching with the grayscale directly. The area-based methods have low accuracy and poor robustness in lunar image patch matching. The feature-based methods obtain artificially designed descriptors from patches for matching, such as the floating descriptors SIFT [14], SURF [15], DAISY [16], and the binary descriptors ORB [17], BRISK [18], and FREAK [19]. This type of method is simple and efficient but it is difficult to obtain useful descriptors with high discriminability in lunar patches with a lack of texture and low resolution, so the feature-based methods are not available for lunar image patch matching.
In recent years, remote sensing image processing has developed, with traditional applications including image classification [20], object detection [21], semantic segmentation [22], and image registration [23]. Some other novel applications have also been explored, including the assessment of forest health [24], marine oil-spill detection and identification [25], and earth surface change detection [26,27]. The convolutional neural network (CNN) has become the basic deep learning model in computer vision, as it can effectively fuse image information in spatial dimensions and has strong image feature extraction abilities. CNNs have been carried on spacecraft hardware platforms recently [28]. Deep learning and CNNs make it possible to overcome the above four difficulties and achieve accurate and robust lunar image patch matching.
There are two types of general deep learning methods for image patch matching: metric learning and descriptor learning. The descriptor learning methods have similar principles to those of SIFT [14] but obtain descriptors through deep learning networks after data training. The distances between descriptor pairs symbolize the similarity of patch pairs and generally are optimized directly by the hinge loss [29,30]. Others use the parameterized exponential loss [31], cosine loss [32], which introduces cosine similarity, or soft-margin loss [33,34], which combines the natural exponential to avoid setting parameters artificially. Regularization terms in the loss function have also been studied to improve the patch matching accuracy, including the global loss [35] to constrain the means and variances of all descriptor distances, and a second-order similarity regularization term [36] to constrain the correlation between the dimensions of the descriptors. Further making full use of mismatched patch pairs to train the network, TFeat [37] proposes a triplet network structure and loss function to maximize the difference between matched descriptor pair distances and mismatched descriptor pair distances, increasing the latter and reducing the former simultaneously. DeepDesc [30] proposes the hard negative mining sampling strategy for training the triplet loss, and similarly Twin-Net [38] further proposes the twin negative mining sampling strategy and quad loss for training. The metric learning methods further merge descriptor pairs and then output similarity scores through the metric network component to symbolize the similarity of patch pairs. MatchNet [39] directly concatenates 4096D descriptors in the channel dimension and other methods merge descriptors in different ways, including concatenation with shortcut connections similar to ResNet [40] in DenseNet [41], cross correlation in NC-Net [42], features differences and accumulation in AFD-Net [43], and the fusion of concatenation, difference and element-wise multiplication in MRA-Net [44]. Siamese and pseudo, 2-channel, central-surround two-stream and other network structures were evaluated for descriptor and metric learning [45]. Generally, descriptor learning methods process matrix operations on descriptors in batches and the similarity is evaluated by a manual principle. Metric learning methods pair each patch with all the other patches in the mini-batch, which is inferred by the metric network component for a total number of times equal to the batch size squared, and determine the metric principle through the training of the metric network component. The former performs more quickly, and the latter has better accuracy and robustness. Considering the processing speed required by EDL, our method is designed for descriptor learning.
L2-Net [46] uses the relative loss to minimize the relative descriptor distances of matched patch pairs in the mini-batch. It also imposes constraints on the similarity between feature map outputs by intermediate layers and achieves excellent performance on general image patch datasets. However, it is hard to directly train L2-Net or other general patch matching methods for lunar image patch matching since the lunar image has different characteristics from general city or natural images, two of which are the lack of texture and resolution mismatch. On the one hand, the great difference in the resolution between the matched LCAM and MAP patches, meaning that the features contained in patches are different, will lead to significant differences in the matched descriptors. On the other hand, since lunar images lack texture, the limited prominent terrain features need to be focused on. Otherwise, the ratio of significant features will be low and the discriminability of the descriptors will be insufficient to determine whether the patch pair is matched or not. Thus, it may be not appropriate to directly apply general patch matching networks on lunar images and there is no network designed for lunar images according to our knowledge. The design of the attention module used in the patch matching was first introduced by Noh H. et al. [47] and was subsequently studied further [44,48]. This helped enhance the feature extraction within small image patches containing limited information. The FPN [49] was first proposed for target detection. Its feature fusion structure merges multi-scale feature maps to enhance the robustness and feature representations. The attention module and feature fusion structure inspired our network design to solve the four difficulties in lunar image patch matching. In addition, the triplet loss and hard negative mining sampling strategy was introduced for L2-Net in HardNet [50] to make full use of mismatched patch pairs for training. It also inspired a method to improve the discriminability of descriptors with regard to the loss function.
In order to make up for the gap in research on deep learning patch matching methods in the TRN for EDL and overcome the four difficulties of lunar patch matching effectively, an L2-normed attention and multi-scale fusion network (L2AMF-Net) was proposed for patch descriptor learning to achieve lunar image patch matching accurately and robustly. L2AMF-Net receives 32 × 32 image patches as the inputs, and outputs 320D descriptors. The matched patch is determined by the shortest L2 distance between descriptors. The contributions of this paper are as follows:
  • An L2-Attention unit (LAU) was proposed to generate attention score maps in spatial and channel dimensions and enhance feature extraction. In the shallow and medium blocks, a spatial attention module filters pixel neighbourhoods to learn pixel interaction, and a channel attention module adopts a multi-layer perception (MLP) to explore the priority of features in different channels. An attention score map is generated and applied on a feature map to emphasize significant terrains or invariant features and weaken general features. In the deep block, a large-scale kernel convolution assigns weights to compact pixel features and accumulates them together as a more compact and abstract representation.
  • A multi-scale feature self and fusion enhance structure (SFES) was proposed to fuse multi-scale features and enhance the feature representations. In the self-enhance module, a large-scale convolution assigns weights to shallow or deep features and refines a compact representation of a 1 × 1 map to achieve self enhancement, respectively. In the fusion-enhance module, a channel attention module identifies and assigns greater weights on invariant and significant features to enhance feature fusion, and a feature compression removes redundant features to increase the compactness of descriptors.
  • The triplet loss and hard negative mining sampling strategy was introduced for network training in the TRN for EDL. The triplet loss maximizes the difference between matched descriptor pair distances and mismatched descriptor pair distances. This helps to simultaneously enhance the similarity of matched pairs and reduce the possibility of matching errors in the mini-batch.
The related codes are publicly available at https://github.com/zwh0527/lunar-image-patch-matching (released on 14 July 2022).

2. Proposed Method

In this paper, L2AMF-Net was proposed for descriptor learning to achieve lunar image patch matching. The network structure is shown in Figure 1. L2AMF-Net consists of two components: an L2-Attention unit (LAU) and a multi-scale feature self and fusion enhance structure (SFES). In the LAU, L2-Net as the backbone performs preliminary feature extraction on 32 × 32 input image patches. An attention score map is generated in the attention module and applied on a feature map. In the SFES, multi-scale features are respectively assigned weights and refined as a compact representation in the self-enhance module. They are further processed with the channel attention module and a feature compression. The details of the different components are as follows.

2.1. Backbone: L2-Net

L2-Net is the backbone of L2AMF-Net. Its network structure is shown in Figure 2 and the hyperparameters were determined by experiments, which were different from those previously reported [46]. L2-Net receives 32 × 32 image patches as inputs, and outputs 160D descriptors. It consists of seven basic blocks and a local response normalization (LRN) layer. Each basic block consists of a convolutional layer, a batch normalization (BN) layer, and a ReLU activation layer. Except for basic block 7, the kernel sizes of the basic blocks were 5 × 5, 5 × 5, 5 × 5, 5 × 5, 5 × 5, and 3 × 3 and could be divided into three blocks based on the scale of the output feature maps. The basic blocks in the same block had the same kernel numbers, which were 40, 80, and 160 in turn. The strides of the basic blocks in green and blue are 1 and 2 respectively. Basic block 7 performed no-padding convolution and its kernel size and kernel number were 8 × 8 and 160 respectively. Thus, the scale of the input and output feature maps were 160 × 8 × 8 and 160 × 1 × 1 respectively. The principle of the LRN layer can be formalized as [51]
b x , y i = a x , y i / ( k + α j = max ( 0 , i n / 2 ) min ( N 1 , i + n / 2 ) ( a x , y j ) 2 ) β
where b x , y i and a x , y i denotes the values of the output and input feature maps in the x th row, y th column and i th dimension. k , α , and β are hyperparameters of the LRN layer, with values of 1, 0.0001, and 0.75. N denotes the total numbers of channels of the feature maps and n denotes the number of channels processed in the LRN layer, which was set to 5. The output descriptors were locally normalized in the channel range of ( n / 2 , n / 2 ) to highlight the significant channels, weaken the normal channels and improve the discriminability.
In the process of TRN for EDL, with X s = x 1 s x i s x p s 32 × 32 × p , ( s = 1 , 2 ) inputs, L2AMF-Net outputs descriptor matrices of the LCAM and MAP patches Y s = y 1 s y i s y p s q × p , ( s = 1 , 2 ) , where p denotes the batch size and q denotes the descriptor dimensions. y i s , ( s = 1 , 2 ) denotes the i th descriptor of the LCAM (s = 2) or MAP (s = 1) patches in the mini-batch. Thus, the distance matrix between the LCAM and MAP patches D [ d i j ] R p × p is defined, where d i j = y i 2 y i 1 2 and · 2 is the L2 norm or distance. D can be computed by one simple matrix multiplication as
D = 2 ( 1 Y 1 T Y 2 )
The matched patch is determined by the shortest L2 distance between the descriptors in a mini-batch. Thus, the element of the distance matrix D should satisfy
min i [ 1 , p ] { d i k } = d k k min j [ 1 , p ] { d k j } = d k k
Therefore, the performance metric available for the process of TRN for EDL should be that in a mini-batch, for each LCAM patch, the MAP patch whose descriptor has the shortest L2 distance to it is regarded as the matched patch and the matching accuracy of this mini-batch can be calculated. The mean of the matching accuracy in all mini-batches is the overall training or test accuracy of the dataset. In this paper, the accuracy in all the experiments was calculated following this approach.

2.2. L2-Attention Unit

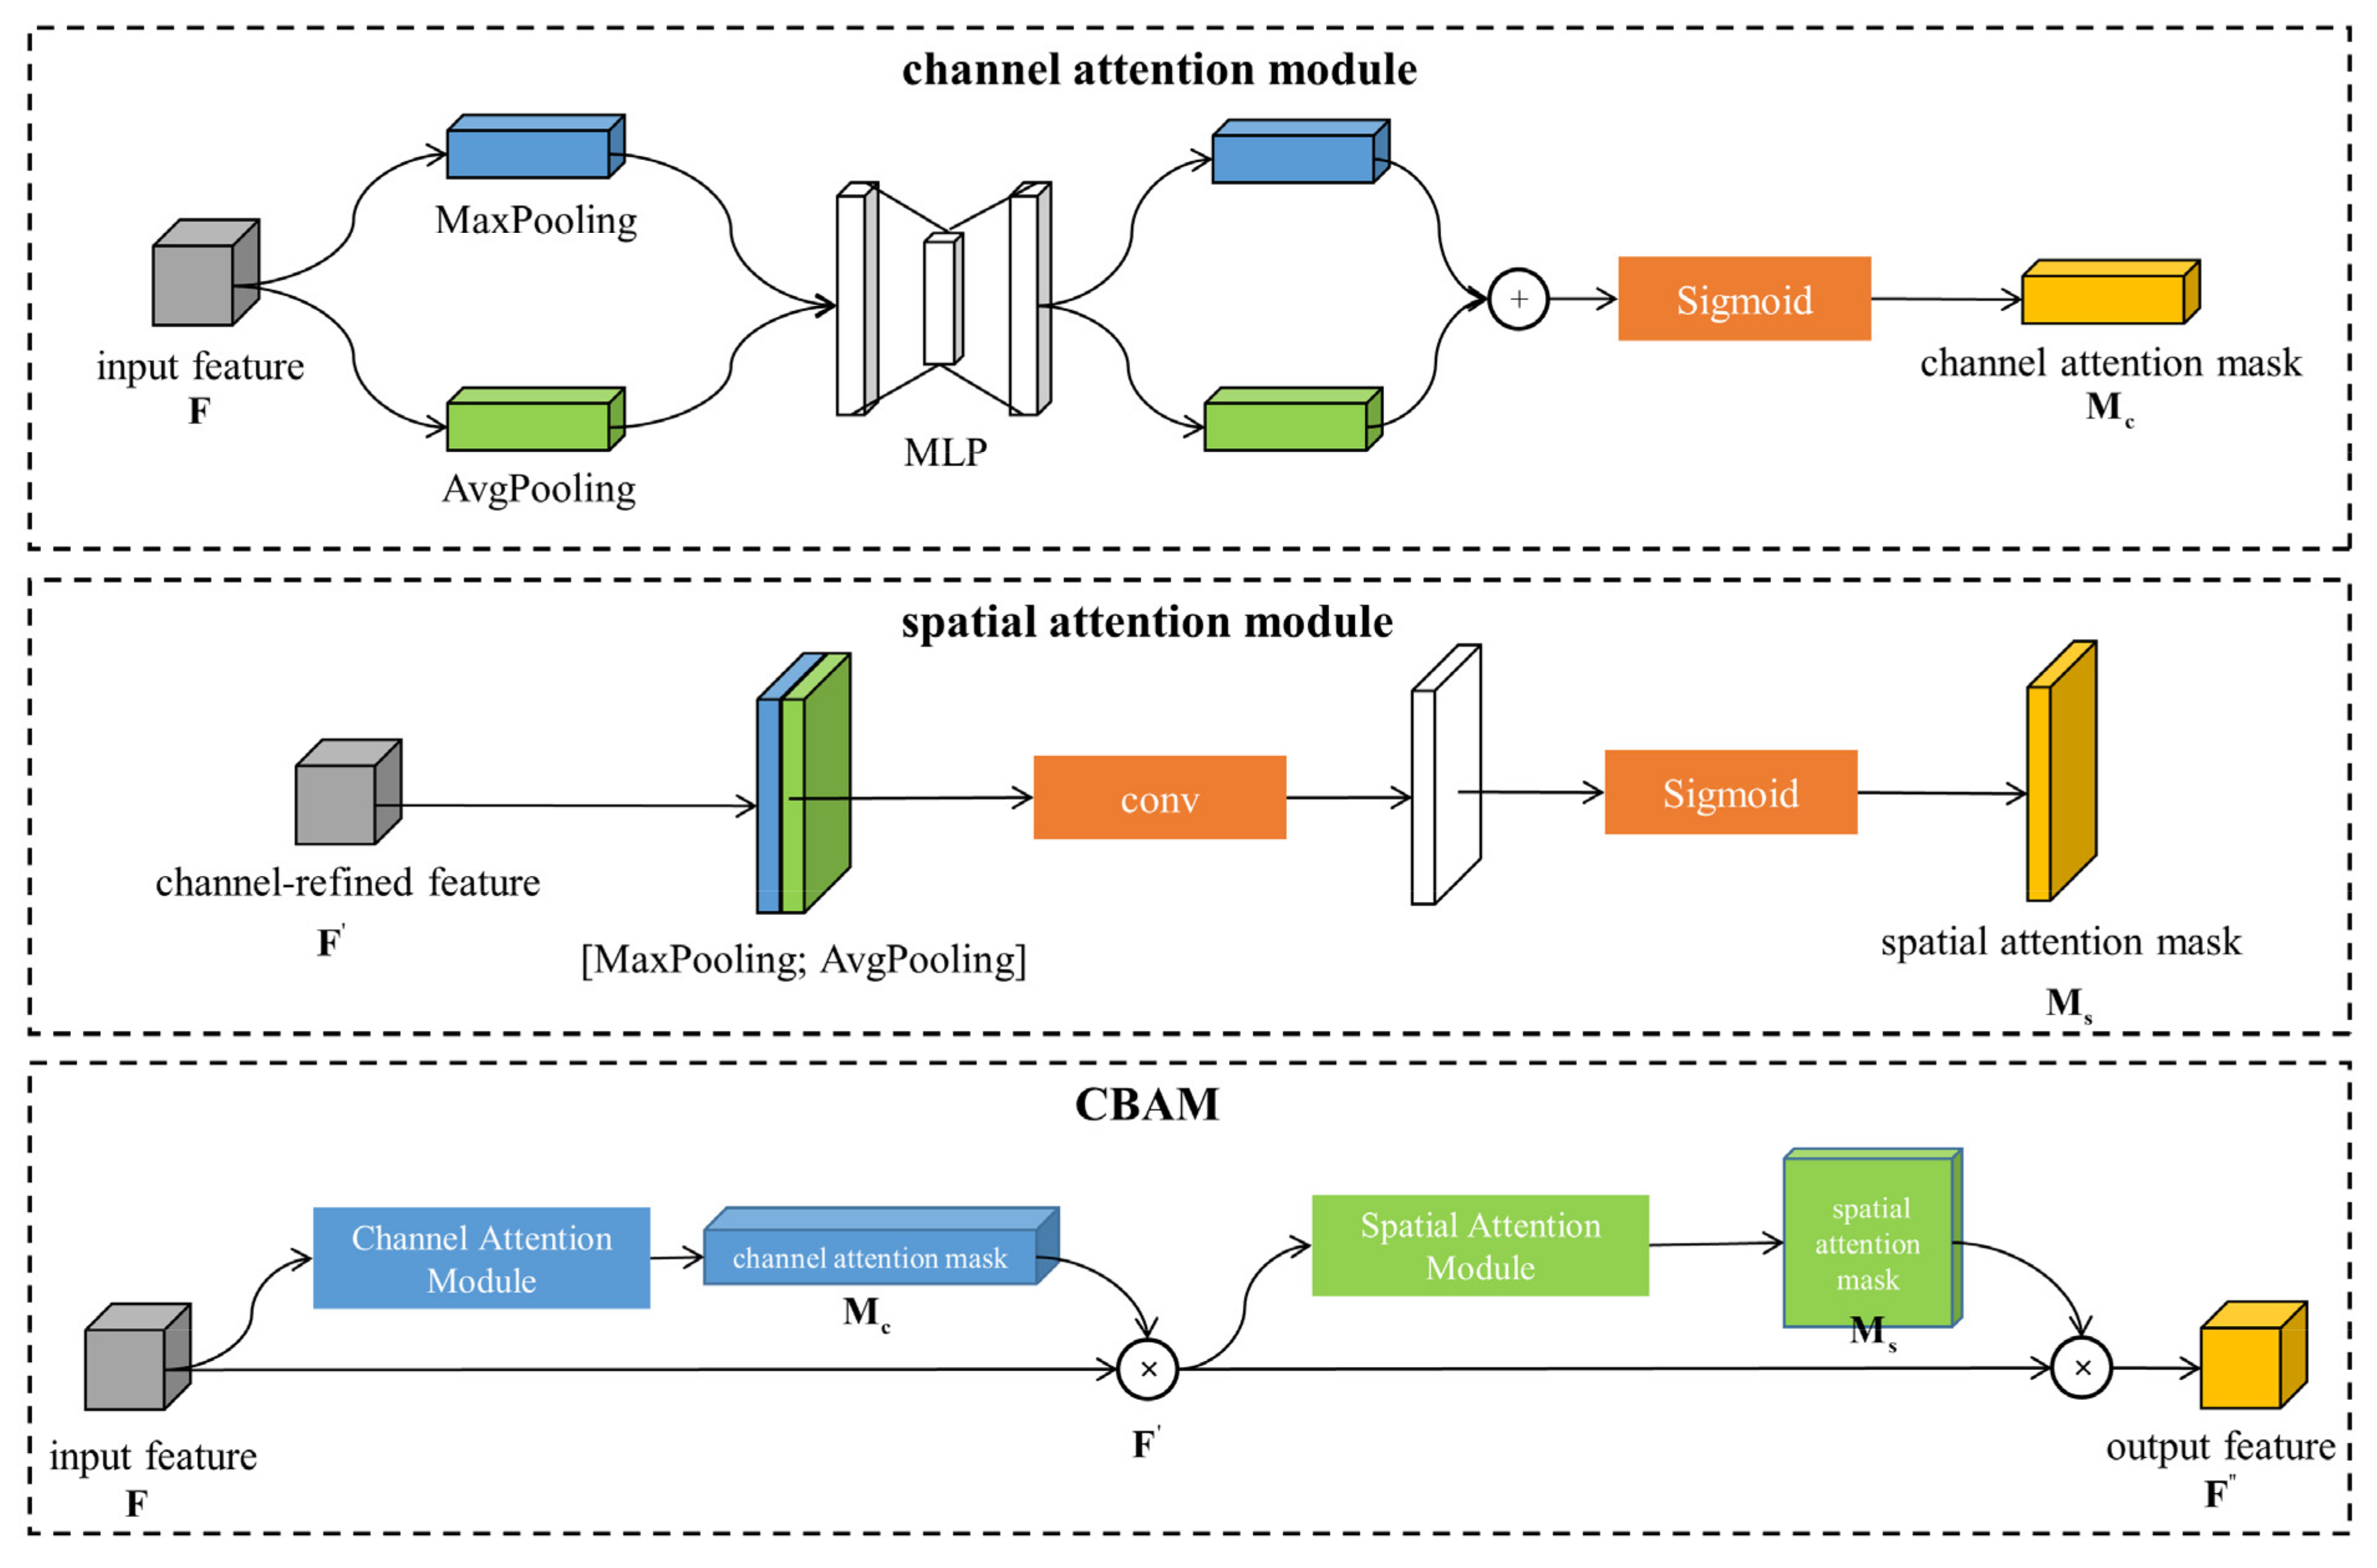
The attention module in L2AMF-Net was CBAM [52], and its principle as well as its internal structure are shown in Figure 3. The attention module consists of spatial and channel attention. For the input feature map F R C × H × W , the output feature map F R C × H × W can be denoted as
F = M c ( F ) F , F = M s ( F ) F
First, a 1D channel attention mask M C R C × 1 × 1 can be obtained when inputting the feature map F , weighting the features in the channel dimension, and outputting the channel-refined feature F R C × H × W . The symbol denotes element-wise multiplication, which can be broadcast. Then, a 2D spatial attention mask M S R 1 × H × W can be obtained when inputting F , weighting the features in the spatial dimension, and outputting the final attention-refined feature F . The process of the spatial attention can be denoted as
M s ( F ) = σ ( f k × k ( [ AvgPooling ( F ) ; MaxPooling ( F ) ] ) ) = σ ( f k × k ( [ F a v g s ; F m a x s ) ] ) )
where F a v g s R 1 × H × W and F m a x s R 1 × H × W are the feature maps after average and max pooling in the channel dimension respectively, which will be concatenated in the channel dimension, f k × k denotes the spatial convolution operation with a k × k kernel size, which outputs an initial spatial attention mask, and σ ( · ) = Sigmoid ( x ) denotes the activation function and performs normalization on the mask. The process of the channel attention can be denoted as
M c ( F ) = σ ( MLP ( AvgPooling ( F ) ) + MLP ( MaxPooling ( F ) ) ) = σ ( W 1 ( W 0 ( F a v g c ) ) + W 1 ( W 0 ( F m a x c ) ) )
where F a v g c R C × 1 × 1 and F m a x c R C × 1 × 1 are the feature maps after average and max pooling in the spatial dimension respectively, which will be added for each element, W 0 R C / r × C and W 1 R C × C / r are weight parameters of the two layers in the MLP, and r denotes the channel compression factor. The initial channel attention mask is output by the MLP and normalized by a sigmoid activation function.
AN L2 -Attention unit (LAU) was proposed to generate attention score maps in spatial and channel dimensions and enhance feature extraction. According to Figure 1, in the LAU, the seven basic blocks play a major role in feature extraction. Of these, the two feature maps with dimensions of 40 × 32 × 32 output by the two basic blocks in shallow block are refined by an attention module whose kernel size is 7 × 7. The number of input channels of the MLP is 40, and the channel compression factor is 8. Similar refinements by the attention module are also performed on the two feature maps with dimensions of 80 × 16 × 16 output by the two basic blocks in medium block. The kernel size of the attention module is 3 × 3 and the number of input channels of the MLP is 80 In the shallow and medium block, a spatial attention module filters pixel neighborhoods to learn pixels interaction and a channel attention module adopts a MLP to explore the priority of features in different channels. An attention score map is generated and applied to a feature map. The attention module emphasizes the feature extraction of the prominent terrains, such as craters, mountains, and rifts, and weaken the feature extraction of the general terrains, such as plains in the spatial dimension. For the channel dimension, the attention module focusses on robust features, such as the grayscale distribution, and semantic information, and it is less concerned with unstable features, such as the pixel grayscale and gradient. In the deep block, a large-scale kernel convolution assigns weights to compact pixel features and accumulates them together as a more compact and abstract representation.

2.3. Multi-Scale Feature Self and Fusion Enhance Structure

A multi-scale feature self and fusion enhance structure (SFES) was proposed to fuse multi-scale features and enhance the feature representations. It consists of two modules: the self-enhance module and the fusion-enhance module. In the self-enhance module, a large-scale, multi-level kernel convolution assigns weights to shallow and deep features and refines a compact representation of 1 × 1 map to achieve self-enhancement, respectively. For multi-scale feature maps F 1 R 40 × 32 × 32 , F 2 R 80 × 16 × 16 , F 3 R 160 × 8 × 8 , F 4 R 160 × 1 × 1 of shallow block, medium block, deep block, and basic block 7, this can be denoted as
F i = f i k × k ( F i ) ( i = 1 , 2 , 3 )
where f i k × k ( i = 1 , 2 , 3 ) represents the three down-sampling layers of L2AMF-Net in Figure 1 with a no-padding convolution whose large-scale kernel size is k × k . Then, in the fusion-enhance module, feature maps F i R C × 1 × 1 ( C = 40 , 80 , 160 ) with the same size of 1×1 are first concatenated to obtain the fused features F = F 1 F 2 F 3 F 4 R 440 × 1 × 1 . This achieves merging of different types of features at different levels. A simple concatenation cannot fuse features effectively since multi-scale features contribute differently to output descriptors. Weighting of multi-scale features is performed by a channel attention module, whose channel compression factor is also eight, and the output features F R 440 × 1 × 1 are obtained. In this process, the proportion of shallow features, such as the grayscale and gradient, and abstract features, such as the semantic and distribution information, are adjusted to have better matching performances. Invariant and significant features are identified and assigned greater weights to enhance feature fusion. After this, a feature compression is applied to remove the redundant features and increase the compactness of descriptors. In detail, a basic block with a kernel size of 1×1 and kernel number of 320 receives a feature map F R 440 × 1 × 1 as an input and produces F R 320 × 1 × 1 as an output. Finally, the LRN layer normalizes and outputs 320D descriptors.

2.4. Loss Function and Sampling Strategy

In this paper, the triplet loss and hard negative mining strategy were introduced for network training in the TRN for EDL. The triplet loss can be formalized as [37]
L triplet = max ( 0 , α + D ap D an )
where α is the threshold of the distance difference, D ap denotes the distance between the descriptors of the MAP patch (anchor) and the matched LCAM patch (positive), and D an denotes the distance between the anchor and the mismatched LCAM patch (negative). The triplet loss directly denotes the difference between matched descriptor pair distances and mismatched descriptor pair distances, so the smaller loss symbolizes less similarity between mismatched descriptor pairs and matching errors.
The details of the sampling strategy are as follows.
(1)
The descriptor distance matrix D = 2 ( 1 Y 1 T Y 2 ) is obtained according to Equation (2).
(2)
i is set to 0 and the j of min j i D i j is the index of the negative LCAM patch in the mini-batch. The D ap is set to D i i and D an is set to D i j .
(3)
i is set to i + 1 . The second step is repeated until i is equal to batch size p .
(4)
The triplet loss L triplet is obtained through batch size ( D ap , D an ) tuples according to Equation (8).

3. Lunar Image Patch Datasets

Several lunar global maps with different resolution have been published so far. However, no LCAM and MAP patch pairs dataset has been published for the training and testing of the patch matching network. In this paper, two datasets were generated based on the lunar global map with a 7 m resolution obtained by Chang’E-2 [53]. The details are described below.

3.1. Generation Procedure of Datasets

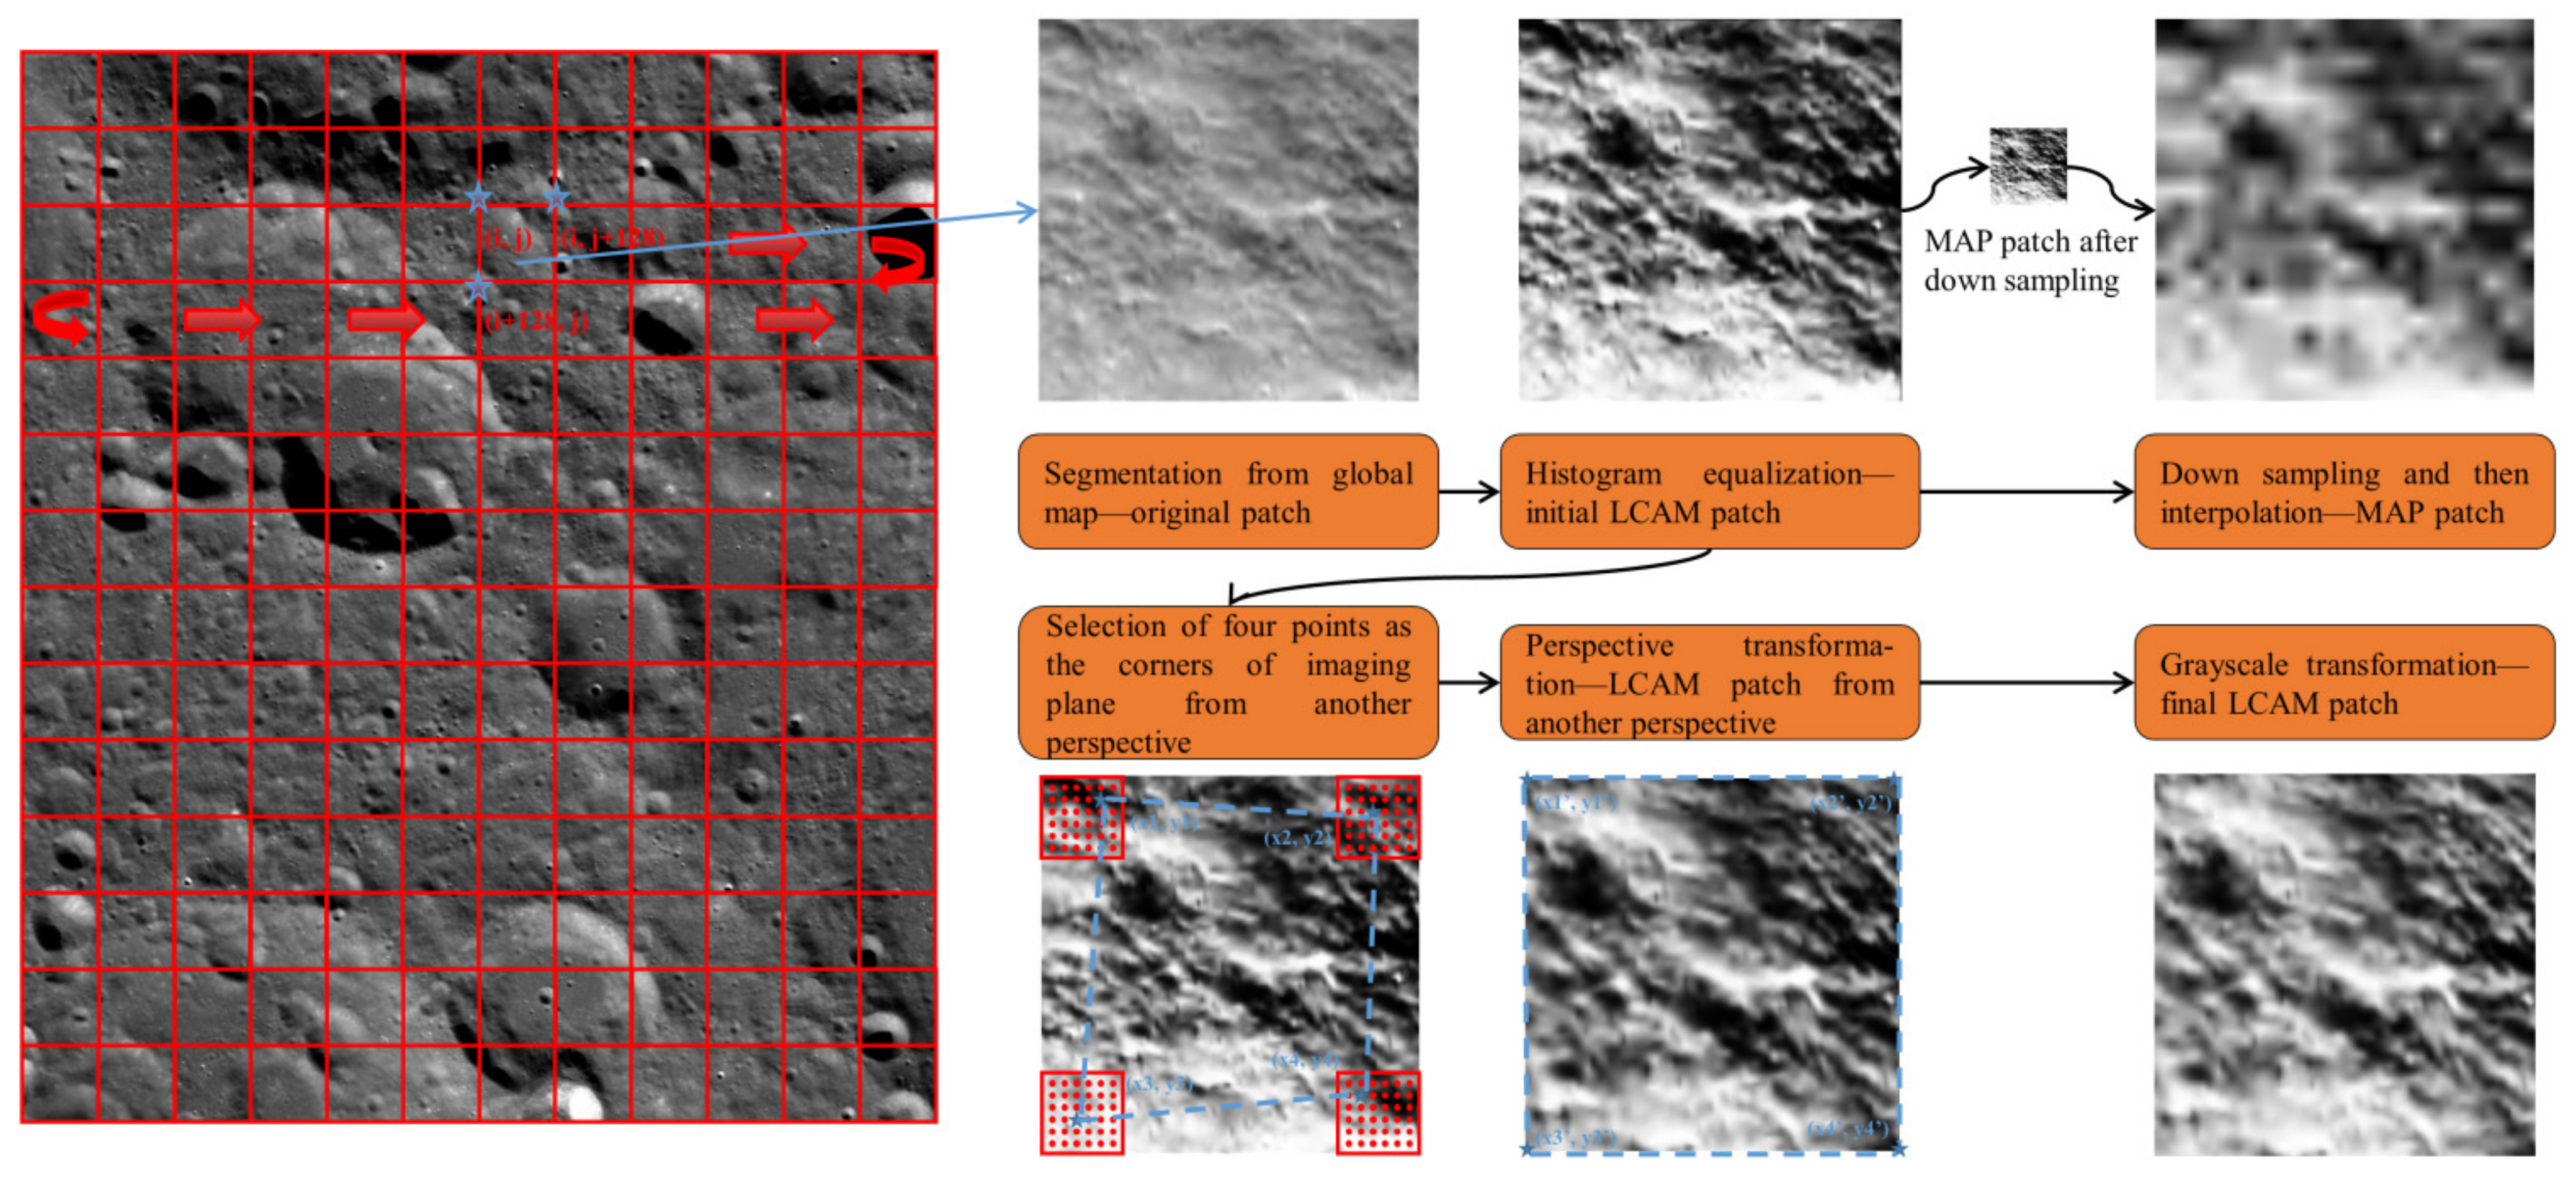
Figure 4 shows the overall generation procedure of the dataset. For the lunar global map, traversal and segmentation are first performed first from left to right and then from top to bottom according to the red arrows in Figure 4. For the pixel in the i th row and the j th column, the 128 × 128 image area in the row range of from i to i + 127 and in the column range of from j to j + 127 is cropped as an image patch, and all the initial LCAM patches are generated as non-overlapping.
The initial LCAM patch has a small range of grayscale values, poor contrast, and a lack of texture. Histogram equalization is first applied as preprocessing on the initial LCAM patches to reduce matching difficulty. Then, resolution transformation is imposed on them to simulate the actual matching condition in which the resolutions of the MAP patches are lower than those of the LCAM patches. In detail, the initial LCAM patches are down-sampled by α times and then processed by bilinear interpolation to finally obtain 128 × 128 MAP patches.
The variety of spacecraft attitudes causes the LCAM imaging angle to not be in the normal direction of the lunar surface. In contrast, as the lunar global map is geometrically corrected, the MAP patches are imaged in the direction normal to the lunar surface. To simulate the difference of the imaging perspective, perspective transformation is imposed on the initial LCAM patches to generate LCAM patches imaging from another viewing direction. In detail, four pixels of the initial LCAM patch ( x i , y i ) ( i = 1 , 2 , 3 , 4 ) are chosen from an area of a certain size in each corner and become the four corners ( x i , y i ) ( i = 1 , 2 , 3 , 4 ) of the new imaging plane from another viewing direction after perspective transformation. η denotes the rate of the rest central area except for the four corner areas. The 8-DoF transformation matrix can be solved using the linear equations formed by four pixels pairs and applied on all pixels to generate perspective-transformed LCAM patches.
Finally, to simulate a variety of sun altitudes at different times and sites, the perspective-transformed LCAM patches are processed by a grayscale transformation with a random power, which can be formalized as
f ( D ) = D β , D [ 0 , 1 ]
where D and f ( D ) are the grayscale before and after transformation, respectively, β donates the random power, which simulates weak illumination when the value is less than 1 and strong illumination when the value is greater than 1.
After traversal and segmentation, resolution transformation, perspective transformation, and grayscale transformation with a random power, a dataset of the LCAM and MAP patch pairs can be generated.

3.2. Datasets Overview

The first dataset was a general dataset, which simulated general imaging and matching conditions for the training and testing of L2AMF-Net. The training dataset contained 125,664 pairs image patches with sizes of 128 × 128 generated from two tiles of the lunar global map. The test dataset had 23,100 pairs patches generated from the half tile of the global map. The value of α was set from 4 to 8 randomly considering the height, focal length, and pixel size of the camera. The value of η was set to 0.6, and β was set from 0.7 to 1.4 randomly. Some samples of the dataset are shown in Figure 5. After resolution transformation, the patches were significantly blurred, and the details were missing. Some samples only retained the global grayscale distribution information, and the local textures were indistinguishable. After perspective transformation, the patches showed significant stretching deformation. The proportion of the image area that was relatively close to the camera became larger, and that of the remaining image was decreased, reflecting the “near big and far small” imaging effect after the spacecraft attitude changed. The overall brightness of the image patch is significantly enhanced or weakened.
The second dataset was a robustness dataset, which simulated more extreme conditions for the robustness testing of L2AMF-Net. It contained illumination, perspective, and texture robustness datasets, and each was comprised of four parts, including the origin, level1, level2, and level3. Based on the origin part, other parts were processed with the resolution, perspective, or illumination transformation for different levels of the parameters such that the transformation degree was continuously enhanced, and the different levels of the parameters of level1, level2, and level3 are shown in Table 1. In the illumination robustness dataset, the former half-patches were processed with Equation (9) whose β value was less than 1, and the latter half-patches were processed with Equation (9) whose β value was greater than 1. The LCAM patches of the origin part were the initial LCAM patches after histogram equalization, and the MAP patches of that were MAP patches of the general test dataset. The origin part of the perspective robustness dataset was same as that of the illumination robustness dataset, and that of texture robustness dataset was same as the general test dataset. Thus, all three robustness datasets had the same quantity of patches as the general test dataset. Figure 5 shows some samples of different parts of the robustness dataset, and the image details will be discussed with the robustness experiments in Section 4.3.

4. Experiment

4.1. Training and Testing Details

In this study, the SGD optimizer was used for training, whose learning rate, momentum, and weight decay were 0.001, 0.9, and 0.0001. The learning rate decayed 0.95 every two epochs, and the parameters were updated every 10 batches. The training samples were not shuffled and were flipped horizontally with a 50% probability, but the test samples were shuffled by default to avoid over-fitting within a mini-batch. The testing was performed three times to obtain the average test matching accuracy. In some experiments, the test samples were not shuffled to maintain the consistency of the test data. The models were trained for 20 epochs on a machine with the Windows10 operating system, an i7-8750H CPU, and an NVIDIA GeForce GTX 1050Ti GPU with 4GB RAM.
The batch size during training was 128, and 256 during testing by default. The value of α in the triplet loss was set to 1.0. The performance metrics and how the matching accuracy was calculated is discussed in Section 2.1.

4.2. Comparison with Other Methods

The L2AMF-Net and other methods were trained and tested on the general dataset. The test results are shown in Table 2. The batch size of all the methods was 128, and the test samples were not shuffled. L2AMF-Net achieved a 95.57% matching accuracy.
The template matching method in the LVS of the Mars 2020 was chosen as the traditional area-based method for comparison [1,9]. Six methods of template matching were tested [54], including the correlation coefficient matching method, denoted as CCOEFF, its normalized type, denoted as NORMED CCOEFF, the correlation matching method, denoted as CCORR, its normalized type, denoted as NORMED CCORR, the squared difference matching method, and its normalized type. The latter two methods had less than 1% accuracy, so they are not listed in Table 2. As the size of the image patch influenced the matching accuracy, every template matching method was tested with the input sizes of 16, 32, 64, and 128. The test accuracy listed in Table 2 was the best performance of each method. The normalized methods had a test accuracy of about 70%, and others had a test accuracy of about 54%. The normalized methods had better performances, but they were all worse than that of L2AMF-Net.
SIFT [14] and SURF [15] were chosen as two types of traditional floating feature-based methods, and the ORB [17] was chosen as the binary descriptor for comparison. As the size of the image patch also influenced the matching accuracy of the descriptors, the experimental conditions were the same as those of traditional area-based methods. SIFT and SURF both had a test accuracy of about 20% and that of ORB was less than 10%. These were all worse than that of L2AMF-Net. As the lunar image patches had low resolution and lacked texture, the traditional feature-based methods were not available in the TRN for EDL.
To make other descriptor learning methods suitable for the dataset generated in this paper, all the methods were based on the structure and hyperparameters of L2-Net in Figure 2. L2-Net was trained with the relative loss in a previous study [46]. HardNet [50] was trained with the same loss function and sampling strategy as that of L2AMF-Net. The three Siamese networks were trained with the hinge loss [29,30], whose distance threshold was set to 1.0, soft-margin loss [34] and cosine loss [32], whose distance threshold was set to 0.1. One more Siamese network with the 2ch2stream structure [55] was trained with the hinge loss, since it achieved the best test accuracy of the three Siamese networks described above. Only HardNet had a test accuracy of greater than 90%, which verified the loss function and sampling strategy of L2AMF-Net as the best available for the TRN for EDL. Among the other methods, L2-Net achieved the best test accuracy of 88.96%, since the relative loss minimized the relative distance of the matched descriptor pairs in a mini-batch, and it indirectly increased the descriptor distance between the mismatched patches. The 2ch2stream structure was also trained but is not listed in Table 2 because it only achieved test accuracy of 58.87%. The Siamese (hinge loss) network only directly minimized the descriptor distance between the matched patch pairs, so it had test accuracy of 86.94%, which was slightly worse than that of L2-Net. The Siamese (cosine loss) network achieved matching accuracy of 72.62%, reflecting a worse availability of the cosine distance than the L2 distance in the TRN for EDL. The Siamese (soft-margin loss) network had the worst test accuracy of 46.63%. The Siamese (hinge loss, 2ch2stream) network was not better than the Siamese (hinge loss, base) network. This indicates that the 2ch2stream structure contributed less to patch matching for the TRN for EDL. In summary, L2AMF-Net had the best performance of the descriptor learning methods.
The MatchNet [39] and its 2channel and 2ch2stream structure [55] were chosen as metric learning methods for comparison. All three metric learning methods had a test accuracy of greater than 94%, which was better than those of the descriptor learning methods. The 2ch2stream structure contributes less not only in the descriptor learning but also in the metric learning. The 2channel structure receives a pair of patches which concatenate together in the channel dimension as input. It helped better align image patch pairs and extract the differences and similarities of the grayscale. Thus, it achieved a best test accuracy of 95.76, 0.2% greater than that of L2AMF-Net. However, each patch required to be paired with all the other patches in the mini-batch and inferred by MatchNet (2channel) a total number of times equal to the batch size squared. As for L2AMF-Net, each patch was inferred by the network only one time. In theory, L2AMF-Net requires less time to finish the test on general lunar image patch datasets. Since the real-time performance was not a main focus of our report, the two networks were tested on the whole general test dataset and the rough times required by each were recorded to verify the analysis. L2AMF-Net required about 21 s and MatchNet (2channel) required about 130 s, which was about six times that of L2AMF-Net. Thus, L2AMF-Net performed better than the metric learning methods.
In summary, L2AMF-Net had the best performance compared with other traditional and deep learning methods.

4.3. Robustness Testing

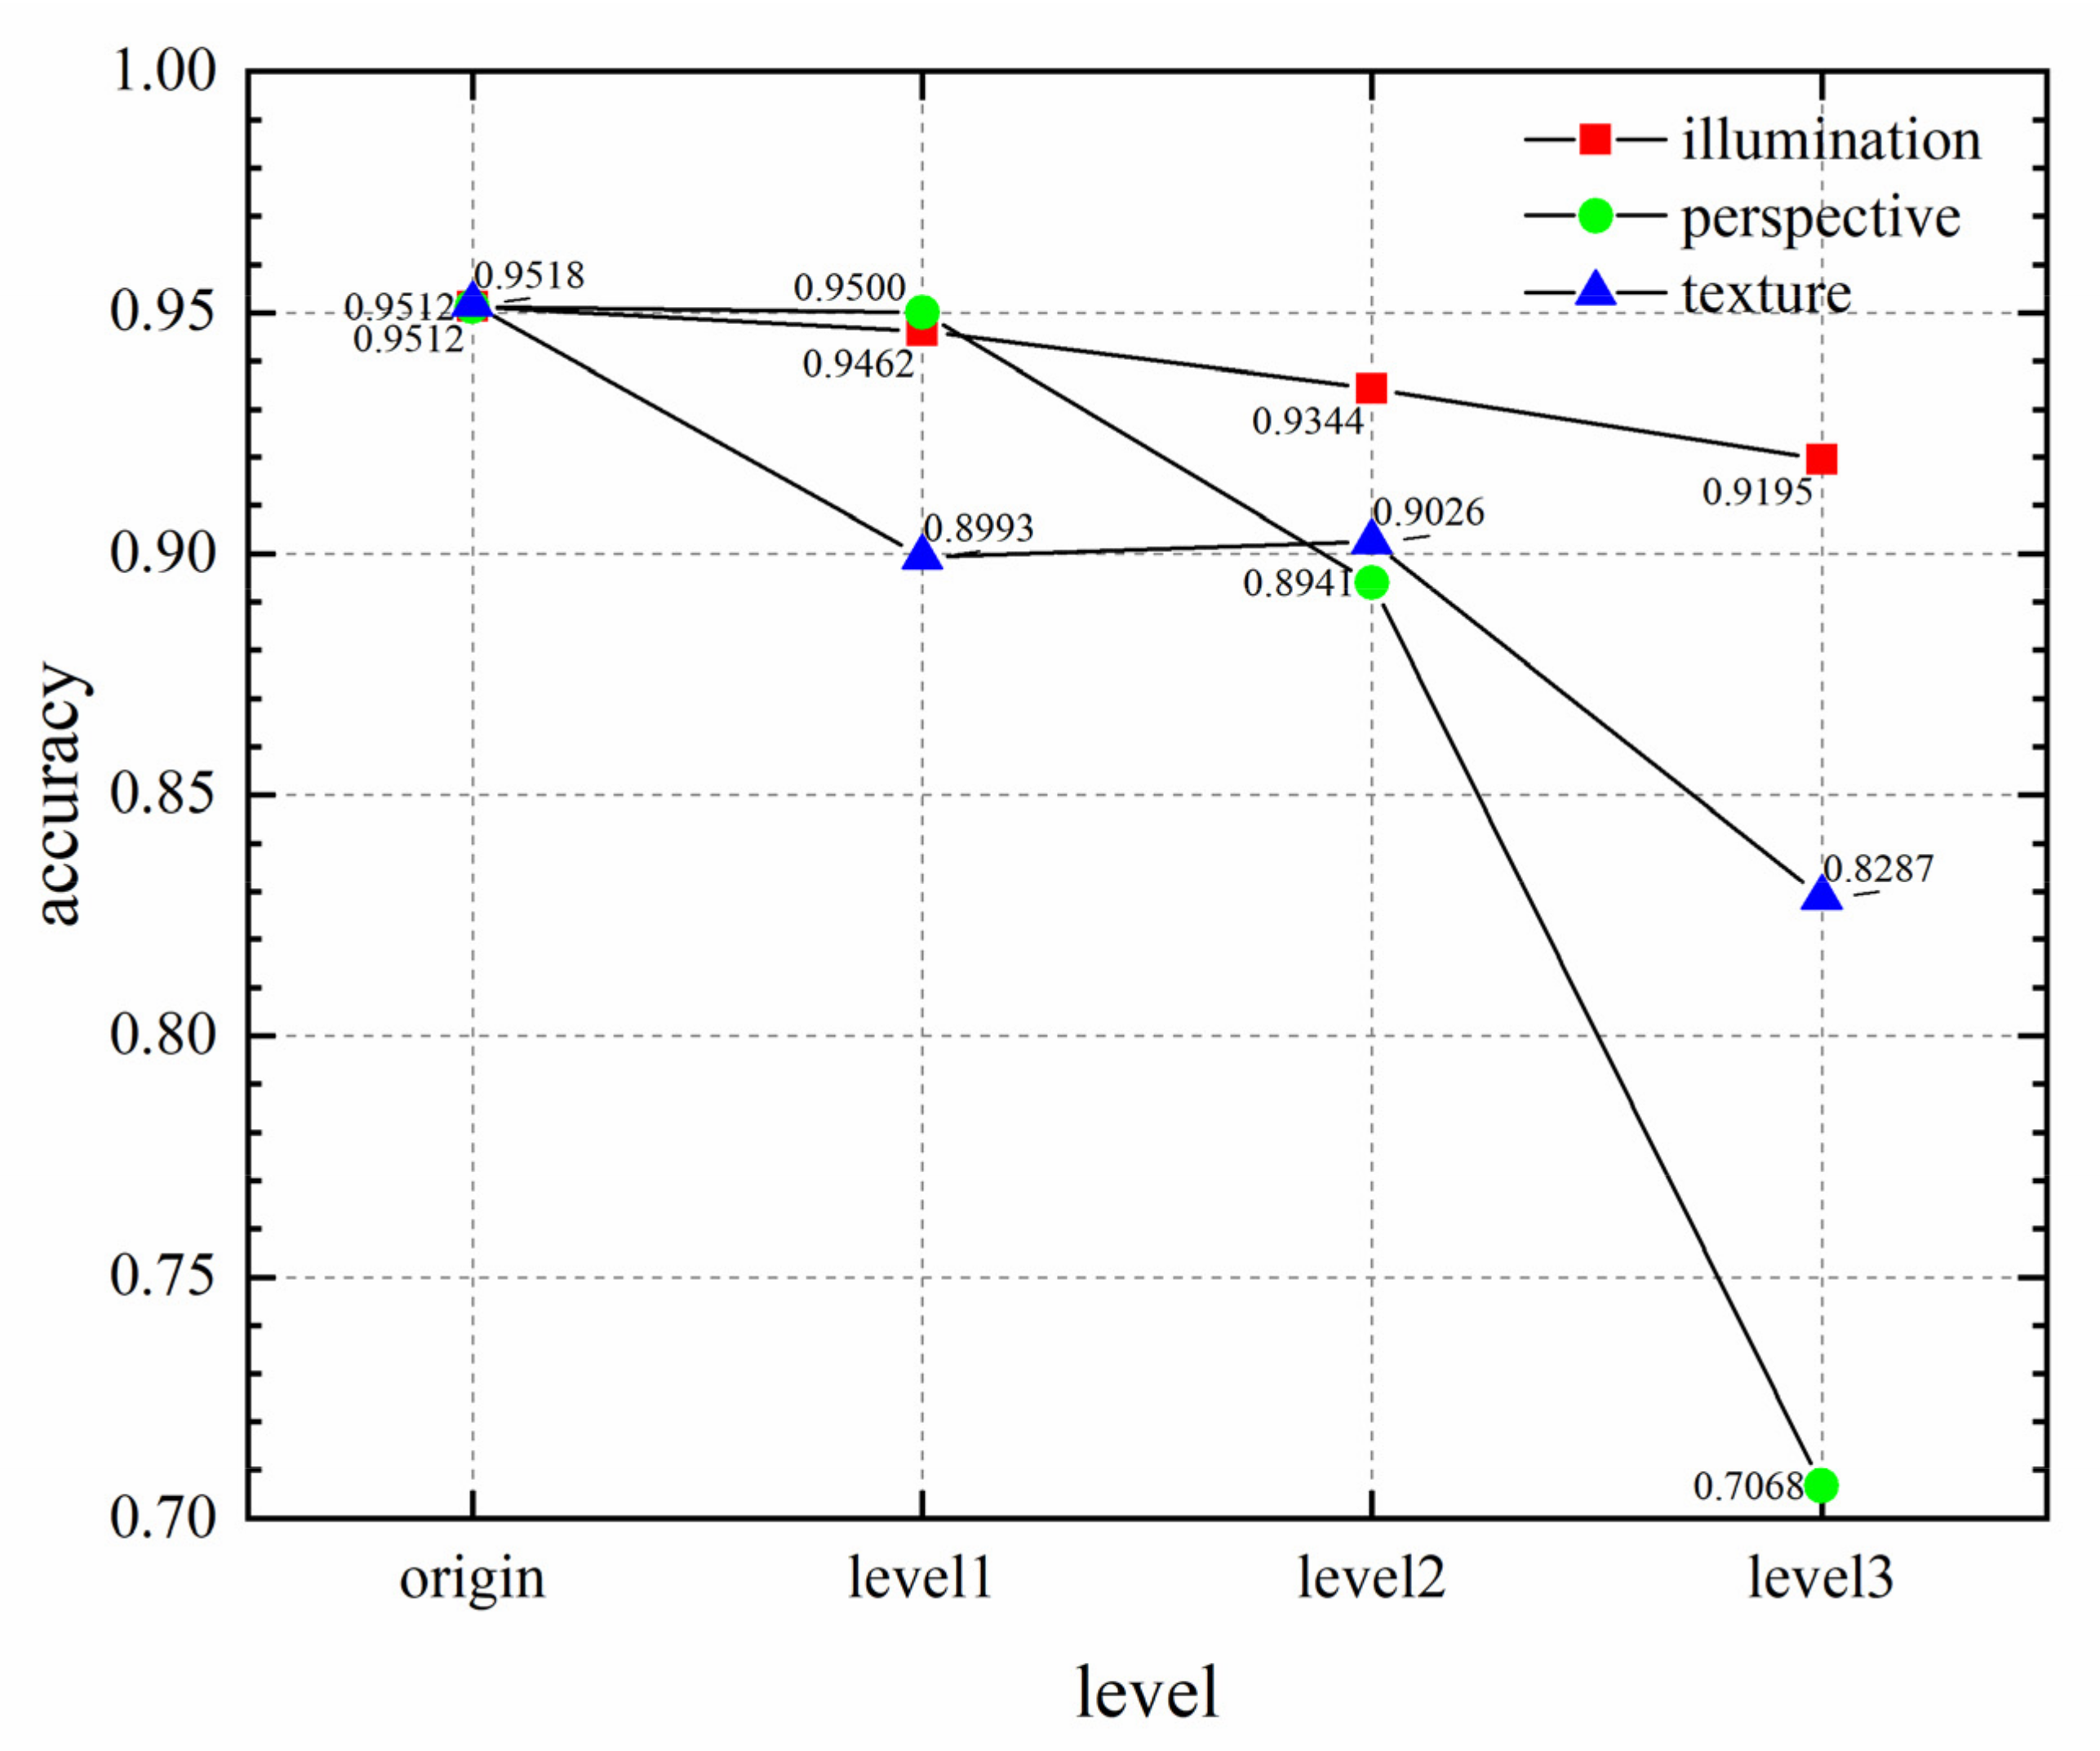
Since the application background of TRN for EDL, the robustness under more extreme imaging and matching conditions is another important aspect required testing, L2AMF-Net was tested on the robustness dataset to analyze its illumination, perspective, and texture robustness under more extreme imaging and matching conditions of the LCAM. The matching accuracy is shown in Figure 6.

4.3.1. Illumination Robustness

In the data of the level1 part, the brightness of the dark areas increased and the ranges of bright areas expanded. The contrast of the patches decreased, but the test accuracy only dropped by about 0.51%. In the data of the level2 part, the brightness further increased and the contrast further decreased. The test accuracy further dropped by about 1.2%. In the data of the level3 part, the patches were imaged under strong exposure conditions. Most of the lunar areas were uniformly white, and the texture disappeared. The grayscale of the patches was significantly affected, and the test accuracy dropped by about 3.2% but was still greater than 90%. In summary, L2AMF-Net had strong stability in patch matching when the illumination changed. It could maintain high matching accuracy under extreme illumination conditions and effectively meet the requirements of lunar patch matching under variable-illumination conditions. Thus, L2AMF-Net has strong illumination robustness.

4.3.2. Perspective Robustness

For the perspective robustness dataset, the degree of distortion of the patches imaged from the same lunar area continued to increase, and the imaging direction gradually deviated from the normal direction. In the data of the level1 part, the LCAM patch was imaged in the direction slightly approaching to the bottom right and had a certain degree of distortion. The test accuracy dropped by only about 0.12%. In the data of the level2 part, the top left image area substantially approached the LCAM, and there was significant stretching and deformation. The test accuracy was greatly affected and dropped by about 5.6% but still remained near 90%. In the data of the level3 part, the imaging direction of the LCAM patch deviated to the top right and nearly parallel to the lunar surface. The image patch was strongly distorted and had drastic changes in the grayscale compared with the patch of the origin part. This was the most extreme LCAM imaging with a generally impossible spacecraft attitude. The test accuracy sharply dropped by about 20% but still remains greater than 70%. In summary, L2AMF-Net maintained a high accuracy and strong robustness within a large range of imaging directions. It is sufficient to meet the requirements of lunar image patch matching for a general spacecraft attitude. Under the most extreme conditions, L2AMF-Net still maintained a certain degree of patch matching ability. This reflected the superior performance of L2AMF-Net.

4.3.3. Texture Robustness

As the down-sampling ratio of the MAP patches continued to increase, the large significant terrain features in the local areas, such as craters, were further blurred and lost partially. Only terrain features spanning a large range, such as mountains, were retained. The down-sampling ratio led to the randomness of the grayscale in the local areas of the patches. Thus, the grayscale of patches imaged from the same lunar area had significant differences, which increased the matching difficulty. In the results of the texture robustness experiment, the test accuracy for the data of the level1 part dropped by about 5.2% compared to that for the data of the origin part and had nearly the same performance for the data of the level2 part, but the two still remained near 90%. The accuracy for the data of the level3 part further dropped by about 7.4%, with an accuracy of greater than 80%. In summary, significant differences in the grayscale and texture had a certain degree of impact on the matching performance. However, within a certain range of down-sampling ratios, L2AMF-Net maintained a high matching accuracy and a certain degree of stability. It could effectively meet the requirements of variable-texture conditions and had strong robustness. As for more extreme texture conditions, L2AMF-Net dropped its accuracy sharply but maintained a relatively high patch matching ability. This reflected the superior performance of L2AMF-Net.
In summary, L2AMF-Net had the strongest robustness in illumination, and the test accuracy remained greater than 90%. L2AMF-Net had the second strongest robustness in texture, and the test accuracy remained near 90% within a certain range of down-sampling ratio and more than 80% under the extreme conditions. The perspective had the strongest impact on L2AMF-Net, but the test accuracy could remain at about 90% for a large range of imaging directions, effectively meeting the requirements of actual lunar image patch matching.

4.4. Ablation Study

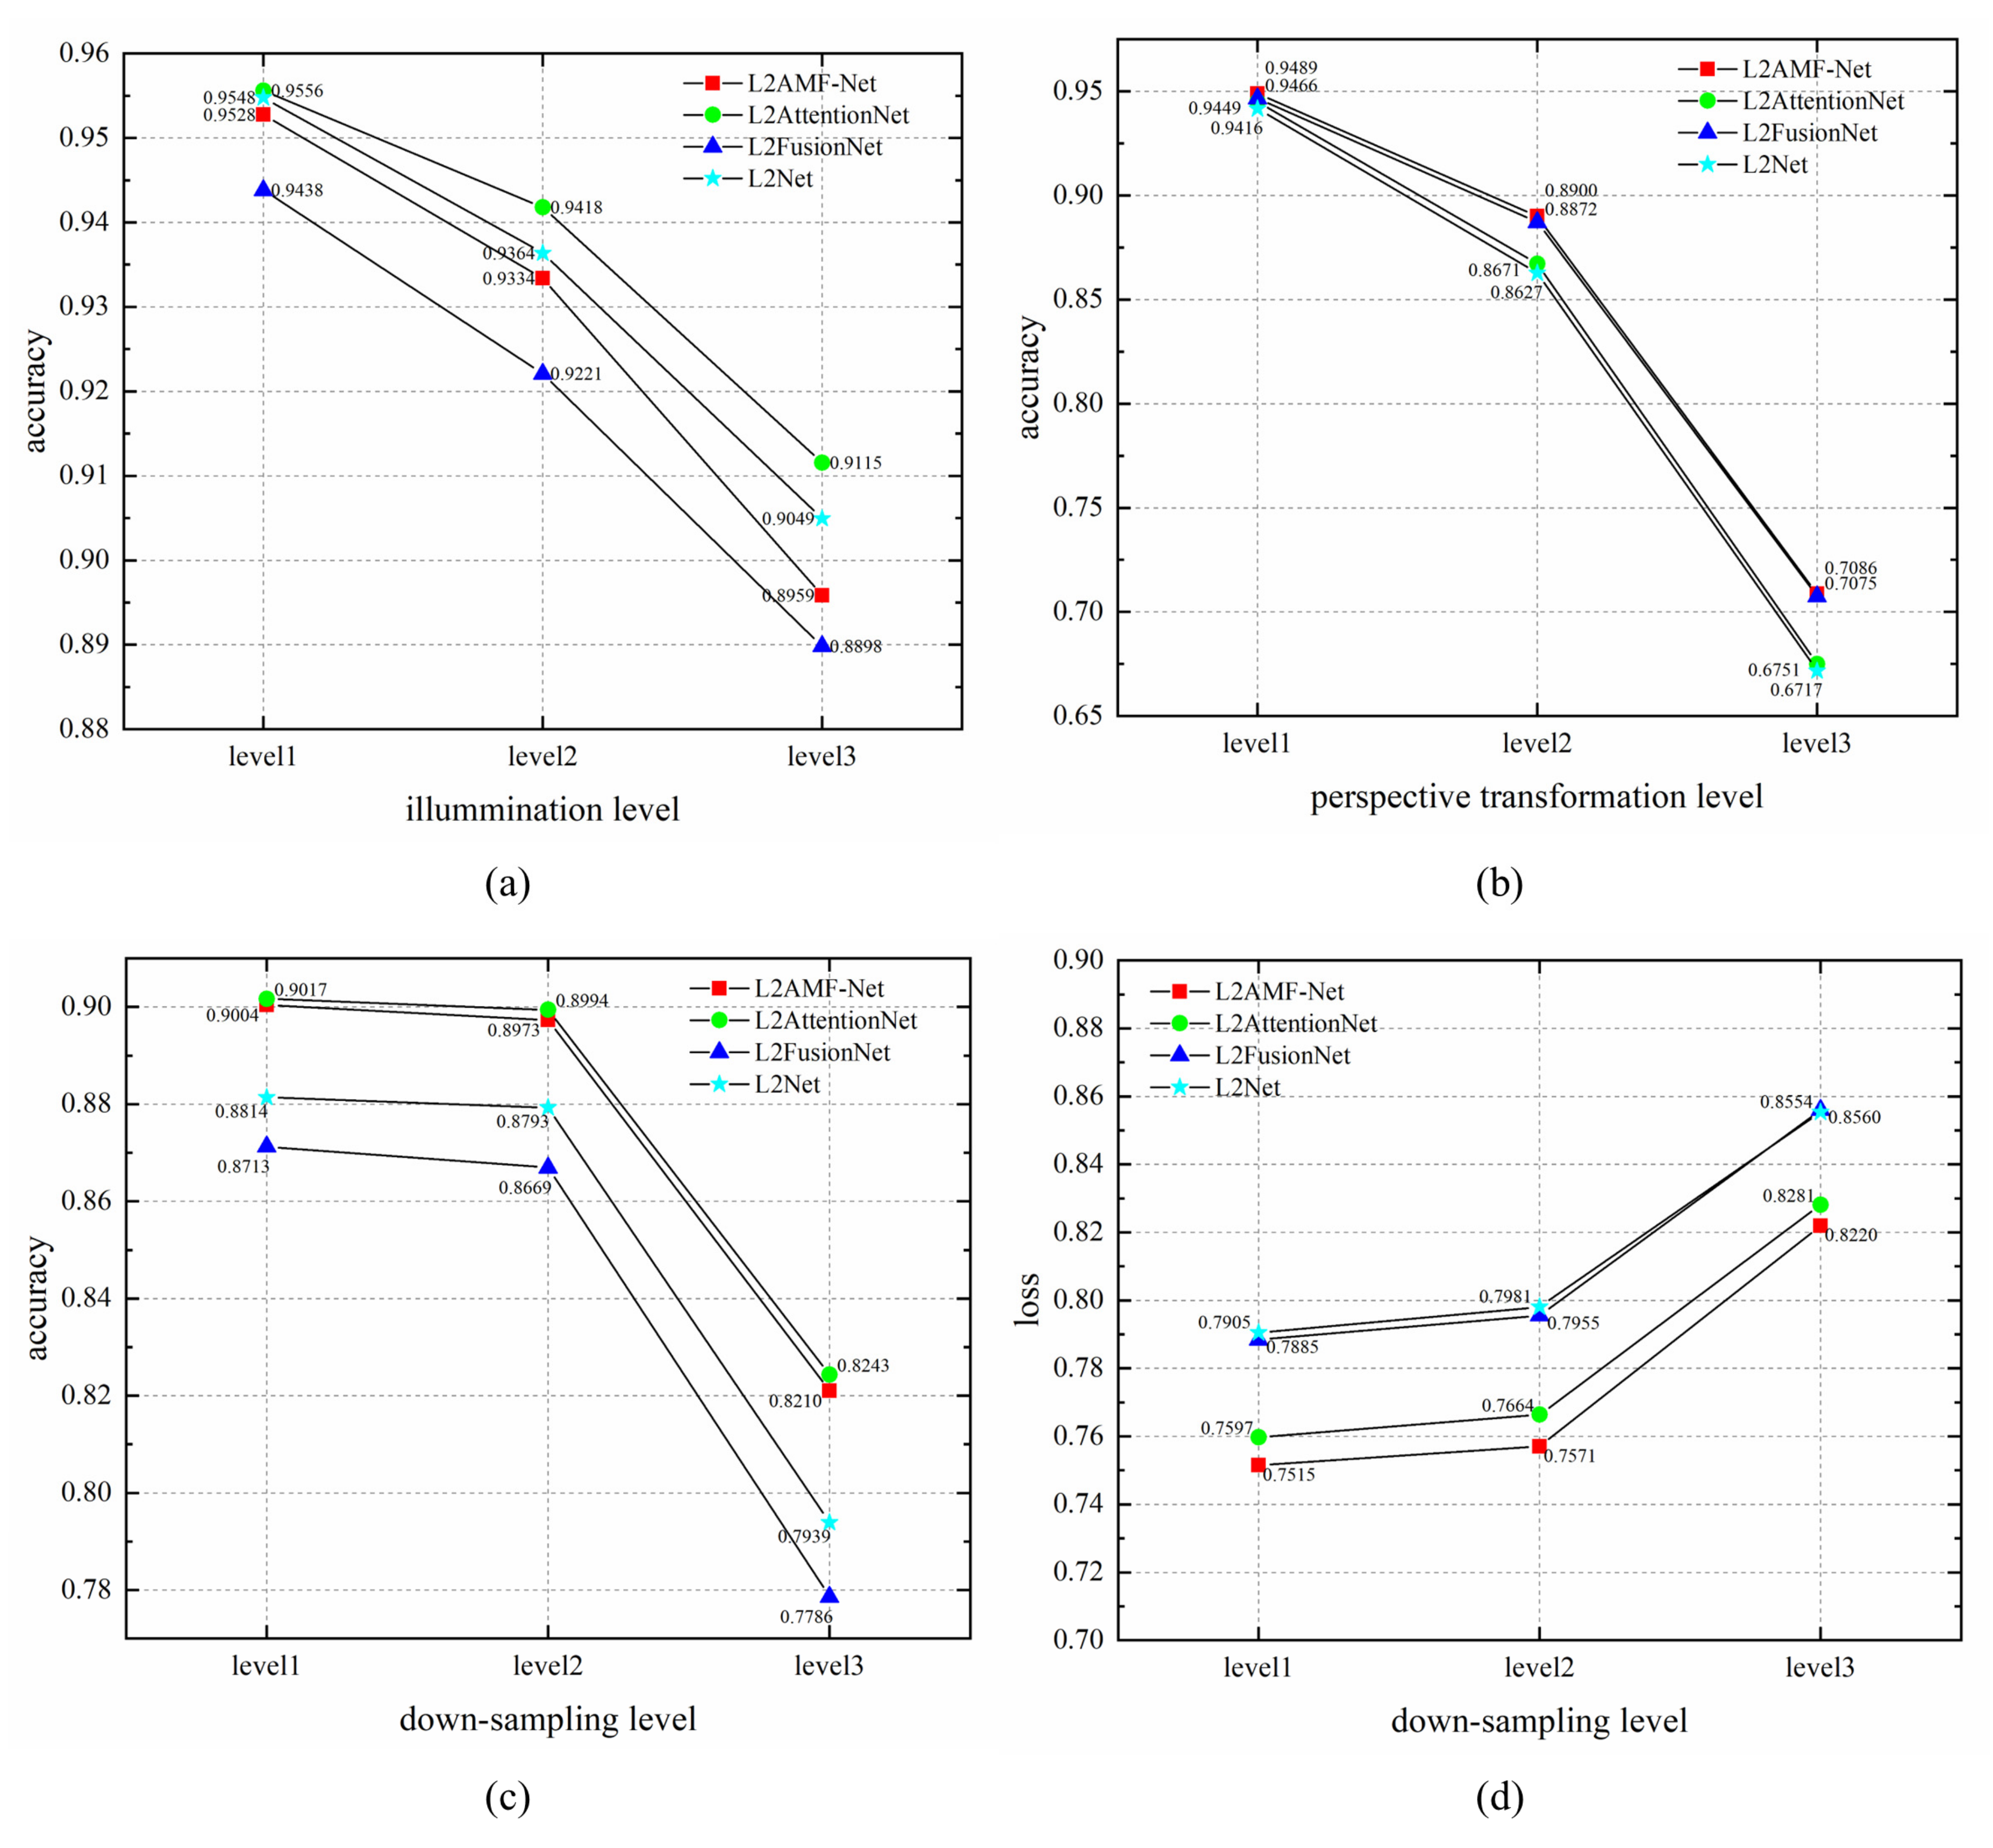
To verify the validity of LAU and SFES, L2AMF-Net, L2AttentionNet, L2FusionNet, and L2-Net were trained and tested on general dataset. The results are shown in Table 3. In addition, the four models were also tested on the robustness dataset, and the results are shown in Figure 7. The dimension of the output descriptors of all the models remained the same at 160D, while that of L2AMF-Net in Section 4.2 was 320D. To be noticed, as L2-Net served as a baseline here, it was trained with the triplet loss, while L2-Net (relative loss) in Section 4.2 was trained with the original relative loss.

4.4.1. L2-Attention Unit

According to Table 3, compared with L2-Net, L2AttentionNet had improvements in the test loss and accuracy of about 0.028 and 0.6%, respectively. Compared with L2FusionNet, L2AMF-Net had improvements in the test loss and accuracy of about 0.032 and 0.4%, respectively. This indicated the LAU was effective in improving the matching accuracy of lunar image patches and enhancing the discriminability of mismatched descriptor pairs. That was because the feature weighting of the attention module could stress the significant features and weaken the emphasis on general or useless features.
According to Figure 7a, for illumination robustness, the test accuracy of L2AMF-Net was about 0.9%, 1.1%, and 0.6% higher than that of L2FusionNet for the data of level1, level2, and level3 parts, respectively. The test accuracy of L2AttentionNet was about 0.08%, 0.54%, and 0.66% higher than that of L2-Net for the data of level1, level2, and level3 parts, respectively. This indicated the validity of the LAU for enhancing the illumination robustness. This was because the feature weighting of the attention module could balance the difference of the response between areas under different illumination conditions and increase the ratio of large significant terrains in the spatial dimension, yielding better stability of the grayscale when the illumination changed. It could also enhance the illumination-invariant features in the channel dimension.
According to Figure 7b, for perspective robustness, the test accuracy of L2AMF-Net was about 0.24%, 0.29%, and 0.12% higher than that of L2FusionNet for the data of level1, level2, and level3 parts, respectively. The test accuracy of L2AttentionNet was about 0.32%, 0.45%, and 0.34% higher than that of L2-Net for the data of level1, level2, and level3 parts, respectively. This indicated the validity of the LAU for enhancing the perspective robustness. This was because the attention module could correct patches to the similar imaging directions to balance the difference of the response and increase the ratio of small significant terrain in the spatial dimension, which had smaller differences under large perspective differences compared to larger terrain features, such as craters and mountains. It played the same role in the channel dimension.
According to Figure 7c, for texture robustness, the test accuracy of L2AMF-Net was about 2.9%, 3.1%, and 4.3% higher than that of L2FusionNet for the data of level1, level2, and level3 parts, respectively. The test accuracy of L2AttentionNet was about 2.0%, 2.0%, and 3.1% higher than that of L2-Net for the data of level1, level2, the level3 parts, respectively. The improvement in accuracy increased with the increase in the down-sampling ratio. This indicated the significant validation of the LAU for enhancing the texture robustness and with a lack of texture, the validity was more significant. This was because the attention module could make the feature extraction stress the significant terrain, such as craters and mountains, and weaken the emphasis on general terrain, such as plains, in the spatial dimension. In the channel dimension, it could enhance the global features, such as the grayscale distribution, and the edge distribution, and weaken the emphasis on local features, such as edges, and contours. Fusing more global features could increase the discriminability of the descriptors and reduce the impact of texture blurring and losing resulting from down-sampling of the MAP patches.

4.4.2. Multi-Scale Feature Self and Fusion Enhance Structure

According to Table 3, compared with L2-Net, L2FusionNet had improvements in the test loss and accuracy of about 0.031 and 0.5%, respectively. Compared with L2AttentionNet, L2AMF-Net had significant difference in the test loss and accuracy of about 0.035 and 0.3%, respectively. This indicated the validity of the SFES. This was because the SFES could make full use of both shallow features, such as contours and edges, and abstract features, such as semantic information, to make the information of the descriptors more complex and sufficient, enhancing the discriminability of the descriptors.
According to Figure 7b, for perspective robustness, the test accuracy of L2AMF-Net was about 0.41%, 2.3%, and 3.3% higher than that of L2AttentionNet for the data of level1, level2, and level3 parts, respectively. The test accuracy of L2FusionNet was about 0.5%, 2.5%, and 3.6% higher than that of L2-Net for the data of level1, level2, and level3 parts, respectively. The improvement in accuracy increased with the degree of perspective transformation. This indicated the significant validity of the SFES for enhancing the perspective robustness, and the greater the degree of the perspective transformation was, the more significant the validity was. This was because some shallow features had high stability when the imaging direction changed, including grayscale, edges, and gradients. Some abstract features were also invariant to perspective transformations, such as the number, size, and distribution of craters. After merging multi-scale features and weighting features in the channel dimension through a channel attention, the proportion of the features invariant to the perspective in the descriptors increased, and the perspective robustness enhanced.
In conclusion, on the one hand, as a component of L2AMF-Net, LAU proved to have improvements in matching accuracy of 0.6% and 0.4% respectively on L2-Net and L2FusionNet. And LAU can enhance the illumination, perspective and texture robustness of 1.1%, 0.45%, 4.3% at maximum, respectively. The validity of LAU had been verified. On the other hand, as another component of L2AMF-Net, SFES also proved to have improvements in matching accuracy of 0.5% and 0.3% respectively on L2-Net and L2AttentionNet. And SFES can enhance the perspective robustness of 3.6% at maximum. The validity of SFES had also been verified.

4.5. Further Discussion

In this section, the characteristics of L2AMF-Net are further discussed. On the one hand, the test batch size influenced the matching accuracy based on the performance metrics discussed in Section 2.1. On the other hand, the patch size directly determined how many features the descriptors could contain, also influencing the matching accuracy. The results of the batch size and patch size characteristic experiments are shown in Figure 8, and the detailed analyses are presented below.

4.5.1. Batch Size Characteristics

The batch sizes in the test experiments were set to 16, 32, 64, 128, 256, 512, and 1024, and results are shown in Figure 8a. The larger batch size led to more matching candidates in the mini-batch and greater matching difficulty, so the test accuracy was lower and the test loss was larger. For the test accuracy, the decreases were about 0.9%, 1.0%, 0.88%, 0.65%, 0.6%, and 0.75%. This indicated that the influence of the batch size on L2AMF-Net gradually weakened and trended to be stable. The test accuracy decreased within 1%, even if the batch size increased to 512. This indicated the high stability of the matching performance of L2AMF-Net. When the batch size was 1024, L2AMF-Net still maintained a high accuracy of 93.84%, indicating the strong robustness of L2AMF-Net to the batch size. For the test loss, the above analyses and conclusions still held.
The general LCAM image was 2048 × 2048. When the lunar image patches were segmented to 128 × 128, the batch size was 256, and L2AMF-Net had a high matching accuracy of 95.18%. This could fully meet the requirements of lunar image patch matching in the TRN for EDL.

4.5.2. Patch Size Characteristics

Seven datasets with patch sizes of 32 × 32, 48 × 48, 64 × 64, 96 × 96, 128 × 128, 196 × 196, and 256 × 256 were generated from the same materials as those of the general dataset based on the same settings, and the first LCAM patches in each test dataset are shown in Figure 9. The patch sizes are illustrated above each patch, and the red rectangle in one patch corresponds to the same lunar surface as the next patch. When the patch was too small, the texture was insufficient, which could lead to low matching accuracy. When the patch size increased, the number of significant terrain features, such as craters, mountains, and gullies, increased, and the texture information was richer. This could lead to increased accuracy. However, if the patch was too large, the proportion of significant terrain would decrease, and that of areas that lack texture, such as plains, would increase. This could cause the accuracy to drop. L2AMF-Net was trained and tested on seven datasets, and the results are shown in Figure 8b.
For the test accuracy, as the patch size increased, the accuracy improved continuously. This indicated when the patches contained more information, the matching was easier. However, when patch size increased from 196 to 256, the accuracy dropped by 0.37%. This verified the analysis that too large a patch would cause the accuracy to drop. For the test loss, the minimum value was 0.6120 when the patch size was 128, and it had a significant difference of greater than 0.05. This indicated that too large or small of a patch size would enhance the similarity between mismatched patch pairs and reduce the differences of distances between matched descriptor pairs and mismatched pairs. In summary, balancing the accuracy and loss, L2AMF-Net had the best performance when the patch size of the dataset was 128 × 128.

5. Conclusions

In order to make up for the gap of research on patch matching methods in the TRN for EDL and address the four difficulties of effective lunar patch matching, an L2 -normed attention and multi-scale fusion network (L2AMF-Net) was proposed for patch descriptor learning to achieve lunar image patch matching accurately and robustly. L2AMF-Net was trained with a triplet loss and hard negative mining strategy. AN L2 -Attention Unit (LAU) was proposed to generate attention score maps in spatial and channel dimensions and enhance feature extraction. A multi-scale feature self and fusion enhance structure (SFES) was proposed to fuse multi-scale features and enhance the feature representations. To simulate the actual imaging and matching conditions of LCAM, large-scale lunar image patch datasets were generated from the lunar global map with a 7m resolution obtained by Chang’E-2. L2AMF-Net achieved the best matching accuracy of 95.57% accuracy when the batch size was 128 compared with other traditional and deep learning methods. Robustness experiments verified the illumination, perspective, and texture robustness of L2AMF-Net. An ablation study verified the validity of LAU and SFES for improving the matching accuracy, which were about 0.5% and 0.4% on average, respectively. The LAU could effectively enhance the illumination, perspective, and texture robustness. The SFES enhanced perspective robustness significantly, with a greater than 3% increase in accuracy. The influences of the batch size and patch size on L2AMF-Net were also studied and discussed. L2AMF-Net had high stability and strong matching accuracy robustness to the batch size and maintained a high accuracy of 93.84% when the batch size was 1024. L2AMF-Net had the best matching performance when the patch size was 128. The research in this paper forms a foundation for the deep learning methods of patch matching in the TRN for EDL and provides a new effective method for position estimation and navigation in the EDL of spacecraft. It has theoretical significance and application value.

Author Contributions

W.Z., Y.M. and J.J. conceived the idea; W.Z. designed the network and performed the experiments; W.Z., Y.M. and J.J. analyzed the results; W.Z. wrote the paper; J.J. and Y.M. offered comments and supervised the paper. All authors have read and agreed to the published version of the manuscript.

Funding

This research was supported by the National Natural Science Foundation of China (NSFC) under grant number 61725501.

Data Availability Statement

The lunar image patch dataset is generated from the DOM-7m dataset of Chang’E-2, which could be applied for researches. The lunar image patch dataset generated in this paper is not permitted to be public.

Acknowledgments

This work was supported by the Key Laboratory of Precision Opto-mechatronics Technology, Ministry of Education, Beihang University, China. The authors would like to thank the Lunar and Deep Space Exploration Scientific Data and Sample Release System for providing the DOM-7m dataset of Chang’E-2.

Conflicts of Interest

The authors declare no conflict of interest.

References

  1. Johnson, A.; Aaron, S.; Chang, J.; Cheng, Y.; Montgomery, J.; Mohan, S.; Schroeder, S.; Tweddle, B.; Trawny, N.; Zheng, J. The lander vision system for mars 2020 entry descent and landing. In Proceedings of the AAS Guidance Navigation and Control Conference, Breckenridge, CO, USA, 2–8 February 2017. [Google Scholar]
  2. Johnson, A.E.; Montgomery, J.F. Overview of terrain relative navigation approaches for precise lunar landing. In Proceedings of the IEEE Aerospace Conference, Big Sky, MT, USA, 1–8 March 2008. [Google Scholar]
  3. Liu, J.; Ren, X.; Yan, W.; Li, C.; Zhang, H.; Jia, Y.; Zeng, X.; Chen, W.; Gao, X.; Liu, D.; et al. Descent trajectory reconstruction and landing site positioning of Chang’E-4 on the lunar farside. Nat. Commun. 2019, 10, 4229. [Google Scholar] [CrossRef] [Green Version]
  4. Wouter, D. Autonomous Lunar Orbit Navigation with Ellipse R-CNN. Master’s Thesis, Delft University of Technology, Delft, The Netherlands, 7 July 2021. [Google Scholar]
  5. Downes, L.; Steiner, T.J.; How, J.P. Deep learning crater detection for lunar terrain relative navigation. In Proceedings of the AIAA SciTech 2020 Forum, Orlando, FL, USA, 6 January 2020. [Google Scholar]
  6. Silburt, A.; Ali-Dib, M.; Zhu, C.; Jackson, A.; Valencia, D.; Kissin, Y.; Tamayo, D.; Menou, K. Lunar crater identification via deep learning. Icarus 2019, 317, 27–38. [Google Scholar] [CrossRef] [Green Version]
  7. Downes, L.M.; Steiner, T.J.; How, J.P. Lunar terrain relative navigation using a convolutional neural network for visual crater detection. In Proceedings of the American Control Conference, Denver, CO, USA, 1–3 July 2020. [Google Scholar]
  8. Lu, T.; Hu, W.; Liu, C.; Yang, D. Relative pose estimation of a lander using crater detection and matching. Opt. Eng. 2016, 55, 023102. [Google Scholar] [CrossRef]
  9. Johnson, A.; Villaume, N.; Umsted, C.; Kourchians, A.; Sterberg, D.; Trawny, N.; Cheng, Y.; Geipel, E.; Montgomery, J. The Mars 2020 lander vision system field test. In Proceedings of the AAS Guidance Navigation and Control Conference, Breckenridge, CO, USA, 30 January–5 February 2020. [Google Scholar]
  10. Matthies, L.; Daftry, S.; Rothrock, B.; Davis, A.; Hewitt, R.; Sklyanskiy, E.; Delaune, J.; Schutte, A.; Quadrelli, M.; Malaska, M.; et al. Terrain relative navigation for guided descent on titan. In Proceedings of the IEEE Aerospace Conference, Big Sky, MT, USA, 7–14 March 2020. [Google Scholar]
  11. Mulas, M.; Ciccarese, G.; Truffelli, G.; Corsini, A. Integration of digital image correlation of Sentinel-2 data and continuous GNSS for long-term slope movements monitoring in moderately rapid landslides. Remote Sens. 2020, 12, 2605. [Google Scholar] [CrossRef]
  12. Li, Z.; Mahapatra, D.; Tielbeek, J.A.; Stoker, J.; van Vliet, L.J.; Vos, F.M. Image registration based on autocorrelation of local structure. IEEE Trans. Image Processing 2015, 35, 63–75. [Google Scholar] [CrossRef]
  13. Ma, J.; Jiang, X.; Fan, A.; Jiang, J.; Yan, J. Image matching from handcrafted to deep features: A survey. Int. J. Comput. Vis. 2021, 129, 23–79. [Google Scholar] [CrossRef]
  14. Lowe, D.G. Object recognition from local scale-invariant features. In Proceedings of the Seventh IEEE International Conference on Computer Vision, Kerkyra, Greece, 20–25 September 1999. [Google Scholar]
  15. Bay, H.; Tuytelaars, T.; Gool, L.V. Surf: Speeded up robust features. In Proceedings of the European Conference on Computer Vision, Graz, Austria, 7–13 May 2006. [Google Scholar]
  16. Tola, E.; Lepetit, V.; Fua, P. Daisy: An Efficient Dense Descriptor Applied to Wide-baseline Stereo. IEEE Trans. Pattern Anal. Mach. Intell. 2009, 32, 815–830. [Google Scholar] [CrossRef] [Green Version]
  17. Rublee, E.; Rabaud, V.; Konolige, K.; Bradski, G. ORB: An efficient alternative to SIFT or SURF. In Proceedings of the IEEE International Conference on Computer Vision, Barcelona, Spain, 6–13 November 2011. [Google Scholar]
  18. Leutenegger, S.; Chli, M.; Siegwart, R.Y. BRISK: Binary Robust Invariant Scalable Keypoints. In Proceedings of the IEEE International Conference on Computer Vision, Barcelona, Spain, 6–13 November 2011. [Google Scholar]
  19. Alahi, A.; Ortiz, R.; Vandergheynst, P. Freak: Fast Retina Keypoint. In Proceedings of the IEEE Conference on Computer Vision and Pattern Recognition, Providence, RI, USA, 18–20 June 2012. [Google Scholar]
  20. Xi, J.; Ersoy, O.K.; Cong, M.; Zhao, C.; Qu, W.; Wu, T. Wide and Deep Fourier Neural Network for Hyperspectral Remote Sensing Image Classification. Remote Sens. 2022, 14, 2931. [Google Scholar] [CrossRef]
  21. Qing, Y.; Liu, W.; Feng, L.; Gao, W. Improved YOLO Network for Free-Angle Remote Sensing Target Detection. Remote Sens. 2021, 13, 2171. [Google Scholar] [CrossRef]
  22. Manos, E.; Witharana, C.; Udawalpola, M.R.; Hasan, A.; Liljedahl, A.K. Convolutional Neural Networks for Automated Built Infrastructure Detection in the Arctic Using Sub-Meter Spatial Resolution Satellite Imagery. Remote Sens. 2022, 14, 2719. [Google Scholar] [CrossRef]
  23. Chen, Y.; Jiang, J. A Two-Stage Deep Learning Registration Method for Remote Sensing Images Based on Sub-Image Matching. Remote Sens. 2021, 13, 3443. [Google Scholar] [CrossRef]
  24. Khorrami, B.; Valizadeh Kamran, K. A fuzzy multi-criteria decision-making approach for the assessment of forest health applying hyper spectral imageries: A case study from Ramsar forest, North of Iran. Int. J. Eng. Geosci. 2022, 7, 214–220. [Google Scholar] [CrossRef]
  25. Jiang, Z.; Zhang, J.; Ma, Y.; Mao, X. Hyperspectral Remote Sensing Detection of Marine Oil Spills Using an Adaptive Long-Term Moment Estimation Optimizer. Remote Sens. 2022, 14, 157. [Google Scholar] [CrossRef]
  26. Song, K.; Cui, F.; Jiang, J. An Efficient Lightweight Neural Network for Remote Sensing Image Change Detection. Remote Sens. 2021, 13, 5152. [Google Scholar] [CrossRef]
  27. Cui, F.; Jiang, J. Shuffle-CDNet: A Lightweight Network for Change Detection of Bitemporal Remote-Sensing Images. Remote Sens. 2022, 14, 3548. [Google Scholar] [CrossRef]
  28. Furano, G.; Meoni, G.; Dunne, A.; Moloney, D.; Ferlet-Cavrois, V.; Tavoularis, A.; Byrne, J.; Buckley, L.; Psarakis, M.; Voss, K.-O.; et al. Towards the use of artificial intelligence on the edge in space systems: Challenges and opportunities. IEEE Aerosp. Electron. Syst. Mag. 2020, 35, 44–56. [Google Scholar] [CrossRef]
  29. Keller, M.; Chen, Z.; Maffra, F.; Schmuck, P.; Chli, M. Learning deep descriptors with scale-aware triplet networks. In Proceedings of the IEEE Conference on Computer Vision and Pattern Recognition, Salt Lake City, UT, USA, 18–22 June 2018. [Google Scholar]
  30. Simo-Serra, E.; Trulls, E.; Ferraz, L.; Kokkinos, I.; Fua, P.; Moreno-Noguer, F. Discriminative learning of deep convolutional feature point descriptors. In Proceedings of the IEEE International Conference on Computer Vision, Santiago, Chile, 7–13 December 2015. [Google Scholar]
  31. Wang, S.; Li, Y.; Liang, X.; Quan, D.; Yang, B.; Wei, S.; Jiao, L. Better and faster: Exponential loss for image patch matching. In Proceedings of the IEEE International Conference on Computer Vision, Seoul, Korea, 27 October–2 November 2019. [Google Scholar]
  32. Barz, B.; Denzler, J. Deep learning on small dataset without pre-training using cosine loss. In Proceedings of the IEEE Winter Conference on Applications of Computer Vision, Waikoloa, HI, USA, 2–5 March 2020. [Google Scholar]
  33. Regmi, K.; Shah, M. Bridging the domain gap for ground-to-aerial image matching. In Proceedings of the IEEE International Conference on Computer Vision, Seoul, Korea, 27 October–2 November 2019. [Google Scholar]
  34. Wang, X.; Zhang, S.; Lei, Z.; Liu, S.; Guo, X.; Li, S.Z. Ensemble soft-margin softmax loss for image classification. arXiv 2018, arXiv:1805.03922. [Google Scholar]
  35. Kumar, B.G.V.; Carneiro, G.; Reid, I. Learning local image descriptors with deep siamese and triplet convolutional networks by minimising global loss functions. In Proceedings of the IEEE Conference on Computer Vision and Pattern Recognition, Las Vegas, CA, USA, 26 June–1 July 2016. [Google Scholar]
  36. Tian, Y.; Yu, X.; Fan, B.; Wu, F.; Heijnen, H.; Balntas, V. Sosnet: Second order similarity regularization for local descriptor learning. In Proceedings of the IEEE Conference on Computer Vision and Pattern Recognition, Long Beach, CA, USA, 16–20 June 2019. [Google Scholar]
  37. Balntas, V.; Riba, E.; Ponsa, D.; Mikolajczyk, K. Learning local feature descriptors with triplets and shallow convolutional neural networks. In Proceedings of the British Machine Vision Conference, York, UK, 19–22 September 2016. [Google Scholar]
  38. Irshad, A.; Hafiz, R.; Ali, M.; Faisal, M.; Cho, Y.; Seo, J. Twin-net descriptor: Twin negative mining with quad loss for patch-based matching. IEEE Access 2019, 7, 136062–136072. [Google Scholar] [CrossRef]
  39. Han, X.; Leung, T.; Jia, Y.; Sukthankar, R.; Berg, A.C. Matchnet: Unifying feature and metric learning for patch-based matching. In Proceedings of the IEEE Conference on Computer Vision and Pattern Recognition, Boston, MA, USA, 7–12 June 2015. [Google Scholar]
  40. He, K.; Zhang, X.; Ren, S.; Sun, J. Deep residual learning for image recognition. In Proceedings of the IEEE Conference on Computer Vision and Pattern Recognition, Las Vegas, NV, USA, 26 June–1 July 2016. [Google Scholar]
  41. Huang, G.; Liu, Z.; Van Der Maaten, L.; Weinberger, K.Q. Densely connected convolutional networks. In Proceedings of the IEEE Conference on Computer Vision and Pattern Recognition, Honolulu, HI, USA, 21–26 July 2017. [Google Scholar]
  42. Rocco, I.; Arandjelović, R.; Sivic, J. Convolutional Neural Network Architecture for Geometric Matching. IEEE Transactions on Pattern Analysis and Machine Intelligence 2019, 41, 2553–2567. [Google Scholar] [CrossRef] [Green Version]
  43. Quan, D.; Liang, X.; Wang, S.; Wei, S.; Li, Y.; Huyan, N.; Jiao, L. AFD-Net: Aggregated feature difference learning for cross-spectral image patch matching. In Proceedings of the IEEE International Conference on Computer Vision, Seoul, Korea, 27 October–2 November 2019. [Google Scholar]
  44. Quan, D.; Wang, S.; Li, Y.; Yang, B.; Huyan, N.; Chanussot, J.; Hou, B.; Jiao, L. Multi-Relation Attention Network for Image Patch Matching. IEEE Trans. Image Processing 2021, 30, 7127–7142. [Google Scholar] [CrossRef]
  45. Zagoruyko, S.; Komodakis, N. Learning to compare image patches via convolutional neural networks. In Proceedings of the IEEE Conference on Computer Vision and Pattern Recognition, Boston, MA, USA, 7–12 June 2015. [Google Scholar]
  46. Tian, Y.; Fan, B.; Wu, F. L2-Net: Deep learning of discriminative patch descriptor in euclidean space. In Proceedings of the IEEE Conference on Computer Vision and Pattern Recognition, Honolulu, HI, USA, 21–26 July 2017. [Google Scholar]
  47. Noh, H.; Araujo, A.; Sim, J.; Weyand, T.; Han, B. Large-scale image retrieval with attentive deep local features. In Proceedings of the IEEE International Conference on Computer Vision, Venice, Italy, 22–29 October 2017. [Google Scholar]
  48. Zhang, Z.; Lan, C.; Zeng, W.; Jin, X.; Chen, Z. Relation-aware global attention for person re-identification. In Proceedings of the IEEE Conference on Computer Vision and Pattern Recognition, Seattle, WA, USA, 13–19 June 2020. [Google Scholar]
  49. Lin, T.Y.; Dollár, P.; Girshick, R.; He, K.; Hariharan, B.; Belongie, S. Feature pyramid networks for object detection. In Proceedings of the IEEE Conference on Computer Vision and Pattern Recognition, Honolulu, HI, USA, 21–26 July 2017. [Google Scholar]
  50. Mishchuk, A.; Mishkin, D.; Radenovic, F.; Matas, J. Working hard to know your neighbor’s margins: Local descriptor learning loss. In Proceedings of the Advances in Neural Information Processing Systems, Long Beach, CA, USA, 4–9 December 2017. [Google Scholar]
  51. Krizhevsky, A.; Sutskever, I.; Hinton, G.E. Imagenet classification with deep convolutional neural networks. In Proceedings of the Advances in Neural Information Processing Systems, Lake Tahoe, NV, USA, 3–6 December 2012. [Google Scholar]
  52. Woo, S.; Park, J.; Lee, J.Y.; Kweon, I.S. Cbam: Convolutional block attention module. In Proceedings of the European Conference on Computer Vision, Munich, Germany, 8–14 September 2018. [Google Scholar]
  53. Lunar and Deep Space Exploration Scientific Data and Sample Release System. Chang’E-2 CCD Stereoscopic Camera DOM-7m Dataset. Available online: http://moon.bao.ac.cn (accessed on 1 December 2021).
  54. Liu, J. Study on fast image template matching algorithm. Master’s Thesis, Central South University, Changsha, China, 1 March 2007. [Google Scholar]
  55. Zagoruyko, S.; Komodakis, N. Deep compare: A study on using convolutional neural networks to compare image patches. Comput. Vis. Image Underst. 2017, 164, 38–55. [Google Scholar] [CrossRef]
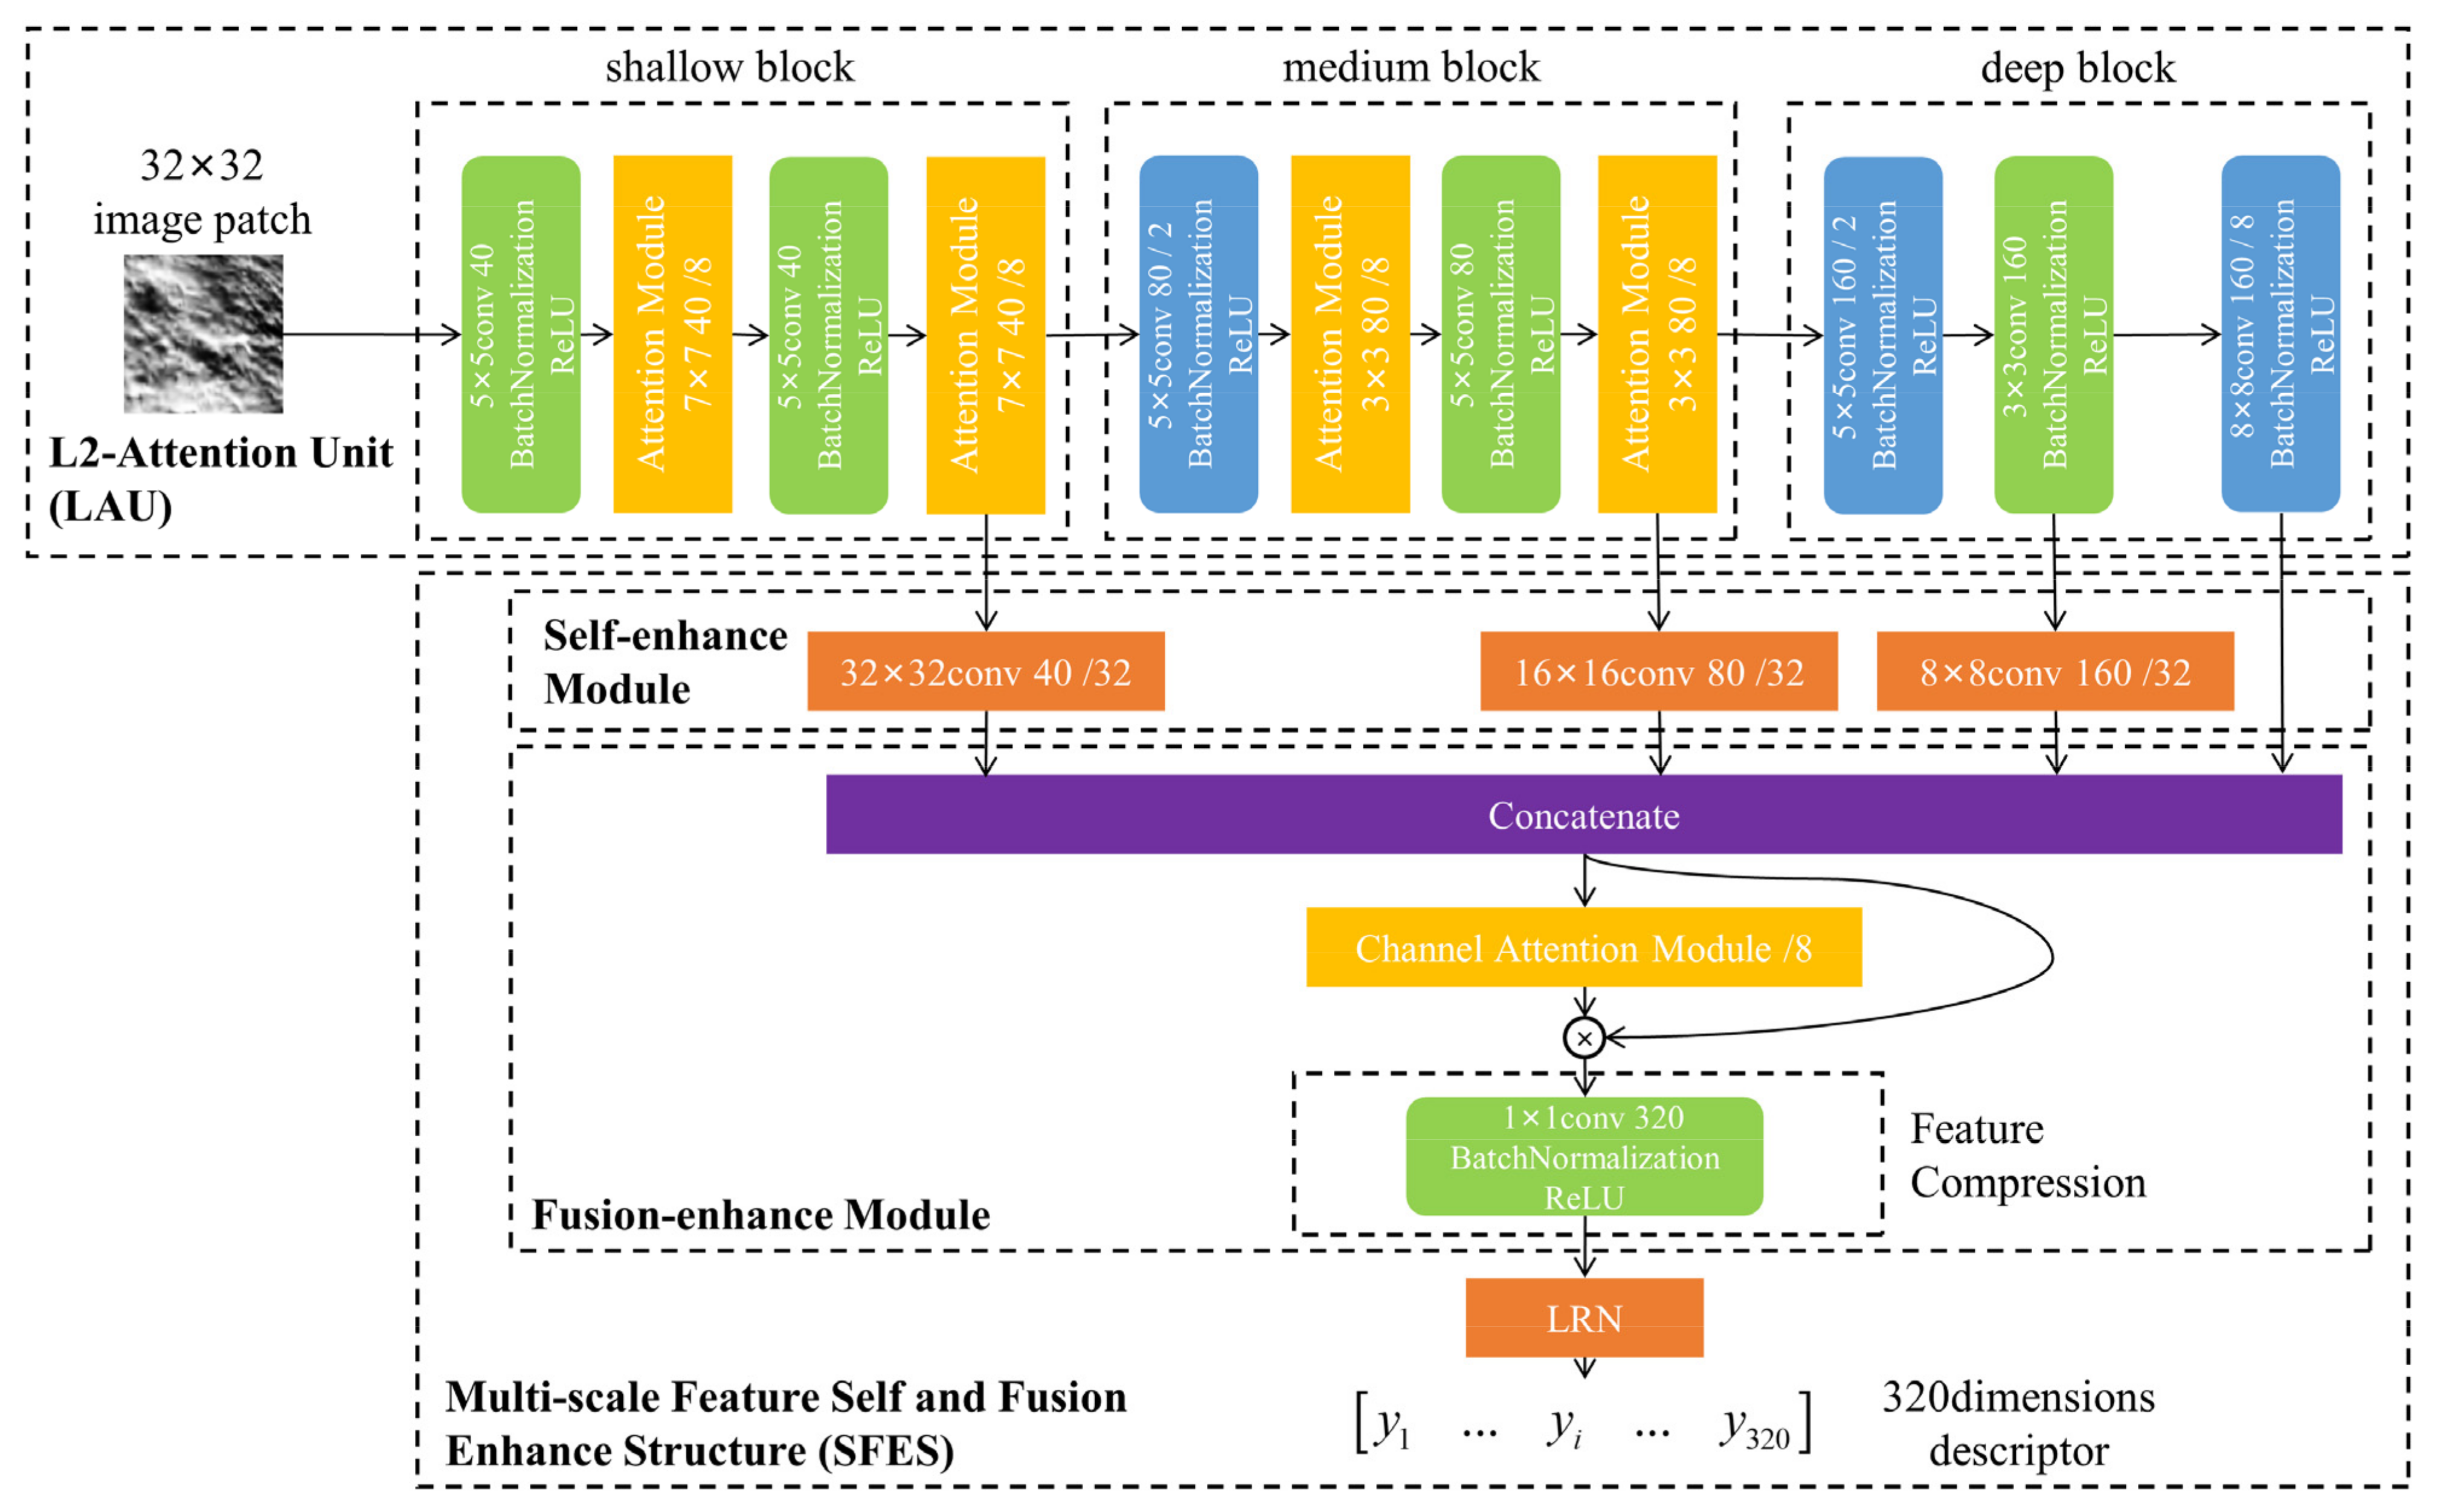
Figure 1. Network structure of L2AMF-Net.
Remotesensing 14 05156 g001
Figure 2. Network structure of L2-Net. It consists of seven basic blocks, divided into three blocks.
Remotesensing 14 05156 g002
Figure 3. Principle and internal structure of CBAM.
Remotesensing 14 05156 g003
Figure 4. Overall generation procedure of dataset. Each initial patch segmented from the lunar global map can generate a pair of matched LCAM and MAP patches. The blue stars represented four pixels of the initial LCAM patch and four corners of the new imaging plane from another viewing direction during perspective transformation.
Remotesensing 14 05156 g004
Figure 5. Samples of datasets. The left rectangle shows some samples of the general dataset. The origin patch was the initial LCAM patch segmented from the lunar global map after histogram equalization. Sample 1 and 2 were the results of the corresponding transformation. The right rectangle shows some samples of the robustness dataset. Based on the origin part, the patches in other parts were processed with corresponding transformations for different levels of the parameters such that the transformation degree was continuously enhanced.
Remotesensing 14 05156 g005
Figure 6. Matching accuracy tested on the robustness dataset. Each robustness dataset has four parts, whose details can be found in Section 3.2. The values in the first column belong to texture, perspective and illumination, respectively.
Remotesensing 14 05156 g006
Figure 7. The robustness comparison of ablation study tested on robustness dataset. (a) Matching accuracy comparison of illumination robustness; (b) Matching accuracy of perspective robustness; (c) Matching accuracy comparison of texture robustness; (d) Test loss comparison of texture robustness. The results in (a,b) were respectively tested on illumination and perspective robustness datasets. The results in (c,d) were tested on texture robustness dataset. The values of the first column in (b) belong to L2AMF-Net, L2FusionNet, L2AttentionNet and L2-Net, respectively.
Remotesensing 14 05156 g007
Figure 8. Results of batch size and patch size characteristic experiments. (a) Results of batch size characteristic experiment; (b) Results of patch size characteristic experiment. Both experimental results contained the test loss and test matching accuracy.
Remotesensing 14 05156 g008
Figure 9. Image patches with different patch sizes. The patch sizes are illustrated above each patch, and the red rectangle in one patch corresponds to the same lunar surface as the next patch.
Remotesensing 14 05156 g009
Table 1. Transformation parameters of different parts of the robustness dataset. The details of the parameters are discussed in Section 3.1.
Transformation Degree β < 1 β > 1 η α
origin1114–8 (random)
level10.71.40.69
level20.551.90.510
level30.42.40.411
Table 2. Test results of L2AMF-Net and other methods. The upper part contains the results of the traditional methods, and the lower part contains the results of the deep learning methods. The matching accuracy was calculated following the metric performances discussed in Section 2.1. The values in bold are the best.
MethodsTest Accuracy
template matching (CCOEFF, 128) [1,54]0.5429
template matching (CCORR, 128) [1,54]0.5408
template matching (NORMED CCOEFF, 64) [1,54]0.7227
template matching (NORMED CCORR, 64) [1,54]0.6852
SIFT (32) [14]0.2088
SURF (32) [15]0.2081
ORB (64) [17]0.0728
L2-Net (relative loss) [46]0.8896
HardNet (triplet loss) [50]0.9370
Siamese (hinge loss, base) [30]0.8694
Siamese (soft-margin loss, base) [34]0.4663
Siamese (cosine loss, base) [32]0.7262
Siamese (hinge loss, 2ch2stream) [55]0.8422
MatchNet (base) [39]0.9402
MatchNet (2channel) [39,55]0.9576
MatchNet (2ch2stream) [39,55]0.9398
L2AMF-Net0.9557
Table 3. Results of ablation study. The second and third columns indicate whether the networks had an LAU and a SFES. L2-Net trained with the triplet loss served as a baseline here. The values in bold are the best.
NetworkLAUSFESTest LossTest Accuracy
L2AMF-Net0.61730.9499
L2AttentionNet 0.65290.9468
L2FusionNet 0.64980.9457
L2-Net 0.68080.9408
Publisher’s Note: MDPI stays neutral with regard to jurisdictional claims in published maps and institutional affiliations.