Technical Note

Local-Scale Horizontal CO2 Flux Estimation Incorporating Differential Absorption Lidar and Coherent Doppler Wind Lidar

1
School of Earth and Space Science, University of Science and Technology of China, Hefei 230026, China
2
School of Atmospheric Physics, Nanjing University of Information Science and Technology, Nanjing 210044, China
3
Nanjing Taixin Co., Ltd., Nanjing 211899, China
4
National Laboratory for Physical Sciences at the Microscale, University of Science and Technology of China, Hefei 230026, China
5
Institute of Software, Chinese Academy of Sciences, Beijing 100190, China
*
Author to whom correspondence should be addressed.
Remote Sens. 2022, 14(20), 5150; https://doi.org/10.3390/rs14205150
Submission received: 7 September 2022 / Revised: 3 October 2022 / Accepted: 11 October 2022 / Published: 14 October 2022
(This article belongs to the Special Issue Stereoscopic Remote Sensing of Air Pollutants and Applications)

Abstract

:
A micro-pulse lidar system incorporating differential absorption lidar (DIAL) and coherent Doppler wind lidar (CDWL) is proposed and demonstrated. Due to the high signal-to-noise ratio (SNR) of the superconducting nanowire single-photon detector (SNSPD), the DIAL channel achieves high sensitivity in CO2 measurement. Meanwhile, the CDWL channel is used to obtain the horizontal wind field. In the process of the optimization and calibration of the DIAL receiver, specifically, mode scrambling and temperature control of the connecting fiber between the telescope and the SNSPD enhance the stability and robustness of the system. Horizontal scanning of the CO2 concentration and the wind field is carried out in a 6 km range over a scanning span of 60° with a radial resolution of 150 m and 15 s. The results show that the hybrid lidar system captures the spatial distribution of CO2 concentration and the wind field simultaneously. The horizontal net CO2 flux in a radius of 6 km is estimated by integrating the CO2 concentration and the wind transport vector, indicating different characteristics of horizontal net CO2 fluxes in an industrial area, a university campus, and a park. During most of the experiment, CO2 flux remained positive in the industrial area, but balances fell to nearly zero on the campus and in the park. The horizontal net fluxes averaged over 24 h in the three areas are 3.5 × 10⁵ ppm·m2·s−1, 0.7 × 10⁵ ppm·m2·s−1, and 0.1 × 10⁵ ppm·m2·s1.

Graphical Abstract

1. Introduction

Quantifying the sources and sinks of carbon dioxide (CO2) in the atmosphere is of great significance for controlling climate warming and studying atmospheric composition [1,2,3,4,5,6]. The current emission and absorption of CO2 in the atmosphere are still subject to large uncertainties [7,8,9]. Flux observations can be used to analyze CO2 transport processes.
Spaceborne instruments can infer large-scale global carbon fluxes by imaging surface radiation [10,11]. Eddy covariance technique can measure the vertical flux of carbon dioxide directly [12,13]. By approaching average CO2 and water vapor mixing ratios in the atmospheric boundary layer as quasi-equilibrium, net CO2 surface exchange can be estimated [14]. The Lagrangian budgeting approach was used to quantify the uptake of CO2 [15]. Flux profiles over larger areas usually require networks of tall towers, balloons, or airborne-based flight to obtain average fluxes with spatial resolutions ranging from tens to hundreds of square kilometers [16,17,18,19]. However, for areas with less than 1 km2 or non-uniform (mixed) coverage, the measurement is quite difficult, and footprint models are required to improve the representativeness [20].
Due to high spatial and temporal resolution, the lidar technique has significant advantages in the remote sensing of aerosol particles [21], gas concentrations [22,23,24,25,26,27], and wind fields [28]. There have been many reports on gas detection based on differential absorption lidar (DIAL) [29,30,31] and Raman lidar [32,33]. Thus, the flux in any local area within the measurement range can be observed. Studies on gas flux based on lidar technique have been reported. The vertical flux of water vapor was measured using coherent DIAL and CDWL [34,35]. The vertical aerosol flux was measured using Doppler and Raman lidars [36]. Meanwhile, the vertical flux of CO2 induced by turbulence was estimated based on coherent DIAL, using the eddy covariance technique [37]. However, compared with direct detection, the signal-to-noise ratio (SNR) of coherent lidar is greatly affected by speckle noise, which limits the accuracy of the measured gas concentration. The vertical flux of CO2 above a crater was estimated using path-integrated CO2 concentration and the vertical plume transport speed derived from video analysis [38]. By scanning the cross-section of a CO2 plume from a stack, incorporating wind in the orthogonal direction, CO2 emission was measured [39].
Although there have been studies of CO2 flux measurement, the dynamic monitoring of CO2 horizontal transport is rarely reported. A combination of multiple techniques or instruments is required to achieve the above goals. In this paper, a hybrid lidar incorporating DIAL and coherent Doppler wind lidar (CDWL) is developed to estimate the horizontal CO2 flux. The instruments and principles are introduced in Section 2. The optimization and calibration of the receiver are described in Section 3. The experiments and results are demonstrated in Section 4. A new method is proposed to estimate the local horizontal flux as shown in Section 4. Finally, a conclusion is drawn in Section 5.

2. Instruments and Principles

2.1. Instruments

As shown in Figure 1, a compact and hybrid lidar system incorporating a DIAL channel and a CDWL channel has been developed. The DIAL channel is based on molecular spectral differential absorption technology for CO2 gas detection. The CDWL channel is based on heterodyne detection for wind-field measurement. The two subsystems share the same laser transmitter, optical collimator, and control system but adopt different optical receivers. The detailed parameters of the hybrid lidar are listed in Table 1.
In the transmitting system, the so-called on-wavelength laser and the off-wavelength laser are continuous-wave seed lasers, which alternately emit continuous light with a frequency of 10 kHz under the control of a fast optical switch (OS). After the splitter, one portion of the light is used as a probe laser and another small part is used as a local oscillator laser for heterodyne detection. The probe signal is chopped and frequency-shifted 80 MHz by an acoustic–optical modulator (AOM), ensuring the identical pulse shape for the laser at two wavelengths. After the AOM, the pulsed laser is amplified by an erbium-doped fiber amplifier (Rayshinning, SW-PFL-2 × 1-S/A). After passing through a circulator, the probe laser is transmitted into the atmosphere via a collimator. The atmospheric backscatter is collected by two telescopes.
In the CDWL channel, the backscatter coupled by one telescope (collimator) is redirected to a circulator and then mixed with the local oscillator laser and measured on a balanced detector (BD). The analog signal is converted to digital signal by an analog-to-digital converter (ADC) and then processed by a computer.
In the DIAL channel, the backscatter received from another bi-axis telescope is coupled into a multimode fiber (MMF). After an online optical filter, the signal is modulated by a fiber mode scrambler and then detected by a large-active-area superconducting nanowire single-photon detector (SNSPD) for CO2 gas detection. The nine-channel analog signal output from the SNSPD is amplified and read out as a digital signal by nine homemade electrical modules. A multi-channel scaler (MCS) records the digital signal, which is then processed by the same computer.

2.2. Advantages of the Hybrid Lidar

By sharing a transmitting system, the measured signals in both channels are from the same backscattering volume, and the wind profile and CO2 concentration are measured synchronously. The probe pulse of two wavelengths differs only in the absorption of the cross-section of the gas under test, avoiding most impacts caused by the atmospheric turbulence effect. Meanwhile, the hybrid lidar, incorporating single-photon DIAL and CDWL, inherits the advantages of both techniques.
CO2 detection requires high sensitivity. For intensity detection, single-photon detection performed with SNSPD provides higher SNR than that of the coherent technique [30,40]. Meanwhile, an MMF-coupled SNSPD possesses a large active area [41], avoiding the jitter of coupling efficiency from the telescope with a common single-mode fiber. If the coherent technique is adopted, the single-mode detection will be affected by the turbulence, resulting in a jitter from coupling the efficiency of the telescope.
Two approaches of wind measurement by lidar are available: direct detection and coherent detection [28]. For direct detection, an expensive frequency discriminator is required, and the spectrum of Doppler-shifted backscatter is assumed to be an ideal Gaussian shape [28]. A large number of detections show that the spectra exhibit different shapes under the functions of turbulence, wind shear, and rainfall [42]. For wind detection, coherent detection can obtain accurate spectral information in the troposphere [43].
Benefiting from the high SNR of the DIAL channel and accurate wind information of the CDWL channel, the hybrid lidar is built for CO2 flux estimation.

2.3. Principle

By detecting the frequency shift of the Doppler signal in the echo, the measurement of the spatial wind field information can be realized by CDWL [44].
The total differential optical depth (DOD) for a single optical path of DIAL lidar is estimated as [30]
D O D R j = 1 2 ln N ν o n , R j N ν o f f , R j = 0 R j α g ν o n , R j α g ν o f f , R j d r ,
and the D O D within a range cell ( Δ D O D ) from R j to R j + 1 is expressed as
Δ D O D = D O D R j + 1 D O D R j ,
where α g is the absorption coefficient of the gas under investigation; N ν o n , R j and N ν o f f , R j are the photon numbers received with the optical frequency of ν o n and ν o f f with a range of R j ; Δ σ = σ o n σ o f f is the differential absorption cross-section, taken from HITRAN2020 [45], Δ R = R j + 1 R j ; and N is number density of the gas under investigation. Therefore, we can derive the gas concentration (in ppm) as
ρ = Δ D O D · 10 6 Δ σ Δ R · N a i r ,
where N a i r is the (moist) air number density computed with knowledge of specific humidity, atmospheric pressure, and temperature acquired by a portable, in situ sensor close to the instrument.

3. Optimization and Calibration of Optical Receiver

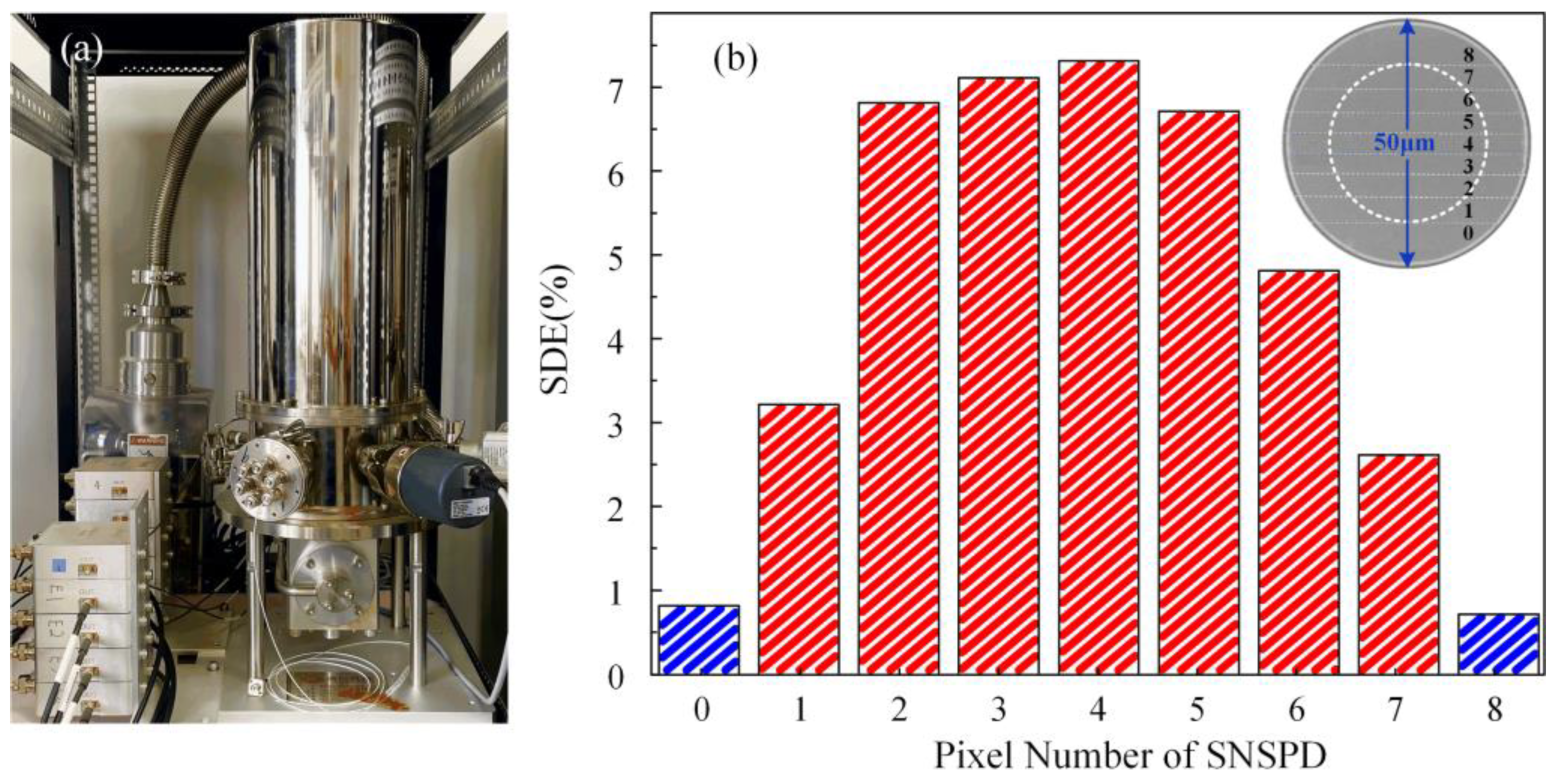
Figure 2a shows the MMF-coupled SNSPD in the DIAL receiver. The active area of the detector is divided into nine pixels [41]. The system detection efficiency (SDE) of SNSPD versus the pixel number is shown in Figure 2b. In the right corner of Figure 2b, a scanning electron microscope (SEM) image of the nine-pixel SNSPD array with large active area (50 μm diameter) is shown. The overall SDE is the sum of the detection efficiency of the nine pixels. The research discovered that the MMF-coupled SNSPD will have the problem of the uneven distribution of photon numbers in the nine pixels, resulting in fluctuations in the detection efficiency and saturation of some pixels [46]. Due to the low count rate, pixel 0 and pixel 8 are only used for boundary detection in the system initialization. As shown in the insert in Figure 2b, the dashed circle indicates the light spot focused on the SNSPD array.
The fluctuation of the SDE is found once disturbance is added to the connecting MMF between the telescope and the SNSPD. Meanwhile, it was found that the SDE of SNSPD is affected by ambient temperature change. For the DIAL technique, as shown in Equation (5), the accuracy of derived gas concentration relies heavily on the stability of the detector. Thus, it is necessary to stabilize and calibrate the optical detector.

3.1. Mode Scrambling of Multimode Fiber

The perturbation of the MMF will cause light scattering and the redistribution of the power among the guided modes inside the MMF, resulting in different spot distribution in the SDE. Figure 3a shows the SDE proportion of each pixel of the SNSPD (normalized by the total SDE). Due to the low count rate, pixel 0 and pixel 8 are not shown in the figure. It can be seen that the SDE of pixels 1–7 fluctuates with time, especially when the fiber is touched at about the 3rd and 58th minutes.
To reduce the impact of vibration on SDE, a mode scrambler (Newport, FM-1) is mounted on the connecting fiber between the telescope and the SNSPD. It presses the fiber between specially designed corrugated surfaces to cause the microbending of the fiber, which dramatically increases mode coupling among guided modes (mode scrambling) and the coupling of high-order guided modes to radiation modes (mode filtering). Stable modal distribution in the MMF is then achieved. Meanwhile, negligible insertion losses are introduced. By observing the light spots emitted from the MMF, the mode scrambler is adjusted to the optimum degree. Figure 3b shows the SDE with optimal microbending. In the middle of Figure 3b, the images (I–IV) are four spot photos taken after adjusting the mode scrambler to different degrees. The laser was captured by a photosensitive card. Image (I) is the light spot without microbending. Image (II) is the light spot with slight microbending. Image (III) is the light spot with optimal microbending. Image (IV) is the light spot with excessive microbending. It can be seen that in Image (III), the area of the light spot is the largest, and the distribution is nearly uniform. After mode scrambling, the fluctuation between the seven pixels of the SNSPD is significantly suppressed, making the SDE drift tenderly along the time axis.

3.2. Temperature Control

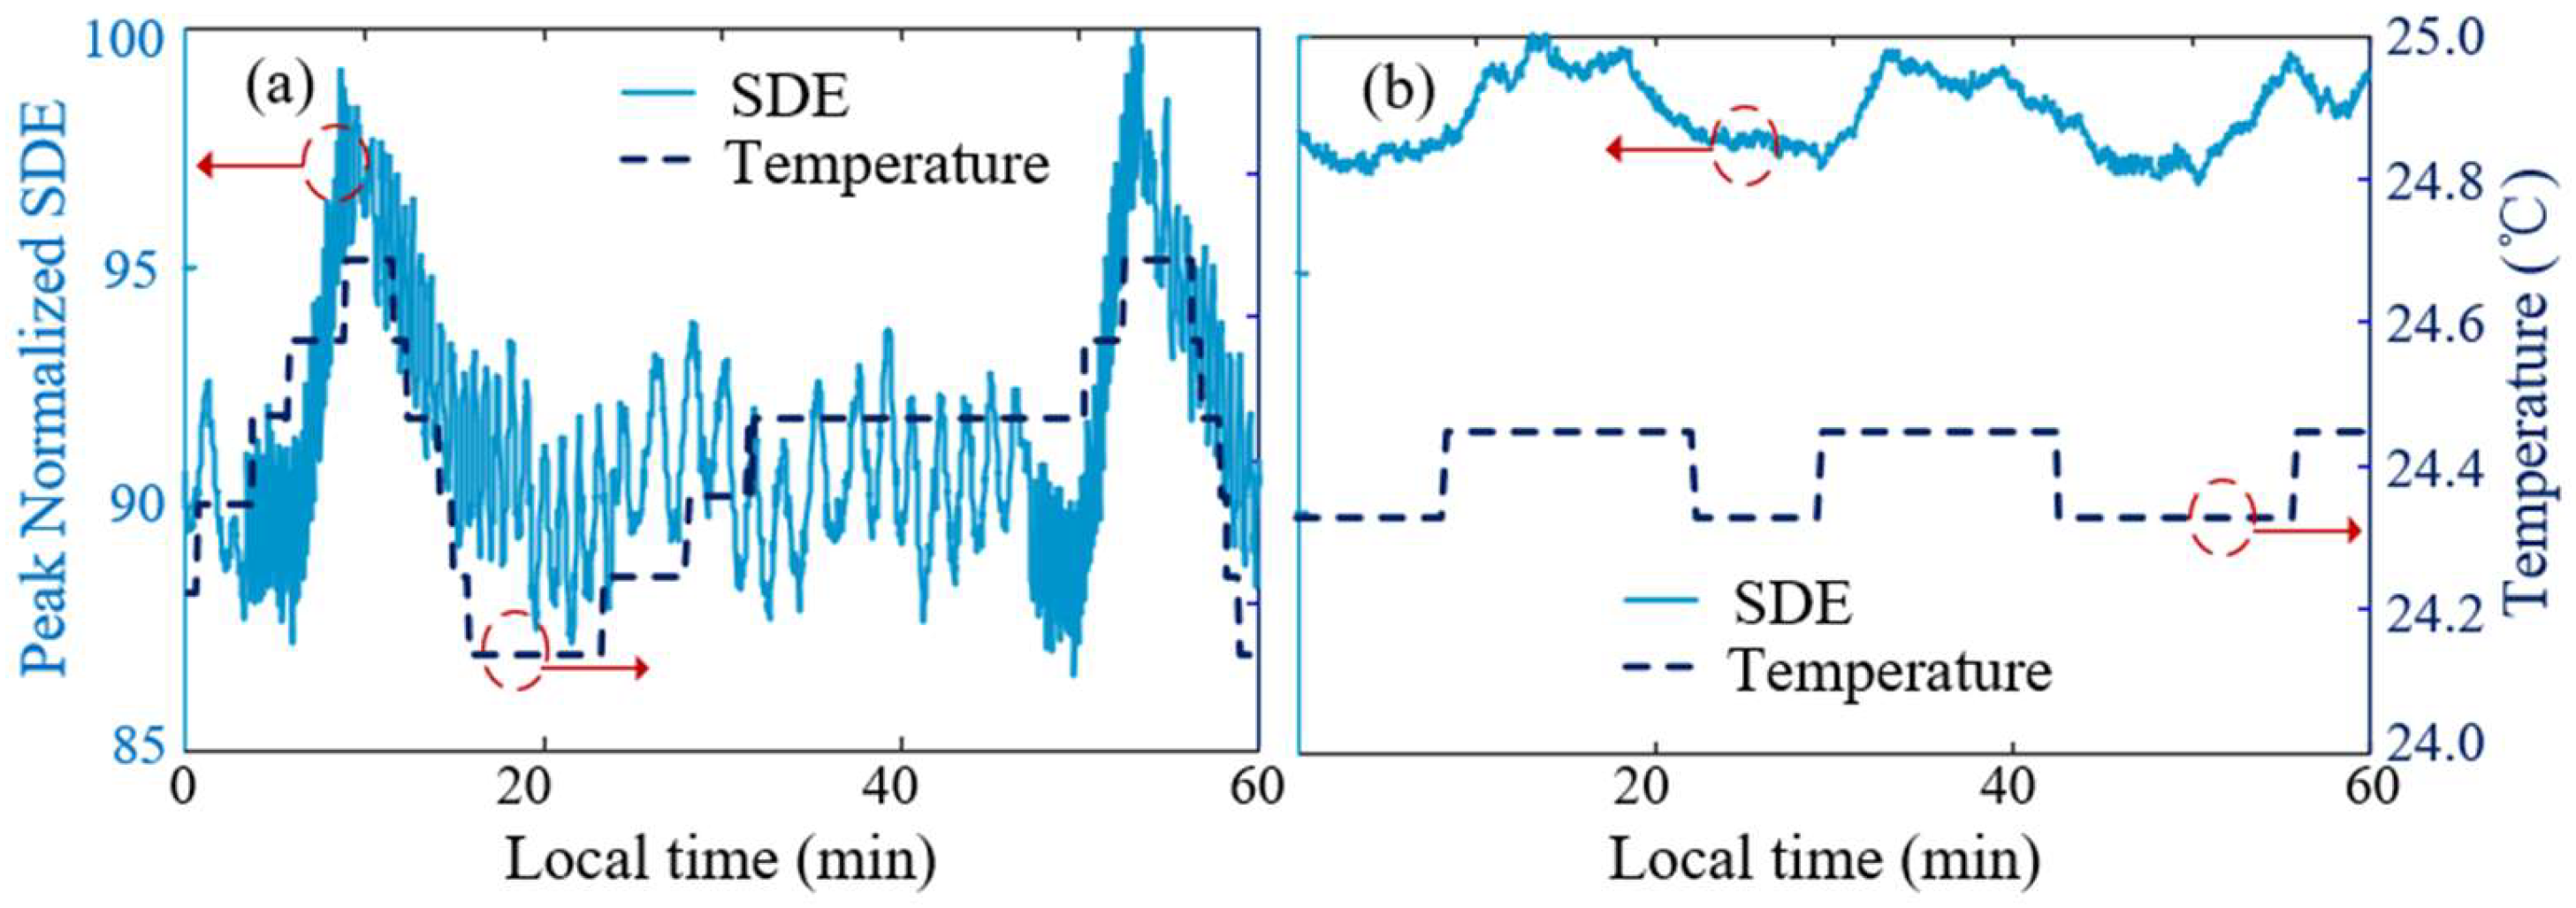
Experiments show that the SDE of SNSPD is also affected by ambient temperature. With the core chip working at a temperature of 2.3 K, the performance of SNSPD is not easily affected by ambient temperature. After a series of experiments, it was found that the MMF between the telescope and the SNSPD is affected by temperature. In the experiments, the MMF is exposed to ambient atmosphere. When the temperature in the laboratory changes under the function of the air conditioner (AC), the SDE shows a rapid change and a certain periodicity, as shown in Figure 4a. In Figure 4a,b, red circles and arrows are used to indicate the ordinates corresponding to the two curves. When the temperature changes within the range of 0.7 °C, the peak–valley fluctuation of the SDE reaches about 13%. Here, during the experiment, no mode scrambler was used. Therefore, the wind from the AC causes the vibration of the fiber, resulting in a high-frequency jitter of SDE.
To suppress the effect of temperature on SDE, temperature control for the MMF is performed. The MMF is inserted into a soft water pipe, in which the water temperature is controlled. Thus, the vibration of the MMF is isolated, and the temperature of the MMF is controlled. As shown in Figure 4b, the fluctuation of the SDE curve changes from a fast jitter to a tender drift, which can be compensated for in the DIAL data processing. When the temperature changes within ±0.1 °C, the SDE change is controlled with ±1.5% over 1 h.

4. Experiments and Results

4.1. Horizontal CO2 Distribution and Wind Field

The field experiment is performed in Nanjing City, Jiangsu province, China (32°12′8″N 118°42′59″E). The observation period is from 2 May to 3 May 2022. Horizontal plan position indicator (PPI) scanning is performed to obtain spatial distribution and transport of CO2. As shown in Figure 5, the lasers are emitted horizontally at Nanjing University of Information Science and Technology (NUIST) at an altitude of 30 m. With a detection range of 6 km, the scanning angle spans from 35° to 95° by a step of 1°. The accumulation time along one radial direction is 15 s. Three typical areas are covered by the lidar scan (i.e., the NUIST campus, Taizishan Park, and an industrial area). If not specified, local time is used.
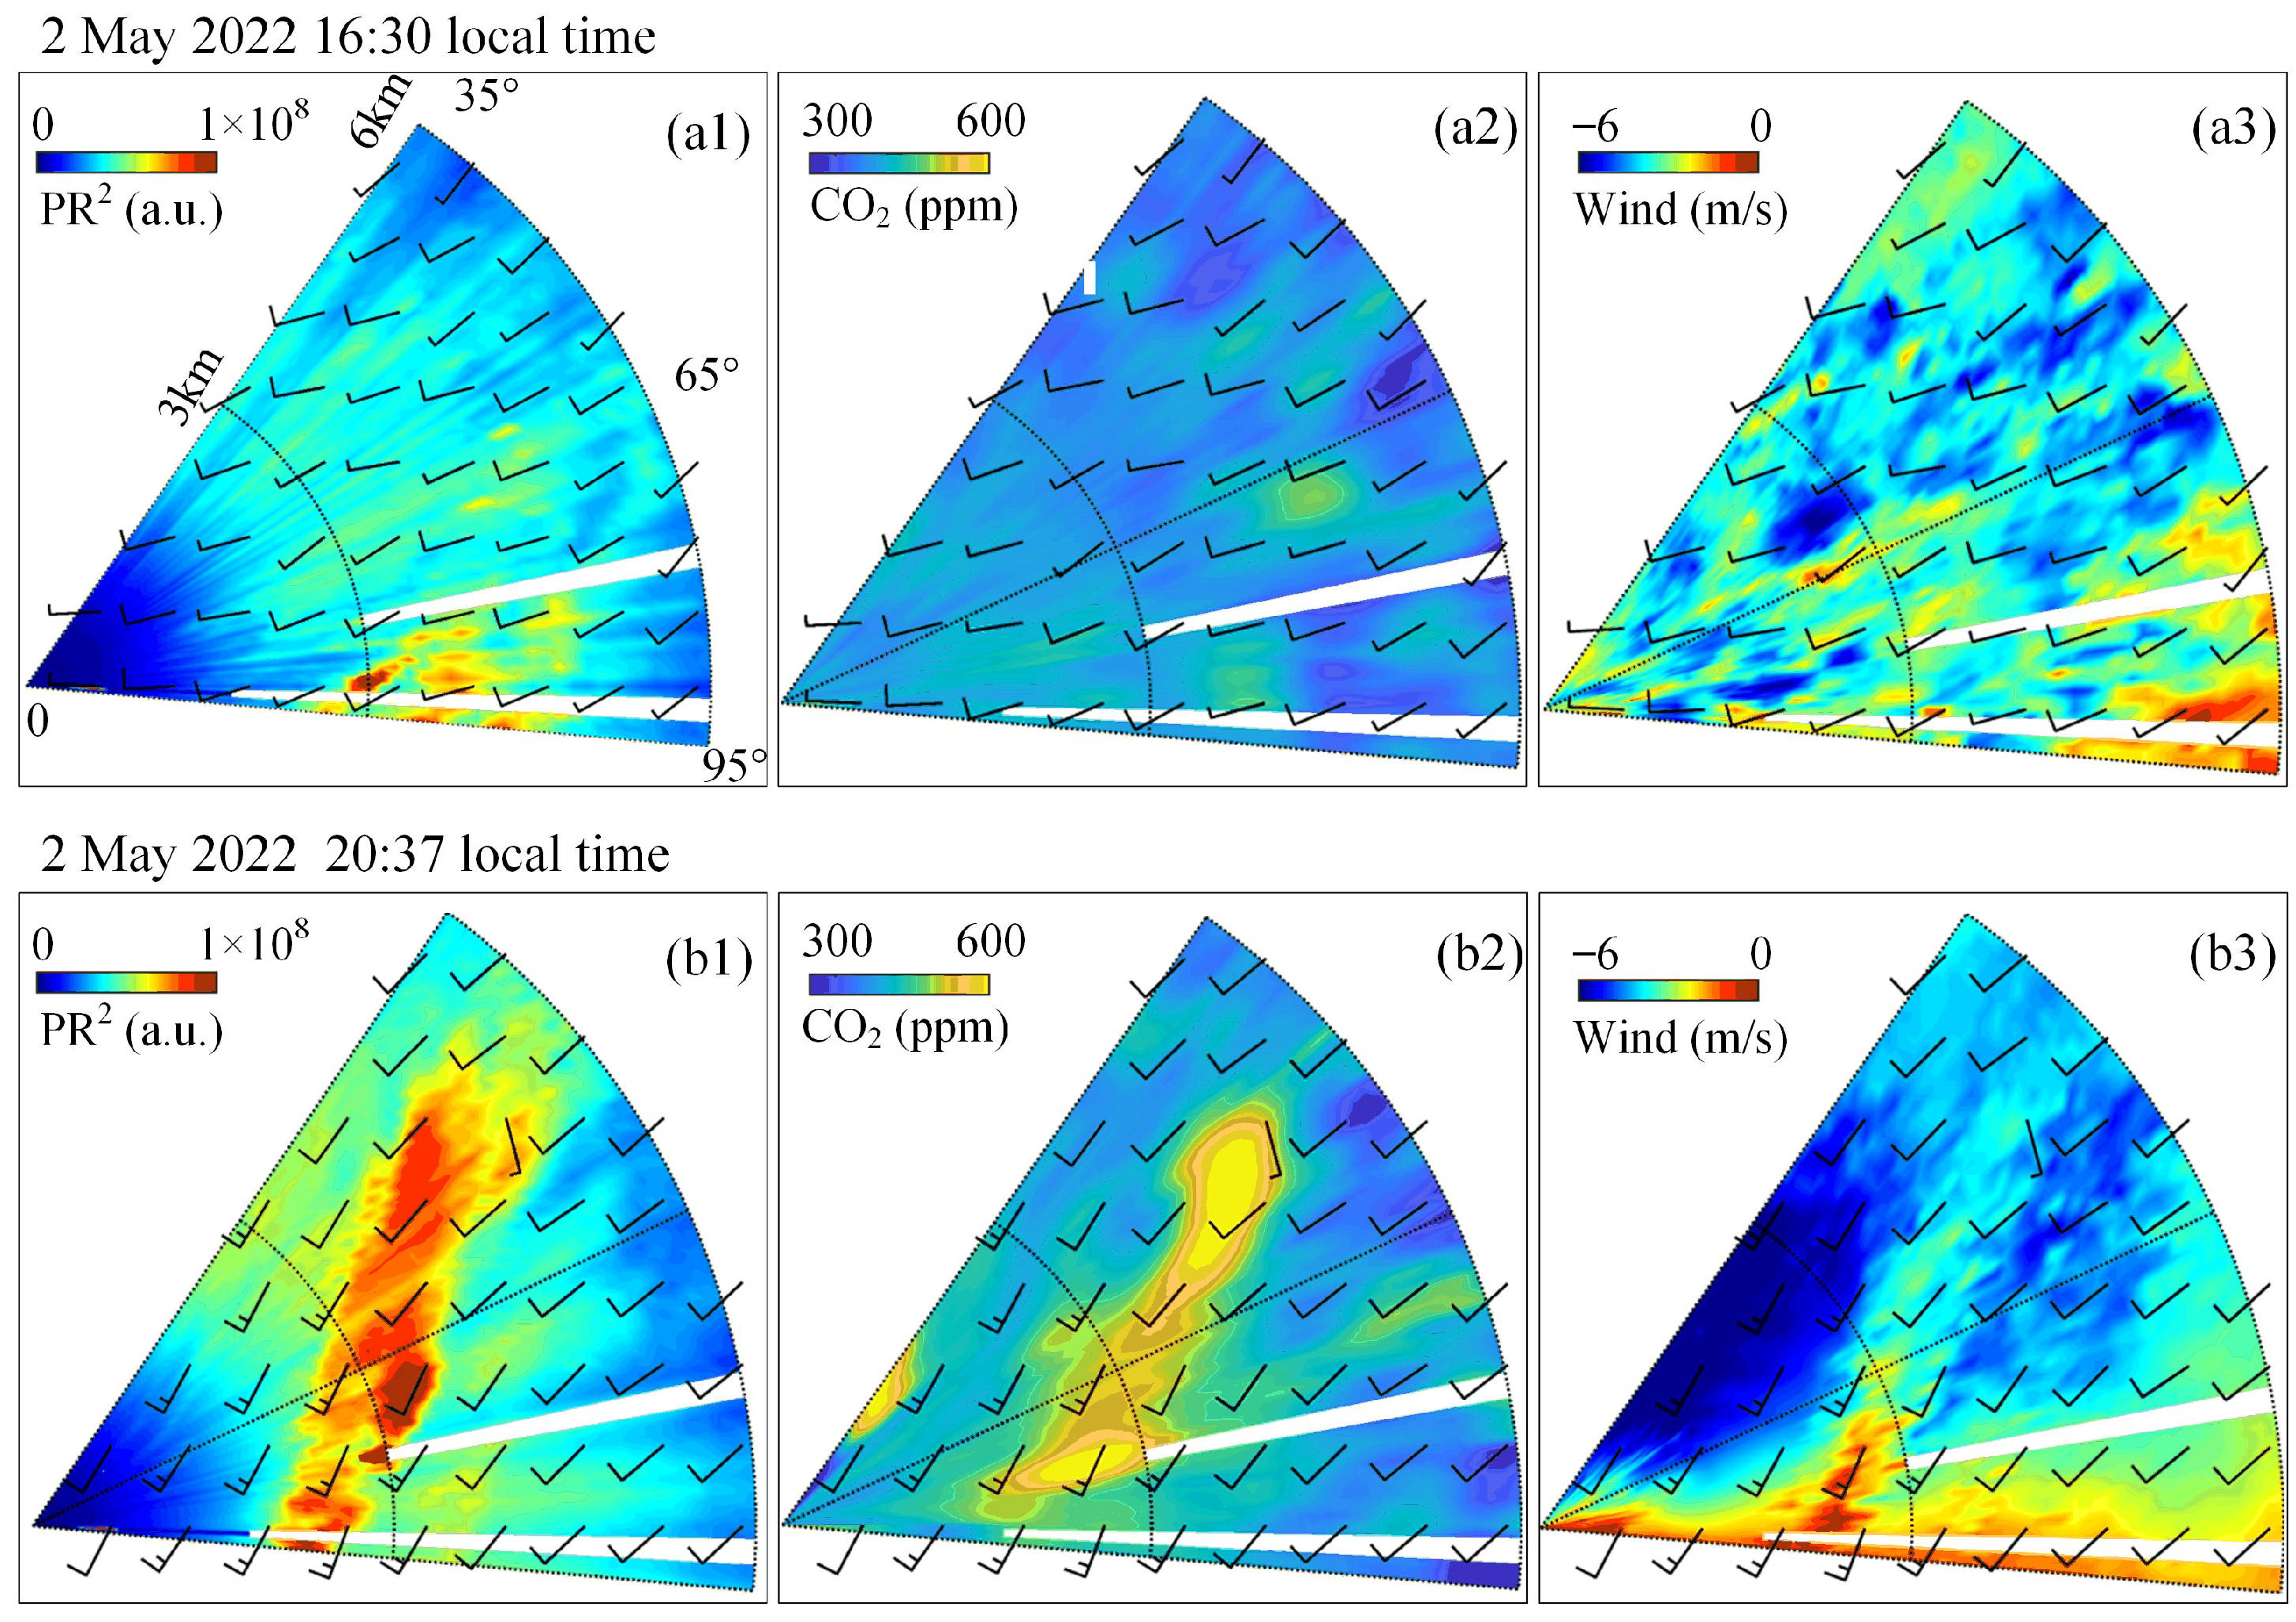
Figure 6 is horizontal scanning results at two moments. Figure 6(a1–a3) show the range-corrected backscatter signal PR2, CO2 concentration, and radial wind vector at 16:30. Figure 6(b1–b3) show corresponding results at 20:37. PR2 is the product of the power of the backscatter signal and the square of the range. The sign of wind is defined as positive when the movement is toward the lidar, and vice versa [42]. The backscatter in Figure 6(a1) is relatively uniform. Figure 6(a2) shows low CO2 concentration during light pollution conditions. The wind-driven plumes of intensified backscatter PR2 and CO2 concentration in Figure 6(b1,b2) are consistent with the wind field. Considering that there is an industrial area in the scanning area, the local high concentration is most likely the emissions from the factories.
To further analyze the diurnal variation in the CO2 concentration, the results of diurnal CO2 concentrations in three areas are shown in Figure 7. For the three areas, CO2 concentrations begin to increase at 18:00 and remain at high values during the night. Then, the concentrations gradually decrease after 09:00 in the morning. Thanks to the high greenery-coverage rates at the NUIST Campus and in Taizishan Park, the CO2 concentration is lower than that in the industrial area.

4.2. Horizontal Net Flux

To assess the transport and emission of CO2 in different regions, an estimation of CO2 horizontal net flux is required. Using the horizontal slice of the CO2 concentration distribution at a certain height, a method is proposed to calculate the local horizontal net CO2 flux by integrating the CO2 transport vector over a closed boundary of the area of interest.
Figure 8 is the illustration of the horizontal net flux calculation, defined as
F C O 2 = L ρ V n d l ,
where V is the wind velocity vector, n is the normal vector of the boundary,   ρ is the CO2 concentration, and l is the length of the boundary of the area under investigation. Horizontal net flux F C O 2 represents the regional CO2 horizontal transport at a certain height. A positive value means CO2 output is higher than the input.
According to Equation (4), the boundaries of the three areas aforementioned are chosen. The area is roughly defined in polar coordinates in the following format: A r 1 ,   r 2 ,   θ 1 , θ 2 , where A is the area under investigation, r 1 and r 2 are the start and end radii, and θ 1 and θ 2 define the angle span. In this experiment, the areas of the campus, park, and industrial area are given as:
A C   0.6   km ,   1.6   km ,   50 ° ,   60 ° , A P   3.0   km ,   4.0   km ,   59 ° ,   64 ° , A I   3.0   km ,   4.0   km ,   84 ° ,   90 ° .
As shown in the satellite photo of Figure 5, many white plumes can be seen in the lower part of the scanning area. Chimney 1 and Chimney 2 in Figure 5 are located at 2–3 km. Since the two chimneys are conspicuous, the emission is critically monitored and controlled. In this work, we are interested in the unknown emission sources. As shown in Figure 6a1, there are some emission sources in 3–4 km. Thus, A I is selected as the industrial area to estimate flux.
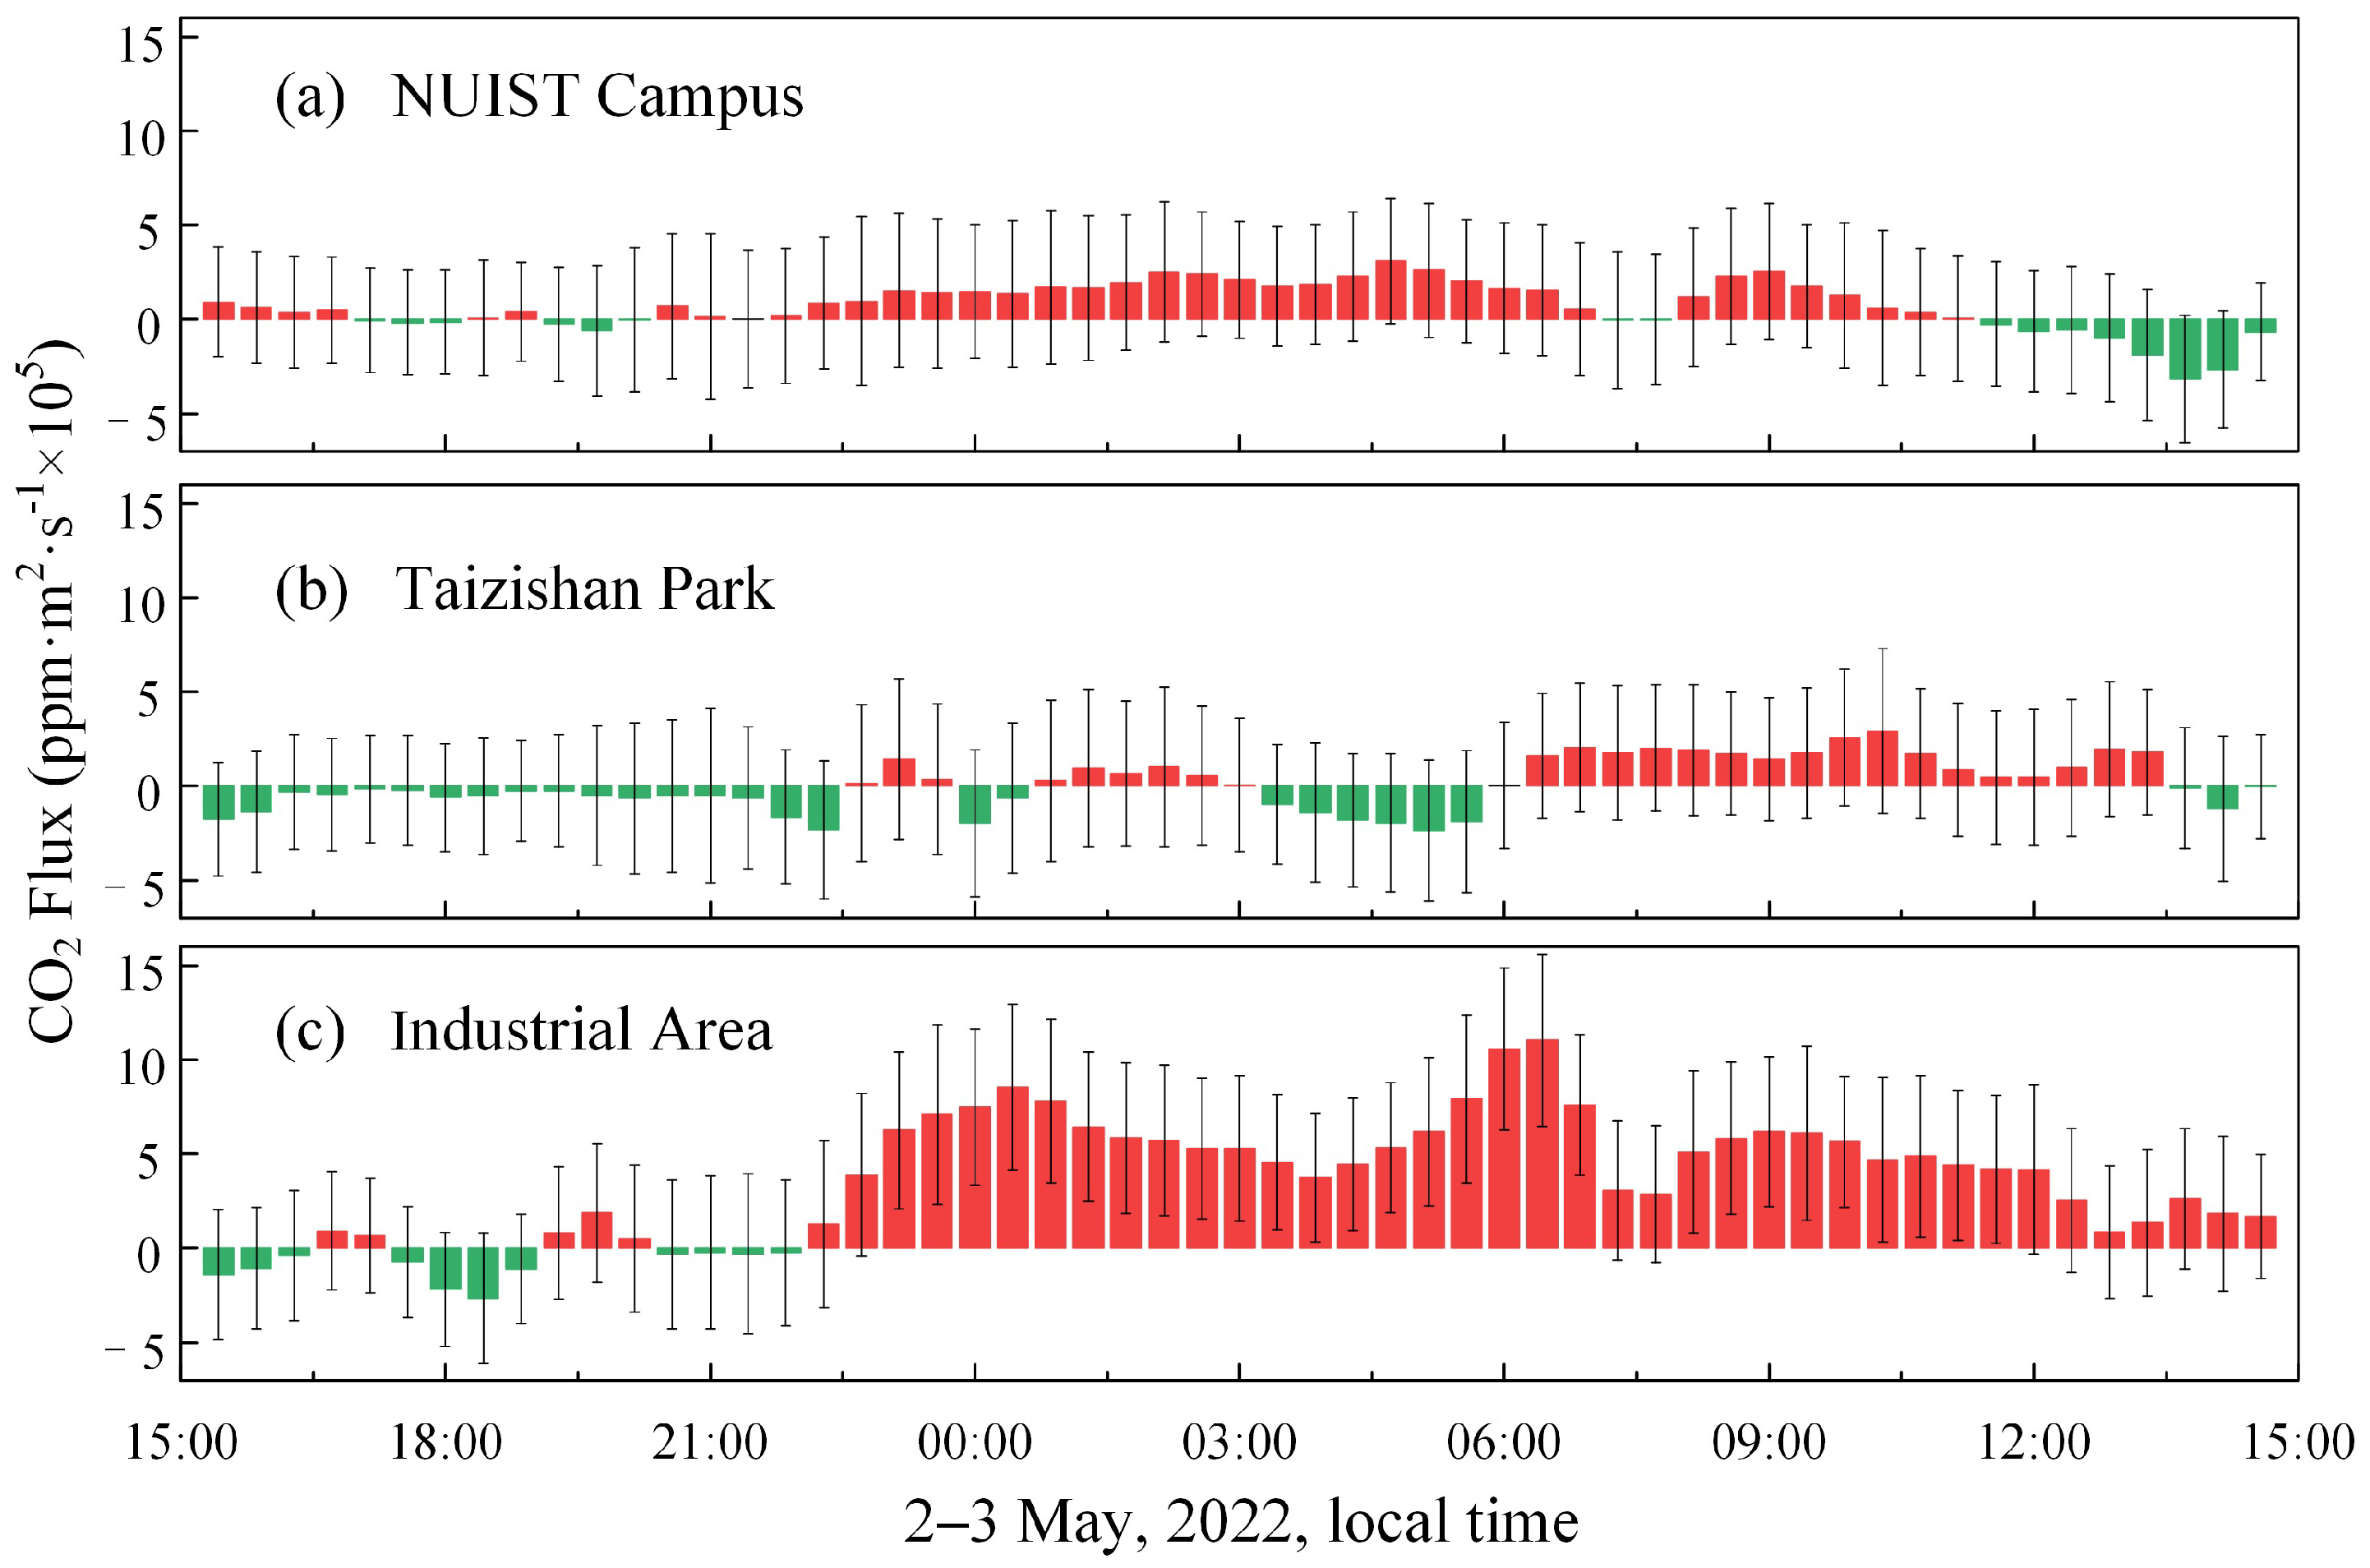
The diurnal measurements of horizontal net fluxes in three typical areas are shown in Figure 9. The red bars represent positive flux, the green bars represent negative flux. Clearly, CO2 horizontal transport modes vary widely in different local areas. The results indicate different characteristics of horizontal net CO2 fluxes in the different local areas. For most of the time during the experiment, CO2 flux is positive in the industrial area. On the contrary, on the campus and in the park, CO2 fluxes fluctuate around zero, indicating that CO2 output is close to the input in these areas. The horizontal net fluxes averaged over 24 h of the campus, the park, and the industrial area are 0.7 × 10⁵ ppm·m2·s−1, 0.1 × 10⁵ ppm·m2·s−1, and 3.5 × 10⁵ ppm·m2·s−1, respectively. From the estimated CO2 horizontal net fluxes, the carbon sinks and sources can be identified.
To estimate the precision of flux, the standard deviation is calculated. The integration of Equation (4) can be expressed as the form of discrete summation as
i ρ i V i Δ l i = i F C O 2 , i ,
where V i is the projected wind speed along the normal direction of the area boundary. Therefore, the measurement variance of the horizontal net flux can be calculated with
σ F C O 2 2 = i F C O 2 , i σ ρ i 2 ρ i 2 + σ V i 2 V i 2 ,
where σ ρ i and σ V i are the standard deviation of the CO2 concentration and the projected wind speed, respectively. σ ρ i at 2 km is about 2.1% [30], σ V i < 0.6   m / s within a measure distance of 6 km [42], and detailed information is shown in our previous works. The total standard deviation of CO2 flux σ F C O 2 based on Equation (6) is jointly determined by the σ ρ i and σ V i and the length of the boundary to be measured. The total standard deviation of CO2 flux σ F C O 2 is then calculated based on Equation (6) and shown as error bars in Figure 9.
The horizontal net flux can help to trace the source of CO2. It shows whether the CO2 on the horizontal plane is a net input or a net output along the horizontal wind vector at a certain height above the interested area. The measured flux data show that the horizontal net flux in the industrial area is indeed much higher than that in the campus and the park, proving the feasibility of our method. To obtain the precise emission in the three-dimensional (3D) space quantitatively, it is necessary to perform 3D scanning measurements.

5. Conclusions

A lidar system incorporating DIAL and CDWL was developed. The two receivers share a transmitter so that the same atmospheric volume is probed for both velocity and concentration measurements. Due to the high signal-to-noise ratio of the SNSPD, the DIAL channel shows high sensitivity in CO2 detection. The CDWL provides wind field information which is helpful for the traceability of CO2 emission and the forecast of its transportation. Through the optimization and calibration of the DIAL receiver, the stability of the SDE of SNSPD is significantly improved. Angular scanning in a horizontal plane gives access to CO2 concentration and horizontal wind velocity mapping over a large area (6 km range and 60° angular coverage). The CO2 concentration and wind velocity are then used to estimate CO2 horizontal net fluxes in characteristic locations including an industrial area. The results show correlations among the different signals. The CO2 daily cycle is observed, and a local CO2 plume emitted by the industrial plant is captured by the lidar.
In conclusion, the developed lidar system incorporating DIAL and CDWL proved effective in monitoring real-time CO2 concentration and estimating the horizontal net fluxes for local CO2 emission and transport events. The horizontal net flux can certainly help to trace the source of CO2, while the 3D spatial distributions of CO2 concentration and wind vector are necessary to obtain precise emission measurements in the 3D space quantitatively. By scanning the slices of a CO2 plume from a source located downwind of the lidar and incorporating orthogonal wind, 3D CO2 flux can be calculated and verified [38,39]. It is recommended that the boundary of the area of interest be selected according to the actual shape of the area for fine calculation. Next, comparison experiments of the CO2 3D flux are planned. The horizontal net flux can help trace the source of CO2. However, the horizontal net flux defined in the present work is only the CO2 horizontal transport at a certain height. In the near future, 3D CO2 flux estimation can be realized with multi-layer scanning experiments.

Author Contributions

Conceptualization, H.X.; methodology, B.Y., S.Y. and Y.Y.; experiment, M.L., B.Y., Z.Z. and J.D.; data processing, T.W., Z.G. and J.Y.; formal analysis, H.X., B.Y., S.Y. and Y.Y.; photo capture, Y.J. and H.X. writing—original draft preparation, B.Y.; writing—review and editing, B.Y., S.Y., T.W., J.Y., Y.Y. and H.X.; visualization, B.Y. and H.X.; supervision, H.X.; project administration, H.X. All authors have read and agreed to the published version of the manuscript.

Funding

This work is supported by the fourth batch of National Ten Thousand Talent Program in China. We are grateful to Nanjing Taixin Co., Ltd. for financial support (91320191MA26A48Q5X).

Data Availability Statement

The data underlying the results presented in this paper can be obtained from the authors upon reasonable request.

Acknowledgments

We thank Xianggang Bai, Yong Wang, Genshu Lan, and Fang Fei for their contribution to the development and manufacture of the fiber lasers.

Conflicts of Interest

The authors declare no conflict of interest.

References

  1. Schmidt, K. Coming to Grips with the World’s Greenhouse Gases. Science 1998, 281, 504–506. [Google Scholar] [CrossRef]
  2. Metzl, N.; Tilbrook, B.; Poisson, A. The Annual FCO2 Cycle and the Air’sea CO2 Flux in the Sub-Antarctic Ocean. Tellus B Chem. Phys. Meteorol. 1999, 51, 849–861. [Google Scholar] [CrossRef] [Green Version]
  3. Gurney, K.R.; Law, R.M.; Denning, A.S.; Rayner, P.J.; Baker, D.; Bousquet, P.; Bruhwiler, L.; Chen, Y.-H.; Ciais, P.; Fan, S.; et al. Towards Robust Regional Estimates of CO2 Sources and Sinks Using Atmospheric Transport Models. Nature 2002, 415, 626–630. [Google Scholar] [CrossRef] [PubMed] [Green Version]
  4. Le Quéré, C.; Raupach, M.R.; Canadell, J.G.; Marland, G.; Bopp, L.; Ciais, P.; Conway, T.J.; Doney, S.C.; Feely, R.A.; Foster, P.; et al. Trends in the Sources and Sinks of Carbon Dioxide. Nat. Geosci. 2009, 2, 831–836. [Google Scholar] [CrossRef] [Green Version]
  5. Shi, T.; Han, G.; Ma, X.; Gong, W.; Chen, W.; Liu, J.; Zhang, X.; Pei, Z.; Gou, H.; Bu, L. Quantifying CO2 Uptakes over Oceans Using LIDAR: A Tentative Experiment in Bohai Bay. Geophys. Res. Lett. 2021, 48, e2020GL091160. [Google Scholar] [CrossRef]
  6. Wang, Q.; Mustafa, F.; Bu, L.; Zhu, S.; Liu, J.; Chen, W. Atmospheric Carbon Dioxide Measurement from Aircraft and Comparison with OCO-2 and CarbonTracker Model Data. Atmos. Meas. Tech. 2021, 14, 6601–6617. [Google Scholar] [CrossRef]
  7. Wang, J.; Feng, L.; Palmer, P.I.; Liu, Y.; Fang, S.; Bösch, H.; O’Dell, C.W.; Tang, X.; Yang, D.; Liu, L.; et al. Large Chinese Land Carbon Sink Estimated from Atmospheric Carbon Dioxide Data. Nature 2020, 586, 720–723. [Google Scholar] [CrossRef]
  8. Mustafa, F.; Bu, L.; Wang, Q.; Shahzaman, M.; Bilal, M.; Aslam, R.W.; Dong, C. Spatiotemporal Investigation of Near-Surface CO2 and Its Affecting Factors over Asia. IEEE Trans. Geosci. Remote Sens. 2022, 60, 1–16. [Google Scholar] [CrossRef]
  9. Wetzel, P.; Winguth, A.; Maier-Reimer, E. Sea-to-Air CO2 Flux from 1948 to 2003: A Model Study. Glob. Biogeochem. Cycles 2005, 19, GB2005. [Google Scholar] [CrossRef]
  10. Running, S.W.; Baldocchi, D.D.; Turner, D.P.; Gower, S.T.; Bakwin, P.S.; Hibbard, K.A. A Global Terrestrial Monitoring Network Integrating Tower Fluxes, Flask Sampling, Ecosystem Modeling and EOS Satellite Data. Remote Sens. Environ. 1999, 70, 108–127. [Google Scholar] [CrossRef]
  11. Cramer, W.; Kicklighter, D.W.; Bondeau, A.; Iii, B.M.; Churkina, G.; Nemry, B.; Ruimy, A.; Schloss, A.L. Comparing Global Models of Terrestrial Net Primary Productivity (NPP): Overview and Key Results. Glob. Change Biol. 1999, 5, 1–15. [Google Scholar] [CrossRef]
  12. Massman, W.J.; Lee, X. Eddy Covariance Flux Corrections and Uncertainties in Long-Term Studies of Carbon and Energy Exchanges. Agric. For. Meteorol. 2002, 113, 121–144. [Google Scholar] [CrossRef]
  13. Aubinet, M. Eddy Covariance CO2 Flux Measurements in Nocturnal Conditions: An Analysis of the Problem. Ecol. Appl. 2008, 18, 1368–1378. [Google Scholar] [CrossRef]
  14. Helliker, B.R.; Berry, J.A.; Betts, A.K.; Bakwin, P.S.; Davis, K.J.; Denning, A.S.; Ehleringer, J.R.; Miller, J.B.; Butler, M.P.; Ricciuto, D.M. Estimates of Net CO2 Flux by Application of Equilibrium Boundary Layer Concepts to CO2 and Water Vapor Measurements from a Tall Tower. J. Geophys. Res. Atmos. 2004, 109, D20106. [Google Scholar] [CrossRef] [Green Version]
  15. Schmitgen, S.; Geiß, H.; Ciais, P.; Neininger, B.; Brunet, Y.; Reichstein, M.; Kley, D.; Volz-Thomas, A. Carbon Dioxide Uptake of a Forested Region in Southwest France Derived from Airborne CO2 and CO Measurements in a Quasi-Lagrangian Experiment. J. Geophys. Res. Atmos. 2004, 109, D14302. [Google Scholar] [CrossRef] [Green Version]
  16. Baldocchi, D.; Falge, E.; Gu, L.; Olson, R.; Hollinger, D.; Running, S.; Anthoni, P.; Bernhofer, C.; Davis, K.; Evans, R.; et al. FLUXNET: A New Tool to Study the Temporal and Spatial Variability of Ecosystem-Scale Carbon Dioxide, Water Vapor, and Energy Flux Densities. Bull. Am. Meteorol. Soc. 2001, 82, 2415–2434. [Google Scholar] [CrossRef]
  17. Feigenwinter, C.; Bernhofer, C.; Eichelmann, U.; Heinesch, B.; Hertel, M.; Janous, D.; Kolle, O.; Lagergren, F.; Lindroth, A.; Minerbi, S.; et al. Comparison of Horizontal and Vertical Advective CO2 Fluxes at Three Forest Sites. Agric. For. Meteorol. 2008, 148, 12–24. [Google Scholar] [CrossRef]
  18. Vickers, D.; Thomas, C.; Law, B.E. Random and Systematic CO2 Flux Sampling Errors for Tower Measurements over Forests in the Convective Boundary Layer. Agric. For. Meteorol. 2009, 149, 73–83. [Google Scholar] [CrossRef]
  19. Lin, J.C.; Gerbig, C.; Wofsy, S.C.; Andrews, A.E.; Daube, B.C.; Grainger, C.A.; Stephens, B.B.; Bakwin, P.S.; Hollinger, D.Y. Measuring Fluxes of Trace Gases at Regional Scales by Lagrangian Observations: Application to the CO2 Budget and Rectification Airborne (COBRA) Study. J. Geophys. Res. Atmos. 2004, 109, D15304. [Google Scholar] [CrossRef] [Green Version]
  20. Wang, W.; Davis, K.J.; Cook, B.D.; Butler, M.P.; Ricciuto, D.M. Decomposing CO2 Fluxes Measured over a Mixed Ecosystem at a Tall Tower and Extending to a Region: A Case Study. J. Geophys. Res. Biogeosci. 2006, 111, G02005. [Google Scholar] [CrossRef]
  21. Wang, C.; Jia, M.; Xia, H.; Wu, Y.; Wei, T.; Shang, X.; Yang, C.; Xue, X.; Dou, X. Relationship Analysis of PM2.5 and Boundary Layer Height Using an Aerosol and Turbulence Detection Lidar. Atmos. Meas. Tech. 2019, 12, 3303–3315. [Google Scholar] [CrossRef] [Green Version]
  22. Amediek, A.; Ehret, G.; Fix, A.; Wirth, M.; Büdenbender, C.; Quatrevalet, M.; Kiemle, C.; Gerbig, C. CHARM-F—A New Airborne Integrated-Path Differential-Absorption Lidar for Carbon Dioxide and Methane Observations: Measurement Performance and Quantification of Strong Point Source Emissions. Appl. Opt. 2017, 56, 5182–5197. [Google Scholar] [CrossRef]
  23. Cezard, N.; Mehaute, S.L.; Gouët, J.L.; Valla, M.; Goular, D.; Fleury, D.; Planchat, C.; Dolfi-Bouteyre, A. Performance Assessment of a Coherent DIAL-Doppler Fiber Lidar at 1645 nm for Remote Sensing of Methane and Wind. Opt. Express 2020, 28, 22345–22357. [Google Scholar] [CrossRef]
  24. Yu, S.; Zhang, Z.; Li, M.; Xia, H. Multi-Frequency Differential Absorption Lidar Incorporating a Comb-Referenced Scanning Laser for Gas Spectrum Analysis. Opt. Express 2021, 29, 12984–12995. [Google Scholar] [CrossRef]
  25. Wagner, G.A.; Plusquellic, D.F. Multi-Frequency Differential Absorption LIDAR System for Remote Sensing of CO2 and H2O near 1.6 µm. Opt. Express 2018, 26, 19420–19434. [Google Scholar] [CrossRef]
  26. Cadiou, E.; Mammez, D.; Dherbecourt, J.-B.; Gorju, G.; Pelon, J.; Melkonian, J.-M.; Godard, A.; Raybaut, M. Atmospheric Boundary Layer CO2 Remote Sensing with a Direct Detection LIDAR Instrument Based on a Widely Tunable Optical Parametric Source. Opt. Lett. 2017, 42, 4044–4047. [Google Scholar] [CrossRef]
  27. Zhang, Z.; Xia, H.; Yu, S.; Zhao, L.; Wei, T.; Li, M. Femtosecond Imbalanced Time-Stretch Spectroscopy for Ultrafast Gas Detection. Appl. Phys. Lett. 2020, 116, 171106. [Google Scholar] [CrossRef]
  28. Xia, H.; Sun, D.; Yang, Y.; Shen, F.; Dong, J.; Kobayashi, T. Fabry-Perot Interferometer Based Mie Doppler Lidar for Low Tropospheric Wind Observation. Appl. Opt. 2007, 46, 7120–7131. [Google Scholar] [CrossRef] [Green Version]
  29. Kiemle, C.; Quatrevalet, M.; Ehret, G.; Amediek, A.; Fix, A.; Wirth, M. Sensitivity Studies for a Space-Based Methane Lidar Mission. Atmos. Meas. Tech. 2011, 4, 2195–2211. [Google Scholar] [CrossRef] [Green Version]
  30. Yu, S.; Zhang, Z.; Xia, H.; Dou, X.; Wu, T.; Hu, Y.; Li, M.; Shangguan, M.; Wei, T.; Zhao, L.; et al. Photon-Counting Distributed Free-Space Spectroscopy. Light Sci. Appl. 2021, 10, 212. [Google Scholar] [CrossRef]
  31. Hamperl, J.; Dherbecourt, J.-B.; Totems, J.; Mølster, K.M.; Canalias, C.; Lee, C.; Zukauskas, A.; Pasiskevicius, V.; Santagata, R.; Melkonian, J.-M.; et al. Preliminary Range-Resolved Detection of Stable Water Isotopologues by Differential Absorption Lidar Using a 2 µm Parametric Source. In Proceedings of the Optica High-Brightness Sources and Light-Driven Interactions Congress 2022, Budapest, Hungary, 21 March 2022; Optica Publishing Group: Washington, DC, USA, 2022. Paper MF3C.3. [Google Scholar] [CrossRef]
  32. Ansmann, A.; Riebesell, M.; Wandinger, U.; Weitkamp, C.; Voss, E.; Lahmann, W.; Michaelis, W. Combined Raman Elastic-Backscatter LIDAR for Vertical Profiling of Moisture, Aerosol Extinction, Backscatter, and LIDAR Ratio. Appl. Phys. B 1992, 55, 18–28. [Google Scholar] [CrossRef]
  33. Wulfmeyer, V.; Hardesty, R.M.; Turner, D.D.; Behrendt, A.; Cadeddu, M.P.; Di Girolamo, P.; Schlüssel, P.; Van Baelen, J.; Zus, F. A Review of the Remote Sensing of Lower Tropospheric Thermodynamic Profiles and Its Indispensable Role for the Understanding and the Simulation of Water and Energy Cycles. Rev. Geophys. 2015, 53, 819–895. [Google Scholar] [CrossRef]
  34. Giez, A.; Ehret, G.; Schwiesow, R.L.; Davis, K.J.; Lenschow, D.H. Water Vapor Flux Measurements from Ground-Based Vertically Pointed Water Vapor Differential Absorption and Doppler Lidars. J. Atmos. Ocean. Technol. 1999, 16, 237–250. [Google Scholar] [CrossRef]
  35. Kiemle, C.; Ehret, G.; Fix, A.; Wirth, M.; Poberaj, G.; Brewer, W.A.; Hardesty, R.M.; Senff, C.; LeMone, M.A. Latent Heat Flux Profiles from Collocated Airborne Water Vapor and Wind Lidars during IHOP_2002. J. Atmos. Ocean. Technol. 2007, 24, 627–639. [Google Scholar] [CrossRef] [Green Version]
  36. Engelmann, R.; Wandinger, U.; Ansmann, A.; Müller, D.; Žeromskis, E.; Althausen, D.; Wehner, B. Lidar Observations of the Vertical Aerosol Flux in the Planetary Boundary Layer. J. Atmos. Ocean. Technol. 2008, 25, 1296–1306. [Google Scholar] [CrossRef]
  37. Gibert, F.; Koch, G.J.; Beyon, J.Y.; Hilton, T.W.; Davis, K.J.; Andrews, A.; Flamant, P.H.; Singh, U.N. Can CO2 Turbulent Flux Be Measured by Lidar? A Preliminary Study. J. Atmos. Ocean. Technol. 2011, 28, 365–377. [Google Scholar] [CrossRef] [Green Version]
  38. Queiβer, M.; Granieri, D.; Burton, M. A New Frontier in CO2 Flux Measurements Using a Highly Portable DIAL Laser System. Sci. Rep. 2016, 6, 33834. [Google Scholar] [CrossRef] [PubMed] [Green Version]
  39. Robinson, R.A.; Gardiner, T.D.; Innocenti, F.; Finlayson, A.; Woods, P.T.; Few, J.F.M. First Measurements of a Carbon Dioxide Plume from an Industrial Source Using a Ground Based Mobile Differential Absorption Lidar. Environ. Sci. Process. Impacts 2014, 16, 1957–1966. [Google Scholar] [CrossRef]
  40. Bienfang, J.C.; Zwiller, V.; Steinhauer, S. Materials, Devices, and Systems for High-Speed Single-Photon Counting. MRS Bull. 2022, 47, 494–501. [Google Scholar] [CrossRef]
  41. Zhang, C.; Zhang, W.; You, L.; Huang, J.; Li, H.; Sun, X.; Wang, H.; Lv, C.; Zhou, H.; Liu, X.; et al. Suppressing Dark Counts of Multimode-Fiber-Coupled Superconducting Nanowire Single-Photon Detector. IEEE Photonics J. 2019, 11, 1–8. [Google Scholar] [CrossRef]
  42. Yuan, J.; Su, L.; Xia, H.; Li, Y.; Zhang, M.; Zhen, G.; Li, J. Microburst, Windshear, Gust Front, and Vortex Detection in Mega Airport Using a Single Coherent Doppler Wind Lidar. Remote Sens. 2022, 14, 1626. [Google Scholar] [CrossRef]
  43. Yuan, J.; Xia, H.; Wei, T.; Wang, L.; Yue, B.; Wu, Y. Identifying Cloud, Precipitation, Windshear, and Turbulence by Deep Analysis of the Power Spectrum of Coherent Doppler Wind Lidar. Opt. Express 2020, 28, 37406–37418. [Google Scholar] [CrossRef]
  44. Wei, T.; Xia, H.; Yue, B.; Wu, Y.; Liu, Q. Remote Sensing of Raindrop Size Distribution Using the Coherent Doppler Lidar. Opt. Express 2021, 29, 17246–17257. [Google Scholar] [CrossRef] [PubMed]
  45. Gordon, I.E.; Rothman, L.S.; Hargreaves, R.J.; Hashemi, R.; Karlovets, E.V.; Skinner, F.M.; Conway, E.K.; Hill, C.; Kochanov, R.V.; Tan, Y.; et al. The HITRAN2020 Molecular Spectroscopic Database. J. Quant. Spectrosc. Radiat. Transf. 2022, 277, 107949. [Google Scholar] [CrossRef]
  46. Zhang, W.J.; Zhang, C.J.; Huang, J.; Sun, X.Q.; Xu, G.Z.; Xiong, J.M.; You, L.X.; Wang, Z.; Xie, X.M. Development of Superconducting Nanowire Single-Photon Detector Arrays for Applications in SIMIT. In Proceedings of the Advanced Photon Counting Techniques XIV, Online, 28 May 2020; Volume 11386, pp. 45–54. [Google Scholar]
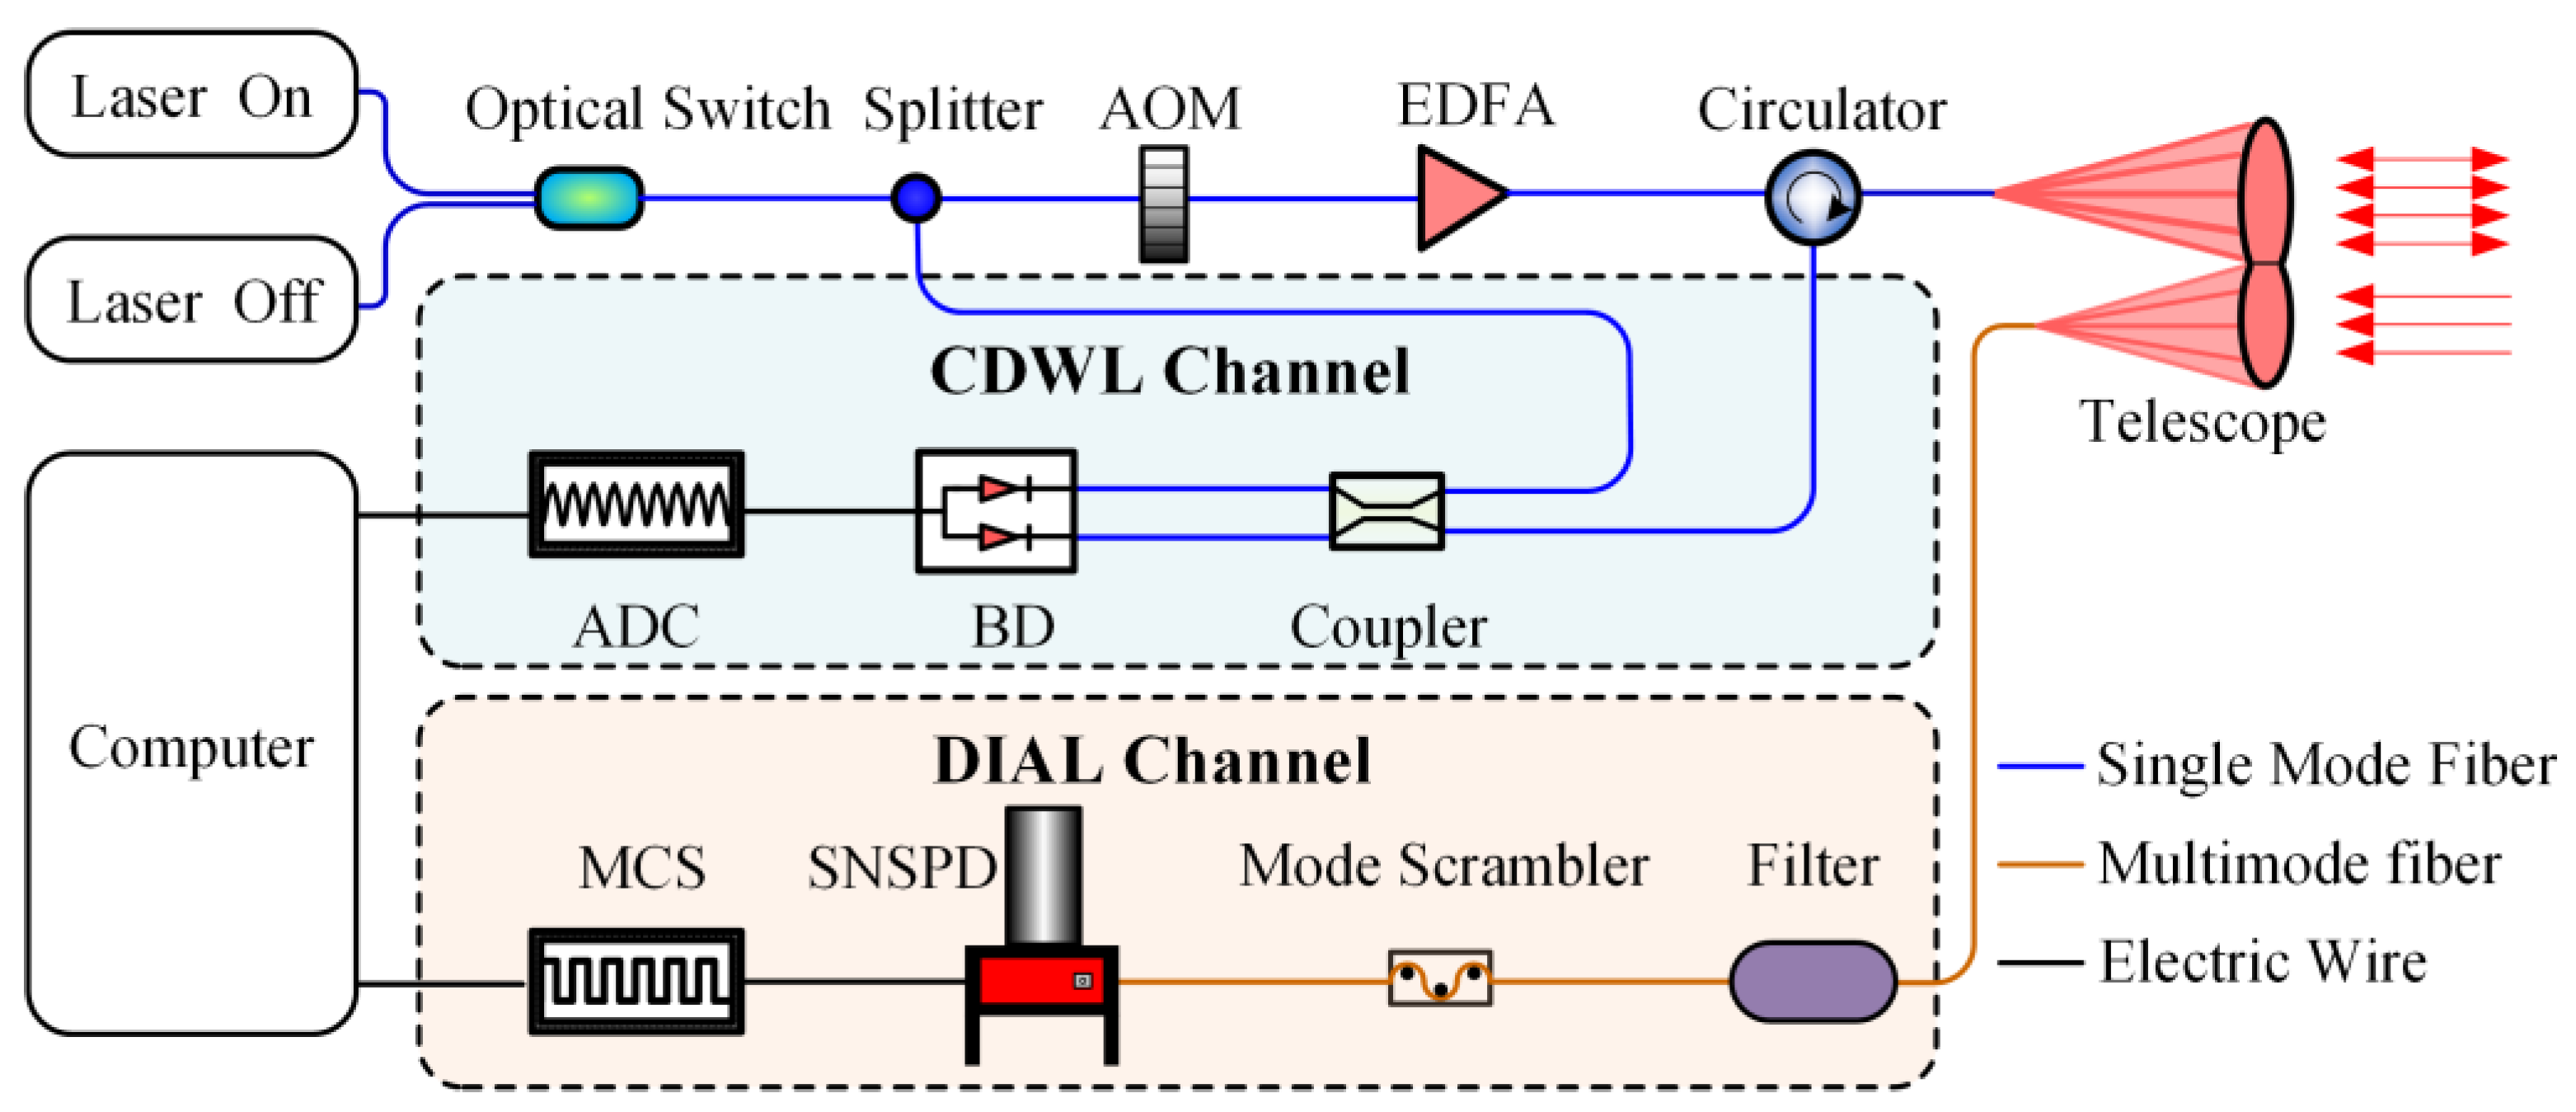
Figure 1. A diagram of the hybrid lidar system: AOM, acoustic–optical modulator; EDFA, erbium-doped fiber amplifier; ADC, analog to digital converter; BD, balance detector; SNSPD, superconducting nanowire single-photon detector; MCS, multi-channel scaler.
Remotesensing 14 05150 g001
Figure 2. (a) System photo of SNSPD; (b) SDE as a function of the pixel number. SEM image of nine-pixel SNSPD array with 50 μm circular active area is shown in the right corner.
Remotesensing 14 05150 g002
Figure 3. (a) SDE proportion of each pixel without mode scrambling. (b) SDE proportion of each pixel with mode scrambling. Images (I–IV) are four spot photos taken after adjusting the mode scrambler to different degrees.
Remotesensing 14 05150 g003
Figure 4. (a) Peak-normalized SDE without temperature control; (b) peak-normalized SDE with temperature control. Red circles and arrows are used to indicate the ordinates corresponding to the two curves.
Remotesensing 14 05150 g004
Figure 5. Illustration of measurement areas. (A) indicates the NUIST campus, (B) is Taizishan Park, and (C) represents an industrial area.
Remotesensing 14 05150 g005
Figure 6. Horizontal scanning results on 2 May 2022 in Nanjing. (a1a3) are backscatter signal PR2, CO2 concentration, and radial velocity at 16:30. (b1b3) are at 20:37. The blank areas in the fan charts are caused by hitting hard targets (Chimney 1 and Chimney 2 in Figure 5). The wind barbs represent the wind speed and direction.
Remotesensing 14 05150 g006
Figure 7. The diurnal variation in CO2 concentrations at three typical locations. Error bars indicate the 1σ standard deviation.
Remotesensing 14 05150 g007
Figure 8. Schematic diagram of horizontal net flux. The black arrow represents the wind vector.
Remotesensing 14 05150 g008
Figure 9. The diurnal variation in horizontal net flux in three typical areas: (a) NUIST campus, (b) Taizishan Park, and (c) industrial area. Error bars indicate the 1σ standard deviation. The red bars represent positive flux, the green bars represent negative flux.
Remotesensing 14 05150 g009
Table 1. Key parameters of the hybrid lidar.
ParameterValue
On wavelength1572.335 nm
Off wavelength1572.454 nm
Pulse energy80 μ J
Pulse average power0.8 W
On/off pulse repletion frequency5 kHz
On/off laser frequency uncertainty0.5 MHz
Diameter of collimator80 mm
Diameter of telescope70 mm
Spatial resolution150 m
Radial temporal resolution15 s
Maximum range6 km
Azimuth scanning range0–360°
Zenith scanning range0–90◦
SDE of SNSPD @ 1572 nm31.5%
Responsibility of BD1.0 A/W
Sample rate of ADC500 MS/s
Publisher’s Note: MDPI stays neutral with regard to jurisdictional claims in published maps and institutional affiliations.