Technical Note

Digital In Situ Data Collection in Earth Observation, Monitoring and Agriculture—Progress towards Digital Agriculture

1
Department of Geoecology, Institute of Geosciences and Geography, Martin Luther University Halle-Wittenberg, Von-Seckendorff-Platz 4, 06120 Halle (Saale), Germany
2
Department of Digital Geography, Institute of Geosciences and Geography, Martin Luther University Halle-Wittenberg, Von-Seckendorff-Platz 4, 06120 Halle (Saale), Germany
3
Geographic Information Science and Data Handling, Institute of Geosciences and Geography, Martin Luther University Halle-Wittenberg, Von-Seckendorff-Platz 4, 06120 Halle (Saale), Germany
*
Author to whom correspondence should be addressed.
Remote Sens. 2022, 14(2), 393; https://doi.org/10.3390/rs14020393
Submission received: 30 November 2021 / Revised: 4 January 2022 / Accepted: 9 January 2022 / Published: 15 January 2022
(This article belongs to the Special Issue Progresses in Agro-Geoinformatics)

Abstract

:
Digital solutions in agricultural management promote food security and support the sustainable use of resources. As a result, remote sensing (RS) can be seen as an innovation for the fast generation of reliable information for agricultural management. Near real-time processed RS data can be used as a tool for decision making on multiple scales, from subplot to the global level. This high potential is not yet fully applied, due to often limited access to ground truth information, which is crucial for the development of transferable applications and acceptance. In this study we present a digital workflow for the acquisition, processing and dissemination of agroecological information based on proprietary and open-source software tools with state-of-the-art web-mapping technologies. Data is processed in near real-time and thus can be used as ground truth information to enhance quality and performance of RS-based products. Data is disseminated by easy-to-understand visualizations and download functionalities for specific application levels to serve specific user needs. It thus can increase expert knowledge and can be used for decision support at the same time. The fully digital workflow underpins the great potential to facilitate quality enhancement of future RS products in the context of precision agriculture by safeguarding data quality. The generated FAIR (findable, accessible, interoperable, reusable) datasets can be used to strengthen the relationship between scientists, initiatives and stakeholders.

1. Introduction

The importance of digital solutions in agricultural management to promote food security and support the protection of ecosystems and thus ecosystem services, e.g., through the collection of agroecological data, has been repeatedly underlined by the World Programme for the Census of Agriculture [1]. The FAO [1] emphasizes the high relevance of IT for data collection and processing through significant reductions of processing time and improvements in reliability. In this context, remote sensing (RS) can be assessed as an innovation with high potential for agricultural management [2,3]. RS applications in agriculture include, among others, crop type identification, biomass estimation, yield projection, land use and land cover change classification, assignment of management zones, assessments of soil properties such as organic matter, pH, moisture and clay content [4,5,6]. Integratively used, e.g., in on-farm systems [7,8,9], RS contributes to the digitalization of agriculture, hence allowing scientists, farmers, agribusiness, and political decision makers to monitor and evaluate agricultural systems at individual levels [10,11,12]. Provided as digital solutions with near real-time processing, RS-based information can be used as a tool for decision making on multiple scales, from subplot (e.g., management zones) to regional and global levels [13]. However, this high potential is not yet fully applied, in part because of often limited access to ground truth information, which in turn would help practitioners evaluate the reliability of the selected product.
The full access to ground truthing data in time is crucial for most RS technologies to enhance product quality, to reduce preprocessing time of products and to ensure near real-time provision of information, knowledge transfer and thus decision making [14,15]. Different approaches exist to gain progress in this sector, ranging from on-farm management tools [9] to supra-national monitoring frameworks with varying amounts and types of RS data [13]. From the latter one the project sen4cap is well-known. It aims at delivering algorithms, workflows and best practices for agriculture monitoring in the context of the European Union Common Agriculture Policy (CAP) [16,17,18]. All these efforts have in common that they need acceptance for their successful application in reality [19]. In order to become accepted and commercialized, big data applications such as RS must meet the five dimensions: ‘volume’, ‘velocity’, ‘variety’, ‘veracity’ and ‘valorization’ [20]. Even though it is not necessary to meet all five dimensions for all big data applications [20], Kamilaris et al. [2] highlight veracity above all, e.g., product quality, accuracy and reliability as useful to develop transferable and robust algorithms and harmonize maps [21,22] and thus is necessary for the acceptance of RS in the field of agricultural management. Additionally, Giuliani et al. [23] and Nativi et al. [24] point to a still-limited access to ground truth information, which is crucial for the development of transferable near real-time applications.
Thus, an omnipresent challenge is the access to comparable and documented ground truth data. Additionally, the FAO [1] proposes the usage of IT for data archiving which would enable a wider reuse of data, including historical analysis and the benefits for the dissemination of information and products. Traditional pen and paper collection requires time-intensive postprocessing of hand-written paper sheets to access and archive information digitally. Through the promotion of digitalization in this sector, there is an increasing number of digital tools available for general applications [25,26,27,28], for digital in situ data collection and also linking with RS data [29].
However, if the data is not stored in accessible databases, the re-use of ground truth data remains difficult. In that case the risk of physical data loss (fragmented availability) and data loss due to missing documentation is high. Digital solutions such as accessible databases are available, e.g., in the fields of agrometeorology [30,31] or for verification of land use/cover information [32]. However, digital surveys, online databases of biophysical in situ parameters or the combination of both are rare for biophysical information under varying vegetation cover [33,34,35].
International initiatives including GEOSS [24] or validation networks such as the Joint Experiment for Crop Assessment and Monitoring (JECAM) are great opportunities to promote the generation of such databases. For instance, in JECAM experiments have been undertaken, data exchange, harmonization and documentation of collection methods are established in a standardized manner [36]. With a view on near real-time applications for precision agriculture including farm management decisions or yield projections, such accessible ground truth databases are crucial for at least some essential variables, such as the “Essential Climate, Biodiversity or Water Variables” [23], and access has to be near real-time.
Thus, the deployment of datasets for other applications is often time-consuming and expensive. Hence, the usability of this big data is mostly provided with a timely delay.
Some efforts have been made in order to support digital ground truth data collections, at least in some fields of RS [13,37,38,39,40,41,42].
Access to ground truth information includes (a) availability of in situ databases, (b) appropriate documentation and (c) standardization of protocols for in situ measurements or at least interoperability which in turn allows harmonization of the in situ data collected to follow the FAIR principles [43]. According to Coetzee et al. [44], one big challenge remains raising awareness of the efficacy of FAIR open geospatial data. The need for FAIR cross-sectoral data encompasses that data should be findable (i.e., through metadata and globally unique identifier), should be accessible by standardized free communication protocols, should be interoperable and reusable [45]. By the use of FAIR and open data collection frameworks, in situ data can converge scientific approaches for best monitoring practices in different agricultural systems in combination with policies [46] and decision making [47,48]. Active participation of farmers for data collection would increase trust in the provided information and improve the standardized and FAIR digital data collection and dissemination in agriculture. This can provide a substantial contribution to the Sustainable Development Goals (SDG) [1].
Thus, there is a strong need for the connection of agricultural research networks and databases to facilitate information access and flow between different research disciplines in the context of FAIR open data for sustainable and precision agriculture [37]. In this study we present a digital data management workflow of in situ data from the field to the database for the standardized data collection, processing and dissemination of agroecological ground data. Our developed framework of InsituDB is focused on widely used field data collection methods of three different parameter groups, biophysical, pedological and spectral, beneficial for agricultural applications of RS. The field methods are oriented on JECAM and Copernicus initiatives. The workflow innovatively uses state-of-the-art geospatial technologies and data management, including near real-time quality control. The goal was the conception and implementation of a transferable process chain from data acquisition to service-based presentation and subsequent utilization by a wide range of users. The focus is not only on the data sets themselves, but also on the broad use of the developed process chains, in the sense of a transferable best-practice use-case.

2. Materials and Methods

The development of the digital data collection and visualization framework, InsituDB, is embedded in the ongoing scientific activities of the Durable Environmental Multidisciplinary Monitoring Information Network (DEMMIN). DEMMIN is part of the international Joint Experiment for Crop Assessment and Monitoring (JECAM) and the terrestrial environmental observatories network (TERENO), an interdisciplinary and long-term research program coordinated by six Helmholtz Association Centers, Germany [49].

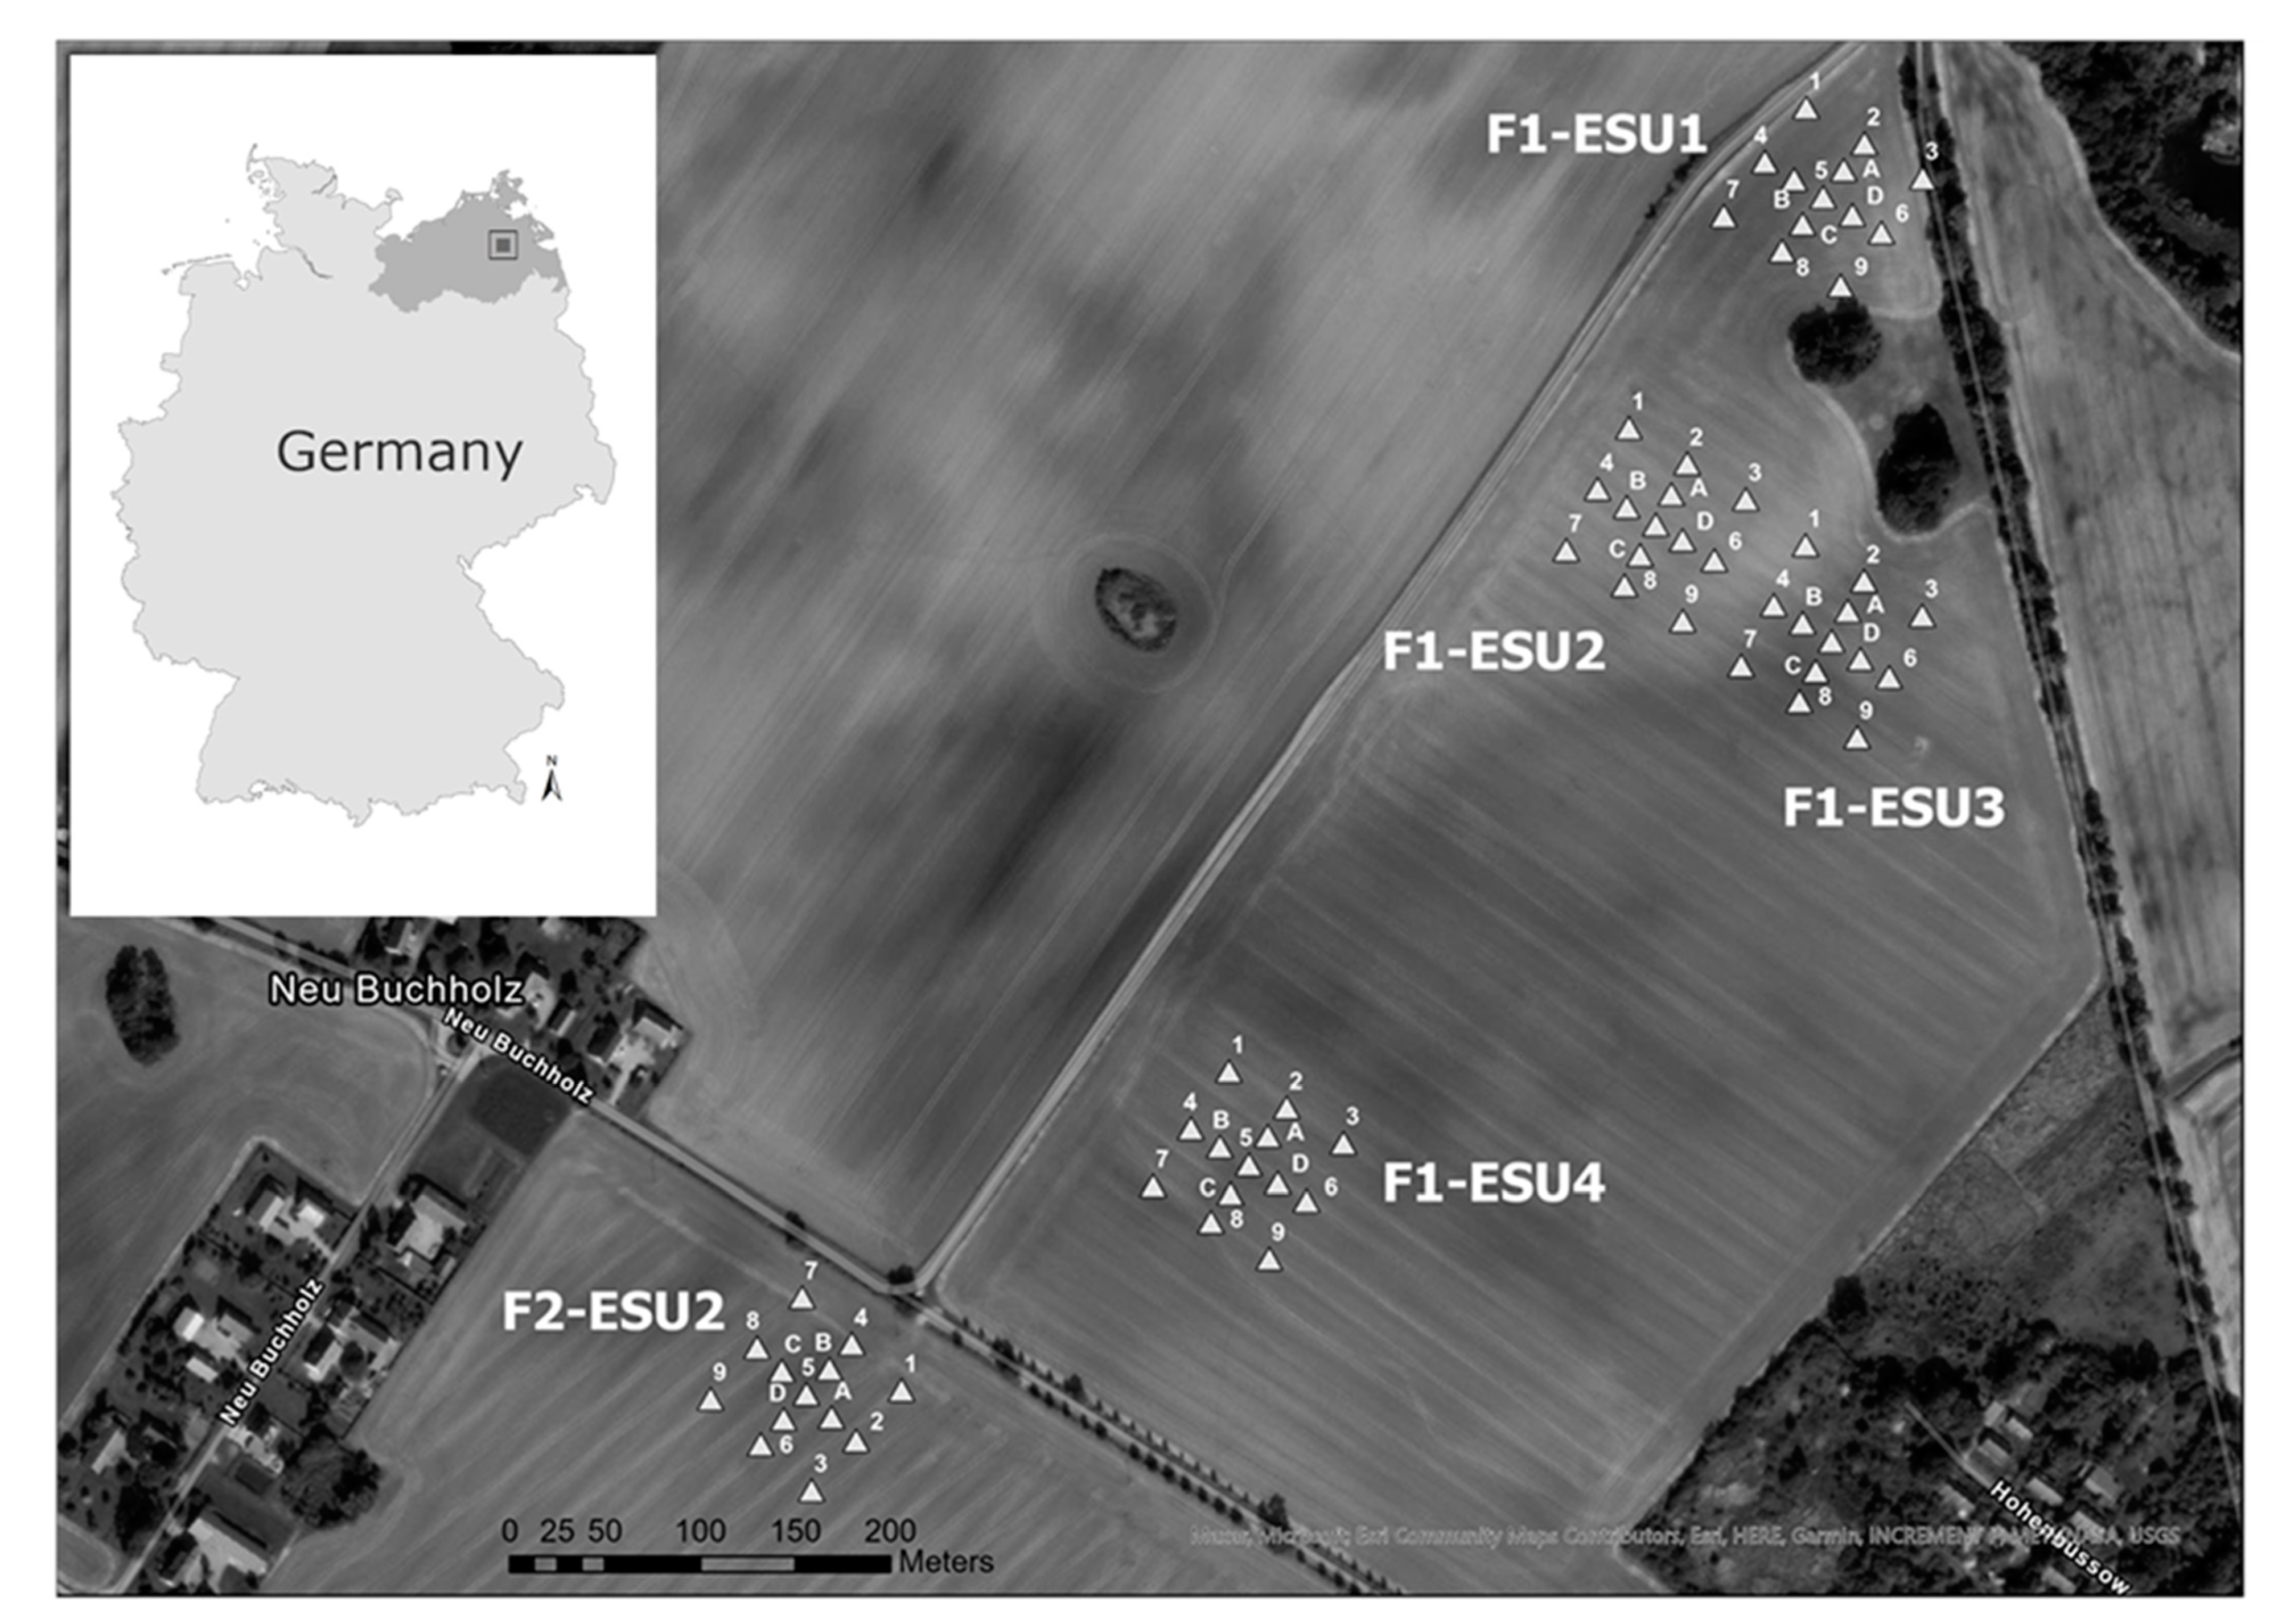
2.1. Study Site: DEMMIN

The DEMMIN test site is situated in North-East Germany (54°2′54.29″N, 12°52′17.98″E to 53°45′40.42″N, 13°27′49.45″E) in an intensely agriculturally used, mostly commercial environment.
The test site was established in 1999 as a cooperation of the German Aerospace Center (DLR) with local farmers and since 2011 is part of the TERENO observatory ‘North-East German Lowlands’, managed by the GeoForschungszentrum (GFZ) in Potsdam [50].
As an environmental monitoring network, the DEMMIN test site operates more than 40 measurement stations with scientific instruments for measuring atmospheric and soil parameters, e.g., up- and downwelling shortwave and longwave radiation, relative air moisture, temperature, leaf moisture, wind speed and direction, as well as soil temperature and moisture at different depth on a regular interval of 15 min. Although, several parameters are collected automatically, some require regular field campaigns. These field campaigns are conducted manually and follow a standardized protocol that includes the acquisition of information on phenology, canopy height, canopy cover, chlorophyll content and LAI, as well as soil moisture and spectrometric signatures [51]. Details on collected agroecological parameters and measurement devices can be found in Table S1.
As shown in Figure 1 Elementary Sampling Units (ESU) were aligned as squares with an edge length of 72 m according to geometric resolution of RS data [52,53,54]. Each ESU consists of 13 Secondary Sampling Units (SSUs) to assess spatial heterogeneity within an ESU. Nine of these are arranged in three rows of three sampling locations each and numbered from one to nine. Additionally, there is a quadrant of sampling locations around the center (SSU 5) labeled A through D [52].

2.2. Prerequisites and challenges

For the development of the workflow, which consists of a digital survey instrument for data acquisition in the field, subsequent processing, visualization and dissemination, some practical challenges need to be considered. First of all, the ability to be used in areas with weak or no network coverage is a major advantage, especially when working in the field. The survey instrument must have the ability for asynchronous transfer of data from digital survey instrument to the database storage to guarantee data backup on the device itself and synchronization to the database storage when network is available. In addition, the information collected must be accessible at every stage of acquisition to ensure data quality and possible data corrections after acquisition in the field at the expert level. Some of the scientific measuring devices produce no digital data files, for instance the Konica Minolta SPAD-502PLUS which only shows raw data on the device display. Others use proprietary files and data formats, e.g., LI-COR LAI-2200, which are not directly transferable during acquisition. Thus, it must be possible to input raw data directly read from the device and to add post-processed data afterwards. Beside this, multi-user functionality is required to collect data on, for example, canopy cover by several estimators for the same location. Some of the biophysical parameters (e.g., canopy cover) are judged by expert estimations in the field. To ensure comparability and objectiveness, estimations should be evidenced by photographs. Therefore, image data handling is essential through either use on-board or plugged camera devices or to import external images. Moreover, essential metadata, such as geolocation and orientation of acquisition devices should be saved to the digital survey instrument to ensure postprocessing of imagery data.
When collecting data in the field, it may happen that individual parameters are not measurable or can be measured with more than one method. To accommodate these cases, the survey instrument should provide omission logic and support for default values.
The digital survey instrument must support system-side validation of input data to avoid systematic sampling errors and data anomalies, e.g., input of strings instead of integers or floating-point values instead of integer values. This is very important for further processing of raw data collected in the field, especially when data collection is accomplished by non-experts.
Finally, tools are needed within the data collection workflow to manipulate, aggregate and visualize the raw data collected in the field. These tools are to be developed within the framework of a service-oriented architecture (SOA) and should follow international standards and norms (ISO, OGC). They are implemented via web services that support interfaces for common file formats in the geosciences, e.g., CSV files, ESRI Shapefile format, GeoJSON and KML files, as well as Web Map Services (WMS) and Web Feature Services (WFS).

3. Results

The developed digital survey instrument InsituDB comprises four general parts. Part one consists of field data, which is acquired in the field. Data acquisition is divided into three independent surveys (vegetation, soil and spectrometry) and measurements are performed according to the mentioned parameters in Table S1. Part two of the survey contains data entry of laboratory measurements, normally conducted after field collection by analyzing samples in the laboratory. Part three is the data transfer from the field devices to the storage and processing server, which has to be fast and reliable to prevent data loss and to provide backup of data. The last part of InsituDB is the visualization and dissemination part, where raw data is processed, aggregated, visualized and ready for dissemination (see Figure 2).
Architecture: To meet the above-described pre-requisites the development of the digital survey instrument was completed using the software Survey123 from ESRI. It is a form-centric data collection tool, which supports smart forms with skip logic, defaults and multiple languages [55]. As Survey123 is totally embedded in the ArcGIS Enterprise infrastructure [56] it meets the criteria of SOA and follows international standards (e.g., OGC and ISO). Although, Survey123 is a proprietary software, it perfectly meets the criteria of network coverage by offline editing, image data handling functionality through appropriate interfaces, omission logic and system-side validation through the use of standardized programming language XLSForms. Thus, for the first part (data acquisition) the benefits outweigh potential impediments of being proprietary. Hybrid deployment ensures that distributed collaboration is leveraged to integrate GIS data across a network of participants and meets the pre-requisites of multi-user functionality. For the development of surveys created with ESRI Survey123 the open standard of XLSForm is used. XLSForm is an instrument that enables survey development using human-readable formats based on spreadsheets. A detailed list of surveyed parameters and corresponding data types and input restrictions is presented in Table S2.
Due to restricted accessibility of ArcGIS Online as a proprietary storage environment and to broaden the dissemination and re-use of information, we used ArcGIS Representational State Transfer (REST) communication protocol to migrate data from data acquisition in the field into an open data service through the JavaScript Object Notation (JSON) scripting language [57]. PostgreSQL database within Drupal WCMS was chosen because within its taxonomic subsystem it offers a wide variety of functions for semantic and spatial classification of temporal and thematic data views [58]. Further key benefits of Drupal environment are high suitability for creating integrated digital frameworks, which combine add-ons and modules to allow accessibility at every stage and furthermore provides advanced data analysis functionalities (e.g., interactive charts, corresponding data views and geostatistical aggregations). The entire workflow of transferring and processing data from field devices to the online visualization platform is presented in Figure 2.
The asynchronously captured datasets are synchronized from ArcGIS Online to the PostgreSQL database on demand. This creates a complete backup of the raw data in PostgreSQL, which is used for further data processing and is either automatically executed via cronjobs or can be triggered manually. This enables automated data processing, which can also take place in real time if there is good network coverage. The raw survey data is parsed via JSON interfaces using Python and PHP scripts. Therefore, the unique identifier (Survey123 Global ID) is used via python scripting to collect the respective data from the three surveys in use [59]. As a result, there is one normalized data entity in the PostgreSQL database for all captured information, instead of three different ones. Here the survey on vegetation serves as master survey, meaning that especially general information (e.g., date, crop type, campaign number, planting direction and performing institution), which are part of all three surveys, will be checked against the vegetation survey and modified respectively.
Although inadmissible entries are largely excluded by the logic of the data model implemented in the survey, a comprehensive evaluation of the data quality and data quantity by experts is indispensable. The process of quality assurance is accomplished via interactively queryable data views in Drupal.
After quality control, which is the first step after migration to the PostgreSQL database, the agglomeration of the geostatistical parameters (location and dispersion measures) is carried out via Python and SQL-based queries and their normalization in PostgreSQL tables. On this basis, a ‘semantic model’ is defined in Drupal, which accurately describes the value expressions of the parameters recorded in the field as entities and their relations in a computer-processable manner. Terms from existing ontologies and vocabularies are mapped via the semantic model and thus the improved classification, structuring and spatial retrieval of data elements are possible.
The classifications follow the given scale levels, which means that for the different aggregation levels, summaries of the measured parameters can be efficiently generated within interactively searchable data views, fulfilling the general requirements of FAIR services. Figure 3 shows an example of a summary of 13 single Secondary Sampling Units (SSUs) to Elementary Sampling Units (ESU) following the nomenclature of [52].
Based on the standardized sampling scheme and survey instrument, multi-temporal comparisons are possible to visualize and analyze in-year development of the measured parameters and inter-annual changes in the development of parameters during several vegetation periods.
As Figure 3 and Figure 4 demonstrate, the users have either the choice to use on-demand visualization provided by the InsituDB itself, or registered users have the option to download raw data for customized visualization and analysis. In order to allow the widest possible variety of data uses while complying with data protection regulations, hierarchized user groups have been created on the platform. These range from general users without registration for viewing standardized on demand visualizations to the download of raw data for interested registered user groups, such as farmers or scientists. Besides the raw data download and pre-defined visualizations of all datasets, the platform offers aggregated on demand visualizations, which comprise aggregates of SSUs to ESU scale level. The objective of this type of visualization is to present generalized individual measurements of SSUs to the coarser level of ESUs ([52]).
Furthermore, the platform provides download functionalities on all levels of visualization. This means that the aggregated visualizations can be downloaded in graphic file formats (e.g., png or jpg), or csv file format, as well as the download of the raw data for selected user groups. The selected user groups with raw data download functionality can choose between csv file format for processing in specific software, such as R, or other spreadsheet software (e.g., OpenOffice or Microsoft Excel) or direct integration of the dataset into geographic information systems via OGC-compliant web services such as WMS or JSON format.

4. Discussion

The InsituDB demonstrates how highly specified scientific data collected by a complex sampling scheme can be used in multiple ways and offered to different users and interest groups by means of latest data management and visualization techniques. The platform highlights the principles of FAIR open datasets. Datasets, and thus information, are findable on one common platform for the regions under investigation. This supports the demand for data provision as stated in [33,37,46,60] and continues further scientific research on RS product validation at the test site DEMMIN [61,62]. The datasets are linked to internationally renowned initiatives, such as JECAM, in the scope of remote sensing and they are also linked to research projects in the field of smart agriculture and thus are in accordance with the recommendations by Delgado et al. (2018) [37], Nagai et al. (2017) [41] and Nasahara and Nagai (2015) [42]. Nasahara and Nagai (2015) [42] recommend establishing interfaces to other research projects, such as GEOSS [24], GEOBON [63] or AgCROS [37], by providing consistent variable names, units and methods, which would also facilitate communication and cooperation and exchange between researcher and projects. They are accessible to experts via standardized and partly OGC-compliant file formats. In addition, most of the information is accessible to the interested public through easy-to-understand diagrams. The situation reference is clarified by interactive web mapping applications. The information from InsituDB is interoperable due to standardized and well documented sampling schemes. For instance, the documentation of the LAI device can be utilized to establish transfer functions among sensors and hence increase reliability of the validation process [64]. At the same time InsituDB data are reusable through different forms of aggregation and depth for a broad variety of analyses and thereby fit the requirements stated in [34] for the accessibility of data for re-use in meta-analysis or other research (c.f. [60]).
An often-mentioned hindrance for the utilization of big data in general is the topic of data ownership and control [46]. Within the InsituDB workflow this aspect is minimized by aggregated datasets which are freely available and preserve data privacy. Whereby, the call of Eagle et al. (2017) [34] to provide complete and full-factorial data for each year and location is safeguarded through full datasets, which are accessible after registration and enclose a notification of ownership and use restrictions. The development and integration of the InsituDB into scientific research and teaching concepts at the university level benefits the active utilization of data and the training of young future scientists. The training of young students on how to collect field data and use these in combination with RS products is the optimal way to qualify future decision makers and of supporting the demanded changes in education for data-intensive research by Elliott et al. (2016) [35].
For practical work in the field, the workflow for the digital acquisition of agroecological parameters shows several advantages compared to traditional pen and paper collection (c.f. [65]). In former times, traditional paper sheets needed to be digitized manually and often with problems of readability due to blurred records because of rainy conditions in the field, or even missing sheets due to lack of attention of the surveying people. Digitally acquired information need less postprocessing time. Furthermore, digitally acquired ground-truth data from multiple locations and evidenced by images from the ground are saved together as a digital pair and can enhance image interpretation for RS products afterwards [41]. This benefit is in line with [66]. Digital acquisition avoids spelling mistakes or the problem of record legibility. Secondly, the predefined standardized sampling scheme is represented by the input fields of the survey tools, including skip logic and mandatory field entries (c.f. [67]). Thus, the number of parameters to be acquired is predefined and the risk of missing single parameters is eliminated compared to paper notes. This is in accordance to the recommended data acquisition and dissemination through data entry templates as suggested by [37]. Reliable data storage prevents data loss by storing data as backup on individual input devices, as well as on the interim ArcGIS Online platform.
The data entry templates further offer tracking options to minimize systematic errors, e.g., if minute takers do not correctly enter data, or measuring devices show distortions that may not be recognized by the measuring person. In practice, this property of InsituDB enables to easily cross-check field campaigns that were conducted by different research partners in DEMMIN. This particularly allows for more campaigns and hence increased field data acquisition, which in turn increases the reliability of the developed RS products for agriculture.
In summary, the advantages of the developed workflow for digital recording in the field outweigh those of classical survey techniques in terms of cost-benefit efficiency (c.f. [68]). Although the first component of InsituDB, the survey application ESRI Survey123 is part of a proprietary and commercial software suite and it has some significant advantages in comparison to open-source applications such as ODK Collect or similar. The first and most significant advantage is the direct integration of the application into GIS workflows. As ESRI Survey123 is strongly interlinked with the ArcGIS Online platform, the surveyed information is directly captured as geodata. Once developed as an ESRI Survey123 input mask, it can be published as freely available with no need for subscription to the ArcGIS environment. Through the use of a freely available weblink, the input mask is accessible for the interested public. Furthermore, the use of the proprietary software suite from ESRI as an interim stage, encompassing ArcGIS Enterprise platform and Survey123 software leverages sustainable data and software infrastructures for data acquisition, where developer-sided innovations and changes will be adapted and harmonized by commercial providers rather than individual modifications within the established workflow. Thus, the system remains robust and functional in the face of further developments in the IT environment ([46,68]). Data can be downloaded or stored as shapefile or ESRI feature service from the interim stage ArcGIS Online. As Survey123 is part of the ESRI software suite, the dissemination of the survey is much easier via internet-based synchronization instead of manual installation and configuration. Due to the network dissemination, user groups can be individually defined, and users have a direct communication to the developer of the survey, as they can see who is the owner of that survey and the application provides contact details. The third advantage is the easy preparation and configuration of the survey elements themselves. The use of XLSForms as the basis for the surveys, even allows non-geoinformatics to compile advanced survey routines ([69]). Combined with detailed documentation and an active community, frequently occurring issues and specific questions are answered timely ([69,70]).
Although the benefits of the survey tool ESRI Survey123 outperform other tools, there are still some pitfalls and limitations when developing a complex survey instrument. For example, problems exist when subsequently adding or changing data types for individual survey elements. Whereas the subsequent addition of new input fields is easily possible without changing or damaging existing datasets, the modification of existing input fields (e.g., changing input type decimal number to text or vice versa) is hardly possible without damaging existing datasets. Thus, the creation of the final survey instrument needs precise planning and testing before publishing the survey to be used in the field. During the development of the presented workflow, the conceptualization and implementation of more than 200 data fields within the survey tool was one of the biggest challenges. The evaluation in the field inevitably led to time-consuming iterative revisions due to the great complexity of the data collection campaign.
Secondly, although the dissemination of the final survey version is mainly accomplished via the internet, all devices used for field collection need to be updated periodically. Another issue is battery capacity of the used devices. Working for more than six hours on a sunny day with full display brightness of the device and usage of GPS-enabled geolocation can shorten the battery life enormously (c.f. [68]).
Another bottleneck within the developed workflow are currently the limitations for the visualization and aggregation tool within the InsituDB. While the visualization and aggregation are performed automatically, a few required data have to be corrected manually. This is the case, for example, for the leaf area index (LAI) parameter, as the LiCOR instrument used stores the information in binary format within the instrument itself, and the LAI values entered into the survey tool need to be changed after correcting the raw LAI value from the LiCOR instrument using special software provided by the manufacturer. Thus, the mapped information must be analyzed in depth by experts or other systems must be used for estimating LAI values fully digital ([65]). In addition, monitoring of the acquired data to identify, e.g., aforementioned systematic errors or other unreliable aspects within the data, also requires expert attention.

5. Conclusions

With the benefits and limitations of the developed survey tool and their integration into a complete workflow from field acquisition to online dissemination and visualization in mind, the InsituDB represents a significant advancement in providing remote sensing ground truthing data for RS and disseminating research information to a wide range of users. The prescribed approach follows the recommendations and need for further research of [36] who highlight the importance of in situ observation data for benchmarking performance and robustness of RS classification algorithms for cropland and management and the usage as validation data for national or global land use land cover products.
InsituDB shows great potential to facilitate quality enhancement of future RS products in the focus of precision agriculture by safeguarding data quality with common statistical measures as they are implemented in the workflow ([34]). It addresses numerous parameters collected in the JECAM initiative world-wide and may be used with minor adjustments by other JECAM sites for agricultural field data collection and hence for the further development of essential agricultural variables and core information products in future. The example of digital capture and provision of scientific data shown here should inspire others to participate in FAIR datasets, thereby creating closer linkages between scientists, initiatives and other stakeholders to jointly progress on the way to more sustainable agricultural production and in general to achieve some of the relevant Sustainable Development Goals.

Supplementary Materials

The following are available online at https://www.mdpi.com/article/10.3390/rs14020393/s1, Table S1: Measurement topics and devices for field data collection, Table S2: Data fields and formats of collected parameters in ESRI Survey123.

Author Contributions

Conceptualization, M.T. and C.C.; methodology, M.T. and D.T.; software, M.T., D.T. and P.A; validation, D.T., P.A. and C.C.; formal analysis, M.T.; investigation, M.T., D.T., P.A. and C.C.; resources, C.C.; data curation, P.A. and D.T.; writing—original draft preparation, M.T.; writing—review and editing, D.T. and C.C.; visualization, M.T. and D.T.; supervision, C.C.; project administration, M.T.; funding acquisition, C.C. All authors have read and agreed to the published version of the manuscript.

Funding

We acknowledge the financial support within the funding programme Open Access Publishing by the German Research Foundation (DFG).

Data Availability Statement

Data are available in a publicly accessible repository that does not issue DOIs. Publicly available datasets were analyzed in this study. This data can be found here: https://insitu.geo.uni-halle.de/phenology/demmin (accessed on 8 January 2022).

Acknowledgments

We want to highly acknowledge the following persons involved in the study. The whole staff at the Daberkower Landhof AG in Kruckow, Germany for providing access to the field plots used for validation. Christopher Krause for his enormous contribution in preparing the first versions of the ESRI Survey123 application.

Conflicts of Interest

The authors declare no conflict of interest.

References

  1. FAO. World Programme for the Census of Agriculture 2020. Volume 2 Operational Guidelines; FAO statistical development series; FAO: Rome, Italy, 2018; Volume 16, ISBN 978-92-5-131032-8. [Google Scholar]
  2. Kamilaris, A.; Kartakoullis, A.; Prenafeta-Boldú, F.X. A Review on the Practice of Big Data Analysis in Agriculture. Comput. Electron. Agric. 2017, 143, 23–37. [Google Scholar] [CrossRef]
  3. Lytos, A.; Lagkas, T.; Sarigiannidis, P.; Zervakis, M.; Livanos, G. Towards Smart Farming: Systems, Frameworks and Exploitation of Multiple Sources. Comput. Netw. 2020, 172, 107147. [Google Scholar] [CrossRef]
  4. Mercier, A.; Betbeder, J.; Baudry, J.; Le Roux, V.; Spicher, F.; Lacoux, J.; Roger, D.; Hubert-Moy, L. Evaluation of Sentinel-1 & 2 Time Series for Predicting Wheat and Rapeseed Phenological Stages. ISPRS J. Photogramm. Remote Sens. 2020, 163, 231–256. [Google Scholar] [CrossRef]
  5. Mulla, D.J. Twenty Five Years of Remote Sensing in Precision Agriculture: Key Advances and Remaining Knowledge Gaps. Biosyst. Eng. 2013, 114, 358–371. [Google Scholar] [CrossRef]
  6. Weiss, M.; Jacob, F.; Duveiller, G. Remote Sensing for Agricultural Applications: A Meta-Review. Remote Sens. Environ. 2020, 236, 111402. [Google Scholar] [CrossRef]
  7. Abd El-Kader, S.M.; Mohammad El-Basioni, B.M. Precision Agriculture Technologies for Food Security and Sustainability; Advances in Environmental Engineering and Green Technologies; IGI Global: Hershey, PA, USA, 2021; Available online: https://www.igi-global.com/gateway/book/244644 (accessed on 8 January 2022)ISBN 978-1-79985-000-7.
  8. Fajardo, M.; Whelan, B.M. Within-farm Wheat Yield Forecasting Incorporating Off-farm Information. Precis. Agric. 2021, 22, 569–585. [Google Scholar] [CrossRef]
  9. Wolfe, M.L.; Richard, T.L. 21st Century Engineering for On-Farm Food–Energy–Water Systems. Curr. Opin. Chem. Eng. 2017, 18, 69–76. [Google Scholar] [CrossRef]
  10. Khanal, S.; Kc, K.; Fulton, J.P.; Shearer, S.; Ozkan, E. Remote Sensing in Agriculture—Accomplishments, Limitations, and Opportunities. Remote Sens. 2020, 12, 3783. [Google Scholar] [CrossRef]
  11. Sishodia, R.P.; Ray, R.L.; Singh, S.K. Applications of Remote Sensing in Precision Agriculture: A Review. Remote Sens. 2020, 12, 3136. [Google Scholar] [CrossRef]
  12. Whitcraft, A.K.; Becker-Reshef, I.; Justice, C.O.; Gifford, L.; Kavvada, A.; Jarvis, I. No Pixel Left behind: Toward Integrating Earth Observations for Agriculture into the United Nations Sustainable Development Goals Framework. Remote Sens. Environ. 2019, 235, 111470. [Google Scholar] [CrossRef]
  13. Defourny, P.; Bontemps, S.; Bellemans, N.; Cara, C.; Dedieu, G.; Guzzonato, E.; Hagolle, O.; Inglada, J.; Nicola, L.; Rabaute, T.; et al. Near Real-Time Agriculture Monitoring at National Scale at Parcel Resolution: Performance Assessment of the Sen2-Agri Automated System in Various Cropping Systems around the World. Remote Sens. Environ. 2019, 221, 551–568. [Google Scholar] [CrossRef]
  14. Weersink, A.; Fraser, E.; Pannell, D.; Duncan, E.; Rotz, S. Opportunities and Challenges for Big Data in Agricultural and Environmental Analysis. Annu. Rev. Resour. Econ. 2018, 10, 19–37. [Google Scholar] [CrossRef]
  15. Wolfert, S.; Ge, L.; Verdouw, C.; Bogaardt, M.-J. Big Data in Smart Farming—A Review. Agric. Syst. 2017, 153, 69–80. [Google Scholar] [CrossRef]
  16. Bontemps, S.; Bajec, K.; Cara, C.; Defourny, P.; de Vendictis, L.; Heymans, D.; Kucera, L.; Malcorps, P.; Milcinski, G.; Nicola, L.; et al. Sen4CAP—Sentinels for Common Agricultural Policy: System Software User Manual 2020; ESA: Louvain-la-Neuve, Belgium, 2021. [Google Scholar]
  17. Koetz, B.; Defourny, P.; Bontemps, S.; Bajec, K.; Cara, C.; de Vendictis, L.; Kucera, L.; Malcorps, P.; Milcinski, G.; Nicola, L.; et al. SEN4CA—Sentinels for CAP Monitoring Approach. In Proceedings of the 2019 JRC IACS Workshop, Valladolid, Spain, 10–11 April 2019. [Google Scholar]
  18. ESA. Sen4cap—Project Background. Available online: http://esa-sen4cap.org/content/project-background (accessed on 28 December 2021).
  19. Long, T.B.; Blok, V.; Coninx, I. Barriers to the Adoption and Diffusion of Technological Innovations for Climate-Smart Agriculture in Europe: Evidence from the Netherlands, France, Switzerland and Italy. J. Clean. Prod. 2016, 112, 9–21. [Google Scholar] [CrossRef]
  20. Chi, M.; Plaza, A.; Benediktsson, J.A.; Sun, Z.; Shen, J.; Zhu, Y. Big Data for Remote Sensing: Challenges and Opportunities. Proc. IEEE 2016, 104, 2207–2219. [Google Scholar] [CrossRef]
  21. Manakos, I.; Lavender, S. Remote Sensing in Support of the Geo-Information in Europe. In Land Use and Land Cover Mapping in Europe; Manakos, I., Braun, M., Eds.; Remote Sensing and Digital Image Processing; Springer: Dordrecht, The Netherlands, 2014; Volume 18, pp. 3–10. ISBN 978-94-007-7968-6. [Google Scholar]
  22. Nativi, S.; Bigagli, L. Discovery, Mediation, and Access Services for Earth Observation Data. IEEE J. Sel. Top. Appl. Earth Obs. Remote Sens. 2009, 2, 233–240. [Google Scholar] [CrossRef]
  23. Giuliani, G.; Egger, E.; Italiano, J.; Poussin, C.; Richard, J.-P.; Chatenoux, B. Essential Variables for Environmental Monitoring: What Are the Possible Contributions of Earth Observation Data Cubes? Data 2020, 5, 100. [Google Scholar] [CrossRef]
  24. Nativi, S.; Mazzetti, P.; Santoro, M.; Papeschi, F.; Craglia, M.; Ochiai, O. Big Data Challenges in Building the Global Earth Observation System of Systems. Environ. Model. Softw. 2015, 68, 1–26. [Google Scholar] [CrossRef]
  25. Craglia, M.; Nativi, S. Mind the Gap: Big Data vs. Interoperability and Reproducibility of Science. In Earth Observation Open Science and Innovation; Mathieu, P.-P., Aubrecht, C., Eds.; Springer International Publishing: Cham, Switzerland, 2018; pp. 122–141. ISBN 978-3-319-65632-8. [Google Scholar]
  26. Giuliani, G.; Masó, J.; Mazzetti, P.; Nativi, S.; Zabala, A. Paving the Way to Increased Interoperability of Earth Observations Data Cubes. Data 2019, 4, 113. [Google Scholar] [CrossRef] [Green Version]
  27. Lehmann, A.; Masò, J.; Nativi, S.; Giuliani, G. Towards Integrated Essential Variables for Sustainability. Int. J. Digit. Earth 2020, 13, 158–165. [Google Scholar] [CrossRef]
  28. Pettorelli, N.; Safi, K.; Turner, W. Satellite Remote Sensing, Biodiversity Research and Conservation of the Future. Philos. Trans. R. Soc. B 2014, 369, 20130190. [Google Scholar] [CrossRef] [PubMed]
  29. Bastin, L.; Buchanan, G.; Beresford, A.; Pekel, J.-F.; Dubois, G. Open-Source Mapping and Services for Web-Based Land-Cover Validation. Ecol. Inform. 2013, 14, 9–16. [Google Scholar] [CrossRef] [Green Version]
  30. JRC. Gridded Agro-Meteorological Data in Europe. 2021. Available online: https://agri4cast.jrc.ec.europa.eu/DataPortal/SignIn.aspx?idResource=7&o=d (accessed on 18 August 2021).
  31. WMO. Data Collection or Production Centre (DCPC) for the World Weather Information Service (WWIS). 2021. Available online: https://dcpc.worldweather.org/dcpc/ (accessed on 18 August 2021).
  32. Institute for Environment and Sustainability. LUCAS Topsoil Survey: Methodology, Data and Results; EU Commission JRC: Luxembourg, 2013. [Google Scholar]
  33. Cushing, J.B.; Kaplan, N.E.; Laney, C.; Mallett, J.; Ramsey, K.; Vanderbilt, K.L.; Zeman, L.; Gao, J.; Kruger, J.; LeRoy, C.; et al. Integrating Ecological Data: Notes from the Grasslands ANPP Data Integration Project. In Proceedings of the Ecoinformatics Conference Service, Environmental Information Management 2008, Albuquerque, NM, USA, 10–11 September 2008. [Google Scholar]
  34. Eagle, A.J.; Christianson, L.E.; Cook, R.L.; Harmel, R.D.; Miguez, F.E.; Qian, S.S.; Ruiz Diaz, D.A. Meta-Analysis Constrained by Data: Recommendations to Improve Relevance of Nutrient Management Research. Agron. J. 2017, 109, 2441–2449. [Google Scholar] [CrossRef] [Green Version]
  35. Elliott, K.C.; Cheruvelil, K.S.; Montgomery, G.M.; Soranno, P.A. Conceptions of Good Science in Our Data-Rich World. Bioscience 2016, 66, 880–889. [Google Scholar] [CrossRef]
  36. Jolivot, A.; Lebourgeois, V.; Ameline, M.; Andriamanga, V.; Bellón, B.; Castets, M.; Crespin-Boucaud, A.; Defourny, P.; Diaz, S.; Dieye, M.; et al. Harmonized in Situ JECAM Datasets for Agricultural Land Use Mapping and Monitoring in Tropical Countries. Earth Syst. Sci. Data 2021, 13, 5951–5967. [Google Scholar] [CrossRef]
  37. Delgado, J.A.; Vandenberg, B.; Kaplan, N.; Neer, D.; Wilson, G.; D’Adamo, R.; Carter, J.; O’Gan, L.; Grow, N.; Marquez, R.; et al. Agricultural Collaborative Research Outcomes System (AgCROS): A Network of Networks Connecting Food Security, the Environment, and Human Health. J. Soil Water Conserv. 2018, 73, 158A–164A. [Google Scholar] [CrossRef] [Green Version]
  38. ESA. Copernicus: Factsheet Agriculture Socio-Economic Benefits. 2018. Available online: https://www.copernicus.eu/sites/default/files/2018-11/10%20FACTSHEETS_Socio-economic_V3%203.pdf# (accessed on 21 July 2021).
  39. Herold, M.; Woodcock, C.E.; di Gregorio, A.; Mayaux, P.; Belward, A.S.; Latham, J.; Schmullius, C.C. A Joint Initiative for Harmonization and Validation of Land Cover Datasets. IEEE Trans. Geosci. Remote Sens. 2006, 44, 1719–1727. [Google Scholar] [CrossRef]
  40. Kobayashi, K.; Nasahara, K.; Tadono, T.; Ohgushi, F.; Dotsu, M.; Dan, R. Development and Update of “SACLAJ” a Multi-Temporal Ground Truth Dataset of Land Cover. In Proceedings of the International Symposium on Remote Sensing, Nagoya University, Nagoya, Japan, 17–19 May 2017. [Google Scholar]
  41. Nagai, S.; Nasahara, K.N.; Akitsu, T.K.; Saitoh, T.M.; Muraoka, H. Importance of the Collection of Abundant Ground-Truth Data for Accurate Detection of Spatial and Temporal Variability of Vegetation by Satellite Remote Sensing. In Geophysical Monograph Series; Dontsova, K., Balogh-Brunstad, Z., Le Roux, G., Eds.; Wiley: Hoboken, NJ, USA, 2020; pp. 223–244. ISBN 978-1-119-41330-1. [Google Scholar]
  42. Nasahara, K.N.; Nagai, S. Review: Development of an in Situ Observation Network for Terrestrial Ecological Remote Sensing: The Phenological Eyes Network (PEN). Ecol. Res. 2015, 30, 211–223. [Google Scholar] [CrossRef]
  43. Wilkinson, M.D.; Dumontier, M.; Aalbersberg, I.J.J.; Appleton, G.; Axton, M.; Baak, A.; Blomberg, N.; Boiten, J.-W.; Da Silva Santos, L.B.; Bourne, P.E.; et al. The FAIR Guiding Principles for Scientific Data Management and Stewardship. Sci. Data 2016, 3, 160018. [Google Scholar] [CrossRef] [PubMed] [Green Version]
  44. Coetzee, S.; Ivánová, I.; Mitasova, H.; Brovelli, M.A. Open Geospatial Software and Data: A Review of the Current State and A Perspective into the Future. ISPRS Int. J. Geo-Inf. 2020, 9, 90. [Google Scholar] [CrossRef] [Green Version]
  45. Pommier, C.; Michotey, C.; Cornut, G.; Roumet, P.; Duchêne, E.; Flores, R.; Lebreton, A.; Alaux, M.; Durand, S.; Kimmel, E.; et al. Applying FAIR Principles to Plant Phenotypic Data Management in GnpIS. Plant. Phenomics 2019, 2019, 1671403. [Google Scholar] [CrossRef] [PubMed] [Green Version]
  46. Rotz, S.; Duncan, E.; Small, M.; Botschner, J.; Dara, R.; Mosby, I.; Reed, M.; Fraser, E.D.G. The Politics of Digital Agricultural Technologies: A Preliminary Review. Sociol. Rural. 2019, 59, 203–229. [Google Scholar] [CrossRef]
  47. Capalbo, S.M.; Antle, J.M.; Seavert, C. Next Generation Data Systems and Knowledge Products to Support Agricultural Producers and Science-Based Policy Decision Making. Agric. Syst. 2017, 155, 191–199. [Google Scholar] [CrossRef] [PubMed]
  48. Klerkx, L.; Jakku, E.; Labarthe, P. A Review of Social Science on Digital Agriculture, Smart Farming and Agriculture 4.0: New Contributions and a Future Research Agenda. NJAS-Wagening. J. Life Sci. 2019, 90, 100315. [Google Scholar] [CrossRef]
  49. Tereno. Tereno Test Site DEMMIN. 2021. Available online: https://www.tereno.net/joomla/index.php/observatories/northeast-german-lowland-observatory/test-sites (accessed on 17 November 2021).
  50. Spengler, D.; Ahmadian, N.; Borg, E.; Harfenmeister, K.; Hohmann, C.; Hüttich, C.; Itzerott, S.; Maass, H.; Missling, K.-D.; Schmullius, C.; et al. The German JECAM Site DEMMIN: Status and Future Perspectives. In Proceedings of the Annual JECAM Meeting, Taichung, Taiwan, 17–20 September 2018. [Google Scholar]
  51. Borg, E.; Conrad, C.; Truckenbrodt, S.; Hüttich, C.; Ahmadian, N.; Thorsten, D.; Heupel, K.; Spengler, D.; Missling, K.-D. Joint Experiment for Crop Assessment and Monitoring (JECAM) Test Site DEMMIN 2018. In Proceedings of the International Geoscience and Remote Sensing Symposium, IGARSS 2018, the 38th Annual Symposium, Valencia, Spain, 24 August 2018. [Google Scholar]
  52. Morisette, J.T.; Baret, F.; Privette, J.L.; Myneni, R.B.; Nickeson, J.E.; Garrigues, S.; Shabanov, N.V.; Weiss, M.; Fernandes, R.A.; Leblanc, S.G.; et al. Validation of Global Moderate-Resolution LAI Products: A Framework Proposed within the CEOS Land Product Validation Subgroup. IEEE Trans. Geosci. Remote Sens. 2006, 44, 1804–1817. [Google Scholar] [CrossRef] [Green Version]
  53. Baret, F.; Weiss, M.; Allard, D.; Garrigues, S.; Leroy, M. VALERI: A Network of Sites and a Methodology for the Validation of Medium Spatial Resolution Land Satellite Products 2021. ffhal-03221068f. Available online: https://hal.inrae.fr/hal-03221068 (accessed on 8 January 2022).
  54. Ding, Y.; Ge, Y.; Hu, M.; Wang, J.; Wang, J.; Zheng, X.; Zhao, K. Comparison of Spatial Sampling Strategies for Ground Sampling and Validation of MODIS LAI Products. Int. J. Remote Sens. 2014, 35, 7230–7244. [Google Scholar] [CrossRef]
  55. ESRI ArcGIS Survey123 Smarter Forms, Smarter Data Collection. Available online: https://www.esri.com/en-us/arcgis/products/arcgis-survey123/overview (accessed on 21 July 2021).
  56. ESRI Esri Education Institution License Program Overview—International. Available online: https://www.esri.com/content/dam/esrisites/en-us/media/pdf/Esri-Edu-Institution-License-Program-Overview-Intl-7-2019.pdf (accessed on 21 July 2021).
  57. ESRI ArcGIS REST API—Working with Services You’ve Published. Available online: https://developers.arcgis.com/rest/services-reference/working-with-services-you-ve-published.htm (accessed on 21 July 2021).
  58. DRUPAL DRUPAL. Available online: https://www.drupal.org/ (accessed on 21 July 2021).
  59. ESRI How Can I Share My Data with a Member of Another Organization? Available online: https://doc.arcgis.com/de/arcgis-online/reference/faq.htm#anchor90 (accessed on 21 July 2021).
  60. Herzmann, D.E.; Abendroth, L.J.; Bunderson, L.D. Data Management Approach to Multidisciplinary Agricultural Research and Syntheses. J. Soil Water Conserv. 2014, 69, 180A–185A. [Google Scholar] [CrossRef] [Green Version]
  61. Dhillon, M.S.; Dahms, T.; Kuebert-Flock, C.; Borg, E.; Conrad, C.; Ullmann, T. Modelling Crop Biomass from Synthetic Remote Sensing Time Series: Example for the DEMMIN Test Site, Germany. Remote Sens. 2020, 12, 1819. [Google Scholar] [CrossRef]
  62. Hosseini, M.; McNairn, H.; Mitchell, S.; Robertson, L.D.; Davidson, A.; Ahmadian, N.; Bhattacharya, A.; Borg, E.; Conrad, C.; Dabrowska-Zielinska, K.; et al. A Comparison between Support Vector Machine and Water Cloud Model for Estimating Crop Leaf Area Index. Remote Sens. 2021, 13, 1348. [Google Scholar] [CrossRef]
  63. Scholes, R.J.; Mace, G.M.; Turner, W.; Geller, G.N.; Jürgens, N.; Larigauderie, A.; Muchoney, D.; Walther, B.A.; Mooney, H.A. Toward a Global Biodiversity Observing System. Science 2008, 321, 1044–1045. [Google Scholar] [CrossRef]
  64. Fang, H.; Baret, F.; Plummer, S.; Schaepman-Strub, G. An Overview of Global Leaf Area Index (LAI): Methods, Products, Validation, and Applications. Rev. Geophys. 2019, 57, 739–799. [Google Scholar] [CrossRef]
  65. Chianucci, F. An Overview of in Situ Digital Canopy Photography in Forestry. Can. J. For. Res. 2019, 227–242. [Google Scholar] [CrossRef]
  66. Bateman, H.L.; Lindquist, T.E.; Whitehouse, R.; Gonzalez, M.M. Mobile Application for Wildlife Capture-Mark-Recapture Data Collection and Query: Mobile Application for Field Studies. Wildl. Soc. Bull. 2013, 37, 838–845. [Google Scholar] [CrossRef]
  67. McCaffrey, K.J.W.; Jones, R.R.; Holdsworth, R.E.; Wilson, R.W.; Clegg, P.; Imber, J.; Holliman, N.; Trinks, I. Unlocking the Spatial Dimension: Digital Technologies and the Future of Geoscience Fieldwork. J. Geol. Soc. 2005, 162, 927–938. [Google Scholar] [CrossRef] [Green Version]
  68. Andrachuk, M.; Marschke, M.; Hings, C.; Armitage, D. Smartphone Technologies Supporting Community-Based Environmental Monitoring and Implementation: A Systematic Scoping Review. Biol. Conserv. 2019, 237, 430–442. [Google Scholar] [CrossRef]
  69. Wich, S.A.; Piel, A.K. Conservation Technology; Oxford University Press: New York, NY, USA, 2021; ISBN 978-0-19-885024-3. [Google Scholar]
  70. Teacher, A.G.F.; Griffiths, D.J.; Hodgson, D.J.; Inger, R. Smartphones in Ecology and Evolution: A Guide for the App-Rehensive. Ecol. Evol. 2013, 3, 5268–5278. [Google Scholar] [CrossRef]
Figure 1. Study area and Elementary Sampling Unit Design (ESU) of the winter wheat sampling campaign in 2021. The campaign was conducted on two fields (F1, F2). A ESU comprises of 13 Secondary Sampling Units (SSU). Nine of these are arranged in three rows of three sampling locations each and numbered from one to nine. Additionally, there is a quadrant of sampling locations around the center (SSU 5) labeled A through D. All sampling locations are aligned according to the management direction to minimize conflicts with regular management activities.
Remotesensing 14 00393 g001
Figure 2. Schematic data flow from collection in the field to standardized web-based Fair Data Services.
Remotesensing 14 00393 g002
Figure 3. Visualization of aggregation of single SSUs to ESU exemplified by the Fractional Vegetation Cover (FVC).
Remotesensing 14 00393 g003
Figure 4. In-season and interannual comparison of measured canopy height exemplified by ESU 1 for winter wheat for the years 2018, 2019 and 2021. Dark greyish, light greyish and white boxplots display the campaigns in 2018, 2019 and 2021, respectively.
Remotesensing 14 00393 g004
Publisher’s Note: MDPI stays neutral with regard to jurisdictional claims in published maps and institutional affiliations.

