Article

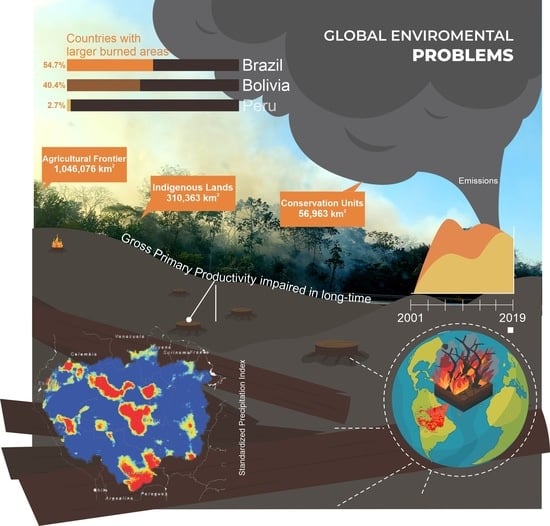
Fires Drive Long-Term Environmental Degradation in the Amazon Basin

by
Carlos Antonio da Silva Junior
1,*,
Mendelson Lima
2,
Paulo Eduardo Teodoro
3,
José Francisco de Oliveira-Júnior
4,
Fernando Saragosa Rossi
5,
Beatriz Miky Funatsu
6,
Weslei Butturi
2,
Thaís Lourençoni
2,
Aline Kraeski
7,
Tatiane Deoti Pelissari
2,
Francielli Aloisio Moratelli
7,
Damien Arvor
8,
Iago Manuelson dos Santos Luz
2,
Larissa Pereira Ribeiro Teodoro
3,
Vincent Dubreuil
8 and
Vinicius Modolo Teixeira
1
1
Department of Geography, State University of Mato Grosso (UNEMAT), Sinop 78555-000, Mato Grosso, Brazil
2
State University of Mato Grosso (UNEMAT), Alta Floresta 78580-000, Mato Grosso, Brazil
3
Federal University of Mato Grosso do Sul (UFMS), Chapadão do Sul 79560-000, Mato Grosso do Sul, Brazil
4
Federal University of Alagoas (UFAL), Maceió 57072-970, Alagoas, Brazil
5
State University of São Paulo (UNESP), Jaboticabal 14884-900, São Paulo, Brazil
6
CNRS, Université de Nantes, UMR6554 LETG, Chemin de la Censive du Tertre, BP 81227, CEDEX 3, 44312 Nantes, France
7
Federal University of Mato Grosso (UFMT), Sinop 78060-900, Mato Grosso, Brazil
8
CNRS, Université Rennes 2, UMR6554 LETG COSTEL, 35000 Rennes, France
*
Author to whom correspondence should be addressed.
Remote Sens. 2022, 14(2), 338; https://doi.org/10.3390/rs14020338
Submission received: 2 December 2021 / Revised: 30 December 2021 / Accepted: 8 January 2022 / Published: 12 January 2022
(This article belongs to the Special Issue Remote Sensing of the Amazon Region)

Abstract

:
The Amazon Basin is undergoing extensive environmental degradation as a result of deforestation and the rising occurrence of fires. The degradation caused by fires is exacerbated by the occurrence of anomalously dry periods in the Amazon Basin. The objectives of this study were: (i) to quantify the extent of areas that burned between 2001 and 2019 and relate them to extreme drought events in a 20-year time series; (ii) to identify the proportion of countries comprising the Amazon Basin in which environmental degradation was strongly observed, relating the spatial patterns of fires; and (iii) examine the Amazon Basin carbon balance following the occurrence of fires. To this end, the following variables were evaluated by remote sensing between 2001 and 2019: gross primary production, standardized precipitation index, burned areas, fire foci, and carbon emissions. During the examined period, fires affected 23.78% of the total Amazon Basin. Brazil had the largest affected area (220,087 fire foci, 773,360 km2 burned area, 54.7% of the total burned in the Amazon Basin), followed by Bolivia (102,499 fire foci, 571,250 km2 burned area, 40.4%). Overall, these fires have not only affected forests in agricultural frontier areas (76.91%), but also those in indigenous lands (17.16%) and conservation units (5.93%), which are recognized as biodiversity conservation areas. During the study period, the forest absorbed 1,092,037 Mg of C, but emitted 2908 Tg of C, which is 2.66-fold greater than the C absorbed, thereby compromising the role of the forest in acting as a C sink. Our findings show that environmental degradation caused by fires is related to the occurrence of dry periods in the Amazon Basin.

Graphical Abstract

1. Introduction

Regarding current climate change discussions, the Amazon is of special interest as it is a carbon (C) sink and home to a large biodiversity of plants and animals and is being threatened by deforestation and fire [1,2,3,4]. Despite its environmental importance, the Amazon has been exploited and degraded for decades as a result of the public policies imposed by the governments of the countries that share it. The forest and animals are being displaced by livestock, soybean plantations [5,6,7,8], land-reform projects [9], mining [10], hydroelectric constructions [11,12], and urbanization [13]. These rapid land use and land cover changes in the Amazon have recently been associated with an increase in greenhouse gas (GHG) emissions, mainly due to deforestation [14], in addition to the consequence of land use change on soil quality [15], such as declining soil organic carbon (SOC) [16,17]. In Brazil, the current political scenario has induced an intensification of these processes as a result of significant changes in laws, policies, and environmental regulations [18,19].
In recent years, the frequency and intensity of fires have increased worldwide, especially during dry years. Globally, fires and deforestation are the main causes of biodiversity loss in the tropics [20,21,22], and the expectation is that without, a reduction in the present disturbance rates, undisturbed forests will have entirely disappeared in large tropical humid regions by 2050 [23]. In the Amazon, the use of fire is the fastest, most efficient, and least expensive way to clear a forested Amazonian agricultural frontier area and is often employed in protected areas, such as conservation units (CUs) and indigenous lands (ILs) [19,24]. Ranchers, farmers, miners, and land grabbers all employ this practice. A recent study that determined different types of fires that occur in the Amazon showed that deforestation fires are fires in areas that have been previously cleared and can invade standing forests; their drivers and positive feedbacks can lead to more fires in the region [25]. Such fires lead to the release of a significant amount of GHGs into the atmosphere [26,27,28].
In the Amazon region, fires are ubiquitous at the end of the dry season (September-October; e.g., Espinoza et al. [29]), but have often worsened in years of extreme drought (i.e., 2005, 2010, and 2015) [30,31,32,33]. Anomalously dry years are associated with tropical seas surface temperature anomalies [34,35,36]; high temperatures and low humidity provide favorable conditions for the rapid spread of fires [37,38]. These extreme-drought events have the potential to destabilize large areas by reducing rainfall and thereby increasing the risk of forest death [39], which could, in turn, lead to the further intensification of regional droughts as a result of vegetation loss [40]. A warmer and drier climate can lead to the mortality of plant species adapted to wetter climates [4], as well as a decrease in water recycling in the central part of the Amazon [41,42]. Researchers forecast a possibility of doubling of the burned area south of the Brazilian Amazon in the coming decades [43]. This projection is in accordance with the scenarios proposed by the Intergovernmental Panel on Climate Change, which are based on global numerical models [44] that indicate increased environmental degradation in the near future. Indeed, the Amazon ecosystem has been identified as a region with the highest vulnerability index in ecosystem function, particularly in areas of large-scale forest degradation and fragmentation [45].
Recently, advances in remote sensing have made it possible to quantify and monitor environmental degradation [1,14] caused by climate change [46], fires [47], changes in gross primary production (GPP) [48], and C supply [14]. Using the wide availability of products generated by remote orbital sensors, it is possible to study degradation in large areas, such as the Amazon Basin, over a relatively long span of time. However, some questions have yet to be answered about this region: is there a relationship between the duration of dry periods and fire foci extent? What is the impact of burning on C absorption and emissions? Can models/products generated from remote orbital sensors be used to estimate environmental degradation? Considering these questions, the objectives of this investigation were: (i) to quantify the extent of burned areas between 2001 and 2019 and relate them to drought events in a 20-year time series; (ii) to identify the proportion of countries making up the Amazon Basin that are responsible for environmental degradation and relate them to the spatial patterns of fires; and (iii) to analyze the basin’s capacity to absorb C produced by the occurrence of fires.

2. Materials and Methods
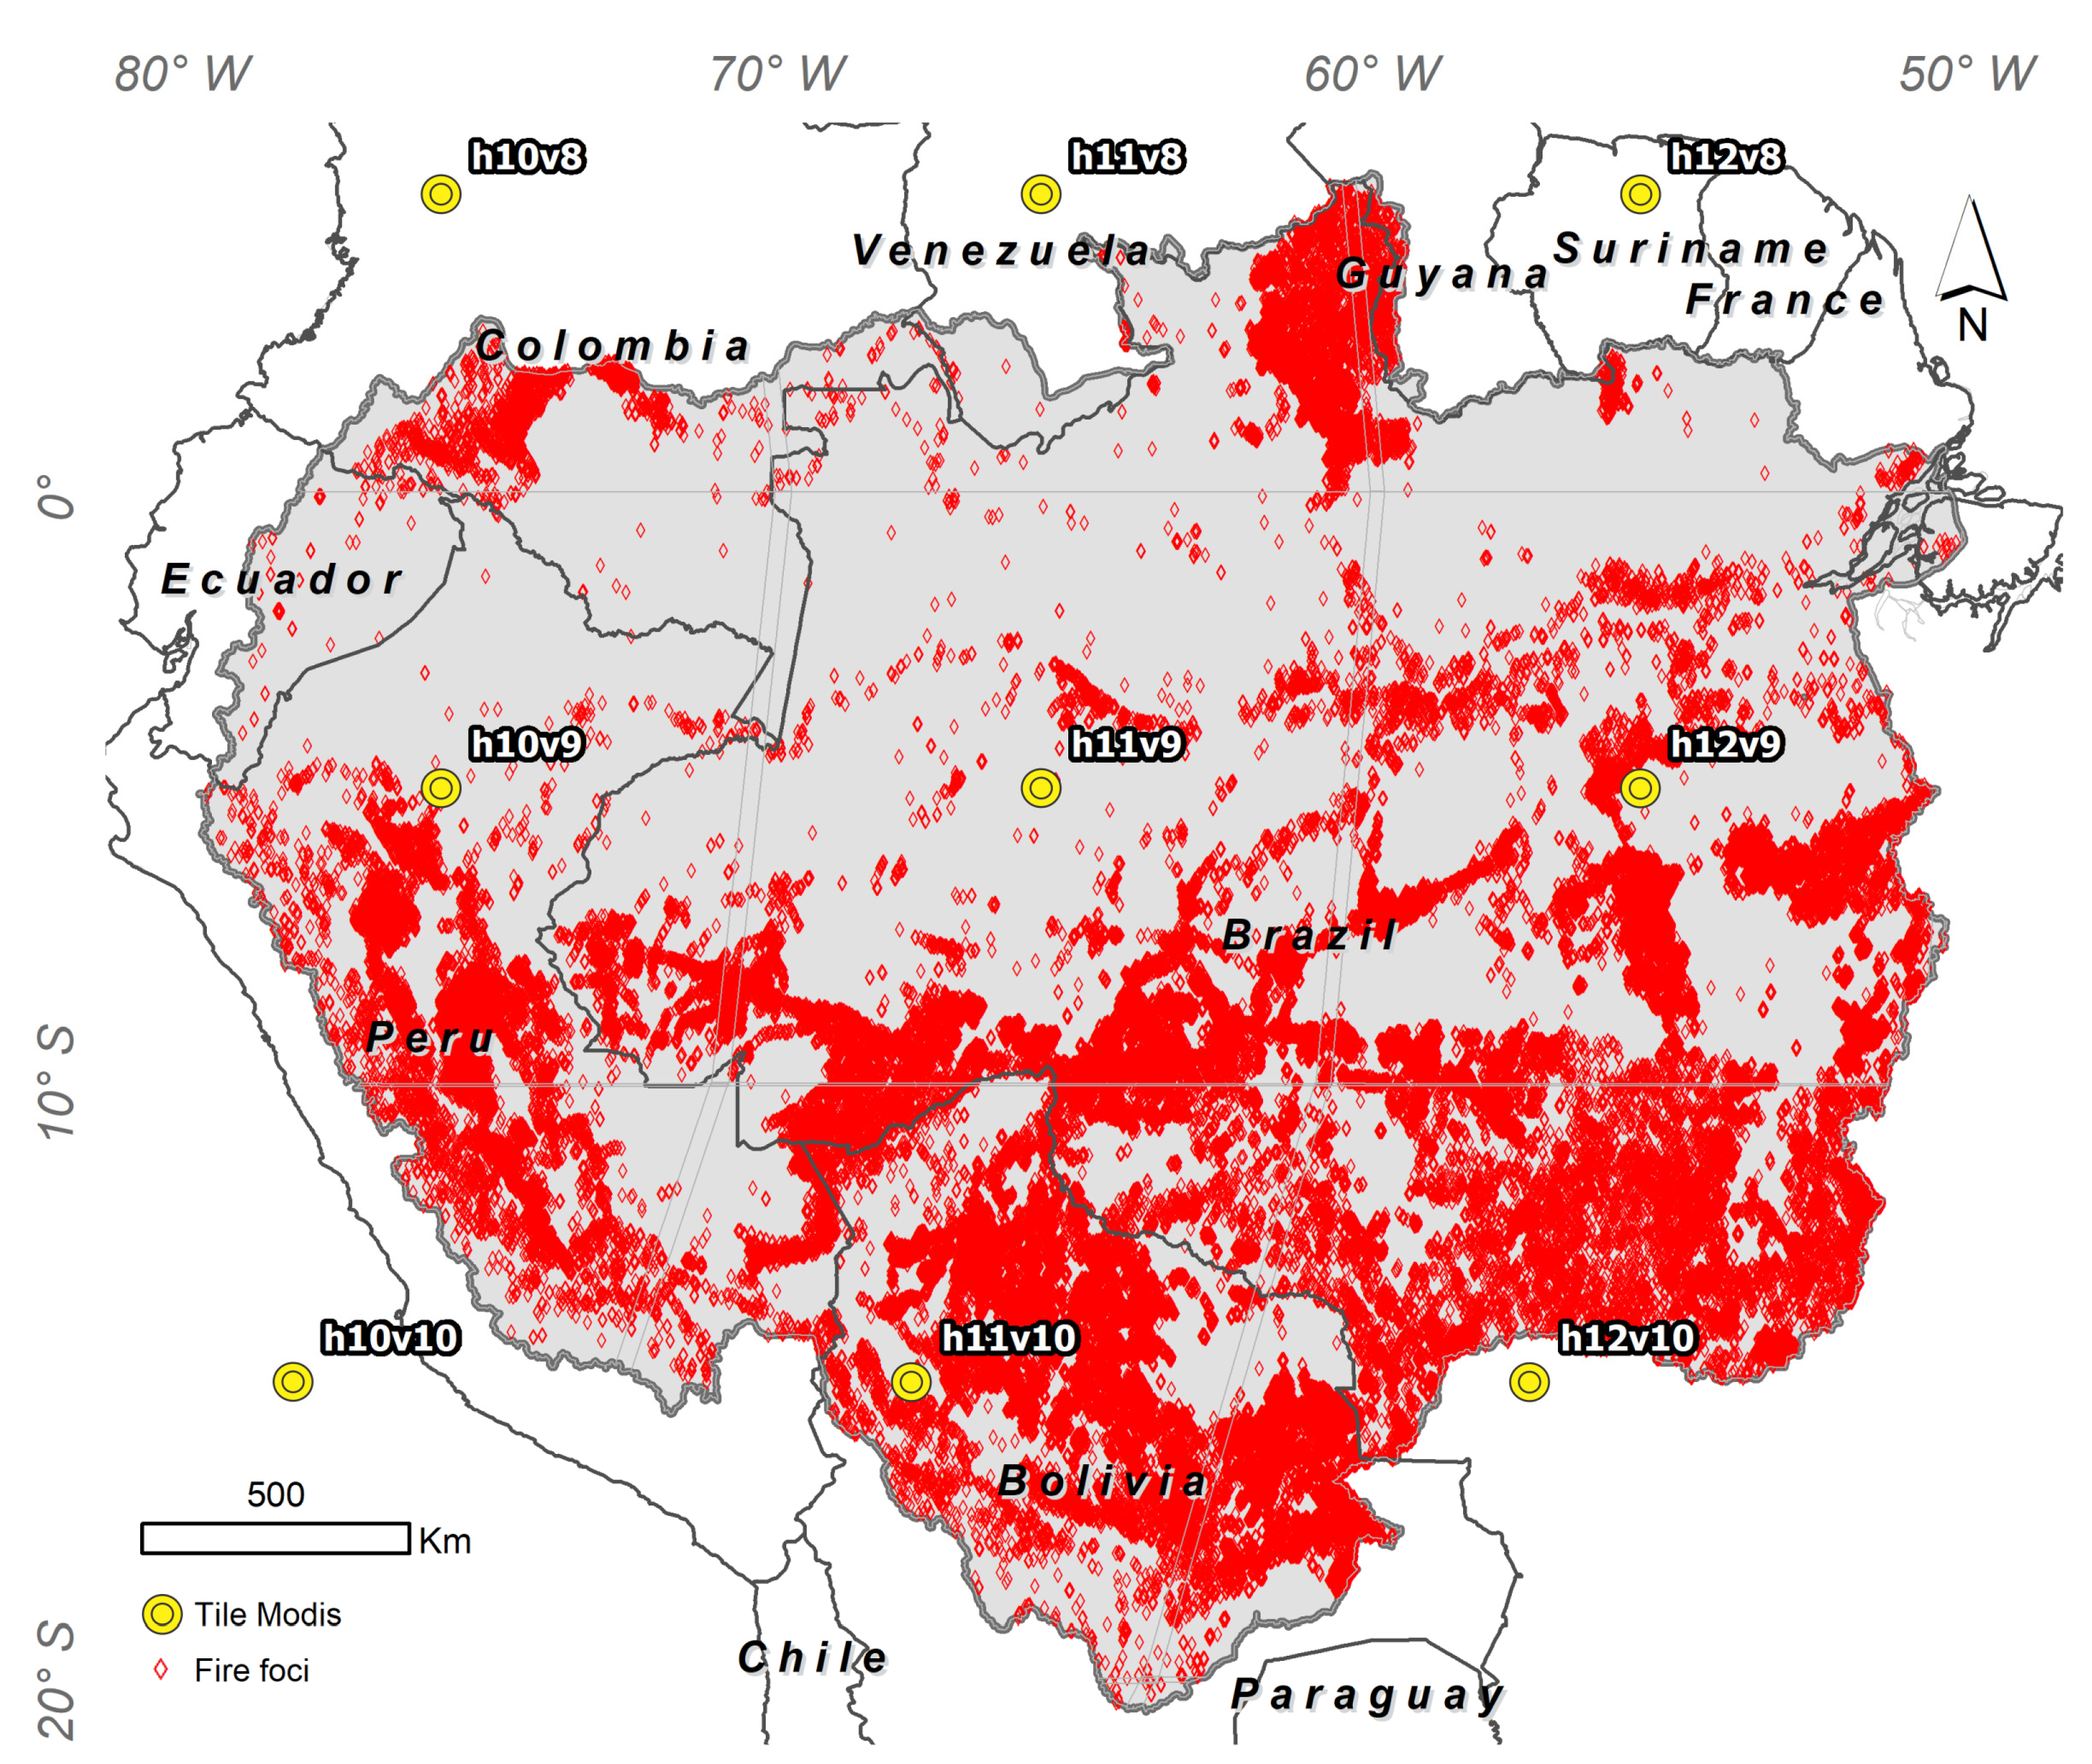
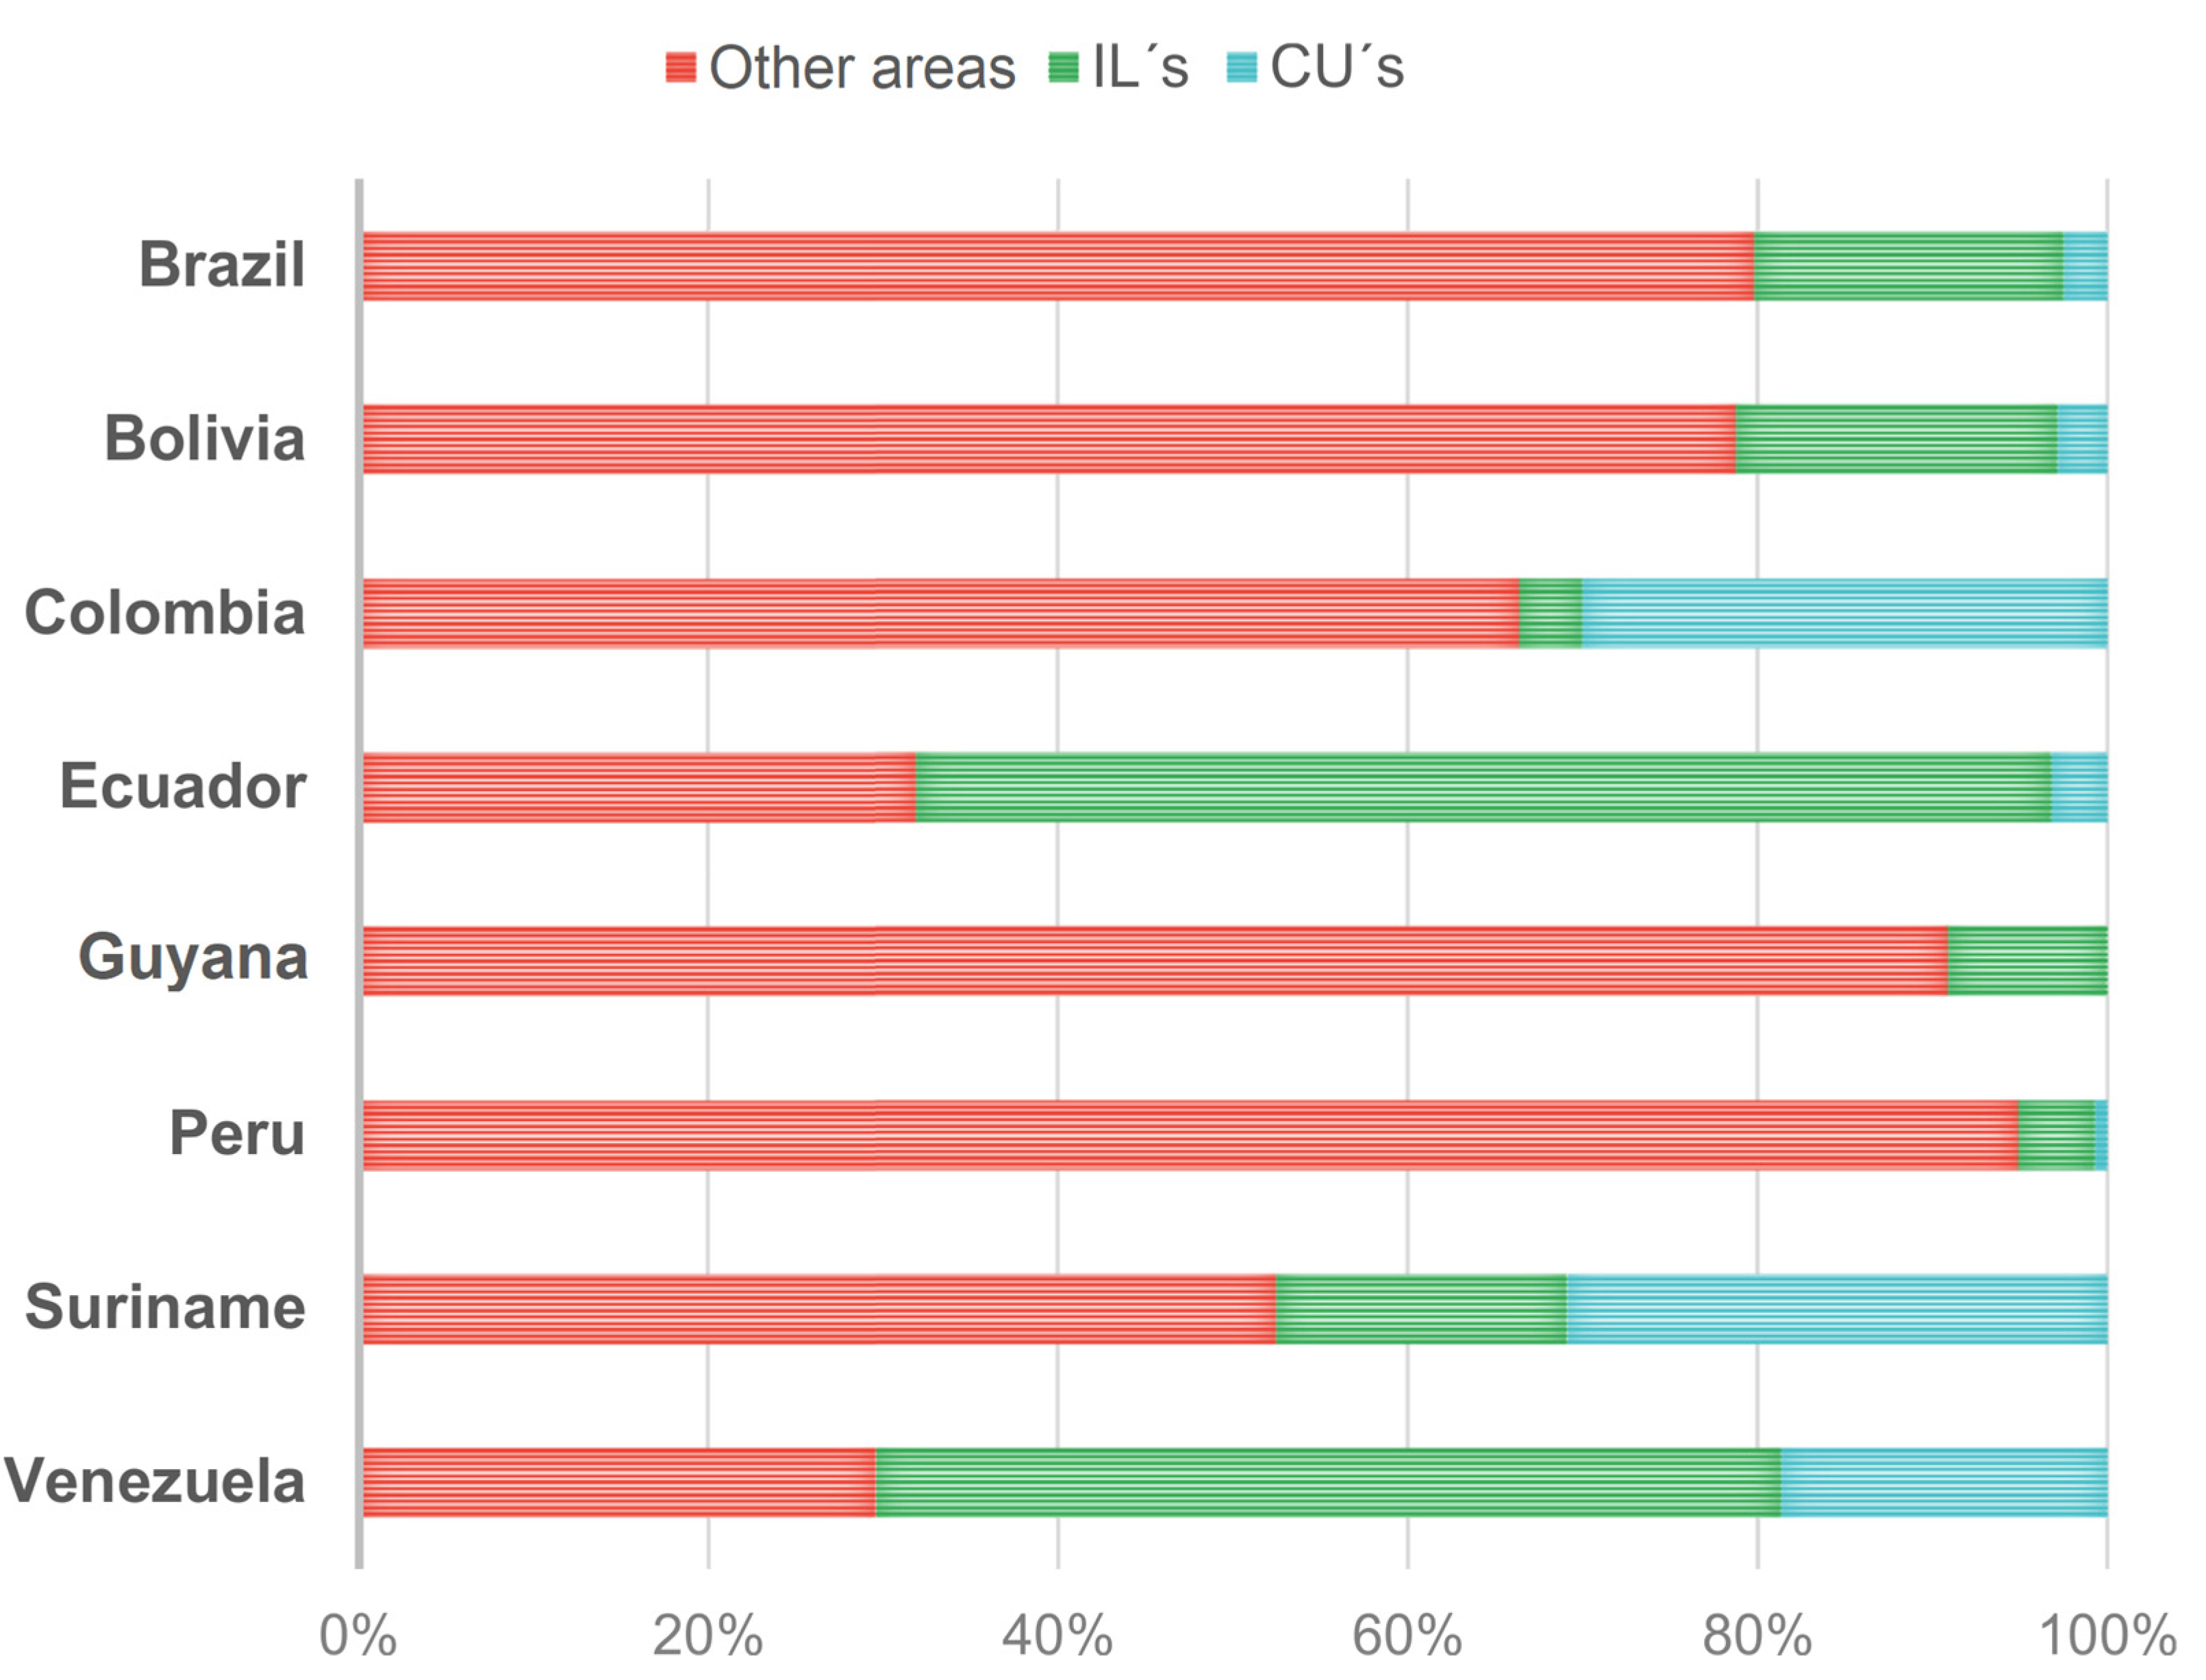
2.1. Study Area

The study area is located in the Amazon Basin (Figure 1). The ecoregion is spread over 6 million km2 (2.3 million mi2), and comprises the largest rainforest on Earth, as well as the largest river in terms of water volume. The basin spans eight countries, including Brazil, Peru, Bolivia, Colombia, Ecuador, Venezuela, Guyana, and Suriname [49].

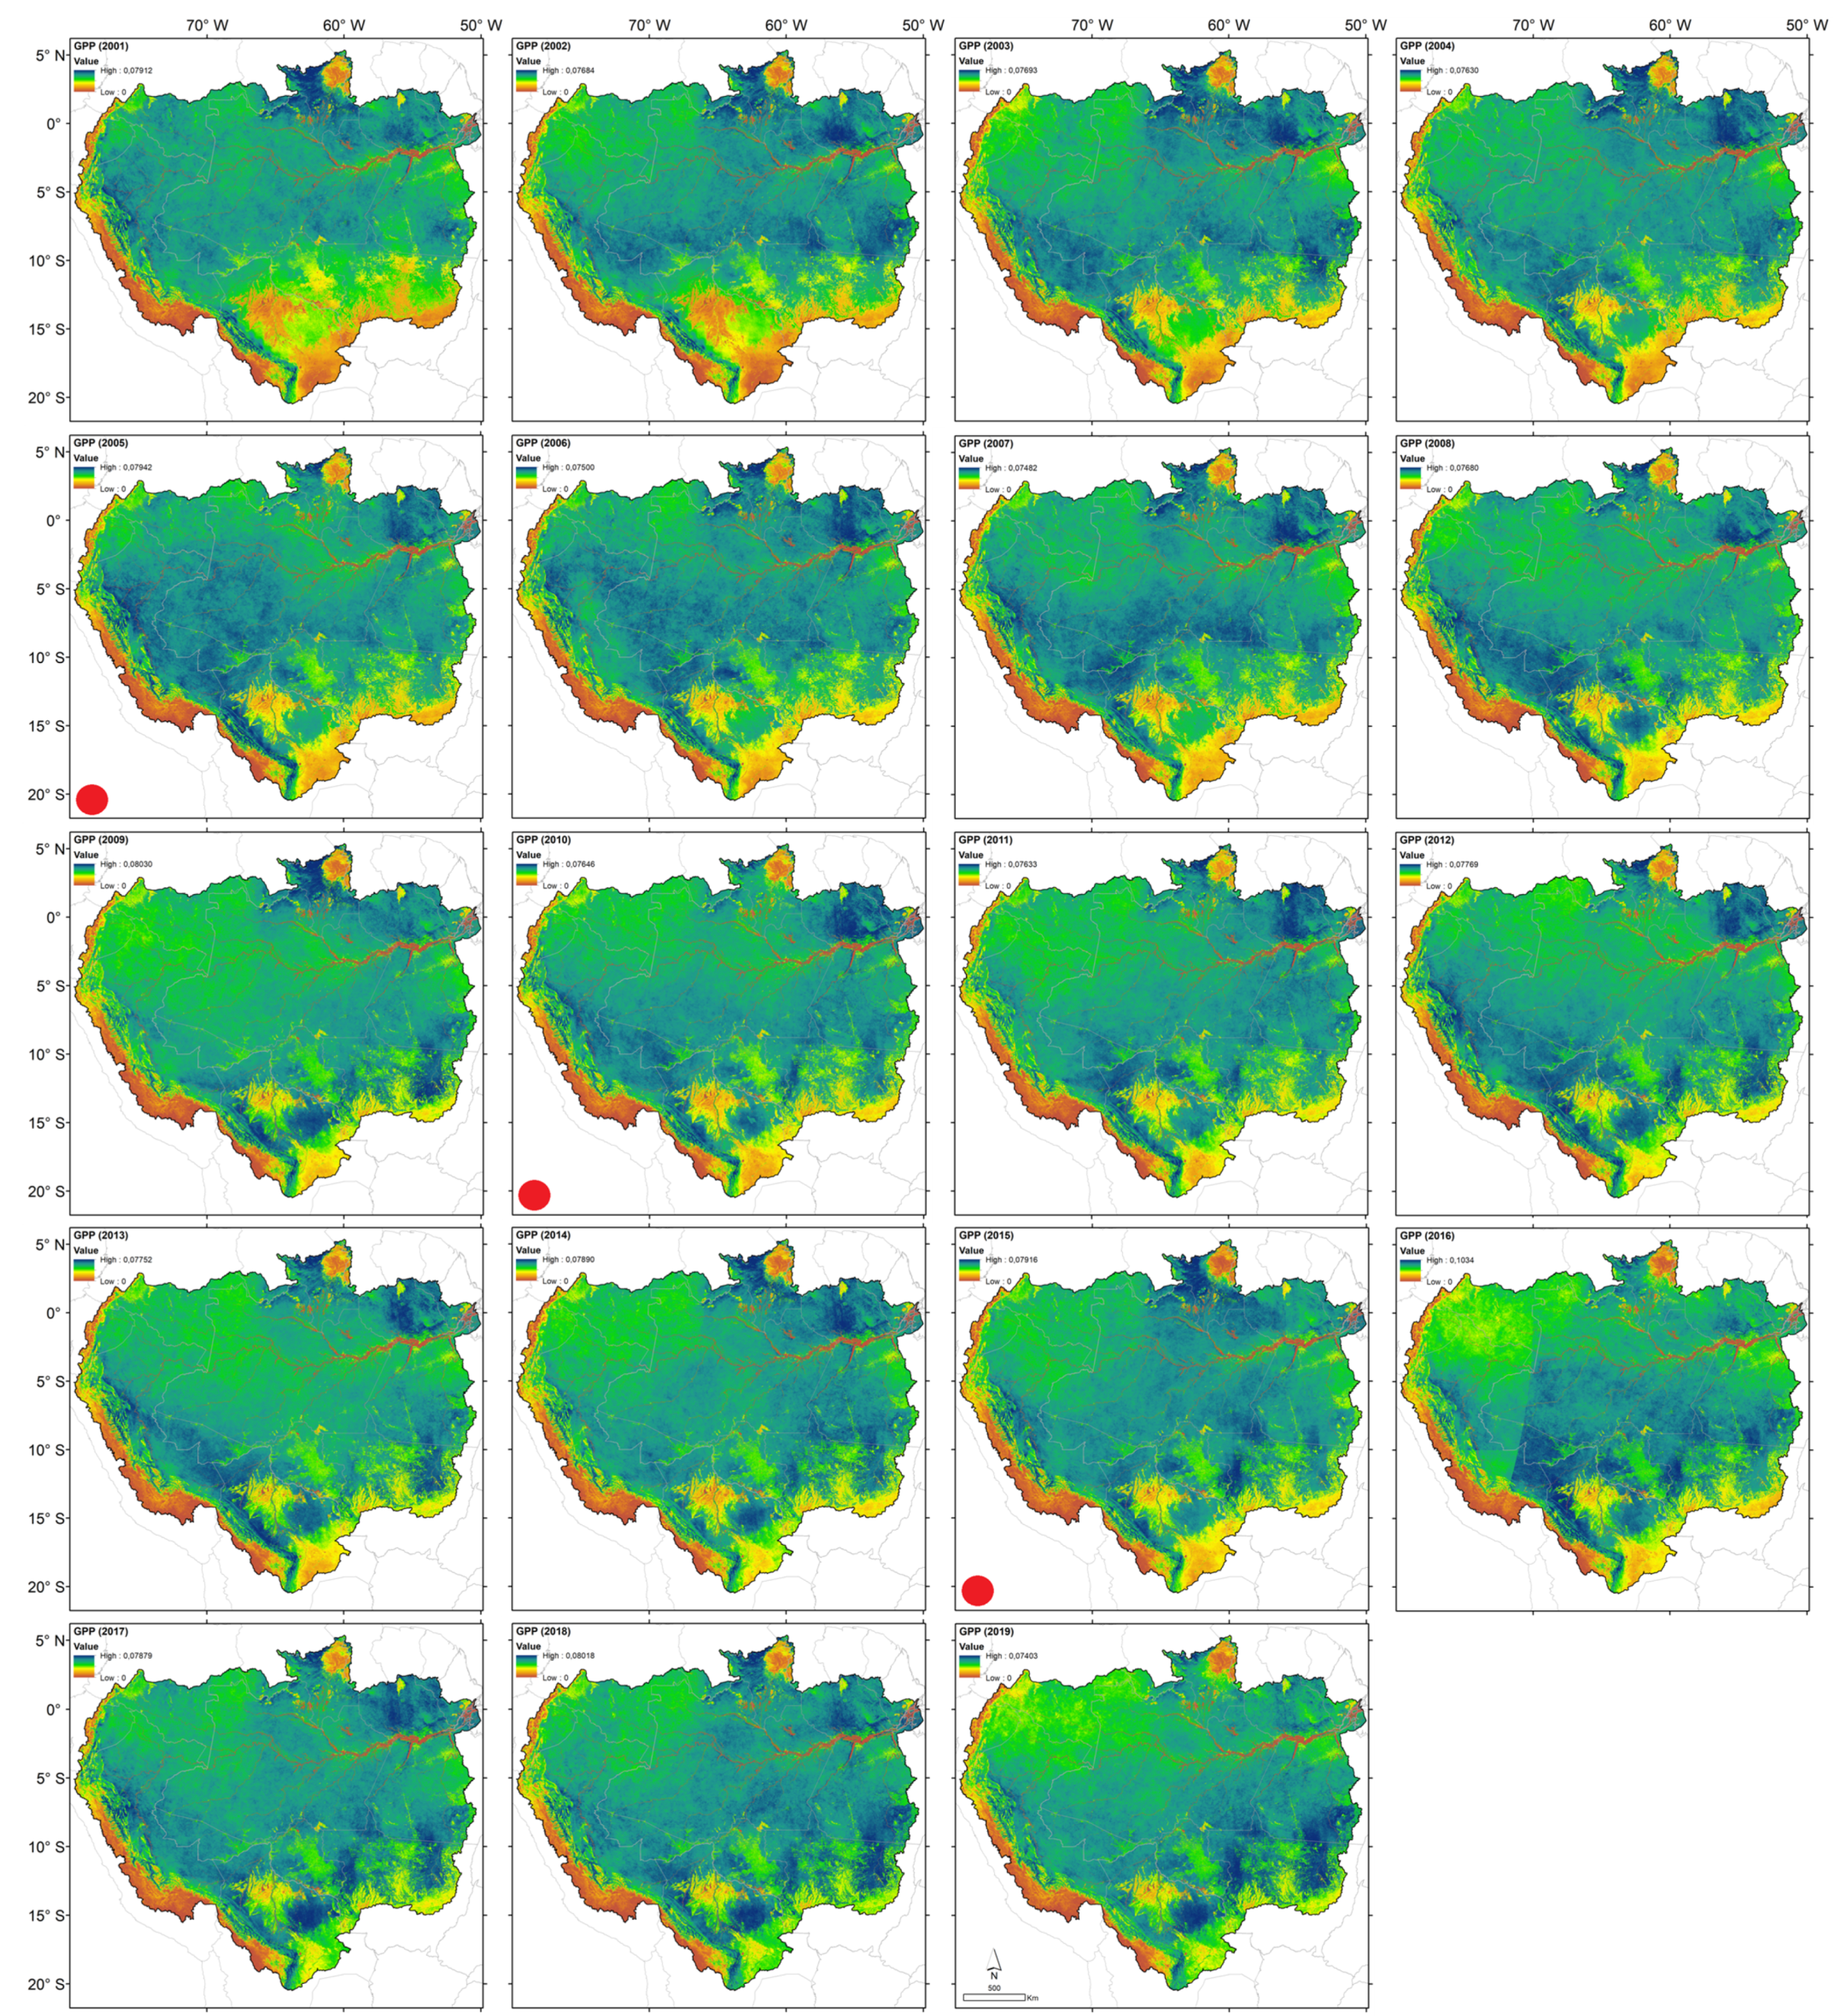
2.2. Gross Primary Production (GPP)

Among the various environmental services provided by the Amazon rainforest, the removal of C from the atmosphere via C sequestration and storage with increasing GPP is one of the most important [51,52,53]. GPP is related to the total photosynthetic uptake of C by vegetation and plays a key role in the C balance between the atmosphere and biosphere [54,55]. Thus, it is necessary to accurately and quantitatively estimate the temporal and spatial variations in the GPP to understand ecosystem functions and C estimates in response to climate change [56,57].
The MOD17A2 product is a cumulative compound of GPP values based on the efficient use of solar radiation by vegetation (ε). Primary production is linearly related to photosynthetically active absorbed radiation (APAR). APAR is the product of the incident photosynthetically active radiation (PAR) in the visible spectral range of 0.4–0.7 μm (assumed to be 45% of the total incident solar radiation) and the fraction of photosynthetically active radiation (FPAR) absorbed by plant cover [51,58]. GPP is defined as
GPP = ε × PAR × FPAR,
where FPAR is the fraction of PAR (MJ m−2 d−1). PAR can be calculated from the total shortwave solar radiation (SWRad; MJ m−2 d−1) as follows:
PAR = 0.45 × SWRad.
One of the major challenges of using such a model is obtaining the magnitude of the light-use efficiency (LUE), or ε, over large areas because of its dependence on environmental factors and the vegetation itself. One way to overcome this problem is to relate ε to its maximum value (εmax) by adding environmental contributions synthesized by the minimum air temperature (Tmin) and the state of the water in the vegetation [59]. The ε value (g C m−2 d−1 MJ−1) can be calculated as follows:
ε = εmax × Tminscalar × VPDscalar,
where εmax (g C m−2 d−1 MJ−1) is the maximum LUE specified by the Biome Properties Look-Up Table based on biome type, and Ts and VPDs are the attenuation scalars influenced by the daily minimum temperature (Tmin, °C) and daytime vapor pressure deficit (VPDavg, Pa), respectively [58,60].
In this study, the Moderate Resolution Imaging Spectroradiometer (MODIS) GPP version 5.0, as well as the Google Earth Engine platform, were used for the period of 1 January 2001–22 September 2019. The pixel values with reference to the MODIS image digital numbers were converted into biophysical values (kg C m−2) via multiplication with a scale factor (0.0001) [58]. Zhao et al. [58] showed that MODIS/GPP data correlated well with the GPP records of 12 flow towers (in situ) in North America, showing that MOD17A2 is a reliable data source for this variable. Meanwhile, the GPP values were transformed from the accumulated eight-day values to daily values for the entire extension of the Amazon Basin, and consequently, all the uses that comprise it. To calculate the C absorption for the entire study area, each pixel and its GPP value were calculated for each year of the study period (kg C m−2 year−1).

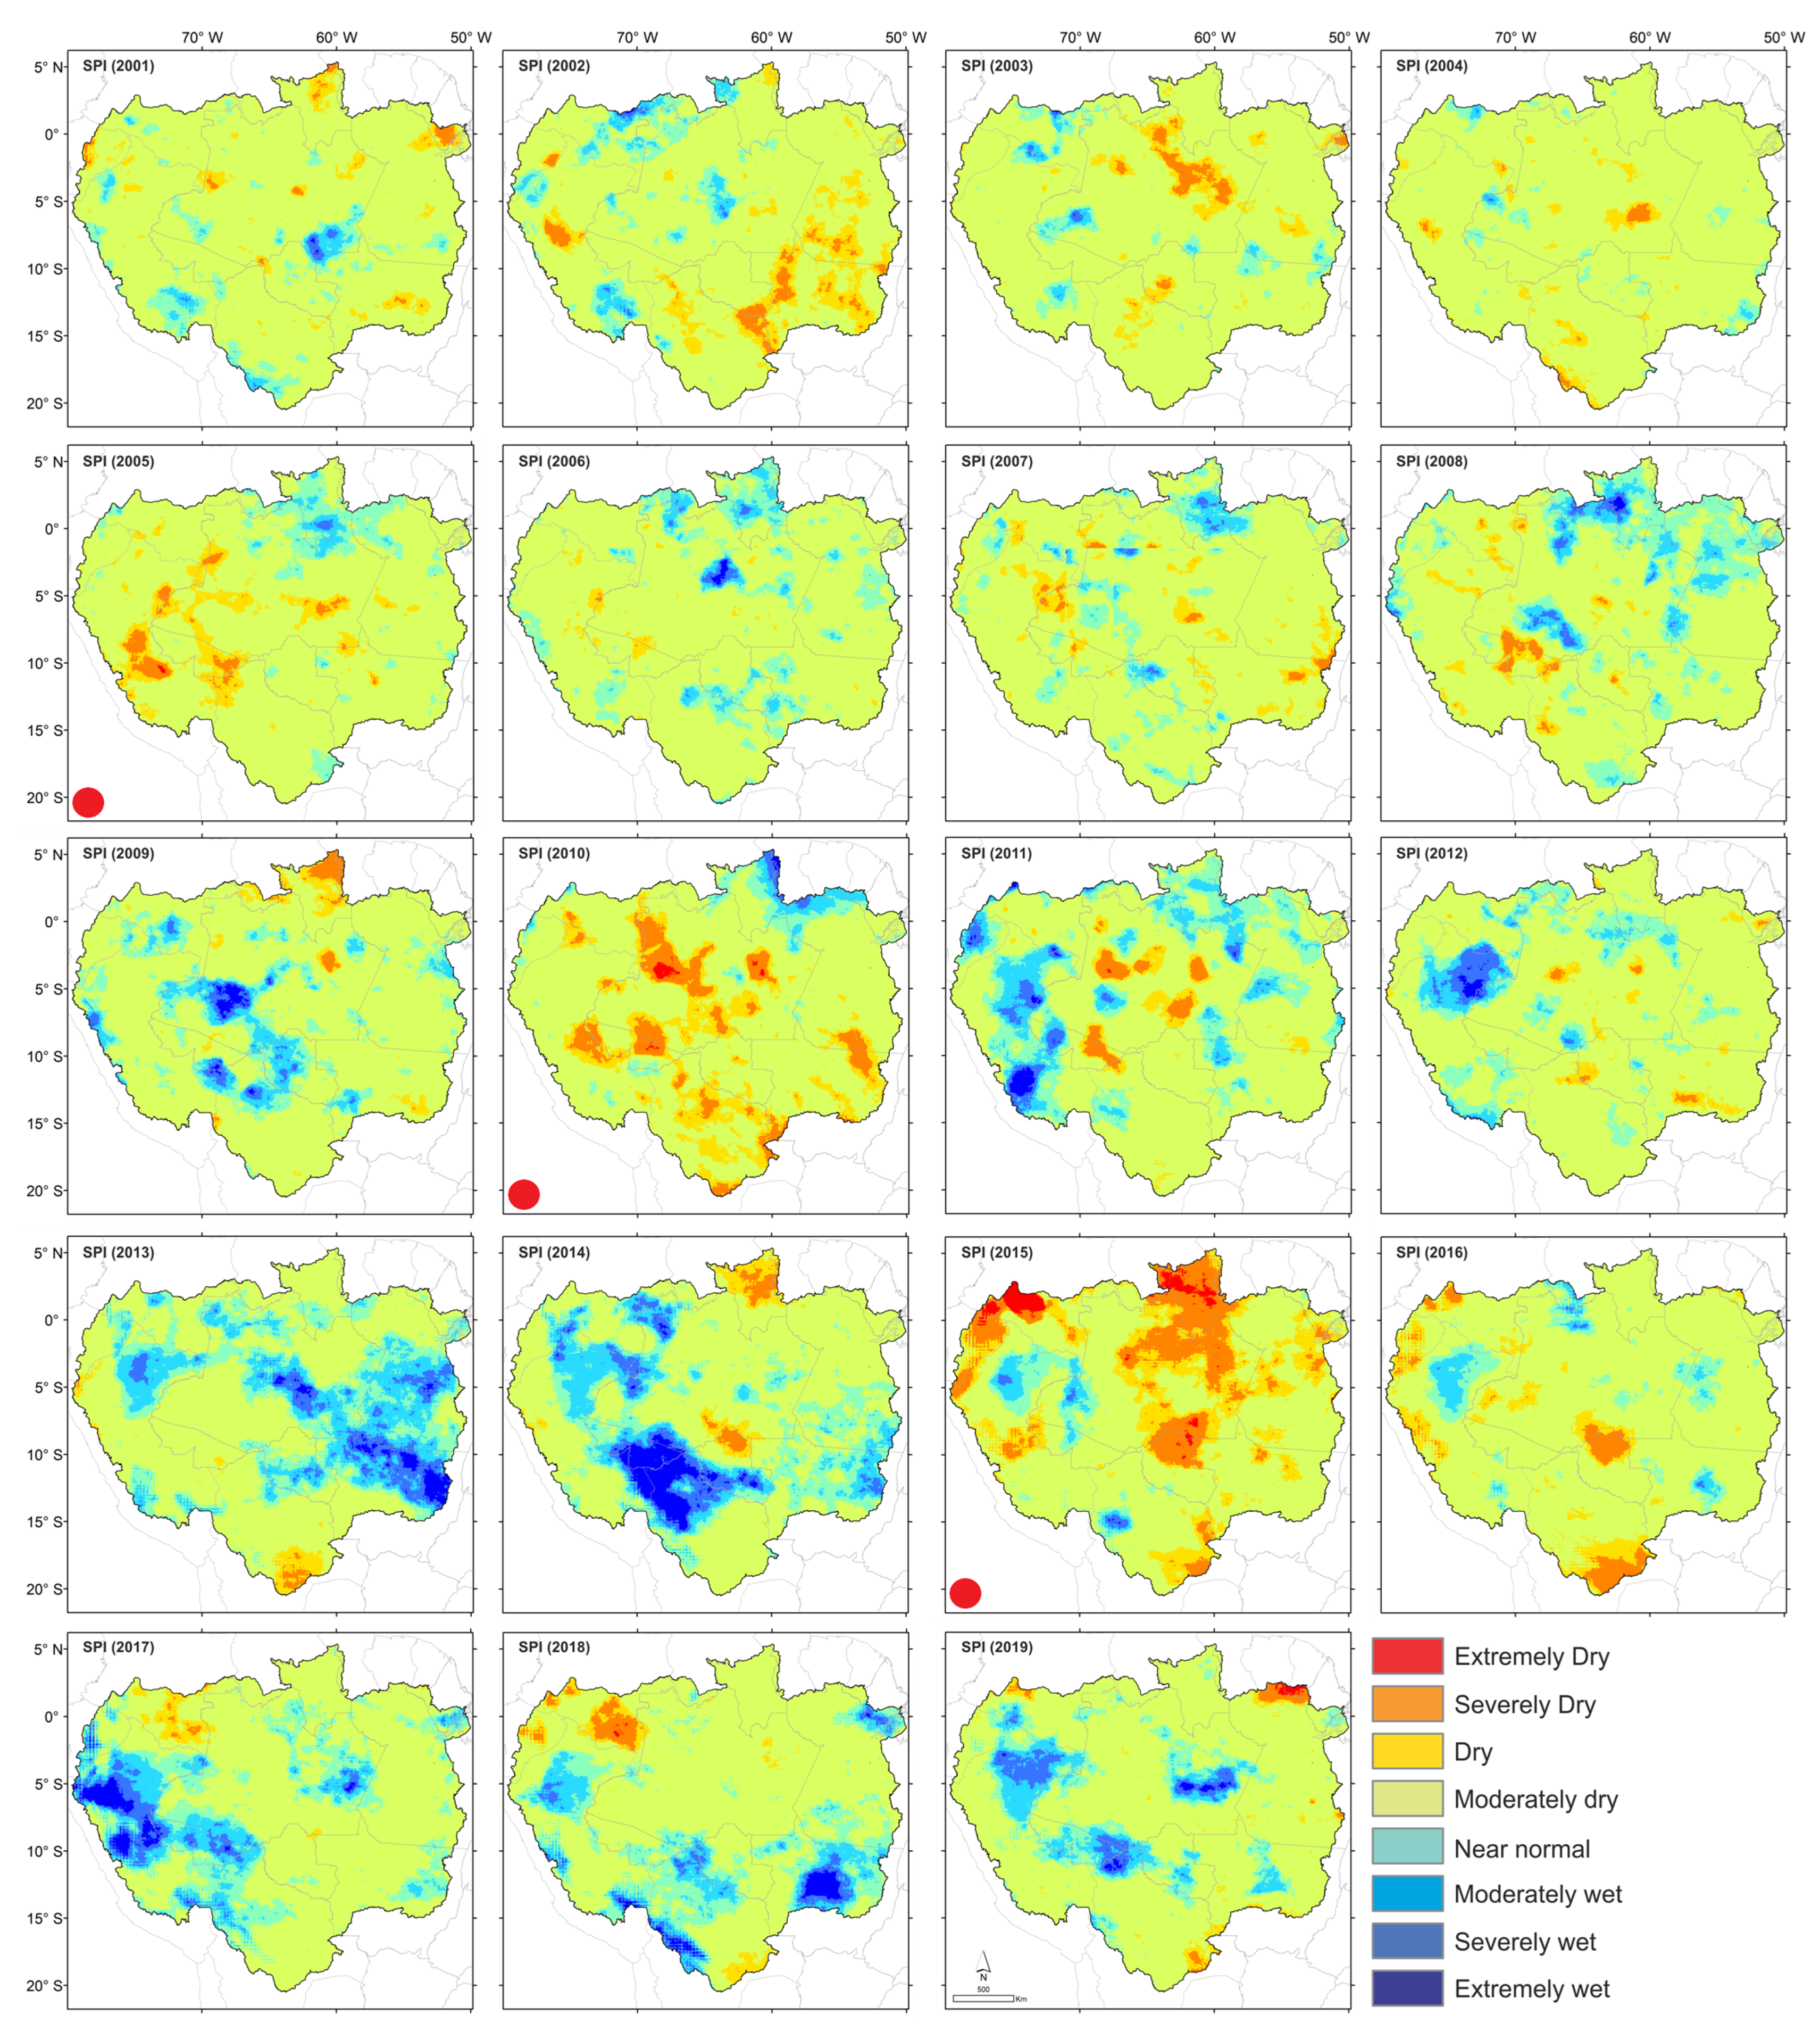
2.3. Rainfall and Standardized Precipitation Index (SPI)
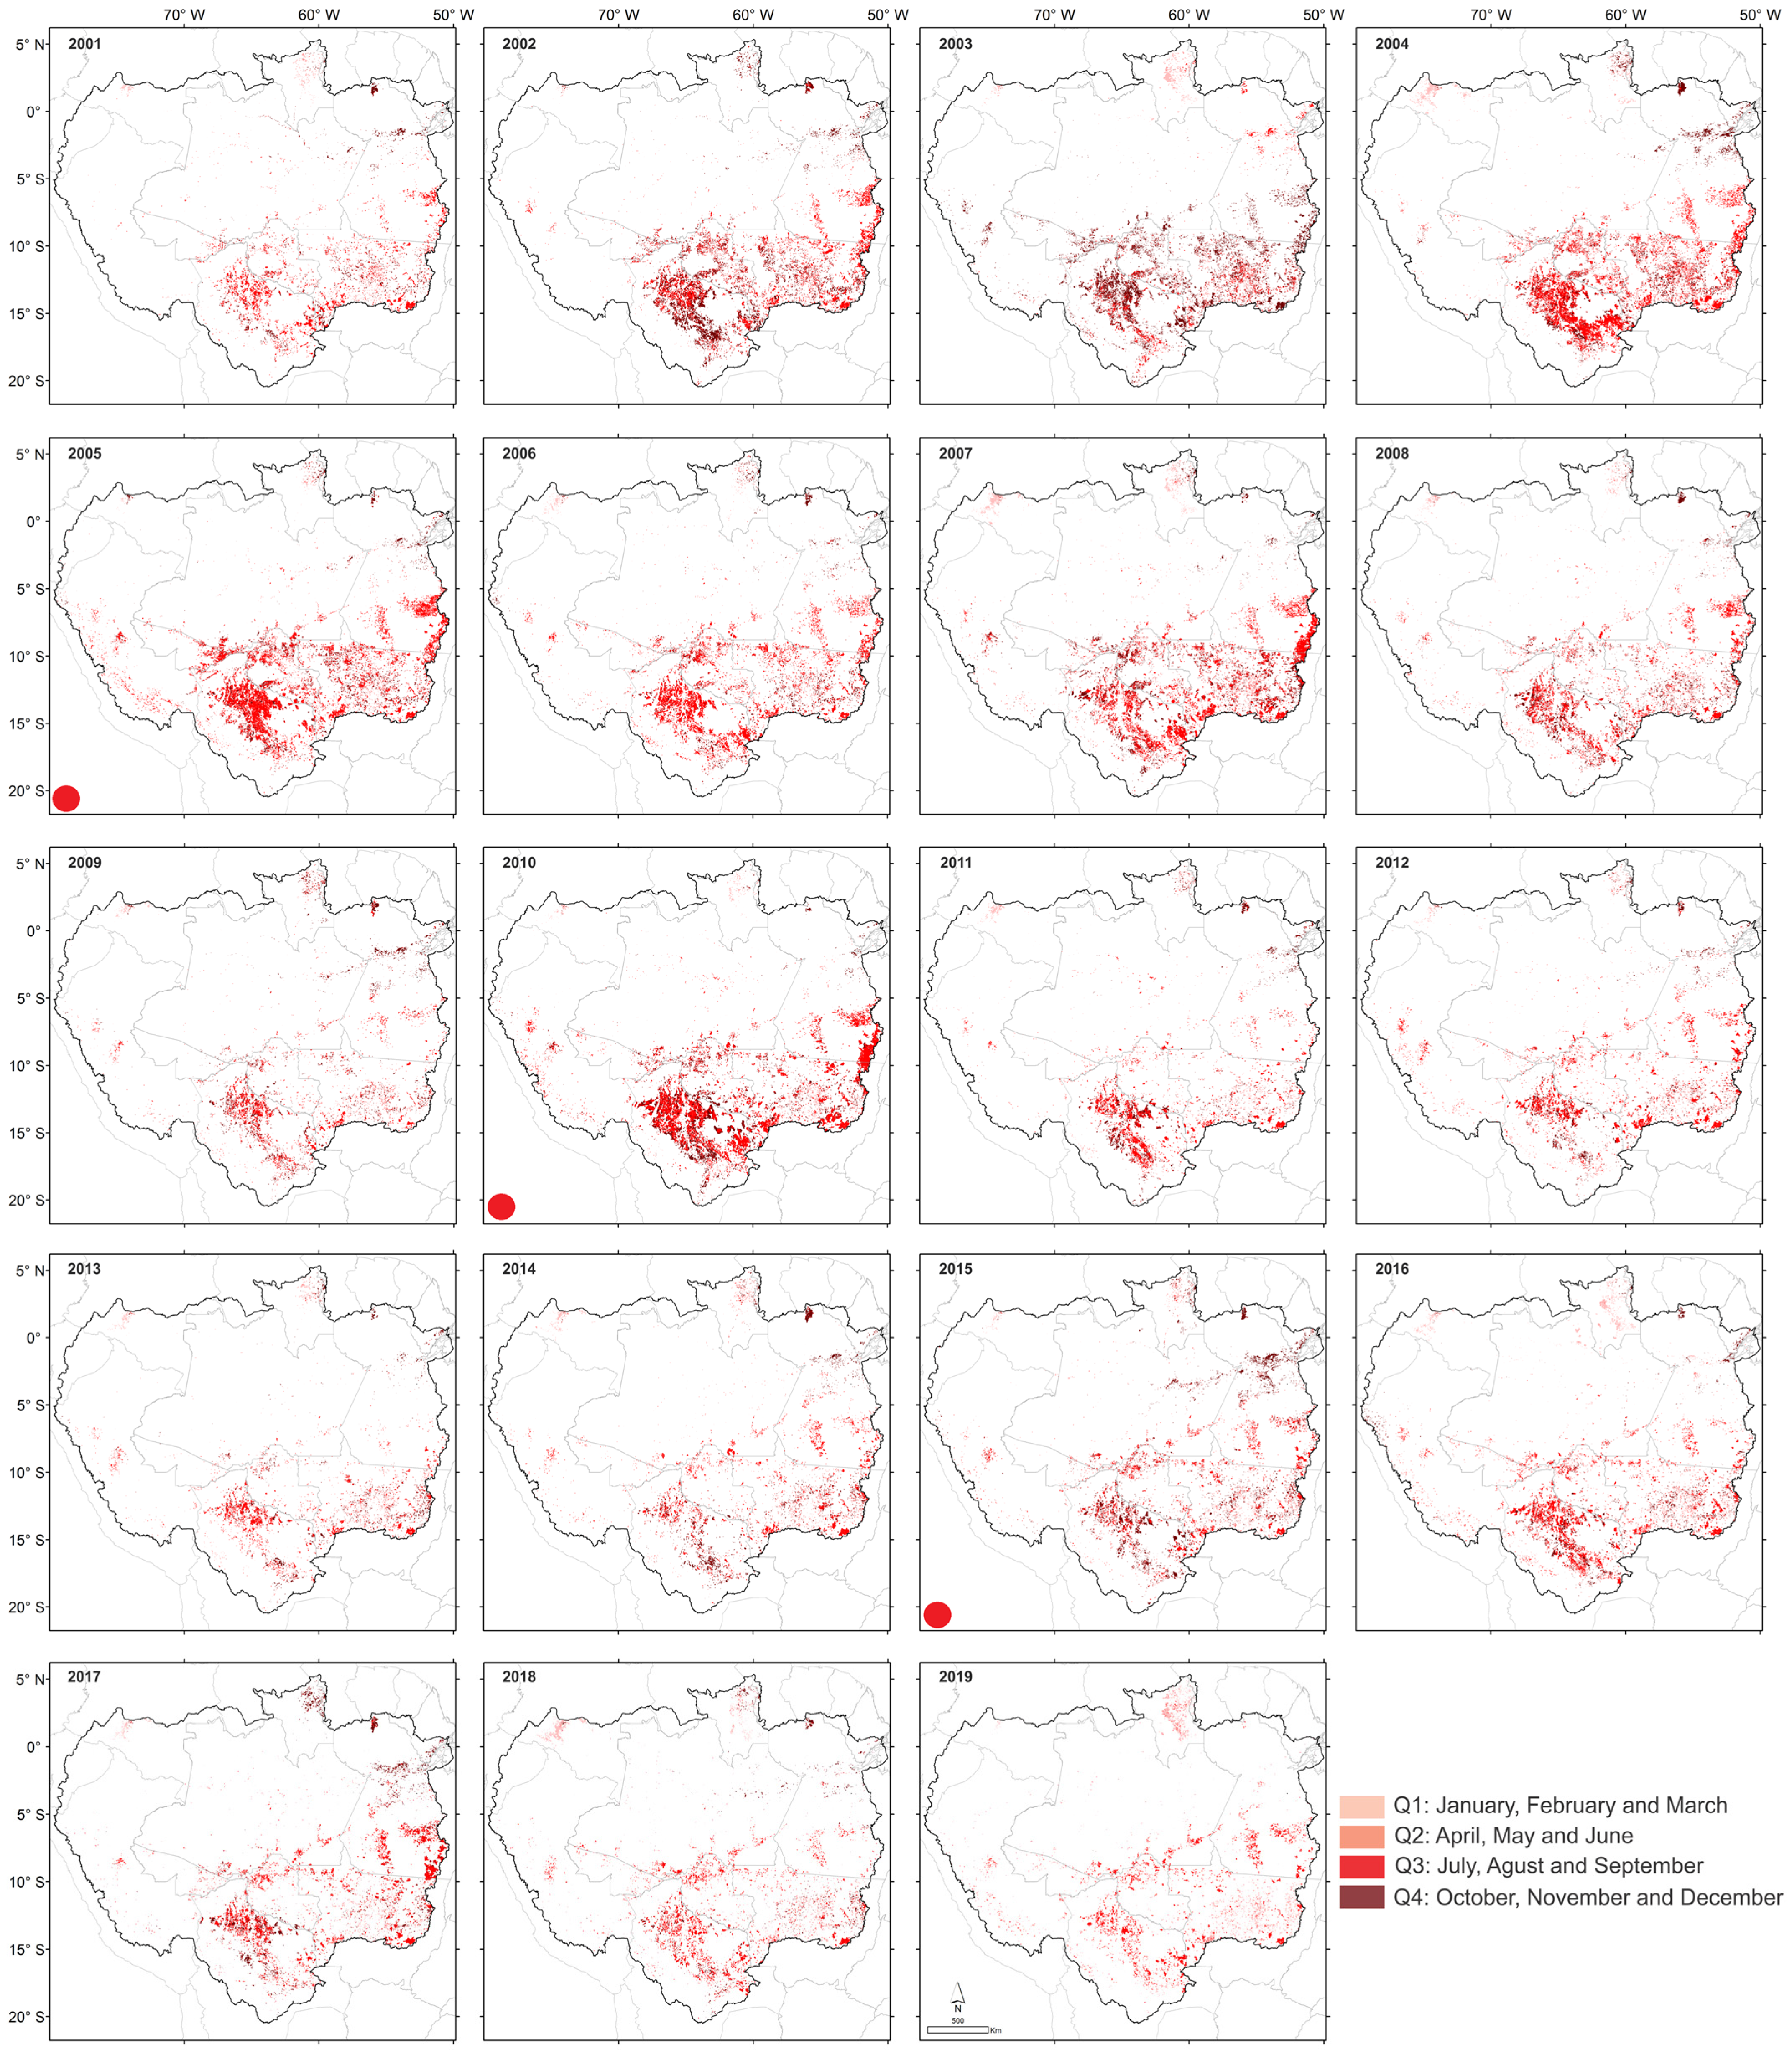
For precipitation and SPI analysis, we used the CHIRPS dataset [61], developed by the United States Geological Survey and the Climate Hazards Group of the University of California, Santa Barbara. This dataset combines pentadal precipitation climatology, near-global geostationary thermal infrared satellite observations from the Climate Prediction Center (CPC) and National Climatic Data Center [62], rainfall fields from the atmospheric model of the NOAA Climate Forecast System (CFSv2) [63], and in situ rainfall observations [64,65]. In this study, CHIRPS is used as there is a lack of temporal data from in situ stations throughout the Amazon Basin, and because of their availability from 1981 to the present at a spatial resolution of 0.05° (~5.3 km) at daily, pentads and monthly temporal resolutions for the near-globe.
The standardized precipitation index (SPI) was developed by McKee et al. [66] to quantify the deficit or excess rainfall at different time scales. To identify drought events in the time series, the results for this study were calculated on an annual scale (SPI-12) from 2001 to 2019. The SPI was calculated from the total cumulative rainfall over the 20-year period and then adjusted to a probability distribution function (PDF), which is transformed into a normal probability distribution function to change the average SPI value of a given location and period to zero [67,68].
To determine the SPI, a Gamma distribution defined by the PDF was initially used:
f ( x ) =   1 Γ ( a ) β a x a 1 e x β
where α (>0; dimensionless) is the shape parameter, β (>0; mm) is the scale parameter,   x (>0; mm) is the total rainfall, and Γ (α) is the Gamma function: Γ ( a ) = 0 x a 1 e x d x .
All the parameters and the PDF Gamma were adjusted for the rainfall cumulative frequency distribution based on CHIRPS annual data. We calculated the α and β parameters of the PDF Gamma for each year. The maximum-likelihood method was used to estimate the α and β values [67,68]. Parameters α and β were calculated to identify the cumulative probability of an observed rain event for the adopted scale using the following:
F ( x ) = 0 x f ( x ) d x = 1 Γ ( a ) β a 0 x x a 1 e x β d x
The annual SPI values were classified into wet and dry periods, as was done by McKEE et al. [66]. CHIRPS data were then used to quantify and apply statistical tests to the monthly and annual scales. To identify GPP anomalies as a function of the SPI, the data were adapted to equations used by Sazib et al. [69] (Equation (6)):
GPPa   = X GPP μ GPP σ GPP ,   SPIa   = X SPI μ SPI σ SPI ,
where X GPP is the GPP value, μ SM is the average GPP value, and σ GPP is the standard deviation of GPP. The GPP values are estimated from the full data recording of the satellite observation period within the time series selected in this study. The same conditions apply for SPI.

2.4. Burned Areas

Fire detection was performed using a contextual algorithm [70] that exploits the strong emission of mid-infrared radiation from fires [71,72]. The algorithm examines each pixel of the MODIS swath and ultimately categorizes each pixel into the following classes: missing data, cloud, water, non-fire, fire, or unknown.
The Terra and Aqua combined MCD64A1 Version 6 Burned Area data product is a monthly, globally gridded 500 m product containing per-pixel burned-area data and quality information. The MCD64A1 burned-area mapping approach employs 500 m MODIS Surface Reflectance imagery coupled with 1 km MODIS active fire observations. The algorithm uses a burn-sensitive vegetation index (VI) to create dynamic thresholds that can be applied to the composite data. This VI is derived from MODIS shortwave infrared atmospherically corrected surface-reflectance bands 5 and 7 with a measure of temporal texture (i.e., ρ5 − ρ7/ρ5 + ρ7). The algorithm identifies the date of burn for the 500 m grid cells within each individual MODIS tile. The date is encoded in a single data layer as the ordinal day of the calendar year during which the burn occurred, with values assigned to unburned land pixels and additional special values reserved for missing data and water grid cells [73,74].
Mapping was used to relate the recording date of the satellite’s passage to the nearest record for individual grid cells. The date was then encoded in a single layer of output data in terms of Julian days on which burning occurred (interval 1–366); 0 was assigned to “no burn” pixels and additional special values were assigned to missing data and water grid cells. We sought to calculate the burned areas for the Amazon Basin (1–365 Julian days) from 2001 to 2019 (for 2019, we used data until 1 September 2019). Subsequently, the data were vectorized and the areas were quantified in km2 (extracted by country, ILs, and CUs located in the Amazon Basin). We then aggregated the data from Julian days to quarters, called Q1, Q2, Q3, and Q4, which correspond to the first, second, third, and fourth quarters, respectively.

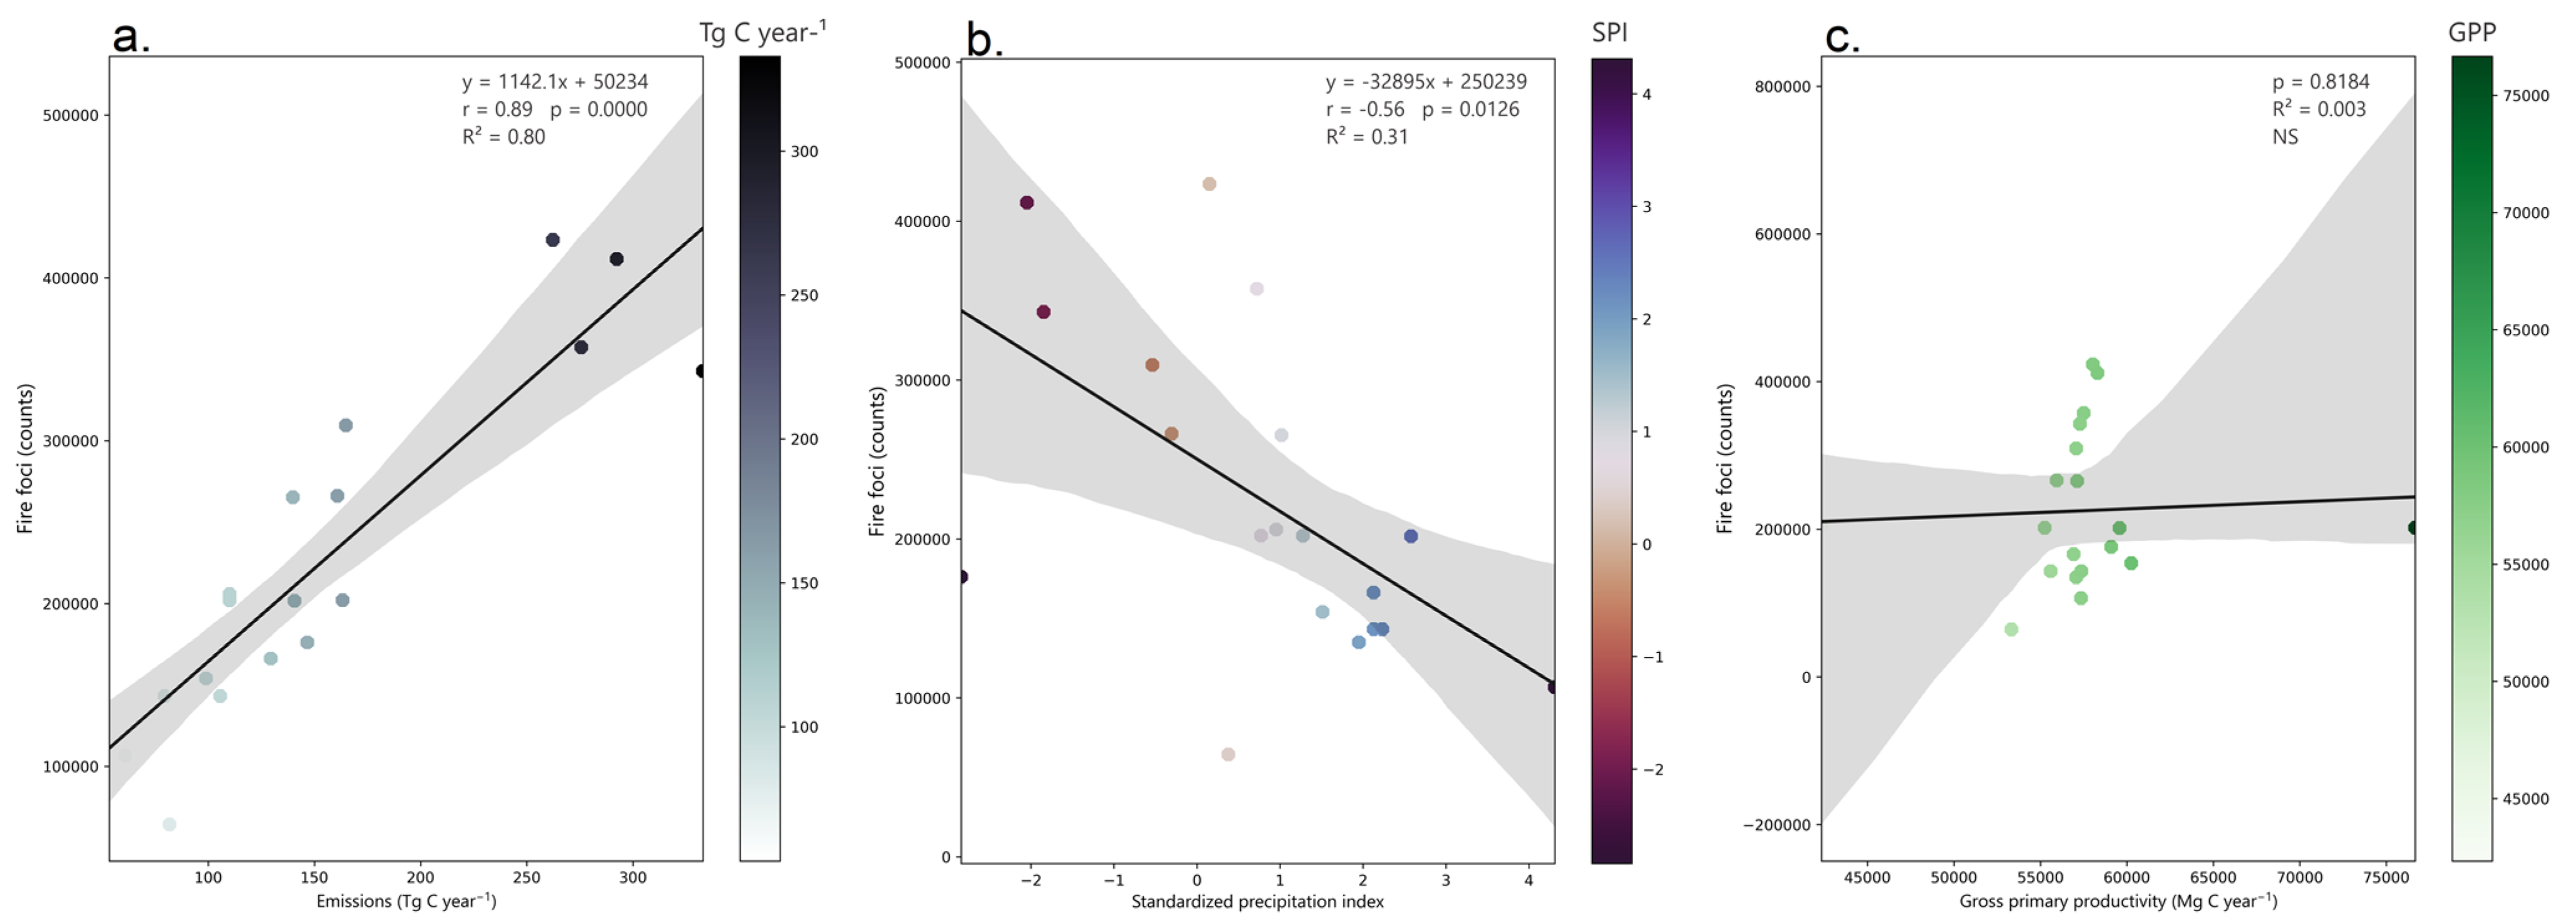
2.5. Fire Foci and Emissions

Fire foci data were calculated using the MODIS sensor product MCD14DL (TERRA/AQUA). Near real-time (NRT) MODIS Thermal Anomalies/Fire locations—Collection 6 were processed by NASA’s Land, Atmosphere Near real-time Capability for EOS Fire Information for Resource Management System (FIRMS), using swath products (MOD14/MYD14) instead of the tiled MOD14A1 and MYD14A1 products. The thermal anomalies/active fires represent the center of a 1 km pixel that was flagged by the MODIS MOD14/MYD14 Fire and Thermal Anomalies algorithm [70] as containing at least one fire. This is the most basic fire product, in which active fires and other thermal anomalies, such as volcanoes, are identified. Data were directly downloaded from a FIRMS [50] shapefile format. The FIRMS Fire Map allows the interactive browsing of the full archive of global active fire detections obtained from MODIS and Visible Infrared Imaging Radiometer Suite (VIIRS). NRT fire data are available within approximately 3 h of satellite overpass, and imagery is available within 4–5 h.
C emission data were verified and extracted using the fourth version of the Global Fire Emissions Database (GFED4s), as described in Van der Werf et al. [75]. The GFED4s provides C data via the contribution of different types of fire in order to calculate gas traces using emission factors [76]. All the contributing datasets are based on burned areas driven by small fires. The spatial resolution of global files is 0.25°, and the different fields have 720 rows and 1440 columns. Emission data have monthly temporal resolution, but it are also provided as a day cycle based on Mu et al. [77]. The emissions group consists of a 12-month dataset (01, 02..., 12), of calculated C with units of g C m−2 month−1. Biosphere flows contain monthly net primary production, heterotrophic respiration, and fire emissions, all of which have the unit g C m−2 month −1.

2.6. Statistical Data Analysis

Data were subjected to a linear regression analysis, wherein the fire foci (counts) was considered to be a dependent variable and the other evaluated variables (emissions, GPP, and SPI) were considered to be independent variables. We also performed a multiple linear regression model in which C emission was the main dependent variable and the other variables were considered to be independent.
Pearson correlations between pairs of variables were estimated and expressed in two ways: a heatmap and Pearson correlation network. The heatmap demonstrates the similarity between the variables and between the years, whereas the correlation network graphically expresses the functional relationship between the estimates of these correlations. Overall, the proximity between nodes (traces) was proportional to the absolute value of the correlation between such nodes. The thicknesses of the edges were controlled by applying a cut-off value of 0.60, causing only |rij| ≥ 0.60 to have highlighted edges. Moreover, positive correlations were highlighted in green, while negative correlations were represented in red. This analysis used the package “qgraph” of the R software.
Subsequently, to identify trends along the time series (2001–2019) of each variable, a Mann–Kendall test was performed. This nonparametric test confirmed the stationarity of the historical series. Specifically, with the exception of random fluctuations, the observations were determined to be invariant with respect to the chronology of their occurrences. Finally, the data were submitted to a Pettitt’s test [78], which identifies the point at which a sudden change occurs in the mean of a time series. This analysis used the package “trend” of the R software [79].

3. Results

In the spatial analysis of the GPP, the absorption of C by the Amazon Basin over the last 19 years was evaluated (Figure 2). The time series of C absorption/pixel ranged from 0.050 kg C m−2 year−1 to 0.103 kg C m−2 year−1. During this series, there were highlights for the years 2009 (0.05 kg C m−2 year −1), 2016 (0.10 kg C m−2 year−1), and 2018 (0.08 kg C m−2 year−1). Spatially, the lowest identified GPP values found around the Amazon were mainly in the south (S), southeast (SE), southwest (SW), west (W), and northwest (NW) regions. Conversely, the highest GPP values occurred in the central region, especially at the beginning of the time series. However, after 2011, there was a significant increase in GPP values in the SE region of the Amazon.
The rainfall time series showed that the S, SW, and W regions consistently had rainfall below 1000 mm year−1, which is lower than the climatological average recorded in the Amazon (2200 mm), as occurred in the NW region (see Figure S1). Note that in 2005, 2010, and 2015, there was a reduction in rainfall, especially in 2015, when the rainfall was less than 1640 mm. The values for these drought years were considered the most severe of this century [36,38]. Furthermore, a significant decrease in rainfall occurred in Bolivia and the Arc of Deforestation, which covers eastern and southern Pará. This decrease was followed by that in the states of Mato Grosso, Rondônia, and Acre in the Brazilian Amazon, which experienced rainfall below 1360 mm. In extreme cases, these values were less than 520 mm and were characterized by severe drought events.
The spatial analysis of the annual SPI (Figure 3) revealed that the entire Amazon received average rainfall at the beginning of the time series until mid-2008, with a predominance in the near-normal category. However, some regions experienced variations in wet and dry conditions in the moderate and severe–moderate categories. From 2009 onwards, the high variability of wet and dry regimes in the extreme categories occurred throughout the Amazon, especially in 2010, and 2015, coinciding with years of El Niño influence. One exception occurred in 2005, in which the variability was not related to El Niño, but to sea surface temperature (SST) anomalies in the north tropical Atlantic [80]. Moreover, the regions in the extremely wet category, as defined by the SPI, correspond to the regions previously identified by the GPP (Figure 2) and rainfall maps (Figure S1).
After analyzing the annual SPI (Figure 3, quantified in Table S1), the occurrences of the annual burned area of the Amazon were evaluated and divided into quarters (Figure 4). During the years evaluated, the burned area ranged from 10,140 km2 to 29,336 km2 (Table S2). The most burned areas occurred in 2002, 2004, 2005, 2007, 2009, and 2010; the largest burned areas identified in the time series corresponded to 2005 (109,341.10 km2), 2009 (109,422.00 km2), and 2010 (51,687.36 km2). The S, SE, and E regions exhibited higher fire occurrences than the other regions. In addition, Q3 (critical burn point) had higher fire occurrences, as compared with the other quarters.
The fire foci from 2001 to 2019 were concentrated in an area of 1,413,402 km2, which corresponds to 23.78% of the entire Amazon Basin. Of this, 310,363.86 km2 exists in ILs (Table S3), which corresponds to 17.16% of the total IL area in the Amazon Basin (1,807,639.74 km2). Meanwhile, CUs had a total burned area of 59,962.55 km2 (Table S4), accounting for 5.93% of their total area (1,010,569.55 km2). In absolute numbers, Brazil had the largest affected area (220,087 fire foci, 773,360 km2 burned area, 54.7% of the total burned in the Amazon Basin, followed by Bolivia (102,499 fire foci, 571,250 km2 burned area, 40.4%), which was significant compared to other countries that make up the Amazon Basin (Figure 4). These high values were justified by the fact that Brazil and Bolivia comprise approximately 75% of the entire Amazon Basin. In relative numbers (Tables S3 and S4), Venezuela and Ecuador had their ILs most affected by the fires, while Suriname and Colombia experienced the largest effects in their CUs (Figure 5).
The variables analyzed in this study, such as emissions (C released into the atmosphere), rainfall, SPI, and GPP, were subjected to a linear regression analysis, in which fire foci was the independent variable (Figure 6). The results showed that there was a positive and significant linear relationship (p-value < 0.01) between C emissions and fire foci. The coefficient of agreement obtained with the model explained 80% of the C emission variation. This strong relationship was confirmed by the heatmap (Figure S2), correlation network (Figure S3), and multiple regression, wherein C emission was the dependent variable, and the others were explanatory (Table S5). The results of this analysis show that C emissions are significantly affected by heat sources only when all variables are analyzed.
It is also important to highlight the negative and significant linear relationship between the SPI and fire foci (p-value = 0.01). In particular, the SPI negatively affected C emissions (Figure S3). The results of the annual SPI, correlated with the studied years and analyzed via a Pearson cluster correlation (Figure S2), reveal that there is no gradual drought trend for the region as the annual SPI values randomly varied from year to year. However, in years in which El Niño (ENSO hot phase) occurred, there was a tendency for positive annual SPI values. The correlation analysis between GPP and SPI anomalies is important for determining the impact of changes in C absorption and emissions in correlation to drought index variation. Note that negative SPI anomaly values indicate that favorable conditions for C uptake are below average, while positive values indicate high C absorption (Figure S4). The highest GPP values, obtained as a function of the SPI, occurred in 2016.
The average GPP in the Amazon Basin revealed that the average absorption of C/pixel during the study period was 0.0751 kg C m−2 year−1 (Figure 7a), with areas surrounding the Amazon showing significantly smaller values (<0.04 kg C m−2 year−1). Regarding average rainfall, a water deficit existed in areas where deforestation occurred, including the Bolivian Amazon Basin and northern Roraima (Brazil) (Figure S1). The accumulated annual SPI values indicated extreme droughts (<−2.5) in some regions of the Amazon Basin belonging to Brazil, Bolivia, Peru, and Colombia (Figure 7b). In some regions of the Amazon Basin, such as that of Bolivia, low rainfall and a high occurrence of fires are reflected in terms of severe drought rates. The accumulated heat hotspots clearly show the intensification of burning in the last two annual quarters (July–December), mainly in the Brazilian and Bolivian Amazon areas (Figure 7c), which collectively represent approximately 95% (Table 1) of the areas where fires occurred between 2001 and 2019.
However, according to the Pettitt’s and Man–Kendall tests (Table 1), no trend in the time series (p-value > 0.05) was observed for the evaluated variables in the entire Amazon Basin (fire foci, rainfall, SPI, emissions, and GPP). The lack of a robust trend is partially due to the relatively short time series for trend detection, which should be reassessed in the future.

4. Discussion

The analysis of GPP results indicate that the average C absorption of the forest is neutral, and the C absorption/pixel was 0.0751 kg C m−2 year−1 during the study period. However, the occurrence of fires has seriously compromised the C balance. Specifically, during the study period, the forest absorbed 1,092,037 Mg of C, but emitted 2908 Tg of C, which is 2.66 times greater than the C absorbed, thereby compromising the role of the forest in acting as a C sink (Figure S1 and Table S5). Deforestation and forest fires are primarily responsible for the high CO2 emission rates in the Amazon [14]. However, climate variability has also contributed to changes in C balance [81]. During the severe droughts of 2005, 2010, and 2015 (due to El Niño or warm Atlantic SST conditions), C absorption tended to decrease as a result of a water deficit, thereby reducing the photosynthetic rate [55,82,83]. Severe droughts lead to increased tree mortality, biomass losses, and a temporary cessation to the C sink in the Amazon [45,84,85].
The Amazon contains vast reserves of C but can experience major changes in rainfall patterns, mainly because of the influence of large-scale phenomena (ENSO, SST anomalies, and moisture transport anomalies; e.g., Marengo and Espinoza [38], Espinoza et al. [29], Towner et al. [36], Funatsu et al. [86]) which affect C dynamics [81]. Herein, the results obtained for the El Niño drought period, such as in 2009 when the annual absorption rate of C/pixel was 0.050 kg C m−2 year−1, showed no significant differences with those obtained for the La Niña drought period (cold phase of ENSO). Therefore, the results of the GPP analysis revealed that the performance of C uptake by the Amazon Basin during the study period was neutral, meaning that the sequestration of C through the forest was zero as the mean C uptake/pixel matched 0.0751 kg C m−2 year−1. Nevertheless, as this study period is short, we cannot claim, based on our data, that the Amazon Basin is entering a drought period and is moving rapidly toward its “tipping point”. However, we can state that this forest is no longer acting as a C sink and that it is currently a net source of GHG emissions, which contribute to global warming, as a result of anthropic actions, for example, the replacement of original land cover for crops and livestock, and opening highways [87].
According to Baccini et al. [88], the death of trees in the eastern and southern Amazon implies that C absorption is neutral. Our results are consistent with these findings, but also highlight a key difference. As GPP decreases with seasonal decrease in water availability, this causes negative impacts on C absorption [2,89]. Meanwhile, fires impact the global and local ecosystems via vegetation effects (loss of biomass), contributing to the release of accumulated C stocks [90,91].
Although natural variability explains forest burning, this study found that burning occurred in quarters where vegetation was green and humid during the rainy season (especially in quarters Q1 and Q2), indicating the strong presence of anthropic action in the Amazon region. In particular, the fire foci in the Q1 and Q2 quarters occurred from January to June, a period during which natural fires do not occur in this type of vegetation as well as in the two months of drought equivalent to the period of August–October [92,93].
The moderately negative Pearson correlations obtained between the SPI and emissions and those obtained between the SPI and fire foci (Figures S2 and S3) indicate that dry periods increase the likelihood of forest burning. High C emissions (989–504 Tg C year−1) occurred in the region in 2015 and were associated with extreme fire events.
As shown in Figure S2, in 2015, a strong El Niño event occurred, which is consistent with the findings of Alencar et al. [94], Santos et al. [95], and Yan et al. [55]. Note that fire incidence is associated with SST anomalies, especially the warm phase of ENSO [21,33,55]. In recent decades, some studies have reported a high frequency of droughts and extreme rainfall in some Amazonian areas [38,82,86,92,96,97]. Some periods of extreme drought in 1997 and 1998 were related to the occurrence of El Niño events [98], as well as the drought recorded in 2010, which was related to El Niño events from previous years [99]. Gutiérrez-Vélez et al. [100] found that drought severity had the greatest influence on the occurrence of fires. Changes in the duration of the dry season, increase in dry days and delayed onset of the dry season were observed in the southern Amazon and Bolivia [29,86,101], all of which have the potential to intensify fires conditions. These areas are largely coincident with the “deforestation arc”, wherein the largest land use conversions have occurred [21,87].
Brazil, which contains the largest portion of the Amazon Forest in its territory, set emission reduction targets as part of the Paris Agreement during the 21st Conference of the Parties in 2015. Despite some initial success, deforestation rates have since increased, especially in 2019, which exhibited an increase of 43.93% (10,123.17 km2) compared with 2018 [102]. Although Bolivia also ratified the Paris Agreement, it burned the equivalent of 79.63% of its Amazon Basin area. These countries must adopt stricter policies to contain deforestation and fire foci in order to fulfill their Paris Agreement commitments.
The results obtained were also similar for Bolivia, showing that rainfall in its region was not similar to that in other more forested basin areas (Figure S1). This also suggests that decreasing rainfall affects local climates via a feedback process, in which less forest area causes less rain and less rainfall leads to less forest area [40]. In addition, land use change in these areas causes landscape fragmentation by increasing the flammability of forests, which makes them more susceptible to fires than dense forests [94], and substantially alters the region’s albedo, itself an important variable that controls climate processes [87].
Our results show that, currently, the incidence of fire foci is the largest threat to the Amazon landscape, already affected by various types of forest disturbance [103]. Between 2001 and 2019, the total burned areas in the Amazon Basin corresponded to 23.78% of its total area. These fires not only affected forests in agricultural frontier areas (76.91%), but also those of ILs (17.16%) and CUs (5.93%), which are recognized as biodiversity conservation areas. Furthermore, nearly four-fifths (79.63%) of the Bolivian Amazon Basin area was affected by fire foci; the corresponding values for Guyana and Brazil were 29.58% and 20.77%, respectively. These values are compelling considering the fact that the Amazon rainforest has lost an estimated 20% of its vegetation cover in the last five centuries [104]. These findings demonstrate that fires have advanced beyond deforestation areas and invaded the areas employed as reserves in private properties, such as ILs and CUs, which should be safeguarding the Amazon’s natural heritage [8].

5. Conclusions

Our findings show that environmental degradation caused by fires is related to the occurrence of dry periods in the Amazon Basin. However, it remains unclear how much degradation from burning the forest can withstand before reaching a point of no return. Although this research did not evaluate the degradation caused by anthropogenic factors such as changes in land use and occupation, fires are directly related to C emissions. Countries that contain some of the Amazon Basin in their territory, especially Brazil, need to assess the cost–benefit ratio of allowing their forested areas to be continuously deforested and burned to open up new agricultural areas [6,7,8]. Numerical simulations show that the more agriculture expands into the forest, the less productive it will become [105,106] and excessive GHG emissions can cause changes in atmospheric composition that will cause a decline in rainfall in the eastern Amazon [102,105,106,107,108,109,110]. A decline in rainfall will compromise the well-being of millions of people living in southern and southeastern Brazil [38] who depend on this rainfall to produce food and energy.

Supplementary Materials

The following are available online at https://www.mdpi.com/article/10.3390/rs14020338/s1, Table S1: Annual values of the variables investigated in the Amazon basin calculated from orbital products, highlighted in red for the years of occurrence of El Niño. Data related to the annual average of all pixels for the whole basin for the variable rainfall (mm year−1) and Standardized Precipitation Index (SPI), performing the sum of the values every 12 months. The variables Gross Primary Productivity (GPP, kg C m−2 year−1) and Fire Foci (counts) were added for the basin in each year studied; while the variable Emissions (Tg C year−1) was added each year for the areas where fires occurred within the Amazon Basin; Table S2: Size of areas, number of polygons (NP), and relative percentage of each country with fires within the Amazon Basin; Table S3: Size of areas, number of polygons (NP), and relative percentage with fires within indigenous lands (ILs) that are in the countries inserted in Amazon Basin; Table S4: Size of areas, number of polygons (NP), and relative percentage with fires within conservation units (CU’s) that are in the countries inserted in Amazon Basin; Table S5: Multiple regression models for the emissions as a function of the fire foci, rainfall, SPI, and gross primary production (GPP). *: significant by F-test; Figure S1: Measurement of annual rainfall (mm year−1) of the study area between the years 2001 and 2019; Figure S2: Pearson-cluster correlation (red dots indicate that there were El Niño events in the year (between 2010 and 2015). Dark red dots indicate that there were sea surface temperature (SST) anomalies in the north tropical Atlantic (2005); Figure S3: Network Pearson correlation between the variables. Positive correlations were linked by green dashes, while negative correlations were linked by red dashes. The thickness of the trace is proportional to the magnitude of the correlation; Figure S4: Time series (2001–2019) of the anomaly variation between the Standardized Precipitation Index (SPI) calculated from long-time rainfall and the sum of Gross Primary Production (GPP) values for the Amazon basin, indicating its standard deviation and outliers (red dots).

Author Contributions

Conceptualization, C.A.d.S.J., M.L., P.E.T. and J.F.d.O.-J.; methodology, C.A.d.S.J., P.E.T., F.S.R. and L.P.R.T.; formal analysis, B.M.F., D.A., V.D. and V.M.T.; investigation, C.A.d.S.J., W.B., T.L., A.K., T.D.P., F.A.M. and I.M.d.S.L.; data curation, C.A.d.S.J., F.S.R. and P.E.T.; writing—original draft preparation, C.A.d.S.J., M.L., P.E.T. and J.F.d.O.-J.; writing—review and editing, L.P.R.T., B.M.F., D.A., V.D. and V.M.T.; visualization, C.A.d.S.J. and P.E.T.; supervision, C.A.d.S.J. All authors have read and agreed to the published version of the manuscript.

Funding

This research received no external funding.

Institutional Review Board Statement

Not applicable.

Informed Consent Statement

Not applicable.

Data Availability Statement

The datasets used and/or analyzed during the current study are available from the corresponding author on reasonable request.

Acknowledgments

The authors would like to thank the Fire Information for Resource Management System (FIRMS/NASA) and the Global Fire Emissions Database (GEFD). We would also like to thank the anonymous reviewers for providing insights to improve the manuscript. We are also thankful to the research laboratories of the State University of Mato Grosso (UNEMAT), the Federal University of Mato Grosso do Sul (UFMS), the Federal University of Alagoas (UFAL), and the State University of São Paulo (UNESP). C.A.d.S.J., B.M.F., D.A. and V.D. acknowledge the Program CLIMAT-AmSud Project PRELASA (21-CLIMAT-12).

Conflicts of Interest

The authors declare no conflict of interest. The funders had no role in the design of the study; in the collection, analyses, or interpretation of data; in the writing of the manuscript, or in the decision to publish the results.

References

  1. Trumbore, S.; Brando, P.; Hartmann, H. Forest Health and Global Change. Science 2015, 349, 814–818. [Google Scholar] [CrossRef] [Green Version]
  2. Brienen, R.J.W.; Phillips, O.L.; Feldpausch, T.R.; Gloor, E.; Baker, T.R.; Lloyd, J.; Lopez-Gonzalez, G.; Monteagudo-Mendoza, A.; Malhi, Y.; Lewis, S.L.; et al. Long-Term Decline of the Amazon Carbon Sink. Nature 2015, 519, 344–348. [Google Scholar] [CrossRef] [Green Version]
  3. Antonelli, A.; Zizka, A.; Carvalho, F.A.; Scharn, R.; Bacon, C.D.; Silvestro, D.; Condamine, F.L. Amazonia Is the Primary Source of Neotropical Biodiversity. Proc. Natl. Acad. Sci. USA 2018, 115, 6034–6039. [Google Scholar] [CrossRef] [PubMed] [Green Version]
  4. Esquivel-Muelbert, A.; Baker, T.R.; Dexter, K.G.; Lewis, S.L.; Brienen, R.J.W.; Feldpausch, T.R.; Lloyd, J.; Monteagudo-Mendoza, A.; Arroyo, L.; Álvarez-Dávila, E.; et al. Compositional Response of Amazon Forests to Climate Change. Glob. Chang. Biol. 2018, 25, 39–56. [Google Scholar] [CrossRef] [PubMed] [Green Version]
  5. Barnes, A.D.; Allen, K.; Kreft, H.; Corre, M.D.; Jochum, M.; Veldkamp, E.; Clough, Y.; Daniel, R.; Darras, K.; Denmead, L.H.; et al. Direct and Cascading Impacts of Tropical Land-Use Change on Multi-Trophic Biodiversity. Nat. Ecol. Evol. 2017, 1, 1511–1519. [Google Scholar] [CrossRef]
  6. Seymour, F.; Harris, N.L. Reducing Tropical Deforestation. Science 2019, 365, 756–757. [Google Scholar] [CrossRef] [Green Version]
  7. Shimabukuro, Y.E.; Arai, E.; Duarte, V.; Jorge, A.; dos Santos, E.G.; Gasparini, K.A.C.; Dutra, A.C. Monitoring Deforestation and Forest Degradation Using Multi-Temporal Fraction Images Derived from Landsat Sensor Data in the Brazilian Amazon. Int. J. Remote Sens. 2019, 40, 5475–5496. [Google Scholar] [CrossRef]
  8. Silva Junior, C.A.; Lima, M. Soy Moratorium in Mato Grosso: Deforestation Undermines the Agreement. Land Use Policy 2018, 71, 540–542. [Google Scholar] [CrossRef]
  9. Wang, C.; Caldas, M.M. Fragmentation Patterns in Land Reform Settlements in the Brazilian Amazon. Soc. Nat. Resour. 2014, 27, 742–758. [Google Scholar] [CrossRef]
  10. Sonter, L.J.; Herrera, D.; Barrett, D.J.; Galford, G.L.; Moran, C.J.; Soares-Filho, B.S. Mining Drives Extensive Deforestation in the Brazilian Amazon. Nat. Commun. 2017, 8, 1013. [Google Scholar] [CrossRef] [Green Version]
  11. Lees, A.C.; Peres, C.A.; Fearnside, P.M.; Schneider, M.; Zuanon, J.A.S. Hydropower and the Future of Amazonian Biodiversity. Biodivers. Conserv. 2016, 25, 451–466. [Google Scholar] [CrossRef]
  12. Jones, I.L.; Bull, J.W. Major Dams and the Challenge of Achieving “No Net Loss” of Biodiversity in the Tropics. Sustain. Dev. 2020, 28, 435–443. [Google Scholar] [CrossRef] [Green Version]
  13. Venter, O.; Sanderson, E.W.; Magrach, A.; Allan, J.R.; Beher, J.; Jones, K.R.; Possingham, H.P.; Laurance, W.F.; Wood, P.; Fekete, B.M.; et al. Sixteen Years of Change in the Global Terrestrial Human Footprint and Implications for Biodiversity Conservation. Nat. Commun. 2016, 7, 12558. [Google Scholar] [CrossRef] [Green Version]
  14. Aragão, L.E.O.C.; Anderson, L.O.; Fonseca, M.G.; Rosan, T.M.; Vedovato, L.B.; Wagner, F.H.; Silva, C.V.J.; Junior, C.H.L.S.; Arai, E.; Aguiar, A.P.; et al. 21st Century Drought-Related Fires Counteract the Decline of Amazon Deforestation Carbon Emissions. Nat. Commun. 2018, 9, 536. [Google Scholar] [CrossRef]
  15. Zeraatpisheh, M.; Bakhshandeh, E.; Hosseini, M.; Alavi, S.M. Assessing the Effects of Deforestation and Intensive Agriculture on the Soil Quality through Digital Soil Mapping. Geoderma 2020, 363, 114139. [Google Scholar] [CrossRef]
  16. Pham, T.G.; Nguyen, H.T.; Kappas, M. Assessment of Soil Quality Indicators under Different Agricultural Land Uses and Topographic Aspects in Central Vietnam. Int. Soil Water Conserv. Res. 2018, 6, 280–288. [Google Scholar] [CrossRef]
  17. Bandyopadhyay, S.; Novo, L.A.B.; Pietrzykowski, M.; Maiti, S.K. Assessment of Forest Ecosystem Development in Coal Mine Degraded Land by Using Integrated Mine Soil Quality Index (IMSQI): The Evidence from India. Forests 2020, 11, 1310. [Google Scholar] [CrossRef]
  18. da Silva Junior, C.A.; Teodoro, P.E.; Delgado, R.C.; Teodoro, L.P.R.; Lima, M.; de Andréa Pantaleão, A.; Baio, F.H.R.; de Azevedo, G.B.; de Oliveira Sousa Azevedo, G.T.; Capristo-Silva, G.F.; et al. Persistent Fire Foci in All Biomes Undermine the Paris Agreement in Brazil. Sci. Rep. 2020, 10, 16246. [Google Scholar] [CrossRef] [PubMed]
  19. Lima, M.; do Vale, J.C.E.; de Medeiros Costa, G.; dos Santos, R.C.; Filho, W.L.F.C.; Gois, G.; de Oliveira-Junior, J.F.; Teodoro, P.E.; Rossi, F.S.; da Silva Junior, C.A. The Forests in the Indigenous Lands in Brazil in Peril. Land Use Policy 2020, 90, 104258. [Google Scholar] [CrossRef]
  20. Lawrence, D.; Vandecar, K. Effects of Tropical Deforestation on Climate and Agriculture. Nat. Clim. Chang. 2014, 5, 27–36. [Google Scholar] [CrossRef]
  21. Caúla, R.H.; Oliveira-Júnior, J.F.; Lyra, G.B.; Delgado, R.C.; Filho, P.F.L.H. Overview of Fire Foci Causes and Locations in Brazil Based on Meteorological Satellite Data from 1998 to 2011. Environ. Earth Sci. 2015, 74, 1497–1508. [Google Scholar] [CrossRef]
  22. Barlow, J.; Lennox, G.D.; Ferreira, J.; Berenguer, E.; Lees, A.C.; Nally, R.M.; Thomson, J.R.; de Barros Ferraz, S.F.; Louzada, J.; Oliveira, V.H.F.; et al. Anthropogenic Disturbance in Tropical Forests Can Double Biodiversity Loss from Deforestation. Nature 2016, 535, 144–147. [Google Scholar] [CrossRef] [Green Version]
  23. Vancutsem, C.; Achard, F.; Pekel, J.-F.; Vieilledent, G.; Carboni, S.; Simonetti, D.; Gallego, J.; Aragão, L.E.O.C.; Nasi, R. Long-Term (1990–2019) Monitoring of Forest Cover Changes in the Humid Tropics. Sci. Adv. 2021, 7, eabe1603. [Google Scholar] [CrossRef]
  24. De Faria, B.L.; Brando, P.M.; Macedo, M.N.; Panday, P.K.; Soares-Filho, B.S.; Coe, M.T. Current and Future Patterns of Fire-Induced Forest Degradation in Amazonia. Environ. Res. Lett. 2017, 12, 95005. [Google Scholar] [CrossRef]
  25. Barlow, J.; Berenguer, E.; Carmenta, R.; França, F. Clarifying Amazonia´s Burning Crisis. Glob. Chang. Biol. 2019, 26, 319–321. [Google Scholar] [CrossRef] [Green Version]
  26. Bogaerts, M.; Cirhigiri, L.; Robinson, I.; Rodkin, M.; Hajjar, R.; Junior, C.C.; Newton, P. Climate Change Mitigation through Intensified Pasture Management: Estimating Greenhouse Gas Emissions on Cattle Farms in the Brazilian Amazon. J. Clean. Prod. 2017, 162, 1539–1550. [Google Scholar] [CrossRef]
  27. de O. Imbiriba, B.C.; de S. Ramos, J.R.; de Sousa Silva, R.; Cattanio, J.H.; do Couto, L.L.; Mitschein, T.A. Estimates of Methane Emissions and Comparison with Gas Mass Burned in CDM Action in a Large Landfill in Eastern Amazon. Waste Manag. 2020, 101, 28–34. [Google Scholar] [CrossRef]
  28. IPCC Global Warming of 1.5 °C. 2019. Available online: https://apps.ipcc.ch/outreach/documents/451/1551801374.pdf (accessed on 1 December 2021).
  29. Espinoza, J.-C.; Arias, P.A.; Moron, V.; Junquas, C.; Segura, H.; Sierra-Pérez, J.P.; Wongchuig, S.; Condom, T. Recent Changes in the Atmospheric Circulation Patterns during the Dry-to-Wet Transition Season in South Tropical South America (1979–2020): Impacts on Precipitation and Fire Season. J. Clim. 2021, 34, 1–56. [Google Scholar] [CrossRef]
  30. Morello, T.F.; Parry, L.; Markusson, N.; Barlow, J. Policy Instruments to Control Amazon Fires: A Simulation Approach. Ecol. Econ. 2017, 138, 199–222. [Google Scholar] [CrossRef] [Green Version]
  31. Morgan, W.T.; Darbyshire, E.; Spracklen, D.V.; Artaxo, P.; Coe, H. Non-Deforestation Drivers of Fires Are Increasingly Important Sources of Aerosol and Carbon Dioxide Emissions across Amazonia. Sci. Rep. 2019, 9, 16975. [Google Scholar] [CrossRef] [Green Version]
  32. Pinto, J.F.S.K.C.; Setzer, A.; Morelli, F.; Adami, M.; Venturieri, A.; Gomes, A.R. Land Use and Land Cover Dynamics in Relation to Fire Recurrence in the Brazilian Amazon, 2008–2014. In Proceedings of the IGARSS 2018—2018 IEEE International Geoscience and Remote Sensing Symposium, Valencia, Spain, 22–27 July 2018. [Google Scholar]
  33. Silva Junior, C.H.L.; Anderson, L.O.; Silva, A.L.; Almeida, C.T.; Dalagnol, R.; Pletsch, M.A.J.S.; Penha, T.V.; Paloschi, R.A.; Aragão, L.E.O.C. Fire Responses to the 2010 and 2015/2016 Amazonian Droughts. Front. Earth Sci. 2019, 7. [Google Scholar] [CrossRef]
  34. Barbosa, M.L.F.; Delgado, R.C.; de Andrade, C.F.; Teodoro, P.E.; Junior, C.A.S.; Wanderley, H.S.; Capristo-Silva, G.F. Recent Trends in the Fire Dynamics in Brazilian Legal Amazon: Interaction between the ENSO Phenomenon, Climate and Land Use. Environ. Dev. 2021, 39, 100648. [Google Scholar] [CrossRef]
  35. Fang, K.; Yao, Q.; Guo, Z.; Zheng, B.; Du, J.; Qi, F.; Yan, P.; Li, J.; Ou, T.; Liu, J.; et al. ENSO Modulates Wildfire Activity in China. Nat. Commun. 2021, 12, 1764. [Google Scholar] [CrossRef] [PubMed]
  36. Towner, J.; Cloke, H.L.; Lavado, W.; Santini, W.; Bazo, J.; de Perez, E.C.; Stephens, E.M. Attribution of Amazon Floods to Modes of Climate Variability: A Review. Meteorol. Appl. 2020, 27, e1949. [Google Scholar] [CrossRef]
  37. Brando, P.M.; Balch, J.K.; Nepstad, D.C.; Morton, D.C.; Putz, F.E.; Coe, M.T.; Silverio, D.; Macedo, M.N.; Davidson, E.A.; Nobrega, C.C.; et al. Abrupt Increases in Amazonian Tree Mortality Due to Drought-Fire Interactions. Proc. Natl. Acad. Sci. USA 2014, 111, 6347–6352. [Google Scholar] [CrossRef] [PubMed] [Green Version]
  38. Marengo, J.A.; Espinoza, J.C. Extreme Seasonal Droughts and Floods in Amazonia: Causes, Trends and Impacts. Int. J. Climatol. 2015, 36, 1033–1050. [Google Scholar] [CrossRef]
  39. Locosselli, G.M.; Brienen, R.J.W.; de Souza Leite, M.; Gloor, M.; Krottenthaler, S.; de Oliveira, A.A.; Barichivich, J.; Anhuf, D.; Ceccantini, G.; Schöngart, J.; et al. Global Tree-Ring Analysis Reveals Rapid Decrease in Tropical Tree Longevity with Temperature. Proc. Natl. Acad. Sci. USA 2020, 117, 33358–33364. [Google Scholar] [CrossRef]
  40. Zemp, D.C.; Schleussner, C.-F.; Barbosa, H.M.J.; Hirota, M.; Montade, V.; Sampaio, G.; Staal, A.; Wang-Erlandsson, L.; Rammig, A. Self-Amplified Amazon Forest Loss Due to Vegetation-Atmosphere Feedbacks. Nat. Commun. 2017, 8, 14681. [Google Scholar] [CrossRef] [PubMed]
  41. Moura, M.M.; dos Santos, A.R.; Pezzopane, J.E.M.; Alexandre, R.S.; da Silva, S.F.; Pimentel, S.M.; de Andrade, M.S.S.; Silva, F.G.R.; Branco, E.R.F.; Moreira, T.R.; et al. Relation of El Niño and La Niña Phenomena to Precipitation, Evapotranspiration and Temperature in the Amazon Basin. Sci. Total Environ. 2019, 651, 1639–1651. [Google Scholar] [CrossRef] [PubMed]
  42. Sullivan, M.J.P.; Lewis, S.L.; Affum-Baffoe, K.; Castilho, C.; Costa, F.; Sanchez, A.C.; Ewango, C.E.N.; Hubau, W.; Marimon, B.; Monteagudo-Mendoza, A.; et al. Long-Term Thermal Sensitivity of Earth’s Tropical Forests. Science 2020, 368, 869–874. [Google Scholar] [CrossRef]
  43. Brando, P.M.; Soares-Filho, B.; Rodrigues, L.; Assunção, A.; Morton, D.; Tuchschneider, D.; Fernandes, E.C.M.; Macedo, M.N.; Oliveira, U.; Coe, M.T. The Gathering Firestorm in Southern Amazonia. Sci. Adv. 2020, 6, eaay1632. [Google Scholar] [CrossRef] [PubMed] [Green Version]
  44. Chai, Y.; Martins, G.; Nobre, C.; von Randow, C.; Chen, T.; Dolman, H. Constraining Amazonian Land Surface Temperature Sensitivity to Precipitation and the Probability of Forest Dieback. NPJ Clim. Atmos. Sci. 2021, 4, 6. [Google Scholar] [CrossRef]
  45. Saatchi, S.; Longo, M.; Xu, L.; Yang, Y.; Abe, H.; André, M.; Aukema, J.E.; Carvalhais, N.; Cadillo-Quiroz, H.; Cerbu, G.A.; et al. Detecting Vulnerability of Humid Tropical Forests to Multiple Stressors. One Earth 2021, 4, 988–1003. [Google Scholar] [CrossRef]
  46. Berenguer, E.; Lennox, G.D.; Ferreira, J.; Malhi, Y.; Aragão, L.E.O.C.; Barreto, J.R.; Espírito-Santo, F.D.B.; Figueiredo, A.E.S.; França, F.; Gardner, T.A.; et al. Tracking the Impacts of El Niño Drought and Fire in Human-Modified Amazonian Forests. Proc. Natl. Acad. Sci. USA 2021, 118, e2019377118. [Google Scholar] [CrossRef] [PubMed]
  47. Berenguer, E.; Carvalho, N.; Anderson, L.O.; Aragão, L.E.O.C.; França, F.; Barlow, J. Improving the Spatial-Temporal Analysis of Amazonian Fires. Glob. Chang. Biol. 2020, 27, 469–471. [Google Scholar] [CrossRef] [PubMed]
  48. Wang, S.; Zhang, Y.; Ju, W.; Qiu, B.; Zhang, Z. Tracking the Seasonal and Inter-Annual Variations of Global Gross Primary Production during Last Four Decades Using Satellite near-Infrared Reflectance Data. Sci. Total Environ. 2021, 755, 142569. [Google Scholar] [CrossRef]
  49. NASA—Mapping the Amazon. Available online: https://earthobservatory.nasa.gov/images/145649/mapping-the-amazon (accessed on 10 March 2021).
  50. FIRMS—Fire Information for Resource Management System. Available online: https://firms.modaps.eosdis.nasa.gov/ (accessed on 10 May 2020).
  51. Chagas, M.C.; Delgado, R.C.; de Souza, L.P.; de Carvalho, D.C.; Pereira, M.G.; Teodoro, P.E.; Junior, C.A.S. Gross Primary Productivity in Areas of Different Land Cover in the Western Brazilian Amazon. Remote Sens. Appl. Soc. Environ. 2019, 16, 100259. [Google Scholar] [CrossRef]
  52. de Almeida, C.T.; Delgado, R.C.; Galvão, L.S.; de Oliveira Cruz e Aragão, L.E.; Ramos, M.C. Improvements of the MODIS Gross Primary Productivity Model Based on a Comprehensive Uncertainty Assessment over the Brazilian Amazonia. ISPRS J. Photogramm. Remote Sens. 2018, 145, 268–283. [Google Scholar] [CrossRef]
  53. Zhang, Y.; Xiao, X.; Wu, X.; Zhou, S.; Zhang, G.; Qin, Y.; Dong, J. A Global Moderate Resolution Dataset of Gross Primary Production of Vegetation for 2000–2016. Sci. Data 2017, 4, 170165. [Google Scholar] [CrossRef] [Green Version]
  54. Wang, L.; Zhu, H.; Lin, A.; Zou, L.; Qin, W.; Du, Q. Evaluation of the Latest MODIS GPP Products across Multiple Biomes Using Global Eddy Covariance Flux Data. Remote Sens. 2017, 9, 418. [Google Scholar] [CrossRef] [Green Version]
  55. Yan, H.; Wang, S.; Huete, A.; Shugart, H.H. Effects of Light Component and Water Stress on Photosynthesis of Amazon Rainforests During the 2015/2016 El Niño Drought. J. Geophys. Res. Biogeosciences 2019, 124, 1574–1590. [Google Scholar] [CrossRef]
  56. Wagle, P.; Zhang, Y.; Jin, C.; Xiao, X. Comparison of Solar-Induced Chlorophyll Fluorescence, Light-Use Efficiency, and Process-Based GPP Models in Maize. Ecol. Appl. 2016, 26, 1211–1222. [Google Scholar] [CrossRef] [Green Version]
  57. Lin, X.; Chen, B.; Chen, J.; Zhang, H.; Sun, S.; Xu, G.; Guo, L.; Ge, M.; Qu, J.; Li, L.; et al. Seasonal Fluctuations of Photosynthetic Parameters for Light Use Efficiency Models and the Impacts on Gross Primary Production Estimation. Agric. For. Meteorol. 2017, 236, 22–35. [Google Scholar] [CrossRef] [Green Version]
  58. Zhao, M.; Heinsch, F.A.; Nemani, R.R.; Running, S.W. Improvements of the MODIS Terrestrial Gross and Net Primary Production Global Data Set. Remote Sens. Environ. 2005, 95, 164–176. [Google Scholar] [CrossRef]
  59. Field, C.B.; Randerson, J.T.; Malmström, C.M. Global Net Primary Production: Combining Ecology and Remote Sensing. Remote Sens. Environ. 1995, 51, 74–88. [Google Scholar] [CrossRef] [Green Version]
  60. Zhao, M.; Running, S.W. Drought-Induced Reduction in Global Terrestrial Net Primary Production from 2000 Through 2009. Science 2010, 329, 940–943. [Google Scholar] [CrossRef] [PubMed] [Green Version]
  61. Funk, C.C.; Peterson, P.J.; Landsfeld, M.F.; Pedreros, D.H.; Verdin, J.P.; Rowland, J.D.; Romero, B.E.; Husak, G.J.; Michaelsen, J.C.; Verdin, A.P. A Quasi-Global Precipitation Time Series for Drought Monitoring 2014. Available online: https://pubs.usgs.gov/ds/832/ (accessed on 1 December 2021).
  62. Knapp, K.R.; Ansari, S.; Bain, C.L.; Bourassa, M.A.; Dickinson, M.J.; Funk, C.; Helms, C.N.; Hennon, C.C.; Holmes, C.D.; Huffman, G.J.; et al. Globally Gridded Satellite Observations for Climate Studies. Bull. Am. Meteorol. Soc. 2011, 92, 893–907. [Google Scholar] [CrossRef]
  63. Shah, R.; Bharadiya, N.; Manekar, V. Drought Index Computation Using Standardized Precipitation Index (SPI) Method For Surat District, Gujarat. Aquat. Procedia 2015, 4, 1243–1249. [Google Scholar] [CrossRef]
  64. Toté, C.; Patricio, D.; Boogaard, H.; van der Wijngaart, R.; Tarnavsky, E.; Funk, C. Evaluation of Satellite Rainfall Estimates for Drought and Flood Monitoring in Mozambique. Remote Sens. 2015, 7, 1758–1776. [Google Scholar] [CrossRef] [Green Version]
  65. Oliveira-Júnior, J.F.; Silva Junior, C.A.; Teodoro, P.E.; Rossi, F.S.; Blanco, C.J.C.; Lima, M.; Gois, G.; Filho, W.L.F.C.; Santiago, D.B.; Vanderley, M.H.G.S. Confronting CHIRPS Dataset and in Situ Stations in the Detection of Wet and Drought Conditions in the Brazilian Midwest. Int. J. Climatol. 2021, 41, 4478–4493. [Google Scholar] [CrossRef]
  66. McKee, T.B.; Doesken, N.J.; Kleist, J. The Relationship of Drought Frequency and Duration to Time Scales. In Proceedings of the Eighth Conference on Applied Climatology, Anaheim, CA, USA, 17–22 January 1993; pp. 179–184. [Google Scholar]
  67. Gois, G.; Souza, J.L.; Silva, P.R.T.; Oliveira-Júnior, J.F. Caracterização Da Desertification No Estado de Alagoas Utilizando Variáveis Climáticas. Rev. Bras. Meteorol. 2005, 20, 301–314. [Google Scholar]
  68. Teodoro, P.E.; Correia, C.C.G.; Torres, F.E.; de Oliveira, J.F.; da Silva Junior, C.A.; Gois, G.; Delgado, R.C. Analysis of the Occurrence of Wet and Drought Periods Using Standardized Precipitation Index in Mato Grosso Do Sul State, Brazil. J. Agron. 2015, 14, 80–86. [Google Scholar] [CrossRef]
  69. Sazib, N.; Mladenova, I.; Bolten, J. Leveraging the Google Earth Engine for Drought Assessment Using Global Soil Moisture Data. Remote Sens. 2018, 10, 1265. [Google Scholar] [CrossRef] [PubMed] [Green Version]
  70. Giglio, L.; Descloitres, J.; Justice, C.O.; Kaufman, Y.J. An Enhanced Contextual Fire Detection Algorithm for MODIS. Remote Sens. Environ. 2003, 87, 273–282. [Google Scholar] [CrossRef]
  71. Dozier, J. A Method for Satellite Identification of Surface Temperature Fields of Subpixel Resolution. Remote Sens. Environ. 1981, 11, 221–229. [Google Scholar] [CrossRef]
  72. Matson, M.; Dozier, J. Identification of Subresolution High Temperature Sources Using Termal IR Sensor. Photogramm. Eng. Remote Sens. 1981, 47, 1311–1318. [Google Scholar]
  73. Giglio, L.; Justice, C.; Boschetti, L.; Roy, D. MCD64A1 MODIS/Terra+Aqua Burned Area Monthly L3 Global 500m SIN Grid V006. 2015. Available online: https://cmr.earthdata.nasa.gov/search/concepts/C1364190927-LPDAAC_ECS.html (accessed on 1 December 2021).
  74. Zhou, L.; Wang, Y.; Chi, Y.; Wang, S.; Wang, Q. Contrasting Post-Fire Dynamics between Africa and South America Based on MODIS Observations. Remote Sens. 2019, 11, 1074. [Google Scholar] [CrossRef] [Green Version]
  75. van der Werf, G.R.; Randerson, J.T.; Giglio, L.; van Leeuwen, T.T.; Chen, Y.; Rogers, B.M.; Mu, M.; van Marle, M.J.E.; Morton, D.C.; Collatz, G.J.; et al. Global Fire Emissions Estimates during 1997-2016. Earth Syst. Sci. Data 2017, 9, 697–720. [Google Scholar] [CrossRef] [Green Version]
  76. GFED4s Global Fire Emissions Database. Available online: http://www.globalfiredata.org/ (accessed on 20 November 2019).
  77. Mu, M.; Randerson, J.T.; van der Werf, G.R.; Giglio, L.; Kasibhatla, P.; Morton, D.; Collatz, G.J.; DeFries, R.S.; Hyer, E.J.; Prins, E.M.; et al. Daily and 3-Hourly Variability in Global Fire Emissions and Consequences for Atmospheric Model Predictions of Carbon Monoxide. J. Geophys. Res. Atmos. 2011, 116, 1–19. [Google Scholar] [CrossRef]
  78. Pettitt, A.N. A Non-Parametric Approach to the Change-Point Problem. Appl. Stat. 1979, 28, 126. [Google Scholar] [CrossRef]
  79. R Core Team R: A Language and Environment for Statistical Computing. Available online: http://r.meteo.uni.wroc.pl/web/packages/dplR/vignettes/intro-dplR.pdf (accessed on 1 December 2021).
  80. Marengo, J.A.; Nobre, C.A.; Tomasella, J.; Oyama, M.D.; de Oliveira, G.S.; de Oliveira, R.; Camargo, H.; Alves, L.M.; Brown, I.F. The Drought of Amazonia in 2005. J. Clim. 2008, 21, 495–516. [Google Scholar] [CrossRef] [Green Version]
  81. Asner, G.P.; Nepstad, D.; Cardinot, G.; Ray, D. From The Cover: Drought Stress and Carbon Uptake in an Amazon Forest Measured with Spaceborne Imaging Spectroscopy. Proc. Natl. Acad. Sci. USA 2004, 101, 6039–6044. [Google Scholar] [CrossRef] [Green Version]
  82. Zeng, N.; Yoon, J.-H.; Marengo, J.A.; Subramaniam, A.; Nobre, C.A.; Mariotti, A.; Neelin, J.D. Causes and Impacts of the 2005 Amazon Drought. Environ. Res. Lett. 2008, 3, 14002. [Google Scholar] [CrossRef]
  83. Jiménez-Muñoz, J.C.; Mattar, C.; Sobrino, J.A.; Malhi, Y. A Database for the Monitoring of Thermal Anomalies over the Amazon Forest and Adjacent Intertropical Oceans. Sci. Data 2015, 2, 150024. [Google Scholar] [CrossRef] [PubMed] [Green Version]
  84. Gatti, L.V.; Gloor, M.; Miller, J.B.; Doughty, C.E.; Malhi, Y.; Domingues, L.G.; Basso, L.S.; Martinewski, A.; Correia, C.S.C.; Borges, V.F.; et al. Drought Sensitivity of Amazonian Carbon Balance Revealed by Atmospheric Measurements. Nature 2014, 506, 76–80. [Google Scholar] [CrossRef] [PubMed]
  85. Saatchi, S.; Asefi-Najafabady, S.; Malhi, Y.; Aragao, L.E.O.C.; Anderson, L.O.; Myneni, R.B.; Nemani, R. Persistent Effects of a Severe Drought on Amazonian Forest Canopy. Proc. Natl. Acad. Sci. USA 2012, 110, 565–570. [Google Scholar] [CrossRef] [Green Version]
  86. Funatsu, B.M.; Le Roux, R.; Arvor, D.; Espinoza, J.C.; Claud, C.; Ronchail, J.; Michot, V.; Dubreuil, V. Assessing Precipitation Extremes (1981–2018) and Deep Convective Activity (2002–2018) in the Amazon Region with CHIRPS and AMSU Data. Clim. Dyn. 2021, 57, 827–849. [Google Scholar] [CrossRef]
  87. Faria, T.D.O.; Rodrigues, T.R.; Curado, L.F.A.; Gaio, D.C.; Nogueira, J.D.S. Surface Albedo in Different Land-Use and Cover Types in Amazon Forest Region. Ambiente Agua-Interdiscip. J. Appl. Sci. 2018, 13, 1. [Google Scholar] [CrossRef] [Green Version]
  88. Baccini, A.; Walker, W.; Carvalho, L.; Farina, M.; Houghton, R.A. Response to Comment on “Tropical Forests Are a Net Carbon Source Based on Aboveground Measurements of Gain and Loss”. Science 2019, 363, eaat1205. [Google Scholar] [CrossRef] [Green Version]
  89. Zhang, K.; de Almeida Castanho, A.D.; Galbraith, D.R.; Moghim, S.; Levine, N.M.; Bras, R.L.; Coe, M.T.; Costa, M.H.; Malhi, Y.; Longo, M.; et al. The Fate of Amazonian Ecosystems over the Coming Century Arising from Changes in Climate, Atmospheric CO2, and Land Use. Glob. Chang. Biol. 2015, 21, 2569–2587. [Google Scholar] [CrossRef] [PubMed]
  90. Balch, J.K.; Brando, P.M.; Nepstad, D.C.; Coe, M.T.; Silvério, D.; Massad, T.J.; Davidson, E.A.; Lefebvre, P.; Oliveira-Santos, C.; Rocha, W.; et al. The Susceptibility of Southeastern Amazon Forests to Fire: Insights from a Large-Scale Burn Experiment. BioScience 2015, 65, 893–905. [Google Scholar] [CrossRef] [Green Version]
  91. Hantson, S.; Arneth, A.; Harrison, S.P.; Kelley, D.I.; Prentice, I.C.; Rabin, S.S.; Archibald, S.; Mouillot, F.; Arnold, S.R.; Artaxo, P.; et al. The Status and Challenge of Global Fire Modelling. Biogeosciences 2016, 13, 3359–3375. [Google Scholar] [CrossRef] [Green Version]
  92. Almeida, C.T.; Oliveira-Júnior, J.F.; Delgado, R.C.; Cubo, P.; Ramos, M.C. Spatiotemporal Rainfall and Temperature Trends throughout the Brazilian Legal Amazon, 1973-2013. Int. J. Climatol. 2016, 37, 2013–2026. [Google Scholar] [CrossRef]
  93. Marengo, J.A.; Borma, L.S.; Rodriguez, D.A.; Pinho, P.; Soares, W.R.; Alves, L.M. Recent Extremes of Drought and Flooding in Amazonia: Vulnerabilities and Human Adaptation. Am. J. Clim. Chang. 2013, 02, 87–96. [Google Scholar] [CrossRef] [Green Version]
  94. Alencar, A.A.; Brando, P.M.; Asner, G.P.; Putz, F.E. Landscape Fragmentation, Severe Drought, and the New Amazon Forest Fire Regime. Ecol. Appl. 2015, 25, 1493–1505. [Google Scholar] [CrossRef] [PubMed]
  95. dos Santos, S.R.Q.; Braga, C.C.; Sansigolo, C.A.; de Araujo Tiburtino Neves, T.T.; dos Santos, A.P.P. Droughts in the Amazon: Identification, Characterization and Dynamical Mechanisms Associated. Am. J. Clim. Chang. 2017, 06, 425–442. [Google Scholar] [CrossRef] [Green Version]
  96. Espinoza, J.C.; Marengo, J.A.; Ronchail, J.; Carpio, J.M.; Flores, L.N.; Guyot, J.L. The Extreme 2014 Flood in South-Western Amazon Basin: The Role of Tropical-Subtropical South Atlantic SST Gradient. Environ. Res. Lett. 2014, 9, 124007. [Google Scholar] [CrossRef]
  97. Gloor, M.; Brienen, R.J.W.; Galbraith, D.; Feldpausch, T.R.; Schöngart, J.; Guyot, J.-L.; Espinoza, J.C.; Lloyd, J.; Phillips, O.L. Intensification of the Amazon Hydrological Cycle over the Last Two Decades. Geophys. Res. Lett. 2013, 40, 1729–1733. [Google Scholar] [CrossRef]
  98. Uvo, C.B.; Repelli, C.A.; Zebiak, S.E.; Kushnir, Y. The Relationships between Tropical Pacific and Atlantic SST and Northeast Brazil Monthly Precipitation. J. Clim. 1998, 11, 551–562. [Google Scholar] [CrossRef]
  99. Espinoza, J.C.; Ronchail, J.; Guyot, J.L.; Junquas, C.; Vauchel, P.; Lavado, W.; Drapeau, G.; Pombosa, R. Climate Variability and Extreme Drought in the Upper Solimões River (Western Amazon Basin): Understanding the Exceptional 2010 Drought. Geophys. Res. Lett. 2011, 38, 1–6. [Google Scholar] [CrossRef]
  100. Gutiérrez-Vélez, V.H.; Uriarte, M.; DeFries, R.; Pinedo-Vásquez, M.; Fernandes, K.; Ceccato, P.; Baethgen, W.; Padoch, C. Land Cover Change Interacts with Drought Severity to Change Fire Regimes in Western Amazonia. Ecol. Appl. 2014, 24, 1323–1340. [Google Scholar] [CrossRef] [PubMed]
  101. Fu, R.; Yin, L.; Li, W.; Arias, P.A.; Dickinson, R.E.; Huang, L.; Chakraborty, S.; Fernandes, K.; Liebmann, B.; Fisher, R.; et al. Increased Dry-Season Length over Southern Amazonia in Recent Decades and Its Implication for Future Climate Projection. Proc. Natl. Acad. Sci. USA 2013, 110, 18110–18115. [Google Scholar] [CrossRef] [Green Version]
  102. INPE Terrabrasilis–Plataforma de Dados Geográficos. Available online: http://terrabrasilis.dpi.inpe.br/app/dashboard/deforestation/biomes/amazon/increments (accessed on 25 September 2021).
  103. Matricardi, E.A.T.; Skole, D.L.; Costa, O.B.; Pedlowski, M.A.; Samek, J.H.; Miguel, E.P. Long-Term Forest Degradation Surpasses Deforestation in the Brazilian Amazon. Science 2020, 369, 1378–1382. [Google Scholar] [CrossRef]
  104. Lovejoy, T.E.; Nobre, C. Amazon Tipping Point. Sci. Adv. 2018, 4, eaat2340. [Google Scholar] [CrossRef] [Green Version]
  105. Oliveira, L.J.C.; Costa, M.H.; Soares-Filho, B.S.; Coe, M.T. Large-Scale Expansion of Agriculture in Amazonia May Be a No-Win Scenario. Environ. Res. Lett. 2013, 8, 24021. [Google Scholar] [CrossRef] [Green Version]
  106. Nobre, C.A.; Sampaio, G.; Borma, L.S.; Castilla-Rubio, J.C.; Silva, J.S.; Cardoso, M. Land-Use and Climate Change Risks in the Amazon and the Need of a Novel Sustainable Development Paradigm. Proc. Natl. Acad. Sci. USA 2016, 113, 10759–10768. [Google Scholar] [CrossRef] [Green Version]
  107. Khanna, J.; Medvigy, D.; Fueglistaler, S.; Walko, R. Regional Dry-Season Climate Changes Due to Three Decades of Amazonian Deforestation. Nat. Clim. Chang. 2017, 7, 200–204. [Google Scholar] [CrossRef]
  108. Ferrante, L.; Fearnside, P.M. Brazil’s New President and ‘ruralists’ Threaten Amazonia’s Environment, Traditional Peoples and the Global Climate. Environ. Conserv. 2019, 46, 261–263. [Google Scholar] [CrossRef]
  109. DOU—DECRETO No 10.084, DE 5 DE NOVEMBRO DE 2019—DOU—Imprensa Nacional. Available online: https://www.in.gov.br/en/web/dou/-/decreto-n-10.084-de-5-de-novembro-de-2019-226227716 (accessed on 10 November 2021).
  110. Malhi, Y.; Roberts, J.T.; Betts, R.A.; Killeen, T.J.; Li, W.; Nobre, C.A. Climate Change, Deforestation, and the Fate of the Amazon. Science 2008, 319, 169–172. [Google Scholar] [CrossRef] [PubMed] [Green Version]
Figure 1. Study area located in the Amazon Basin (South America) with fire foci from January to August 2019 obtained from Moderate Resolution Imaging Spectroradiometer (MODIS) data. MODIS tile centers are marked by a red circle with the corresponding reference code (Terra/Aqua [50]).
Remotesensing 14 00338 g001
Figure 2. Measurement of each annual pixel for the gross primary productivity (GPP, kg C m−2 year−1) variable of the Amazon Basin between 2001 and 2019. Red dots indicate the occurrence of El Niño (see Figure S2). Notice that the color scales vary slightly from year to year.
Remotesensing 14 00338 g002
Figure 3. Measurement of each pixel in the Amazon Basin related to the standardized precipitation index (SPI) and the annual sum of the values between 2001 and 2019. Red dots indicate the occurrence of El Niño or Atlantic SST anomalies (see Figure S2).
Remotesensing 14 00338 g003
Figure 4. Identification and measurements of the annual burned areas (quarters, Q1–Q4) in the Amazon Basin based on the processed data of the product MCD64A1 (Julian days) between 2001 and 2019. Red dots indicate the occurrence of El Niño or Atlantic SST anomalies (see Figure S2).
Remotesensing 14 00338 g004
Figure 5. Percentage of burned area in conservation areas (indigenous lands (ILs) and conservation units (CUs)) and other areas in each country in the Amazon Basin. The burned area weighted values of each country by the total Amazon Basin area are listed in Tables S3 and S4.
Remotesensing 14 00338 g005
Figure 6. Correlation between variables emissions (a) standardized precipitation index (SPI); (b) gross primary productivity (GPP); and (c) fire foci (counts), followed by the coefficients of agreement (R2), Pearson (r) values, and p-values.
Remotesensing 14 00338 g006
Figure 7. General representation of the Amazon Basin during the period 2001–2019, including (a) the study period average gross primary productivity (GPP, kg C m−2); (b) the sum of each year’s standardized precipitation index (SPI); and (c) the sum of the burned areas (quarters, Q1–Q4). Exact values of the variables mentioned for the Amazon Basin are listed in Table S1.
Remotesensing 14 00338 g007
Table 1. Trend analysis (p-value) applied to annual time series fire foci, rainfall, standardized precipitation index (SPI), emissions, and gross primary production (GPP).
VariablePettitt’s TestMan–Kendall Test
Fire foci0.23420.1773
Rainfall0.20780.5291
SPI0.05880.1476
Emissions0.57560.4002
GPP0.06880.2948
Publisher’s Note: MDPI stays neutral with regard to jurisdictional claims in published maps and institutional affiliations.

