Article

Lava Volume from Remote Sensing Data: Comparisons with Reverse Petrological Approaches for Two Types of Effusive Eruption

1
Laboratoire Magmas et Volcans, Université Clermont-Auvergne, CNRS, IRD, OPGC, 63000 Clermont-Ferrand, France
2
Department of Geological and Mining Engineering and Sciences, Michigan Technological University, Houghton, MI 49931, USA
3
Dipartimento di Scienze Della Terra, Università di Torino, Via Valperga Caluso 35, 10135 Torino, Italy
4
Institut de Physique du Globe de Paris, CNRS, Université de Paris, 75005 Paris, France
5
Observatoire Volcanologique du Piton de la Fournaise, Institut de Physique du Globe de Paris, La Plaine des Cafres, 75005 Paris, France
6
Department of Space, Earth and Environment, Chalmers University of Technology, SE-41296 Gothenburg, Sweden
*
Author to whom correspondence should be addressed.
Remote Sens. 2022, 14(2), 323; https://doi.org/10.3390/rs14020323
Submission received: 2 November 2021 / Revised: 30 November 2021 / Accepted: 28 December 2021 / Published: 11 January 2022

Abstract

:
Five effusive eruptions of Piton de la Fournaise (La Réunion) are analyzed to investigate temporal trends of erupted mass and sulfur dioxide (SO2) emissions. Daily SO2 emissions are acquired from three ultraviolet (UV) satellite instruments (the Ozone Monitoring Instrument (OMI), the Ozone Mapping and Profiler Suite (OMPS), and the Tropospheric Monitoring Instrument (TROPOMI)) and an array of ground-based UV spectrometers (Network for Observation of Volcanic and Atmospheric Change (NOVAC)). Time-averaged lava discharge rates (TADRs) are obtained from two automatic satellite-based hot spot detection systems: MIROVA and MODVOLC. Assuming that the lava volumes measured in the field are accurate, the MIROVA system gave the best estimation of erupted volume among the methods investigated. We use a reverse petrological method to constrain pre-eruptive magmatic sulfur contents based on observed SO2 emissions and lava volumes. We also show that a direct petrological approach using SO2 data might be a viable alternative for TADR estimation during cloudy weather that compromises hot spot detection. In several eruptions we observed a terminal increase in TADR and SO2 emissions after initial emission of evolved degassed magma. We ascribe this to input of deeper, volatile-rich magma into the plumbing system towards the end of these eruptions. Furthermore, we find no evidence of volatile excess in the five eruptions studied, which were thus mostly fed by shallow degassed magma.

Graphical Abstract

1. Introduction

Volcanic eruptions are associated with a multitude of geophysical and geochemical signals, including seismicity (e.g., seismic swarms and volcanic tremor), ground deformation, heat flux, and changes in gas emissions and composition. These signals can be detected and tracked by permanent ground stations and satellite observations [1]. Over the years, development of various technologies for near-real time and continuous data collection has led to improvements in volcano monitoring and tracking of their eruptive behavior. Here, we combine ultraviolet (UV) and infrared (IR) satellite measurements [2,3,4,5,6,7,8] to investigate concurrent trends in lava effusion and sulfur dioxide (SO2) emission during multiple effusive eruptions of Piton de la Fournaise (La Réunion, France). Current UV satellite instruments, including the Ozone Monitoring Instrument (OMI) [8,9], the Ozone Mapping and Profiler Suite (OMPS) [3,8], and the Tropospheric Monitoring Instrument (TROPOMI) [2,7], allow for daily monitoring of volcanic SO2 emissions. Thermal infrared (TIR) satellite sensors permit the detection of volcanic hot spots associated with surface activity (e.g., lava flows, lava lakes and domes). Within this category, the Moderate Resolution Imaging Spectroradiometer (MODIS) Level 1B data, provided by sensors on NASA’s Terra and Aqua satellites, are used as the basis for two automated volcano-monitoring systems: Middle InfraRed Observation of Volcanic Activity (MIROVA), and MODIS Thermal Alert System (MODVOLC). Further details on the MIROVA and MODVOLC algorithms are provided by Coppola et al. (2016) [6] and Wright (2016) [10].
Piton de la Fournaise (La Réunion, France) is one of the most active volcanoes in the world, producing frequent effusive basaltic eruptions of varying duration (averaging one eruption every nine months since 1985 [1,11]), with lava effusion rates typically ranging from one to a few tens of m3 s–1 [12]. Formed about 4500 years ago, most of the recent activity has occurred inside the Enclos Fouqué, a horseshoe-shaped depression opening eastward to the Indian Ocean. However, eruptions can occur outside the caldera, threatening the surrounding communities. The summit of Piton de la Fournaise is currently composed of two craters: Bory and Dolomieu (Figure 1). It is also important to note that despite the intense eruptive activity, during intra-eruptive phases the amount of emitted gas is very low [13]. There may be no degassing at all from the volcano between eruptive phases, or the amount can be too low to be measured by satellite instruments, i.e., SO2 amounts are below the detection threshold [13]. This is confirmed by ground-based measurements, which do not detect any SO2 emissions between eruptions [14]. It has been demonstrated that the plumbing system at Piton de la Fournaise is composed of several storage levels connected to each other by sills and dykes ranging from 0.5 to about 15 km in depth [1,15]. The majority of the eruptions occurring at Piton de la Fournaise appear to be fed by the shallowest reservoirs located between 0.5 and 2.5 km beneath the summit crater, with the main reservoir located at about 1.5–2.5 km in depth [15].
The high frequency of eruptions at Piton de la Fournaise in recent years provides an extensive dataset to explore the relationships between eruptive heat and gas fluxes. In this study, we estimate lava discharge rates by adapting the methodology of Harris et al. (2007) [18] to five eruptions characterized by different trends in intensity of activity: April 2007, May 2015, August–October 2015, February 2019, and April 2020 (See Figure 1 for the locations of these eruptions). Time-averaged lava discharge rates (TADRs) are used to interpret the evolution of the effusive activity, which in turn is compared with SO2 emissions detected by the three UV satellite sensors, and the temporal variation of the pre-eruptive sulfur (S) content in olivine-hosted melt inclusions. The objective of this study is to reconcile estimates of erupted lava volumes from the two MODIS systems (MODVOLC and MIROVA) and the UV sensors used for TADR and SO2 emission measurements, respectively. The aim is to define the optimum approach for tracking effusive eruptions under different eruptive, meteorological, and instrumental conditions. Furthermore, the analysis of a suite of eruptions at different locations and with different eruptive trends yields insight into the characteristics of the magma reservoir(s) supplying these events [12]. In fact, this comparison allow us to identify different styles of eruptive behavior based on lava and gas emission rates and, in parallel, to confirm that these eruptions were mostly fed by degassed magma resident in the shallow system.

2. Instrument Description

2.1. Tropospheric SO2 Emissions Measured from Space

To quantify eruptive SO2 emissions, we use daily SO2 data acquired by the UV OMI, OMPS, and TROPOMI sensors. The SO2 emissions data are available at the NASA Global Sulfur Dioxide Monitoring website: https://so2.gsfc.nasa.gov/ (last access: 8 October 2021), which collates data from the three instruments. A summary of the main features for each instrument is available in Table A1.

2.1.1. The Ozone Monitoring Instrument

OMI is a hyperspectral UV and visible (VIS) spectrometer capable of detecting and measuring SO2 associated with volcanic eruptions and passive degassing from space. This instrument is onboard NASA’s Aura satellite (operational from September 2004–present), which is in a polar orbit with a local afternoon equator overpass at 13:45. It provides daily, global coverage with a spatial resolution at nadir of 13 × 24 km2, but with data gaps since 2009 due to the ‘row anomaly’ [9]. OMI data products include ozone, SO2, and other trace gases such as BrO, HCHO, NO2, and OCIO. The UV-2 channel ranges from 307 nm to 383 nm and is used to measure SO2 with a spectral resolution of 0.45 nm [8,9]. The SO2 vertical column densities (VCDs) are retrieved using a low-noise principal component analysis (PCA) algorithm [8]. Since the retrieved SO2 VCD depends on the assumed plume height, the algorithm generates VCDs for three different hypothetical vertical profiles of volcanic SO2 (3 km, 8 km, and 18 km). If the plume height is known, the correct SO2 VCD can then be recalculated by linear interpolation. The default SO2 plume altitude used by NASA’s Global Sulfur Dioxide Monitoring website is 8 km (mid-troposphere or TRM), which is appropriate for moderate volcanic eruptions.

2.1.2. The Ozone Mapping and Profiler Suite Instrument

NASA’s Suomi NPP/OMPS is a nadir-viewing hyperspectral instrument measuring backscattered UV radiance with a spectral resolution of 1 nm. It is situated in a low Earth orbit, with a local ascending equator overpass at 13:30. OMPS provides daily global coverage with a nadir pixel size of 50 × 50 km2. Operational OMPS SO2 retrievals use the same PCA algorithm used for OMI retrievals [8], and OMPS SO2 measurements are of similar quality to OMI SO2 data, but with lower spatial resolution. However, unlike OMI, OMPS currently provides daily global coverage without data gaps.

2.1.3. The Tropospheric Monitoring Instrument

ESA’s Sentinel-5 Precursor satellite, also known as Sentinel-5P, carries only one instrument: TROPOMI. This instrument has four spectral channels covering the UV to short-wave infrared (SWIR) wavelength regions. The TROPOMI 310 to 405 nm waveband is used for SO2 retrievals and has a spectral resolution of 0.54 nm. The Sentinel-5P spacecraft follows a polar orbit with a local equator crossing at 13:30 (ascending node). With a spatial resolution of 7 × 3.5 km2, TROPOMI provides daily SO2 measurements with higher spatial resolution than OMI and OMPS [2]. TROPOMI SO2 retrievals employ the differential optical absorption spectroscopy (DOAS) method using a combination of three fitting windows, namely 312–326 nm as standard, plus 325–335 nm or 360–390 nm as alternatives to avoid signal saturation for high SO2 loading [7].

2.2. NOVAC Network

As well as SO2 data from satellite instruments, we use ground-based measurements from a set of three DOAS instruments from the Network for Observation of Volcanic and Atmospheric Change (NOVAC) operated by the Observatoire Volcanologique du Piton de la Fournaise (OVPF) of the Institut de Physique du Globe de Paris. The stations have been scanning over the Dolomieu crater’s rim since September 2007, i.e., after the April 2007 eruption. The stations are at distances of 4 to 6 km W of the crater (Figure 1), and cover plumes transported north, west, or south from the volcano. NOVAC measurements involve the acquisition of UV spectra (280–420 nm) of skylight over a conical scanning plane enclosing the volcano. The spectra obtained are analyzed using the DOAS technique [19] to derive SO2 columns in the range of 310–325 nm. Plume height and direction are obtained from triangulation of measurements from two stations, while plume speed is obtained from meteorological stations or atmospheric transport models. For this study, we used wind speed from the European Centre for Medium-Range Weather Forecasts (ECMWF) ERA5 re-analysis database (0.25 × 0.25 deg, summit level, hourly). The typical time resolution of a gas flux measurement is 5 min, and the uncertainty of a fully scanned plume lies at about 30% [19]. However, the possibility and quality of the measurements depend on the wind direction, the weather conditions, and the magnitude of the eruption, as well as the vent location. Gas emissions escape detection by NOVAC instruments during nighttime, when transported to the east of the volcano, when the plume is not lifted above the level of the Dolomieu crater’s rim, or when its altitude is several (>5) km high above the station. Incompletely scanned plumes would lead to underestimation of the flux, but the spatial information could be used to determine the direction and altitude of the plume.

3. Materials and Methods

We processed OMI, OMPS, and TROPOMI SO2 data for all eruptions at Piton de la Fournaise since 2004, deriving and comparing daily SO2 emissions. Figure A1 gives the time-series of SO2 mass during the selected eruptions. In parallel, TADR data were acquired for the MODVOLC and MIROVA systems and estimated from manual processing of the MODIS images. By integrating these data through an eruption, the cumulative lava volume can be determined and compared to field observations, assuming the latter are the most accurate, to validate the satellite-based estimates. In addition, total SO2 emissions for each eruption are estimated for a range of sulfur (S) contents within melt inclusions and matrix glasses using a direct petrological approach. A reverse petrological approach is also used to estimate the daily pre-eruptive magmatic sulfur content during the eruptions by fixing the residual sulfur content within the lava matrix and assuming that the observed SO2 emissions are derived from the satellite-based lava mass.

3.1. Field Measurements

Generally, field measurements only include the bulk lava volumes erupted. However the total lava volume should also include the cone and pyroclasts emitted during the event. A linear correlation was established by Michon et al. (2013) [20] between the lava and pyroclast volume, allowing for the estimation of this missing volume. Usually it represents about 10% of the total volume or less. The field bulk lava volume data presented in this study came from the analysis of Derrien (2019) [21]. The application of digital image processing techniques to (aerial) photographs (a.k.a. photogrammetry) associated with 3D models provide a fine analysis of lava flows volumes that takes into account the morphological evolution of the ground. The reader may refer to Derrien (2019) [21] for further information on the techniques used to acquire this data. In the following sections, we also discuss the Dense Rock Equivalent (DRE) lava volume, which is obtained by removing the vesicularity and crystallinity of the lava from the bulk lava volume.

3.2. MODIS Image Processing

TADRs for Piton de la Fournaise eruptions were calculated from thermal data acquired by two automated systems: MIROVA and MODVOLC. For the MODVOLC approach, the data are publicly available on http://modis.higp.hawaii.edu/ (last access: 8 October 2021). MIROVA data were provided by the University of Turin. Both MODVOLC and MIROVA use MODIS Level 1b data collected from NASA’s Terra and Aqua satellites [4,5,6]. However, MODVOLC provides thermal anomaly data in terms of total lava flow radiance ( L f l o w ), whereas MIROVA gives those data in terms of Volcanic Radiative Power (VRP = [1.89 × 10⁷] ×   L f l o w ) [22,23]. Terra and Aqua MODIS acquire data in 36 spectral bands ranging from 0.4 to 14.4 μ m and provide global coverage every one to two days following the EOS orbit. The bands of interest have a nominal resolution of 1 km at nadir [5]. Our goal was to compare the TADRs derived from MODVOLC and MIROVA and to validate the TADRs using manual analysis of MODIS L1b data (hereafter referred to as “Manual”). Note that the TADR and the effusive trend are provided by considering only the MODIS Level 1b data acquired during good weather conditions. Hence the raw L1b MODIS radiance data were downloaded in order to manually select the hot spots and background pixels using the ENVI software. As part of this manual approach, spectral radiances were extracted from four spectral bands of interest:
  • Radiance of Band 21 centered at 3.959 μ m (Mid Infra-Red (MIR) channel: low gain);
  • Radiance of Band 22 centered at 3.959 μ m (MIR channel: high gain);
  • Radiance of Band 31 centered at 11.03 μ m (Thermal Infra-Red (TIR) channel);
  • Radiance of Band 32 centered at 12.02 μ m (TIR channel).
Following pixel selection, the pixel spectral radiances were corrected for surface emissivity, atmospheric transmission, atmospheric emission, and surface reflection effects using the following equation:
L ( λ , T S ) = L ( λ , T * ) L u ( λ ) ε λ τ λ ,
where L is the Planck function, L ( λ , T S ) is the surface radiance for a surface at temperature T S measured at wavelength λ , L ( λ , T * ) is the at-sensor radiance, ε λ is spectral emissivity, τ λ is the atmospheric spectral transmissivity, and L u ( λ ) is atmospheric upwelling radiance. The three last parameters were obtained using MODTRAN software [22]. Further details of the procedure are given in Harris (2013) [24].
The most important factor is saturation, which happens when the amount of emitted radiance that the MODIS sensor can detect is exceeded. To determine the pixel fraction occupied by a hot target necessary to saturate the different bands, Equation (2) is used [25]:
p = L ( T s a t ) L ( T b ) L ( T h o t ) L ( T b ) ,
where L ( T b ) is the background radiance for the cold surface at temperature T b , and L ( T h o t ) is the radiance of the hot spot. For a given hot spot and background temperature, we were able to determine p , the pixel fraction needed to reach the saturation level of the sensor, L ( T s a t ) with   T s a t   being the saturation temperature. The saturation temperatures were fixed at 60 °C, 180 °C, and 130 °C for Bands 22, 21, and 31 and 32, respectively [25]. Once the saturation point is reached, only a single value is recorded, so even if the area and temperature of the hot spot increases, the brightness temperature will remain the same. Thus, any derived value (e.g., TADR) using saturated values will provide a minimum limit on the value, where Figure 2 shows the upper limit of the size/temperature of the feature that can be measured before this occurs for a T b of 25 °C. By taking a 1 km2 pixel (e.g., at nadir) and a hot spot temperature of 500 °C, Figure 2 illustrates that only a small portion of a pixel (3.50%) is needed to complete a saturation in the MIR compared to those in TIR (12.35–13.30%). It is also important to point out that Band 22 reaches the saturation level for a much smaller area (1200 m2) than Band 21 (35,000 m2).

3.3. Estimation of Lava Discharge Rate from MODIS Data

Two methods were applied in this study to estimate TADR that use a bulk (not DRE) lava volume. The first method is a linear relationship directly relating the satellite-derived spectral radiance and TADR (Direct Conversion, DC):
T A D R = c × L λ f l o w ,
where L λ f l o w is the hot spot radiance minus the background radiance summed for all relevant MODIS pixels, and c is a constant equal to 0.128 m5 J–1, as determined during the May–July 2003 eruption at Piton de la Fournaise [26,27]. The second way to obtain the TADR is to utilize a thermodynamic approach (TA) [28]:
T A D R = σ ε ( T c 4 T a 4 ) + h c ( T c T a ) ρ m ( c p Δ T + φ c L ) × A l a v a
where σ is the Stefan Boltzmann constant (5.67 ×   10 8 W m–2 K–4), h c is the convective heat transfer coefficient (10 W m–2 K–1, [24]), T c and T a are the temperature (K) of the lava surface and background, respectively, ρ m is the bulk density of the lava (kg m–3), c p is the bulk specific heat (J kg–1 K–1), c L is the latent heat of crystallization (J kg–1), Δ T is the cooling range between the vent and the flow front [26] (K), φ is the crystallization in cooling through Δ T , and A l a v a is the active lava area (m2). Equation (4) can be reduced to a linear relationship, where m b is an empirical parameter that converts A l a v a to TADR.
T A D R = m b × A l a v a
The constants m and b combine all the assumed values that are the same for all measurements [27,29], where m   = 2.07   ×   10 4 and b =   6.12   ×   10 7 . Using a value of 3.38   ×   10 4 for m b , Equation (5) provides nearly the same results as the direct conversion from spectral radiance (Equation (3)), except for the April 2007 eruption, where a m b value of 3.53   ×   10 4 gives the best fit. In addition, following Coppola et al. (2009) [27], for the April 2007 eruption, the maximum TADR is increased by 30% due to the flux lost to the ocean. By integrating TADR through the whole duration of the eruption, we acquire the volume of lava erupted with 30% uncertainty [22,29].
Instead, MIROVA data are provided in terms of Volcanic Radiative Power (VRP in W). Hence, TADR is calculated using a coefficient called radiant density ( c r a d in J m–3), which is based on the silica content of the erupted lavas, as follows [22,30]:
T A D R = V R P c r a d

3.4. Relationships between SO2 Emissions and Erupted Volumes

3.4.1. Petrologic Method

The petrological approach assumes that melt inclusions trapped within olivine phenocrysts in the magma chamber represent the pre-eruptive volatile contents dissolved in the magma and that no accumulation of exsolved volatiles occurs in the reservoir. We assume that there are no additional contributions from independent fluid and solid phases, and that melt inclusions record variable degrees of magma degassing in the plumbing system [31]. As a consequence, the source of the degassed S is only the melt phase of the magma. The direct (standard) petrologic method, therefore, estimates the mass of SO2 ( M S O 2 ) released as
M S O 2 = [ ρ m × V l a v a × ( 1 ϕ ε c r x ) ] × 2 × ( c S M I c S m a t r i x ) 10 6 = α × ( c S M I c S m a t r i x ) .
Results are given with 45 % uncertainty. V l a v a is the total (bulk) volume of lava emitted during the eruption (m3—here the MIROVA data were used), c S M I and c S m a t r i x are the sulfur concentrations recorded in the melt inclusion and the degassed matrix (ppm), respectively,   ρ m is the average bulk melt density assuming a melt density of 2940 kg m–3, ϕ is vesicularity, ε c r x is the average volume fraction of phenocrysts in the magma [32], and α (kg) is a constant clustering all the parameters cited above. Table 1 summarizes the crystal fraction, vesicularity, and the bulk density data used for the studied eruptions.

3.4.2. Reverse Petrologic Method including a Time Parameter

According to petrological analysis [33], c S m a t r i x can be fixed at 160 ± 60 ppm during high intensity phases (e.g., lava fountains). This residual value can increase up to 230 ± 30 ppm during the phases of fast magma ascent and incomplete degassing [13,33]. Knowing this parameter and the daily SO2 and lava masses detected from space, Equation (7) may be arranged to determine the pre-eruptive magma S content as
c S M I = c S m a t r i x + M S O 2 α .
Vesicularity and crystallinity, included in the α parameter, can vary during eruptions (see Table 1) and so are adjusted accordingly. In this way, a time series of the pre-eruptive sulfur content can be estimated with 50 % uncertainty. In addition, we assume that the SO2 is not significantly dissolved in condensed water or absorbed on ash and/or Pele’s hairs in the volcanic plume.

4. Results

4.1. Comparisons with NOVAC

SO2 masses calculated from the satellite data were first compared with the SO2 flux measured from ground-based NOVAC stations for the five selected eruptions (Figure 3). Despite some differences, Figure 3 shows good agreement for the eruptions occurring in 2015, where the same trends were apparent in all datasets (OMPS, OMI, and NOVAC). However, for the February 2019 and April 2020 eruptions, the NOVAC fluxes were much lower than the satellite measurements.

4.2. MODIS Analysis

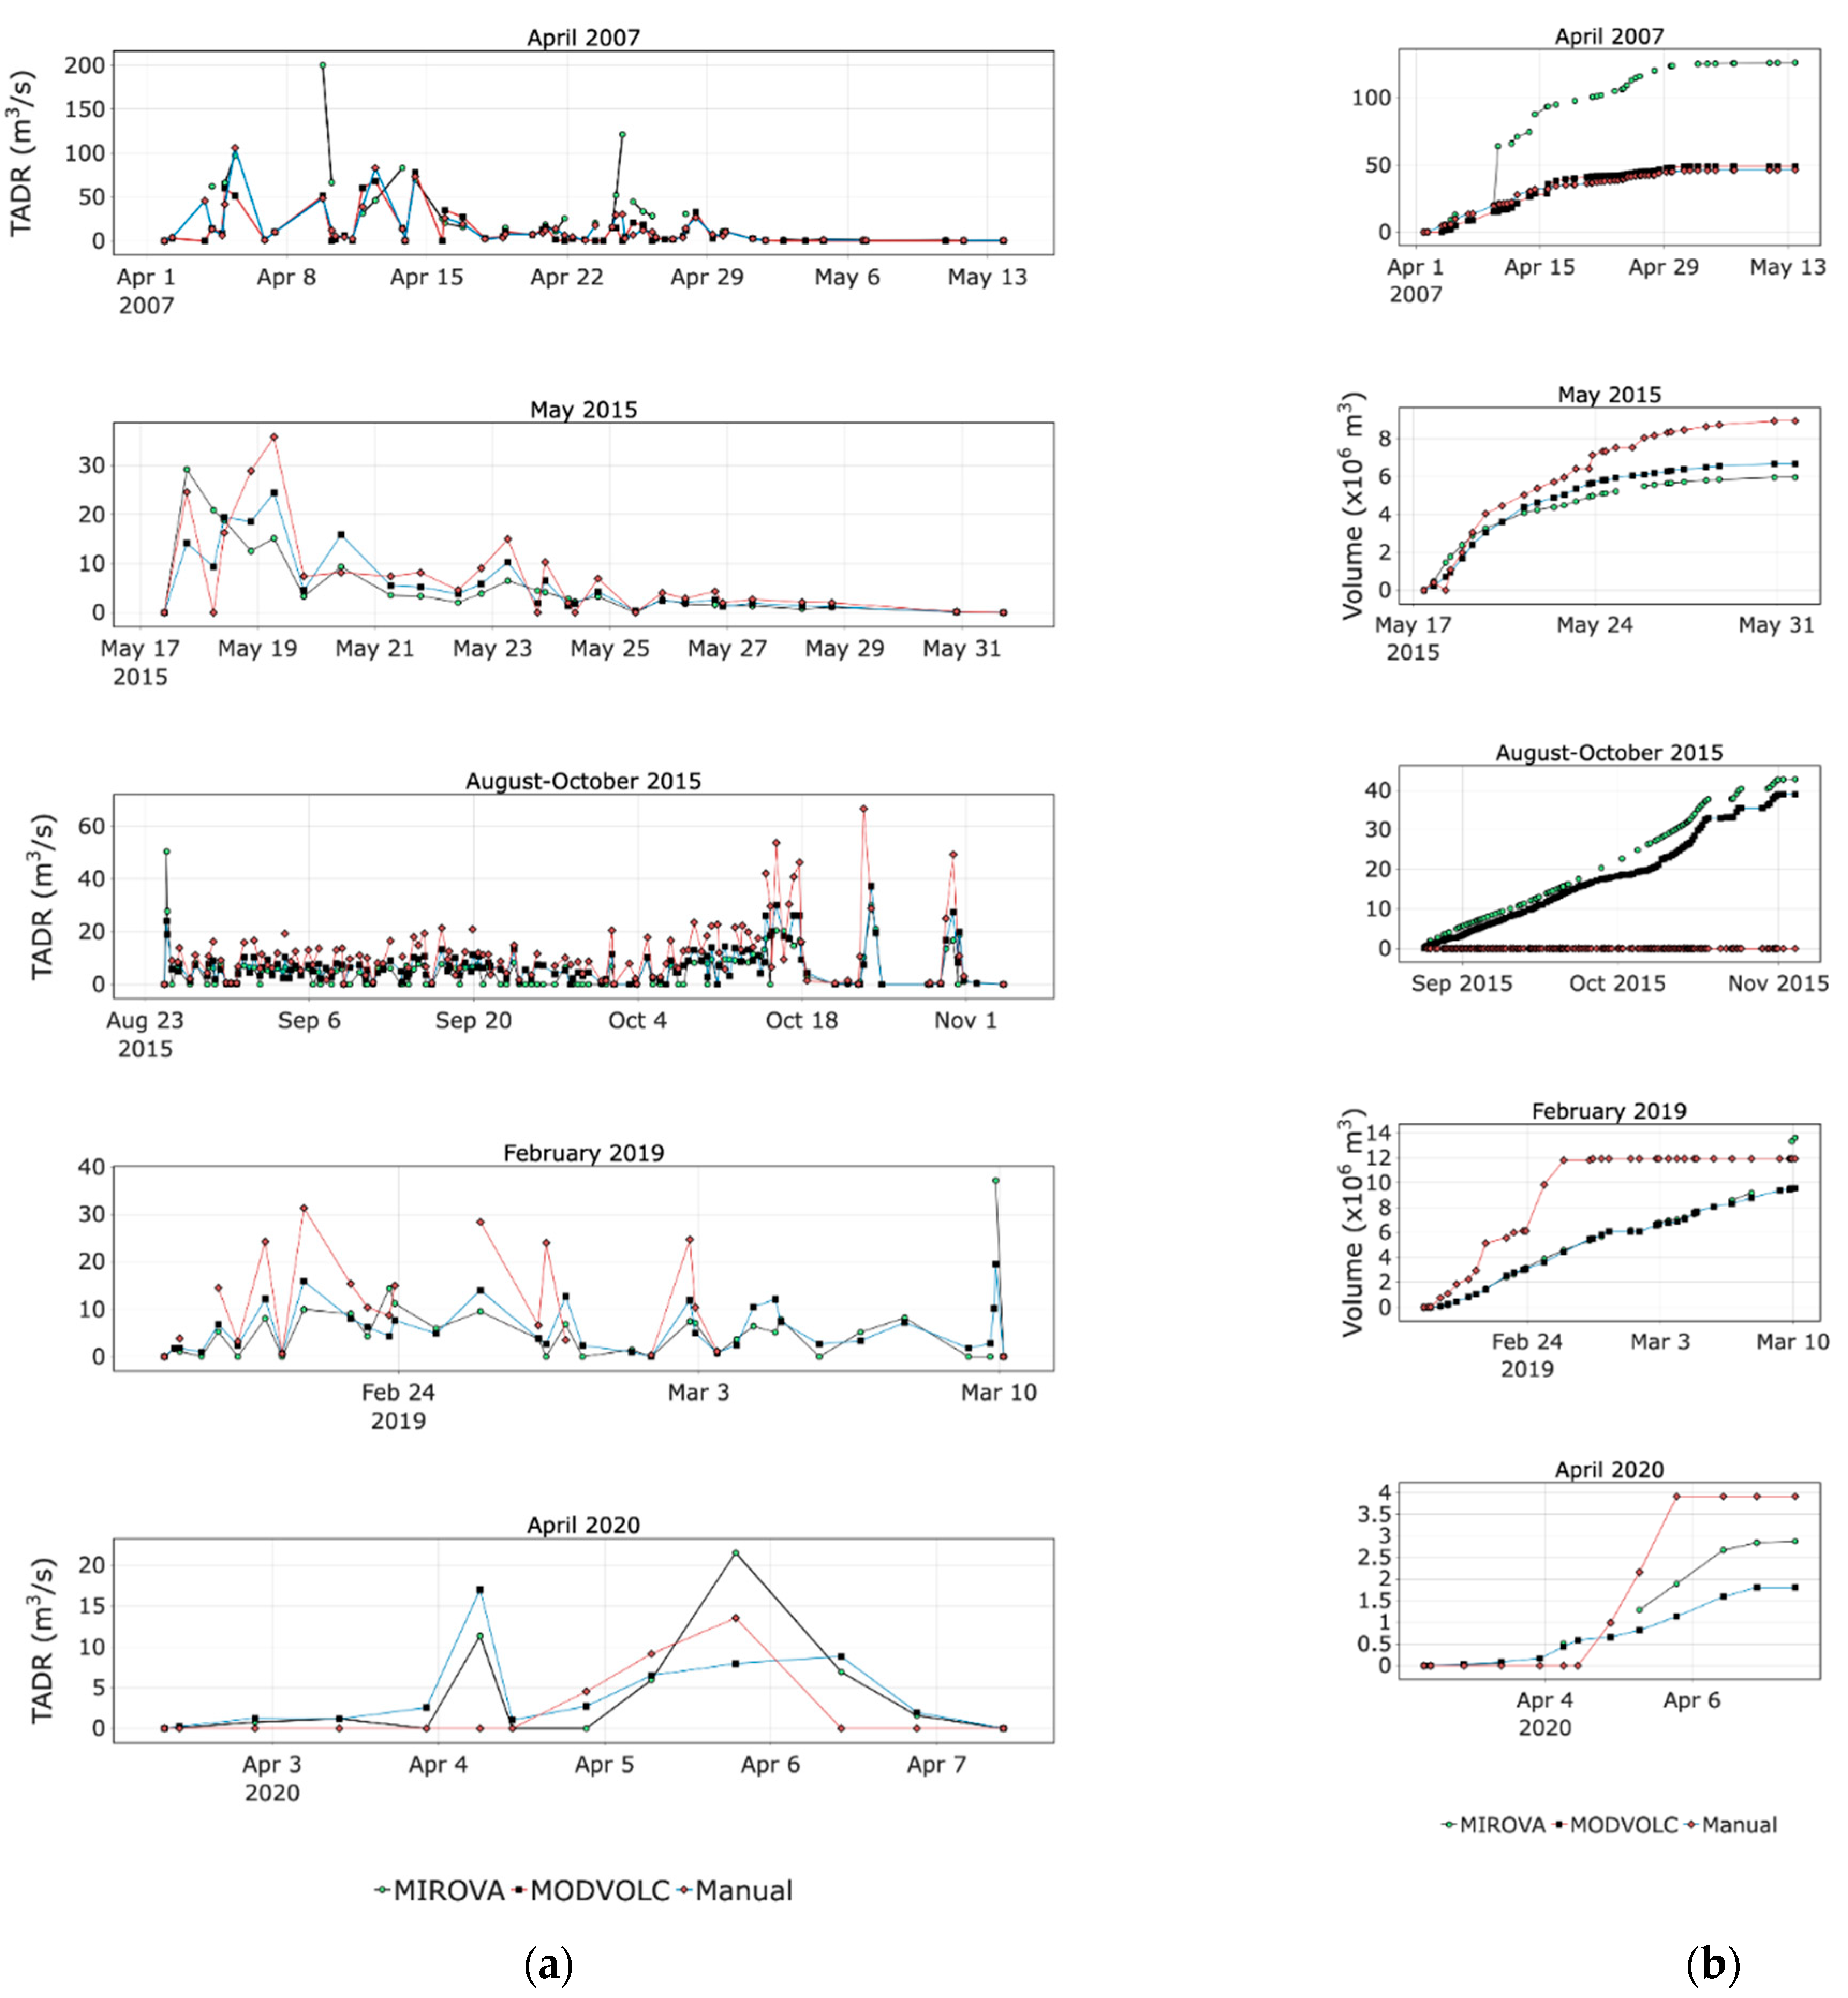
A comparison can be made between the lava volume obtained by the integrated MODIS-derived TADR with the volume measured in the field. For both discharge rates and volumes, the estimations correspond to those derived from the MIROVA and MODVOLC automatic systems and the Manual method. Note that the MIROVA and MODVOLC systems do not consider the atmospheric correction, contrary to the Manual approaches. To simplify, in the following sections, we only consider the first Manual approach (Equation (3)). All comparisons are shown in Figure 4.

4.2.1. April 2007

The April 2007 eruption produced a total of 185 × 106 m3 of lava (bulk volume) [21]. As the eruption was very intense, instruments were saturated, with there being between 3 and 10 saturated pixels per image (i.e., 17–60% of the anomalous pixels) so that minimum bounds on TADR were all that could be given. Figure 4a shows a peak on 5 April that was recorded by all methods. On the MIROVA trend, a peak of up to 200 m3 s–1 is obtained, which differs significantly from peak values obtained with the other methods (Manual: 48 m3 s–1, MODVOLC: 51 m3 s–1). Note that this value (200 m3 s–1) was manually fixed, and so was not derived from MIROVA data [27]. This peak occurred a few hours before the beginning of the collapse of the Dolomieu crater, which occurred during the night of 5 April and lasted several days. We note that the lava discharge rate was nearly zero on 6 April. A second peak was recorded after the next and smaller collapse of the Dolomieu crater occurring on 12 April. TADR estimation from the MODVOLC system (78 m3 s–1), MIROVA (70 m3 s–1), and the Manual method (73 m3 s–1) were in good agreement. The next few days were marked by a decline in the discharge rates, occasionally interrupted by minor fluctuations at the end of April (Figure 4a). Assuming that the bulk field volume is accurate, the manual and MODVOLC approaches largely underestimate the volume (Table 2). However, MIROVA gave a higher estimate closer to that expected by using the corrected dataset, i.e., using the peak in TADR on 6 April of 200 m3 s–1. Without considering this correction, MIROVA data provided a lava volume of 52.1 ± 26.0 × 10⁶ m3, which matched with MODVOLC and the Manual results. In Figure 5, one may observe that the time-series of seismically-derived TADR from Duputel and Rivera (2019) [34] fit with the MIROVA data despite their higher values (up to 600 m3 s–1) [34].

4.2.2. May 2015

This event was characterized by a TADR peak of 30 m3 s–1 at the beginning of the eruption on May 17–18 followed by an exponential decrease (Figure 4a). Despite good agreement between the approaches, we observe a significant discrepancy on May 17 (MODVOLC: 29 m3 s–1, MIROVA: 25 m3 s–1, Manual: 14 m3 s–1). In terms of cumulative volume, the high lava discharge rates from MODVOLC led to the highest cumulative volume (8.9 ×   10 6 m3). These were greater than MIROVA (6.0 ×   10 6 m3), but MIROVA matched the lava volume measured in the field (5.7 ×   10 6 m3) (Table 2, Figure 4b).

4.2.3. August–October 2015

Figure 4a shows a short-lived TADR peak of 50 m3 s–1 at the beginning of the eruption. The activity started on August 24 with high TADRs along a fissure system, but some differences resulted from the distinct methods (MIROVA: 50 m3 s–1, Manual: 24 m3 s–1). Following this initial peak, TADRs remained nearly constant (5–10 m3 s–1 up to 13–20 m3 s–1 for MODVOLC data) during the second phase of the eruption that lasted from September 11 until October 16. The last phase involved three final pulses each interrupted by 4 days of inactivity (Figure 4a). The first pulse on October 17 (MIROVA: 17 m3 s–1, Manual: 26 m3 s–1, MODVOLC: 46 m3 s–1) was followed by a second eruptive pulse on October 23 (MIROVA: 21 m3 s–1, Manual: 37 m3 s–1, MODVOLC: 67 m3 s–1) and a final one on October 30 (MIROVA: 17 m3 s–1, Manual: 27 m3 s–1, MODVOLC: 49 m3 s–1). Assuming that the field volume of 36.6 ×   10 6 m3 is correct, MIROVA and the first manual approach provided similar estimates (42.8 and 39.0 ×   10 6 m3, respectively; Table 2). However, the MODVOLC algorithm overestimated the lava volume emitted (73.3 × 10 6 m3) during the August–October eruption, an event that was particularly long-lived, as it lasted 65 days, resulting in a cumulative over-estimation.

4.2.4. February 2019

For this eruption, TADR was steady over time and below 10 m3 s–1, except at the end when TADR increased to 37 m3 s–1 according to MIROVA (Figure 4a). We identified a peak at the end of the eruption that was not as high in the manually processed data as in the MIROVA data (19 m3 s–1 versus 37 m3 s–1; Figure 4a). In general, MODVOLC-derived values were again much higher than all other methods, ranging from 9 to 31 m3 s–1. In addition, the MODVOLC system stopped detecting hot spots after March 2. Hence, no estimation of TADR could be made for the end of February, thus missing the intense terminal phase of the eruption. MIROVA and field estimates of erupted lava volumes were similar, at 13.6 ×   10 6 m3 and 14.5 ×   10 6 m3, respectively (Table 2). The MODVOLC and manual approaches provided cumulative volumes that were also similar, but lower, at 9.8 and 9.4 × 10 6 m3, respectively (Table 2).

4.2.5. April 2020

Only three detections were made by MODVOLC. This was due to the extremely cloudy conditions during this eruption, leading to poor detection rates. We saw two TADR peaks on 4 and 5 April (Figure 4a). Although MIROVA and manual values were generally similar (with a difference of 6 m3 s–1), MIROVA estimated a much higher TADR on 5 April (22 against 8 m3 s–1 for Manual). In terms of cumulative volume, we obtained a volume that was between 2 and 5 ×   10 6 m3 less than the bulk field volume (Table 2).

4.2.6. Summary of Thermally-Derived TADR Data

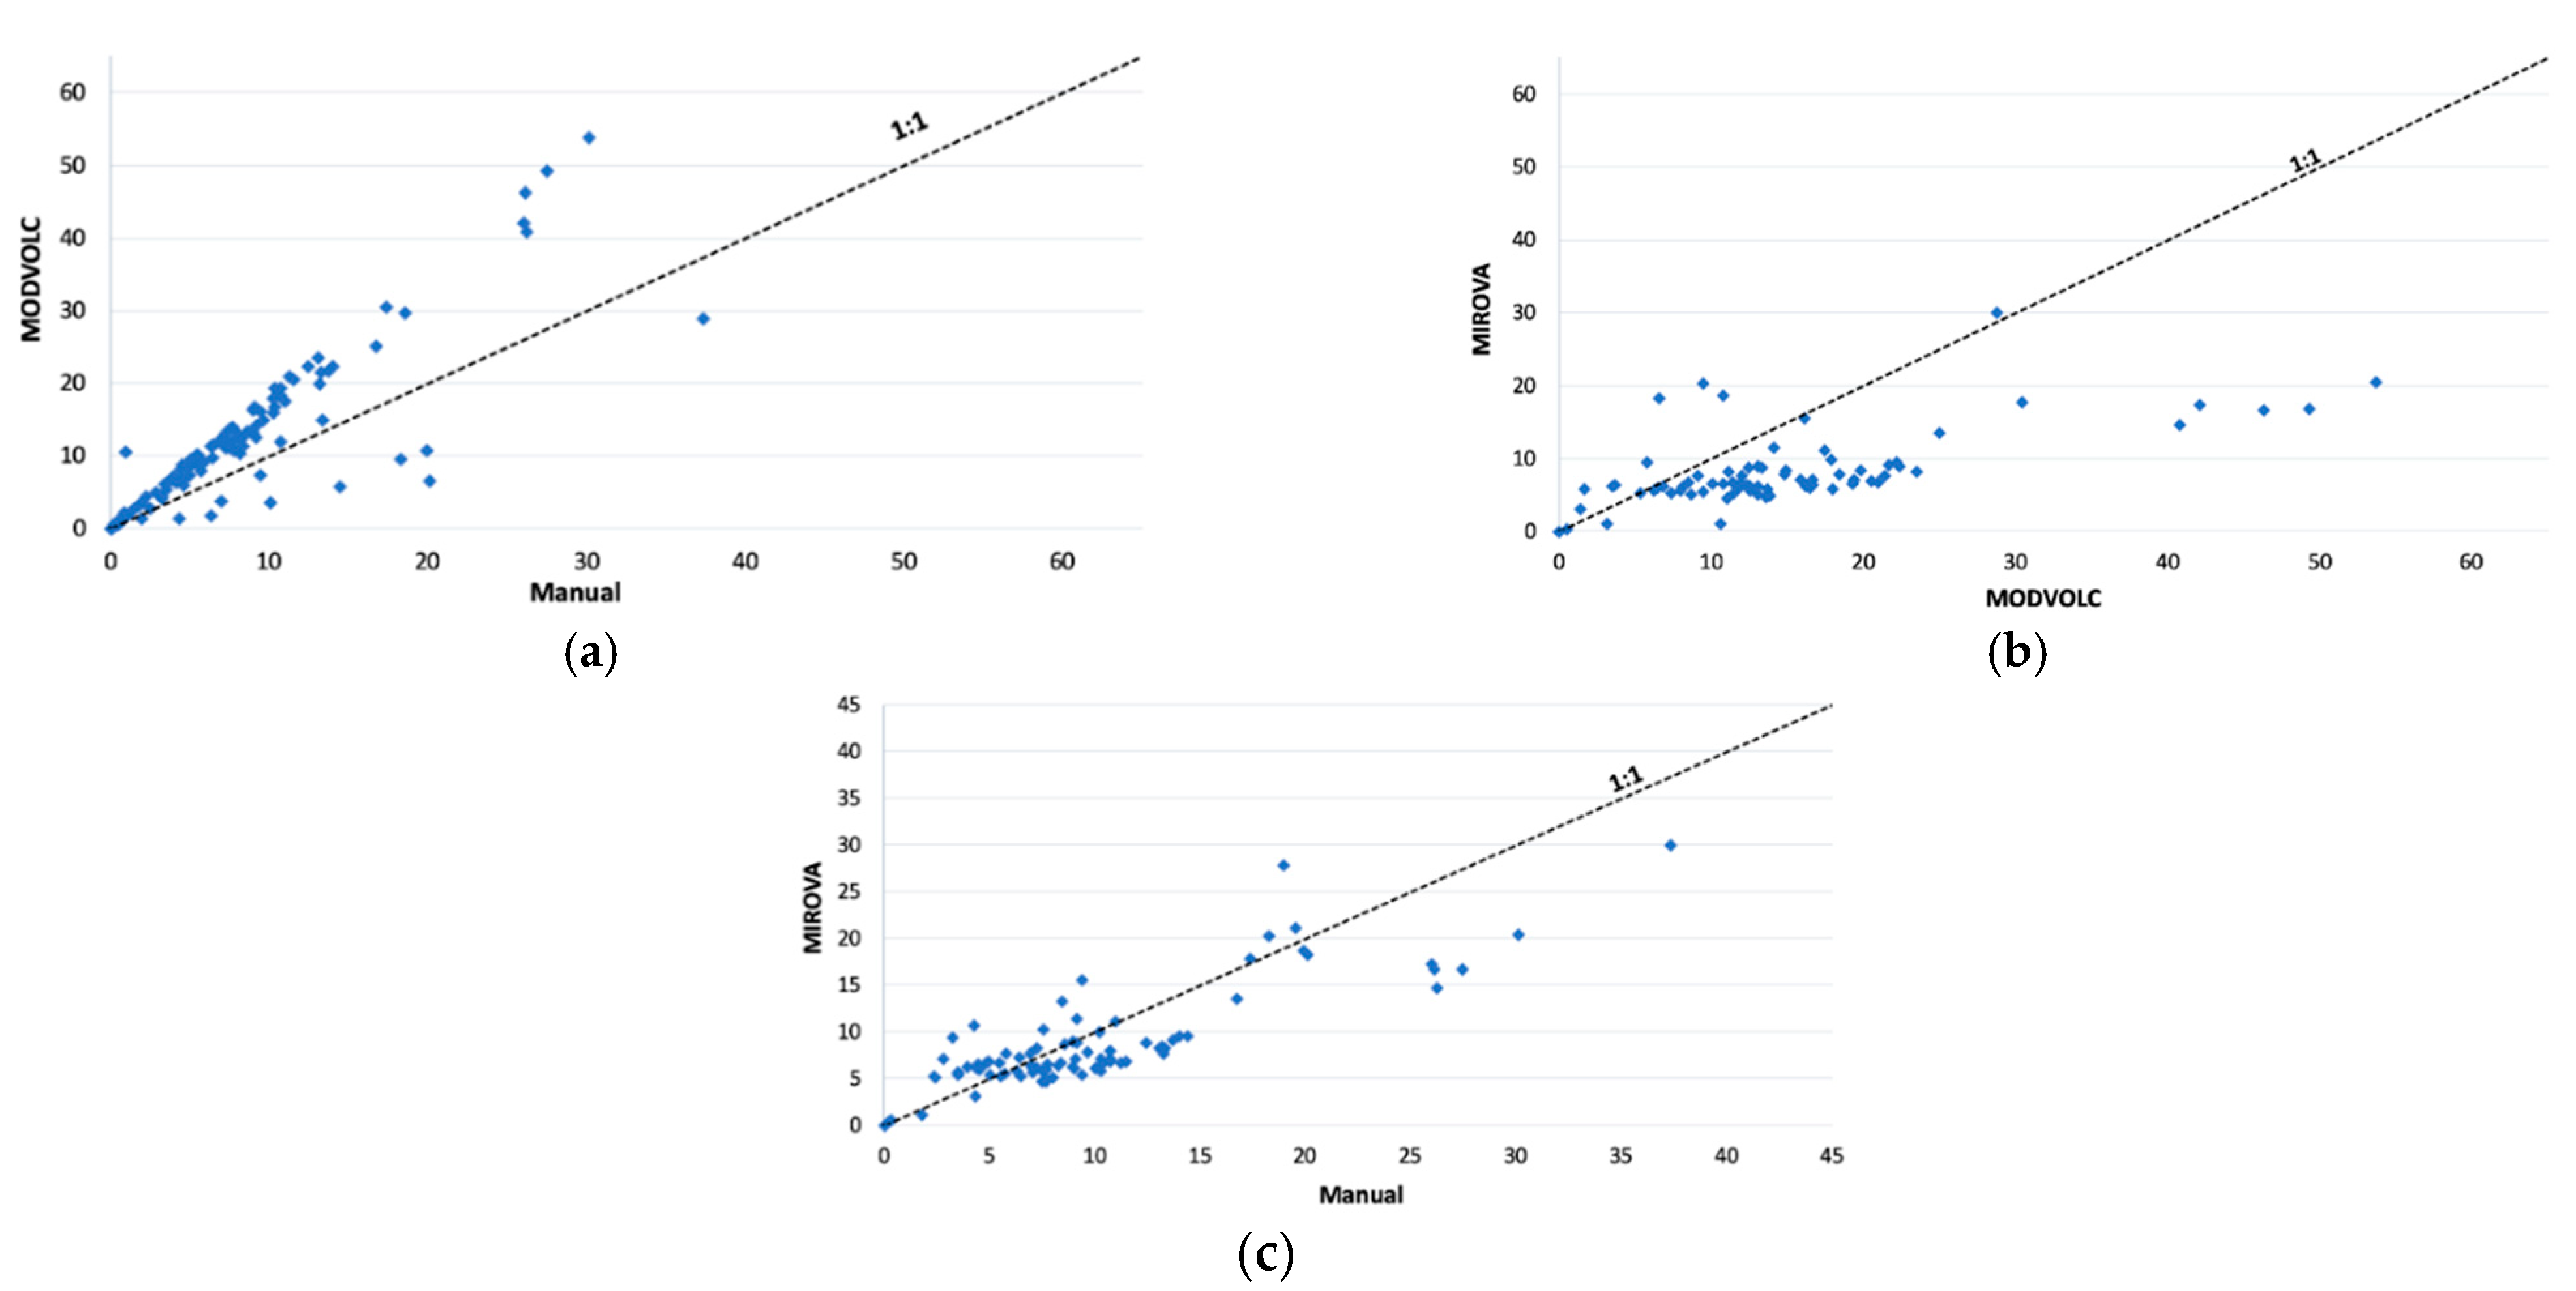
Although consistent in terms of trend, there was some divergence in the absolute values derived from each approach (Figure 4). Discrepancies arise from variable detection limits of the algorithms employed by the automatic systems, as well as saturation problems (Table 3), plus human error regarding the manual method. In addition, the MIROVA and MODVOLC systems do not correct for emissivity, atmospheric transmission, and surface reflection. Hence, the actual surface-leaving spectral radiances were underestimated by 25% due to atmospheric absorption. However, despite this, in general, MODVOLC seemed to overestimate TADR. Instead, we obtained a good correlation between MIROVA and Manual data (Figure 6).
By integrating TADR through time, all methods provided similar bulk cumulative lava volumes. However, assuming that the bulk field volumes are accurate, we find that in April 2020 and April 2007, all approaches significantly underestimated the erupted lava volumes (Table 2). This was due to bad weather and/or saturation of the sensor, which caused data loss and under-estimation. However, the total lava volumes for the year 2015 and February 2019 were in good agreement with the ground truth, except for those given by the MODVOLC system, which overestimated despite missing days (Table 3). We address the cause for this in the discussion.

4.3. Magmatic Sulfur Content Estimations

4.3.1. General Analysis

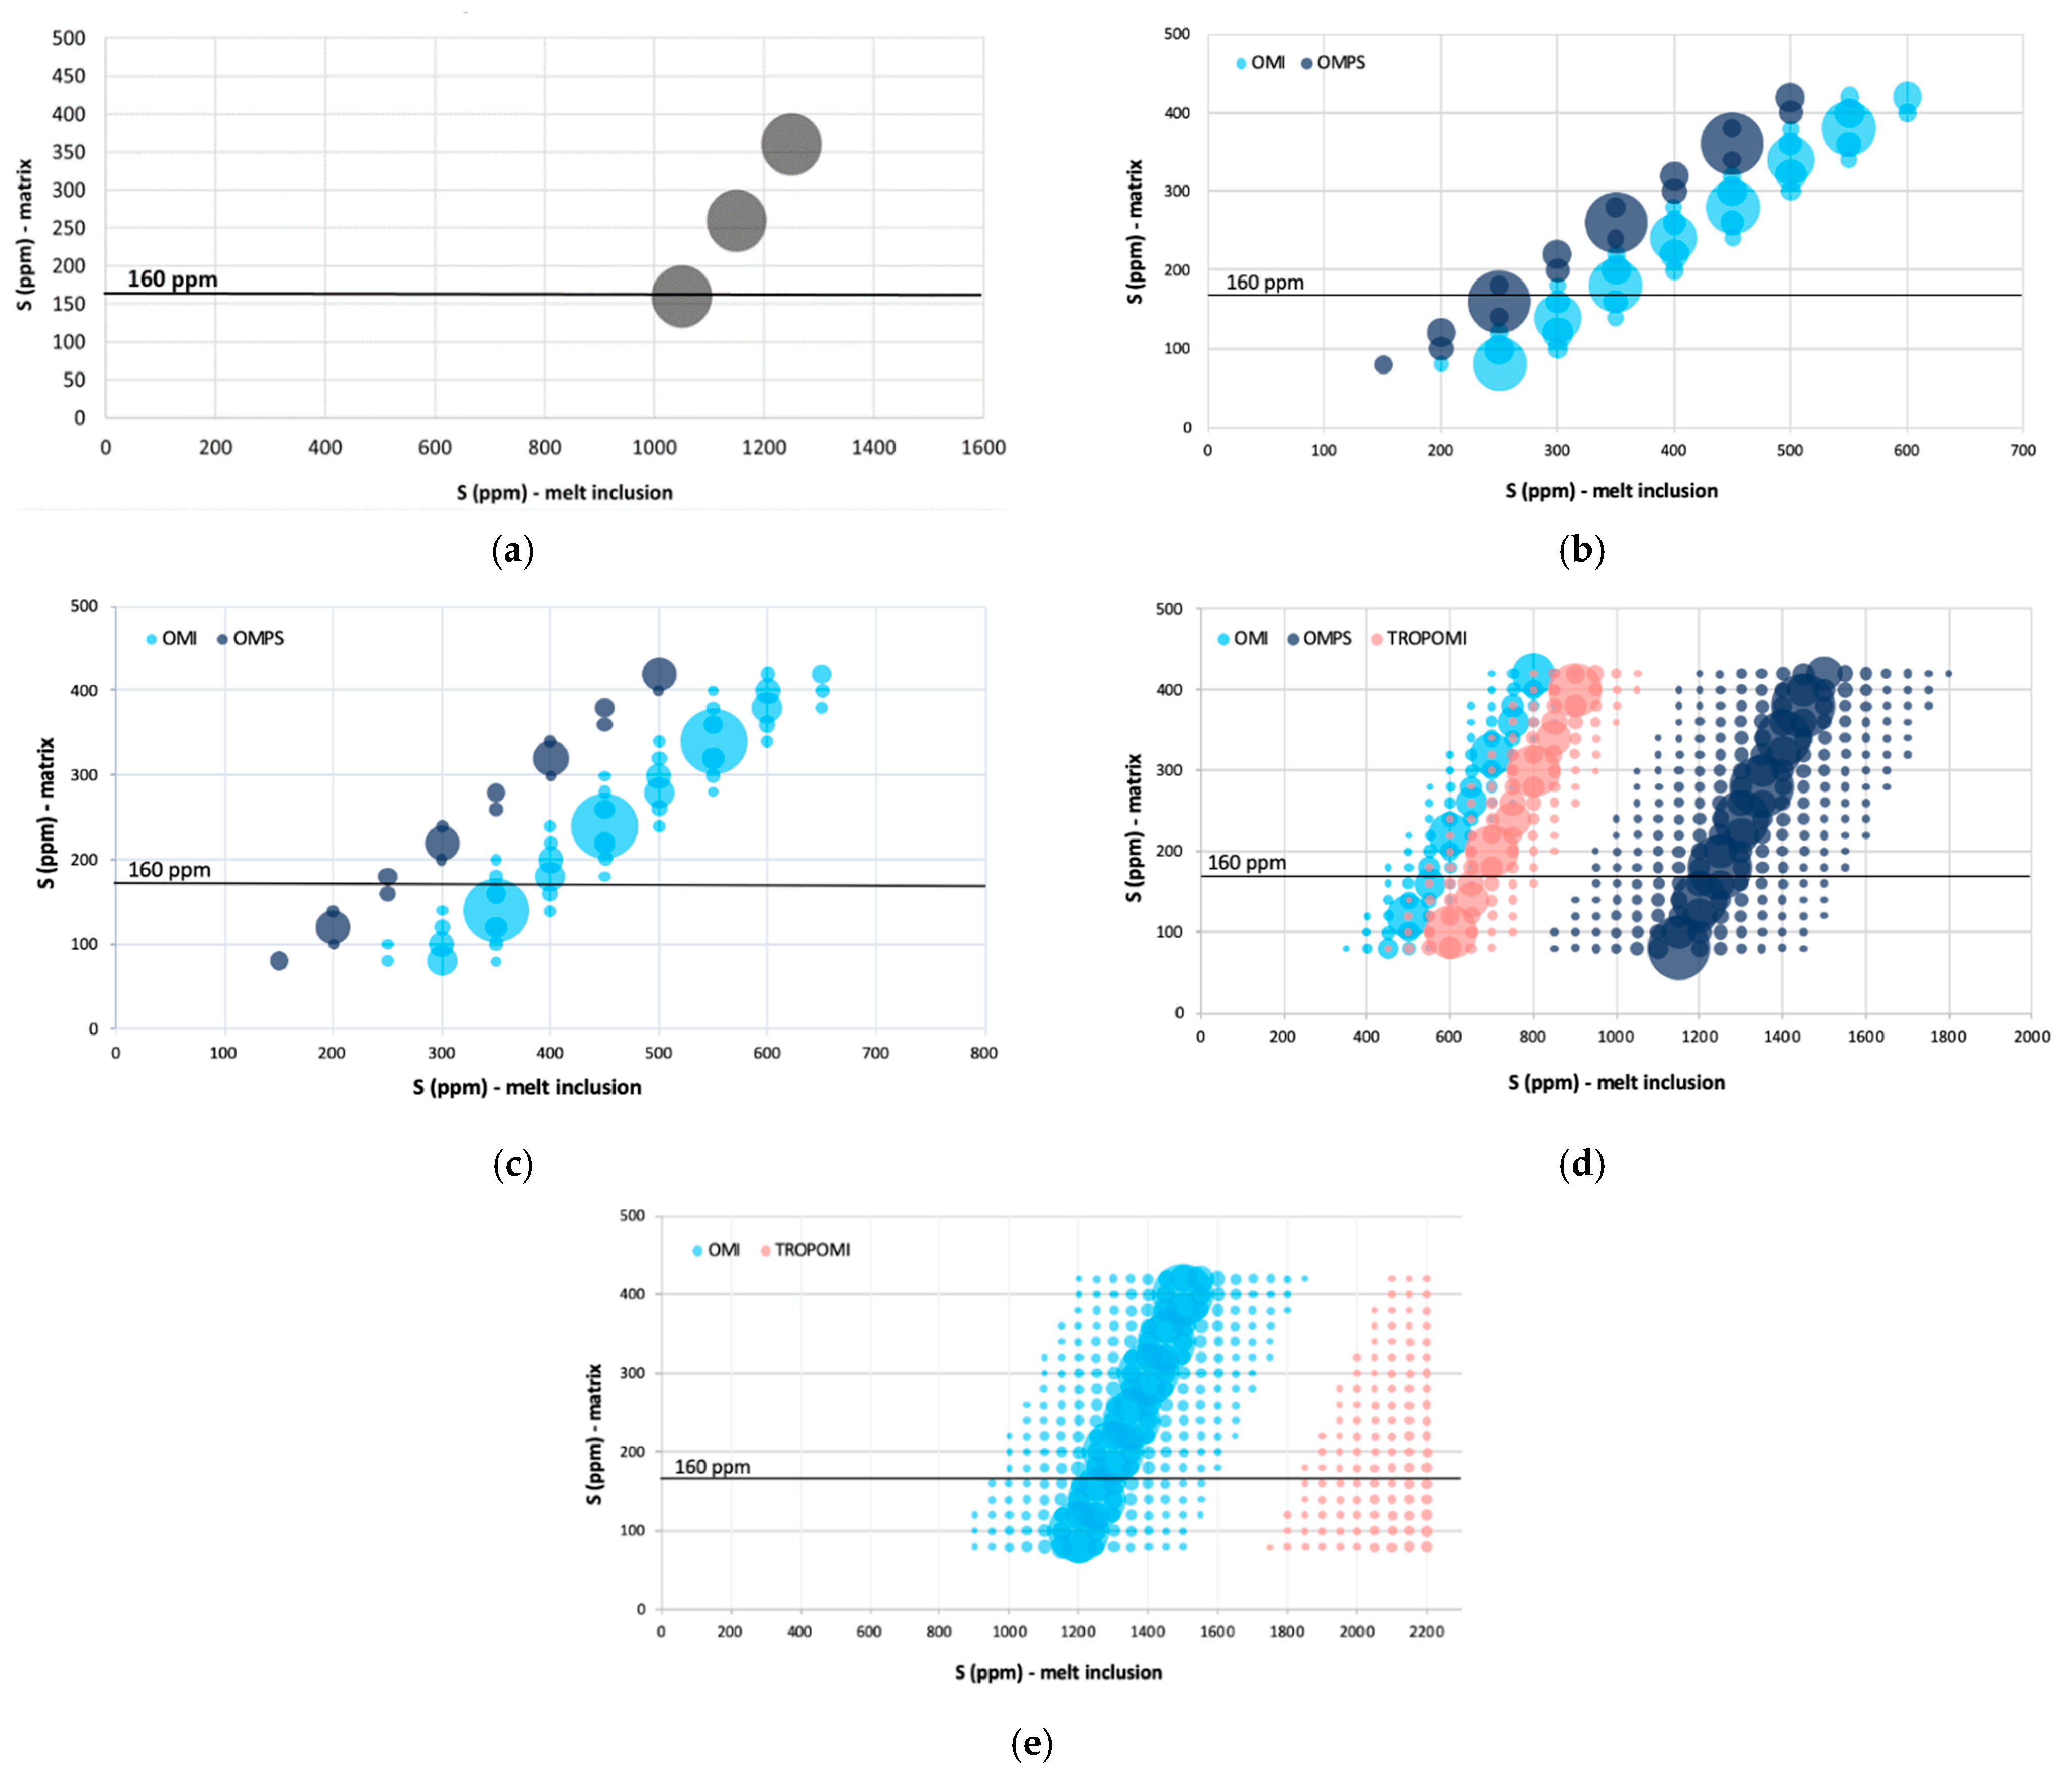
Figure 7 shows the retrieved magmatic sulfur contents using the reverse petrological approach and the erupted lava masses obtained from MODIS TIR satellite data.
For the April 2007 eruption, all SO2 masses estimated using the direct petrological method were lower than the 270 kt of SO2 detected by the OMI sensor, indicating a possible sulfur “excess” during this eruption [36,37]. The average pre-eruptive S content in melt inclusions obtained with the reverse petrological method by fixing c S m a t r i x at 160 ppm during high flux phases or 230 ppm during low degassing (corresponding to phases of intense fountains) was very high (up to 30,000 ppm). We expected much lower values (ca. 1050 ppm; [36]) according to the measured S within melt inclusions from petrological analysis (Figure 8). However, by using the time-series of seismically-derived TADR from Duputel and Rivera (2019) [34], the total SO2 mass estimated from the direct petrological approach was about 370 kt. Using the lava masses obtained from their data and the reverse petrological approach, we estimated an average S within melt inclusion between 1050 and 1250 ppm (Figure 7a), fully consistent with petrological analysis [36].
Given low pre-eruptive S contents of between 100 and 400 ppm, estimated SO2 emissions for the May 2015 eruption were consistent with an eruption largely fed by degassed magma. Both OMI and OMPS SO2 data imply ~200–500 ppm of sulfur in melt inclusions (Figure 7b). Similar values were obtained for the August–October 2015 eruption using OMPS data. OMI data yielded slightly higher values of ~300–650 ppm S (Figure 7c), but despite this slight difference, the estimated sulfur contents were in good agreement between the two sensors.
However, for the February 2019 eruption, the difference between the three satellite sensors was greater. Whereas TROPOMI and OMI indicated a similar range of magmatic sulfur content (300–800 ppm), OMPS gave a higher range (800 to 1600 ppm), suggesting that deep, undegassed magma [12,27,33] was also involved in this eruption (Figure 7d). The situation was similar for the April 2020 eruption, where TROPOMI data indicates around 2000 ppm S and OMI between 900 and 1600 ppm S (Figure 7e). Figure 7e does not show the OMPS results, as no magmatic sulfur content values matched the total mass of SO2 detected by the sensor. On 4 and 6 April, TROPOMI and OMPS measured 12.1 and 26.4 kt of SO2 (Figure A1), respectively, whereas OMI data gaps led to an underestimation of the total SO2 emissions during the eruption.

4.3.2. Temporal Variation of Sulfur Content

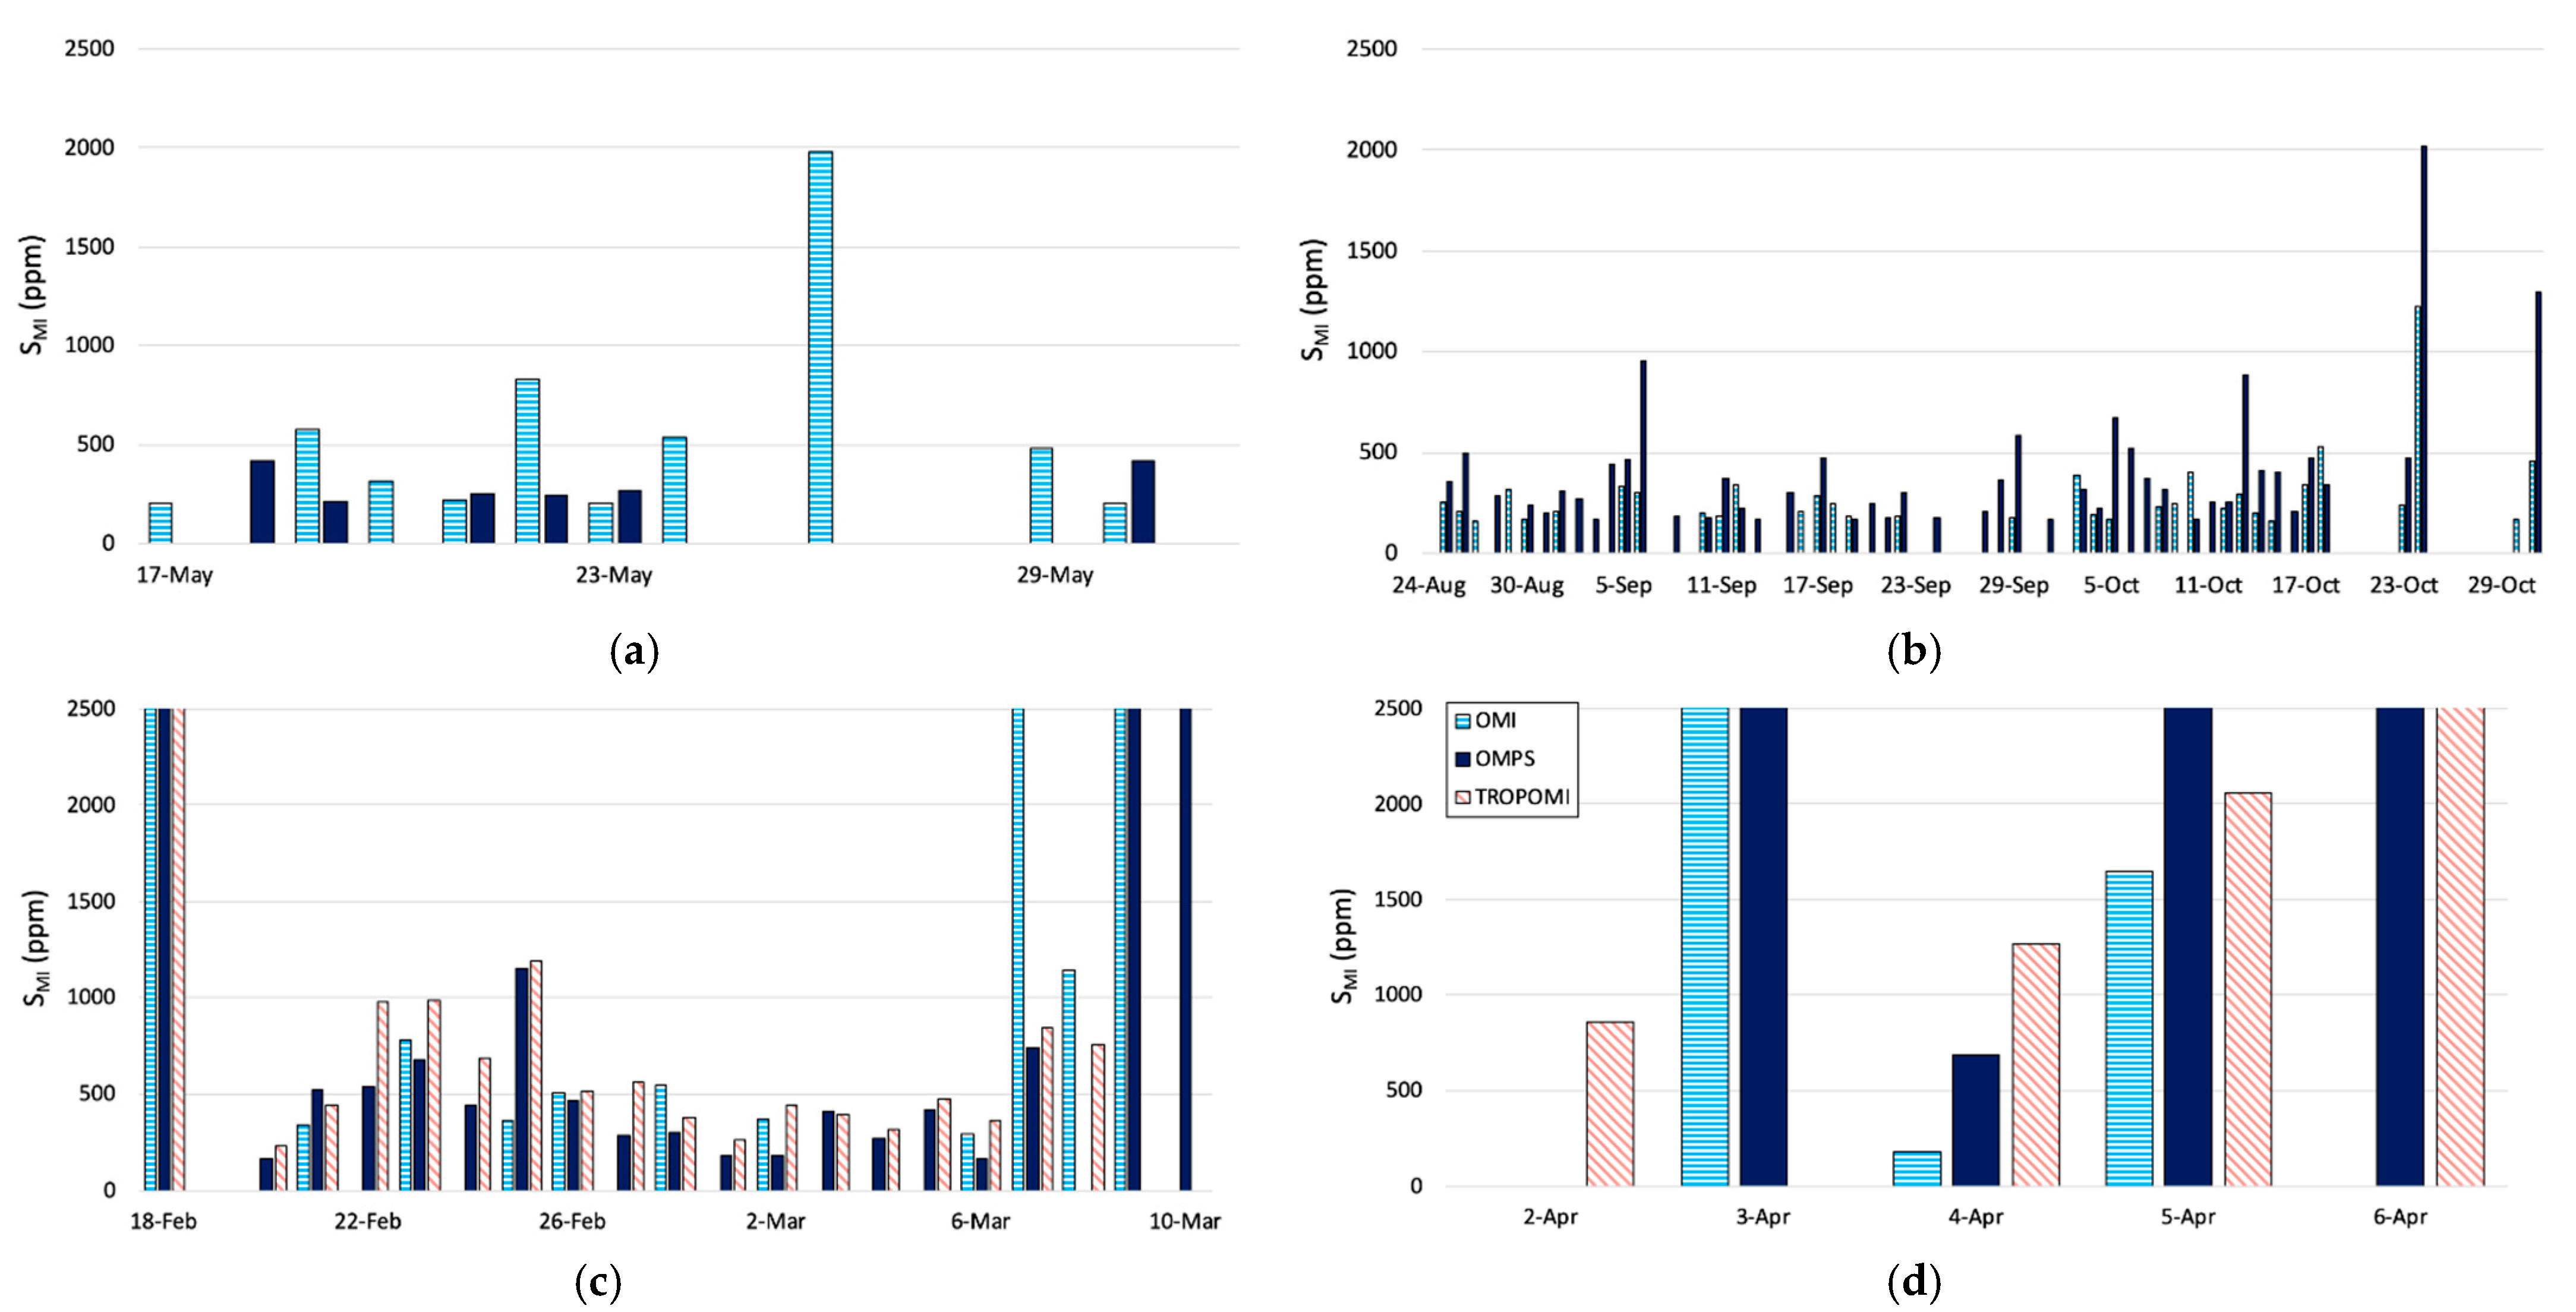
Figure 9 shows the daily pre-eruptive magmatic sulfur contents estimated on the basis of the reverse petrological approach using satellite-derived SO2 masses and by fixing the undegassed sulfur content in the eruptive products. The April 2007 eruption is not represented, as the values were greater than 30,000 ppm S (using the MIROVA lava volume), which is unrealistic. Note that this approach is dependent on the detection of SO2 by the UV sensors. Consequently, if a sensor detected no SO2, we underestimated the emitted SO2 and added an error to the estimated pre-eruptive sulfur content. Nevertheless, in general, we obtained time-series that were in good agreement with each other (Figure 9).
Results were still lower than the value of 1050 ppm S expected for the sea-level reservoir, which was in good agreement with the general view of involvement of variably degassed magmas in many recent eruptions [33] (Figure 9). For the February 2019 eruption, c S M I   was, on average, equal to 521 ±   285 ppm, which was obtained using OMI and TROPOMI data. However, OMPS data indicated a melt enriched in sulfur, which could be explained by the visible peak at the end of the eruption (Figure 9c). A similar observation could be made for the August–October 2015 eruption (Figure 9e). Despite an almost constant c S M I   value of 283 ±   191 ppm (according to OMI data), some peaks were observed, notably during the third and last phases of the eruption (16 October–2 November), suggesting the involvement of a deep undegassed melt.

4.4. Daily Volume Estimation from Sulfur Content

We also re-arranged Equation (8) to calculate the expected DRE lava volume using the measured daily SO2 emissions and fixing c S m a t r i x (160 ppm) and c S M I . The first approach was to fix c S M I   at 1050 ppm corresponding to the sea level magma reservoir. The second method used the c S M I above (Figure 9). Values higher than 2000 ppm were replaced by 1250 or 1600 ppm, as observed in the petrological analysis (Figure 8). In this case, the DRE field lava volume was used as a reference.

4.4.1. Fixed Sulfur Content within Melt Inclusions

By fixing c S M I at 1050 ppm, we generally obtained lower lava volumes than those derived from the field data for the two eruptions in 2015 (May 2015, Aug–Oct 2015) (Table 4). OMI-derived total lava volumes were, in general, lower relative to field data (Table 4). OMPS data overestimated the lava volume for the April 2020 and February 2019 eruptions but underestimated lava volumes for the eruptions in 2015. TROPOMI overestimated the field volume, being 8.4 ×   10 6 m3 and 3.3 ×   10 6 m3, respectively, (Table 4) for the April 2020 eruption. In addition, in February 2019 the field volume was slightly higher than our estimates (9.4 ×   10 6 m3 versus 6.3 ×   10 6 m3) (Table 4). Consequently, fixing the pre-eruptive sulfur content at 1050 ppm may be unreasonable, and a lower value may be more appropriate (see next section).

4.4.2. Variable Pre-Eruptive Sulfur Contents

As no realistic predictions for the sulfur content for the April 2007 eruption were obtained using the MIROVA data, this method could not be applied for this event.
Results showed similar daily lava volumes for April 2020 compared to the previous method (Figure 10a,b). For the February 2019 eruption, the cumulative volume derived using TROPOMI (11.6 ×   10 6 m3) and OMI (9.2 ×   10 6 m3) were in good agreement with field data (9.4 ×   10 6 m3). For the August–October 2015 eruption, OMI also provided a very similar cumulative volume to the field measurements (24.5 ×   10 6 m3 and 23.8 ×   10 6 m3, respectively). The total lava volume acquired based on OMPS SO2 emissions was higher (35.3 ×   10 6 m3). We note that the approach using fixed c S M I generally gave much lower values (Table 4, Figure 10a,b). Hence, the variation in the pre-eruptive sulfur content estimated above (Figure 9) appears valid, and fixing c S M I at 1050 ppm may be an unrealistic assumption leading to underestimated lava volumes. This is confirmed by looking at the similar estimated total lava volumes for the May 2015 eruption (Table 4). However, we caution that there were UV satellite data gaps during the May 2015 eruption, suggesting a small underestimation for this eruption, as no lava volume was calculated for those days.

5. Discussion

5.1. SO2 Flux Measurements from Space and from the Ground-Based NOVAC Network

Comparison between SO2 mass estimation from OMI/OMPS/TROPOMI and SO2 flux from NOVAC measurements illustrates the challenges of comparing satellite-derived masses with ground-based fluxes. The wind speed for the ground-based fluxes, and plume altitude for the satellites, adds significant uncertainty to the values. In addition the vents located on the eastern volcano flank (e.g., February 2019 and April 2020) may be hidden from the NOVAC field of view (Figure 1) when the plume is drifted seawards, hence some SO2 (or the entire plume) may not be observed by the instrument. Plume heights at Piton de la Fournaise range from 1000 m to 5000 m a.s.l. with an average between 3000 m and 3500 m a.s.l. Nevertheless, we find good agreement for the eruptions located within the range of wind directions covered by the NOVAC network (Figure 1 and Figure 3). Adjusting the location of the NOVAC stations and/or expanding the network would be one way to improve plume visibility. Based on our results, moving one or two of the three stations slightly to the east, or adding a fourth station on the east flank of Piton de la Fournaise would provide better coverage for future eruption vents in this area. On the other hand, the discrepancy between the UV satellite instruments may result from their different spatial resolution and measurement timing leading to either an under- or overestimation relative to NOVAC (Figure 3). Ground-based measurements of plume altitude could be used to reduce the uncertainty in satellite measurements that assume a fixed SO2 layer height.

5.2. Discharge of the Magmatic System

5.2.1. April 2007

The April 2007 eruption was characterized by particularly high TADRs and SO2 fluxes (Figure 4 and Figure A1). Assuming that the lava flow bulk field volume estimated at 185 ×   10 6 m3 by Derrien (2019) [21] is correct, then we see from Table 2 that the volume estimates based on MODIS thermal anomalies generally underestimate (by 32–73 %) the actual volume. As the eruption was particularly intense (peak TADR of 100 m3 s–1), MODIS sensor saturation likely resulted in under-estimated values, meaning that values are “minimum-bounds”. This is supported by hot spot temperatures of up to 780 °C [39] and the pixel saturation assessment of Figure 2. Indeed, 1 % coverage by surfaces at 780 °C in a 1 km2 pixel would have been sufficient to saturate Band 21, equivalent to a 9800 m2 hot spot. Moreover, some of the lava flows were tube-fed and entered the ocean [39]. Consequently, part of the thermal emission is missing. In addition the ash plume that formed during the peak phase (6–7 April) would have prevented the detection of the hot spots, or dampened the signal. To counter this effect, TADR estimations were increased by 30%. However, this still results in an underestimate. To square with the field-based measurements, the results of Table 2 shows that the adjustment factor needs to be 73%.
On the other hand, using SO2 emissions we found a larger DRE lava volume (369.8 ± 178.9 ×   10 6 m3) than that measured in the field (120.3 ×   10 6 m3), suggesting an S excess problem. This excess sulfur has been explained either by the contribution of an unerupted amount of deep S-rich magmas [13] or by release from the hydrothermal system. However, according to our results using seismically-derived TADR data [34], we estimated an average S within melt inclusion of between 1050 and 1250 ppm (Figure 7a), corresponding to petrological analysis [36]. Hence, we can conclude that no S excess was associated with this eruption and that suggestions of an excess arose from preliminary underestimates of erupted lava volume due to saturation issues. This paroxysmal eruption released a large amount of SO2 (Figure A1) due to the fast ascent of very deep magma from the crustal underplating depth [13,34]. This deep magma input would have pressurized the shallow reservoir and led to this type of intense activity, as suggested by Di Muro et al. (2014) [36]. Following Walker (1988) [40], that the summit caldera collapses were preceded by an increase in TADR suggests an enhancement in the drainage of the shallow system, leading to a passive form of caldera collapse. This behavior is observed at other basaltic shields that experience high effusion rate and/or voluminous eruptions (e.g., Kilauea (Hawaii [41,42])).

5.2.2. May 2015

This eruption started on May 17 and was characterized by high initial TADR (30 m3 s–1) followed by an exponential decay to 14 m3 s–1 (Figure 4). The same trend is evident in the SO2 emissions (Figure A1 and Figure 4a) and is typical of tapping of a pressurized source [43]. We also point out that this eruption has a similar TADR trend as the April 2007 eruption (Figure 5). Both eruptions show an exponential decay of TADR despite different eruptive processes. In fact, the May 2015 eruption was fed by a closed system, and that observed in the much larger 2007 eruption was fed by an open system. This poses the possibility of using TADR trends to constrain deep magma transfer (Figure 5). According to field measurements, the bulk volume erupted in May 2015 was 5.7 ×   10 6 m3. The total lava volume derived from MODIS data analysis is in good agreement except for the MODVOLC data, where we obtained a lava volume of 9.0 ± 2.7 ×   10 6 m3. Despite MODVOLC data gaps, this system overestimates the total lava erupted, which we assume is mostly due to the bow-tie effect (Figure 11). At high scan angles, Earth’s curvature cannot be neglected by the MODIS instrument, leading to scan-to-scan overlap so that hot spot radiances are counted twice [44].
Using OMI and OMPS SO2 data, the total DRE volume estimated using a fixed pre-eruptive S content c S M I of 1050 ppm underestimates the lava emitted giving ~0.6–1.1 ×   10 6 m3 (Table 4). However, using a lower c S M I of 430 ± 157 ppm yields volumes much closer to that measured in the field (3.5 ×   10 6 m3) (Figure 10b). Note that any volume underestimation may also be an artifact of the low temporal resolution of the UV sensors and/or an inaccurate assumption of SO2 plume altitude, leading to an unrepresentative time-series of SO2 emissions. According to the reverse petrological analysis, the pre-eruptive sulfur content of 430 ± 157 ppm may be slightly too low (Figure 8). Although pre-eruptive sulfur contents of 500 ppm are known, such cases are rare [33]. However, petrochemical studies of the evolved and highly crystallized 2014 magma have shown that part of the pre-eruptive S content can be locked in solid phases (sulphides) and not in the melt and that can further influence the amount of sulfur immediately available to the gas phase upon magma ascent and decompression [45].
We also note that the May 2015 eruption emitted a more evolved magma than usual [46]. In mid-April 2015, deep seismicity and an increase in CO2 discharge were recorded, suggesting the ascent of new mafic magma from depth into the shallow reservoir at 0.5–1.5 km below sea level [47]. Petrological studies show that magma cooling and degassing were effective since 2014 or earlier and that shallow seated May 2015 magmas were among the most evolved and lacked any evidence of interaction with hotter and deeper inputs [43]. No apparent mafic input is recorded in the sulfur content variation in Figure 9, suggesting that magma supplying the May 2015 eruption came from the upper part of the shallow plumbing system. This was extruded due to the arrival of new magma inside the plumbing system but without interacting with it. This could explain the low and nearly constant sulfur content implied by the reverse petrological approach. This is another common process at basaltic shields [48].

5.2.3. August–October 2015

The August–October 2015 eruption can be divided into three phases on the basis of TADR (Figure 4a). The first phase was marked by a high TADR (peak of 50 m3 s–1) and was followed by a rapid decline to a nearly constant TADR at 5 m3 s–1 in phase 2. Three short-lived pulses, each about two days long, characterized the last phase. The bulk lava volume erupted during this last 6-day long phase represented almost 50 % ( ~ 11 ×   10 6 m3) of the total emitted from August 24 to October 17 ( ~ 32 ×   10 6 m3). By integrating the TADR through time, the MIROVA and Manual methods yield equivalent total volumes. However, the MODVOLC system again overestimates the volume by ~40 ×   10 6 m3 (Table 2). As with the May 2015 eruption, we obtain an underestimation by 13 to 20 ×   10 6 m3 of the total DRE lava volume if we fix the pre-eruptive sulfur content at 1050 ppm (Table 4). Depending on the UV sensor, we obtained 3.9 ± 1.8 ×   10 6 m3 (OMI) and 10.5 ± 4.8 ×   10 6 m3 (OMPS) when we expect a total lava volume of 23.8 ×   10 6 m3 according to field measurements. Using the pre-eruptive sulfur content from the reverse petrological approach ( ±   466 ppm), DRE volume estimations are better (OMI: 24.5 ± 17.2 ×   10 6 m3). The OMPS dataset slightly overestimates (35.3 ± 24.7 ×   10 6 m3) the lava emitted, likely due to its lower spatial resolution. Figure 9 reveals a nearly constant c S M I of 200–700 ppm before an increase to 2000 ppm during the last phase. This may suggest an evolution from a degassed melt during the two first phases to a mafic gas-rich melt during the last stage of the event. Because of the involvement of highly degassed evolved melts, the initial phase of strong lava flux does not correspond to the most intense phase of gas emissions (Figure 4 and Figure A1).
This is consistent with Sundermeyer et al. (2019) [46], who modelled diffusion times within olivine crystals. Sundermeyer et al. (2019) [46] noted a progressive increase of the MgO magma content during the third phase, which was accompanied by increased CO2 in summit fumarole emissions [12]. In addition, the bulk composition of erupted products indicate that recharging magmas dominated evolved melts during the final stage, probably because the shallow reservoir had been almost emptied by the three previous eruptions in 2015. That could be explained by the “Stromboli effect” [12]. According to Coppola et al. (2017), after emptying the shallow part of the plumbing system, the deeper part arrives at the surface producing an increase in TADR and SO2 emissions [12].

5.2.4. February 2019

The trends in TADR and SO2 emissions (Figure 4) show this eruption to be characterized by a terminal burst. This was related to the opening of a new E–W trending fissure on 7 March, 17 days after the onset of the eruption and 3 days before the end. TADR was estimated at ~10 m3 s–1 before this event increasing to 19–37 m3 s–1 on 9–10 March (Figure 4a). A peak in SO2 emissions is observable with OMI (4.9 kt) and OMPS (19.2 kt) on 9 March, coinciding with the TADR increase (Figure A1). According to the bulk field data, the total lava volume emitted during this event was around 14.5 ×   10 6 m3. The MIROVA dataset provides a similar value (Table 2). Despite the absence of hot spots after 3 March, missing the intense surface activity at the end of the eruption, MODVOLC also gives a reasonable cumulative lava volume estimate (11.2 ×   10 6 m3), probably due to the bow-tie effect [44]. On the other hand, the estimate from manual MODIS processing is lower (9.5 ×   10 6 m3), meaning that the conversion coefficients of Equation (5) need to be slightly adjusted for this style of activity.
Figure 10 shows two different trends in cumulative volume acquired from the reverse petrological approach. Using a fixed c S M I , we observe lower DRE lava volume estimations. However, by varying the pre-eruptive sulfur content, we obtain cumulative lava volumes closer to the field-based measurements. This suggests that a relatively constant c S M I of 528 ± 284 ppm during the eruption is reasonable. As for the 2015 eruptions, this value would be consistent with a degassed differentiated melt coming from the shallow reservoir. However, we observe an increase in apparent c S M I   at the end of the eruption, corresponding to the increase in TADR and SO2 emissions. This may suggest that the fissure eruption was fed by a volatile-rich, less evolved melt: formation of a new dyke or emptying of the shallow reservoir allowing deep undegassed magma to erupt as in the third phase of the August–October 2015 eruption, as suggested by Coppola et al. (2017) [12].

5.2.5. April 2020

The 2–6 April 2020 eruption occurred close to the site of the February 2019 eruption. Weak ground deformation and a low number of seismic events suggest that the pathway for magma ascent was already open following the 2019 eruption [35]. On 4 April, seismicity increased until 6 April, when the eruption stopped abruptly. During this period, large quantities of Pele’s hair were emitted [35], indicating a unusual highly explosive event for Piton de la Fournaise feeding high fountains and associated with strong volcanic degassing. This is supported by the total mass of SO2 detected during 4–6 April by TROPOMI, OMPS, and OMI (17.32 kt, 36.67 kt, and 4.12 kt, respectively). An OMI data gap on 6 April during the highest SO2 emissions (Figure A1) explains the low OMI value. According to Peltier et al. (2020) [35], the bulk lava volume ranges from 6–10 ×   10 6 m3. MODIS image processing yields a bulk volume of 2–4 ×   10 6 m3 with a ~35% error (Table 2). Cloud cover significantly compromised the availability of usable (cloud-free) images, indicating that caution should be used when using satellite-derived data, which should always be cloud-screened to check for cloud-cover induced trends and drop-outs [49].
On the other hand, the DRE lava volumes estimated using the reverse petrological approach are higher (Table 4). The cause of the high bias in the OMPS-derived volume (nearly 20 ×   10 6 m3) is unclear and requires further investigation. In addition, the results indicate that fixing c S M I at 1050 ppm is a reasonable assumption for this eruption. According to the petrological data ([36]; Figure 8), a sulfur content of 1050 ppm represents, on average, the sea level magma reservoir of Piton de la Fournaise, suggesting that the April 2020 eruption was supplied by this main reservoir. However, Figure 9 also shows an increase in pre-eruptive sulfur content, probably resulting from deeper mafic inputs. The continuous increase in soil CO2 fluxes and syn-eruptive seismicity supports the idea of a deep magma influx into the sea level reservoir [35] after initial emptying.

6. Conclusions

Multiple datasets were acquired for five eruptions at Piton de la Fournaise, La Réunion. Analysis of the temporal evolution of TADR, combined with the associated SO2 emissions and inferred pre-eruptive magmatic sulfur content, reveals that Piton de la Fournaise eruptions may follow several distinct trends, including classic exponential decay (April 2007, May 2015) and terminal burst (August–October 2015, February 2019 and April 2020). In addition, our study confirms no evidence of volatile excess associated with the eruptions considered, which we conclude were mostly fed by shallow degassed magma; instead, we identify a volatile deficit in most cases.
Manual processing of MODIS data validates the efficiency of hot spot detection and TADR-derivation by the MIROVA system during the effusive eruptions at Piton de la Fournaise, meaning that the conversion coefficient in Equation (5) is valid. In contrast, we find that the MODVOLC system often overestimates TADR and also the total DRE erupted volume. This is unexpected given that the MODVOLC system often fails to detect hot spots, which should lead to underestimation of TADRs and lava volumes. This is particularly apparent for the April 2020 eruption. For this case, despite having only three measurements (compared to 11 for MIROVA and manual processing), MODVOLC provides the highest DRE lava volume estimates, which is likely due to double counting resulting from the MODIS bow-tie effect. Nevertheless, lava erupted during bad weather is significantly underestimated by all the approaches compared to the field measurements. Underestimation of lava volume also occurred during the paroxysmal eruption in April 2007 due to widespread saturation of the MODIS TIR channels (Table 2).
Using the reverse petrological method and the erupted lava masses obtained from MODIS data, we derived time-series of pre-eruptive sulfur contents, which were compared with sulfur concentrations measured in melt inclusions. Some results show lower values than expected from typical undegassed magmas. This could be explained by the involvement of shallow seated, evolved, and partly degassed magma in the eruptions. On the other hand, increased TADR and SO2 emissions at the end of the February 2019 and August–October 2015 eruptions (terminal bursts) suggest an increase in pre-eruptive sulfur content. This may indicate replenishment of the shallow magma reservoir by deeper, volatile-rich mafic inputs. In addition, total DRE lava volumes estimated using the SO2 emissions detected by OMI, OMPS, and TROPOMI are in good agreement with ground-truth. Hence, using the SO2 emissions and pre-eruptive sulfur contents could be a viable alternative to estimate bulk lava volumes during bad weather, when the satellite-derived TADRs may be compromised. However, we also recognize that during very bad weather conditions when both thermal anomalies and SO2 plumes are partially or wholly undetectable, neither satellite-based technique (IR or UV) may provide accurate results.
The analysis of multiple datasets for a sequence of effusive eruptions from a single magmatic system at Piton de la Fournaise allowed the identification of two groups of eruptive behavior. The first group is characterized by a strong initial peak in TADR and SO2 emissions before an exponential decrease for the classic “waxing–waning” trend for effusive eruptions defined by Wadge (1981) [43]. Note that the intensity of the SO2 peak will depend on the degree of pre-eruptive degassing of the magma. This trend is represented by two eruptions driven by different eruptive processes (April 2007: piston-collapse [34] or deep input [33] or a combination of both; May 2015: mostly volatile exsolution). Hence, it would be interesting to consider in detail the different sources of overpressure leading to this eruptive behavior. The second group (the August–October 2015, February 2019 and April 2020 eruptions) is characterized by an intense and explosive terminal phase. For these cases, we show that the late increase in TADR (terminal burst) is most likely related to the arrival of new, deep undegassed magma causing an increase in gas emissions (e.g., enrichment in CO2 within the summit fumaroles, soil, and SO2 emissions). However, the driving process for this type of behavior remains unclear and is yet to be clearly identified.
Based on this work, we suggest three improvements to aid with the remote sensing-based monitoring of Piton de la Fournaise and some potential areas of future research:
  • The addition of another NOVAC DOAS station on the east flank of Piton de la Fournaise will allow efficient surveys of future vents in this area. In addition, a more extended comparison between the satellite SO2 masses and the ground-based SO2 fluxes could allow cross-validation of both methods, depending on measurement conditions. A combination of both would lead to better results.
  • This study demonstrates that the MODVOLC did not detect a few hot spots in addition to overestimating the TADR and hence the total lava volume. Consequently, MODVOLC data should be used with caution when used for TADR conversion. However, MIROVA appears well calibrated to produce reliable TADR for Piton de la Fournaise.
  • In addition, depending on the type of activity (e.g., purely effusive, fountains, etc.), the residual sulfur content in the matrix can vary from 50 ppm up to 230 ppm. Hence, our use of a fixed value of 160 ppm for the development of time-series of pre-eruptive sulfur contents is a significant assumption. Future work may select the optimal value according to the style of activity.
Finally, we also suggest further analysis of ground deformation and seismicity datasets or use of Bayesian inversion methods to model the source of deformation during magma migration at Piton de la Fournaise [50]. These data could improve our understanding of the different eruptive trends observed in this study.

Author Contributions

Conceptualization, A.J.L.H. and S.C.; methodology, P.V., A.J.L.H., S.C., A.D.M. and S.A.; validation, A.J.L.H., S.C. and L.G.; formal analysis, P.V., A.J.L.H. and S.C.; investigation, P.V., A.J.L.H. and S.C.; resources, S.A.; data curation, P.V.; writing—original draft preparation, P.V.; writing—review and editing, S.A., D.C. and A.D.M.; visualization, P.V.; supervision, A.J.L.H. and S.C.; project administration, A.J.L.H. and S.C. All authors have read and agreed to the published version of the manuscript.

Funding

S.A. is thankful for support from the Swedish National Space Agency, grant Dr. 149/18. S.C. acknowledges NASA support from the Aura Science Team (grants 80NSSC17K0240 and 80NSSC20K0983) and the Science of Terra, Aqua and Suomi/NPP program (grant 80NSSC18K0688). This is ANR-LAVA publication number 21, and ClerVolc publication number 519.

Data Availability Statement

The data that support the findings of this study are available from the authors upon reasonable request.

Acknowledgments

P.V. thanks M.O. Chevrel for her help in the preparation of Figure 1, and Z.D. for sharing the data on the magma output rate estimated from the seismicity in Figure 4. The authors thank also A. Peltier and N. Villeneuve for the discussion about the field lava volume. We acknowledged the MODIS Alert Team (http://modis.higp.hawaii.edu/ (last access: 1 November 2021)) and the National Aeronautics and Space Administration (https://so2.gsfc.nasa.gov/ (last access: 1 November 2021)) for providing the basis of this work. MODIS level 1 products were obtained from NASA (http://ladsweb.nascom.nasa.gov/ (last access: 10 January 2021)), and the petrological data from DynVolc (http://wwwobs.univ-bpclermont.fr/SO/televolc/dynvolc/ (last access: 14 June 2021)). The authors also want to thank the reviewers for their constructive comments that improved the first version of this paper.

Conflicts of Interest

The authors declare no conflict of interest.

Appendix A

Table A1. Summary of the main features of the Ozone Monitoring Instrument (OMI), Ozone Mapping and Profiler Suite (OMPS), and Tropospheric Monitoring Instrument (TROPOMI) instruments used in this study. The nadir spatial resolution corresponds to the area of a single pixel.
InstrumentNadir Spatial
Resolution
Launch YearSpectral RangeOverpass Time
(Ascending Node)
OMI 13   × 24 km22004264–383 nm
(UV)
~13:45
OMPS 50   × 50 km22011300–380 nm
(UV)
~13:30
TROPOMI 7   × 3.5 km22017310–405 nm
(UV)
~13:30

Appendix B

Figure A1. Sulfur dioxide emissions at Piton de la Fournaise during the eruptions of interest recorded by the Ozone Monitoring Instrument (OMI), the Ozone Mapping and Profiler Suite (OMPS), and the Tropospheric Monitoring Instrument (TROPOMI). (a) April 2007; (b) May 2015; (c) August–October 2015; (d) February 2019; (e) April 2020.
Remotesensing 14 00323 g0a1aRemotesensing 14 00323 g0a1b

References

  1. Peltier, A.; Bachèlery, P.; Staudacher, T. Magma transport and storage at Piton de La Fournaise (La Réunion) between 1972 and 2007: A review of geophysical and geochemical data. J. Volcanol. Geotherm. Res. 2009, 184, 93–108. [Google Scholar] [CrossRef]
  2. Veefkind, J.P.; Aben, I.; McMullan, K.; Förster, H.; de Vries, J.; Otter, G.; Levelt, P.F.; Claas, J.; Eskes, H.J.; De Haan, J.F.; et al. TROPOMI on the ESA Sentinel-5 Precursor: A GMES mission for global observations of the atmospheric composition for climate, air quality and ozone layer applications. Remote Sens. Environ. 2012, 120, 70–83. [Google Scholar] [CrossRef]
  3. Flynn, L.; Long, C.; Wu, X.; Evans, R.; Beck, C.T.; Petropavlovskikh, I.; McConville, G.; Yu, W.; Zhang, Z.; Niu, J.; et al. Performance of the Ozone Mapping and Profiler Suite (OMPS) products. J. Geophys. Res. Atmos. 2014, 119, 6181–6195. [Google Scholar] [CrossRef]
  4. Wright, R.; Flynn, L.; Garbeil, H.; Harris, A.; Pilger, E. Automated volcanic eruption detection using MODIS. Remote Sens. Environ. 2002, 82, 135–155. [Google Scholar] [CrossRef] [Green Version]
  5. Hook, S.J.; Myers, J.J.; Thome, K.J.; Fitzgerald, M.; Kahle, A.B. The MODIS/ASTER airborne simulator (MASTER)—A new instrument for earth science studies. Remote Sens. Environ. 2001, 76, 93–102. [Google Scholar] [CrossRef]
  6. Coppola, D.; Laiolo, M.; Cigolini, C.; Donne, D.D.; Ripepe, M. Enhanced volcanic hot-spot detection using MODIS IR data: Results from the MIROVA system. Geol. Soc. Lond. Spec. Publ. 2016, 426, 181–205. [Google Scholar] [CrossRef]
  7. Theys, N.; De Smedt, I.; Yu, H.; Danckaert, T.; van Gent, J.; Hörmann, C.; Van Roozendael, M.; Hedelt, P.; Bauer, H.; Romahn, F.; et al. Sulfur dioxide retrievals from TROPOMI onboard Sentinel-5 Precursor: Algorithm theoretical basis. Atmos. Meas. Tech. 2017, 10, 119–153. [Google Scholar] [CrossRef] [Green Version]
  8. Li, C.; Krotkov, N.A.; Carn, S.; Zhang, Y.; Spurr, R.J.D.; Joiner, J. New-generation NASA Aura Ozone Monitoring Instrument (OMI) volcanic SO2 dataset: Algorithm description, initial results, and continuation with the Suomi-NPP Ozone Mapping and Profiler Suite (OMPS). Atmos. Meas. Tech. 2017, 10, 445–458. [Google Scholar] [CrossRef] [Green Version]
  9. Levelt, P.F.; Joiner, J.; Tamminen, J.; Veefkind, J.P.; Bhartia, P.K.; Stein Zweers, D.C.; Duncan, B.N.; Streets, D.G.; Eskes, H.; McLinden, C.; et al. The ozone monitoring instrument. IEEE Trans. Geosci. Remote Sens. 2006, 44, 1093–1101. [Google Scholar] [CrossRef]
  10. Wright, R. MODVOLC: 14 years of autonomous observations of effusive volcanism from space. Geol. Soc. Lond. Spec. Publ. 2016, 426, 23–53. [Google Scholar] [CrossRef] [Green Version]
  11. Chevallier, L.; Bachelery, P. Evolution structurale du volcan actif du Piton de la Fournaise, Ile de la Réunion—Océan indien occidental. Bull. Volcanol. 1981, 44, 723–741. [Google Scholar] [CrossRef]
  12. Coppola, D.; Di Muro, A.; Peltier, A.; Villeneuve, N.; Ferrazzini, V.; Favalli, M.; Bachèlery, P.; Gurioli, L.; Harris, A.J.L.; Moune, S.; et al. Shallow system rejuvenation and magma discharge trends at Piton de la Fournaise volcano (La Réunion Island). Earth Planet. Sci. Lett. 2017, 463, 13–24. [Google Scholar] [CrossRef]
  13. Di Muro, A.; Métrich, N.; Allard, P.; Aiuppa, A.; Burton, M.; Galle, B.; Staudacher, T. Magma Degassing at Piton de la Fournaise Volcano; Bachelery, P., Lenat, J.-F., di Muro, A., Michon, L., Eds.; Springer: Berlin/Heidelberg, Germany, 2016; pp. 203–222. [Google Scholar] [CrossRef]
  14. Di Muro, A.; Aiuppa, A.; Burton, M.; Metrich, N.; Allard, P.; Fougeroux, T.; Guida, R.; Giudice, G. Intra-eruptive gas emissions and shallow magma storage after the 2007 summit caldera collapse of Piton de la Fournaise, Reunion island. In Proceedings of the EGU General Assembly 2012, Vienna, Austria, 22–27 April 2020; p. 2761. [Google Scholar]
  15. Peltier, A.; Staudacher, T.; Bachèlery, P. New behaviour of the Piton de La Fournaise volcano feeding system (La Réunion Island) deduced from GPS data: Influence of the 2007 Dolomieu caldera collapse. J. Volcanol. Geotherm. Res. 2010, 192, 48–56. [Google Scholar] [CrossRef]
  16. De Franchis, C.; Meinhardt-Llopis, E.; Michel, J.; Morel, J.-M.; Facciolo, G. An automatic and modular stereo pipeline for pushbroom images. ISPRS Ann. Photogramm. Remote Sens. Spat. Inf. Sci. 2014, II–3, 49–56. [Google Scholar] [CrossRef] [Green Version]
  17. Chevrel, M.O.; Favalli, M.; Villeneuve, N.; Harris, A.J.L.; Fornaciai, A.; Richter, N.; Peltier, A. Lava flow hazard map of Piton de la Fournaise volcano. Nat. Hazards Earth Syst. Sci. 2021, 21, 2355–2377. [Google Scholar] [CrossRef]
  18. Harris, A.J.L.; Ripepe, M. Regional earthquake as a trigger for enhanced volcanic activity: Evidence from MODIS thermal data. Geophys. Res. Lett. 2007, 34, L02304. [Google Scholar] [CrossRef]
  19. Galle, B.; Johansson, M.; Rivera, C.; Zhang, Y.; Kihlman, M.; Kern, C.; Hidalgo, S. Network for Observation of Volcanic and Atmospheric Change (NOVAC)—A global network for volcanic gas monitoring: Network layout and instrument description. J. Geophys. Res. 2010, 115, D05304. [Google Scholar] [CrossRef]
  20. Michon, L.; Di Muro, A.; Villeneuve, N.; Saint-Marc, C.; Fadda, P.; Manta, F. Explosive activity of the summit cone of Piton de la Fournaise volcano (La Réunion island): A historical and geological review. J. Volcanol. Geotherm. Res. 2013, 264, 117–133. [Google Scholar] [CrossRef] [Green Version]
  21. Derrien, A. Apports des Techniques Photogrammétriques à L’étude du Dynamisme des Structures Volcaniques du Piton de la Fournaise. Ph.D. Thesis, Université de Paris, Paris, France, 2019. Available online: http://www.theses.fr/2019UNIP7084/document (accessed on 1 November 2021).
  22. Barsi, J.A.; Barker, J.L.; Schott, J.R. An Atmospheric Correction Parameter Calculator for a single thermal band earth-sensing instrument. In Proceedings of the IGARSS 2003, 2003 IEEE International Geoscience and Remote Sensing Symposium, Proceedings (IEEE Cat. No.03CH37477), Toulouse, France, 21–25 July 2003; Volume 5, pp. 3014–3016. [Google Scholar] [CrossRef]
  23. Coppola, D.; Barsotti, S.; Cigolini, C.; Laiolo, M.; Pfeffer, M.; Ripepe, M. Monitoring the time-averaged discharge rates, volumes and emplacement style of large lava flows by using MIROVA system: The case of the 2014–2015 eruption at Holuhraun (Iceland). Ann. Geophys. 2019, 61, 10. [Google Scholar] [CrossRef] [Green Version]
  24. Harris, A. Thermal Remote Sensing of Active Volcanoes: A User’s Manual; Cambridge University Press: Cambridge, UK, 2013. [Google Scholar] [CrossRef]
  25. Harris, A. Detection capabilities of thermal sensors—Electronic Supplement 1. In Thermal Remote Sensing of Active Volcanoes A User’s Manual; Cambridge University Press: Cambridge, UK, 2013; pp. 1–57. Available online: https://www.cambridge.org/files/3313/6698/1587/Harris_electronic_supplement_1.pdf (accessed on 1 November 2021).
  26. Harris, A.J.L.; Baloga, S.M. Lava discharge rates from satellite-measured heat flux. Geophys. Res. Lett. 2009, 36, L19302. [Google Scholar] [CrossRef]
  27. Coppola, D.; Piscopo, D.; Staudacher, T.; Cigolini, C. Lava discharge rate and effusive pattern at Piton de la Fournaise from MODIS data. J. Volcanol. Geotherm. Res. 2009, 184, 174–192. [Google Scholar] [CrossRef]
  28. Harris, A.J.L.; Flynn, L.P.; Keszthelyi, L.; Mouginis-Mark, P.J.; Rowland, S.K.; Resing, J.A. Calculation of lava effusion rates from Landsat TM data. Bull. Volcanol. 1998, 60, 52–71. [Google Scholar] [CrossRef]
  29. Harris, A.J.L.; Dehn, J.; Calvari, S. Lava effusion rate definition and measurement: A review. Bull. Volcanol. 2007, 70, 1–22. [Google Scholar] [CrossRef]
  30. Coppola, D.; Laiolo, M.; Piscopo, D.; Cigolini, C. Rheological control on the radiant density of active lava flows and domes. J. Volcanol. Geotherm. Res. 2013, 249, 39–48. [Google Scholar] [CrossRef]
  31. Pieri, D.C.; Baloga, S.M.; Nelson, R.M.; Sagan, C. Sulfur flows of Ra Patera, Io. Icarus 1984, 60, 685–700. [Google Scholar] [CrossRef]
  32. Self, S. Magma volume, volatile emissions, and stratospheric aerosols from the 1815 eruption of Tambora. Geophys. Res. Lett. 2004, 31, L20608. [Google Scholar] [CrossRef] [Green Version]
  33. Di Muro, A.; Staudacher, T.; Ferrazzini, V.; Métrich, N.; Besson, P.; Garofalo, C.; Villemant, B. Shallow Magma Storage at Piton de la Fournaise Volcano After 2007 Summit Caldera Collapse Tracked in Pele’s Hairs. In Hawaiian Volcanoes: From Source to Surface; Carey, R., Cayol, V., Poland, M., Weis, D., Eds.; Geophysical Monograph Series; John Wiley & Sons, Inc.: Hoboken, NJ, USA, 2015; pp. 189–212. [Google Scholar] [CrossRef]
  34. Duputel, Z.; Rivera, L. The 2007 caldera collapse of Piton de la Fournaise volcano: Source process from very-long-period seismic signals. Earth Planet Sci. Lett. 2019, 527, 115786. [Google Scholar] [CrossRef]
  35. Peltier, A.; Ferrazzini, V.; Di Muro, A.; Kowalski, P.; Villeneuve, N.; Richter, N.; Chevrel, O.; Froger, J.L.; Hrysiewicz, A.; Ramsey, M.; et al. Volcano Crisis Management at Piton de la Fournaise (La Réunion) during the COVID-19 Lockdown. Seismol. Res. Lett. 2020, 92, 38–52. [Google Scholar] [CrossRef]
  36. Di Muro, A.; Metrich, N.; Vergani, D.; Rosi, M.; Armienti, P.; Fougeroux, T.; Civetta, L.; Deloule, E.; Arienzo, I. The Shallow Plumbing System of Piton de la Fournaise Volcano (La Reunion Island, Indian Ocean) Revealed by the Major 2007 Caldera-Forming Eruption. J. Petrol. 2014, 55, 1287–1315. [Google Scholar] [CrossRef] [Green Version]
  37. Gouhier, M.; Coppola, D. Satellite-based evidence for a large hydrothermal system at Piton de la Fournaise volcano (Reunion Island): Hydrothermal system and SO2 emissions. Geophys. Res. Lett. 2011, 38. [Google Scholar] [CrossRef]
  38. Gurioli, L.; Di Muro, A.; Vlastélic, I.; Moune, S.; Thivet, S.; Valer, M.; Hénot, J.-M.; Villeneuve, N.; Boudoire, G.; Peltier, A.; et al. Integrating field, textural, and geochemical monitoring to track eruption triggers and dynamics: A case study from Piton de la Fournaise. Solid Earth 2018, 9, 431–455. [Google Scholar] [CrossRef] [Green Version]
  39. Staudacher, T.; Ferrazzini, V.; Peltier, A.; Kowalski, P.; Boissier, P.; Catherine, P.; Massin, F.; Lauret, F. The April 2007 eruption and the Dolomieu crater collapse, two major events at Piton de la Fournaise (La Réunion Island, Indian Ocean). J. Volcanol. Geotherm. Res. 2009, 184, 126–137. [Google Scholar] [CrossRef]
  40. Walker, G.P.L. Three Hawaiian calderas: An origin through loading by shallow intrusions? J. Geophys. Res. Solid Earth 1988, 93, 14773–14784. [Google Scholar] [CrossRef] [Green Version]
  41. Fontaine, F.R.; Roult, G.; Hejrani, B.; Michon, L.; Ferrazzini, V.; Barruol, G.; Massin, F.; Tkalčić, H.; Di Muro, A.; Peltier, A. Very- and ultra-long-period seismic signals prior to and during caldera formation on La Réunion Island. Sci. Rep. 2019, 9, 8068. [Google Scholar] [CrossRef] [Green Version]
  42. Tepp, G.; Hotovec-Ellis, A.; Shiro, B.; Johanson, I.; Thelen, W.; Haney, M.M. Seismic and geodetic progression of the 2018 summit caldera collapse of Kīlauea volcano. Earth Planet. Sci. Lett. 2020, 540, 116250. [Google Scholar] [CrossRef]
  43. Wadge, G. The variation of magma discharge during basaltic eruptions. J. Volcanol. Geotherm. Res. 1981, 11, 139–168. [Google Scholar] [CrossRef]
  44. Coppola, D.; James, M.R.; Staudacher, T.; Cigolini, C. A comparison of field- and satellite-derived thermal flux at Piton de la Fournaise: Implications for the calculation of lava discharge rate. Bull. Volcanol. 2010, 72, 341–356. [Google Scholar] [CrossRef]
  45. Vlastélic, I.; Gannoun, A.; Di Muro, A.; Gurioli, L.; Bachèlery, P.; Henot, J.M. Origin and fate of sulfide liquids in hotspot volcanism (La Réunion): Pb isotope constraints from residual Fe–Cu oxides. Geochim. Cosmochim. Acta 2016, 194, 179–192. [Google Scholar] [CrossRef]
  46. Sundermeyer, C.; Di Muro, A.; Gordeychik, B.; Wörner, G. Timescales of magmatic processes during the eruptive cycle 2014–2015 at Piton de la Fournaise, La Réunion, obtained from Mg–Fe diffusion modelling in olivine. Contrib. Mineral. Petrol. 2019, 175, 1. [Google Scholar] [CrossRef]
  47. Peltier, A.; Beauducel, F.; Villeneuve, N.; Ferrazzini, V.; Di Muro, A.; Aiuppa, A.; Taisne, B.; Derrien, A.; Jourde, K. Deep fluid transfer evidenced by surface deformation during the 2014–2015 unrest at Piton de la Fournaise volcano. J. Volcanol. Geotherm. Res. 2016, 321, 140–148. [Google Scholar] [CrossRef]
  48. Thornber, C.R. Kilauea East Rift Zone Magmatism: An Episode 54 Perspective. J. Petrol. 2003, 44, 1525–1559. [Google Scholar] [CrossRef] [Green Version]
  49. Harris, A.J.L.; Thornber, C.R. Complex effusive events at Kīlauea as documented by the GOES satellite and remote video cameras. Bull. Volcanol. 1999, 61, 382–395. [Google Scholar] [CrossRef]
  50. Beauducel, F.; Peltier, A.; Villié, A.; Suryanto, W.; Beauducel, F.; Peltier, A. Mechanical Imaging of a Volcano Plumbing System From GNSS Unsupervised Modeling. Geophys. Res. Lett. 2020, 47, e2020GL089419. [Google Scholar] [CrossRef]
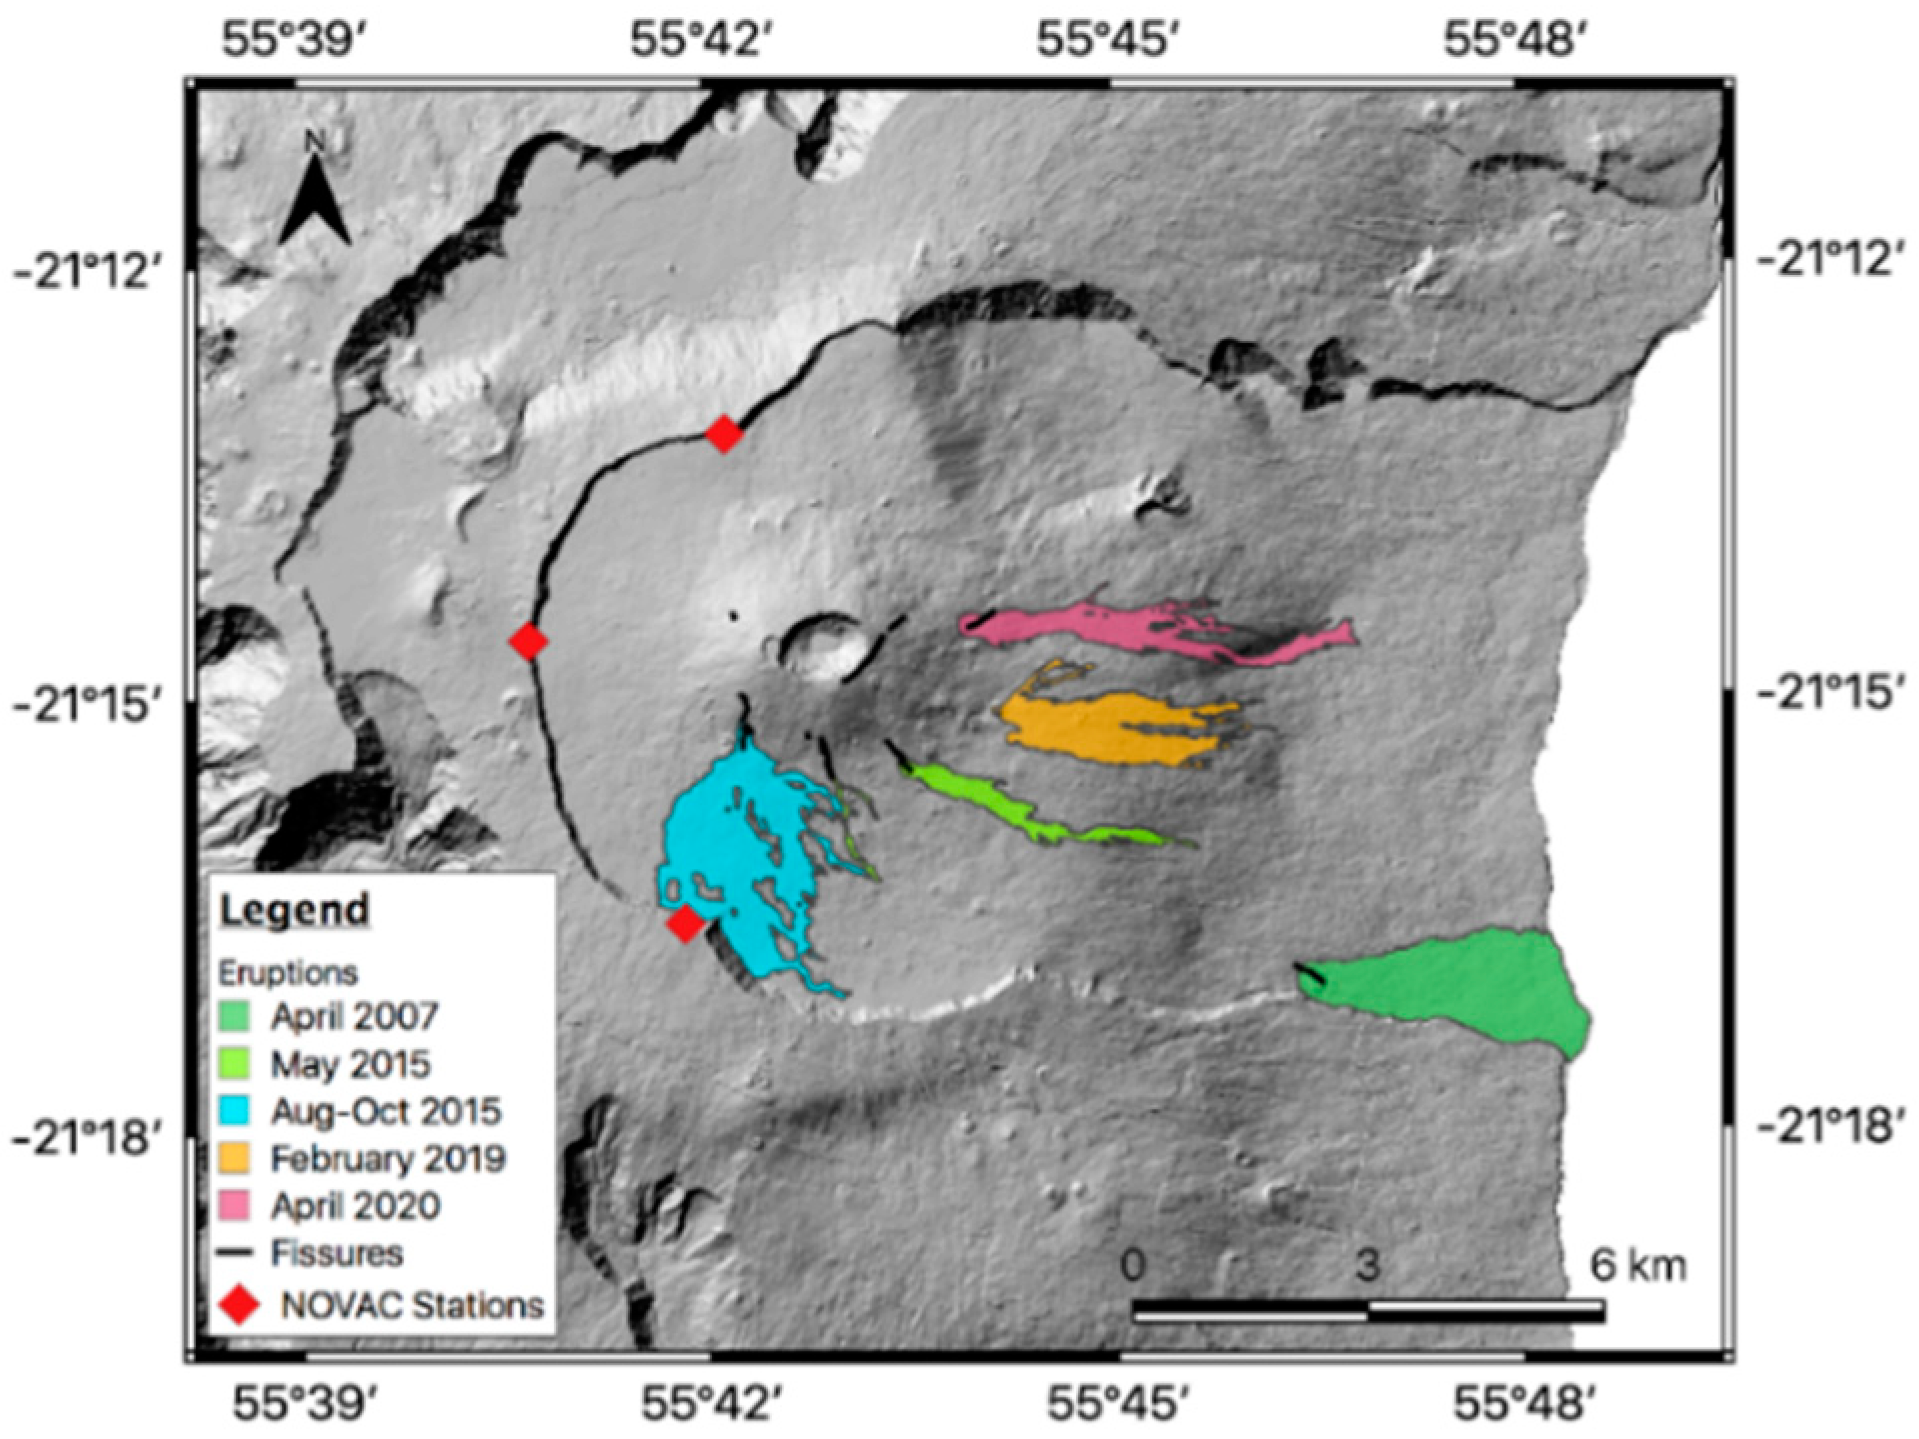
Figure 1. Map of Piton de la Fournaise showing the location of the three DOAS stations of the NOVAC network, and the position of the eruption vents and lava flow fields studied here. The background is the hill shaded relief from the 2016 Digital Elevation Model (DEM) produced in April 2016 from optical Pléiades satellite images acquired in stereo triplet mode and processed by the French Centre National d’Etudes Spatiales using their S2P restitution code [16]. The lava flow outlines and fissure locations are from Chevrel et al. (2021) [17] and OVPF reports ISSN 2610-5101.
Remotesensing 14 00323 g001
Figure 2. Temperature and size of a subpixel hot spot necessary to saturate the MIR and TIR spectral bands given a background temperature of 25 °C.
Remotesensing 14 00323 g002
Figure 3. (ad) Time series of TROPOMI (green triangle), OMPS (pink diamond), and OMI (blue circle) SO2 mass comparisons vs. ground-based SO2 fluxes from NOVAC network (red square) for the eruptions of interest. The uncertainty is 30% for all the instruments. (a) May 2015; (b) August–October 2015; (c) February 2019; (d) April 2020.
Remotesensing 14 00323 g003
Figure 4. (a) The effusion rates and (b) the cumulative volumes of erupted lava for the following eruptions: April 2020, February 2019, August–October 2015, May 2015, and April 2007. The estimations correspond to the MIROVA and MODVOLC automatic systems and the Manual method. Note that on the MIROVA dataset, the peak on 6 April 2007 that was manually corrected (200 m3 s–1) was taken into account. By removing this corrected value, the lava volume estimation decreases to 52.1 ± 26.0 × 10⁶ m3. The uncertainty is 30% except for the April 2007 eruption, where it rises to 50% due to saturation issues.
Remotesensing 14 00323 g004
Figure 5. Normalized TADR trend from MIROVA datasets for the April 2007 (in blue) and May 2015 (in red) eruptions. The abscissa axis represents the elapsed time from the first measurement corresponding to the beginning of the eruption, normalized at 1. The black line represents the time-series of seismically-derived TADR from Duputel and Rivera (2019) [34]: (a) the complete dataset; (b) selected data corresponding to the MIROVA measurements.
Remotesensing 14 00323 g005
Figure 6. Comparison of TADRs (m3 s−1) derived from the different methods for the August–October 2015 eruption: (a) MODVOLC versus Manual; (b) MIROVA versus MODVOLC; (c) MIROVA versus Manual.
Remotesensing 14 00323 g006
Figure 7. (ae) Estimation of sulfur content within melt inclusions using the reverse petrological approach. The larger the symbol, the better the match with the total SO2 mass detected by the UV satellite sensors. According to petrological analysis, the average residual sulfur content in the matrix can be fixed at 160 ppm [33]. This is represented by the black line. Note that for the April 2007 eruption, the sulfur content estimation used the seismically-derived TADR data from Duputel and Rivera (2019) [34] and the three points corresponding to the following S couples (MI—Matrix: 1050—160 ppm; 1150—260 ppm; 1250—360 ppm), provide exactly the total SO2 mass estimated from the direct petrological approach. Results are given with 45% uncertainty. (a) April 2007; (b) May 2015; (c) August–October 2015; (d) February 2019; (e) April 2020.
Remotesensing 14 00323 g007
Figure 8. Petrological analysis of sulfur in melt inclusions at Piton de la Fournaise from 2009 to 2015 [13,38]. Inclusions having a sulfur content of ca. 1050 ppm are considered to come from the sea level reservoir. Those that have a higher sulfur content (>1150 ppm) are related to deeper mafic inputs, while partly degassed and shallow seated magmas are recorded by S contents <1000 ppm.
Remotesensing 14 00323 g008
Figure 9. (ad) Daily estimation of the pre-eruptive magmatic sulfur content at Piton de la Fournaise using a reverse petrological approach and fixing the undegassed c S m a t r i x at 160 ppm, for eruptions in 2015–2020. The uncertainty of 45% related to these results are not shown on this figure. (a) May 2015; (b) August–October 2015; (c) February 2019; (d) April 2020.
Remotesensing 14 00323 g009
Figure 10. (a) DRE cumulative lava volume estimated by fixing the sulfur content within melt inclusions at 1050 ppm (35% uncertainty); (b) DRE cumulative lava volume estimated using sulfur contents calculated from the MIROVA lava volume (45% uncertainty). Hence, note the relationship between them. Anomalous sulfur contents (greater than 2000 ppm) were replaced with 1250 or 1600 ppm. As no estimated sulfur content within the melt inclusion was realistic for the April 2007 eruption by using the MIROVA lava volume, the second approach was not applied.
Remotesensing 14 00323 g010
Figure 11. Figure from Coppola et al. (2010) [44]. (a) Bow-tie effect on the MODIS image of Piton de la Fournaise, acquired on 25 June 2003. We can see two pairs of pixels detected as hot spots resulting in (b) two scan lines from the same surface, thus resulting in double counting at a scan angle of about 45°.
Remotesensing 14 00323 g011
Table 1. Summary of petrologic method data used to estimate the sulfur content and SO2 mass, where ε crx   is the crystalinity and ϕ the vesicularity (http://wwwobs.univ-bpclermont.fr/SO/televolc/dynvolc/ (last access: 14 June 2021)).
Eruption ϕ
(%)
Range   ε c r x
(%)
Average   ε c r x
(%)
Bulk Density
(kg m–3)
Average Bulk Density
(kg m–3)
April 2020522.83–9.164.901142–13311267
February 2019522.14–41.1312.00202–13481057
Aug–Oct 2015522.00–10.705.501096–13541249
May 2015522.40–3.002.701327–13421333
April 2007404.70–53.3044.201625–196464
Table 2. Estimated total bulk volumes of erupted lava ( × 10 6 m3) from field measurements, the MIROVA and MODVOLC systems, and manual analysis. Manual DC corresponds to the direct conversion from spectral radiance, and Manual TA is the thermodynamic approach.
EruptionCumulative Bulk Lava Volume ( × 10 6 m3)
FieldMIROVAMODVOLCManual DCManual TA
April 20206.0–10.0 *2.9 ± 1.03.9 ± 2.01.8 ± 0.62.3 ± 1.1
February 201914.5 **13.6 ± 4.811.2 ± 3.69.8 ± 3.49.4 ± 4.7
Aug–Oct 201536.6 ***42.8 ± 1.579.3 ± 23.839.0 ± 13.736.2 ± 18.1
May 20155.7 ***6.0 ± 2.18.9 ± 2.76.7 ± 2.36.2 ± 3.1
April 2007185.0 ***126.1 ± 63.0 ****48.9 ± 24.446.2 ± 23.152.2 ± 26.1
* [35], ** Preliminary results N. Villeneuve, *** [21], **** Removing the TADR peak on 6 April 2007 that was manually corrected (200 m3 s–1), the lava volume is 52.1 ± 26.0 × 10⁶ m3.
Table 3. Summary of the total pixels for each eruption counted by each method. Note that the MIROVA algorithm resampled MODIS images into 1 km equal area pixels (e.g., high zenith angle). Hence, for some cases, one original MODIS pixel may be divided into several “MODIS-MIROVA” pixels. That explains the differences in total pixels between MIROVA and the other approaches. “#/% pixels sat” = number/percentage of saturated pixel.
EruptionMODVOLCMIROVAMANUAL
Total Pixels# Pixels Sat% Pixels SatTotal
Pixels
# Pixels Sat% Pixels SatTotal
Pixels
# Pixels Sat% Pixels Sat
April 20202100.012543.27722.6
February 20199311.142351.215810.6
Aug–Oct 201559100.0164200.067510.2
May 20159611.033600.013000.0
April 200720410752.573038052.140919046.5
Table 4. Cumulative DRE volumes of erupted lava ( × 10 6 m3) estimated from field measurements, MIROVA, and the reverse petrological approach using OMI, OMPS, and TROPOMI SO2 data. “OMI/OMPS/TROP 1050” = pre-eruptive sulfur content within melt inclusions fixed at 1050 ppm; “OMI/OMPS/TROP t” = pre-eruptive sulfur content varies over time. Note that the MIROVA cumulative lava volume is expressed as a bulk volume and not a DRE volume.
Eruption Cumulative   DRE   Lava   Volume   ( × 10 6 m 3 )
FieldOMI 1050OMPS 1050TROP 1050OMI tOMPS tTROP t
April 20203.3 *3.5 ± 1.619.4 ± 8.88.4 ± 3.83.1 ± 2.216.2 ± 11.56.3 ± 4.5
February 20199.4 **5.1 ± 2.422.4 ± 10.86.3 ± 3.19.2 ± 6.120.9 ± 13.811.6 ± 7.6
Aug–Oct 201523.8 ***3.9 ± 1.810.5 ± 4.8-24.5 ± 17.235.3 ± 24.7-
May 20153.7 ***1.1 ± 2.60.6 ± 0.3-4.0 ± 2.53.5 ± 2.2-
April 2007120.3 ***369.8 ± 178.9-----
* [35], ** Preliminary results N. Villeneuve, *** [21].
Publisher’s Note: MDPI stays neutral with regard to jurisdictional claims in published maps and institutional affiliations.