Technical Note

Monte Carlo Radiative Transfer Simulation to Analyze the Spectral Index for Remote Detection of Oil Dispersed in the Southern Baltic Sea Seawater Column: The Role of Water Surface State

1
Physics Department, Gdynia Maritime University, ul. Morska 81-87, 81-225 Gdynia, Poland
2
Institute of Oceanology, Polish Academy of Sciences, ul. Powstańców Warszawy 55, 81-712 Sopot, Poland
*
Author to whom correspondence should be addressed.
Remote Sens. 2022, 14(2), 247; https://doi.org/10.3390/rs14020247
Submission received: 18 November 2021 / Revised: 28 December 2021 / Accepted: 1 January 2022 / Published: 6 January 2022
(This article belongs to the Special Issue Baltic Sea Remote Sensing)

Abstract

:
The article presents the results of simulations that take into account the optical parameters of the selected sea region (from literature data on the southern Baltic Sea) and two optically extreme types of crude oil (from historical data) which exist in the form of a highly watered-down oil-in-water emulsion (10 ppm). The spectral index was analyzed based on the results of modeling the radiance reflectance distribution for almost an entire hemisphere of the sky (zenith angle from 0 to 80°). The spectral index was selected and is universal for all optically different types of oil (wavelengths of 650 and 412 nm). The possibility of detecting pollution in the conditions of the wavy sea surface (as a result of wind of up to 10 m/s) was studied. It was also shown that if the viewing direction is close to a direction perpendicular to the sea surface, observations aimed at determining the spectral index are less effective than observations under the zenith angle of incidence of sunlight for all azimuths excluding the direction of sunlight’s specular reflection.

1. Introduction

Oily substances may be under the surface of the water, both as a result of the influence of the environment and the deliberate transfer of oil from the form of a floating layer on the surface of the water to the submerged form, which is justified in terms of ensuring easier access for oil-decomposing bacteria, but may also be dictated by a desire to hide illegal oil discharge. In any case, there is a need to conduct research on the efficiency of substances supporting the dispersion of oil [1] and research on the possibility of detecting oil contamination in the form of an emulsion [2,3].
The use of aircraft, drones and satellites to remotely detect oil spills is possible over a wide range of electromagnetic wavelengths (from ultraviolet to microwave) [4]. However, when the oil remains in the water column, only the visible range of electromagnetic waves (VIS) can be used because ultraviolet (UV), infrared (IR) and microwave (MW) radiation is strongly absorbed by water [5]. The interaction of sunlight with water and its components, as well as with oil droplets in an oil-in-water emulsion, is reflected in the spectral and directional distribution of the above-water radiance field. This effect was used to estimate the contrast between the sea area containing the dispersed oil and the area free of oil [6,7]. Research on the search for an appropriate spectral index has already been carried out involving the waters of the Gulf of Gdańsk (the Baltic Sea), which could potentially contain types of oil with extremely different optical parameters. Analyses concerning viewing directions perpendicular to the water surface [8] and various viewing angles in the plane of incidence of direct sunlight [9] were carried out. In our earlier work [10], the effectiveness of the use of the spectral index was analyzed as a function of the viewing direction in almost all possible directions of observation. That study showed the dependence of the spectral index on the thickness of the polluted sea layer for the waters of the southern Baltic Sea, taking the optical properties of crude oil extracted in this region into account. On the other hand, this present article supplements this information by showing the weakening of the spectral coefficient along with the increase in the degree of waving of the sea surface. In addition, this article uses oils with extremely different optical properties.

2. Materials and Methods

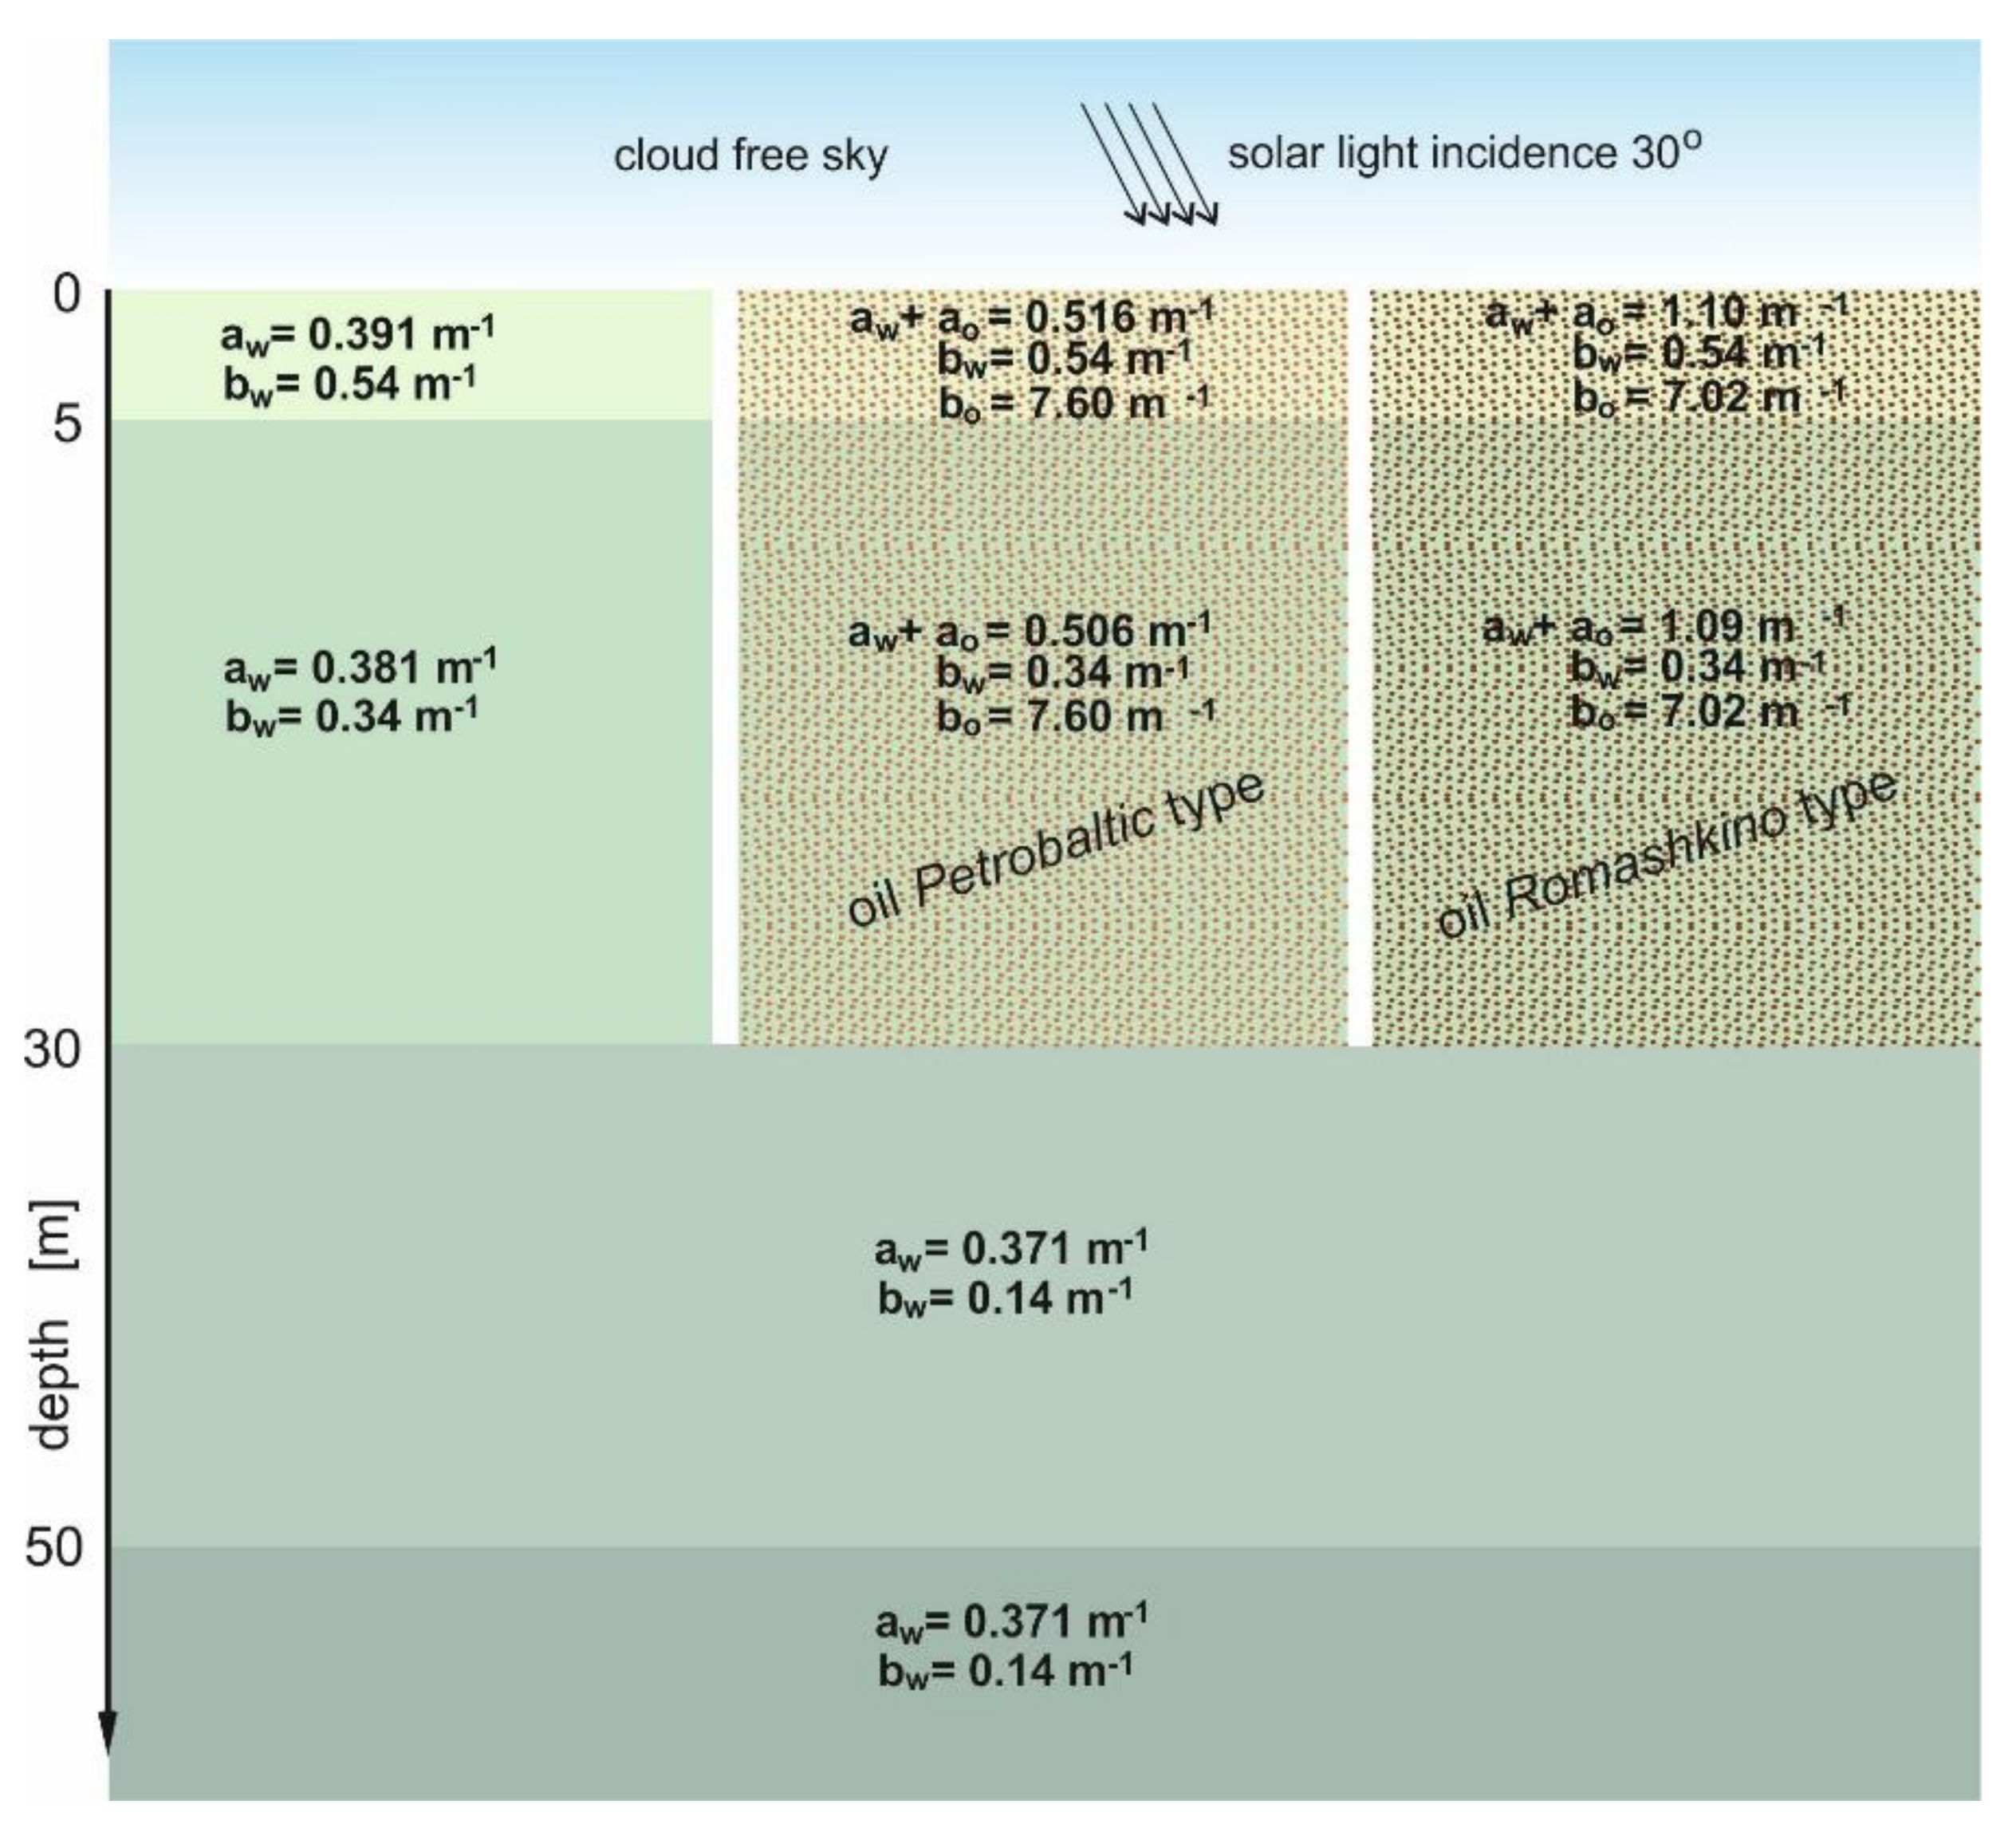
In the radiative transfer simulation, the optical parameters of seawater in the southern Baltic region were applied (data published by Sagan [11] and further cited by Baszanowska et al. [9]). On the other hand, as a factor disturbing the natural light transfer, two types of crude oil were used, whose optical parameters were shown by Otremba [12], and which also used in determining the optical properties of oil-in-water emulsions, which were also used in determining the optical properties of oil-in-water emulsions [9]. Spectra of both the absorption coefficient as well as the scattering coefficient of oil free seawater and oil-in-water emulsions (10 ppm) are shown in Figure 1 [9]. The optical properties used in the study (i.e., the absorption coefficient spectra and the scattering coefficient spectra) of the seawater and the oil-in-water emulsion that pollutes this water is shown in Figure 2. Differentiation of the spectral shapes for seawater in relation to oils is also visible in this picture. This encourages the search for the possibility of remotely detecting oil pollution in the water column.
The absorption coefficient for Petrobaltic crude oil is low across the spectrum in contrast to Romashkino crude oil. Similarly, the refractive index for Petrobaltic has low values, but that for Romashkino has high values. Petrobaltic crude oil is extracted in the southern Baltic Sea, while Romashkino crude oil is extracted on land (Eastern Europe—Romashkino Field, Russia). Other types of crude oil, lubricating oils and fuels have optical properties in the range between Petrobaltic and Romashkino [12]. A schematic representation of the optical model of the sea free of oil and contaminated with dispersed oil in Figure 2 is shown. In this model, the water surface is wavy, according to the Cox & Munk statistics [13].
Water virtually polluted with oil at a concentration of 10 ppm was analyzed in the simulation tests. The principle and course of the procedure aimed to obtain the radiance distribution of light reflected from the sea are described by Baszanowska et al. [8,9]. In the study, it was assumed that the sky was cloudless. The optical model of such a sky took both direct photons from the sun and photons scattered in the atmosphere into account [7]. Virtual detectors were located above the water surface (atmospheric modification of the above-water radiance field was not taken into account).

3. Results

The initial product of individual simulations was the radiance reflectance (RL) for 1620 directions related to various zenith angles (θ) and azimuth angles (φ). RL is the ratio of the above-water upwelling radiance Lu(θ,φ) in the viewing direction θ,φ to the above-water downwelling vector irradiance Ed. In the ocean optics, RL(θ = 0) are often called remote-sensing reflectance (Rrs).
The spectral index I θ , φ , λ n , λ m was defined as the ratio of the radiance reflectance for the longer wavelengths to the remote sensing reflectance for the lower wavelengths for the selected viewing direction θ,φ (1):
I θ , φ , λ n , λ m = L θ , φ λ n L θ , φ λ m
where λn, λm are the higher wavelength and lower wavelengths, respectively.
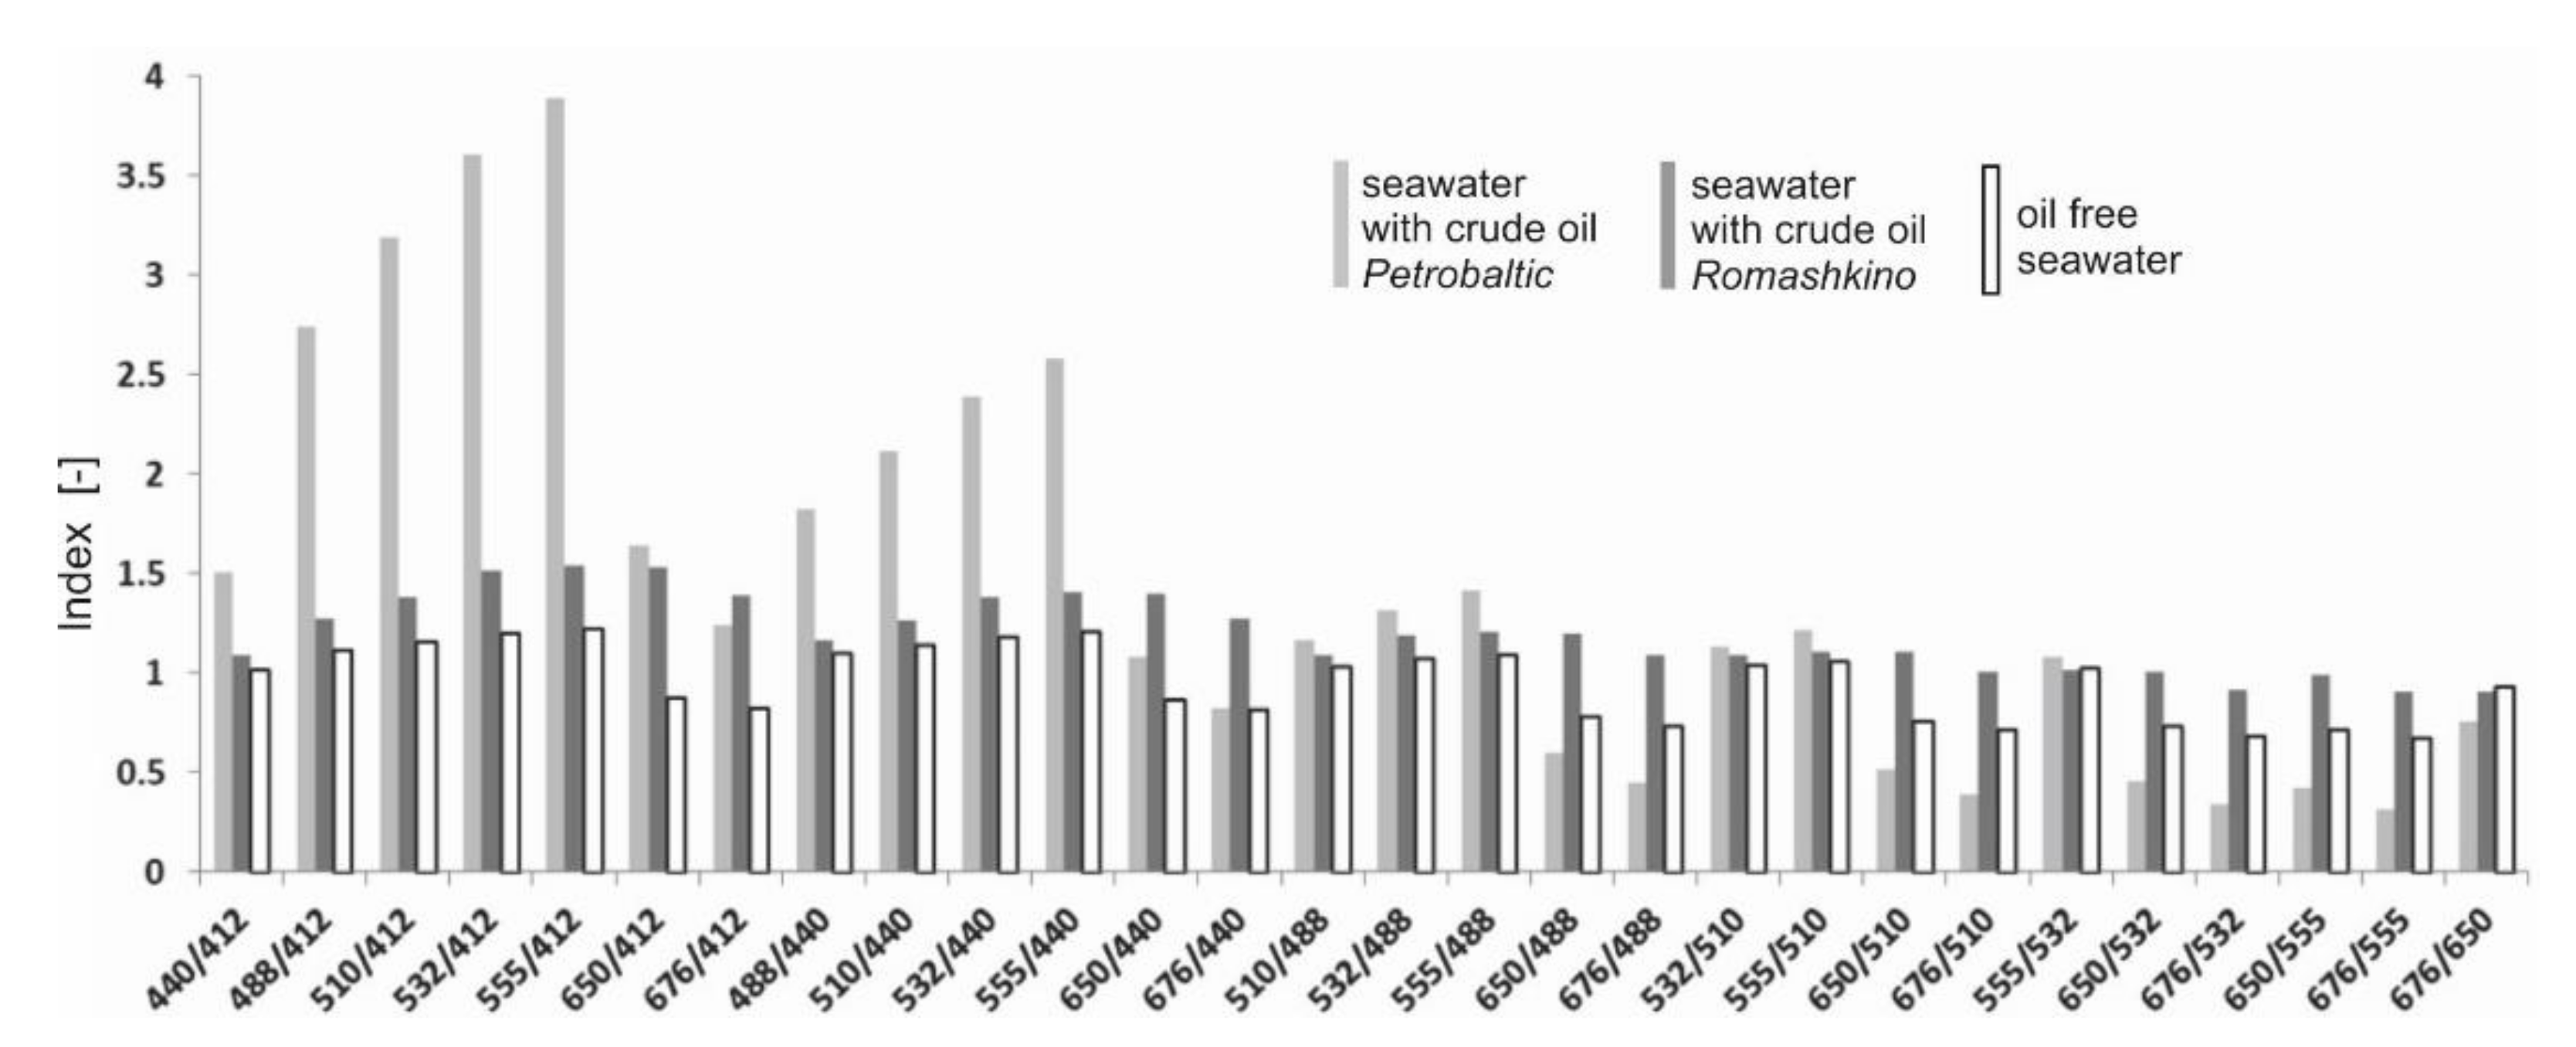
I θ = 0 , λ n , λ m values were determined for every possible combination of wavelengths (a total of 28, as shown in Figure 3).
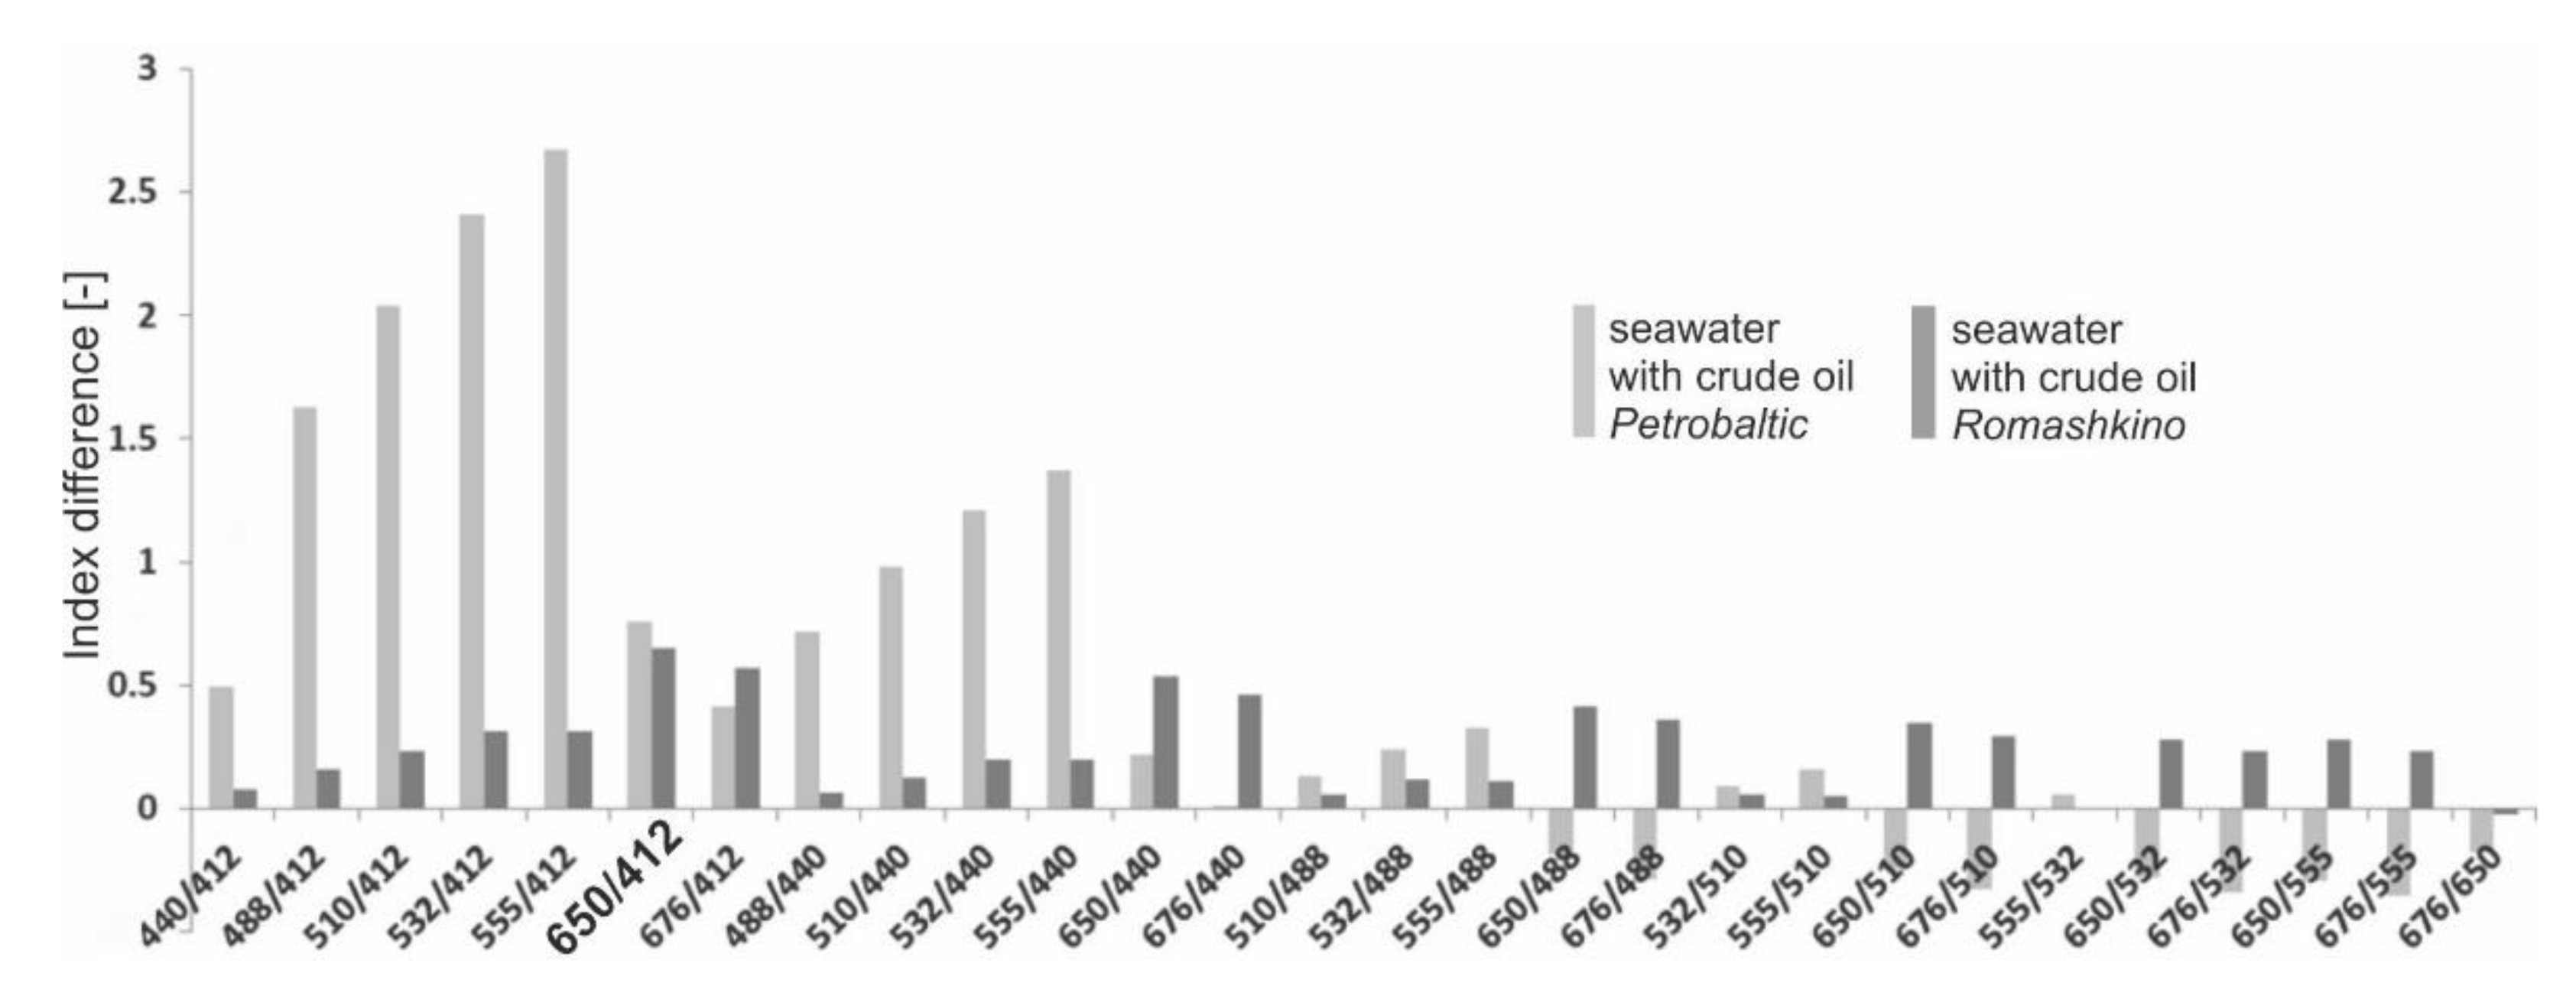
With these data, the differences between the values of the spectral indices of water polluted with dispersed oil and the values of the indices of oil-free water were determined for the viewing angle θ = 0° (shown in Figure 4).
Through an analysis of the bar graph in Figure 4, the combination 650/412 was selected from all the wavelength combinations. This combination was found to be the most advantageous because, although these are high values, they are similar for various types of oil.
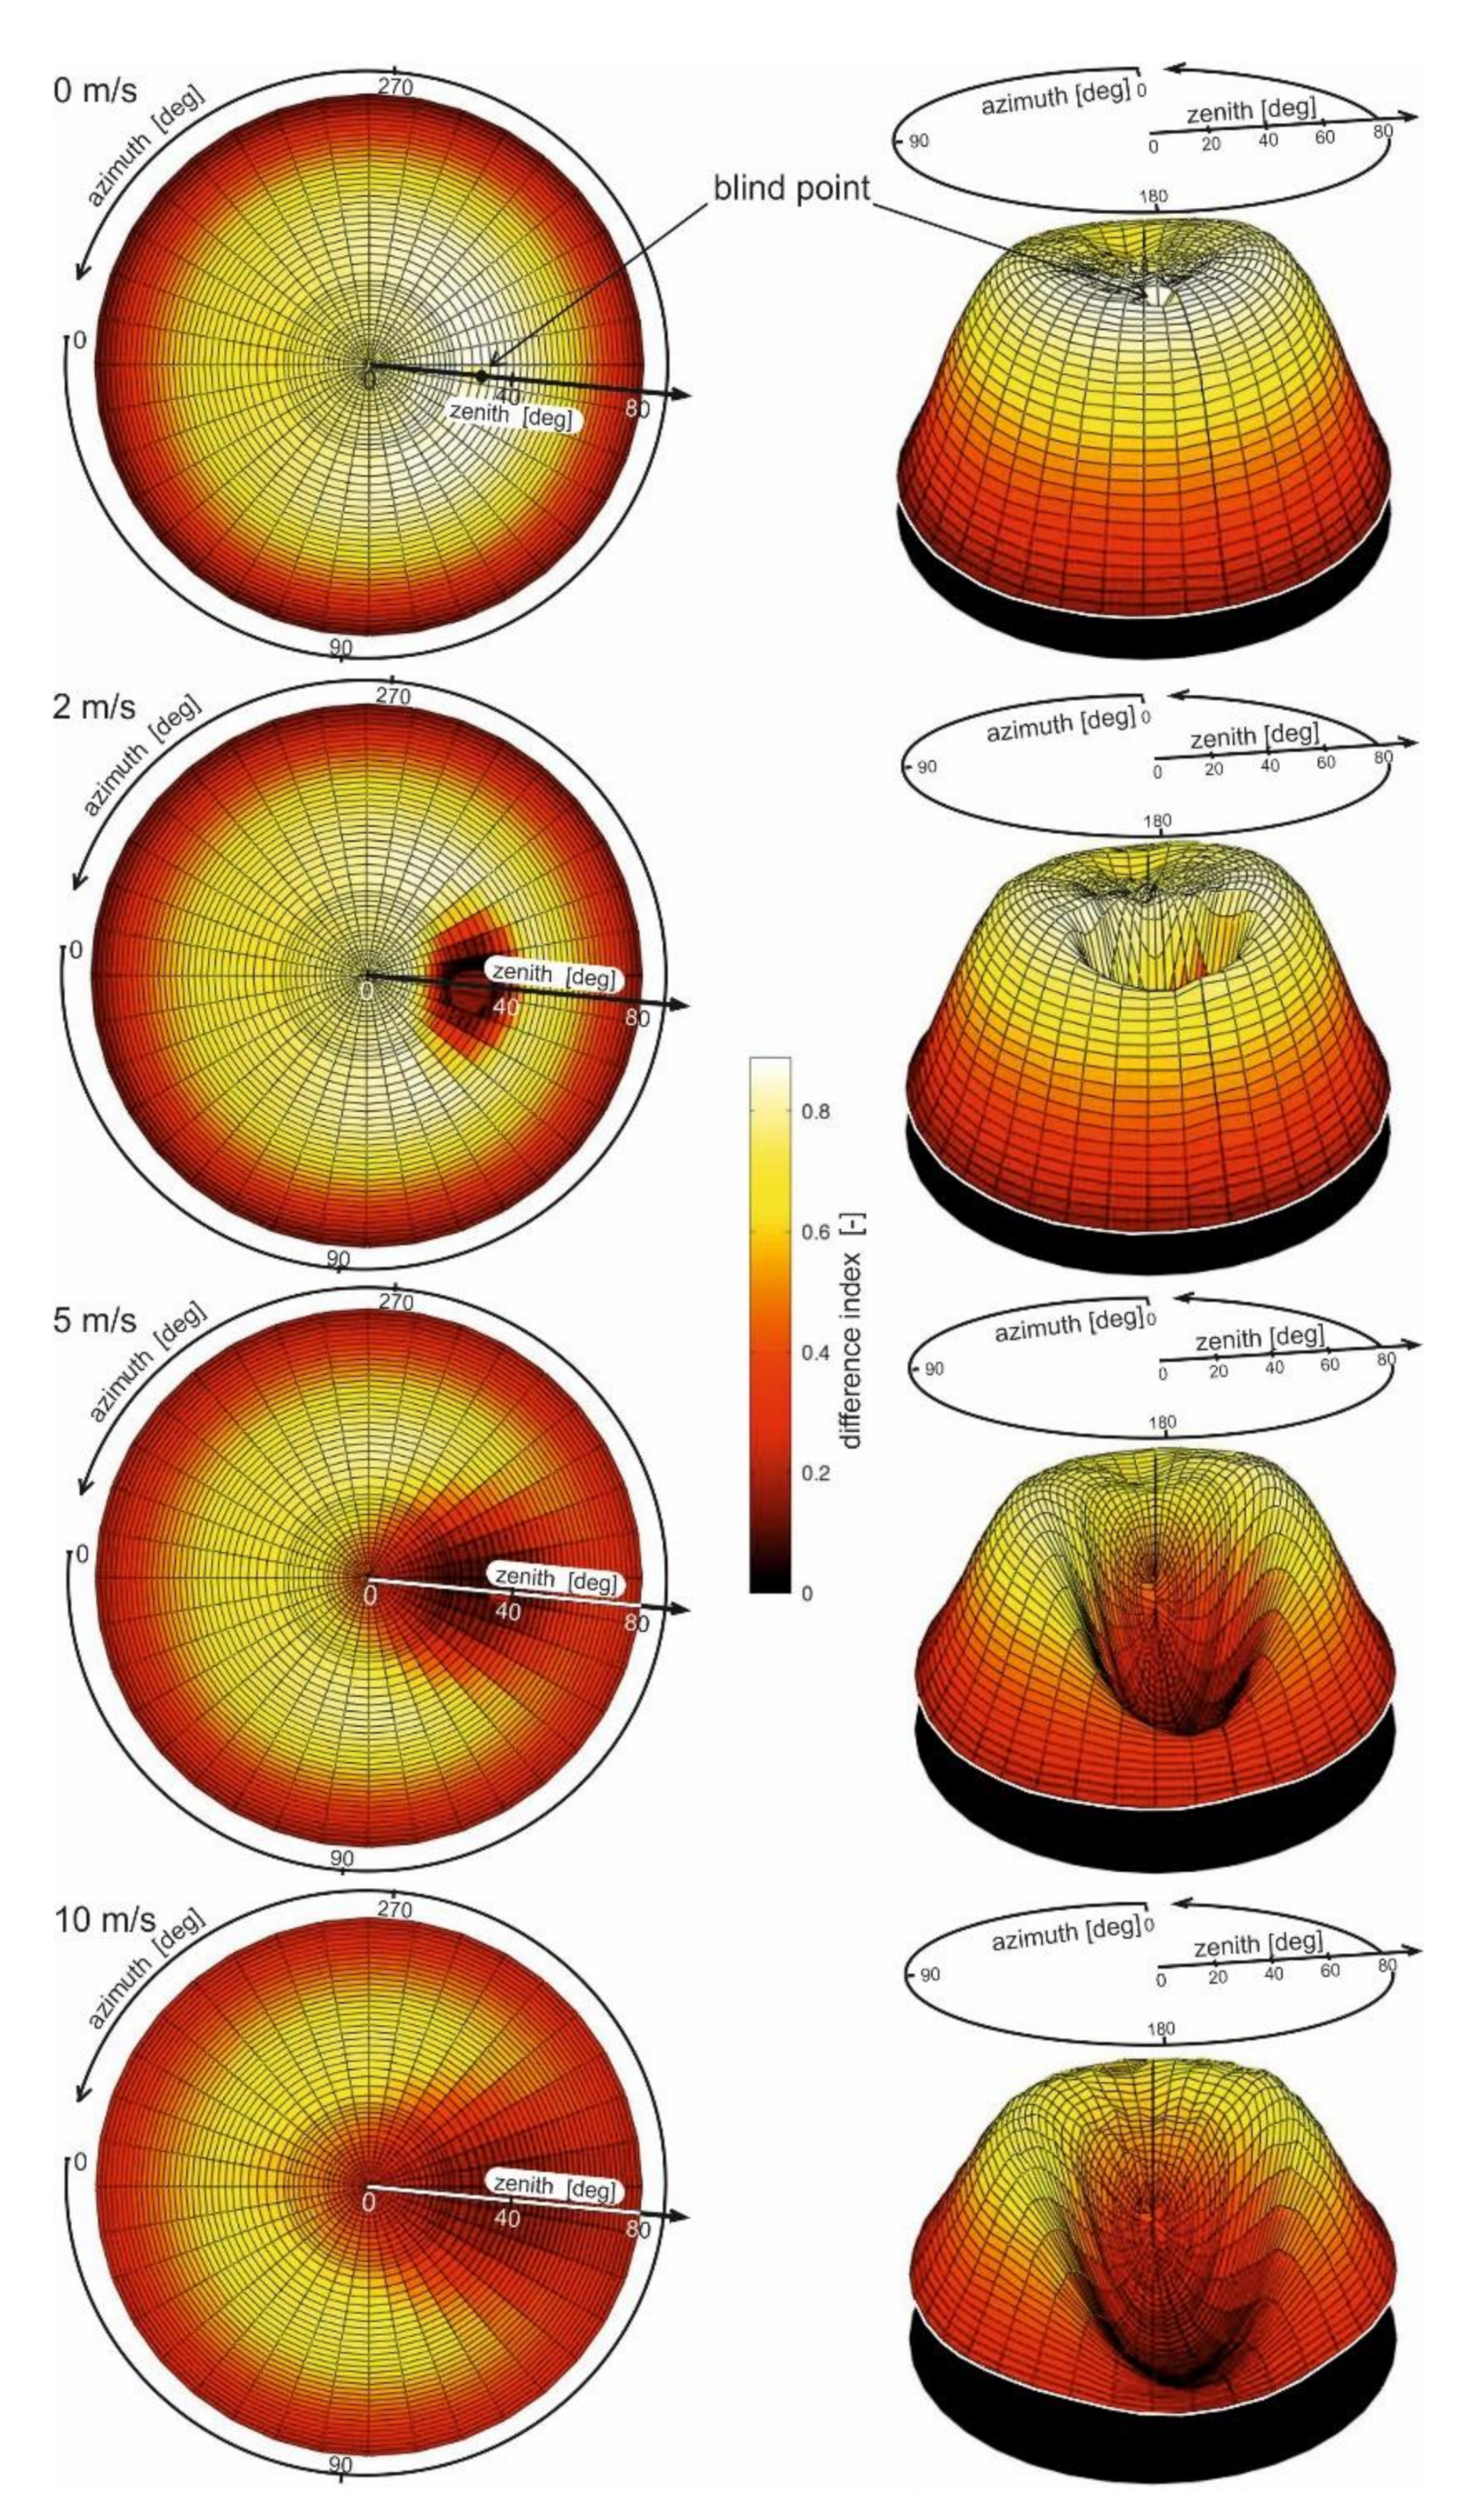
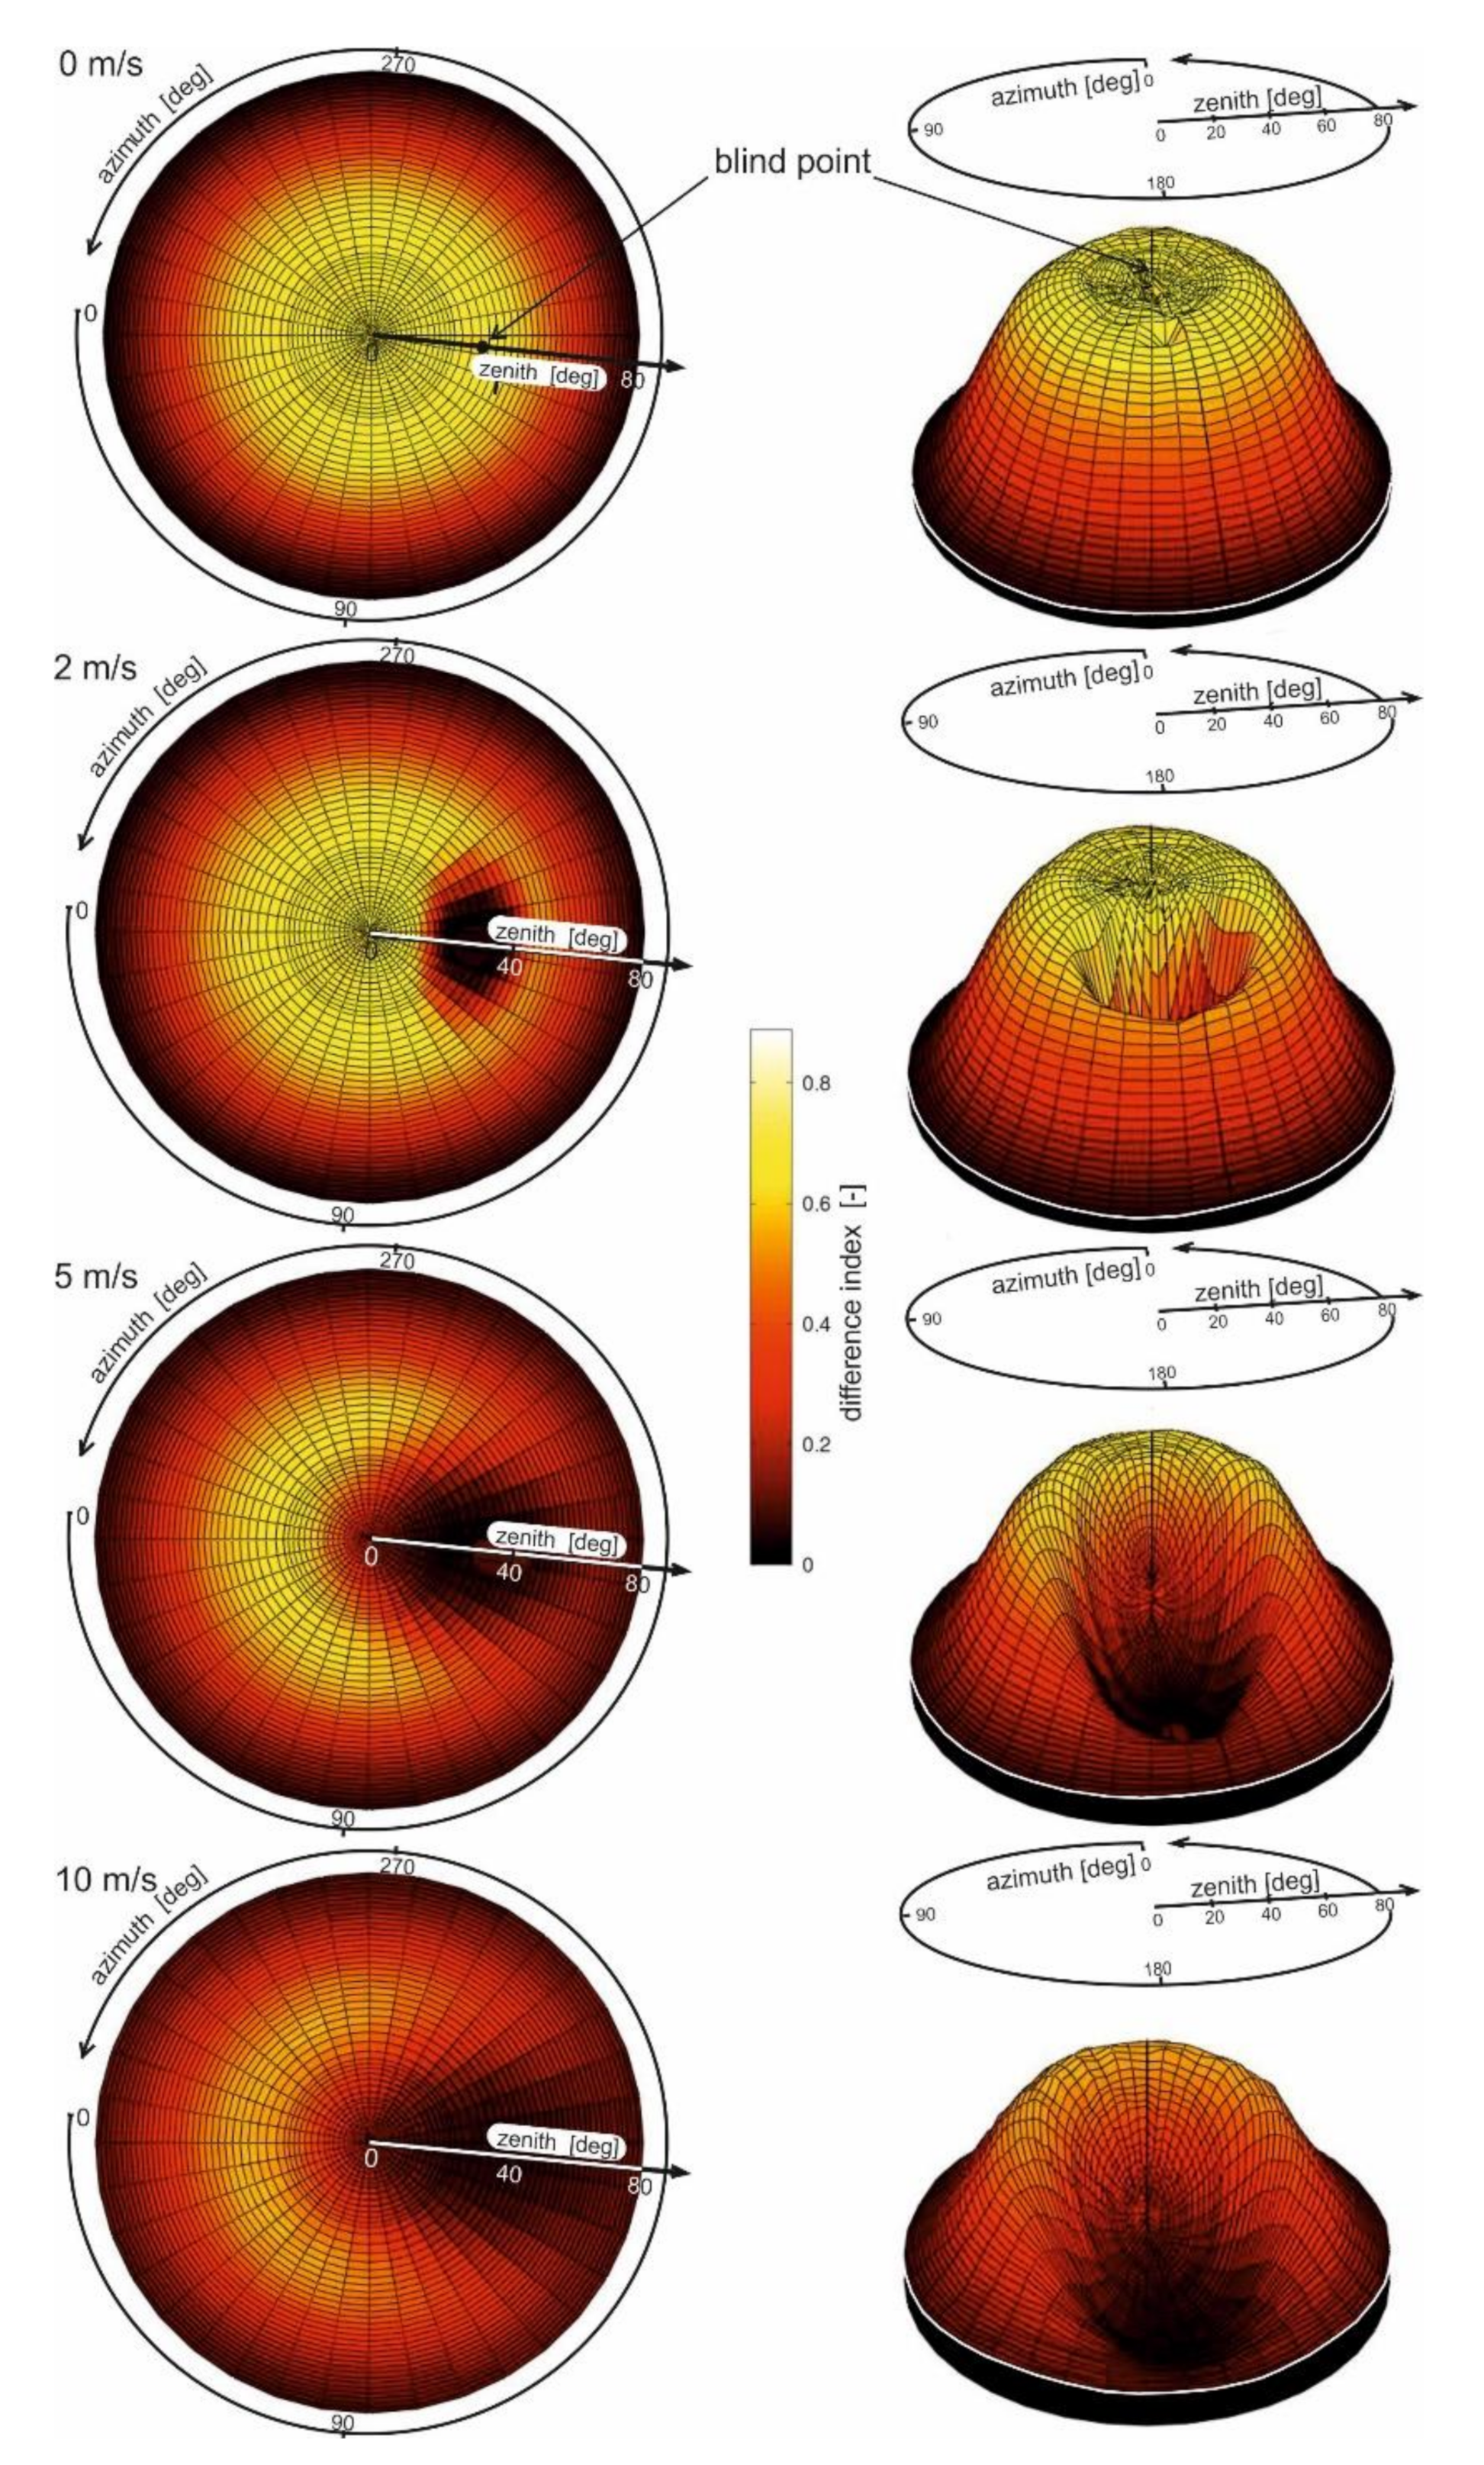
The difference indices were determined for each of the 1620 directions of the sea surface observations (zenith θ from 0 to 80°, azimuth φ in full angle every 10°), both with the use of the simulation results using the optical parameters of Petrobaltic-type oil (Figure 5) and Romashkino-type oil (Figure 6). Figure 5 and Figure 6 show the range of directions in which the observations were ineffective, i.e., directions around the direction in which the light coming directly from the sun would be mirrored. Along with the increase in the degree of sea surface heaving (after an increase in wind speed), the range of unfavorable oil detection directions became wider due to the solar light reflections from the waves’ slopes.
The directions favorable for the detection of the dispersed oil appeared at zenith angles close to the zenith angle of direct sunlight (in Figure 5 and Figure 6, these directions are indicated in yellow and white).
The tallest bar in Figure 4 falls on the differential index 555/412. It corresponds to the substance with the optical properties of Petrobaltic crude oil. At the same time, the differential index that corresponds to the Romashkino crude oil is relatively low for this wavelength combination. If it was possible to predict the possibility of spreading an oil emulsion whose droplets are a hydrocarbon mixture similar to Petrobaltic crude oil, the index 555/412 would clearly be the most advantageous.
If the surface of the sea was smooth, the preferred direction of observation would be close to the direction of reflection of direct sunlight, excluding the specular reflection of the solar beam (which is visible in the upper right graph in Figure 5 and Figure 6). It would be impossible to detect the oil dispersed in the water column if the observation took place at a large zenith angle (dark red and black in Figure 5 and Figure 6).

4. Conclusions

Alien substances dispersed in the water column can manifest their presence above the sea’s surface as a spectral and directional distribution of bottom-up radiance. The findings reported in this study suggest that a spectral index of 650/412 would be useful for the detection of an oil-in-water emulsion under cloudless sky conditions. This index outwardly contradicts the index proposed in an earlier study [10] (555/412), where it was assumed that it would only be used to detect oil extracted in the southern Baltic Sea. It is also confirmed that the orientation of the radiance detector is important. The viewing direction is optimal if it corresponds to the zenith angle of the sun, but only when the azimuth angle falls in a direction close to perpendicular to the plane of incidence of the solar rays. The source of the reliability of the presented results lies in the optical properties of the oils and, more specifically, in the spectral shapes of the refractive index and the absorption coefficient. If the water column contains dispersed non-oil substances with optical properties in the range of properties assigned to oils (crude oil and petroleum derivatives), detection by measuring the spectral indicator could give false results. However, the appearance of an increased value of the spectral index creates a situation that prompts the use of a chemical method to confirm the pollution of the sea with oil substances.

Author Contributions

Conceptualisation, O.Z. and P.J.; methodology, O.Z. and P.J.; formal analysis, O.Z.; investigation, O.Z.; data curation, O.Z.; software, P.J.; writing, O.Z. and P.J.; visualisation, O.Z. All authors have read and agreed to the published version of the manuscript.

Funding

This paper was founded by Gdynia Maritime University, grant No. WM/2022/PZ/05, and the Institute of Oceanology of Polish Academy of Sciences, statutory task I.3.

Institutional Review Board Statement

Not applicable.

Informed Consent Statement

Not applicable.

Conflicts of Interest

The authors declare no conflict of interest.

References

  1. Merlin, F.; Zhu, Z.; Yang, M.; Chen, B.; Lee, K.; Boufade, M.C.; Isaacman, L.; Zhang, B. Dispersants as marine oil spill treating agents: A review on mesoscale tests and field trials. Environ. Syst. Res. 2021, 10, 1–19. [Google Scholar] [CrossRef]
  2. Lai, Q.; Xie, Y.; Wang, C.; Wang, M.; Tan, J. Multiband directional reflectance properties of oil-in-water emulsion: Application for identification of oil spill types. Appl. Opt. 2021, 60, 6902–6909. [Google Scholar] [CrossRef] [PubMed]
  3. Haule, K.; Toczek, H.; Borzycka, K.; Darecki, M. Influence of Dispersed Oil on the Remote Sensing Reflectance—Field Experiment in the Baltic Sea. Sensors 2021, 21, 5733. [Google Scholar] [CrossRef] [PubMed]
  4. Fingas, M. Oil Spill Science and Technology, 2nd ed.; Elsevier: Amsterdam, The Netherlands, 2017. [Google Scholar]
  5. Dera, J.; Wozniak, B. Light Absorption in Sea Water, 4th ed.; Springer: Cham, Switzerland, 2007. [Google Scholar]
  6. Otremba, Z.; Zielinski, O.; Hu, C. Optical contrast of oil dispersed in seawater under windy conditions. J. Eur. Opt. Soc. Rapid Publ. 2013, 8, 13051. [Google Scholar] [CrossRef] [Green Version]
  7. Baszanowska, E.; Otremba, Z.; Piskozub, J. Modelling the Visibility of Baltic-Type Crude Oil Emulsion Dispersed in the Southern Baltic Sea. Remote Sens. 2021, 13, 1917. [Google Scholar] [CrossRef]
  8. Baszanowska, E.; Otremba, Z.; Piskozub, J. Modelling Remote Sensing Reflectance to Detect Dispersed Oil at Sea. Sensors 2020, 20, 863. [Google Scholar] [CrossRef] [PubMed] [Green Version]
  9. Baszanowska, E.; Otremba, Z.; Piskozub, J. Modelling a Spectral Index to Detect Dispersed Oil in a Seawater Column Depending on the Viewing Angle: Gulf of Gdańsk Case Study. Sensors 2020, 20, 5352. [Google Scholar] [CrossRef] [PubMed]
  10. Otremba, Z.; Piskozub, J. Modelling the Spectral Index to Detect a Baltic-Type Crude Oil Emulsion Dispersed in the Southern Baltic Sea. Remote Sens. 2021, 13, 3927. [Google Scholar] [CrossRef]
  11. Sagan, S. The Inherent Water Optical Properties of Baltic Waters. Diss. Monogr. Inst. Oceanol. PAS Sopot 2008, 21, 244. (In Polish) [Google Scholar]
  12. Otremba, Z. The impact on the reflectance in VIS of a type of crude oil film floating on the water surface. Opt. Express 2000, 31, 129–134. [Google Scholar] [CrossRef] [PubMed]
  13. Cox, C.; Munk, W.H. Statistics of the sea surface derived from sun glitter. J. Mar. Res. 1954, 13, 198–227. [Google Scholar]
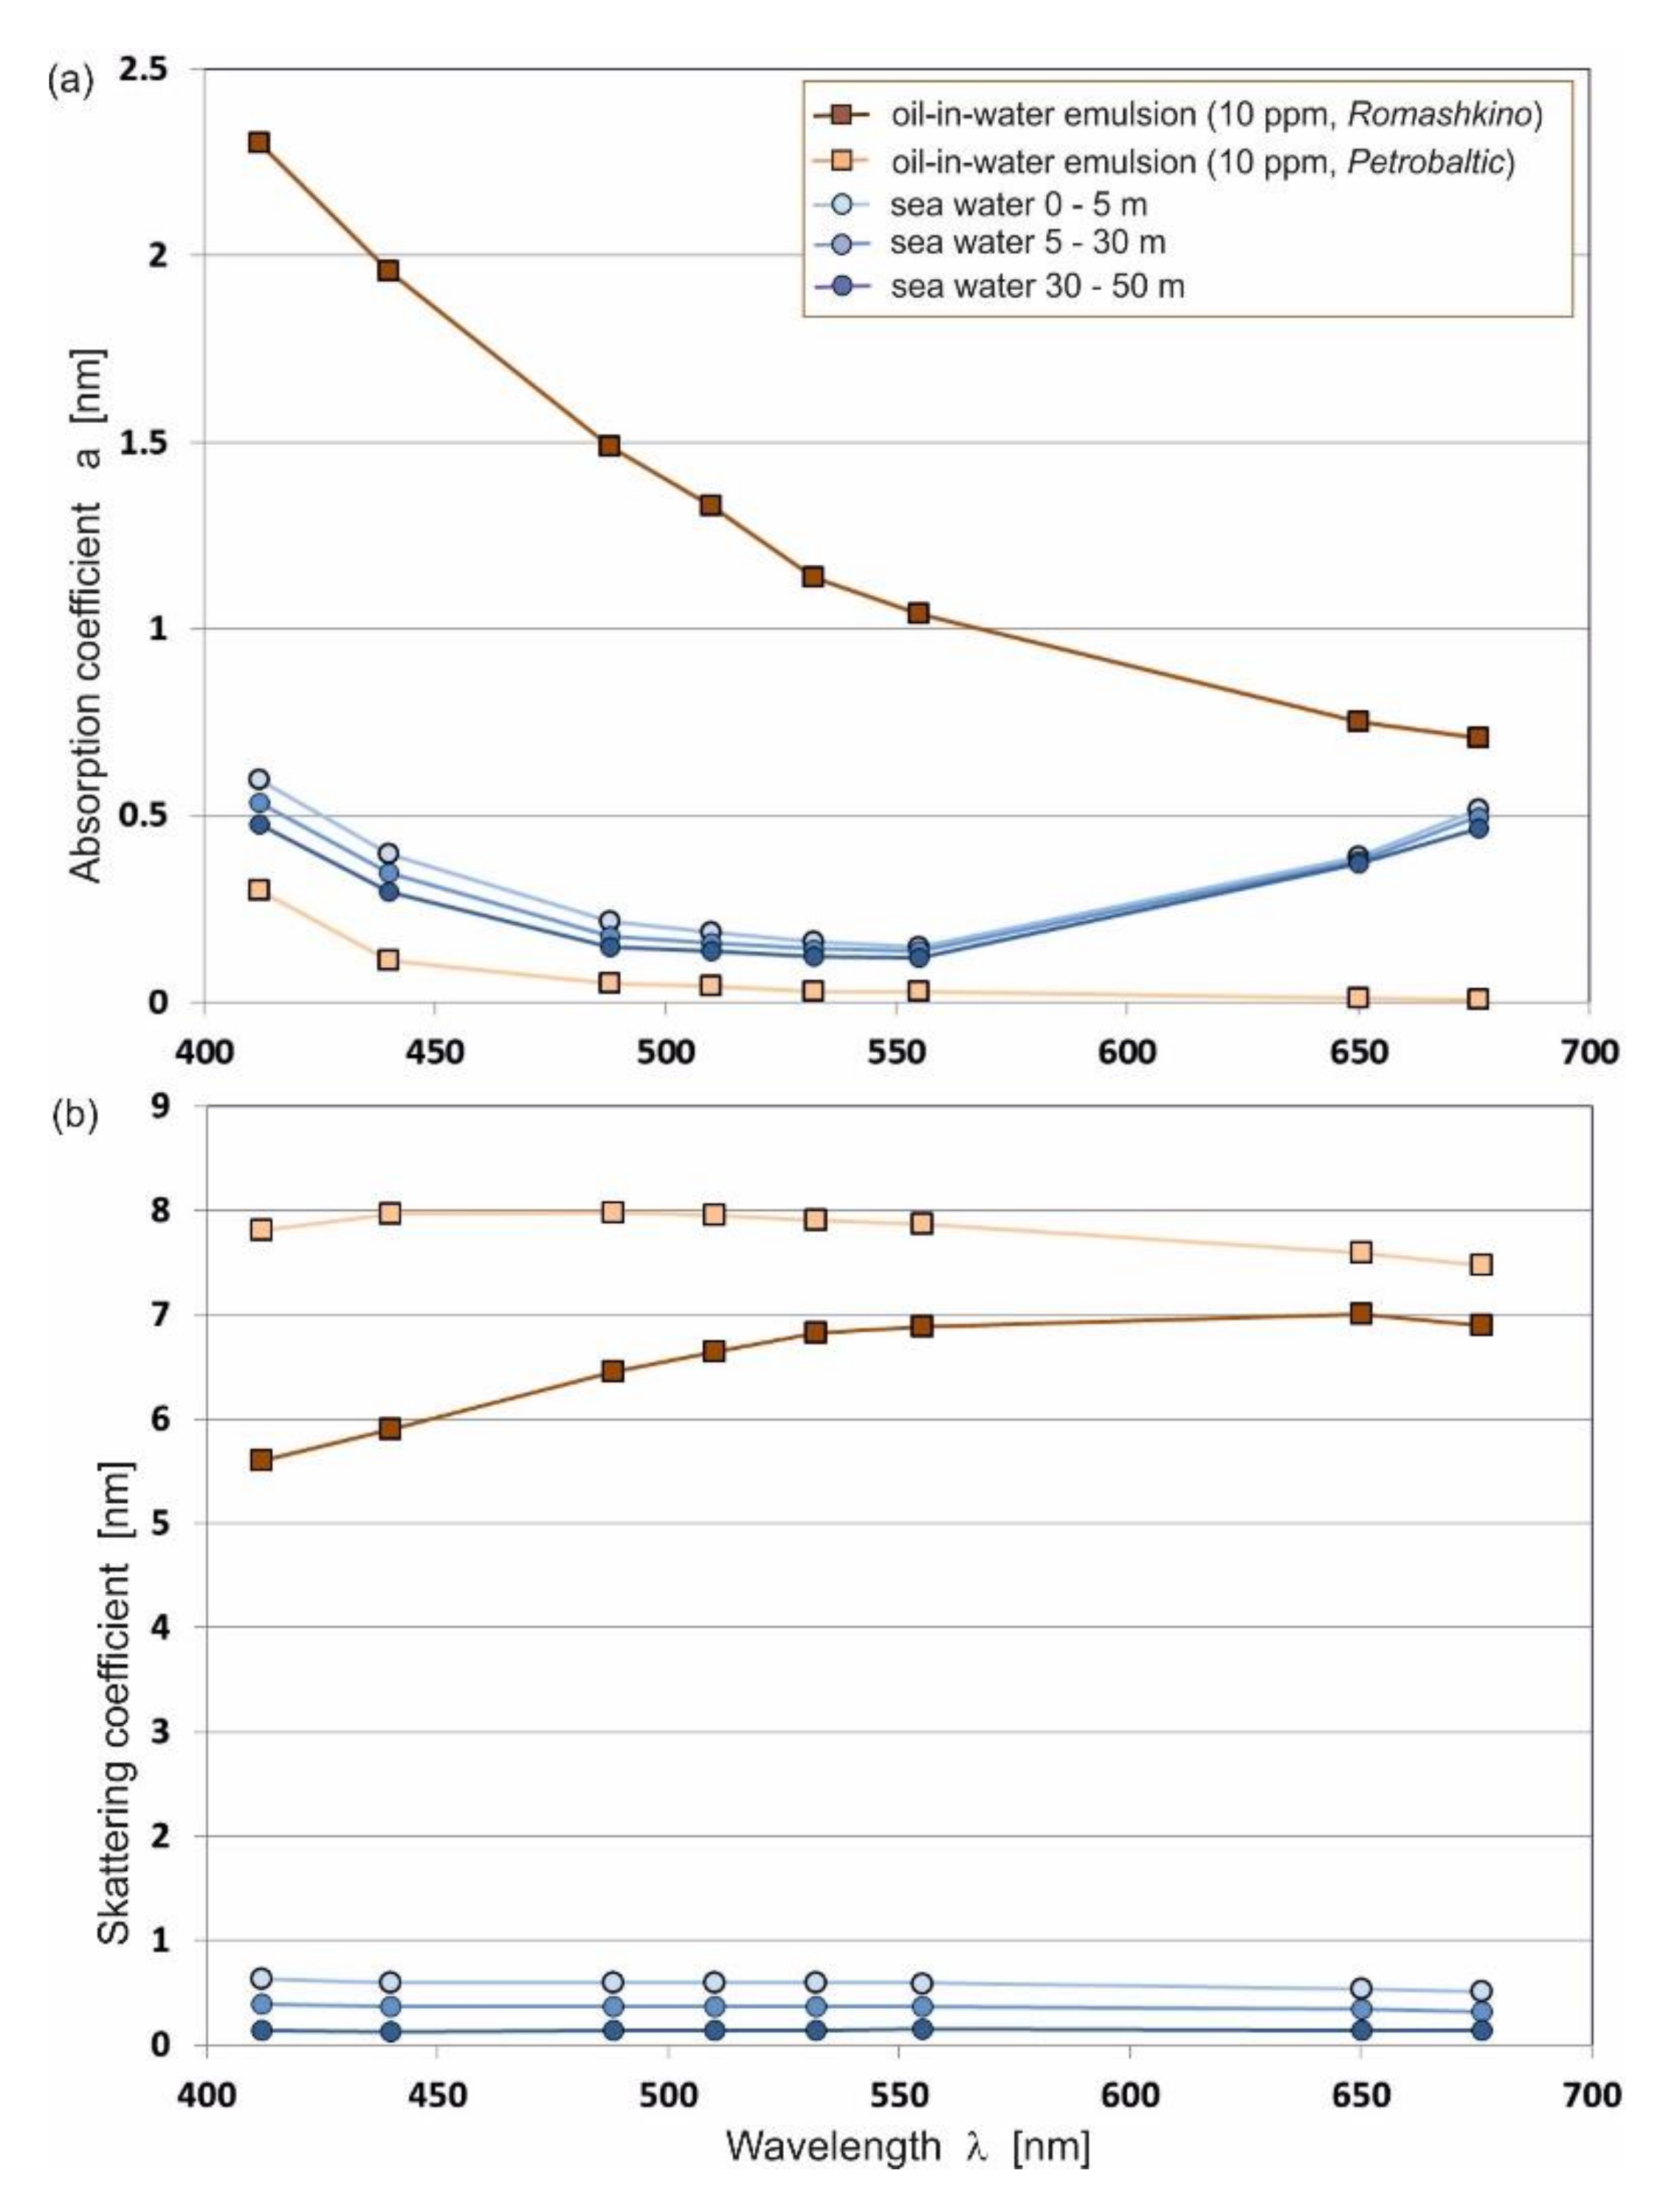
Figure 1. Spectra of both the absorption coefficient (a) and the scattering coefficient (b) of seawater and oil-in-water emulsions (10 ppm).
Remotesensing 14 00247 g001
Figure 2. Optical model of the sea basin for a sample wavelength (655 nm) applied for Monte Carlo simulations of radiative transfer.
Remotesensing 14 00247 g002
Figure 3. Spectral indices of the sea free from oil and in conditions of dispersed oil contamination for a wind-induced rough sea surface (2 m/s).
Remotesensing 14 00247 g003
Figure 4. Differences between the values of the spectral indices of water contaminated by dispersed oil and the values of the indices of oil-free water contamination for a wind-induced rough sea surface (2 m/s).
Remotesensing 14 00247 g004
Figure 5. Difference indices in cylindrical coordinates (left side, 2D maps; right side, 3D contour maps) for the various wind-induced sea surface states (wind speed is indicated on the upper left) from the Monte Carlo simulations for seawater polluted by Petrobaltic-type oil for a 10 ppm oil concentration.
Remotesensing 14 00247 g005
Figure 6. Difference indices as described in Figure 5, but for Romashkino-type oil.
Remotesensing 14 00247 g006
Publisher’s Note: MDPI stays neutral with regard to jurisdictional claims in published maps and institutional affiliations.