Article

Stand Structural Characteristics Derived from Combined TLS and Landsat Data Support Predictions of Mushroom Yields in Mediterranean Forest

by
Raquel Martínez-Rodrigo
1,2,*,
Cristina Gómez
2,3,
Astor Toraño-Caicoya
4,
Luke Bohnhorst
4,
Enno Uhl
4,5 and
Beatriz Águeda
1,2
1
Föra Forest Technologies, Campus Duques de Soria, E-42004 Soria, Spain
2
iuFOR-EiFAB, Campus Duques de Soria, Universidad de Valladolid, E-42004 Soria, Spain
3
Department of Geography and Environment, School of Geoscience, University of Aberdeen, Aberdeen AB24 3UE, UK
4
Chair of Forest Growth and Yield Science, TUM School of Live Sciences Weihenstephan, Technical University of Munich, Hans-Carl-von-Carlowitz-Platz 2, 85354 Freising, Germany
5
Bavarian State Institute of Forestry, Hans-Carl-von-Carlowitz-Platz 1, 85354 Freising, Germany
*
Author to whom correspondence should be addressed.
Remote Sens. 2022, 14(19), 5025; https://doi.org/10.3390/rs14195025
Submission received: 9 September 2022 / Revised: 4 October 2022 / Accepted: 7 October 2022 / Published: 9 October 2022

Abstract

:
Forest fungi provide recreational and economic services, as well as ecosystem biodiversity. Wild mushroom yields are difficult to estimate; climatic conditions are known to trigger temporally localised yields, and forest structure also affects productivity. In this work, we analyse the capacity of remotely sensed variables to estimate wild mushroom biomass production in Mediterranean Pinus pinaster forests in Soria (Spain) using generalised additive mixed models (GAMMs). In addition to climate variables, multitemporal NDVI derived from Landsat data, as well as structural variables measured with mobile Terrestrial Laser Scanner (TLS), are considered. Models are built for all mushroom species as a single pool and for Lactarius deliciosus individually. Our results show that, in addition to autumn precipitation, the interaction of multitemporal NDVI and vegetation biomass are most explanatory of mushroom productivity in the models. When analysing the productivity models of Lactarius deliciosus, in addition to the interaction between canopy cover and autumn minimum temperature, basal area (BA) becomes relevant, indicating an optimal BA range for the development of this species. These findings contribute to the improvement of knowledge about wild mushroom productivity, helping to meet Goal 15 of the 2030 UN Agenda.

1. Introduction

Remote sensing is an exceptional technology for applications in forest ecosystems [1], particularly for assessment of resources [2]. Remote sensing provides data with overall perspective [3] as well as powerful tools for monitoring forest dynamics [4] and the drivers of change [5]. Applications have become more detailed and specific with the improvement of data quality, storage capacity, and analysis techniques [6], and as a result of the information needs imposed by society, going from simple characterization to complex measure and modelling [7].
In the last decade, mushroom-related attributes such as presence, occurrence, and productivity have been modelled with a range of approaches, highlighting a growing interest in the prediction of these non-wood forest products [8,9,10], as they provide a wide range of ecosystem services. Moreover, fungi contribute to maintaining and augmenting the biodiversity of other taxa [11,12] and are considered for provisioning of economic and sociocultural services, as they are among the most appreciated edible non-wood forest products, particularly in Mediterranean areas [13], and they generate recreation and economic returns [14]. Therefore, predicting fungal yields may help the sustainable management of forest ecosystems and contribute to the achievement of the Sustainable Development Goal 15 of the 2030 UN Agenda for Sustainable Development [15].
The interaction among factors triggering mushroom production is complex and nonlinear [16]. Climatic and environmental parameters are paramount drivers of the naturally irregular productivity of mushrooms [17]. Climate parameters, particularly accumulated precipitation, have a strong influence on the fruiting time and total productivity [18]. Furthermore, the inter- and intra-annual irregularity of mushroom production related to precipitation events is being augmented by the climate change effects which, in Mediterranean environments, cause the fruiting of mushrooms to be increasingly scarce [17,18,19]. In addition to climate, site-specific characteristics such as soil [20,21] and topography drive mushroom specificity [22]. Habitat spatial and temporal fragmentation also play a role in maintaining diversity in communities of ectomycorrhizal fungi [23].
An additional important factor in mushroom development is the forest structure [24]. Here, stand density was found as a key driver by Bonet et al. (2008, 2010) [25,26] when modelling total mushroom production in pines of northern Spain, and Ágreda et al. (2013) [27] pointed out stand age as a particularly relevant factor in Mediterranean forests. At the landscape scale, the structure and composition of forest stands have been found to be important for the distribution of mushroom yields [8,28]. Therefore, forest management practices such as thinning, clearcutting, or planting, as well as natural disturbances, influence mushroom yields distribution and quantity [24,29,30].
Overall, the climatic and structural parameters driving mushroom productivity can currently be measured or estimated at medium to large scale with high precision and spatial detail employing remote sensing technologies. Remotely sensed data have capacity for estimation of forest structural parameters and for assessment of forest vigour and condition at different spatial scales. Light Detection and Range (LiDAR) is the preferred technology for characterization of structure due to the high precision its data provide, the lower cost, and wide coverage relative to field data [31]. LiDAR is being increasingly employed in all its variants (aerial, terrestrial, and mobile) for multiple applications [32]. In particular, Terrestrial Laser Scanning (TLS) provides enormous detail about interior canopy features and is a natural choice for studies of stem allometry and biomass, simulation of light environments, testing of photosynthesis, and production models [33]. Optical sensors acquiring frequent data from satellite platforms, like those from the Landsat Programme, provide comparative reflectance values through the year that respond to the vigour and phenology state of forest stands. Individually, and better still in combination, remote sensing active and passive technologies may facilitate, through the approximation of forest structural parameters and the estimation of primary productivity, the assessment of mushroom yields.
Despite the advantages of using remote sensing, there have been yet few attempts to employ this kind of data to explain fungal dynamics. Recently, some efforts have incorporated remotely sensed measures in the modelling of mushroom traits. For example, Thers et al. (2017) [34] found airborne LiDAR-based structural variables more explicative than botanical and environmental variables when modelling fungi species richness and composition in Denmark. Peura et al. (2016) [35] demonstrated that LiDAR structural variables are more explanatory than field-measured variables when modelling the occurrence of forest fungi in temperate forests of Germany. Similarly, Olano et al. (2020) [18] demonstrated that mushroom yields are linked to forest primary productivity and to soil moisture—inferred from Landsat NDVI values and the ESA CCI combined Soil Moisture dataset respectively—in Mediterranean ecosystems.
All this information leads to hypothesise that the combined use of different types of remote sensing data has a strong potential for estimating mushroom yields. The specific objectives of this work are: (i) to evaluate the capacity of multitemporal optical variables (primary productivity, vigour, and condition) and TLS-derived variables (structure) to predict mushroom production in Mediterranean forests; (ii) to demonstrate whether the forest productive capacity, and the volume of total aboveground biomass in particular, determine mushroom production, and (iii) to assess whether the variables that determine total mushroom production in Mediterranean ecosystems are the same as for a specific mushroom species.

2. Materials and Methods

2.1. Study Area and Experimental Design

Mushroom data were collected from forests dominated by Pinus pinaster Ait. in the province of Soria (autonomous region of Castilla y León), in Central Spain (Figure 1). The area (~17.000 ha) is relatively flat, with an elevation ranging from 1000 m to 1200 m a.s.l. Climate is Mediterranean continental, with cold winters and a summer drought period from July to August. Total annual precipitation is, on average, 511 mm, and rain events occur mainly in spring and autumn. Pinus pinaster forests grow over sandy soils with high permeability and low nutrient content.
Pinus pinaster is a widely distributed species in the Mediterranean basin, employed in protective and productive reforestations due to its frugality and productivity of wood, resin, and fungi [36]. Several edible mushroom species such as Hygrophorus latitabundus Britz, Lactarius deliciosus (L.) S.F. Gray, Macrolepiota excoriata (Schaeff.) M.M. Moser, Macrolepiota konradii (Huijsm.), Macrolepiota mastoidea (Fr.) Singer, Macrolepiota procera (Scop.) Sing, Suillus luteus (L.) Roussel, Tricholoma portentosum (Fr.) Quél, and Tricholoma terreum (Sch.) Kumm can be found in these forests [37].
Figure 1. Characterization of the study area: (a) overall location in the Mediterranean basin where Pinus pinaster distributes (source: Caudullo et al., 2017) [38]); (b) location and distribution of the network of plots (numbered yellow dots); and (c) climograph (source: AEMET).
Remotesensing 14 05025 g001
Seventeen permanent plots of 150 m2 (5 × 30 m) have been established in this forest since 1997, with an external fence to prevent harvesting and trampling. Plots were located applying a stratified design to represent all forest structures. Sporocarps, the fungi fruiting bodies, were sampled on a weekly basis during the main fruiting period, which is September to December. All sporocarps within the plots were collected, fresh-weighted, and identified to the species level (see Ágreda et al., 2015 [17] for details).

2.2. Mushroom Yield Data

A database with values of the annual mushroom production at the plot level records the inside-plot yields, indicating species, number of individuals, and biomass per species as collected every week. Since these forests are slow-growing and there were no silvicultural treatments in the last decade, we considered that for this period the forest structure remained stable. We worked with the last 10 years of the database (2012–2021), a period in which the forest structure can be characterised and considered stable.
Annual values of total biomass (g) were calculated with all mushroom species in a single pool. Additionally, total biomass of the main commercial species, i.e., saffron milk cap (Lactarius deliciosus), was also evaluated. Therefore, we built a ten-year time series (2012–2021) of annual mushroom yields for all species in a pool, and of saffron milk cap individually (Figure 2). In total, 295.15 kg of mushrooms were collected, of which 53.6 kg (18.16%) were Lactarius deliciosus, the most appreciated edible mushroom species in the area (Figure 2).

2.3. Climatic Data

Ten years (2012–2021) of precipitation and temperature time series were retrieved from the AEMET (Spanish Meteorological Agency, http://www.aemet.es, accessed on 8 September 2022) meteorological station in Soria. From the original daily database, we calculated the accumulated precipitation of the autumn season (September, October, and November) and the average monthly minimum temperature in this season. These parameters are known to be the most relevant climatic variables for estimation of Lactarius deliciosus productivity in the study area, which is the most relevant species in these forests [18].

2.4. Forest Structural Measurements

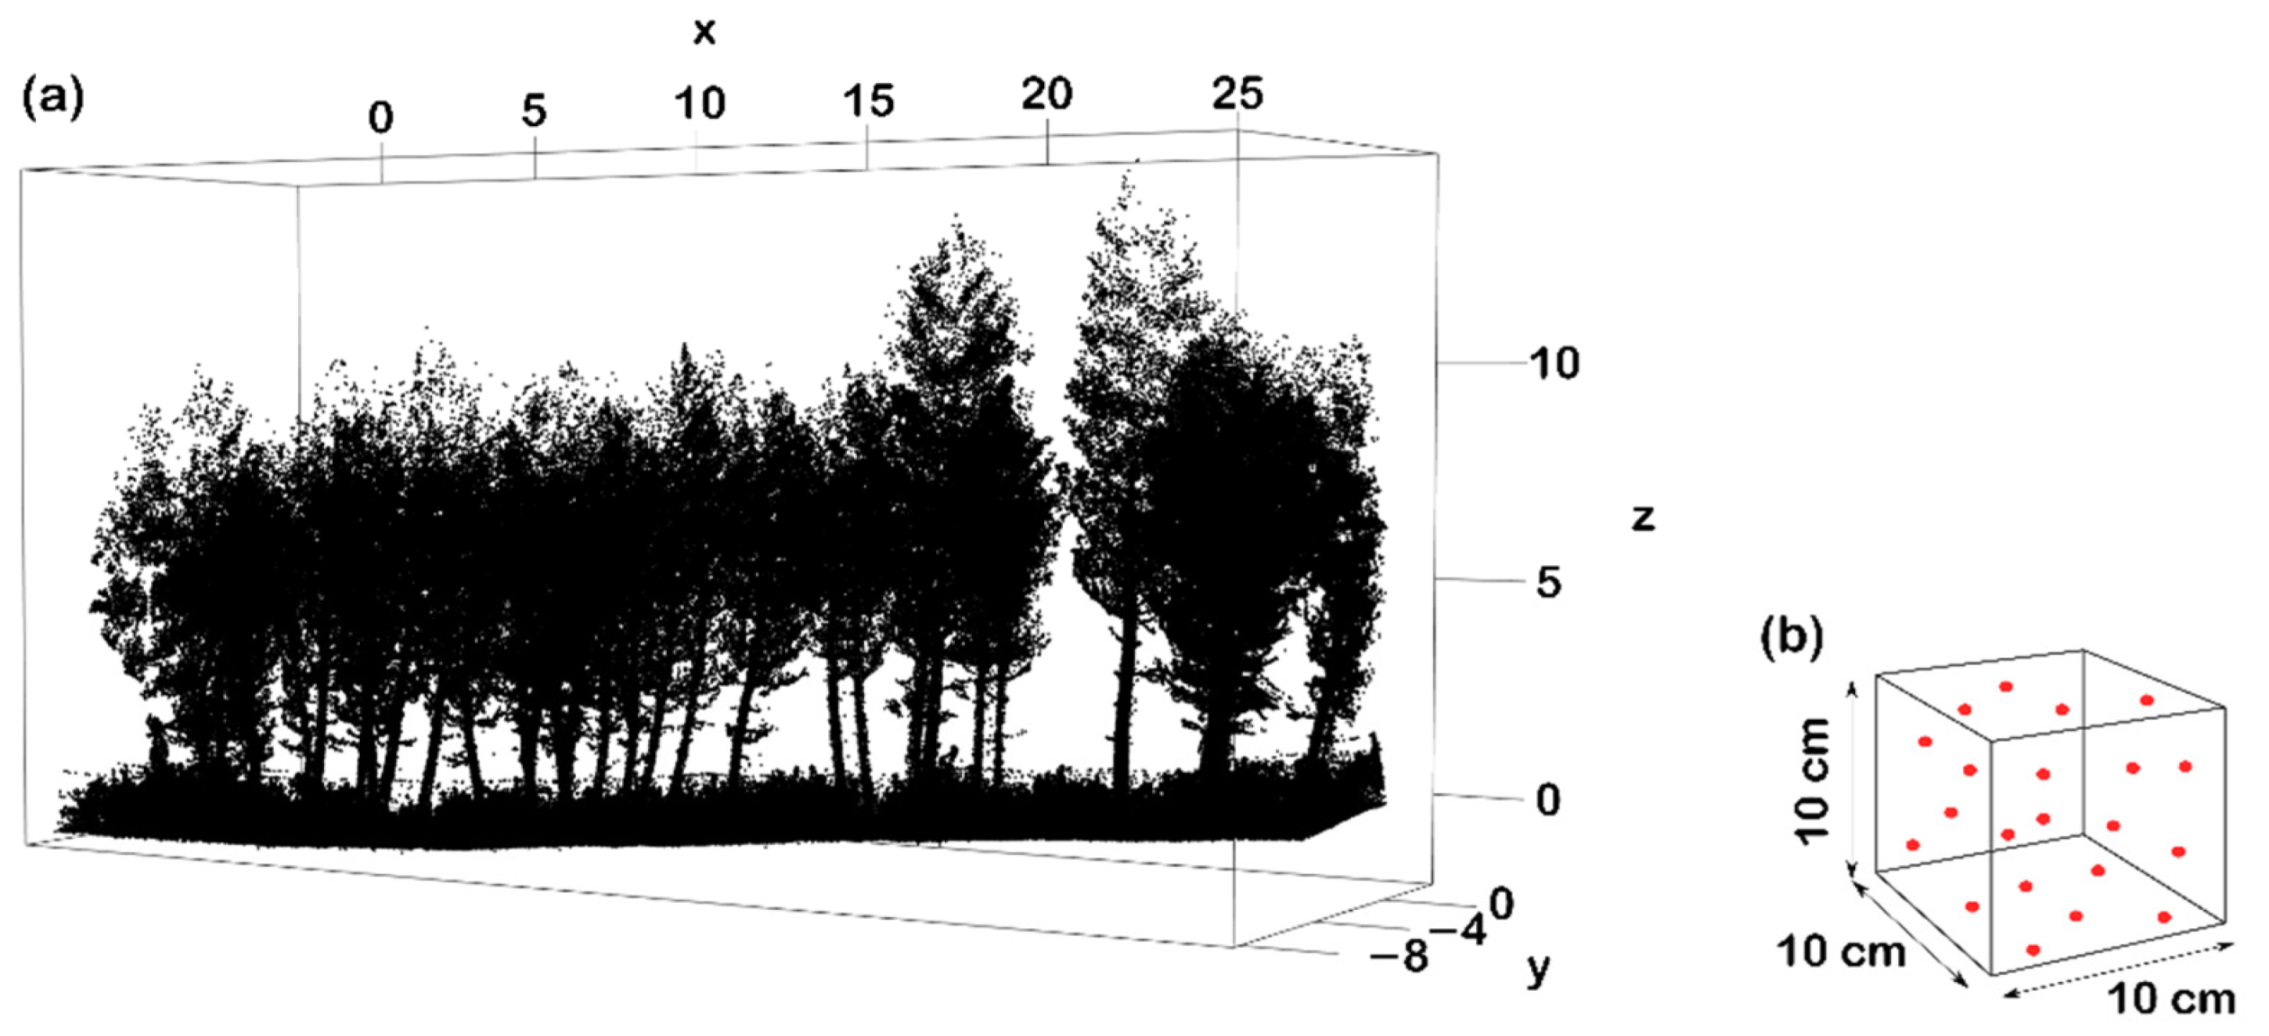
To characterise forest structure at the plot level and to estimate overall vegetation volume of biomass, Terrestrial Laser Scanner (TLS) measurements were acquired in February 2022. A GeoSLAM mobile TLS with six sensors was thoroughly walked through each plot, retrieving very dense point clouds (300,000 points per second, a range of 100 m, and a relative accuracy up to 6 mm depending on the environment). The original point clouds were clipped to each plot area with proprietary software (Figure 3a). The resulting point clouds were used for estimation of overall vegetation volume employing the VoxR package in R [39], voxelizing the point cloud with a voxel size of 10 cm (Figure 3b). The stand volume is the sum of the voxels multiplied by their size.
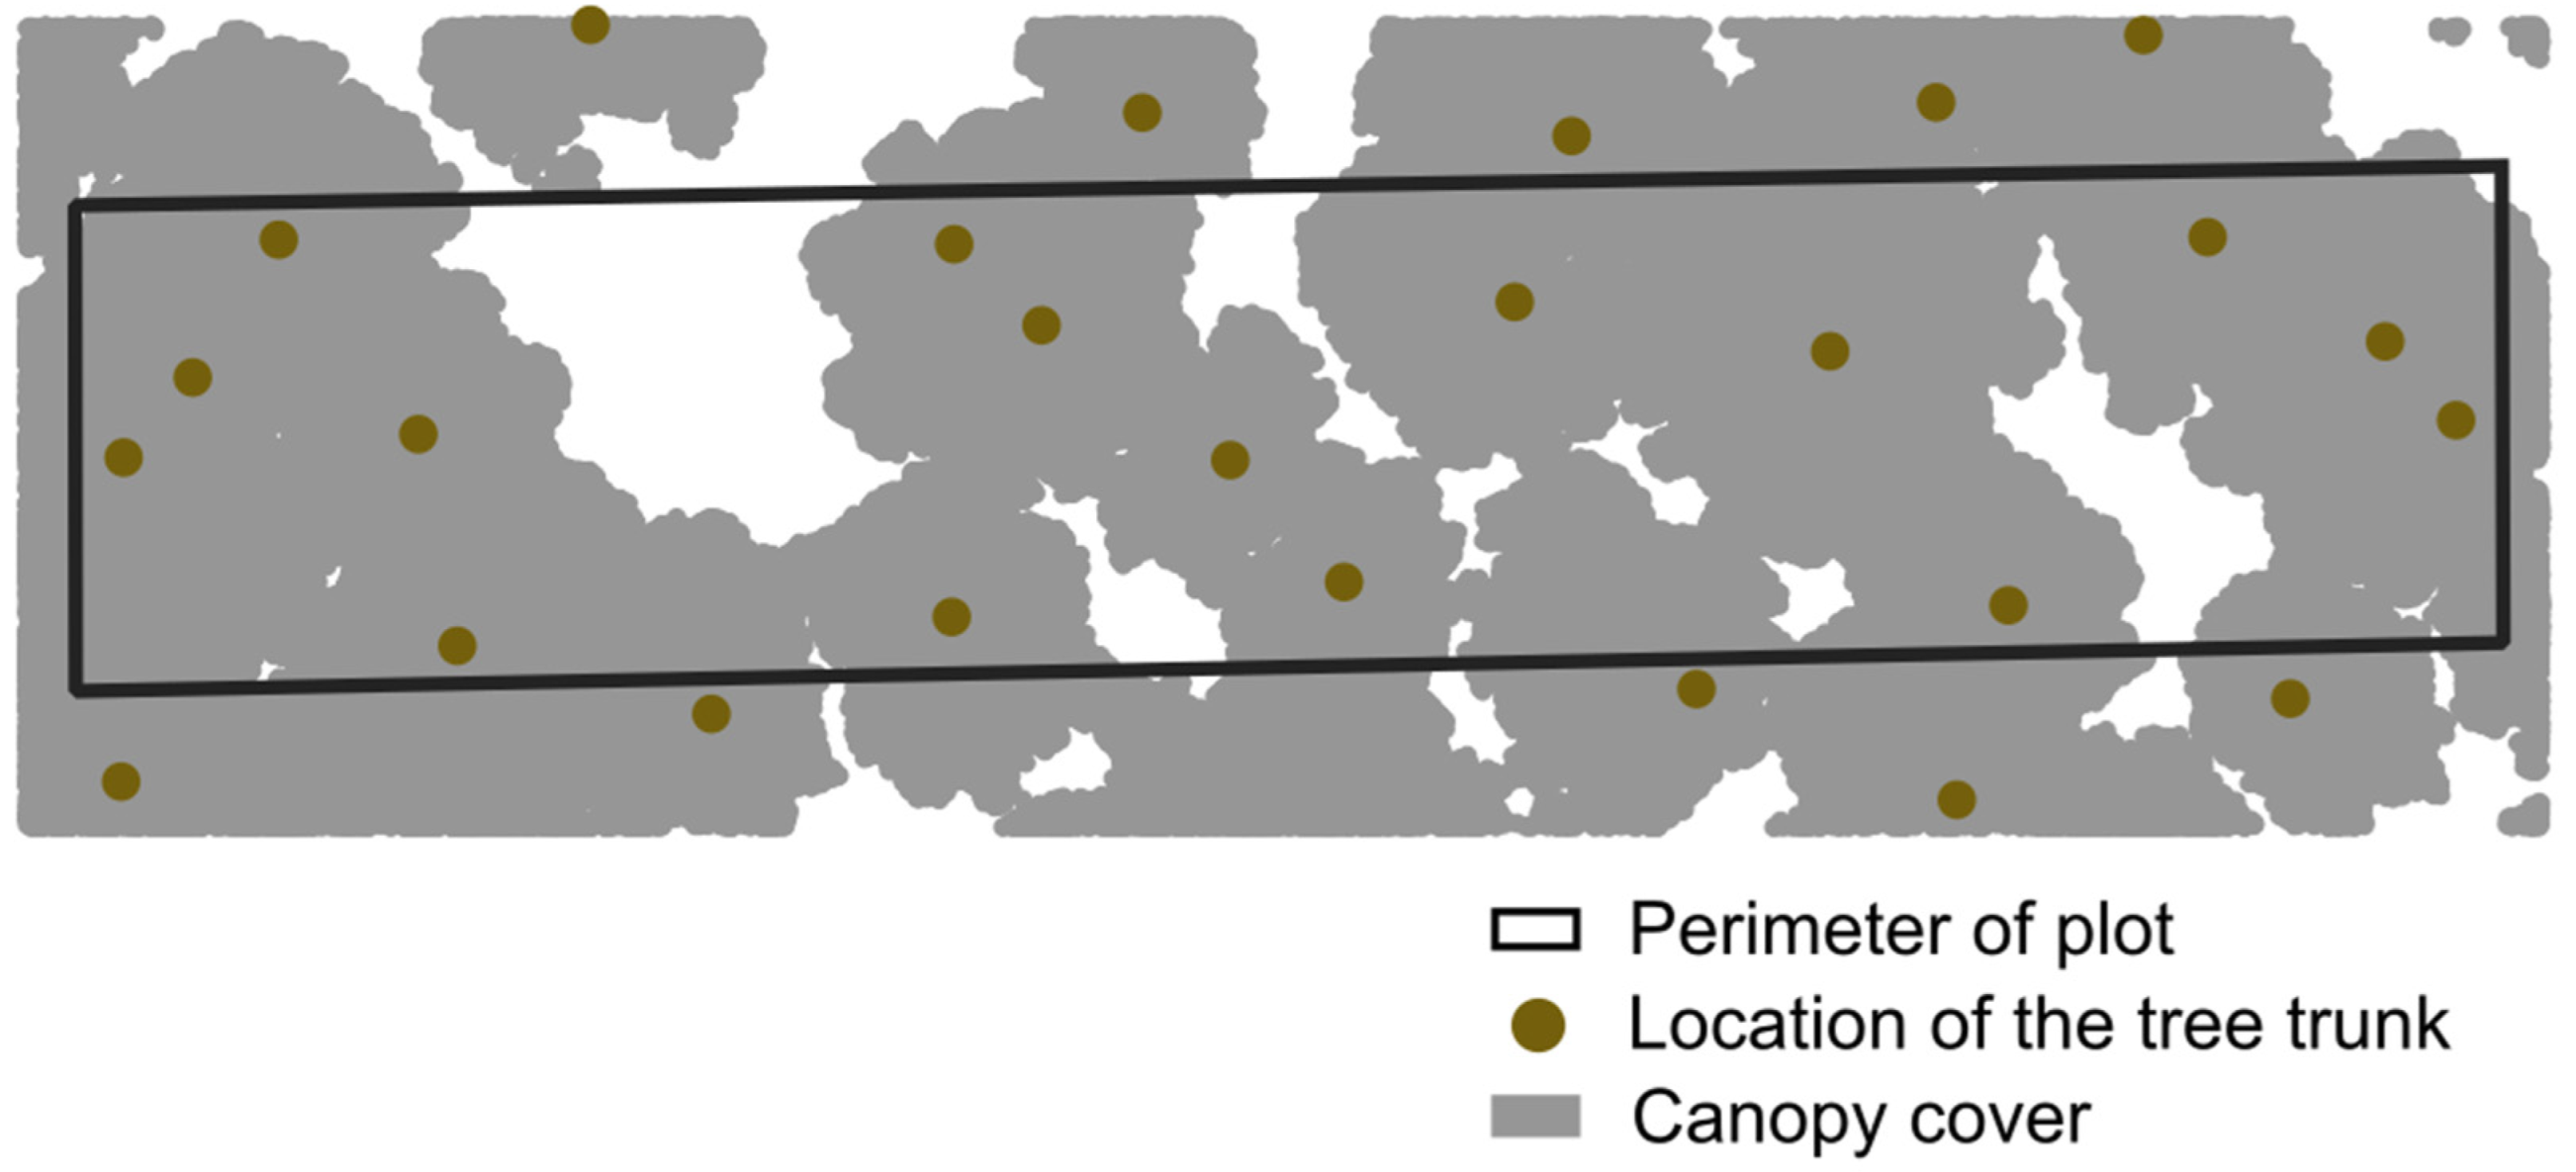
From the TLS point cloud, we also derived the percentage of canopy cover. To calculate the percentage of canopy cover, we considered the crowns of trees shading any part of the plot, including those which stand outside the plot fence. We removed the lowest 3 m from the point cloud to ensure isolation of the trees’ canopy. The value of 3 m is an arbitrary threshold as, in our experience, this is enough to ensure that the ground vegetation is not included. Afterwards, we voxelized the point cloud with a voxel size of 5 cm using the VoxR package and calculated the canopy cover for each plot as the ratio of the area occupied by tree crowns to the plot area (Figure 4).
To complement the structural characterization of the plots, we calculated the Stand Density Index SDI [40] and the total basal area (BA). In summer 2020, we measured all tree diameters and heights using a digital calliper and a hypsometer (VERTEX), respectively.

2.5. Landsat Data

The Normalised Difference Vegetation Index (NDVI, [41]) is the most frequently used spectral index in remote sensing [42]. Algebraically, it is the ratio-normalised difference of infrared minus red (NIR − Red/NIR + Red) and is interpreted as a measure of the vegetation vigour in a given time (e.g., [43]). When NDVI values are compared between two times, this difference reflects the capacity of vegetation to produce energy, i.e., its primary productivity during the period considered [44].
In this work, we calculated NDVI values from Landsat imagery acquired by the Thematic Mapper (TM), Enhanced Thematic Mapper Plus (ETM+), and Operational Land Imager (OLI) sensors from 2012 to 2021. Since the annual primary productivity is represented by the difference between the season maximum and minimum NDVI values [44], our target dates for selection of imagery were 14 February (winter) and 15 August (summer), but these dates were flexible to accommodate orbital cycles and cloudiness. Average values of all 30 m pixels intersected by the field plots were retrieved, and the absolute value of the difference between summer and winter NDVI was evaluated and assigned to each plot.

2.6. Statistical Analysis

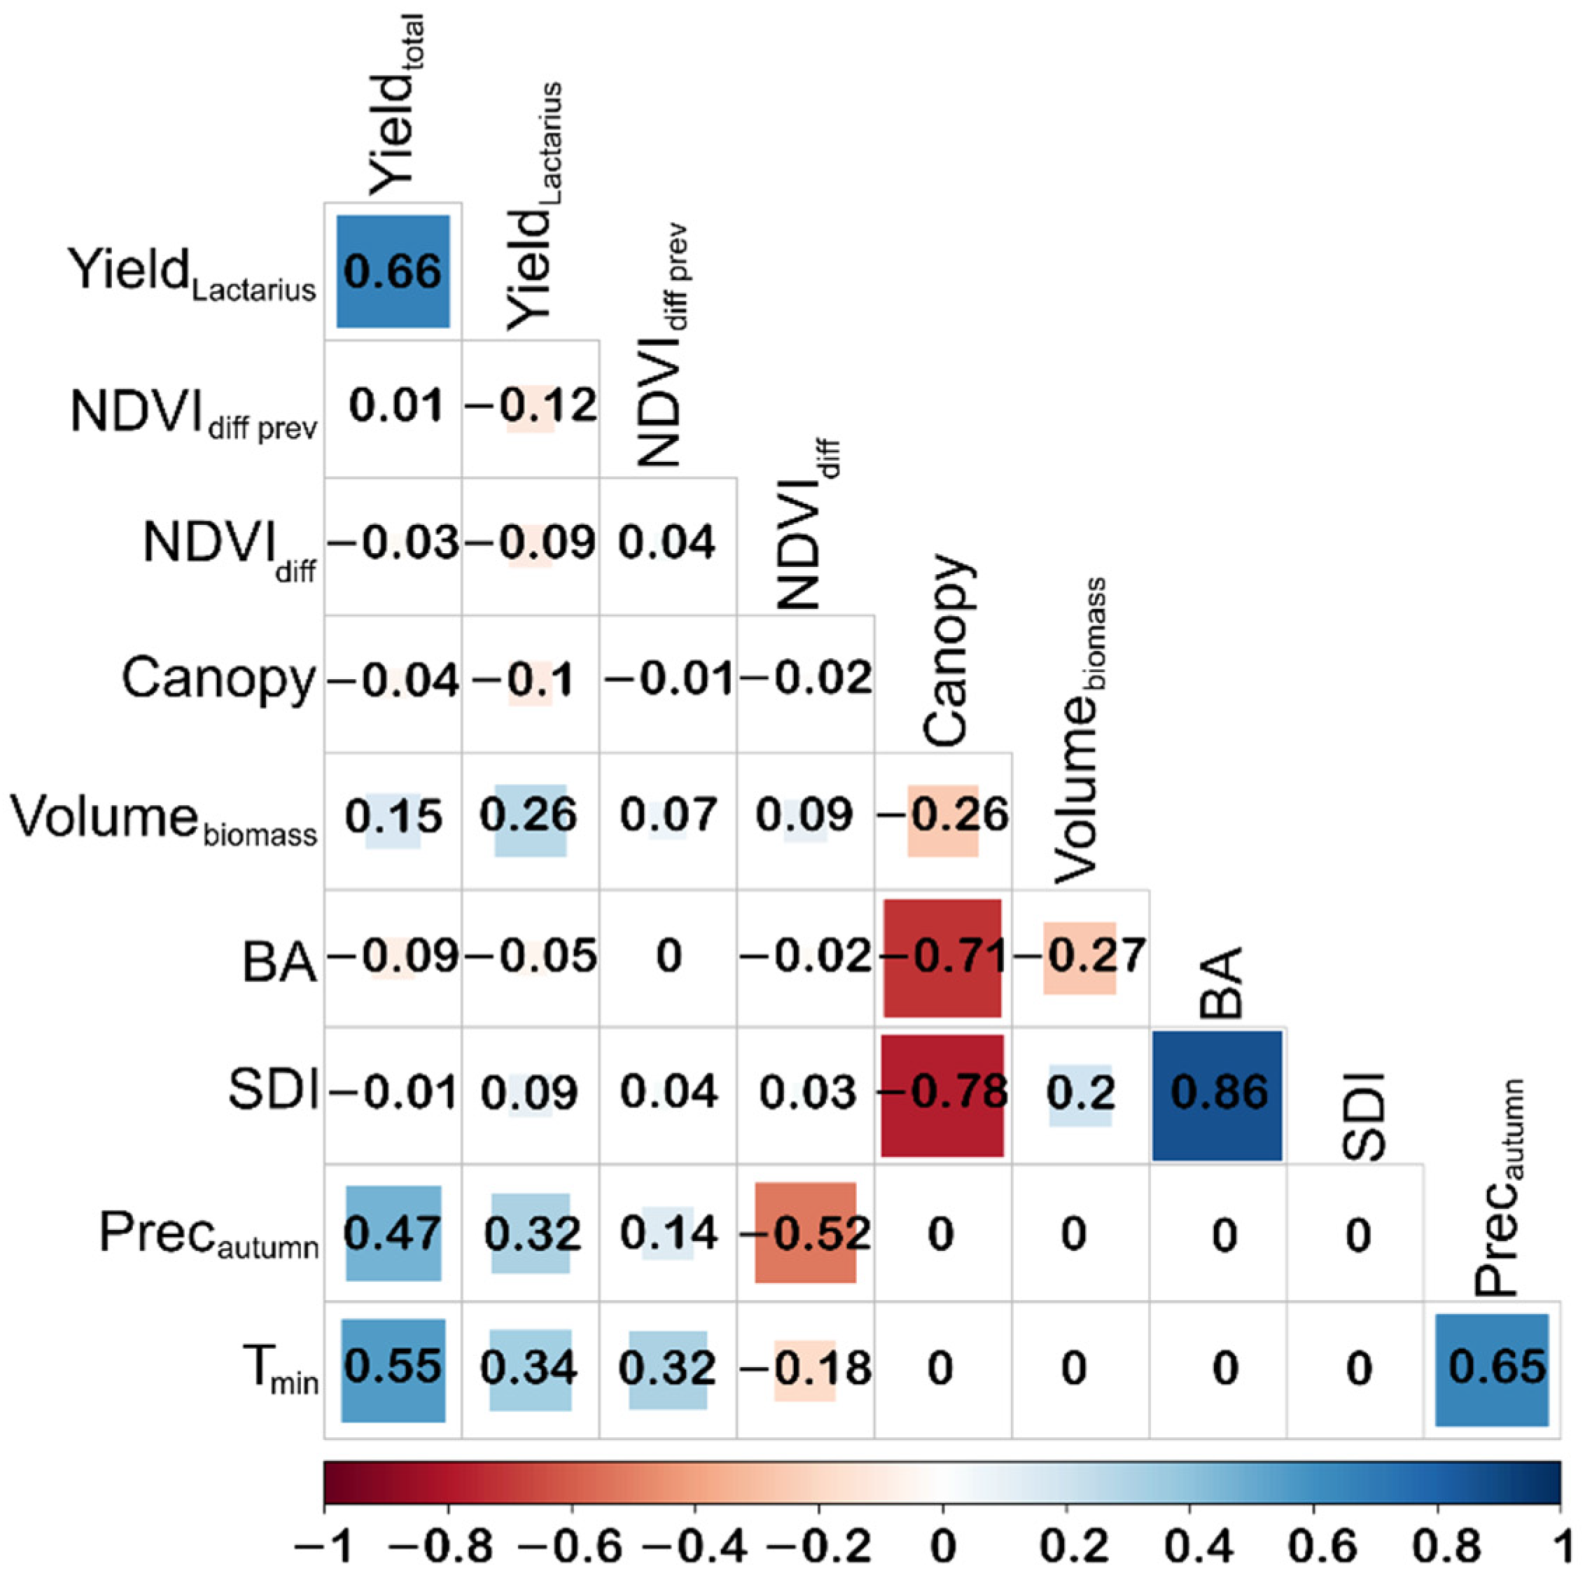
The statistical analysis to predict all mushroom and Lactarius deliciosus yields started from a database with eight covariates (Table 1). To get some understanding of the relationships between yields and the climatic, structural, and primary productivity predictors, and to select the most explanatory ones, we explored Pearson correlations between each pair of variables (Figure 5). SDI was highly correlated with basal area (R = 0.86); therefore, only one of them was included in the models to avoid collinearity [45]. The correlation between all mushroom yields and Lactarius deliciosus yields (R = 0.66) provided confidence in the moderately high contribution of the latter to the complete pool. Furthermore, despite the high values of correlation found between SDI and Canopy (R = −0.78) and between BA and Canopy (R = −0.71), both SDI and BA were candidates in the models as they are evaluated from different data sources.
Unravelling the complex relationship between mushroom yield and its drivers may require powerful statistical tools. Generalised Additive Mixed Models (GAMM) are flexible in modelling complex variables and facilitate identification of the interaction between non-linear factors. Therefore, GAMM models were most suitable to predict mushroom yields with linear and non-linear variables, being more efficient and easier to interpret for all potential users. In addition, GAMMs were used with a random term, which in our case accounts for measuring errors at the plot level. The predictor function for a GAMM (η) has this general formula (Equation (1)):
η (X1 ij, …, Xq ij, K1 ij, …, Kn ij) = α + β1 · X1 ij + … + βq · Xq ij + f1 K1 ij + … + fn Kn ij + aj + ε∼N(0,σ2)
where X1…Xq, K1 …Kn is a set of n explanatory variables, β1 …βq are regression parameters, f1 …fn are nonparametric smoother functions, aj is the random effect at the plot level, and Ɛ is the error term [46]. The indices i and j denote the ith year of yield data and the jth plot of the experiment, respectively.
Prior to the application of GAMM models and to assure its suitability, we tested linear regressions. For each modelling case (overall and Lactarius deliciosus), we tested all possible combinations and interactions of variables with the dredge command of the MuMin package in R. Based on the Akaike Information Criterion (AIC) [47], we selected the best model. Given the poor results obtained by the linear regression tested in a first step (R2 = 0.3 for all mushroom and R2 = 0.2 for Lactarius deliciosus models), GAMM models were built with mgcv package [48,49], observing the most explanatory variables that were selected in the previous step. We plotted the relationships among variables for a visual exploration and interpretation of the results, since GAMMs are better interpreted by visual examination than by statistical significance [50].

3. Results

Two models, one for the entire mushroom assemblage and one for Lactarius deliciosus only, were developed, including climatic and forest structural variables as well as primary productivity as predictors.
In the best model for the entire set of mushrooms, the adjusted coefficient of determination (R2) was 0.49 and the AIC was 2954.352. The actual model is represented by the following equation (Equation (2)):
Yieldtotal = f1(Precautumn) + f2(Volumebiomass, NDVIdiff) + f3(SDI) + f4(Canopy, Tmin) + random + Ɛ
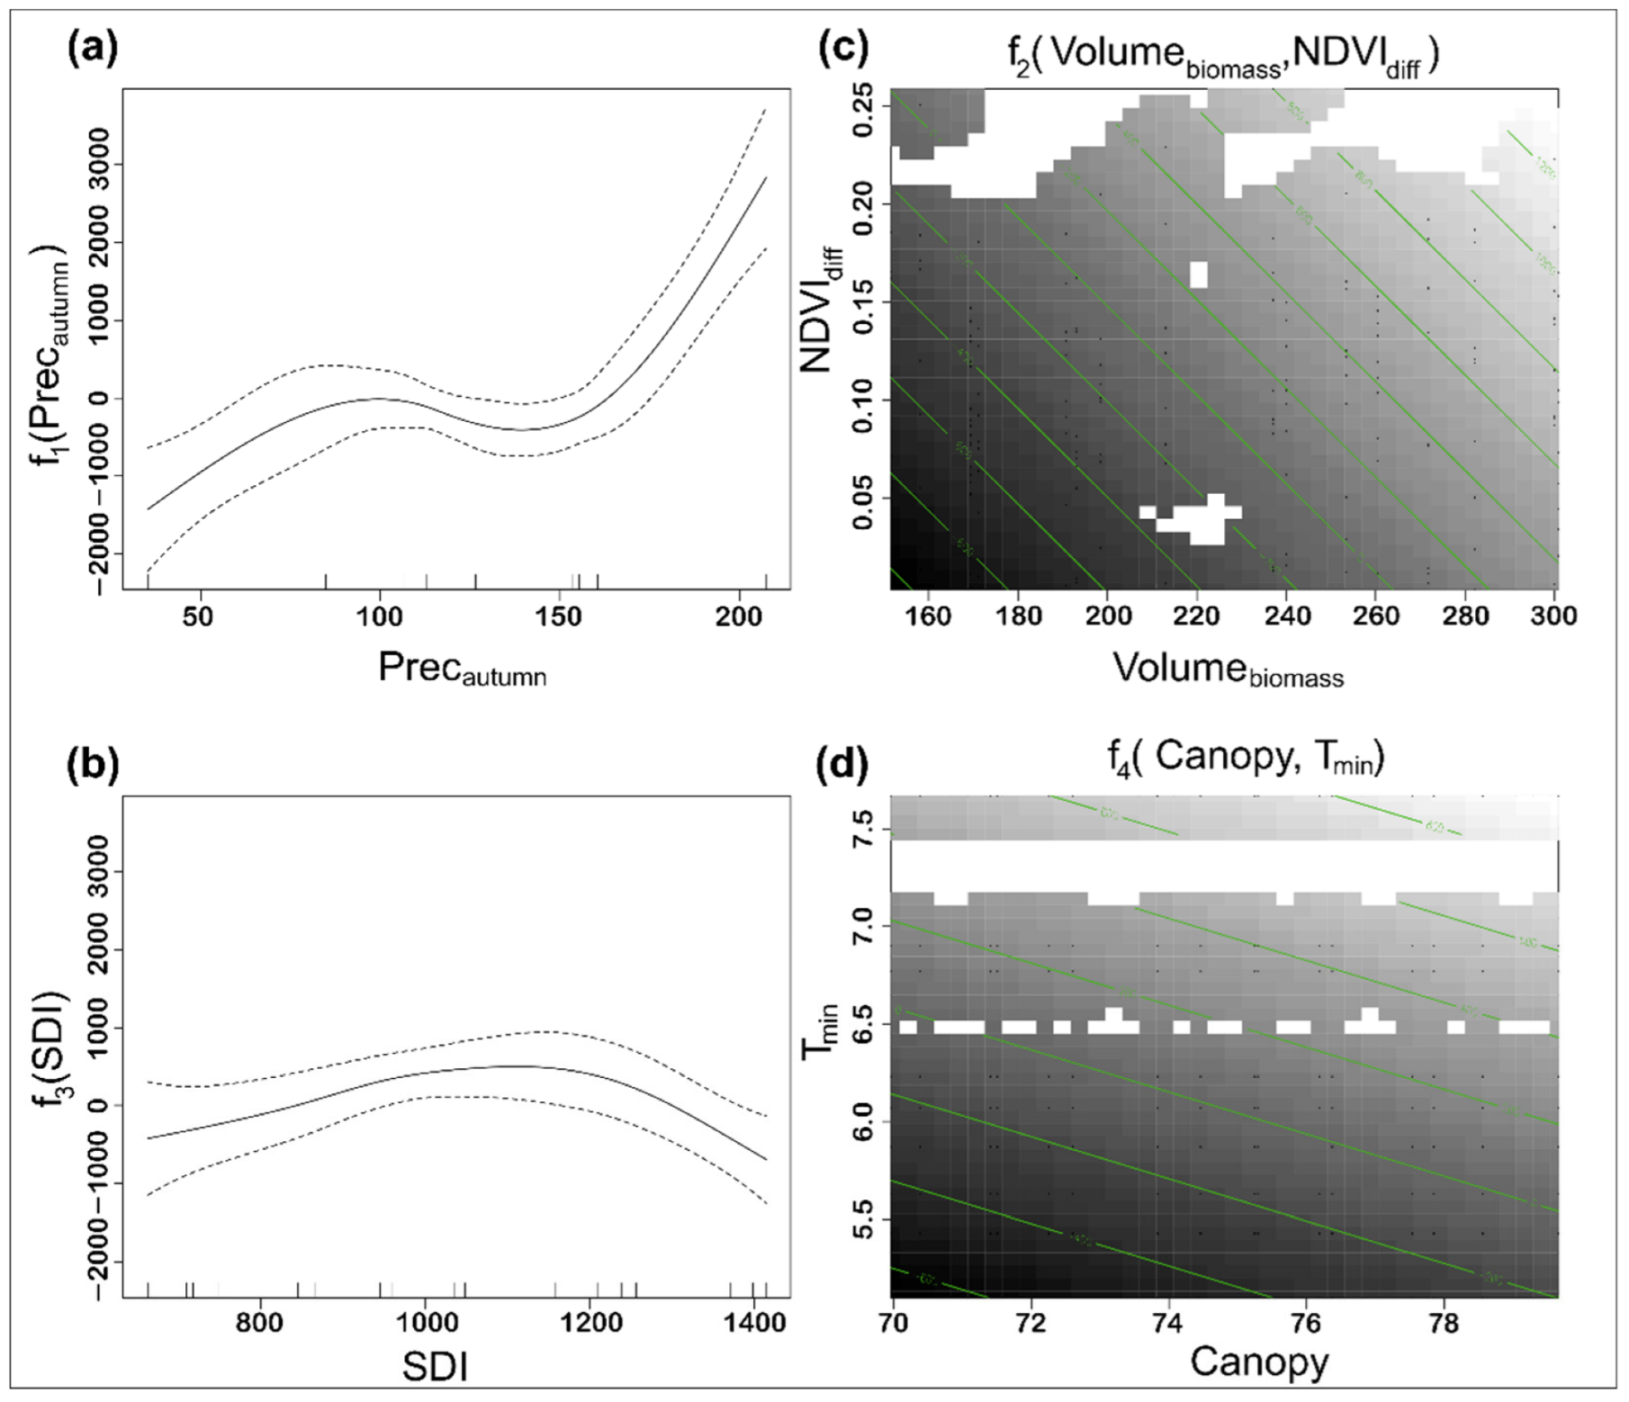
where fi are the nonparametric smoother functions summarised in Table 2. The non-linear parameters are represented in Figure 6 for visual interpretation.
The edf (effective degrees of freedom) values in Table 2, which provides a measure of the linearity of the relationship between variables [51], showed that mushroom yield has a highly non-linear relationship with autumn precipitation and SDI and has a non-linear relationship with the interactions between Volumebiomass and NDVIdiff and between canopy cover and Tmin.
Increased rainfall during the autumn months (Precautumn > 150) was associated with an increment in the mushroom yield, but there was no positive effect with Precautumn below this value (Figure 6a). There was an optimum relationship between stand density and mushroom production with highest production at SDI values between 1000 and 1200; however, for higher SDI values the mushroom yield decreases (Figure 6b). The interaction between plot Volumebiomass and NDVIdiff (Figure 6c) indicated that mushroom yield increases with increasing Volumebiomass and higher primary productivity. The interaction between Canopy and Tmin (Figure 6d) indicated that mushroom yield is higher when the minimum temperature in autumn and the canopy cover are both higher.
Visualising the common effect of SDI and NDVIdiff on mushroom yield facilitates its interpretation (Figure 7). For an SDI value of approximately 650, the predicted yield of all mushrooms together is lowest. It increases when stand density is rather high (SDI 950) but decreases again at even denser stands (SDI 1250). Note that the effect of NDVIdiff on the mushroom production is even stronger. Between NDVIdiff 0.05 and 0.25, mushroom production increases by approx. 800 units.
The model generated for Lactarius deliciosus (R2 = 0.3, AIC = 2658.378) is represented in Equation (3), and its parameters are summarised in Table 3.
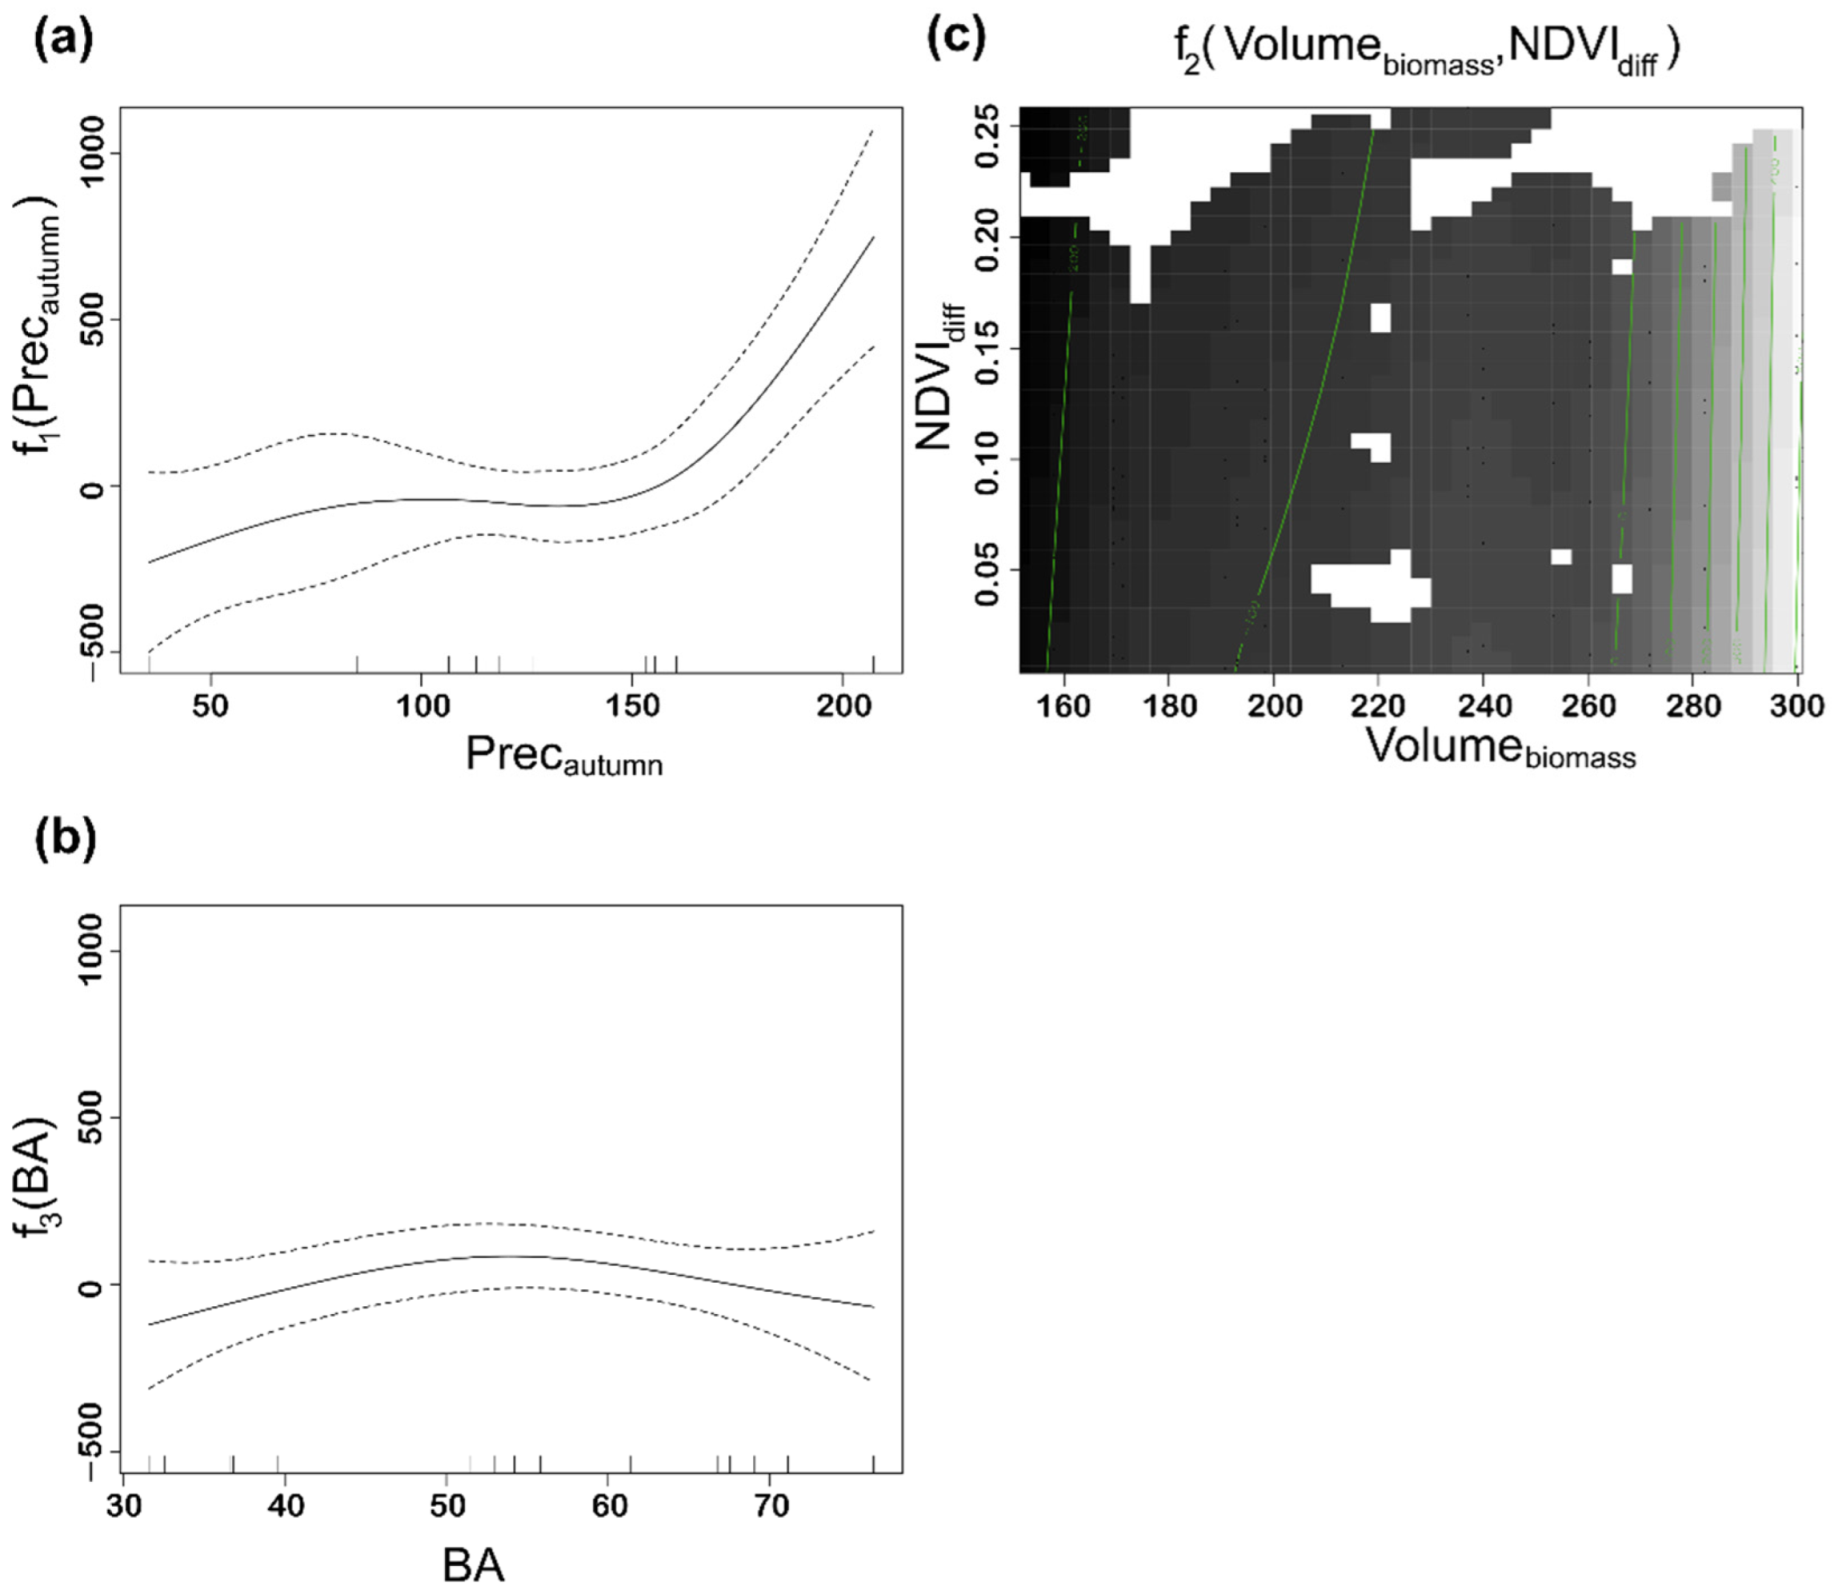
YieldLactarius = f1(Precautumn) + f2(Volumebiomass, NDVIdiff) + f3(BA) + random + Ɛ
where, as before, fi is a nonparametric smoother function. Similar to the previous case, in Figure 8, the non-linear parameters are displayed for visual interpretation.
In this case, the edf indicates that Lactarius deliciosus yields have a highly non-linear relationship with the autumn precipitation and with the interaction between vegetation biomass and primary productivity, and that for basal area the relationship is less pronounced.
For an optimal yield of Lactarius deliciosus in Mediterranean dry forests of P. pinaster, various circumstances are required: abundant rainfall in the autumn months, high values of the interrelationship between Volumebiomass and NDVIdiff (primary productivity), and BA not exceeding 55–60 m2 ha−1. Interestingly, when BA exceeds 60 the Lactarius deliciosus yield is lower (Figure 8).

4. Discussion

Mushroom production is an ecosystem service highly demanded by society in the study area, not only because of the touristic and gastronomic resource that the exploitation of edible species represents but also for its important role in the functioning of ecosystems. According to the latest monitoring report on SDG 15 target in 2022, the risk of species extinction is increasing at a rate unprecedented in history [52]. Fungi are organisms seriously threatened by global change processes [17,19] and whose life cycles are largely unknown [53]. In this sense, the use of remotely sensed data and its processing with advanced mathematical techniques may facilitate our progress in determining the factors that trigger mushroom production and in predicting their yields. Having mushroom yield models will enable the inclusion of mushrooms in sustainable forest management plans in order to maintain the economic activity linked to their exploitation without compromising this resource.
Progress is currently being made in mapping, on a global scale, the distribution of mushrooms by applying artificial intelligence [54,55]. Likewise, the use of remote sensing data is helping advance our knowledge of mushroom biology and the factors that trigger their production [18,34,35], a key step in understanding their life cycle to facilitate its management.
This work presents an approach for assessing the effects of climatic, structural, and primary productivity variables of Mediterranean dry forests of Pinus pinaster in Spain on mushroom yields and, in particular, on those of the edible species Lactarius deliciosus. Through remotely sensed data that are transformed into derived variables (NDVI from Landsat and canopy cover from TLS) and the application of GAMM models, we found that mushroom fruiting, for the overall pool of species and for Lactarius deliciosus specifically, is equally triggered by the cumulative precipitation of autumn (Precautumn > 150 mm). This finding, firstly demonstrated by the ranking of independent variables in our models, is not novel [18], but it is complemented by identifying other influencing factors which result from the interaction between various parameters. In this sense, we noted the strength of the interaction between forest vegetation volume (Volumebiomass) and primary productivity (NDVIdiff), both characterised using remotely sensed data, as a second factor. Finally, the other statistically significant variables in both models were structural, in agreement with other authors (e.g., [25]). Interestingly, when modelling Lactarius deliciosus yields alone, basal area becomes more relevant than SDI, pointing to an optimal range of BA in which Lactarius deliciosus fruits. In [56], it was already demonstrated that there is an optimum BA for mushroom production, which depends on the forest dominant species and is approximately 35–40 m2 ha−1 for P. pinaster. In our study area, BA seemed to positively influence Lactarius deliciosus yields up to a maximum value of 50 m2 ha−1. Evapotranspiration in forests of lower densities leads to less water availability, while at higher densities temperature may be reduced; this is linked to lower illumination and directly affects mushroom yields. When modelling the entire pool of wild mushroom species, SDI and the interaction between canopy cover and Tmin were the most relevant, possibly indicating the minimum conditions necessary to achieve mushroom fruiting. The moderate fit of our models (R2 ~ 0.49) indicates that the independent variables explain the dependent variable to some extent but can be further improved, both in terms of sample size and the type and number of parameters.
The role of remotely sensed variables became relevant in estimating yields, through the interaction of vegetation volume (Volumebiomass) with primary productivity (NDVIdiff) in both predictive models as well as the interaction of Canopy with minimum temperature (Tmin) in the overall model. Vegetation primary productivity was historically among the first variables to be estimated with multitemporal RS data [57], and currently it can be routinely evaluated at a range of spatial scales thanks to the regular and frequent data acquired by operational programs of different optical sensors [58]. The structural parameters, readily estimated in our plots with point clouds acquired with a mobile TLS, would have been unreachable otherwise, and certainly places our work as an example of novel application for the employment of TLS data [32].
Vegetation volume interacting with primary productivity in the yield models suggests the potential for including forest growth rate, a measurable structural parameter, in future modelling efforts. In fact, [59] already demonstrated that there is a relationship between maximum mushroom production and the forest stand growth rate and showed the example of the mycorrhizal sporocarps development in relation with the growth and photosynthetic rate of the host trees [60]. Post-treatment conditions following forest thinning have also been shown to facilitate short-term successional changes in fungal sporocarp assemblage [61]. Sustainable forest management should ensure good mushroom production when keeping the stand density high but not overstocked.
Climate variables, forest primary productivity and forest structure determine the production of mushrooms in Mediterranean forests. Remotely sensed data, multitemporal optical and TLS point clouds in particular, are presented here as a key source of data with strong potential for development of mushroom yields predictive models. The inclusion of variables related to stand development, such as current growth, may further improve the models, developing simple harvest predictive equations that would enable forest managers to establish guidelines for fungal sustainable harvest.

5. Conclusions

A combination of active and passive remotely sensed data was shown to be relevant for assessment of the overall mushroom productivity in Mediterranean dry forests of Pinus pinaster, and specifically for Lactarius deliciosus. Advanced statistical analysis with Generalized Additive Mixed Models (GAMM) unravelled the complex relationships among forest primary productivity, structural parameters, and climatic variables driving the amount of wild mushroom harvests. The most relevant factors triggering mushroom fruiting were the accumulated precipitation of autumn and the interaction of vegetation volume with primary productivity, the latter two estimated from TLS point clouds and Landsat multitemporal NDVI, respectively. Lastly, whilst primary productivity and the interaction of canopy cover and fall low temperatures are key in the estimation of overall yields, basal area is more relevant for estimation of Lactarius deliciosus. The capacity of remote sensing to extend models of mushroom yields at medium to large scale promises relevant opportunities for the inclusion of these non-wood forest products in sustainable management plans and SDGs achievement.

Author Contributions

Conceptualization, R.M.-R.; methodology, R.M.-R.; formal analysis, A.T.-C.; data curation, R.M.-R. and L.B.; writing—original draft preparation, R.M.-R., C.G. and B.Á.; writing—review and editing, R.M.-R., A.T.-C., L.B. and E.U.; supervision, C.G. and B.Á. All authors have read and agreed to the published version of the manuscript.

Funding

This work was supported by the Spanish Ministry of Science and Innovation, under grant DI-17-9626. This work has received funding from the European Union’s Horizon 2020 research and innovation programme under the Marie Skłodowska-Curie grant agreement No. 778322.

Data Availability Statement

Mycological data employed in this work belong to Castilla y León Regional Government (Servicio de Medio Ambiente). We were granted permission to use the dataset for scientific research but are not allowed to share them publicly.

Acknowledgments

Acknowledgement to Consejería de Medioambiente de la Junta de Castilla y León for maintaining the network of plots and providing the mushroom production data, as well as Valonsadero Forestry Centre and Cesefor Foundation for their work in mushroom data collection. Fredrerico Simoes is thanked for collecting the TLS data.

Conflicts of Interest

The authors declare no conflict of interest.

References

  1. Lechner, A.M.; Foody, G.M.; Boyd, D.S. Applications in Remote Sensing to Forest Ecology and Management. One Earth 2020, 2, 405–412. [Google Scholar] [CrossRef]
  2. White, J.C.; Coops, N.C.; Wulder, M.A.; Vastaranta, M.; Hilker, T.; Tompalski, P. Remote Sensing Technologies for Enhancing Forest Inventories: A Review. Can. J. Remote Sens. 2016, 42, 619–641. [Google Scholar] [CrossRef] [Green Version]
  3. Li, J.; Roy, D.P. A global analysis of Sentinel-2a, Sentinel-2b and Landsat-8 data revisit intervals and implications for terrestrial monitoring. Remote Sens. 2017, 9, 902. [Google Scholar] [CrossRef] [Green Version]
  4. Hansen, M.C.; Potapov, P.V.; Moore, R.; Hancher, M.; Turubanova, S.A.; Tyukavina, A.; Thau, D.; Stehman, S.V.; Goetz, S.J.; Loveland, T.R.; et al. High-Resolution Global Maps of 21st-century forest cover change. Science 2013, 134, 850–854. [Google Scholar] [CrossRef] [Green Version]
  5. Kennedy, R.E.; Andréfouët, S.; Cohen, W.B.; Gómez, C.; Griffiths, P.; Hais, M.; Healey, S.P.; Helmer, E.H.; Hostert, P.; Lyons, M.B.; et al. Bringing an ecological view of change to Landsat-based remote sensing. Front. Ecol. Environ. 2014, 12, 339–346. [Google Scholar] [CrossRef]
  6. Wulder, M.A.; Coops, N.C.; Roy, D.P.; White, J.C.; Hermosilla, T. Land cover 2.0. Int. J. Remote Sens. 2018, 39, 4254–4284. [Google Scholar] [CrossRef] [Green Version]
  7. Gómez, C.; Alejandro, P.; Hermosilla, T.; Montes, F.; Pascual, C.; Ruiz, L.A.; Álvarez-Taboada, F.; Tanase, M.A.; Valbuena, R. Remote sensing for the Spanish forests in the 21st century: A review of advances, needs, and opportunities. For. Syst. 2019, 28, 1–33. [Google Scholar] [CrossRef]
  8. Küçüker, D.M.; Baskent, E.Z. Spatial prediction of Lactarius deliciosus and Lactarius salmonicolor mushroom distribution with logistic regression models in the Kızılcasu Planning Unit, Turkey. Mycorrhiza 2014, 25, 1–11. [Google Scholar] [CrossRef]
  9. Sánchez-González, M.; de-Miguel, S.; Martín-Pinto, P.; Martínez-Peña, F.; Pasalodos-Tato, M.; Oria-de-Rueda, J.A.; de Aragón, J.M.; Cañellas, I.; Bonet, J.A. Yield models for predicting aboveground ectomycorrhizal fungal productivity in Pinus sylvestris and Pinus pinaster stands of northern Spain. For. Ecosyst. 2019, 6, 52. [Google Scholar] [CrossRef] [Green Version]
  10. Herrero, C.; Berraondo, I.; Bravo, F.; Pando, V.; Ordóñez, C.; Olaizola, J.; Martín-Pinto, P.; de Rueda, J.A.O. Predicting mushroom productivity from long-term field-data series in mediterranean Pinus pinaster ait. forests in the context of climate change. Forests 2019, 10, 206. [Google Scholar] [CrossRef]
  11. Cockle, K.L.; Martin, K.; Robledo, G. Linking fungi, trees, and hole-using birds in a Neotropical tree-cavity network: Pathways of cavity production and implications for conservation. For. Ecol. Manag. 2012, 264, 210–219. [Google Scholar] [CrossRef]
  12. Müller, J.; Bütler, R. A review of habitat thresholds for dead wood: A baseline for management recommendations in European forests. Eur. J. For. Res. 2010, 129, 981–992. [Google Scholar] [CrossRef]
  13. Croitoru, L. Valuing the non-timber forest products in the Mediterranean region. Ecol. Econ. 2007, 63, 768–775. [Google Scholar] [CrossRef]
  14. Boa, E. Wild Edible Fungi: A Global Overview of Their Use and Importance to People; Food and Agriculture Organisation of the United Nations: Rome, Italy, 2004; Volume 60. [Google Scholar]
  15. United Nations. The 17 Goals|Sustainable Development; United Nations: New York, NY, USA, 2022; Available online: https://sdgs.un.org/es/goals (accessed on 8 September 2022).
  16. Alday, J.G.; de Aragón, J.M.; de Miguel, S.; Bonet, J.A. Mushroom biomass and diversity are driven by different spatio-Temporal scales along Mediterranean elevation gradients. Sci. Rep. 2017, 7, 45824. [Google Scholar] [CrossRef] [Green Version]
  17. Ágreda, T.; Águeda, B.; Olano, J.M.; Sergio, M.; Serrano, V.; Fernández-Toirán, M. Increased evapotranspiration demand in a Mediterranean climate might cause a decline in fungal yields under global warming. Glob. Chang. Biol. 2015, 21, 3499–3510. [Google Scholar] [CrossRef] [PubMed]
  18. Olano, J.M.; Martínez-Rodrigo, R.; Altelarrea, J.M.; Ágreda, T.; Fernández-Toirán, M.; García-Cervigón, A.I.; Rodríguez-Puerta, F.; Águeda, B. Primary productivity and climate control mushroom yields in Mediterranean pine forests. Agric. For. Meteorol. 2020, 288–289, 108015. [Google Scholar] [CrossRef]
  19. Morera, A.; de Aragón, J.M.; De Cáceres, M.; Bonet, J.A.; De Miguel, S. Historical and future spatially-explicit climate change impacts on mycorrhizal and saprotrophic macrofungal productivity in Mediterranean pine forests. Agric. For. Meteorol. 2022, 319, 108918. [Google Scholar] [CrossRef]
  20. Straatsma, G.; Ayer, F.; Egli, S. Species richness, abundance, and phenology of fungal fruit bodies over 21 years in a Swiss forest plot. Mycol. Res. 2001, 105, 515–523. [Google Scholar] [CrossRef] [Green Version]
  21. Rüehling, Å.; Tyler, G. Soil Factors Influencing the Distribution of Macrofungi in Oak Forests of Southern Sweden. Holarct. Ecol. 1990, 13, 11–18. [Google Scholar] [CrossRef]
  22. Hagenbo, A.; Alday, J.G.; de Aragón, J.M.; Castaño, C.; De-Miguel, S.; Bonet, J.A. Variations in biomass of fungal guilds are primarily driven by factors related to soil conditions in Mediterranean Pinus pinaster forests. Biol. Fertil. Soils 2022, 58, 487–501. [Google Scholar] [CrossRef]
  23. Koide, R.T.; Fernandez, C.; Petprakob, K. General principles in the community ecology of ectomycorrhizal fungi. Ann. For. Sci. 2011, 68, 45–55. [Google Scholar] [CrossRef] [Green Version]
  24. Tomao, A.; Bonet, J.A.; de Aragón, J.M.; de-Miguel, S. Is silviculture able to enhance wild forest mushroom resources? Current knowledge and future perspectives. For. Ecol. Manag. 2017, 402, 102–114. [Google Scholar] [CrossRef] [Green Version]
  25. Bonet, J.A.; Pukkala, T.; Fischer, C.R.; Palahí, M.; de Aragón, J.M.; Colinas, C. Empirical models for predicting the production of wild mushrooms in Scots pine (Pinus sylvestris L.) forests in the Central Pyrenees. Ann. For. Sci. 2008, 65, 206. [Google Scholar] [CrossRef] [Green Version]
  26. Bonet, J.A.; Palahí, M.; Colinas, C.; Pukkala, T.; Fischer, C.R.; Miina, J.; de Aragón, J.M. Modelling the production and species richness of wild mushrooms in pine forests of the Central Pyrenees in northeastern Spain. Can. J. For. Res. 2010, 40, 347–356. [Google Scholar] [CrossRef]
  27. Ágreda, T.; Cisneros, O.; Águeda, B.; Fernández-Toirán, L.M. Age class influence on the yield of edible fungi in a managed Mediterranean forest. Mycorrhiza 2013, 242, 143–152. [Google Scholar] [CrossRef]
  28. De Miguel, S.; Bonet, J.A.; Pukkala, T.; de Aragón, J.M.M. Impact of forest management intensity on landscape-level mushroom productivity: A regional model-based scenario analysis. For. Ecol. Manag. 2014, 330, 218–227. [Google Scholar] [CrossRef]
  29. Bonet, J.A.; de Miguel, S.; de Aragón, J.M.; Pukkala, T.; Palahí, M. Immediate effect of thinning on the yield of Lactarius group deliciosus in Pinus pinaster forests in Northeastern Spain. For. Ecol. Manag. 2012, 265, 211–217. [Google Scholar] [CrossRef]
  30. Küçüker, D.M.; Başkent, E.Z. Sustaining the joint production of timber and Lactarius mushroom: A case study of a forest management planning unit in Northwestern Turkey. Sustainability 2017, 9, 92. [Google Scholar] [CrossRef] [Green Version]
  31. Lefsky, M.A.; Cohen, W.B.; Parker, G.G.; Harding, D.J. Lidar Remote Sensing for Ecosystem Studies. Sciences 2002, 52, 19–30. [Google Scholar] [CrossRef]
  32. Beland, M.; Parker, G.; Sparrow, B.; Harding, D.; Chasmer, L.; Phinn, S.; Antonarakis, A.; Strahler, A. On promoting the use of lidar systems in forest ecosystem research. For. Ecol. Manag. 2019, 450, 117484. [Google Scholar] [CrossRef]
  33. Åkerblom, M.; Kaitaniemi, P. Terrestrial laser scanning: A new standard of forest measuring and modelling? Ann. Bot. 2021, 128, 653–662. [Google Scholar] [CrossRef] [PubMed]
  34. Thers, H.; Brunbjer, A.K.; Læssøe, T.; Ejrnæs, R.; Bøcher, P.K.; Svenning, J.C. Lidar-derived variables as a proxy for fungal species richness and composition in temperate Northern Europe. Remote Sens. Environ. 2017, 200, 102–113. [Google Scholar] [CrossRef]
  35. Peura, M.; González, R.S.; Müller, J.; Heurich, M.; Vierling, L.A.; Mönkkönen, M.; Bässler, C. Mapping a ‘cryptic kingdom’: Performance of lidar derived environmental variables in modelling the occurrence of forest fungi. Remote Sens. Environ. 2016, 186, 428–438. [Google Scholar] [CrossRef]
  36. Oria de Rueda, J.A.; Hernández-Rodríguez, M.; Marín-Pinto, P.; Pando, V.; Olaizola, J. Could artificial reforestations provide as much production and diversity of fungal species as natural forest stands in marginal Mediterranean areas? For. Ecol. Manag. 2010, 260, 171–180. [Google Scholar] [CrossRef]
  37. Vásquez, P.; de Rueda, J.O.; Martín-Pinto, P. P. Pinaster under extreme ecological conditions provides high fungal production and diversity. For. Ecol. Manag. 2015, 337, 161–173. [Google Scholar] [CrossRef]
  38. Caudullo, G.; Welk, E.; San-Miguel-Ayanz, J. Chorological maps for the main European woody species. Data Brief 2017, 12, 662–666. [Google Scholar] [CrossRef]
  39. Lecigne, B.; Delagrange, S.; Messier, C. Exploring trees in three dimensions: VoxR, a novel voxel-based R package dedicated to analysing the complex arrangement of tree crowns. Ann. Bot. 2018, 121, 589–601. [Google Scholar] [CrossRef]
  40. Reineke, L.H. Perfecting a stand-density index for even-aged forest. J. Agric. Res. 1933, 46, 627–638. [Google Scholar]
  41. Rouse, J.W.; Haas, R.H.; Schell, J.A.; Deering, D.W. Monitoring vegetation systems in the great plains with ERTS-1. In Proceedings of the Third ERTS Symposium, College Station, TX, USA, 1 January 1974; pp. 309–317. [Google Scholar]
  42. Huang, S.; Tang, L.; Hupy, J.P.; Wang, Y.; Shao, G. A commentary review on the use of normalized difference vegetation index (NDVI) in the era of popular remote sensing. J. For. Res. 2021, 32, 1–6. [Google Scholar] [CrossRef]
  43. Mennis, J. Exploring relationships between ENSO and vegetation vigour in the South- east USA using AVHRR data. Remote Sens. 2001, 22, 3077–3092. [Google Scholar] [CrossRef]
  44. Vicente-Serrano, S.M.; Camarero, J.J.; Olano, J.M.; Martín-Hernández, N.; Peña-Gallardo, M.; Tomás-Burguera, M.; Gazol, A.; Azorin-Molina, C.; Bhuyan, U.; El Kenawy, A. Diverse relationships between forest growth and the Normalized Difference Vegetation Index at a global scale. Remote Sens. Environ. 2016, 187, 14–29. [Google Scholar] [CrossRef]
  45. Dormann, C.F.; Elith, J.; Bacher, S.; Buchmann, C.; Carl, G.; Carré, G.; Marquéz, J.R.G.; Gruber, B.; Lafourcade, B.; Leitão, P.J.; et al. Collinearity: A review of methods to deal with it and a simulation study evaluating their performance. Ecography 2013, 36, 27–46. [Google Scholar] [CrossRef]
  46. Zuur, A.F.; Ieno, E.N.; Walker, N.J.; Saveliev, A.A.; Smith, G.M. Mixed Effects Models and Extensions in Ecology with R; Springer: Berlin/Heidelberg, Germany, 2009. [Google Scholar]
  47. Akaike, H. Information Theory and an Extension of the Maximum Likelihood Principle. In Selected Papers of Hirotugu Akaike; Parzen, E., Tanabe, K., Kitagawa, G., Eds.; Springer: New York, NY, USA, 1998; pp. 199–213. [Google Scholar] [CrossRef]
  48. R Core Team. R: A Language and Environment for Statistical Computing; R Foundation for Statistical Computing: Vienna, Austria, 2018; Available online: https://www.r-project.org (accessed on 8 September 2022).
  49. Wood, S.N. Generalized Additive Models: An Introduction with R; Chapman and Hall/CRC: New York, NY, USA, 2017. [Google Scholar] [CrossRef] [Green Version]
  50. Biber, P.; Seifert, S.; Zaplata, M.K.; Schaaf, W.; Pretzsch, H.; Fischer, A. Relationships between substrate, surface characteristics, and vegetation in an initial ecosystem. Biogeosciences 2013, 10, 8283–8303. [Google Scholar] [CrossRef] [Green Version]
  51. Hunsicker, M.E.; Kappel, C.V.; Selkoe, K.A.; Halpern, B.S.; Scarborough, C.; Mease, L.; Amrhein, A. Characterizing driver–response relationships in marine pelagic ecosystems for improved ocean management. Ecol. Appl. 2016, 26, 651–663. [Google Scholar] [CrossRef] [PubMed]
  52. United Nations. Indicators ODS; United Nations: New York, NY, USA, 2022; Available online: https://unstats.un.org/sdgs/report/2022/Goal-15/ (accessed on 8 September 2022).
  53. van der Heijden MG, A.; Sanders, I.R. Mycorrhizal Ecology; Springer: Berlin/Heidelberg, Germany, 2002. [Google Scholar]
  54. Anthony, M.A.; Crowther, T.W.; Van der Linde, S.; Suz, L.M.; Bidartondo, M.L.; Cox, F.; Schaub, M.; Rautio, P.; Ferreti, M.; Vesterdal, L.; et al. Forest tree growth is linked to mycorrhizal fungal composition and function across Europe. ISME J. 2022, 16, 1327–1336. [Google Scholar] [CrossRef] [PubMed]
  55. Steidinger, B.S.; Crowther, T.W.; Liang, J.; Van Nuland, M.E.; Werner, G.D.A.; Reich, P.B.; Nabuurs, G.J.; De Miguel, S.; Zhou, M.; Picard, N.; et al. Climatic controls of decomposition drive the global biogeography of forest-tree symbioses. Nature 2019, 569, 404–408. [Google Scholar] [CrossRef] [Green Version]
  56. Miina, J.; Bonet, J.A.; De Miguel, S.; de Aragón, J.M.; Kurttila, M.; Salo, K.; Tahvanainen, V. Promoting wild mushroom yields by forest management. Tech. Rep. 2016. [Google Scholar] [CrossRef]
  57. Tucker, C.J.; Sellers, P.J. Satellite remote sensing of primary production. Int. J. Remote Sens. 1986, 7, 1395–1416. [Google Scholar] [CrossRef] [Green Version]
  58. Song, C.; Dannenberg, M.P.; Hwang, T. Optical remote sensing of terrestrial ecosystem primary productivity. Prog. Phys. Geogr. 2013, 37, 834–854. [Google Scholar] [CrossRef]
  59. Kuikka, K.; Härmä, E.; Markkola, A.; Rautio, P.; Roitto, M.; Saikkonen, K.; Ahonen-Jonnarth, U.; Finlay, R.; Tuomi, J. Severe defoliation of Scots pine reduces reproductive investment by ectomycorrhizal symbionts. Ecology 2003, 84, 2051–2061. [Google Scholar] [CrossRef]
  60. Calama, R.; Tomé, M.; Sánchez-González, M.; Miina, J.; Spanos, K.; Palahí, M. Modelling Non-Wood Forest Products in Europe: A review Introduction: Importance. For. Syst. 2010, 19, 69–85. [Google Scholar] [CrossRef]
  61. Collado, E.; Bonet, J.A.; Alday, J.G.; de Aragón, J.M.; De Miguel, S. Impact of forest thinning on aboveground macrofungal community composition and diversity in Mediterranean pine stands. Ecol. Indic. 2021, 133, 108340. [Google Scholar] [CrossRef]
Figure 2. Statistical characterization of annual mushroom yield (g) in the experimental network of plots during the period 2012–2021. (left): total mushroom biomass and (right): Lactarius deliciosus biomass.
Remotesensing 14 05025 g002
Figure 3. Point cloud acquired with GeosLAM. (a) Example of a clipped plot point cloud corresponding to plot 22. (b) Schematic example of voxelization.
Remotesensing 14 05025 g003
Figure 4. Canopy cover retrieved from the GeoSLAM point cloud (example from Plot 6). Brown points represent the tree trunks whose canopies (grey area) affect the plot.
Remotesensing 14 05025 g004
Figure 5. Pearson correlation between pairs of variables.
Remotesensing 14 05025 g005
Figure 6. Non-linear effects of the variables for the model developed for all mushroom species together (Equation (2)). (a) Precautumn; (b) SDI; (c) interaction between Volumebiomass and NDVIdiff; and (d) interaction between Canopy and Tmin. In two-dimensional plots (c,d), white shows a positive effect and black a negative effect; green contour lines show where the function has a constant value.
Remotesensing 14 05025 g006
Figure 7. Model predictions for all mushroom yields. Yieldtotal (Y-axis) versus Volumebiomass (X-axis) are shown for five different NDVIdiff values and SDI values of 650, 950, and 1250.
Remotesensing 14 05025 g007
Figure 8. Non-linear effects of the variables for the model developed for Lactarius deliciosus (Equation (3)). (a) Precautumn; (b) BA; and (c) interaction between Volumebiomass and NDVIdiff. In the two-dimensional graph (c), white shows a positive effect and black a negative effect; green contour lines show where the function has a constant value.
Remotesensing 14 05025 g008
Table 1. Description of variables involved in the statistical analysis.
VariableDescriptionMaxMinMeanStedv
YieldtotalTotal yield of mushrooms (g)9504017461910.27
YieldLactariusTotal yield of Lactarius deliciosus (g)5706.50067690.08
NDVIdiffDifference between winter and summer NDVI (absolute value)0.260.0030.100.0057
NDVIdiffprevDifference between winter and summer NDVI of the previous year (absolute value)0.260.0020.100.0054
CanopyCanopy cover (%)79.6669.9674.372.94
VolumebiomassVolume of total aboveground biomass in the plot (m3 ha−1)301.00151.50221.6049.16
BABasal area of the plot (m2 ha−1)76.4031.6054.1614.08
SDIStand Density Index1414.30662.181034.8247.79
PrecautumnAccumulated autumn rainfall (mm)207.4035.20126.1047.12
TminAverage of the autumn months’ minimum temperature (°C)7.675.106.110.80
Table 2. Parameters describing the smoother functions, where the significance codes are for a p-value = 0 ‘***’, p-value = 0.01 ‘*’, p-value = 0.05 ‘·’.
Edfp-ValueSignificance
f1(Precautumn)3.682<0.0000***
f2(Volumebiomass, NDVIdiff)2.0000.0001***
f3(SDI)2.6580.0112*
f4(Canopy, Tmin)2.0000.0959·
Table 3. Parameters describing the smoother functions of the model of Lactarius deliciosus yield, where the significance codes are for a p-value = 0 ‘***’, p-value = 0.05 ‘·’.
Edfp-ValueSignificance
f1(Precautumn)3.318<0.0000***
f2(Volumebiomass, NDVIdiff)3.7410.0002***
f3(BA)2.0350.0694·
Publisher’s Note: MDPI stays neutral with regard to jurisdictional claims in published maps and institutional affiliations.