Article

Landslide Susceptibility Modeling Using Remote Sensing Data and Random SubSpace-Based Functional Tree Classifier

1
College of Geology and Environment, Xi’an University of Science and Technology, Xi’an 710054, China
2
Key Laboratory of Coal Resources Exploration and Comprehensive Utilization, Ministry of Natural Resources, Xi’an 710021, China
*
Author to whom correspondence should be addressed.
Remote Sens. 2022, 14(19), 4803; https://doi.org/10.3390/rs14194803
Submission received: 11 August 2022 / Revised: 18 September 2022 / Accepted: 21 September 2022 / Published: 26 September 2022

Abstract

:
In this study, a random subspace-based function tree (RSFT) was developed for landslide susceptibility modeling, and by comparing with a bagging-based function tree (BFT), classification regression tree (CART), and Naïve-Bayes tree (NBTree) Classifier, to judge the performance difference between the hybrid model and the single models. In the first step, according to the characteristics of the geological environment and previous literature, 12 landslide conditioning factors were selected, including aspect, slope, profile curvature, plan curvature, elevation, topographic wetness index (TWI), lithology, and normalized difference vegetation index (NDVI), land use, soil, distance to river and distance to the road. Secondly, 328 historical landslides were randomly divided into a training group and a validation group in a ratio of 70/30, and the important analysis of landslide points and conditional factors was carried out using the functional tree (FT) model. In the third step, all data are loaded into FT, RSFT, BFT, CART, and NBTree models for the generation of landslide susceptibility maps (LSM). Comparisons were made by the area under the receiver operating characteristic curve (AUC) to determine efficiency and effectiveness. According to the verification results, the five models selected this time all perform reasonably, but the RSFT model has the highest prediction rate (AUC = 0.838), which is better than the other three single machine learning models. The results of this study also demonstrated that the hybrid model generally improves the predictive power of the benchmark landslide susceptibility models.

Graphical Abstract

1. Introduction

As one of the most typical geological disasters, landslides cause serious population migration and economic losses every year around the world [1,2]. It is well known that mountains, plateaus, and hills occupy 67 percent of the land area of China, which means China is a country with frequent geological disasters [3,4]. Due to the special conditions of the geological environment, Sichuan Province has become an area vulnerable to geological disasters in China [5]. The paper takes Xiaojin County as the study area which is limited to one region in the northeast of Sichuan Province. The production and life of human beings in this area and the local economic development are deeply endangered by landslide disasters. Generally, the threat brought by landslides can be reduced effectively by predicting the precise locations of landslides in the future [6].
The premise of landslide susceptibility analysis is that the geological environment of a certain location is similar to the geological conditions of the location where landslides have occurred, so the location may also have landslides. At present, there are three main models for drawing landslide susceptibility maps: physical models, statistical models, and machine learning methods [7,8]. Landslide susceptibility assessment methods based on physical models (e.g., deterministic analysis) have been widely used since 1990 [9]. Deterministic analysis is the application of the slope stability model to calculate the safety factor to determine landslide susceptibility [10]. This method is greatly affected by the landslide input samples and is only suitable for large-scale small areas. However, this study is to study regional landslides, so this method was not selected for this study.
So far, researchers have developed a number of statistical and machine learning approaches to assess landslide susceptibility.
The widely used statistical models are evidential belief function (EBF) [11], analytical hierarchy process (AHP) [12], statistical index (SI) [13], weight of evidence (WOE) [14], and logistic regression (LR) [15]. For example, Nohani et al. [16] used four binary models (Frequency Ratio (FR), Shannon Entropy (SE), Weight of Evidence (WoE), and Evidence Belief Function (EBF)) for landslide susceptibility evaluation of Klijanrestagh Watershed in Iran. Correspondingly, the common machine learning methods are adaptive neuro-fuzzy inference systems (ANFIS) [6], artificial neural network (ANN) [17], support vector machine (SVM) [18], maximum entropy (MaxEnt) [19], logistic model tree (LMT) [6,20] and random forest(RF) [6,21]. Jaafari et al. [22] used grey wolf and biogeography-based optimization algorithms to optimize the parameters of an adaptive neuro-fuzzy inference system and plotted the corresponding landslide susceptibility mapping. Thi Ngo et al. [23] applied two deep learning methods, the recurrent neural network (RNN) and convolutional neural network (CNN), for landslide susceptibility evaluation of Iran. However, these cases still suffer from some drawbacks, for example, since the landslide susceptibility mapping (LSM) training data is limited, a single model may misjudge the best fit function of the data samples in the hypothesis space or the true distribution of the samples [24]. Therefore, some scholars later explored a new idea of LSM, that is, coupling two or more models and combining them into new algorithms. For example, Azarafza et al. [25] integrated CNN and DNN deep learning methods to develop a new deep convolutional neural network model (CNN-DNN) to evaluate landslide susceptibility in Isfahan province, Iran, and compared this algorithm with other 6 machine learning techniques for comparison (support vector machine (SVM), logistic regression (LR), Gaussian naïve Bayes (GNB), multilayer perceptron (MLP), Bernoulli Naïve Bayes (BNB) and decision tree (DT) classifiers). The results of this study showed that the CNN-DNN model had better predictive ability than the baseline models.
At present, there are many landslide susceptibility model combination methods, but there is still a gap in integrating advanced random subspace (RS) and functional tree (FT).
To further study prediction and assessment on a regional scale, we constructed two new prediction models introduced in this paper, namely random subspace (RS) and functional tree (FT). RS is an advanced machine learning model, which can be trained by randomly selecting features from landslide conditioning factors, rather than all of them [26,27]. Meanwhile, the FT model performed better than others models by randomly selecting features from landslide conditioning factors, rather than all of them while building the framework of multivariate trees for classification and regression problems [28]. The main purpose of this manuscript is to apply a newly developed ensemble model-random subspace function tree (RSFT) to predict landslide susceptibility in Xiaojin County, China, by combining a bagging-based function tree (BFT), classification and regression tree (CART) and the Naive Bayes tree (NBTree) for model optimization to find a more accurate model for landslide susceptibility mapping in the study area.

2. Study Area and Data Used
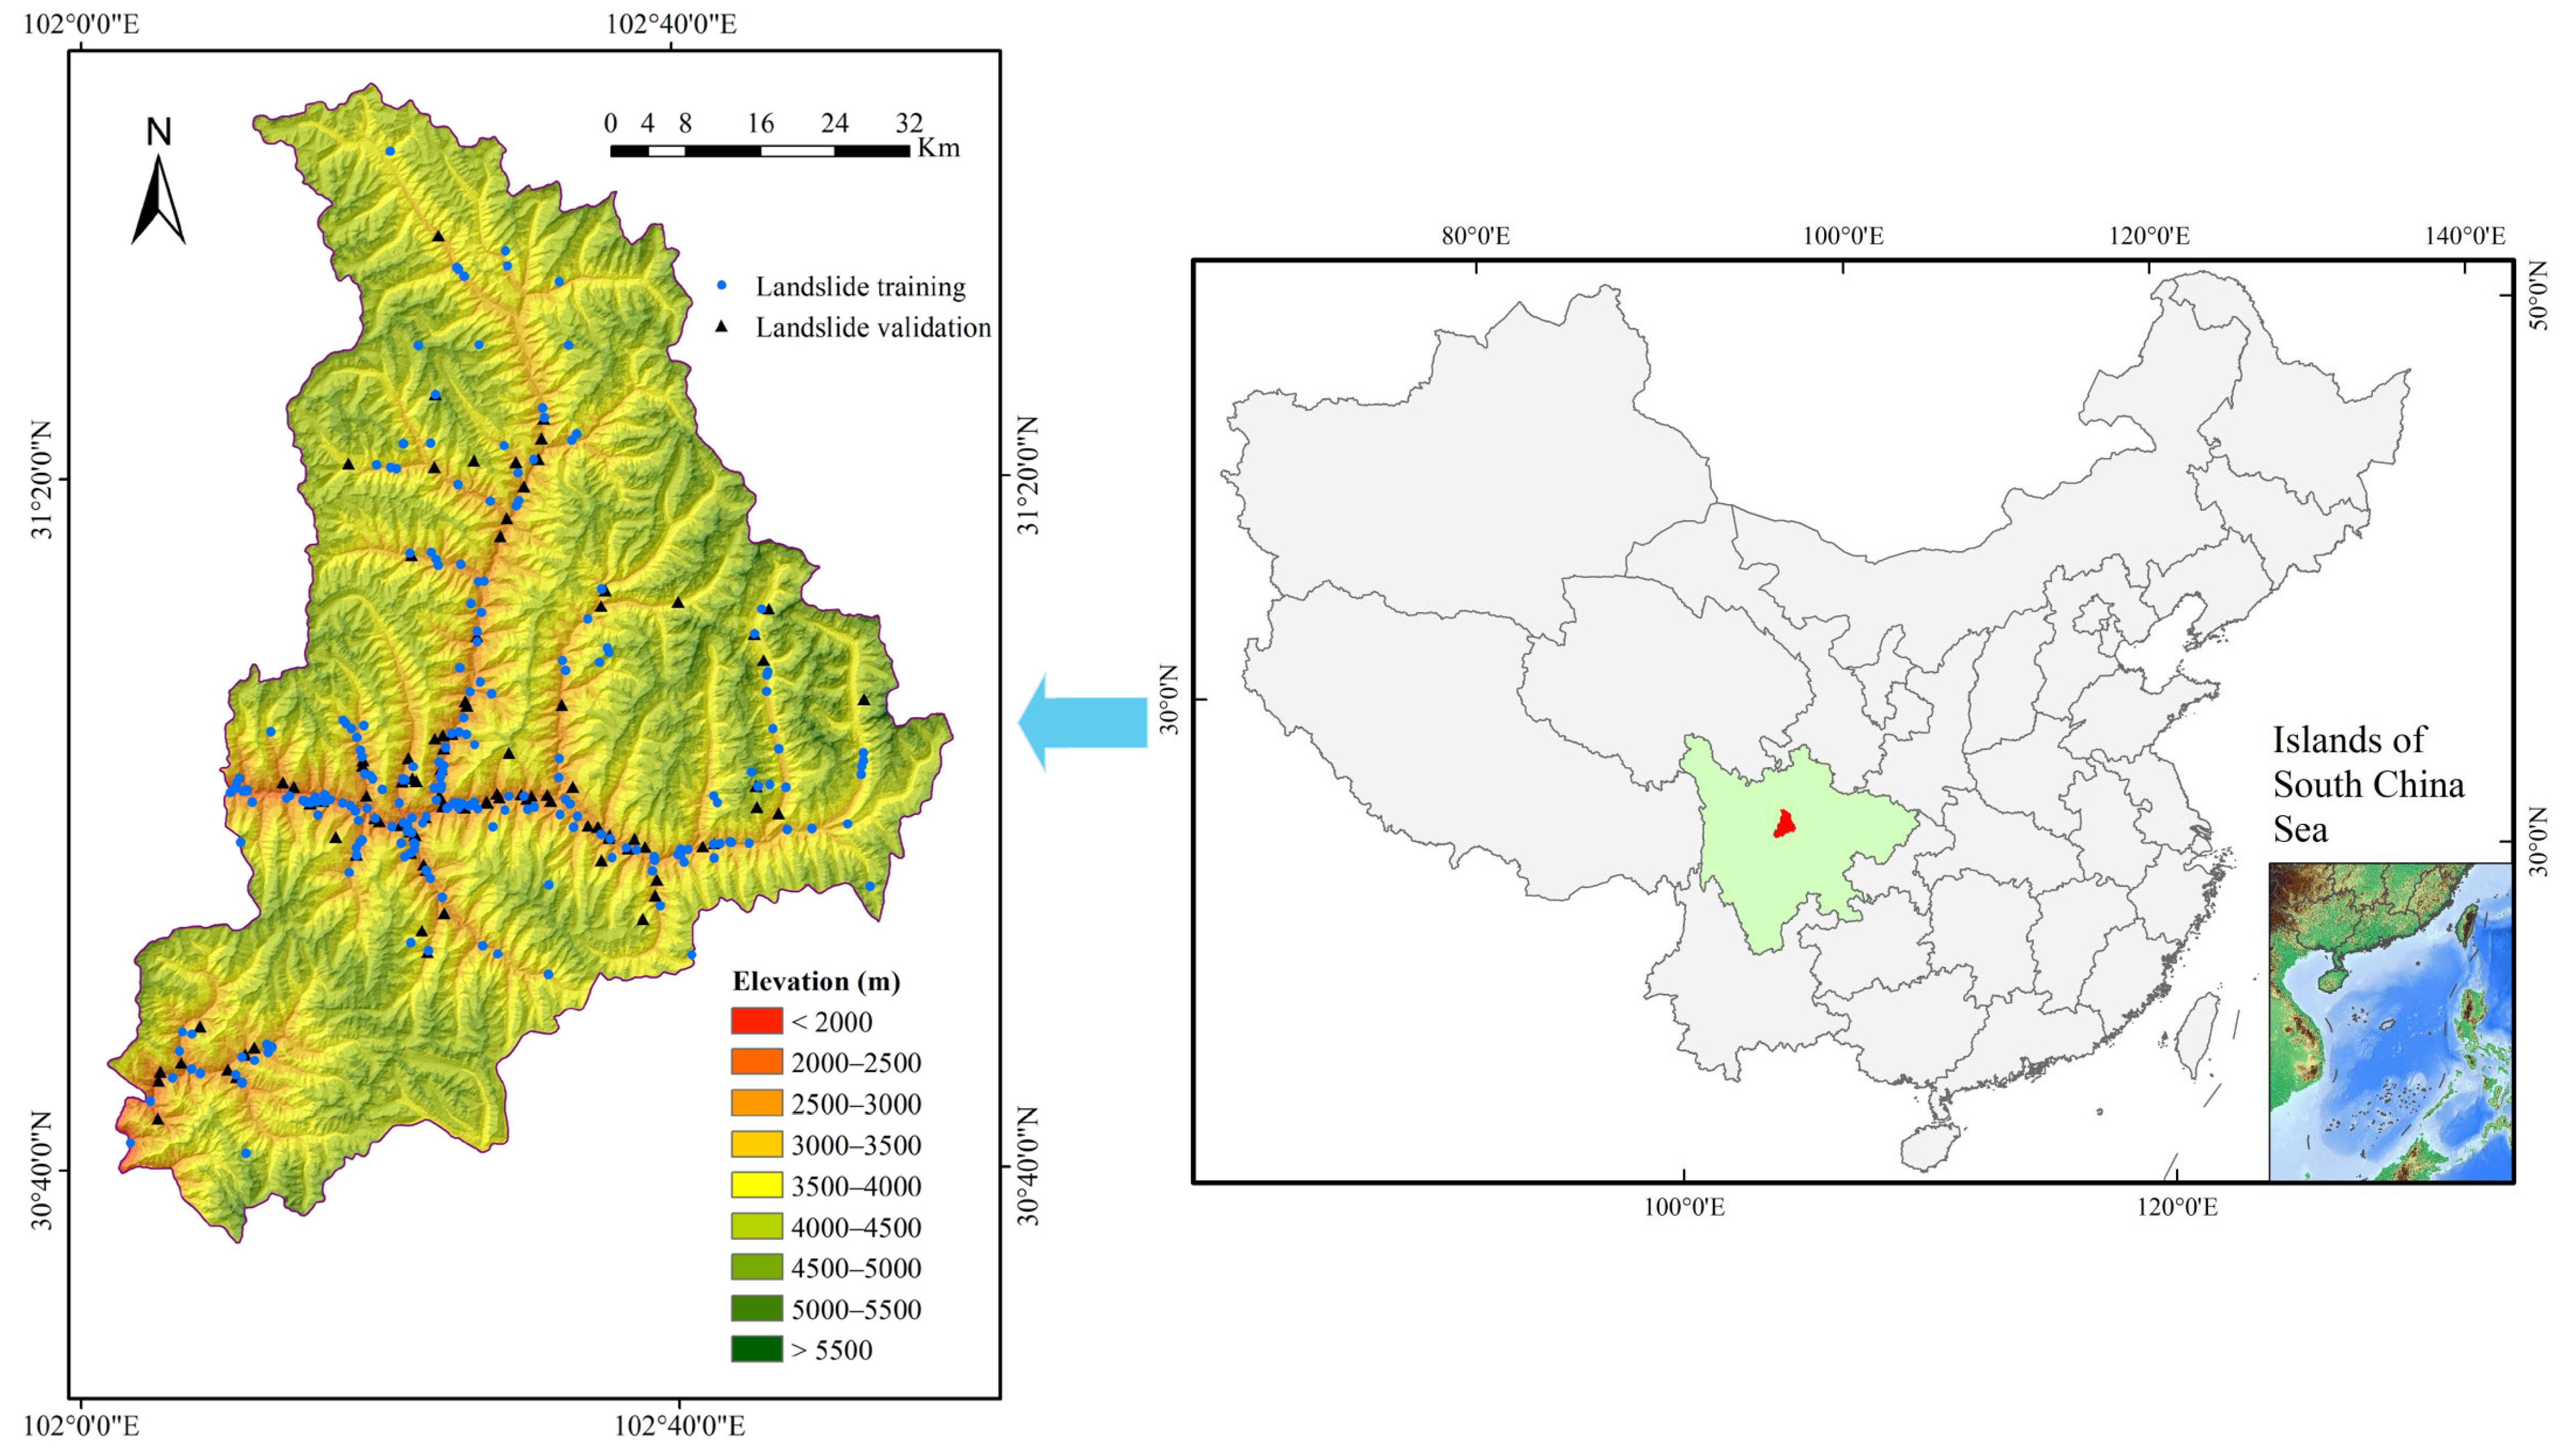
2.1. Study Area

Xiaojin County belongs to the Aba Tibetan and Qiang Autonomous Prefecture, Sichuan Province, China. It is located in the longitude of 102°01′ to 102°59′ and the latitude of 35°35′ to 31°43′ (Figure 1) [29]. The geotectonic unit of Xiaojin County is located in the Songpan-Garze fold system, which belongs to the southern margin of the Bayan Har Maodi trough fold belt and is connected to the Jintang arc fold belt in the east. The study area is one of the main parts of the Western Sichuan Plateau, located on the west side of the alpine landform area of the Qionglai Mountains. The terrain is high in the northeast and low in the southwest. The rivers mostly originate in the north and east, with strong cuts, overlapping peaks and ridges, and large undulating terrain. The area belongs to the typical alpine and canyon landforms. The study area belongs to the subtropical climate type. Due to the plateau terrain, the climate is cold in winter and cool in summer, and rainfall is scarce. The temperature in Xiaojin County is different due to the different terrain, and the regional vertical difference in the temperature in the whole county is large. The mean annual rainfall and temperature are 613.9 mm and 12.2 °C, respectively. Topographically, according to a digital elevation model with a resolution of 20m, altitudes vary from 1705 m to 6055 m a.s.l., and slope gradients vary from 0° to 80.21°.

2.2. Landslide Inventory Map

328 landslides were marked through historical data, interpretation of remote sensing images, and extensive field surveys. The list of landslides includes flow, fall, slide (rotational), and slide (translational) [30], of which the largest landslide scale was about 3,150,000 m2 and the volume was 45,000,000 m3. These landslides mainly affected villagers, buildings (such as houses and roads), and cultivated land. After random sampling of these landslide locations in this study, 230 (70%) data were used for modeling, and the remaining 98 (30%) data were used for model validation. This would be a logical step in a series of follow-up work.

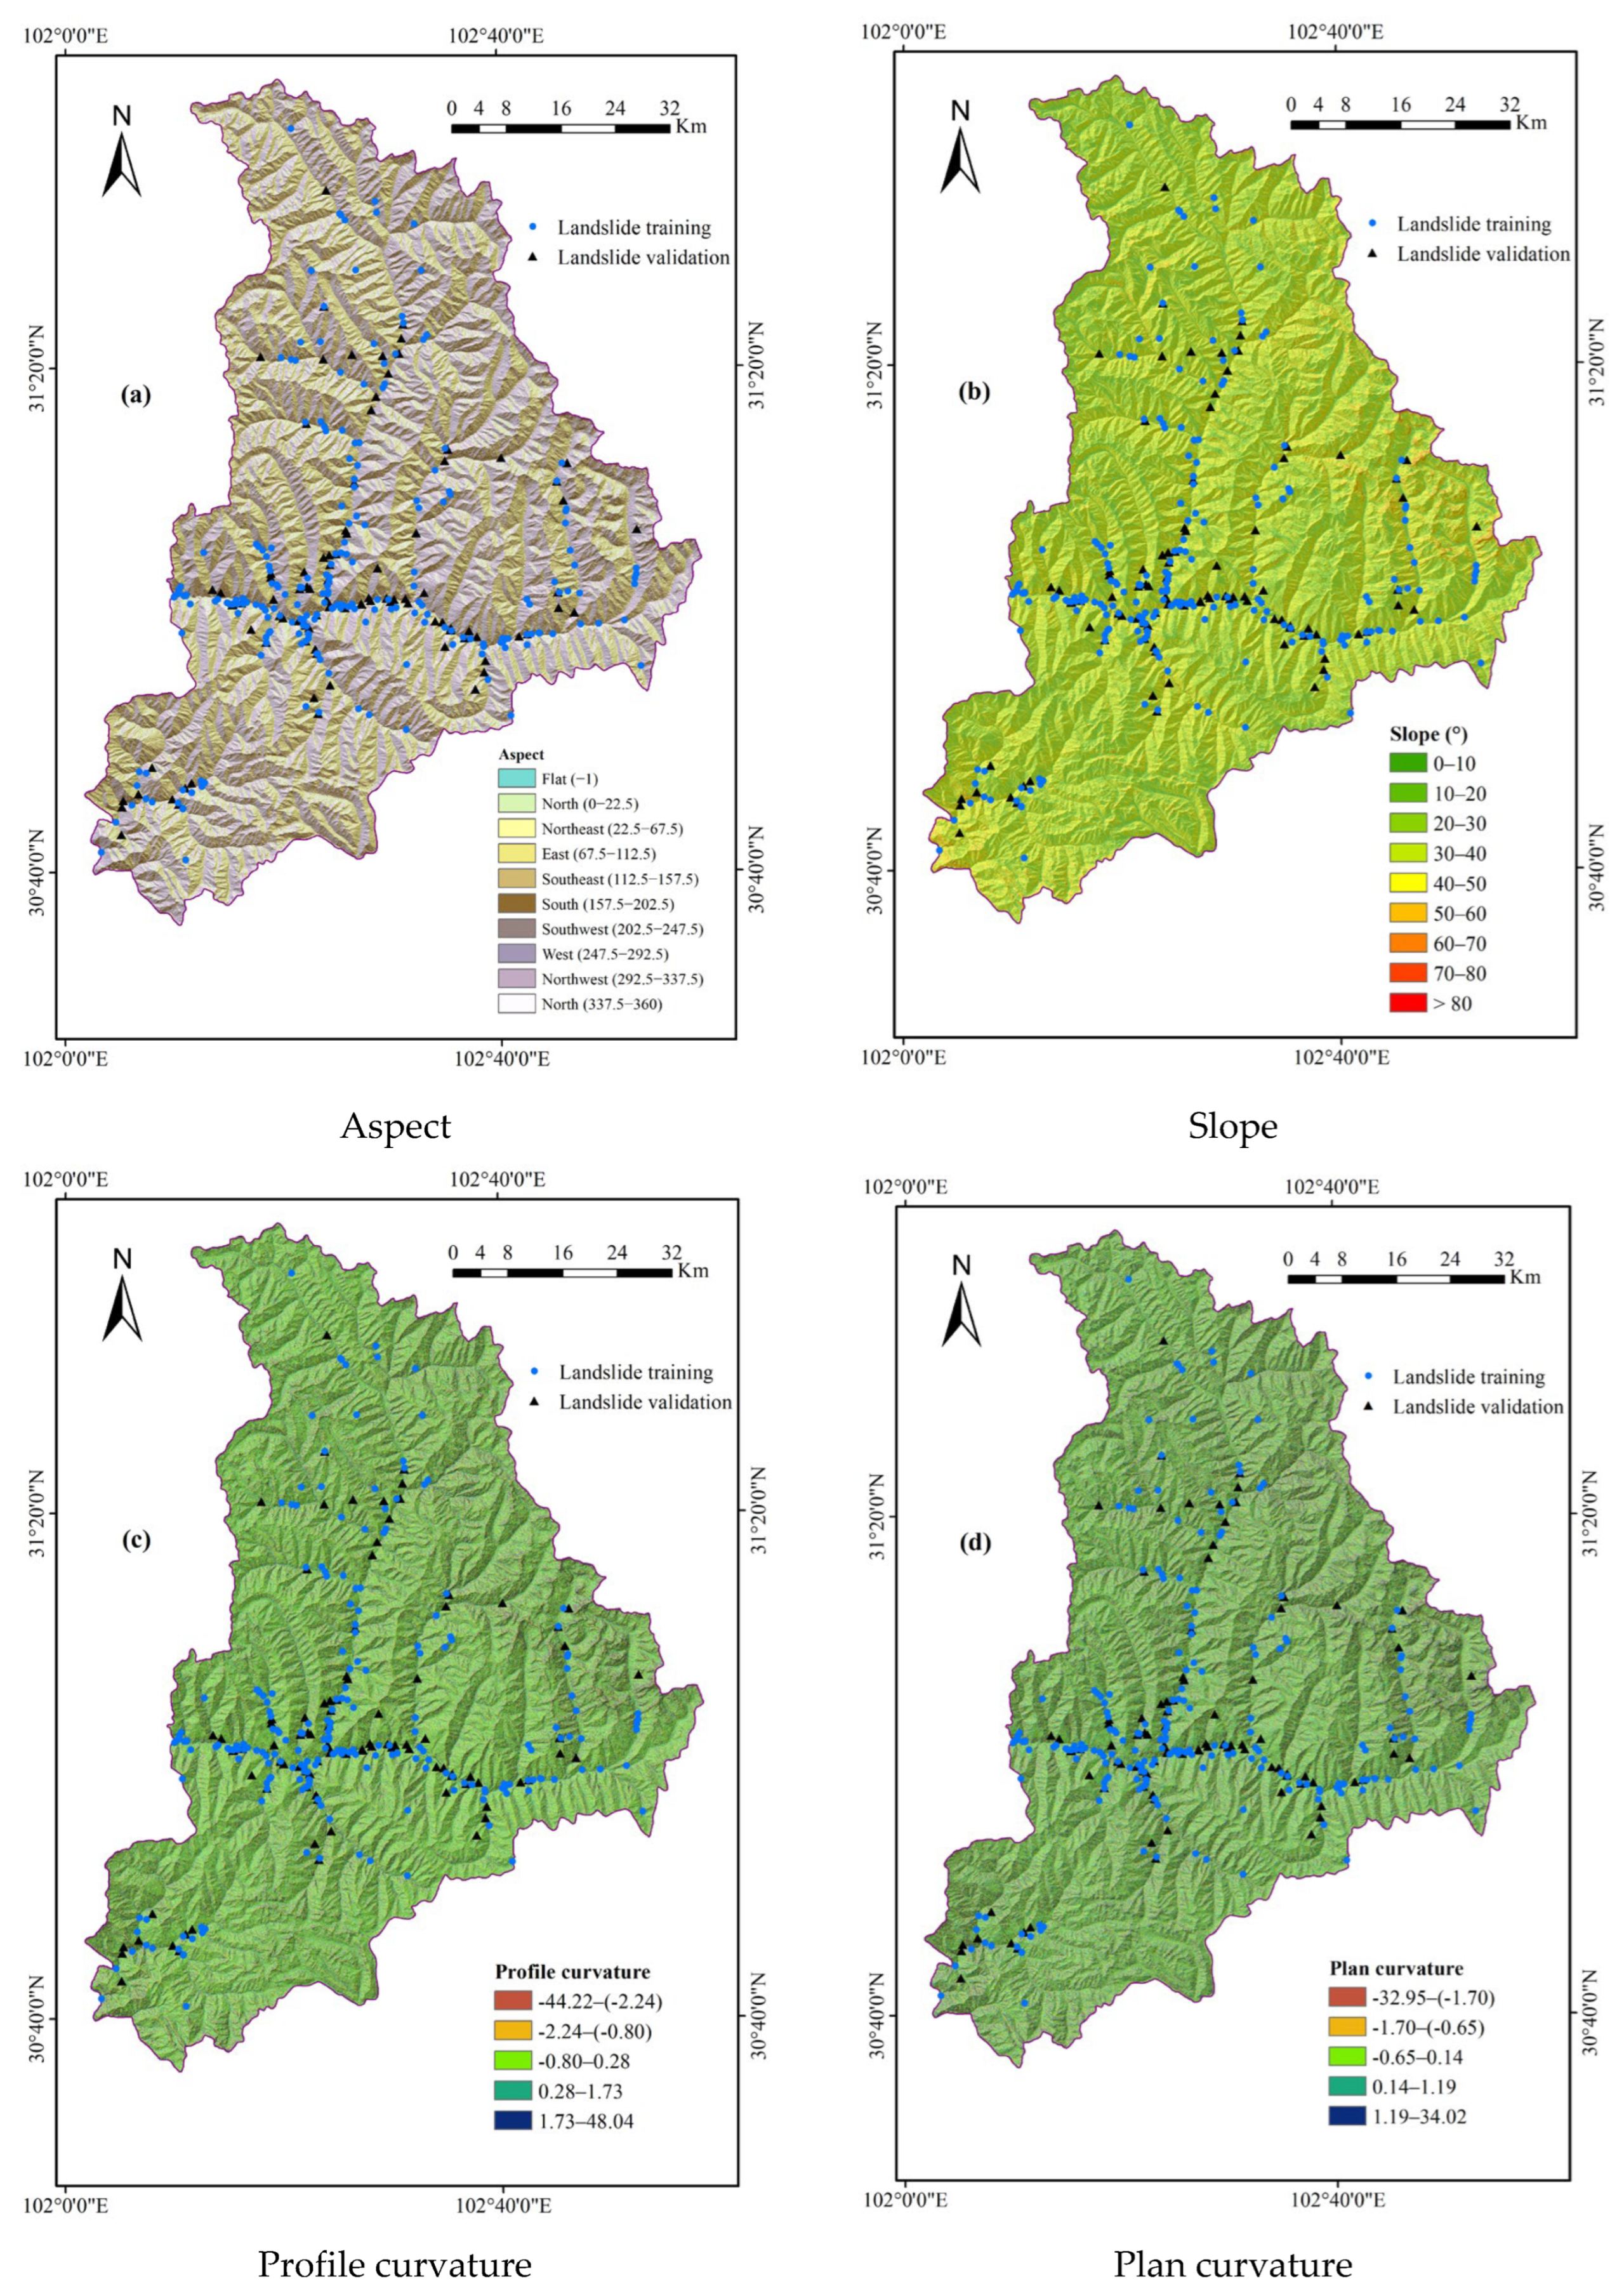
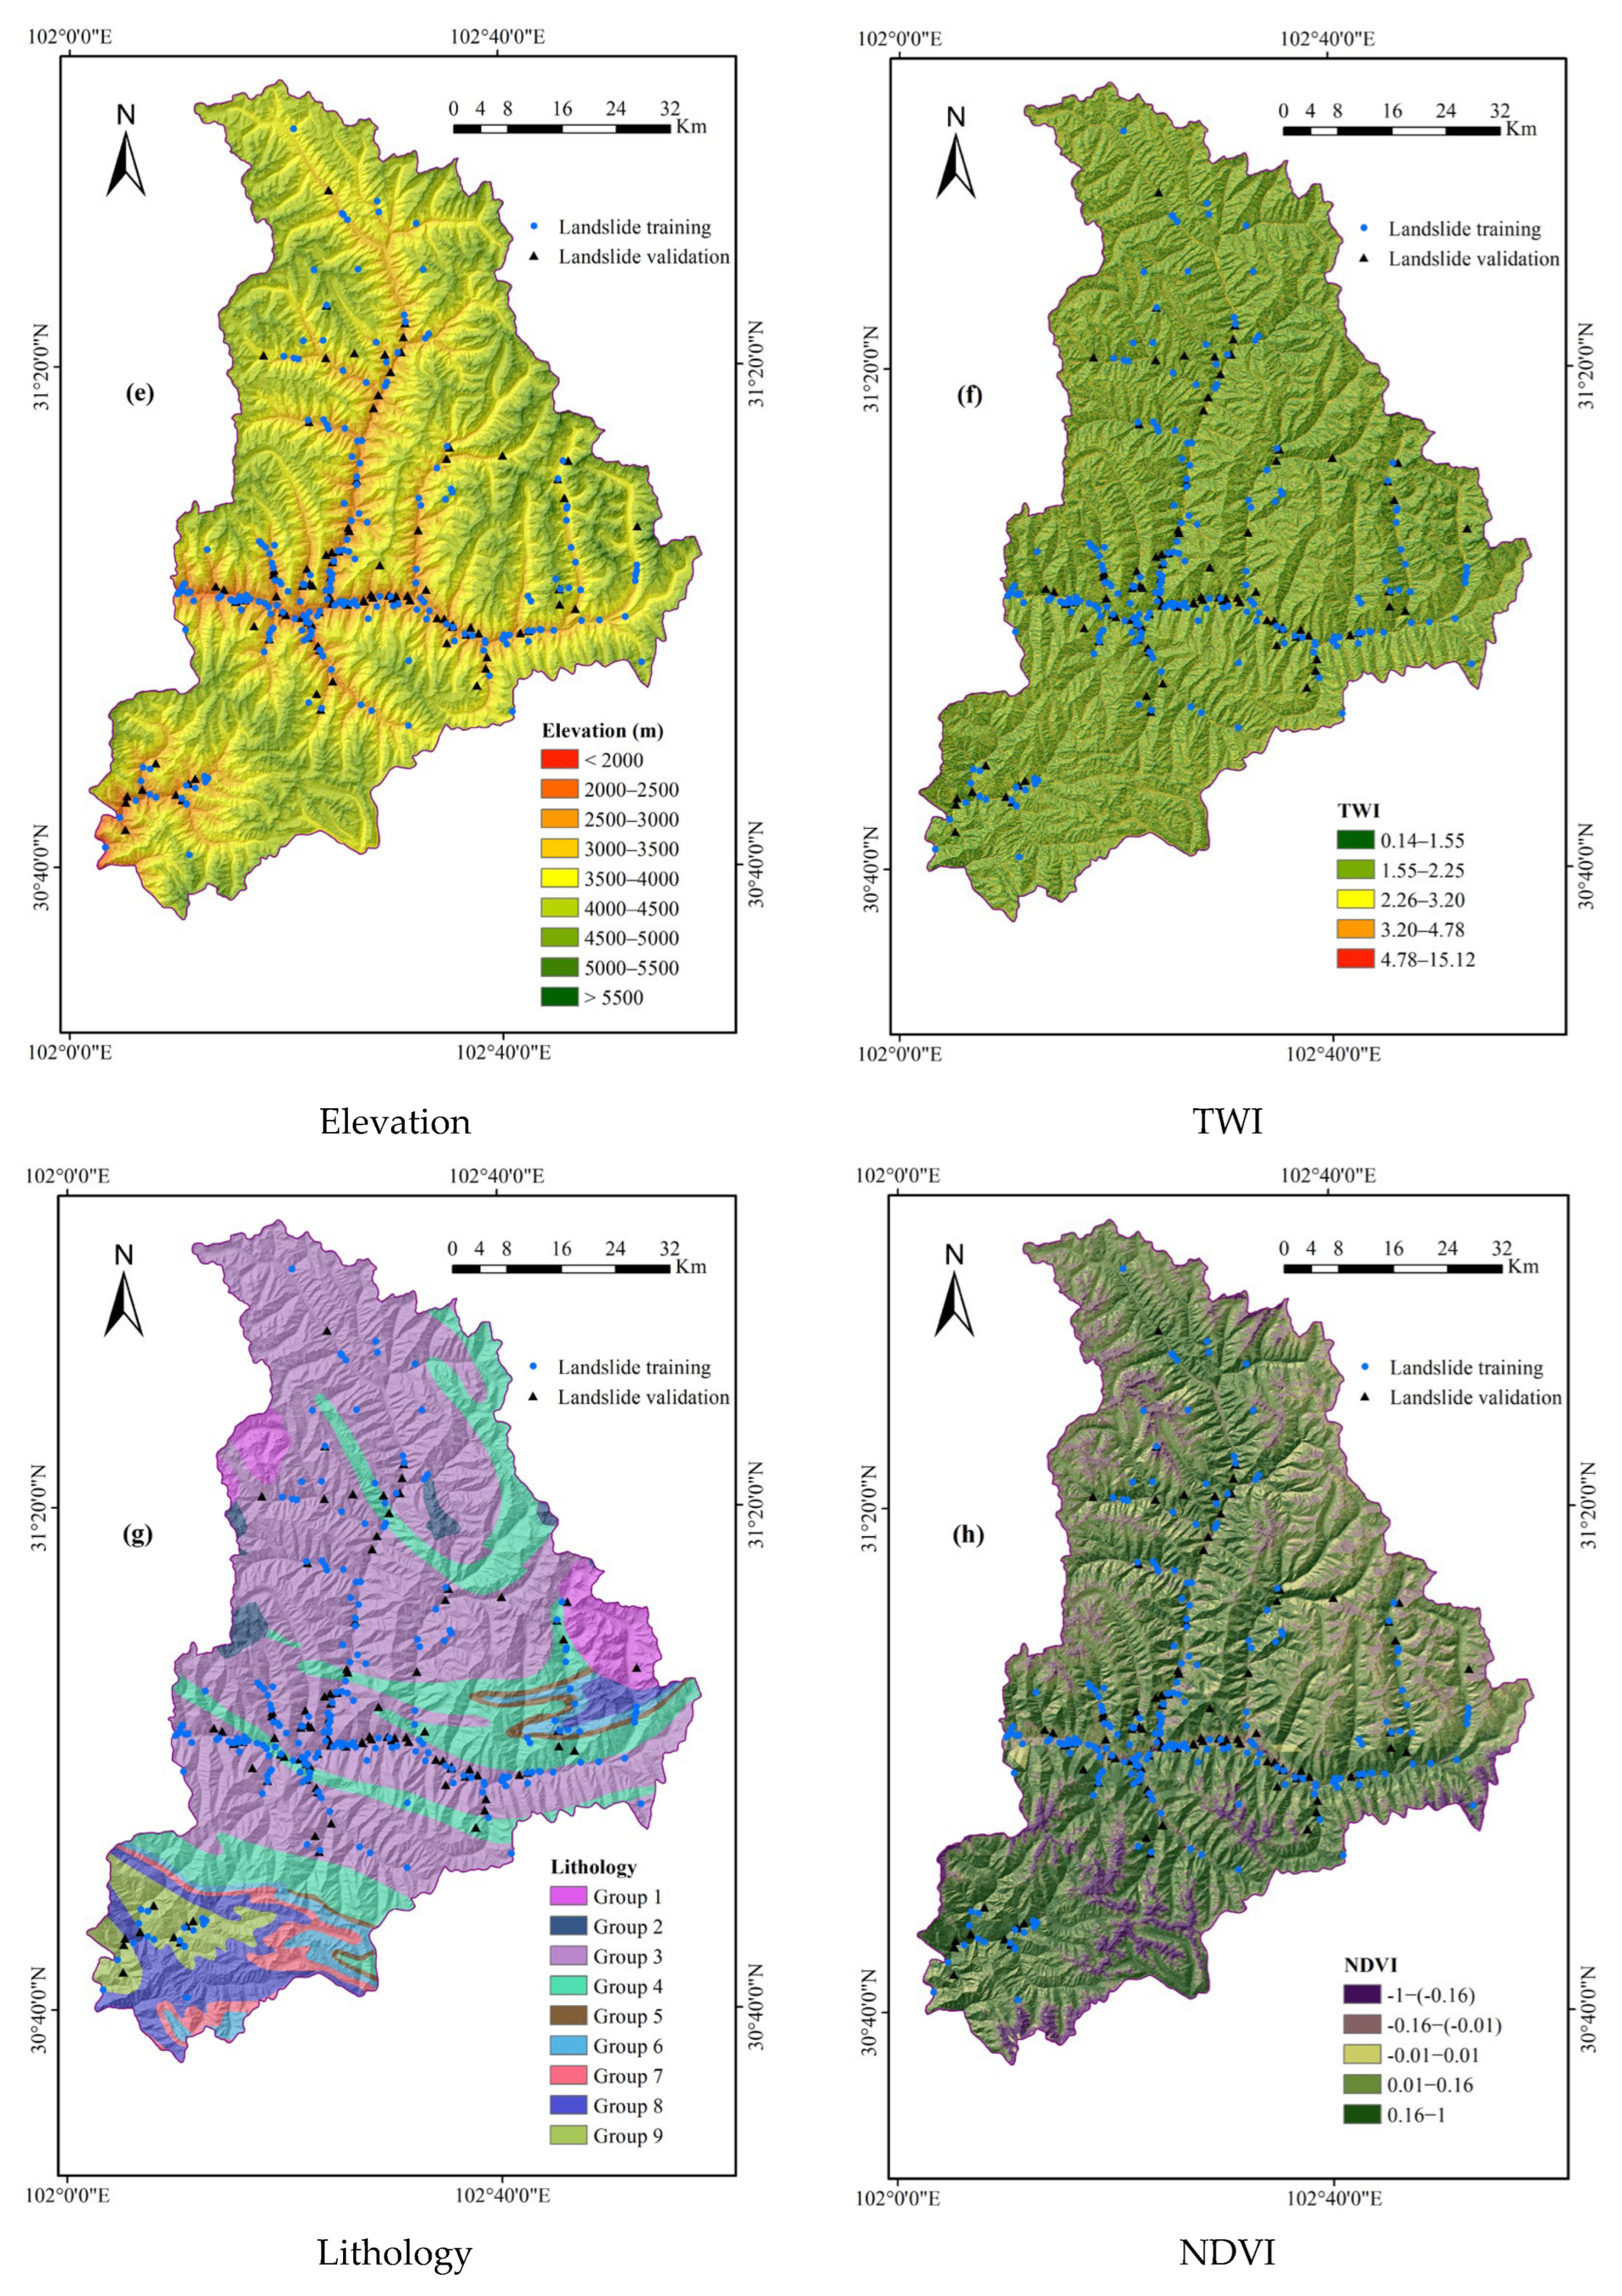
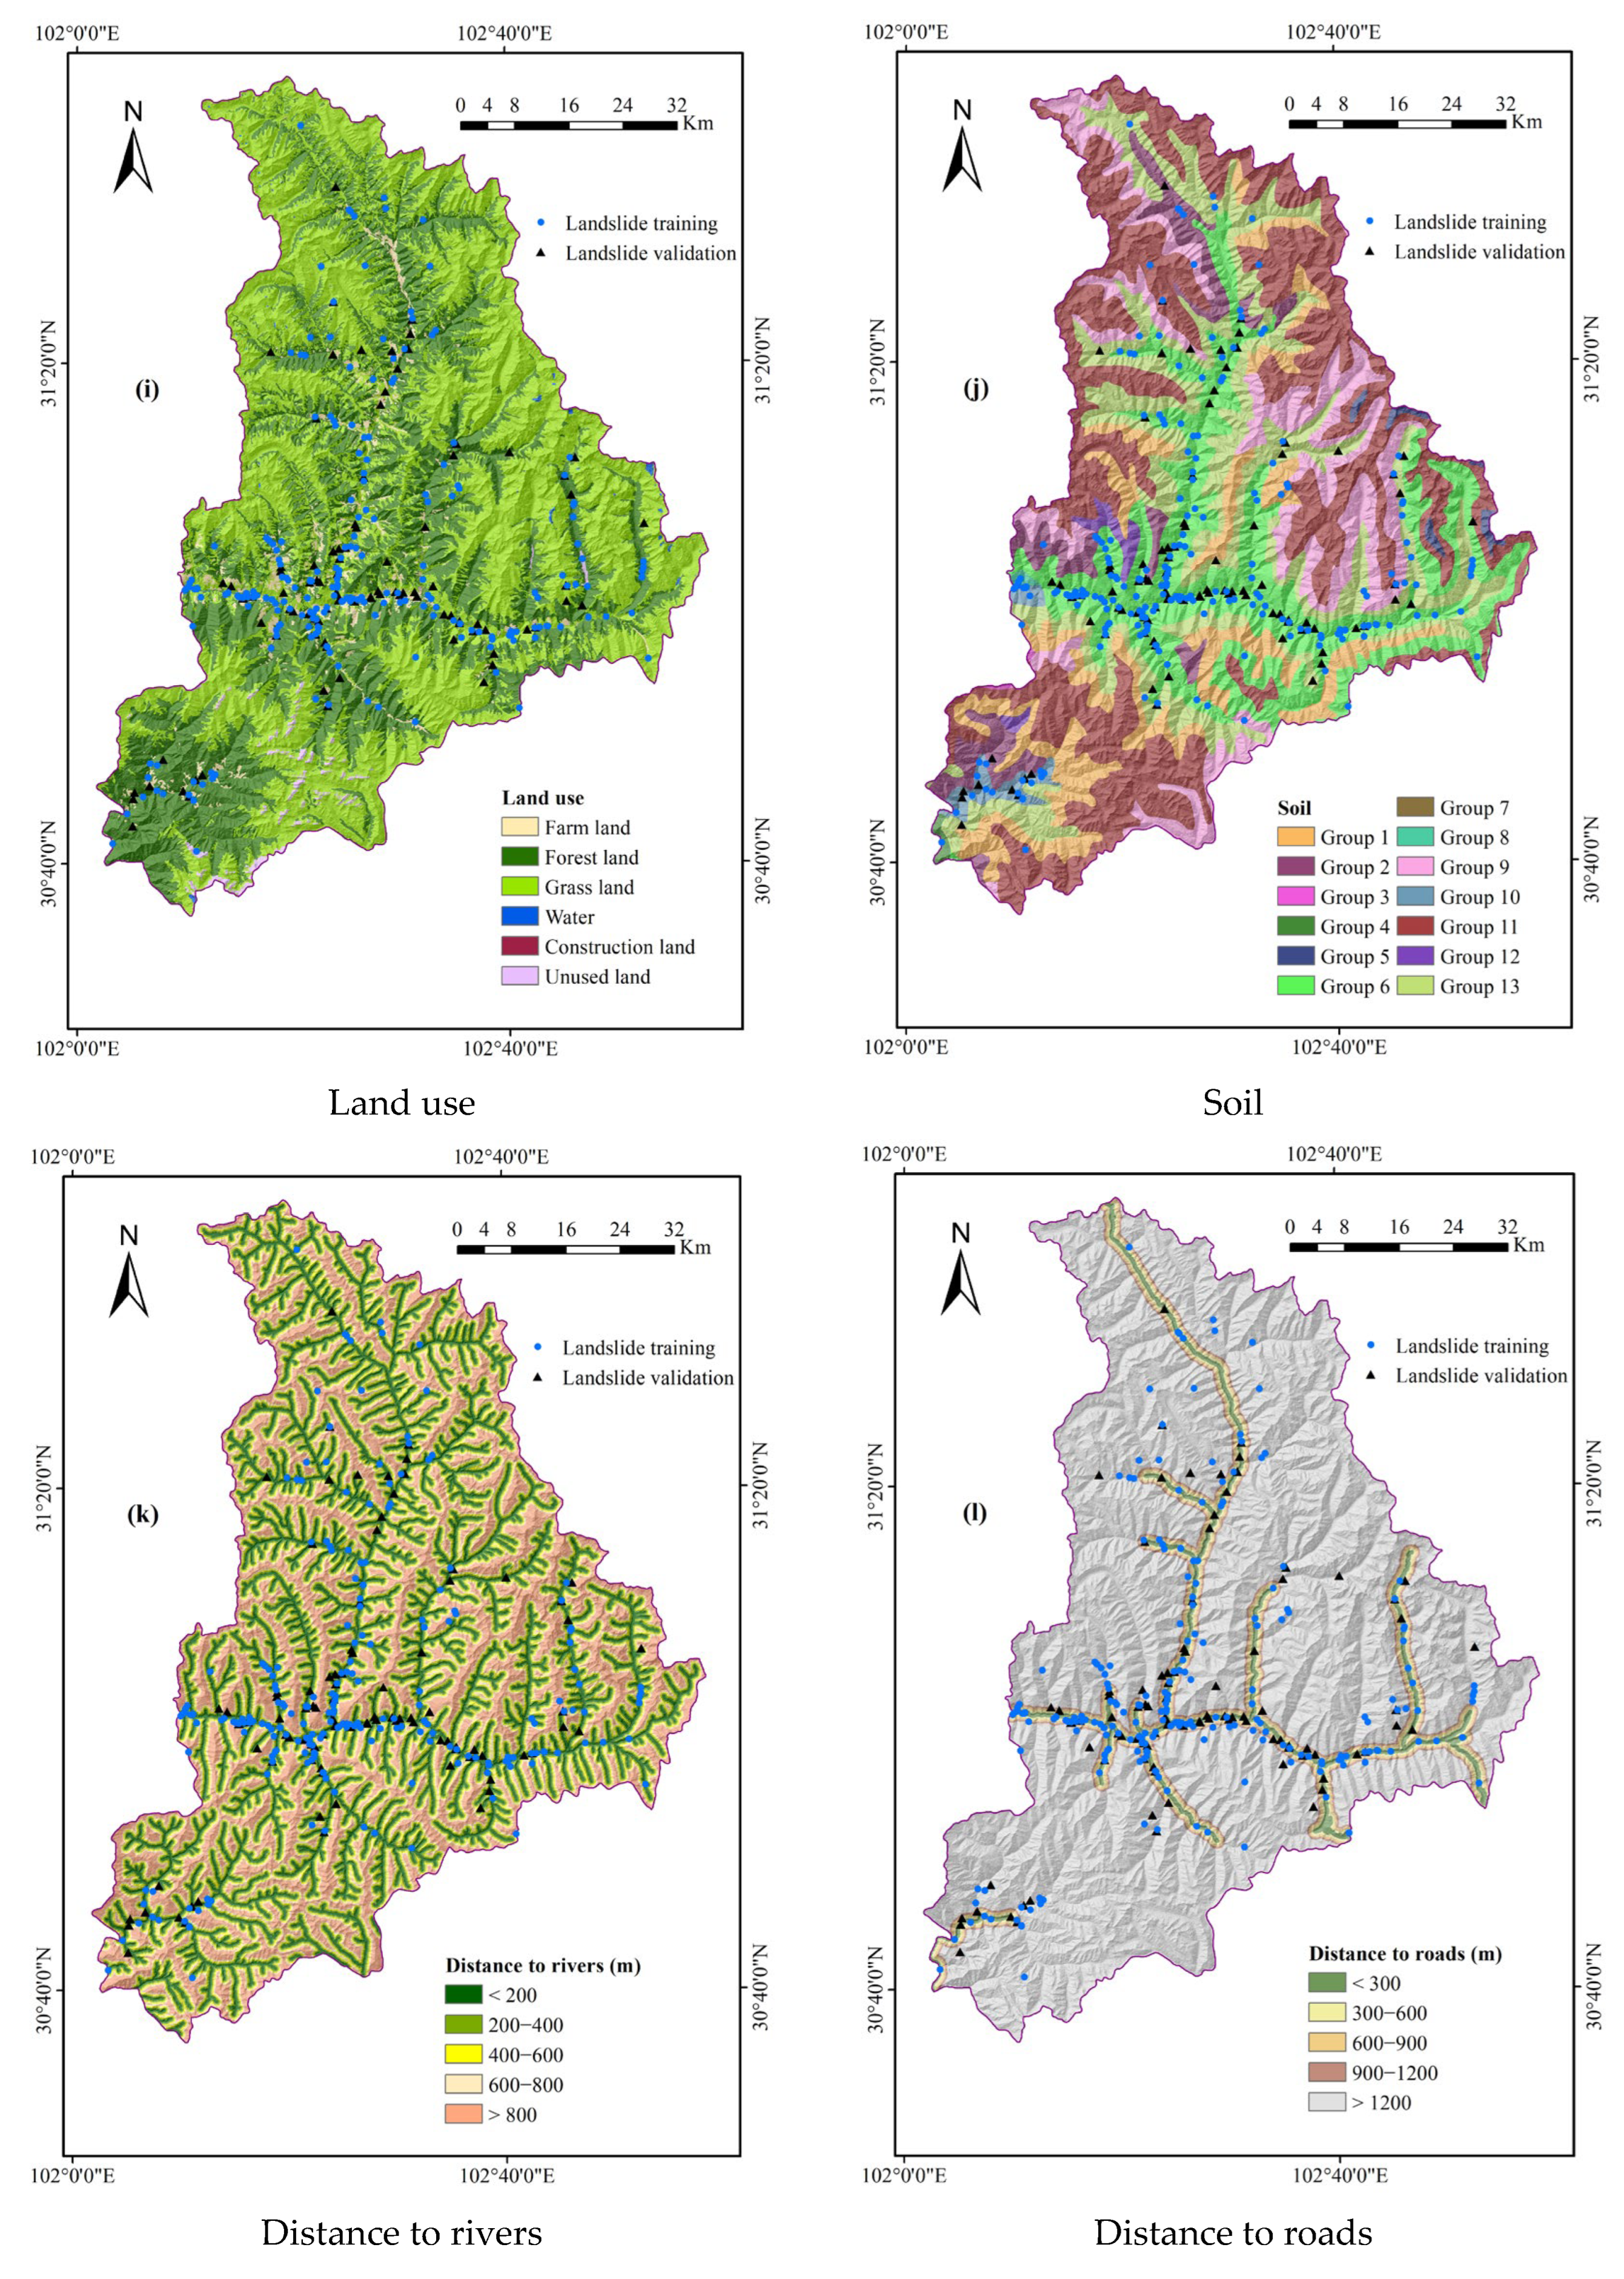
2.3. Landslide Conditioning Factors

In the present study, twelve landslide conditioning factors layers were selected by consulting many previous studies and geomorphological characteristics of the study area [31,32,33]. The landslide conditioning factors layers are illustrated in Figure 2. In subsequent parts of the study, the digital elevation model (DEM) was first prepared, using a DEM at 20 m × 20 m resolution downloaded from ASTER Global DEM. Aspect, slope, plan curvature, and profile curvature are terrain factors, which can be extracted by DEM. Distance to rivers, distance to roads, and lithology are geological factors that can be extracted from the 1:500,000 scale geological map. In this study, the slope aspect was reclassified into nine groups (Figure 2a). The slope was reclassified into nine categories (Figure 2b). The profile curvature map was produced by GIS software and reclassified into four classes with a natural break method (Figure 2c) [34]. Similarly, the plan curvature was also dealt with by GIS software and reclassified into four classes too: −32.95 to −1.7, −1.7 to −0.65, −0.65 to 0.14, 0.14 to 1.19, and 1.19 to 34.02, respectively (Figure 2d). The elevation maps are reclassified into 9 categories using the natural break method (Figure 2e).
TWI is an index used to characterize the impact of terrain changes on soil runoff [35,36], and its calculation formula is:
T W I = ln ( α / tan β )
where α represents the cumulative upslope watershed and β is defined as the slope gradient.
TWI is a hydrological factor, which can be processed in the “Topographic Analysis” and “Hydrological Analysis” modules of the ArcGIS platform based on DEM data.
In this study, TWI values were divided into five categories: 0.14–1.55, 1.55–2.26, 2.26–3.20, 3.20–4.78, and 4.78–15.12 (Figure 2f).
Lithology is the material basis for landslides [37,38]. The lithology map for this study was reclassified into 9 groups: Monzonite granite; Syenite; Metamorphic sandstone, phyllite, slate; Altered sandstone, slate, limestone; Tuffaceous sandstone, siltstone; Volcanic rock, breccia, tuff; Carbonate rocks; Metamorphic mudstone, sandstone and Clastic rock (Figure 2g). NDVI is a common factor reflecting vegetation coverage, which is determined by the red band (R) and the infrared band (IR), and its formula is:
N D V I = I R R I R + R
The continuous variable was re-divided into five groups: −1 to −0.16, −0.16 to −0.01, −0.01 to 0.01, 0.01 to 0.16, and 0.16 to 1 (Figure 2h). As an important landslide predisposing factor, land use has been often used by multiple researchers [39,40]. Land use data was separated into six types (Figure 2i). The map of soil was extracted from the 1:1,000,000-scale digital soil map of China offered by the Institute of Soil Science, Chinese Academy of Sciences (ISSCAS) (http://www.issas.cas.cn/, accessed on 10 August 2022). This study divided the soil units into 13 types: Brown coniferous forest soils, Brown soil, Brown subalpine meadow soil, Dry cinnamon soil, Rock, Calcareous cinnamon soil, Gleyed paddy soil, Grey cinnamon soil, Subalpine meadow soil, Cinnamonic soil, Alpine frost soil, Skeletal soil, and Dark brown soil. Distance to rivers and distance to roads are the factors with linear characteristics, which represent the impact of surface water and human activities on landslides (Figure 2j) [41,42]. Distance to rivers and distance to roads maps were classified into five buffers (Figure 2k,l).

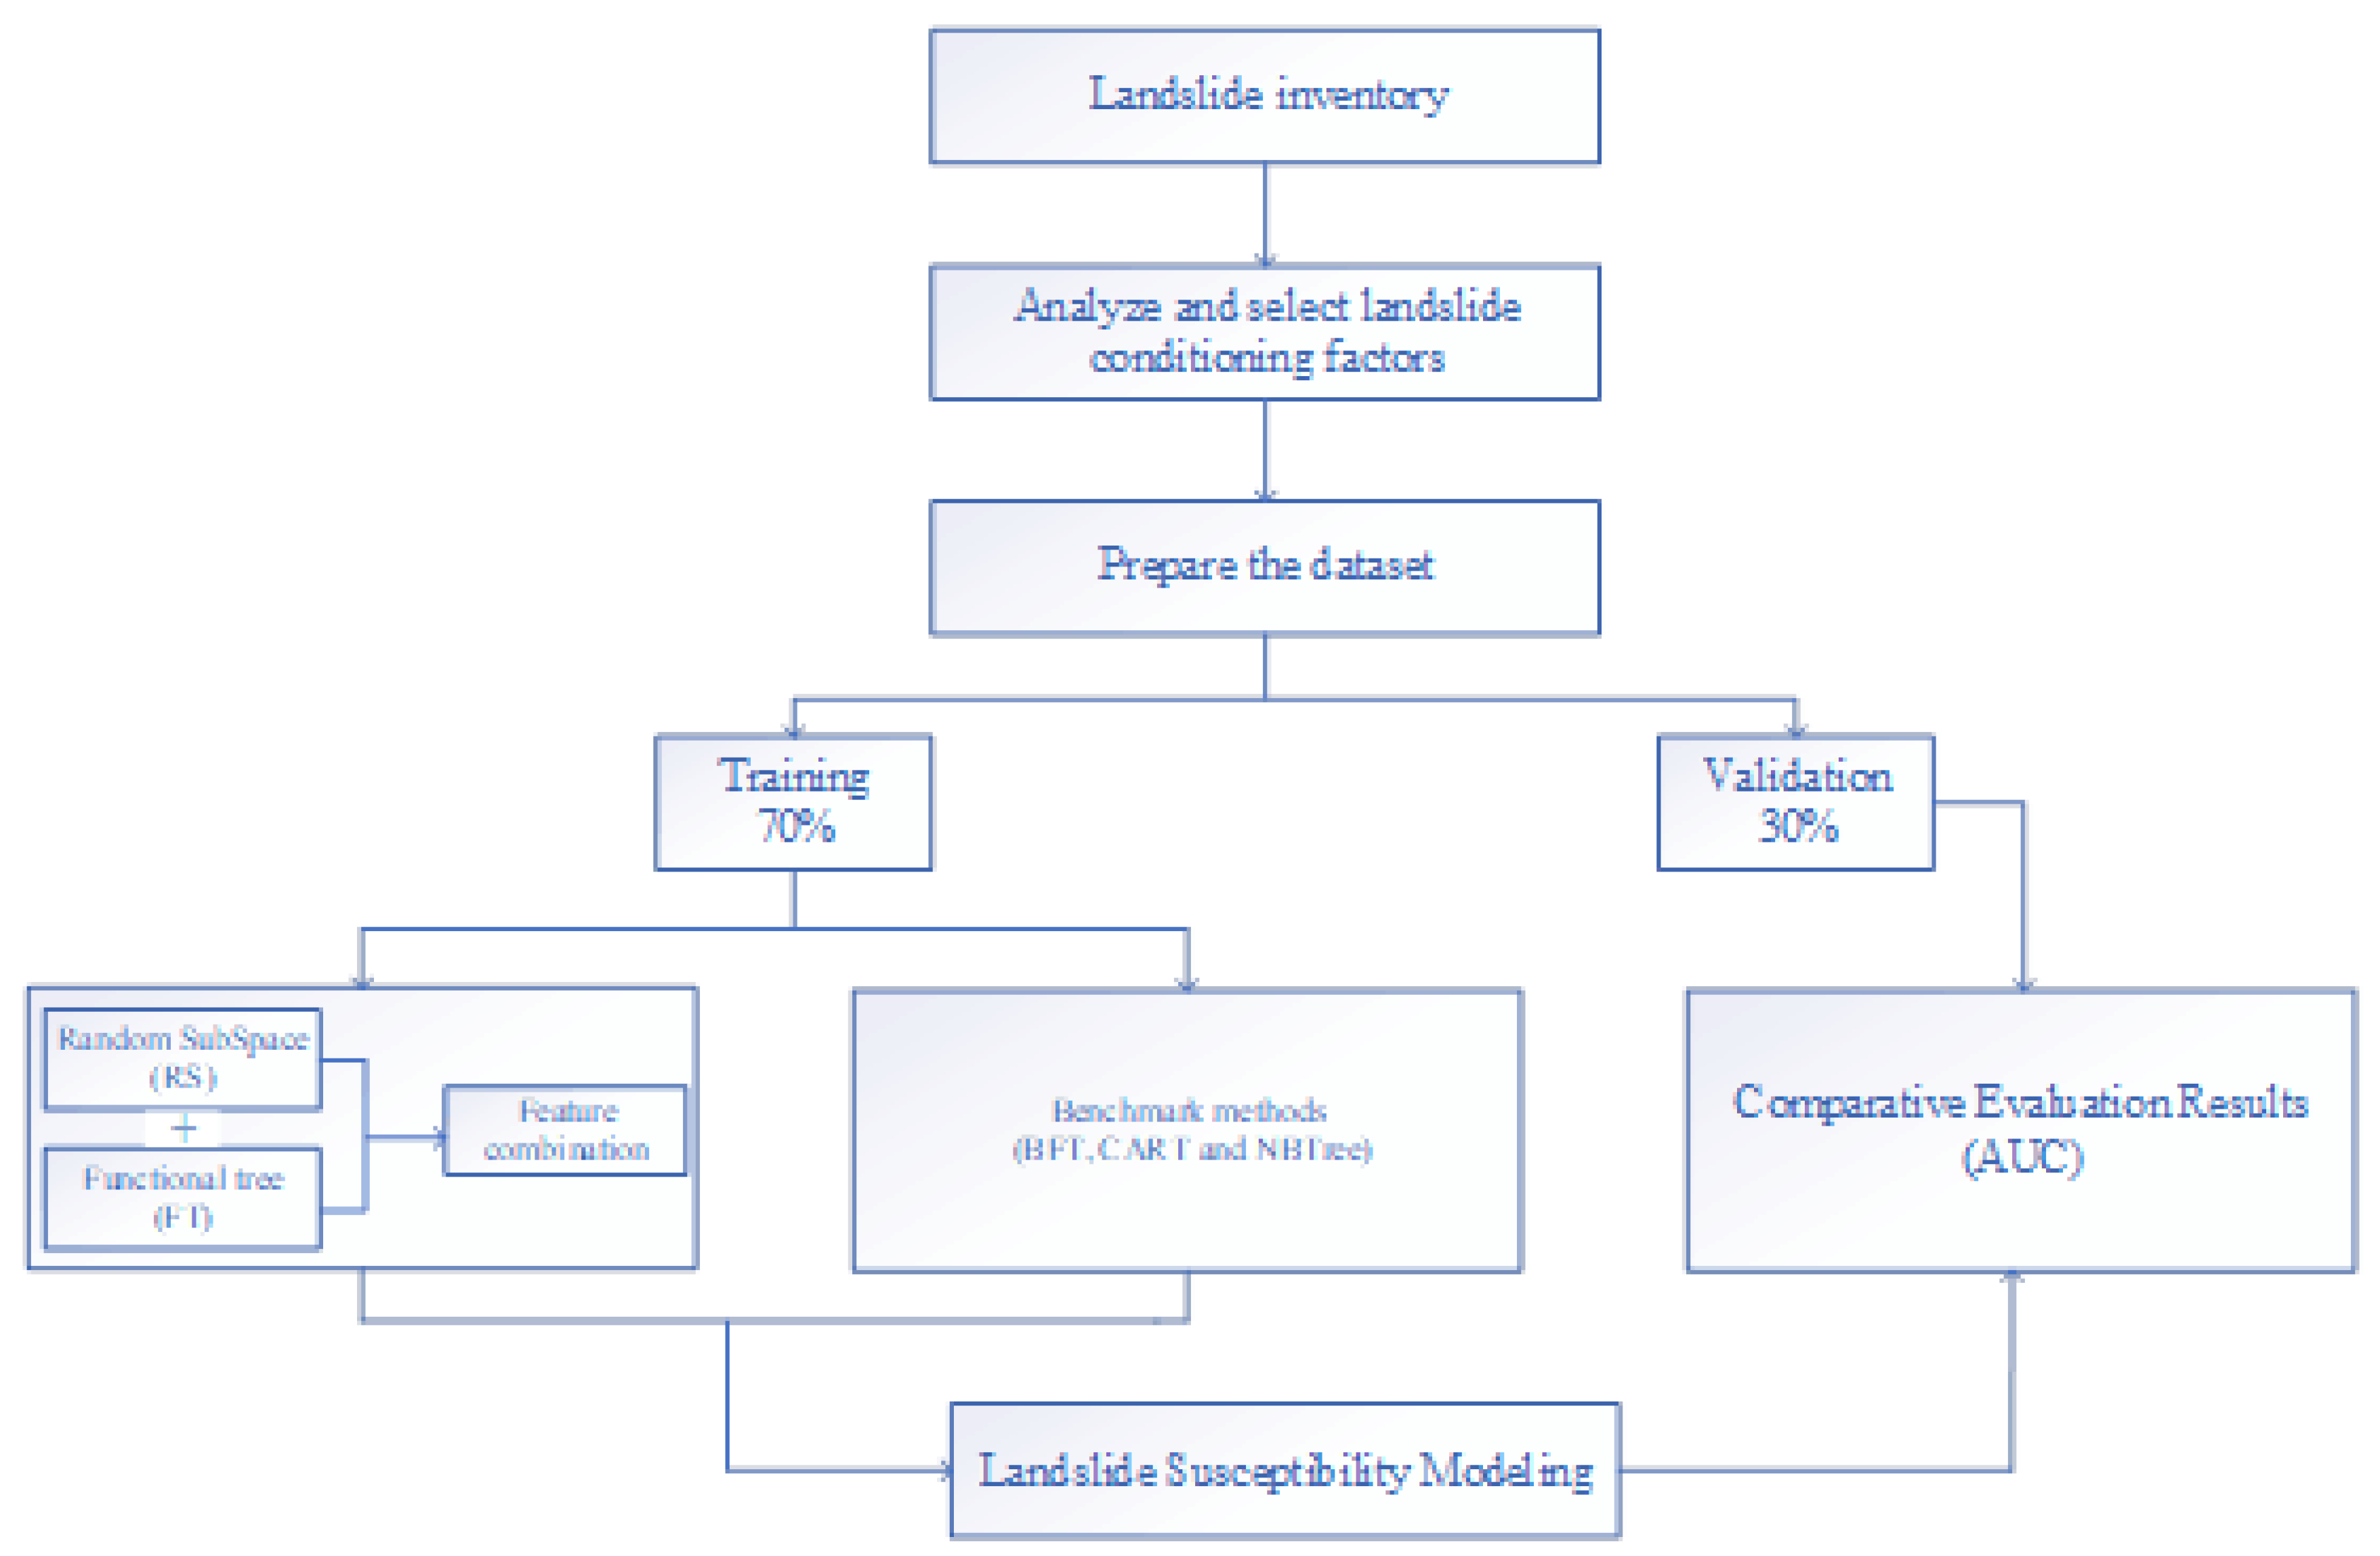
3. Modelling Approach

The research process mainly includes conditional factor selection, LSM modeling, and model validation (Figure 3). First, conditional factor selection includes analyzing factor correlation based on the FR model and applying the FT method to judge factor importance. Then, the LSM is modeled using the new RSFT ensemble model. Finally, the area under the ROC curve (AUC) is used to validate the results and compare the performance difference with other benchmark models.

3.1. Frequency Ratio (FR)

The frequency ratio model is based on the spatial relationship between the observed landslide distribution and each landslide condition factor and can be used to determine the level of correlation between landslide location and geological conditions in the study area [7,43]. The relationship between the landslides and conditioning factors can be characterized by calculating the FR value, the formula is as follows:
F R = P e r c e n t a g e o f l a n d s l i d e P e r c e n t a g e o f d o m a i n
A higher FR value shows that the probability of landslide occurrence is higher in the class.

3.2. Random SubSpace (RS)

As an ensemble learning method, the random subspace (RS) is also called attribute bagging or feature bagging and is produced by Ho to strengthen the weak classifiers [44]. The model combines two algorithms, firstly generation of the low dimensional subspaces by stochastically sampling the vector of the original high dimensional feature, secondly the multiple classifiers mixed into those random subspaces at the end of the predictive outcomes [45,46]. In other words, the difference between the RS model and other methods is that the features of the origin training dataset were selected randomly. In general, RS performed better than other traditional ones, such as the bagging method, as their integrated learning differences [26,47].
Nowadays, the RS has been widely applied in many filed, such as computer science [45], machinery manufacture [48], mathematics [49], electronic science [50], and so on, however, it was rarely used in the geoscience-related research fields, in particular, the study of landslide susceptibility. In this paper, this method was prepared to predict the landslides’ spatial distribution features in Xiaojin County and it can be introduced briefly as follows:
Suppose the vector X = {x1, x2, x3, …, xn} is the landslide conditioning factor vectors in this paper. From the RS integrated pattern, two classes (landslide or non-landslide) were classified by combining multiple classifiers. N samples of size Z were selected randomly from uniformly distributed X without any substitution [51]. The RS has subspace X, with each sample representing a subset by definition. After that, a subset of the whole training dataset was used to train the classifier [52].

3.3. Functional Tree (FT)

The Functional tree (FT) model is a hierarchical model that was proposed in 2001 and applied in constructing the multivariate tree’s framework for addressing classification and regression problems [53]. During the procession of prediction, the FT model mainly uses the properties of functional leaves or functional inner nodes or the combination of functional inner nodes and leaves. The main differences between these three are functional inner nodes are a way to reduce deviations, functional leaves are a process of reducing variance and the combination of functional inner nodes and leaves performs well in big data processing [28]. Compared with other traditional hierarchical models, the FT model can predict the function leaves based on the segmentation of the functional inner nodes by logistic regression function, rather than comparing attributes of the input value and the constant values to divide the input on a tree node [53]. The good or bad of the FT model was mainly determined by the smallest instance number of each leaf, the number of guide iterations, and function tree selections [54].
Although the FT model has been gradually applied in scientific research, its application in landslide susceptibility is still uncommon [55]. A brief introduction of the FT model is given below:
Suppose Y = {y1, y2, y3, …, yn} represents the attribute of each landslide conditioning factor, g = gn, n = landslide or non-landslide classes. The FT model in this research application was considered to have the following three steps: (1) selecting the linear Bayesian discriminant function to construct the g = g(yn) model, namely the distribution probability of landslide and non-landslide; (2) using new landslide conditioning factors to extend yn and establish new tectonic dataset, nevertheless, every new landslide conditioning factor represents the probability of yn that can belong to landslide or non-landslide; (3) choosing the landslide conditioning factors from the original data set. Finally, all the new data sets were used to build the classification tree.

4. Results

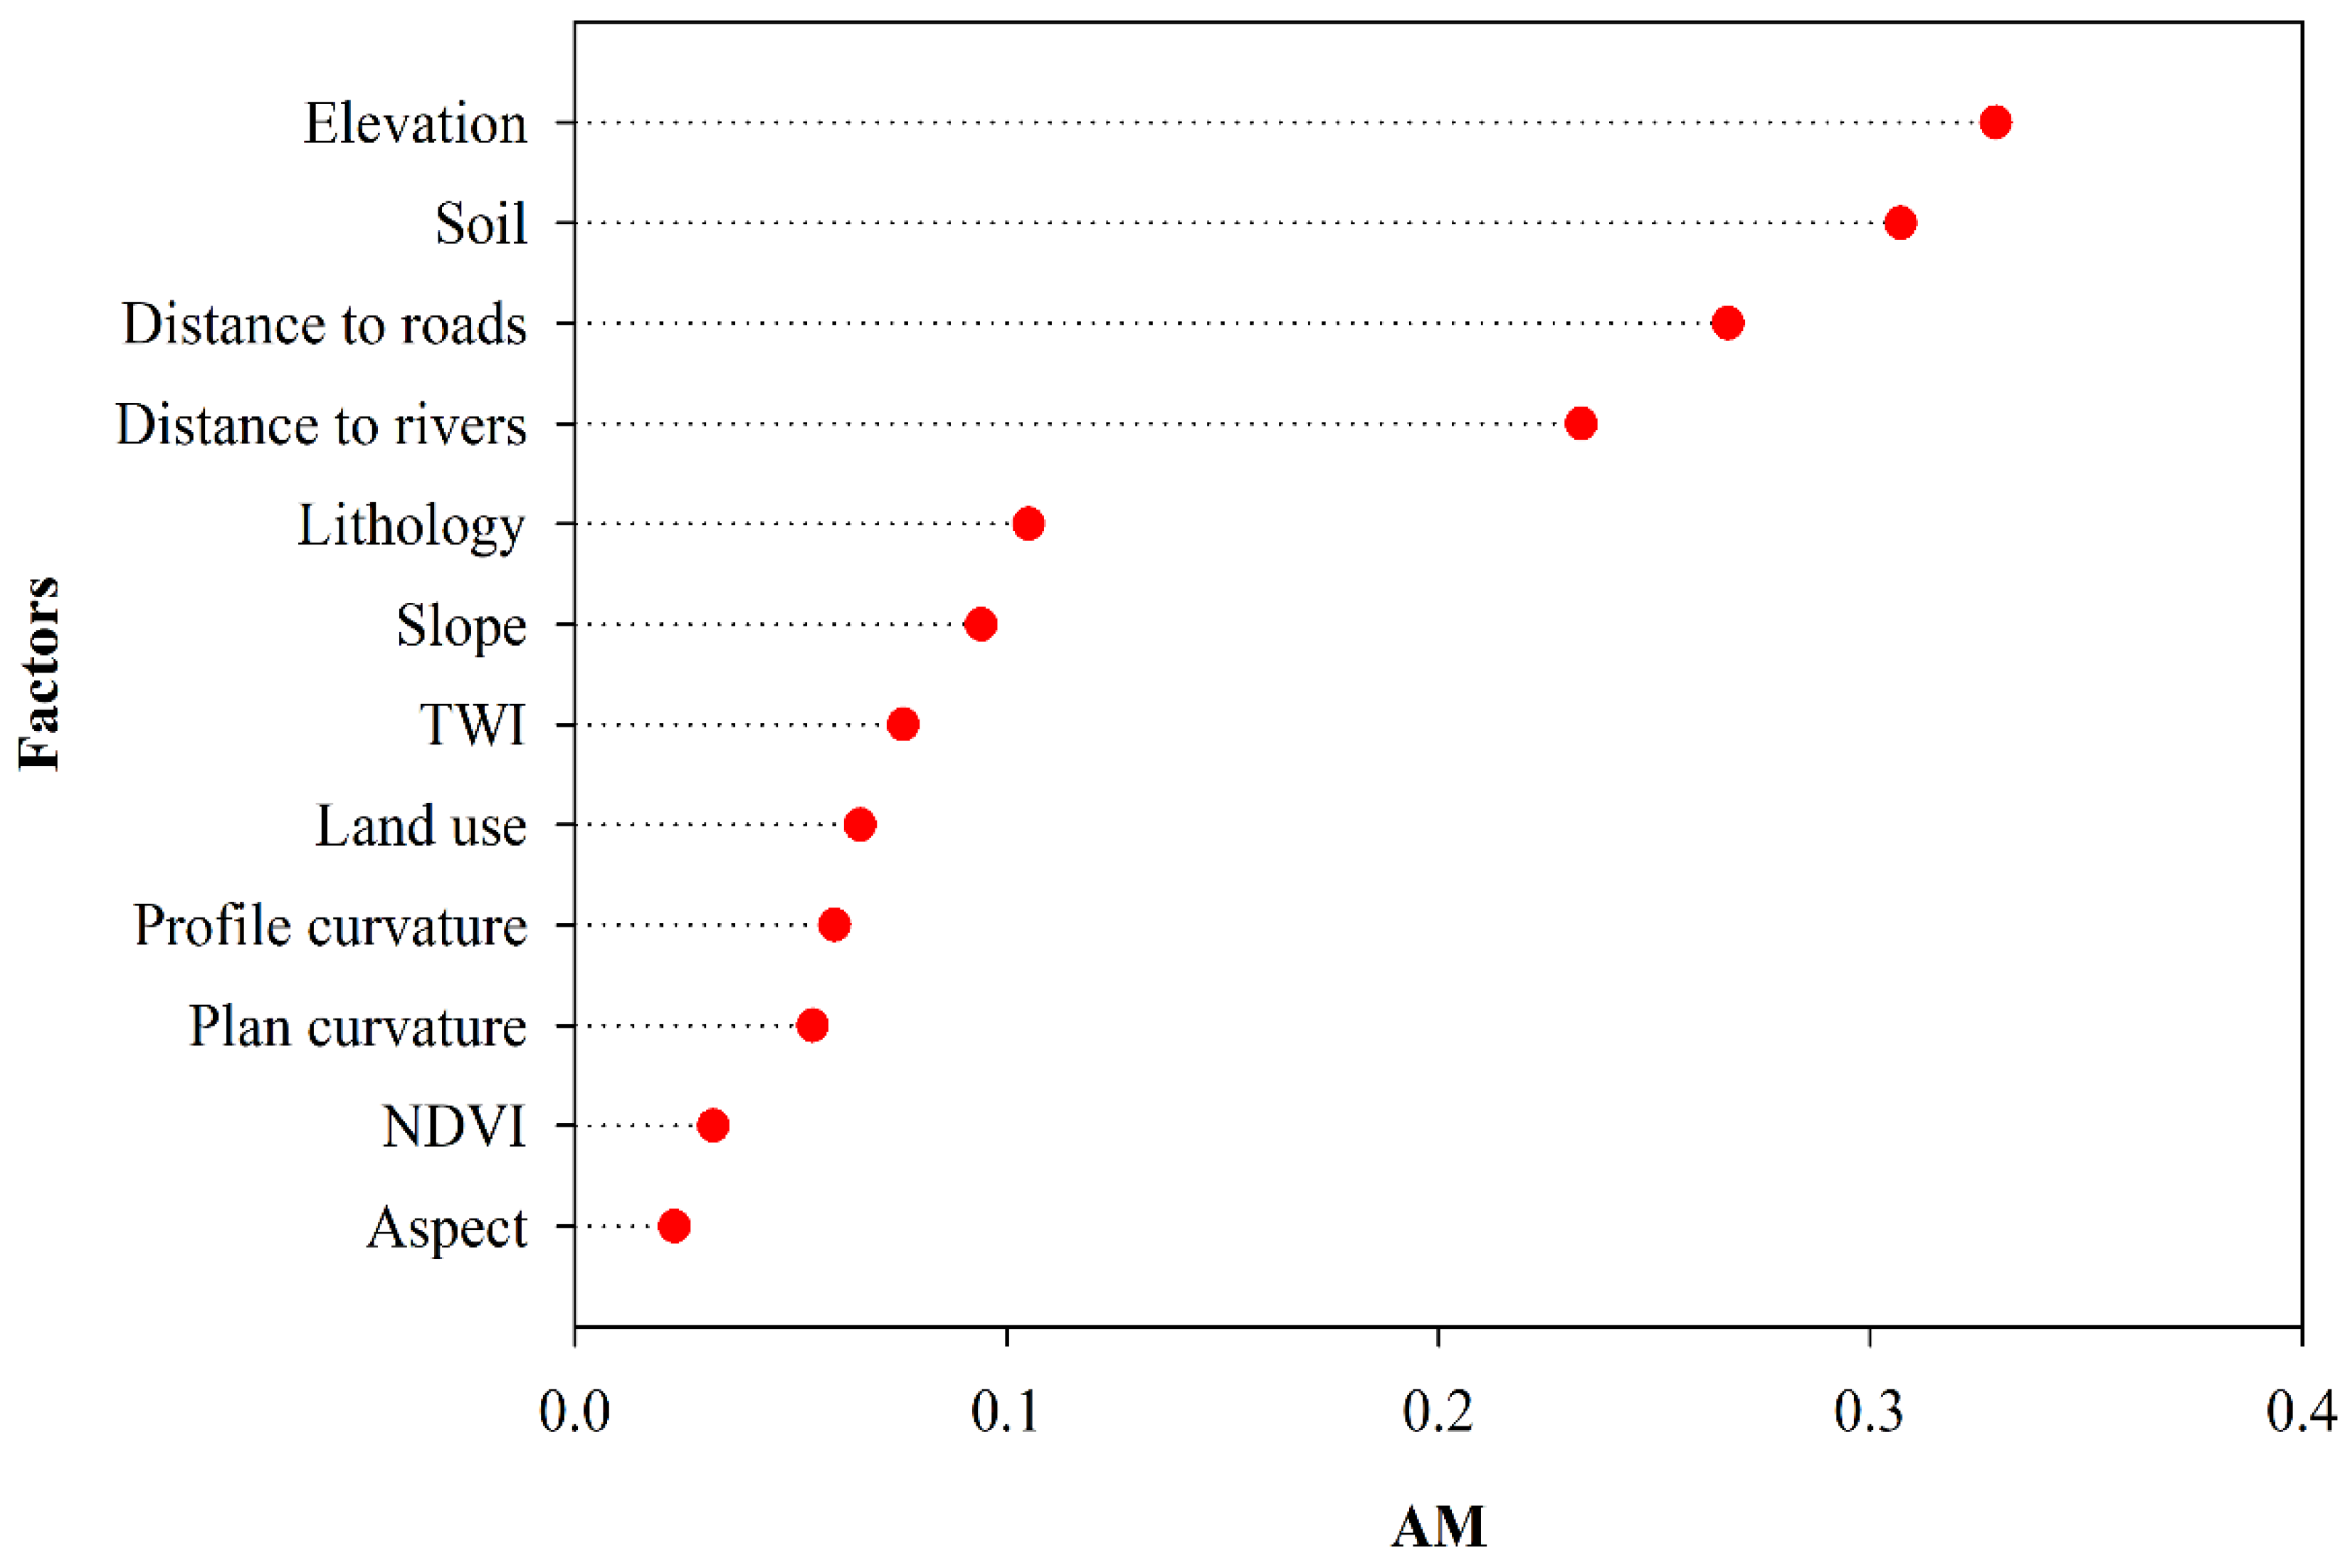
4.1. Selection of landslide Conditioning Factors

The right choice for some suitable landslide conditioning factors is the basis of landslide susceptibility assessment, which appears a conclusive role in the study as an input variable [56,57]. Identification of conditioning factors in this section was used, the immediate next step was to diagnose the importance of factors, and the final result was shown in the scatter plots (Figure 4). This study was based on the FT model and used 10-fold cross-validation to calculate the average merit (AM) to obtain the contribution of the conditioning factors. By comparing the AM values of each conditioning factor, it could be seen that the four most important landslide factors in the modeling process were elevation (AM is 0.320), soil (0.287), distance to roads (0.273), and distance to rivers (0.210). The remaining eight less important predictors all have AM values greater than 0.

4.2. Correlation Analysis Using Frequency Ratio Model

The calculated FR value is applied to measure the spatial relationship between each factor category and landslide (Supplementary Table S1). The higher the FR weight of each class of the training factor was, the higher the relevance level of the class would be. From the FR report of all factor classes, as shown in Table S1, construction land of land use type has the greatest impact on landslides, with the FR value up to 63.033. However, the number of landslides was only 3 in this class. This is because the region of this class is very small with low pixel resolution. Next, area with higher susceptibility for landslide occurrence was these classes of elevation 2000–2500 m (FR = 25.37), elevation <2000 (FR = 16.614) and distance to roads <300 (FR = 13.737). From the above result, human activities have a high impact on historical landslides hazard, which is reflected in fundamental buildings and road constructions. For the TWI factor, the higher the value rank of TWI, the higher the potential calamitous is, which is consistent with [58]. Different types of soil also influence the landslide probability considerably. This study detailed distinguished thirteen soil types. Among them, Grey cinnamon (7.452) and Cinnamonic (7.174) have a large correlation with landslides, the second largest is Calcareous cinnamon (3.382) and Dry cinnamon (2.31). For slope angle, overall, the flatter the slope is, the more the landslide exists. This corresponds to subsequent analysis in this paper of elevation analysis because the topography is rather steep in higher parts. The relationship between landslides and lithology reflects how the types of rock and soil in Xiaojin County affect landslide occurrence. The two highest FR levels were Clastic rock (1.712), and Metamorphic sandstone (1.302) are metamorphic rock and sedimentary rock. This means that there is a low rate of landslide occurrence in the areas with magmatic rock [59]. Other factors also show some regularity, for example, south, north, southwest, and northeast aspects are denser with landslide events; For the Profile curvature and Plan curvature, intermediate value are more likely to landslide, and the skewness is a small positive value in this study [60]. The closer to the river, the larger the harm caused by a landslide. However, when the land type is construction land, the FR value is abnormal (FR is 63.033), which may be due to the fact that landslide susceptibility is greatly affected by human activities.

4.3. Models Results and Analysis

According to the relevant studies [31,61,62], the prediction capacity of machine learning techniques was compared using AUC values of the training and validation datasets. The ROC curves and model performance of FT and RSFT models using a 70% training dataset are placed in Figure 5 and Table 1. This conclusion only illuminates that the RSFT model fitted higher than the FT model due to the AUC and accuracy values of 0.881 and 0.808, respectively.
After building the models, validation of the model effects is a process that can capture the most meaningful and important information for prediction modeling, and the models have no validation which would result in no actual value [63,64]. Similar to building the evaluation models, the ROC curve was also applied but the effect of validating models was different. The ROC curves and model validation of FT and RSFT models are shown in Figure 6 and Table 2, respectively. This conclusion can illuminate that the RSFT model has the highest classification accuracy (0.838) of the two assessment models for the validation dataset, followed by the FT model (0.812).

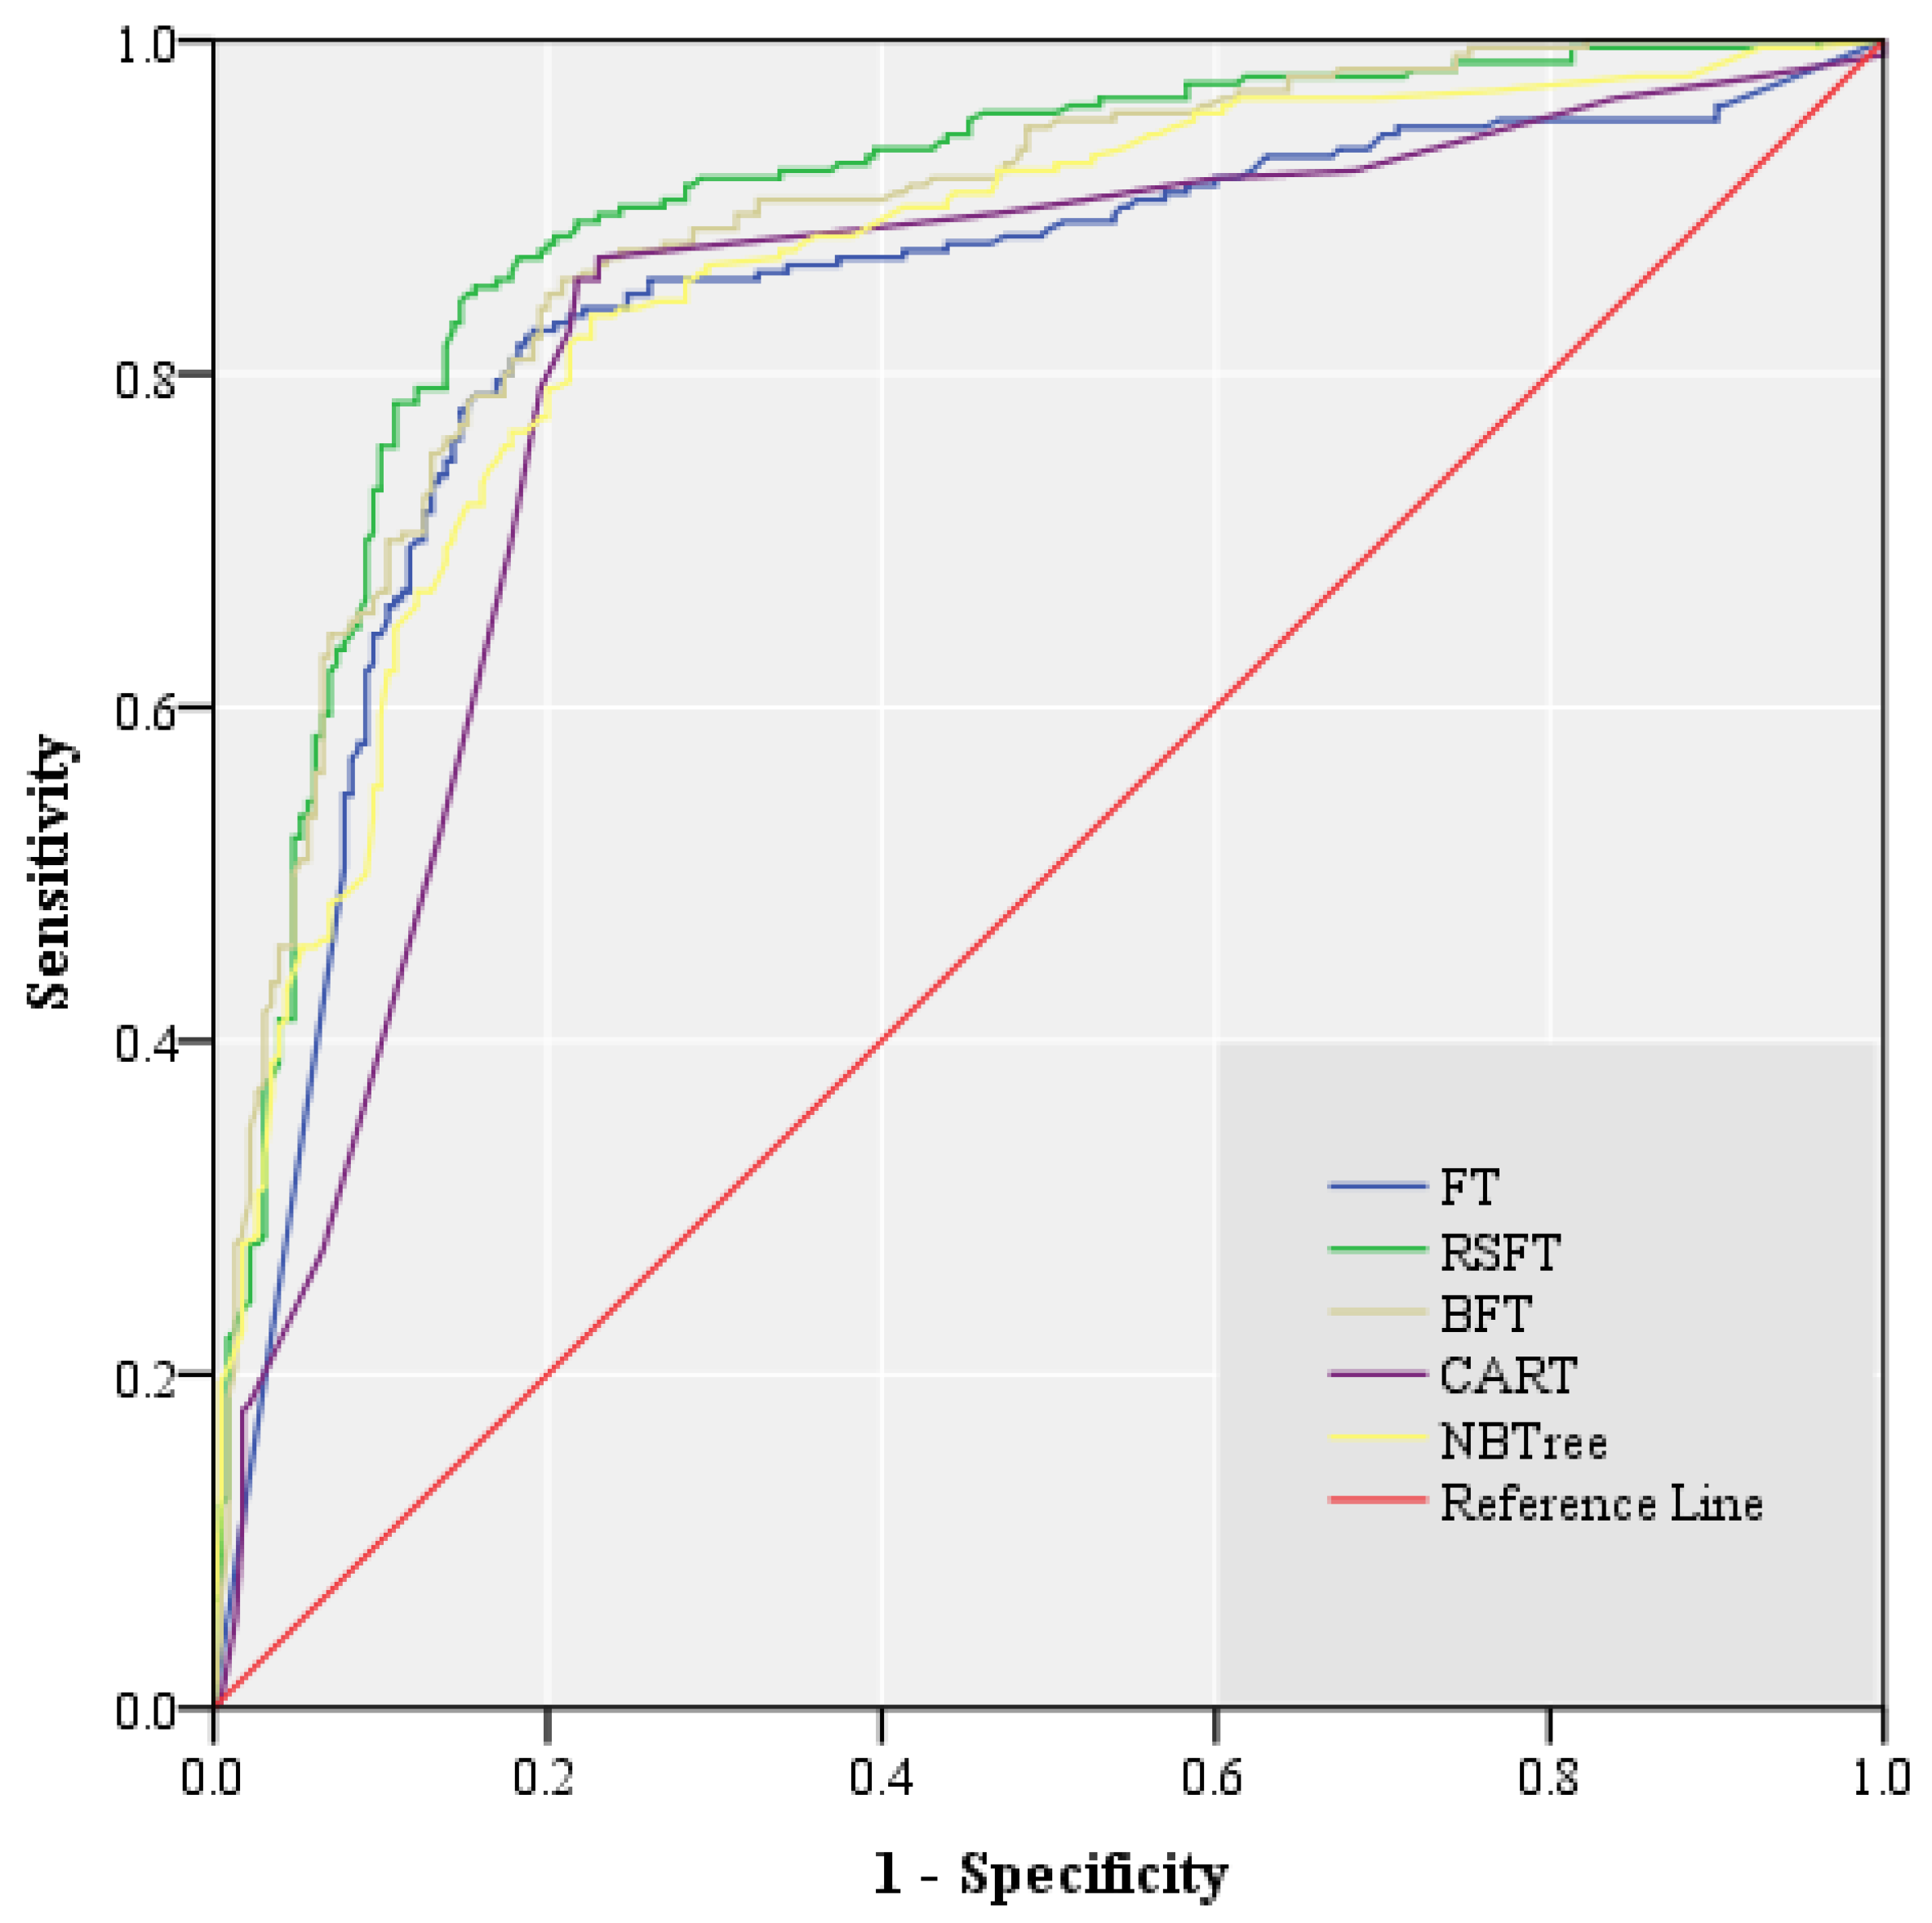
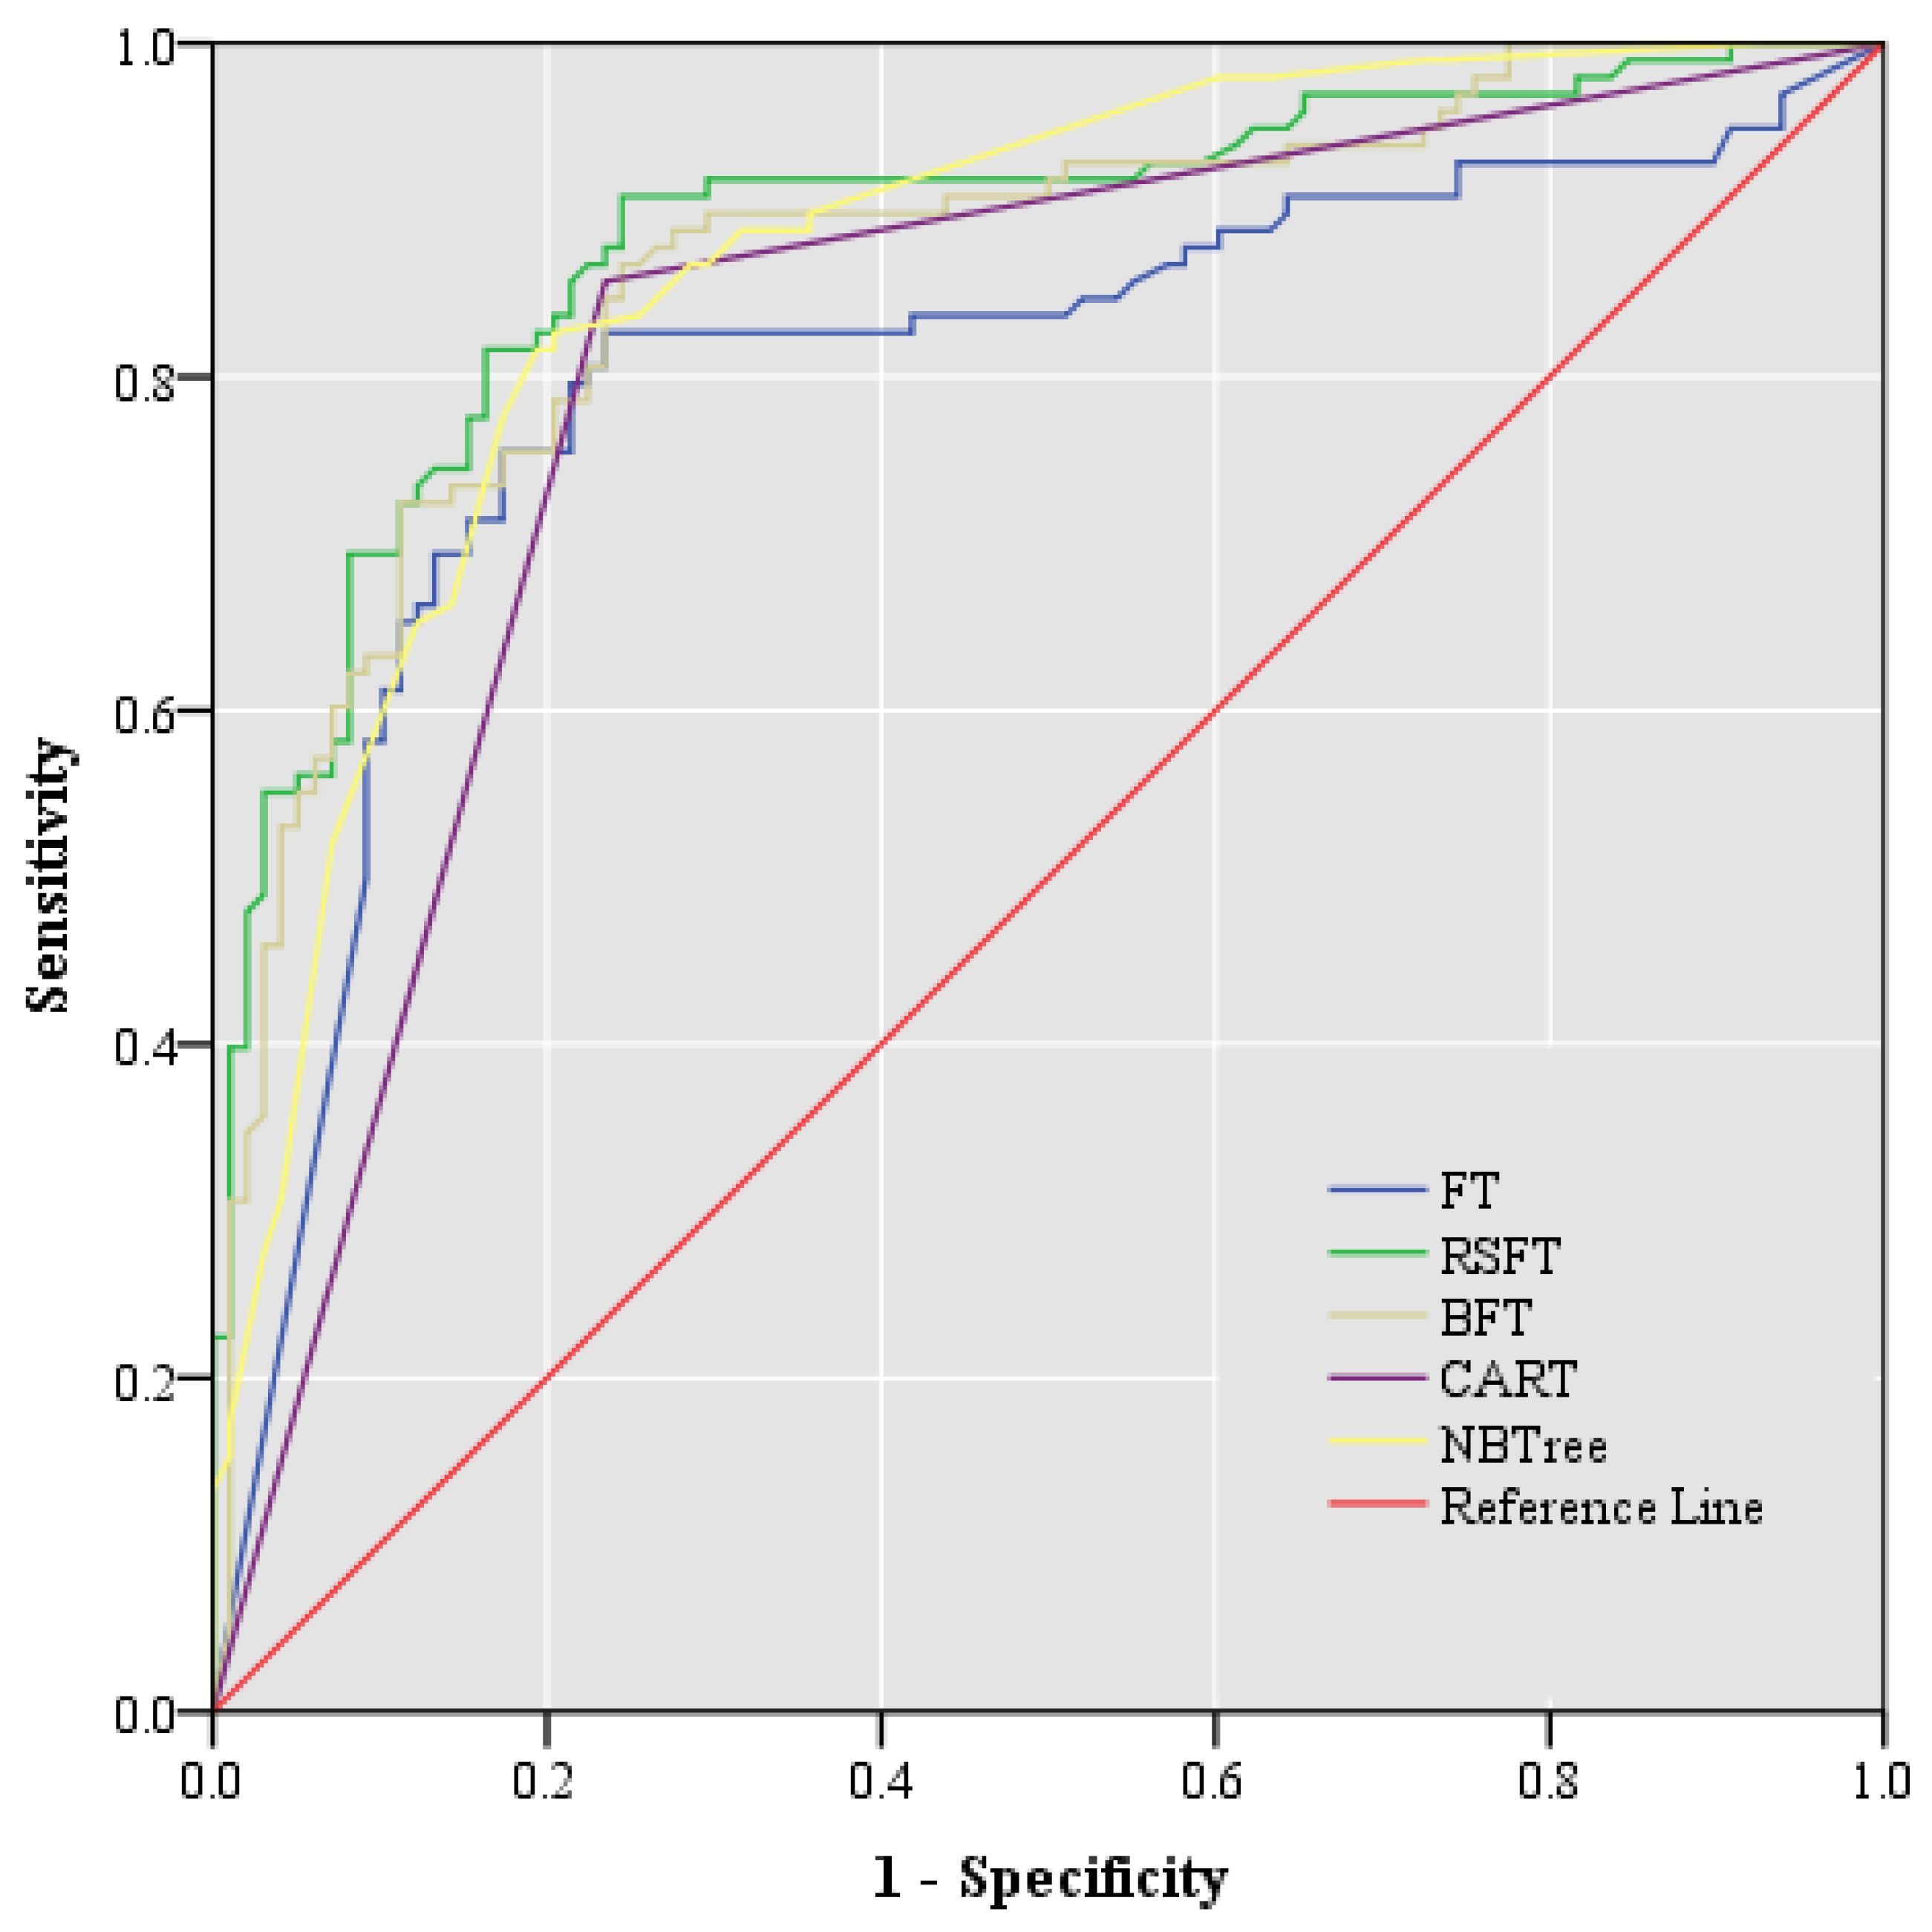
4.4. Comparing with the Benchmark Methods

As mentioned above, RS and FT models were seldom applied in landslide susceptibility research. In-depth studies are more needed to explore the effectiveness of the above models, the paper takes three commonly used models as the benchmark models, namely BFT, CART, and NBTree models. The BFT model is one of the earliest inventions of new ensemble models based on the bootstrap sampling strategy [65], which has been extensively used in mining existing landslide data [66,67,68]. The CART model has been honored as one of the 10 major data mining algorithms [69], which is based on the Gini index to divide the sample dataset into two sub-sample datasets and applied in many assessing model fields [21,70,71]. Similarly, the NBTree model is another top 10 major data mining algorithm, which is consisting of the Naïve-Bayes technique and decision tree model more generally useful for big data analysis and classification problems because of its recognized briefness and practicability properties [72,73].
The training dataset and validation dataset used to establish the benchmark models are the same as RS and RSFT models. The ROC curve and performance of benchmark models in the training area are shown in Figure 5 and Table 1. The AUC values using the training dataset are 0.856, 0.809, and 0.844 for BFT, CART, and NBTree models, respectively. While the AUC values using the training dataset are 0.837 and 0.881 for FT and RSFT models, respectively. Compared to the benchmark models, the models used in this article all performed well, even better than them.
The forecast capacity and fidelity of the trained susceptibility models were tested and verified in the validation area [74,75]. The AUC values mentioned above were applied in the validation process. The ROC curve and performance of benchmark models using the validation dataset are shown in Figure 6 and Table 2. The AUC values using the validation dataset are 0.860, 0.827, and 0.850 for BFT, CART, and NBTree models, respectively. While the AUC values using the validation dataset are 0.874 and 0.889 for FT and RSFT models, respectively. Meanwhile, the accuracy value RSFT model (0.838) is larger than all benchmark models. This conclusion can illuminate that the models used in this paper have ultra-high accuracy and excellent applicability.

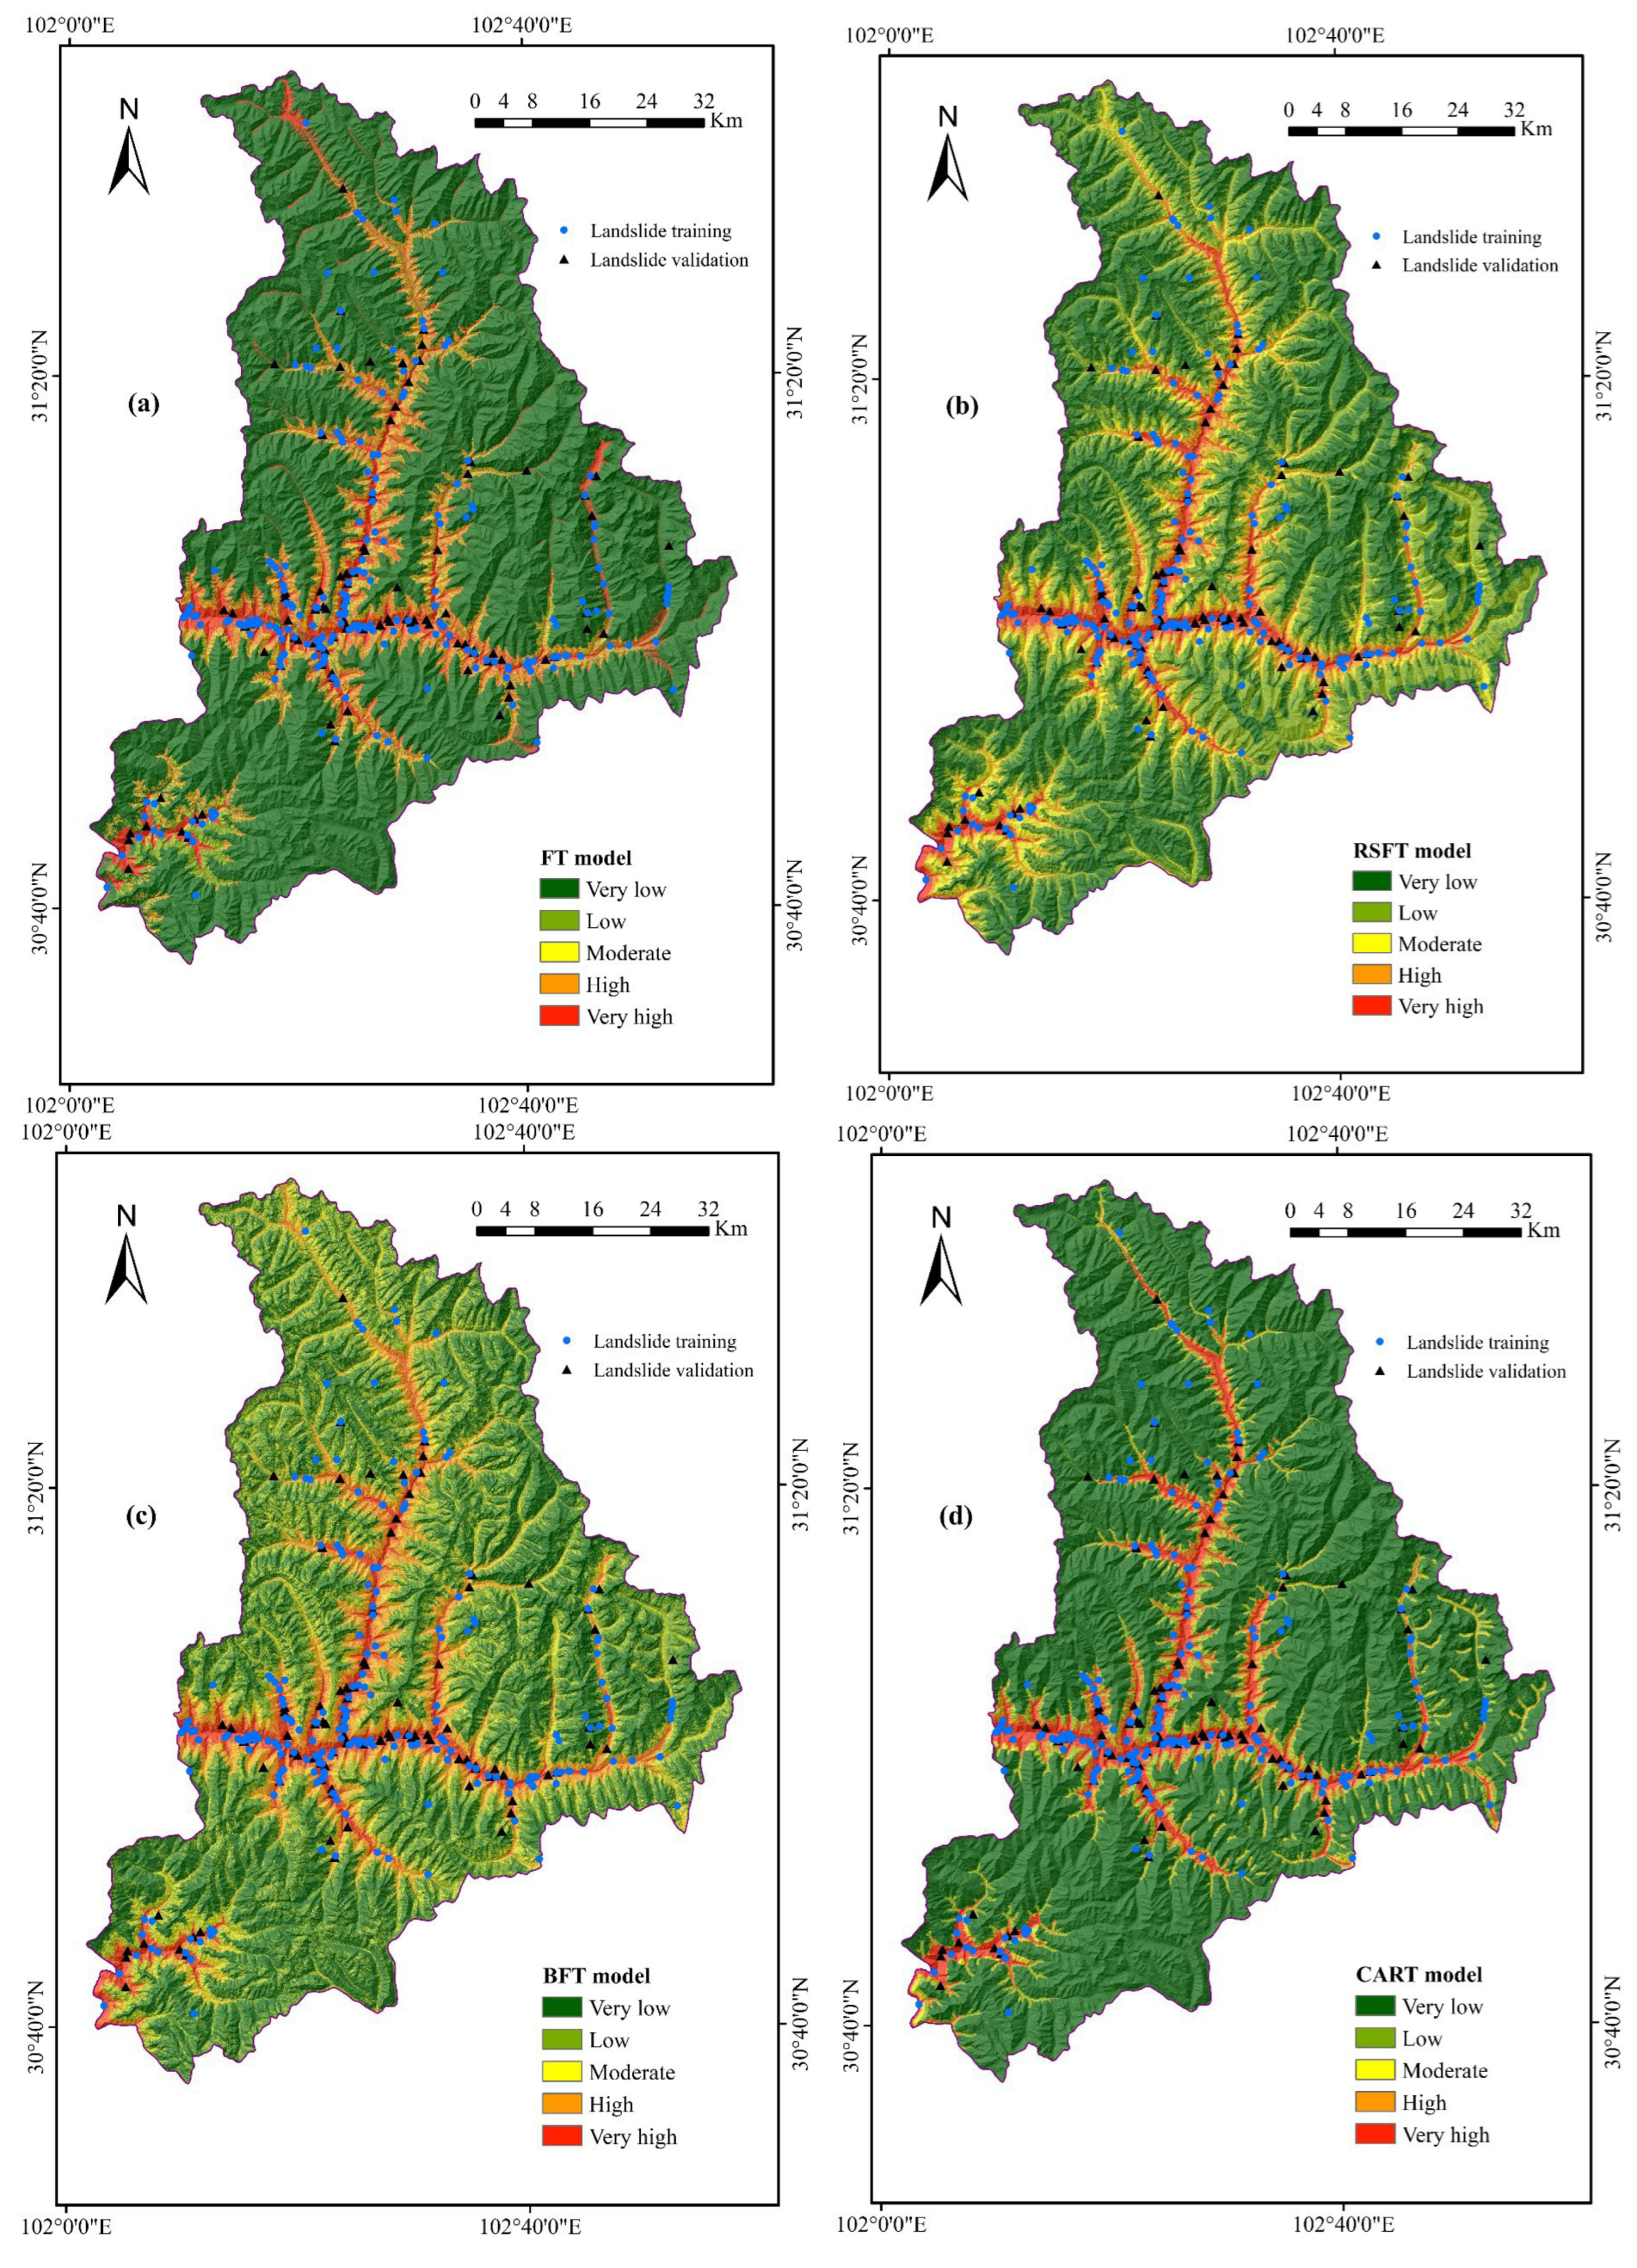
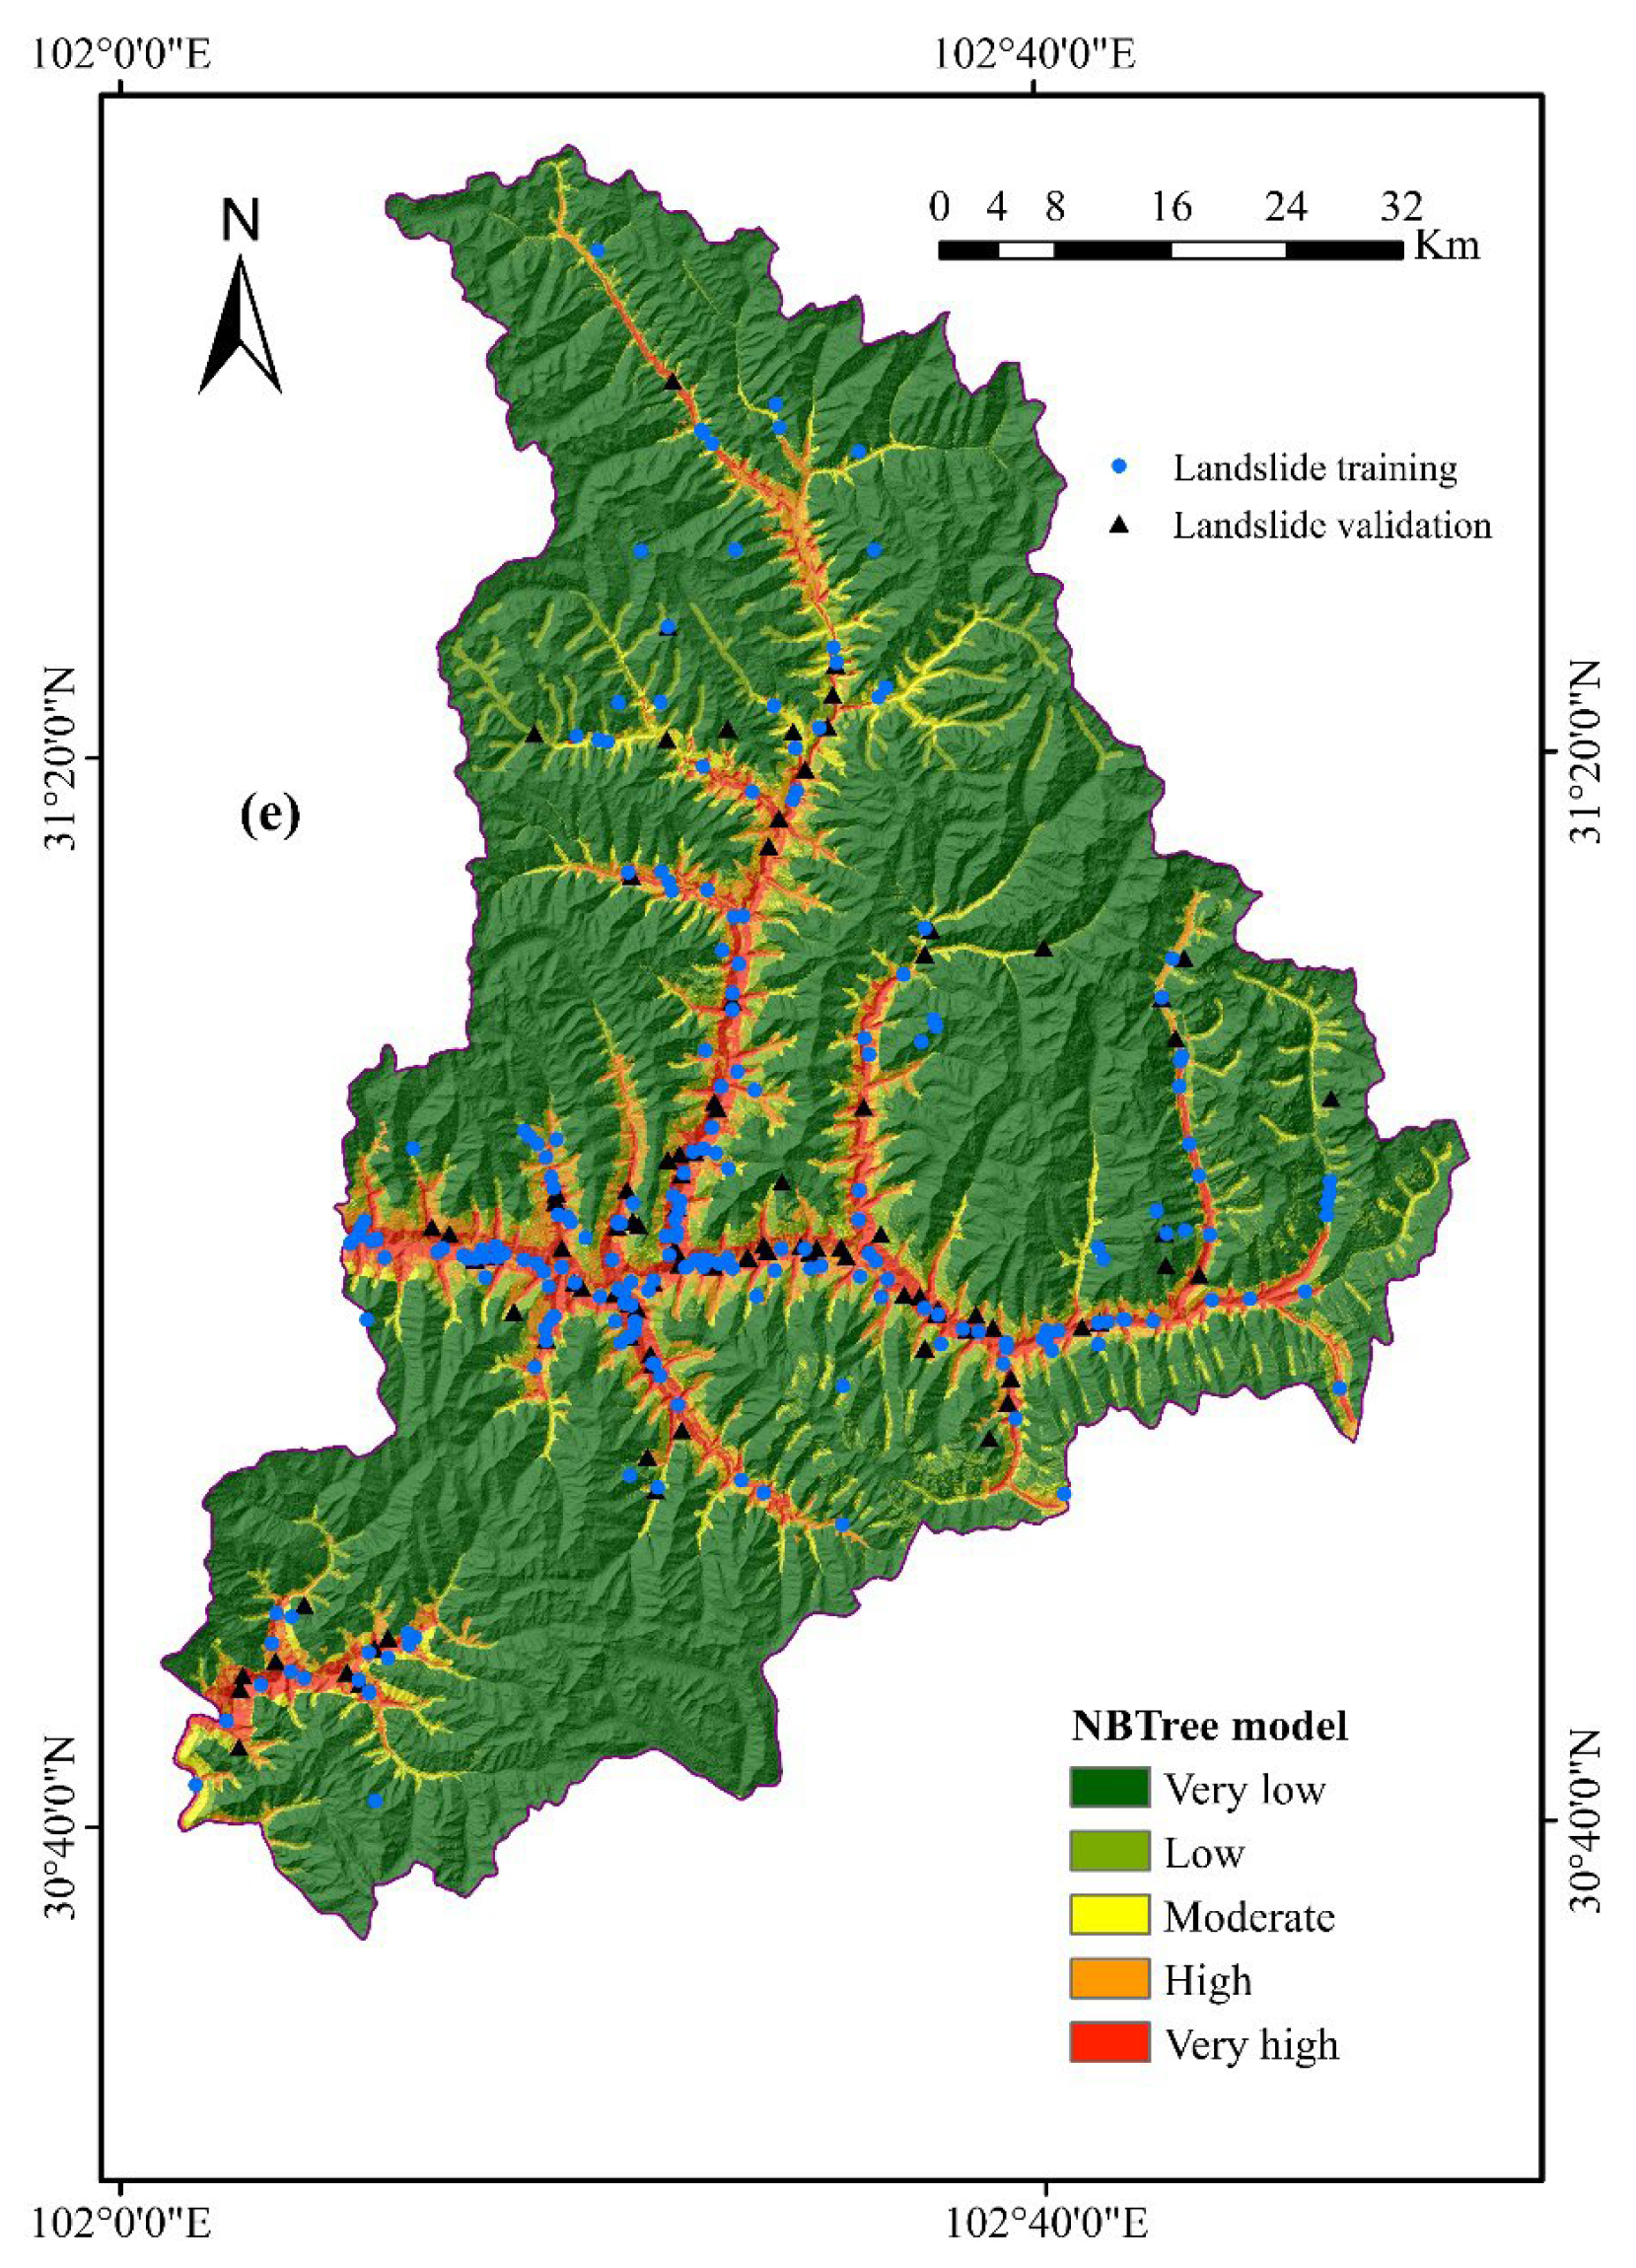
4.5. Generation of Landslide Susceptibility Maps

The LSMs were exported after the progress of conditioning factors prioritization, model training, and two types of model validation. Generally, the production of LSMs mainly includes the following two steps: (i) generating the susceptibility indexes of all evaluation units; (ii) reclassifying the susceptibility indexes. One step is that the susceptibility indexes of all estimation units were created through the probability distribution functions derived from the models used. The second step is that make susceptibility indexes have five re-classification results with different intervals for generating the landslide susceptibility maps by the natural break method. The natural break method applied in GIS software is a most reasonable standard method that reflects the data’s inherent attributes, which are commonly used to deal with continuous data and has the advantage of maximizing the differences among classes [18,76]. This enables the group of landslide susceptibility levels in this paper to be sorted into five categories, very low, low, moderate, high, and very high. Figure 7a,b presents the results of LSMs for the FT and RSFT models, respectively. As mentioned above, there are three benchmark models, namely BFT, CART, and NBTree models, used to demonstrate the pros and cons of the RSFT model in regional landslide assessment. The progress of selecting conditioning factors, factors analysis, establishing models, training models, validating models, and classifying the susceptibility levels were the same as FT and RSFT models. The LSMs produced successively by BFT, CART, and NBTree models are placed in Figure 7c–e, respectively.

5. Discussion

Predicting future landslides in spatial extent is always regarded as the most important step in landslide susceptibility research and is considered to be the first step in landslide hazard risk prevention [77,78,79]. Selecting an evaluation model with high predictive capacity that lies on the methods applied is believed as the first landslide susceptibility assessment step [78]. In past studies, various research in different areas has been undertaken implementing various evaluation models, such as random forest [80], naive Bayes tree [81], SVM [82], logistic model tree [83], and so on, while the detailed information of the models they used was still under discussion. This study is the first to apply an advanced random subspace (RS) and function tree (FT) coupled model applicable to large datasets to create a landslide susceptibility map in Xiaojin County, China, and compare the results with three commonly used methods, namely bagging based functional tree (BFT), CART and Naive Bayesian tree (NBtree) models. The result obtained in this study showed that the RSFT model (AUC = 0.889) outperforms the single FT model (AUC = 0.874). Additionally, the random subspace (RS) model randomly applies a subset of features to train each classifier. Thus, in an informal setting, the RS model will prevent individual learners from paying too much attention to the training set, exhibiting highly predictive/descriptive features, but failing to make predictions on points outside the training set. Therefore, when the features cannot be much larger than the number of training samples, the prediction accuracy of the RS model will be reduced, but coupling the RS algorithm with other appropriate benchmark models can better exert the model performance. According to Haoyaun Hong et al. (2017), these researchers have coupled RS and SVM models to develop a stochastic subspace support vector machine (RSSVM) model and used it for landslide susceptibility mapping in the Wuning region of China. The AUC value obtained by the RSSVM model verification in this document is 0.857, and the AUC value of the single SVM model is 0.814. This study integrates the RS model with other models, which also improves the model prediction accuracy.
It is fully aware that not all determined landslide factors have the same prediction capacity, and even some of them may produce noise which can reduce the prediction accuracy [7,84,85]. For this novel study, twelve non-multicollinearity susceptibility factors were determined, and then AM results prove that all of them have theoretical contributions to modeling. Of course, the results can also indicate that each susceptibility factor has specific contributions to modeling. According to the important analysis between conditioning factors and landslides by the FT model, we can see that elevation is an extremely important factor with the highest AM value of 0.320, and the number of landslides decreased with the altitude increased, which agrees with the other researchers [86]. This condition may be due to high altitude zones having a special geographic location that is capable of blocking the weathering with cliffs consisting of rock [87], and low altitude areas affected heavily by disturbance of humans, such as engineering activities. In addition, what is known is that landslides are influenced seriously by water, and it increases as the altitude goes down. Soil, distance to roads, and distance to rivers are the other three susceptibility factors with AM values of 0287, 0.273, and 0.210, respectively. For the soil, the most significant number of landslides is distributed in the low-altitude areas, such as alluvial fans and river terraces. The calcareous cinnamon soil provides a convenient condition for the clustered take place of landslides with the characteristics of low strength, high porosity, and water content [88,89]. Distance to roads and rivers are two linear factors, which can be roughly regarded as the effects of human activities and water on landslides, and the number of landslides increased when approaching them. It is worth mentioning that the factor class which had the highest correlation is residential areas, again because of human activities. The local government should consider relocating residential houses in highly susceptible areas and strengthening, preventing, and treating landslides beside highways.
The results in the present research obtained indicate that it is best to use the RSFT model as a tool for improving the produced outcomes in landslide susceptibility assessment, with the highest AUC value of 0.889, the standard error of 0.0241, and the confidence interval (95%) of 0.837 to 0.929. FT model performed a little poor than the RSFT model with the 0.874 AUC, the 0.0250 standard error, and the 0.819 to 0.919 confidence interval (95%). The benchmark methods, BFT, CART, and NBTree models, obtained the 0.860, 0.827, and 0.850 AUC values, respectively. Compared with the benchmark methods, RSFT and FT models present excellent applicability in relevant research.
As this study was carried out for the Xiaojin County, which belongs to the Tibet plateau area, further discriminant analysis should be prepared for regions with differences in geological environment features, and to improve the accuracy of assessment, more advanced methods should also be applied in landslide susceptibility mapping.

6. Conclusions

The development of the ensemble model is still a promising technology for landslide spatial prediction. In this study, a new random subspace-based functional tree (RSFT) ensemble model was developed and successfully applied to analyze the landslide distribution in Xiaojin County, China. This paper aims to evaluate the performance of the RSFT model by comparing the novel hybrid model with four benchmark models, namely FT, BFT, CART, and NBTree model prediction ability. To this end, 12 landslide conditioning factors were selected as model inputs: slope aspect, slope angle, profile curvature, plan curvature, elevation, topographic wetness index (TWI), lithology, normalized difference vegetation index (NDVI), land use, soil, distance to rivers and distance to roads. The locations of landslides were detected through aerial photography interpretation and large-scale field surveys. A total of 328 landslides were selected and randomly divided into two groups, with 70% (230) and 30% (98) landslides used for the training and validation of the above models. Finally, the evaluation performance of the models was validated using the area under the receiver operating characteristic curve (AUC). The AUC results showed that the prediction rate of the RSFT hybrid model was higher than that of other benchmark models. Furthermore, according to the factors’ importance measure of the FT model (average merit), the most important conditional factors are elevation, soil, distance to roads, and distance to rivers. As a final conclusion, the RSFT hybrid model has been successfully applied, and its application in landslide-prone areas can be proposed in other regions and regional scales. Although various machine learning methods and ensemble techniques have been widely used in landslide susceptibility mapping in recent years, it is still unclear which model has the most superior predictions. Therefore, more advanced models should be continuously explored and applied to different study areas in future research to obtain more reliable results.

Supplementary Materials

The following supporting information can be downloaded at: https://www.mdpi.com/article/10.3390/rs14194803/s1.

Author Contributions

Conceptualization, T.P., Y.C. and W.C.; methodology, Y.C.; software, Y.C.; validation, T.P. and W.C.; formal analysis, T.P., Y.C., and W.C.; investigation, T.P., Y.C., and W.C.; writing—original draft preparation, T.P., Y.C., and W.C.; writing—review and editing, T.P. and W.C.; visualization, T.P., Y.C., and W.C.; supervision, T.P. and W.C.; project administration, T.P. and W.C. All authors have read and agreed to the published version of the manuscript.

Funding

This research received no external funding.

Data Availability Statement

Not applicable.

Acknowledgments

The authors wish to express their sincere thanks to Chaohong Peng (Sichuan Institute of Geological Engineering Investigation Group Co. Ltd., Chengdu, China) for the useful information provided.

Conflicts of Interest

The authors declare no conflict of interest.

References

  1. Rozos, D.; Skilodimou, H.D.; Loupasakis, C.; Bathrellos, G.D. Application of the revised universal soil loss equation model on landslide prevention. An example from N. Euboea (Evia) Island, Greece. Environ. Earth Sci. 2013, 70, 3255–3266. [Google Scholar] [CrossRef]
  2. Ciampalini, A.; Raspini, F.; Lagomarsino, D.; Catani, F.; Casagli, N. Landslide susceptibility map refinement using PSInSAR data. Remote Sens. Environ. 2016, 184, 302–315. [Google Scholar] [CrossRef]
  3. Xiaomin, F.; Jijun, L.; Derbyshire, E.; Fitzpatrick, E.A.; Kemp, R.A. Micromorphology of the Beiyuan loess-paleosol sequence in Gansu Province, China: Geomorphological and paleoenvironmental significance. Palaeogeogr. Palaeoclimatol. Palaeoecol. 1994, 111, 289–303. [Google Scholar] [CrossRef]
  4. Du, H.-D.; Jiao, J.-Y.; Jia, Y.-F.; Wang, N.; Wang, D.-L. Phytogenic mounds of four typical shoot architecture species at different slope gradients on the Loess Plateau of China. Geomorphology 2013, 193, 57–64. [Google Scholar] [CrossRef]
  5. Han, J.; Wu, S.; Wang, H. Preliminary Study on Geological Hazard Chains. Earth Sci. Front. 2007, 14, 11–20. [Google Scholar] [CrossRef]
  6. Chen, W.; Xie, X.; Wang, J.; Pradhan, B.; Hong, H.; Bui, D.T.; Duan, Z.; Ma, J. A comparative study of logistic model tree, random forest, and classification and regression tree models for spatial prediction of landslide susceptibility. Catena 2017, 151, 147–160. [Google Scholar] [CrossRef]
  7. Chen, W.; Pourghasemi, H.R.; Naghibi, S.A. Prioritization of landslide conditioning factors and its spatial modeling in Shangnan County, China using GIS-based data mining algorithms. Bull. Eng. Geol. Environ. 2018, 77, 611–629. [Google Scholar] [CrossRef]
  8. van Westen, C.J.; Rengers, N.; Terlien, M.T.J.; Soeters, R. Prediction of the occurrence of slope instability phenomenal through GIS-based hazard zonation. Geol. Rundsch. 1997, 86, 404–414. [Google Scholar] [CrossRef]
  9. Montgomery, D.R.; Dietrich, W.E. A physically based model for the topographic control on shallow landsliding. Water Resour. Res. 1994, 30, 1153–1171. [Google Scholar] [CrossRef]
  10. Regmi, A.D.; Devkota, K.C.; Yoshida, K.; Pradhan, B.; Pourghasemi, H.R.; Kumamoto, T.; Akgun, A. Application of frequency ratio, statistical index, and weights-of-evidence models and their comparison in landslide susceptibility mapping in Central Nepal Himalaya. Arab. J. Geosci. 2014, 7, 725–742. [Google Scholar] [CrossRef]
  11. Li, Y.; Chen, W. Landslide Susceptibility Evaluation Using Hybrid Integration of Evidential Belief Function and Machine Learning Techniques. Water 2020, 12, 113. [Google Scholar] [CrossRef]
  12. Pourghasemi, H.R.; Pradhan, B.; Gokceoglu, C. Application of fuzzy logic and analytical hierarchy process (AHP) to landslide susceptibility mapping at Haraz watershed, Iran. Nat. Hazards 2012, 63, 965–996. [Google Scholar] [CrossRef]
  13. Bui, D.T.; Lofman, O.; Revhaug, I.; Dick, O. Landslide susceptibility analysis in the Hoa Binh province of Vietnam using statistical index and logistic regression. Nat. Hazards 2011, 59, 1413. [Google Scholar] [CrossRef]
  14. Xu, C.; Xu, X.; Lee, Y.H.; Tan, X.; Yu, G.; Dai, F. The 2010 Yushu earthquake triggered landslide hazard mapping using GIS and weight of evidence modeling. Environ. Earth Sci. 2012, 66, 1603–1616. [Google Scholar] [CrossRef]
  15. Bai, S.-B.; Wang, J.; Lü, G.-N.; Zhou, P.-G.; Hou, S.-S.; Xu, S.-N. GIS-based logistic regression for landslide susceptibility mapping of the Zhongxian segment in the Three Gorges area, China. Geomorphology 2010, 115, 23–31. [Google Scholar] [CrossRef]
  16. Nohani, E.; Moharrami, M.; Sharafi, S.; Khosravi, K.; Pradhan, B.; Pham, B.T.; Lee, S.; Melesse, A.M. Landslide Susceptibility Mapping Using Different GIS-Based Bivariate Models. Water 2019, 11, 1402. [Google Scholar] [CrossRef]
  17. Gorsevski, P.V.; Brown, M.K.; Panter, K.; Onasch, C.M.; Simic, A.; Snyder, J. Landslide detection and susceptibility mapping using LiDAR and an artificial neural network approach: A case study in the Cuyahoga Valley National Park, Ohio. Landslides 2016, 13, 467–484. [Google Scholar] [CrossRef]
  18. Hong, H.; Pradhan, B.; Xu, C.; Tien Bui, D. Spatial prediction of landslide hazard at the Yihuang area (China) using two-class kernel logistic regression, alternating decision tree and support vector machines. Catena 2015, 133, 266–281. [Google Scholar] [CrossRef]
  19. Park, N.-W. Using maximum entropy modeling for landslide susceptibility mapping with multiple geoenvironmental data sets. Environ. Earth Sci. 2015, 73, 937–949. [Google Scholar] [CrossRef]
  20. Tien Bui, D.; Tuan, T.A.; Klempe, H.; Pradhan, B.; Revhaug, I. Spatial prediction models for shallow landslide hazards: A comparative assessment of the efficacy of support vector machines, artificial neural networks, kernel logistic regression, and logistic model tree. Landslides 2016, 13, 361–378. [Google Scholar] [CrossRef]
  21. Youssef, A.M.; Pourghasemi, H.R.; Pourtaghi, Z.S.; Al-Katheeri, M.M. Landslide susceptibility mapping using random forest, boosted regression tree, classification and regression tree, and general linear models and comparison of their performance at Wadi Tayyah Basin, Asir Region, Saudi Arabia. Landslides 2016, 13, 839–856. [Google Scholar] [CrossRef]
  22. Jaafari, A.; Panahi, M.; Pham, B.T.; Shahabi, H.; Bui, D.T.; Rezaie, F.; Lee, S. Meta optimization of an adaptive neuro-fuzzy inference system with grey wolf optimizer and biogeography-based optimization algorithms for spatial prediction of landslide susceptibility. Catena 2019, 175, 430–445. [Google Scholar] [CrossRef]
  23. Thi Ngo, P.T.; Panahi, M.; Khosravi, K.; Ghorbanzadeh, O.; Kariminejad, N.; Cerda, A.; Lee, S. Evaluation of deep learning algorithms for national scale landslide susceptibility mapping of Iran. Geosci. Front. 2021, 12, 505–519. [Google Scholar] [CrossRef]
  24. Fang, Z.; Wang, Y.; Peng, L.; Hong, H. A comparative study of heterogeneous ensemble-learning techniques for landslide susceptibility mapping. Int. J. Geogr. Inf. Sci. 2021, 35, 321–347. [Google Scholar] [CrossRef]
  25. Azarafza, M.; Azarafza, M.; Akgün, H.; Atkinson, P.M.; Derakhshani, R. Deep learning-based landslide susceptibility mapping. Sci. Rep. 2021, 11, 24112. [Google Scholar] [CrossRef]
  26. Pham, B.T.; Tien Bui, D.; Prakash, I.; Dholakia, M.B. Hybrid integration of Multilayer Perceptron Neural Networks and machine learning ensembles for landslide susceptibility assessment at Himalayan area (India) using GIS. Catena 2017, 149, 52–63. [Google Scholar] [CrossRef]
  27. Collins, B.; Nechita, I. Random quantum channels II: Entanglement of random subspaces, Rényi entropy estimates and additivity problems. Adv. Math. 2011, 226, 1181–1201. [Google Scholar] [CrossRef]
  28. Bui, A.V.; Manasseh, R.; Liffman, K.; Šutalo, I.D. Development of optimized vascular fractal tree models using level set distance function. Med. Eng. Phys. 2010, 32, 790–794. [Google Scholar] [CrossRef]
  29. Xie, W.; Li, X.; Jian, W.; Yang, Y.; Liu, H.; Robledo, L.F.; Nie, W. A Novel Hybrid Method for Landslide Susceptibility Mapping-Based GeoDetector and Machine Learning Cluster: A Case of Xiaojin County, China. ISPRS Int. J. Geo-Inf. 2021, 10, 93. [Google Scholar] [CrossRef]
  30. Dikau, R. The Recognition of Landslides. In Floods and Landslides: Integrated Risk Assessment; Casale, R., Margottini, C., Eds.; Springer: Berlin/Heidelberg, Germany, 1999; pp. 39–44. [Google Scholar]
  31. Guzzetti, F.; Reichenbach, P.; Ardizzone, F.; Cardinali, M.; Galli, M. Estimating the quality of landslide susceptibility models. Geomorphology 2006, 81, 166–184. [Google Scholar] [CrossRef]
  32. Devkota, K.C.; Regmi, A.D.; Pourghasemi, H.R.; Yoshida, K.; Pradhan, B.; Ryu, I.C.; Dhital, M.R.; Althuwaynee, O.F. Landslide susceptibility mapping using certainty factor, index of entropy and logistic regression models in GIS and their comparison at Mugling–Narayanghat road section in Nepal Himalaya. Nat. Hazards 2013, 65, 135–165. [Google Scholar] [CrossRef]
  33. Chen, W.; Pourghasemi, H.R.; Naghibi, S.A. A comparative study of landslide susceptibility maps produced using support vector machine with different kernel functions and entropy data mining models in China. Bull. Eng. Geol. Environ. 2018, 77, 647–664. [Google Scholar] [CrossRef]
  34. ESRI. ArcGIS desktop: Release 10.2 Redlands, CA: Environmental Systems Research Institute. Nat. Sci. 2014, 6, 3. [Google Scholar]
  35. Moore, I.D.; Grayson, R.B. Terrain-based catchment partitioning and runoff prediction using vector elevation data. Water Resour. Res. 1991, 27, 1177–1191. [Google Scholar] [CrossRef]
  36. Xiao, T.; Yin, K.; Yao, T.; Liu, S. Spatial prediction of landslide susceptibility using GIS-based statistical and machine learning models in Wanzhou County, Three Gorges Reservoir, China. Acta Geochim. 2019, 38, 654–669. [Google Scholar] [CrossRef]
  37. Youssef, A.M.; Pourghasemi, H.R.; El-Haddad, B.A.; Dhahry, B.K. Landslide susceptibility maps using different probabilistic and bivariate statistical models and comparison of their performance at Wadi Itwad Basin, Asir Region, Saudi Arabia. Bull. Eng. Geol. Environ. 2016, 75, 63–87. [Google Scholar] [CrossRef]
  38. Pradhan, B.; Lee, S. Landslide susceptibility assessment and factor effect analysis: Backpropagation artificial neural networks and their comparison with frequency ratio and bivariate logistic regression modelling. Environ. Model. Softw. 2010, 25, 747–759. [Google Scholar] [CrossRef]
  39. Reichenbach, P.; Busca, C.; Mondini, A.C.; Rossi, M. The Influence of Land Use Change on Landslide Susceptibility Zonation: The Briga Catchment Test Site (Messina, Italy). Environ. Manag. 2014, 54, 1372–1384. [Google Scholar] [CrossRef]
  40. Fell, R.; Corominas, J.; Bonnard, C.; Cascini, L.; Leroi, E.; Savage, W.Z. Guidelines for landslide susceptibility, hazard and risk zoning for land use planning. Eng. Geol. 2008, 102, 85–98. [Google Scholar] [CrossRef]
  41. Akpan, A.E.; Ilori, A.O.; Essien, N.U. Geophysical investigation of Obot Ekpo Landslide site, Cross River State, Nigeria. J. Afr. Earth Sci. 2015, 109, 154–167. [Google Scholar] [CrossRef]
  42. Vuillez, C.; Tonini, M.; Sudmeier-Rieux, K.; Devkota, S.; Derron, M.-H.; Jaboyedoff, M. Land use changes, landslides and roads in the Phewa Watershed, Western Nepal from 1979 to 2016. Appl. Geogr. 2018, 94, 30–40. [Google Scholar] [CrossRef]
  43. Tay, L.T.; Lateh, H.; Hossain, M.K.; Kamil, A.A. Landslide Hazard Mapping Using a Poisson Distribution: A Case Study in Penang Island, Malaysia. In Landslide Science for a Safer Geoenvironment; Springer: Cham, Switzerland, 2014; pp. 521–525. [Google Scholar]
  44. Wang, X.; Tang, X. Random Sampling for Subspace Face Recognition. Int. J. Comput. Vis. 2006, 70, 91–104. [Google Scholar] [CrossRef]
  45. Kotsiantis, S. Combining bagging, boosting, rotation forest and random subspace methods. Artif. Intell. Rev. 2011, 35, 223–240. [Google Scholar] [CrossRef]
  46. Bertoni, A.; Folgieri, R.; Valentini, G. Bio-molecular cancer prediction with random subspace ensembles of support vector machines. Neurocomputing 2005, 63, 535–539. [Google Scholar] [CrossRef]
  47. Mielniczuk, J.; Teisseyre, P. Using random subspace method for prediction and variable importance assessment in linear regression. Comput. Stat. Data Anal. 2014, 71, 725–742. [Google Scholar] [CrossRef]
  48. Yu, G.; Zhang, G.; Domeniconi, C.; Yu, Z.; You, J. Semi-supervised classification based on random subspace dimensionality reduction. Pattern Recognit. 2012, 45, 1119–1135. [Google Scholar] [CrossRef]
  49. Tavakoli, S.; Pigoli, D.; Aston, J.A.D. Tests for separability in nonparametric covariance operators of random surfaces. In Functional Statistics and Related Fields; Springer: Cham, Switzerland, 2017; pp. 243–250. [Google Scholar]
  50. Liu, J.; Wang, G. Pharmacovigilance from social media: An improved random subspace method for identifying adverse drug events. Int. J. Med. Inform. 2018, 117, 33–43. [Google Scholar] [CrossRef]
  51. Harris, P.; Fotheringham, A.S.; Crespo, R.; Charlton, M. The Use of Geographically Weighted Regression for Spatial Prediction: An Evaluation of Models Using Simulated Data Sets. Math. Geosci. 2010, 42, 657–680. [Google Scholar] [CrossRef]
  52. Pham, B.T.; Tien Bui, D.; Pham, H.V.; Le, H.Q.; Prakash, I.; Dholakia, M.B. Landslide Hazard Assessment Using Random SubSpace Fuzzy Rules Based Classifier Ensemble and Probability Analysis of Rainfall Data: A Case Study at Mu Cang Chai District, Yen Bai Province (Vietnam). J. Indian Soc. Remote Sens. 2017, 45, 673–683. [Google Scholar] [CrossRef]
  53. Gama, J. Functional Trees. Mach. Learn. 2004, 55, 219–250. [Google Scholar] [CrossRef]
  54. Rodríguez, J.J.; García-Osorio, C.; Maudes, J.; Díez-Pastor, J.F. An Experimental Study on Ensembles of Functional Trees; Springer: Berlin/Heidelberg, Germany, 2010; pp. 64–73. [Google Scholar]
  55. Pham, B.T.; Tien Bui, D.; Pourghasemi, H.R.; Indra, P.; Dholakia, M.B. Landslide susceptibility assessment in the Uttarakhand area (India) using GIS: A comparison study of prediction capability of naïve bayes, multilayer perceptron neural networks, and functional trees methods. Theor. Appl. Climatol. 2017, 128, 255–273. [Google Scholar] [CrossRef]
  56. Kavzoglu, T.; Kutlug Sahin, E.; Colkesen, I. Selecting optimal conditioning factors in shallow translational landslide susceptibility mapping using genetic algorithm. Eng. Geol. 2015, 192, 101–112. [Google Scholar] [CrossRef]
  57. Jebur, M.N.; Pradhan, B.; Tehrany, M.S. Optimization of landslide conditioning factors using very high-resolution airborne laser scanning (LiDAR) data at catchment scale. Remote Sens. Environ. 2014, 152, 150–165. [Google Scholar] [CrossRef]
  58. Btpa, B.; Nta, B.; Cq, C.; Tvp, D.; Jie, D.; Lsh, G.; Hvl, H.; Ip, I. Coupling RBF neural network with ensemble learning techniques for landslide susceptibility mapping. Catena 2020, 195, 104805. [Google Scholar] [CrossRef]
  59. Merghadi, A.; Yunus, A.P.; Dou, J.; Whiteley, J.; ThaiPham, B.; Bui, D.T.; Avtar, R.; Abderrahmane, B. Machine learning methods for landslide susceptibility studies: A comparative overview of algorithm performance. Earth-Sci. Rev. 2020, 207, 103225. [Google Scholar] [CrossRef]
  60. Wu, Y.; Ke, Y.; Chen, Z.; Liang, S.; Hong, H. Application of Alternating Decision Tree with AdaBoost and Bagging ensembles for landslide susceptibility mapping. Catena 2020, 187, 104396. [Google Scholar] [CrossRef]
  61. Youssef, A.M.; Al-Kathery, M.; Pradhan, B. Landslide susceptibility mapping at Al-Hasher area, Jizan (Saudi Arabia) using GIS-based frequency ratio and index of entropy models. Geosci. J. 2015, 19, 113–134. [Google Scholar] [CrossRef]
  62. Lee, S.; Min, K. Statistical analysis of landslide susceptibility at Yongin, Korea. Environ. Geol. 2001, 40, 1095–1113. [Google Scholar] [CrossRef]
  63. Tien Bui, D.; Tuan, T.A.; Hoang, N.-D.; Thanh, N.Q.; Nguyen, D.B.; Van Liem, N.; Pradhan, B. Spatial prediction of rainfall-induced landslides for the Lao Cai area (Vietnam) using a hybrid intelligent approach of least squares support vector machines inference model and artificial bee colony optimization. Landslides 2017, 14, 447–458. [Google Scholar] [CrossRef]
  64. Park, S.; Choi, C.; Kim, B.; Kim, J. Landslide susceptibility mapping using frequency ratio, analytic hierarchy process, logistic regression, and artificial neural network methods at the Inje area, Korea. Environ. Earth Sci. 2013, 68, 1443–1464. [Google Scholar] [CrossRef]
  65. Breiman, L. Bagging predictors. Mach. Learn. 1996, 24, 123–140. [Google Scholar] [CrossRef] [Green Version]
  66. Tien Bui, D.; Ho, T.C.; Revhaug, I.; Pradhan, B.; Nguyen, D.B. Landslide Susceptibility Mapping Along the National Road 32 of Vietnam Using GIS-Based J48 Decision Tree Classifier and Its Ensembles. In Cartography from Pole to Pole: Selected Contributions to the XXVIth International Conference of the ICA, Dresden 2013; Buchroithner, M., Prechtel, N., Burghardt, D., Eds.; Springer: Berlin/Heidelberg, Germany, 2014; pp. 303–317. [Google Scholar]
  67. Kavzoglu, T.; Kutlug Sahin, E.; Colkesen, I. An assessment of multivariate and bivariate approaches in landslide susceptibility mapping: A case study of Duzkoy district. Nat. Hazards 2015, 76, 471–496. [Google Scholar] [CrossRef]
  68. Hong, H.; Liu, J.; Bui, D.T.; Pradhan, B.; Acharya, T.D.; Pham, B.T.; Zhu, A.X.; Chen, W.; Ahmad, B.B. Landslide susceptibility mapping using J48 Decision Tree with AdaBoost, Bagging and Rotation Forest ensembles in the Guangchang area (China). Catena 2018, 163, 399–413. [Google Scholar] [CrossRef]
  69. Wu, X.; Kumar, V.; Ross Quinlan, J.; Ghosh, J.; Yang, Q.; Motoda, H.; McLachlan, G.J.; Ng, A.; Liu, B.; Yu, P.S.; et al. Top 10 algorithms in data mining. Knowl. Inf. Syst. 2008, 14, 1–37. [Google Scholar] [CrossRef]
  70. Lee, T.-S.; Chiu, C.-C.; Chou, Y.-C.; Lu, C.-J. Mining the customer credit using classification and regression tree and multivariate adaptive regression splines. Comput. Stat. Data Anal. 2006, 50, 1113–1130. [Google Scholar] [CrossRef]
  71. Hsieh, A.-R.; Hsiao, C.-L.; Chang, S.-W.; Wang, H.-M.; Fann, C.S.J. On the use of multifactor dimensionality reduction (MDR) and classification and regression tree (CART) to identify haplotype–haplotype interactions in genetic studies. Genomics 2011, 97, 77–85. [Google Scholar] [CrossRef] [PubMed]
  72. Wang, S.; Jiang, L.; Li, C. Adapting naive Bayes tree for text classification. Knowl. Inf. Syst. 2015, 44, 77–89. [Google Scholar] [CrossRef]
  73. Jiang, L.; Cai, Z.; Wang, D.; Zhang, H. Improving Tree augmented Naive Bayes for class probability estimation. Knowl.-Based Syst. 2012, 26, 239–245. [Google Scholar] [CrossRef]
  74. Pradhan, B. Use of GIS-based fuzzy logic relations and its cross application to produce landslide susceptibility maps in three test areas in Malaysia. Environ. Earth Sci. 2011, 63, 329–349. [Google Scholar] [CrossRef]
  75. Li, R.; Wang, N. Landslide susceptibility mapping for the Muchuan county (China): A comparison between bivariate statistical models (woe, ebf, and ioe) and their ensembles with logistic regression. Symmetry 2019, 11, 762. [Google Scholar]
  76. Chen, W.; Pourghasemi, H.R.; Kornejady, A.; Zhang, N. Landslide spatial modeling: Introducing new ensembles of ANN, MaxEnt, and SVM machine learning techniques. Geoderma 2017, 305, 314–327. [Google Scholar] [CrossRef]
  77. Hua-xi, G.; Kun-long, Y. Study on spatial prediction and time forecast of landslide. Nat. Hazards 2014, 70, 1735–1748. [Google Scholar] [CrossRef]
  78. Hussin, H.Y.; Zumpano, V.; Reichenbach, P.; Sterlacchini, S.; Micu, M.; van Westen, C.; Bălteanu, D. Different landslide sampling strategies in a grid-based bi-variate statistical susceptibility model. Geomorphology 2016, 253, 508–523. [Google Scholar] [CrossRef]
  79. Lee, S.; Won, J.-S.; Jeon, S.W.; Park, I.; Lee, M.J. Spatial Landslide Hazard Prediction Using Rainfall Probability and a Logistic Regression Model. Math. Geosci. 2015, 47, 565–589. [Google Scholar] [CrossRef]
  80. Chen, W.; Zhang, S.; Li, R.; Shahabi, H. Performance evaluation of the gis-based data mining techniques of best-first decision tree, random forest, and naïve bayes tree for landslide susceptibility modeling. Sci. Total Environ. 2018, 644, 1006–1018. [Google Scholar] [CrossRef]
  81. Mao, Y.-M.; Zhang, M.-S.; Wang, G.-L.; Sun, P.-P. Landslide hazards mapping using uncertain Naïve Bayesian classification method. J. Cent. South Univ. 2015, 22, 3512–3520. [Google Scholar] [CrossRef]
  82. Pourghasemi, H.R.; Jirandeh, A.G.; Pradhan, B.; Xu, C.; Gokceoglu, C. Landslide susceptibility mapping using support vector machine and GIS at the Golestan Province, Iran. J. Earth Syst. Sci. 2013, 122, 349–369. [Google Scholar] [CrossRef]
  83. Althuwaynee, O.F.; Pradhan, B.; Park, H.-J.; Lee, J.H. A novel ensemble decision tree-based Chi-squared Automatic Interaction Detection (CHAID) and multivariate logistic regression models in landslide susceptibility mapping. Landslides 2014, 11, 1063–1078. [Google Scholar] [CrossRef]
  84. Li, L.; Liu, R.; Pirasteh, S.; Chen, X.; He, L.; Li, J. A novel genetic algorithm for optimization of conditioning factors in shallow translational landslides and susceptibility mapping. Arab. J. Geosci. 2017, 10, 209. [Google Scholar] [CrossRef]
  85. Zuo, R.; Carranza, E.J.M. A fractal measure of spatial association between landslides and conditioning factors. J. Earth Sci. 2017, 28, 588–594. [Google Scholar] [CrossRef]
  86. Lei, X.; Chen, W.; Pham, B.T. Performance Evaluation of GIS-Based Artificial Intelligence Approaches for Landslide Susceptibility Modeling and Spatial Patterns Analysis. Int. J. Geo-Inf. 2020, 9, 443. [Google Scholar] [CrossRef]
  87. Bost, M.; Pouya, A. Stress generated by the freeze–thaw process in open cracks of rock walls: Empirical model for tight limestone. Bull. Eng. Geol. Environ. 2017, 76, 1491–1505. [Google Scholar] [CrossRef] [Green Version]
  88. Błońska, E.; Lasota, J.; Piaszczyk, W.; Wiecheć, M.; Klamerus-Iwan, A. The effect of landslide on soil organic carbon stock and biochemical properties of soil. J. Soils Sediments 2018, 18, 2727–2737. [Google Scholar] [CrossRef]
  89. Posner, A.J.; Georgakakos, K.P. Soil moisture and precipitation thresholds for real-time landslide prediction in El Salvador. Landslides 2015, 12, 1179–1196. [Google Scholar] [CrossRef]
Figure 1. Study area.
Remotesensing 14 04803 g001
Figure 2. Landside conditioning factors.
Remotesensing 14 04803 g002aRemotesensing 14 04803 g002bRemotesensing 14 04803 g002c
Figure 3. Flowchart of the study.
Remotesensing 14 04803 g003
Figure 4. Importance of conditioning factors based on FT model.
Remotesensing 14 04803 g004
Figure 5. ROC curves of the models using the training dataset.
Remotesensing 14 04803 g005
Figure 6. ROC curves of the models using validation dataset.
Remotesensing 14 04803 g006
Figure 7. Landslide susceptibility maps: (a) FT model, (b) RSFT model, (c) BFT model, (d) CART model, (e) NBTree model.
Remotesensing 14 04803 g007aRemotesensing 14 04803 g007b
Table 1. Model performance.
Test Result Variable(s)FTRSFTBFTCARTNBTree
Area0.8380.8970.8840.8180.856
Standard Error0.0200.0150.0160.0210.018
p Value0.0000.0000.0000.0000.000
95% Confidence IntervalLower Bound0.7990.8670.8530.7770.822
Upper Bound0.8770.9260.9140.8580.891
Table 2. Model validation.
Test Result Variable(s)FTRSFTBFTCARTNBTree
Area0.8020.8850.8660.8110.868
Standard Error0.0340.0240.0260.0320.026
p Value0.0000.0000.0000.0000.000
95% Confidence IntervalLower Bound0.7360.8370.8150.7480.818
Upper Bound0.8680.9330.9180.8750.918
Publisher’s Note: MDPI stays neutral with regard to jurisdictional claims in published maps and institutional affiliations.

