Article

Relative Contributions of Climate Change and Human Activities on Vegetation Productivity Variation in National Nature Reserves on the Qinghai–Tibetan Plateau

1
Chengdu Institute of Biology, Chinese Academy of Sciences, Chengdu 610041, China
2
University of Chinese Academy of Sciences, Beijing 100049, China
*
Author to whom correspondence should be addressed.
Remote Sens. 2022, 14(18), 4626; https://doi.org/10.3390/rs14184626
Submission received: 12 August 2022 / Revised: 12 September 2022 / Accepted: 13 September 2022 / Published: 16 September 2022
(This article belongs to the Section Biogeosciences Remote Sensing)

Abstract

:
National nature reserves (NNRs) are at the forefront of conservation efforts on the Qinghai–Tibetan Plateau (QTP). However, few studies have examined the vegetation dynamics and their driving forces at the whole QTP scale. In this study, we used potential Net Primary Productivity (PNPP), actual NPP (ANPP), and human-activity-induced NPP (HNPP) to analyze the vegetation dynamics of 42 NNRs on the QTP. Further, we determined the driving factors of vegetation dynamics from 2000 to 2020. The results indicate that, during the 21 years studied, ANPP increased at 83.4% of the NNRs area on the QTP. Additionally, the contributions of climate change and anthropogenic factors to ANPP variation were 59.53% and 40.47%, respectively. The contribution of temperature to ANPP variation was considered high and stable, whereas the contribution of precipitation was relatively lower and variable. Residual analysis showed that human activities had both positive (51.30%) and negative effects (48.70%) on ANPP. Using Hurst exponent analysis, we found that 31.60% of the vegetation for the NNRs on the QTP will likely remain a persistent trend, and 65.4% will be stochastic in the future. By contrast, 3.00% of the vegetation mainly located in southern QTP would show a reverse trend, with most of them distributing in southern QTP, which deserves more attention. This study may help policymakers understand the relative impacts of climate change and human activities on vegetation in the different nature reserves on the QTP.

1. Introduction

Climate change and human activities are the primary drivers of terrestrial ecosystem changes [1,2]. Recent studies have shown that climate change, human activities, and their synergistical interactions impact the structure, composition, and function of terrestrial ecosystems [3]. These effects have resulted in a series of environmental and ecological problems, such as biodiversity loss, soil erosion, ecosystem degradation, and other environmental issues due to vegetation degradation [4]. Therefore, quantifying and separating the relative effects of these two factors on vegetation dynamics have become a hotspot in global change studies in recent years [5].
Ecosystems are vulnerable to climate change and human activities, but recent studies have shown that this vulnerability can be reduced when they are protected [6]. However, protected areas are often especially rich in species or important for ecosystem functions, thus, low levels of impact may have considerable effects or may revert conservation efforts [7,8]. Unfortunately, although the impacts of climate change and human activities have been assessed extensively at local, regional, and global scales [9,10,11,12], no specific attempts have been made to consider the different protected areas within the same geographical unit as a whole. Therefore, studies diagnosing the contributions of climate change and anthropogenic activities are urgently needed to fill the current knowledge gap concerning the effects of climate change and human activities on ecosystems in protected areas.
Recent evidence indicates that selecting appropriate metrics is a prerequisite for meaningful quantitative assessments. Net primary productivity (NPP) is the net amount of organic matter produced by vegetation through photosynthesis per unit of area and time [13]. Previous studies have shown that NPP is more sensitive to climate variations and anthropogenic impacts than other factors (such as ecological and geochemical conditions) and can, therefore, be used as an effective indicator of vegetation dynamics [14]. NPP can be estimated by in situ measurements or process-based models [15,16,17]. However, coarse resolution NPP products derived from in situ measurements or process-based models make their indicating ability poor at larger scales [18]. In contrast, satellite remote sensing products can provide finer spatial NPP information [18]. Among different satellite datasets, Moderate Resolution Imaging Spectroradiometer (MODIS) NPP products can capture the spatiotemporal features of NPP of different biomes and have been widely employed due to their excellent spatial resolution, timeliness, and open access [5,19]. The MOD17A3HGF annual NPP data product is a cumulative 8-day composite of values with a 500 m resolution based on the radiation-use efficiency concept. It is calculated as the difference between GPP and maintenance respiration [20,21]. Compared with the MOD17A3 data product, MOD17A3HGF uses a gap-filling method that substantially increases the quality of MOD17 by cleaning contaminated inputs and calculating their valuation by linear interpolation [5]. As a result, the MOD17A3HGF NPP product has been widely used globally [22,23].
As the highest natural geographical unit on earth, with an average altitude of more than 4000 m, the Qinghai–Tibetan Plateau (QTP) acts as an important environmental and ecological barrier for China, Asia, and even the Northern Hemisphere [24]. Because the QTP is particularly vulnerable to climate and environmental changes, the ecological security of this region is facing unprecedented challenges in the context of global changes [25]. Previous studies have shown that the QTP has experienced marked climate and land-cover changes in recent years [26,27]. For example, it has warmed more than twice the average global warming rate since the 1970s [28]. In parallel with the increasing temperature, precipitation on the QTP has also increased slightly [29]. Additionally, human activities on the QTP such as grazing, agricultural expansion, infrastructure construction, and ecological restoration projects have negatively or positively influenced vegetation dynamics [30,31,32]. Despite the warm and humid climate, ecosystem restoration and conservation activities have favored vegetation growth on the QTP [33], and the ecological fragility of the entire region has not been reduced. The area has even experienced desertification, vegetation cover degradation, and bare soil coverage increases in some areas [34,35].
To protect and conserve the QTP’s unique biodiversity and habitats, the Chinese government has established 155 nature reserves since 1963. Now, the total area of these nature reserves is ~8.22 × 10⁵ km2, accounting for 32.35% of the total plateau area [36]. Unfortunately, economic development and ecological conservation are still in conflict on the QTP, and the nature reserves still face serious challenges due to climate change and irrational human activities. In the context of ongoing climate and environmental changes on the QTP, vegetation feedback in protected areas had profound impacts on the ecological systems of the plateau and adjacent areas, resulting in impaired ecological security patterns. Therefore, exploring vegetation dynamics and their driving factors may provide scientific knowledge to better manage nature reserves [37,38,39]. However, although several studies have quantified the relative contributions of climate variations and anthropogenic factors in specific protected areas on the QTP, less attention has been paid to the evaluation at a whole-QTP scale [30,40,41]. Additionally, the spatial heterogeneity of vegetation on the QTP and the fact that it is influenced by a combination of factors have led to large uncertainties in determining the impacts of climate change and human activities [29,32,42]. Thus, whether climate change and human activities lead to substantial variation in vegetation productivity, as well as its driving factors, remains largely unknown, especially in the nature reserves that are subject to less human influence.
Given this research gap, the present study aimed to provide information on vegetation NPP dynamics and driving factors and the persistence of vegetation trends in the nature reserves on the QTP. Specifically, the main objectives of this study were to (1) explore the spatiotemporal variation of vegetation NPP in nature reserves on the QTP from 2000 to 2020, (2) estimate the relative contributions of climate factors and human activities to NPP variation, and (3) predict the future trend of NPP. The findings of this study will not only improve our current understanding of how climate variability and anthropogenic factors have regulated vegetation NPP dynamics, but may also predict future ecosystem changes, thereby contributing to optimal adaptive and management strategies for the QTP’s protected areas.

2. Materials and Methods

2.1. Study Area

We constrained our study area to the 42 national nature reserves (NNRs) with defined boundaries established on the QTP before 2000. These reserves are located between 80°9′02″E–105°24′55″E and 25°33′07″N–39°49′50″N. The detailed distribution of NNRs and their names are given in Figure 1 and Supplementary Table S1. The total area of these 42 NNRs is ~7 × 10⁵ km2, accounting for 85.2% of the total protected areas on the QTP. As national protected areas, NNRs in China generally have strict regulations prohibiting human occupation, land conversion, and direct use of natural resources. However, these 42 NNRs on the QTP are still affected by anthropogenic activities mainly dominated by grazing, agricultural expansion, infrastructure facilities and tourism facilities, leading them susceptible to extensive natural habitat loss and biodiversity decline [30,31]. On the other hand, to mitigate or reverse the degradation, ecological restoration projects are also implemented in these 42 NNRs [32]. The complex geographical and climatic conditions of the QTP create highly heterogeneous habitats for vegetation. The forest distribution on the QTP is mainly limited to the southern and eastern parts of the study area, and most of the other areas are covered by grassland. In the NNRs under study, four main vegetation types occur, i.e., desert, grassland, alpine vegetation, and broad-leaved forest [43]. Based on the similarity of geographical and climatic conditions, we divided the 42 NNRs into four ecological zones, i.e., the central, south, northeast, and northwest regions (Figure 1).

2.2. Data Sources

Gap-filled MOD17A3HGF-Version 006 NPP data with 500 m resolution covering 2000 to 2020 were obtained from the Land Processes Distributed Active Archive Center (https://lpdaac.usgs.gov (accessed on 15 May 2022)). If pixels had zero annual NPP value in 2000, they were treated as non-vegetated areas and not considered in post-analysis.
Monthly air temperature and precipitation with 0.0083333° resolution for 2000–2020 were acquired from the National Earth System Science Data Center, National Science & Technology Infrastructure of China (http://www.geodata.cn (accessed on 18 May 2022)). In addition, the nearest neighbor interpolation method was used to resample the spatial resolution of the meteorological data to 500 m to ensure consistency between NPP and meteorological data [43].

2.3. Methods

2.3.1. PNPP and HNPP Calculation

To reliably analyze the causes of vegetation productivity changes, the NPP-based scenario simulation method was used in this study, which assumes that the difference between climate-driven potential net primary productivity NPP (PNPP) and actual NPP (ANPP) of vegetation represents the human-induced NPP (HNPP). Thus, the relative impacts of climate change and human activities on vegetation dynamics can be determined by comparing the temporal variations of PNPP, ANPP, and HNPP [44,45,46]. Specifically, the MOD17A3HGF products provided the ANPP, which is the actual condition of NPP and indicates the true conditions of vegetation growth [5,22]. The PNPP was estimated with the Thornthwaite memorial model using temperature and precipitation as inputs, which is a modified version of the Miami model with good accuracy [47]. Additionally, the HNPP was estimated by calculating the difference between PNPP and ANPP and reflecting anthropogenic activities’ influence on ANPP. Negative values of HNPP represent NPP gains due to human activities, whereas positive values represent losses in NPP due to human interventions. The equations for PNPP and HNPP calculations are as follows [14]:
PNPP = 3000 1 e 0.0009695 v 20
v = 1.05 r 1 + ( 1 + 1.05 r L ) 2
L = 3000 + 25 t + 0.05 t 3
HNPP = PNPP ANPP
where PNPP is the total annual potential NPP (gC m−2), v the annual mean actual evapotranspiration (mm), L the annual mean potential evapotranspiration (mm), r the total annual precipitation (mm), and t the mean annual temperature (°C).

2.3.2. Trend Analysis

The linear regression method was adopted to compute the PNPP, ANPP, and HNPP from 2000 to 2020. First, the time series of pixels was calculated to obtain the slope coefficients of the linear regression using the following formula:
S l o p e = n   ×   i = 1 n i   ×   NPP i i = 1 n i i = 1 n NPP i n   ×   i = 1 n i 2 ( i = 1 n i ) 2   i = 1 , 2 , 3 , , n  
where Slope is the change in NPP values, n the continuous sample number over the 21 years being studied, and NPPi the NPP in the ith year. The slope can be positive and negative to represent increasing and decreasing trends. A t-test was then applied to obtain the statistical significance of spatial change patterns.

2.3.3. Scenario Establishment

Eight scenarios (Table 1) were established based on the slope coefficients of the three NPP types to quantify the contributions of climate change and anthropogenic activities to NPP variations [48]. Specifically, under the condition of SANPP > 0, if SPNPP > 0 and SHNPP > 0 (Scenario 1), climate change promoted an increase in ANPP, and human activities promoted a decrease. Thus, the ANPP increase was mainly due to climate change (CDI). If SPNPP < 0 and SHNPP < 0 (Scenario 2), climate change decreased and human activities increased ANPP. Therefore, the ANPP increase was mainly caused by human activities (HDI). If SPNPP > 0 and SHNPP < 0 (Scenario 3), both climate change and human activities increased ANPP. In this scenario, the increasing ANPP was equally caused by climatic and positive human factors (CHII). If SPNPP < 0 and SHNPP > 0 (Scenario 4), climate change and human activities both facilitated a decrease in ANPP, while ANPP still experienced an increasing trend, which was considered an error (EI).
Under the condition of SANPP < 0, if SPNPP < 0 and SHNPP < 0 (Scenario 5), climate change caused a decrease in ANPP, and human activities caused an increase. In this scenario, the decrease in ANPP was mainly caused by climate change (CDD). If SPNPP > 0 and SHNPP > 0 (Scenario 6), climate change mainly caused an increase in ANPP and human activities caused a decrease. Therefore, the ANPP decrease was mainly caused by human activities (HDD). If SPNPP < 0 and SHNPP > 0 (Scenario 7), the ANPP decrease was due to both climatic and human factors (CHID). If SPNPP > 0 and SHNPP < 0 (Scenario 8), climate change and human activities both facilitated an increase in ANPP, while ANPP still experienced a decreasing trend, which was considered an error (ED).

2.3.4. Correlation Analysis

Multiple correlation analysis was used to characterize the relationships between the dependent variable and multiple independent variables. We calculated the multiple correlation coefficient between ANPP (dependent variable) and temperature and precipitation (independent variables) using Equation (6).
R x , y z = 1 ( 1 R x y 2 ) ( 1 R x z , y 2 )
where R x , y z is the multiple correlation coefficient of the dependent variable x and the independent variables y and z; R x z , y is the partial correlation coefficient of variables x and z for a fixed variable y, and R x y is the correlation coefficient between variables x and y. Then, the F-test was used to test the significance of multiple correlations [49].
Furthermore, partial correlation analysis was used to analyze the relationship between the ANPP and temperature, and between ANPP and precipitation.
R x y , z = R x y R x z · R y z 1 R x z 2 · 1 R y z 2
R x z , y = R x z R x y · R y z 1 R x y 2 · 1 R y z 2
where rxy, rxz, and ryz are the correlation coefficients between ANPP and temperature, ANPP and precipitation, and temperature and precipitation. R x y , z represents the partial correlation coefficient of ANPP and temperature in Equation (7), and R x z , y represents the partial correlation coefficient of ANPP and precipitation in Equation (8). Then, t-tests were used to test the significance of partial correlations [5].

2.3.5. Stability Analysis

Based on the ANPP in the NNRs on the QTP, the variation of ANPP was assessed across the study area. The coefficient of variation (CV) was calculated using Equation (9), representing the ratio of the standard deviation to the average value.
CV = i = 1 n ( ANPP i ANPP ¯ ) 2 n 1 ANPP ¯   i = 1 , 2 , 3 , , n
where CV is the coefficient of variation, ANPP ¯ is the multi-year means for ANPP in the period I, ANPP i is the ANPP for year I, and n is the number of years. Additionally, the CV index was classified into weak variation (0 < CV ≤ 10%), medium variation (10% < CV ≤ 100%), and strong variation (CV > 100%) [50].

2.3.6. Hurst Exponent and R/S Analysis

The Hurst index is generally applied to assess the durability of changes in time-series data over long periods [14]. The most used method to calculate the Hurst exponent is the R/S analysis [51,52,53]. In this study, the Hurst exponent (H) from R/S analysis was used to predict the future trend of ANPP in the NNRs. For the main calculation steps, see Equations (10)–(14) and refer to [54]:
(a)
To divide the ANPP time series {ANPP( τ )} ( τ =1,2,3,…,n) into τ sub-series X(t), and for each sub-series t = 1,2,3,…,   τ .
(b)
To define the mean sequence of the time series,
A N P P ¯ τ = 1 τ t = 1 τ X t , τ = 1 , 2 , 3 , , n .
(c)
To calculate the cumulative deviation,
X t , τ = u = 1 t ( A N P P u A N P P τ ¯ ) , 1 t τ .
(d)
To generate the range sequence,
R τ = maxX t , τ minX t , τ , τ = 1 , 2 , 3 , , n 1 t τ   1 t τ .
(e)
To compute the standard deviation sequence,
S τ = 1 τ t = 1 τ A N P P t A N P P τ ¯ 2 1 2 , τ = 1 , 2 , 3 , , n .
(f)
To rescale the range,
R τ S τ = ( c τ ) H
where τ and n is the number of equal sub-series and the maximum number, respectively; t and u are a subsequence belonging to τ and c; X(t, τ) represents cumulative deviations; R(τ) is the range series; S(τ) is the standard deviation sequence; H is the Hurst exponent.
The value of H ranges from 0 to 1 and is generally divided into three categories for predicting future trends [55]; 0.6 < H < 1 indicates the persistent behavior (P) of the time series, i.e., that the future trend of ANPP is likely the same as that in the study period. The closer the H values are to 1, the more persistent the time series is in the future; 0.4 ≤ H ≤ 0.6 indicates a stochastic pattern with instability persistent behavior (IP), i.e., the ANPP trend in the future is likely to be unrelated to this in the study period; 0 < H < 0.4 indicates that the future trend of ANPP is likely to be the anti-persistent behavior (AP) of the trend in the past. The closer the H values are to 0, the more anti-persistent the time series is in the future.
We also used Theil-Sen trend slopes [56] and the Hurst exponent to classify potential future trends in ANPP into six types. If a pixel had a positive slope and H > 0.5, the vegetation in this pixel would tend to maintain a positive development (PD) after 2020. If the slope was positive, but H < 0.5, the vegetation in this pixel would maintain an anti-persistent positive development (APD). If the slope was negative and H > 0.5, we classified the pixel’s vegetation as having a persistent negative development (ND) in the future. H < 0.5 indicated an anti-persistent negative development (AND). If a pixel had a non-significant Theil-Sen slope and H > 0.5, the vegetation in this pixel was supposed to maintain sustained and steady development (SSD). If H < 0.5, the trend was categorized as undetermined development (UD).

3. Results

3.1. Spatiotemporal Variations in ANPP, PNPP, and HNPP

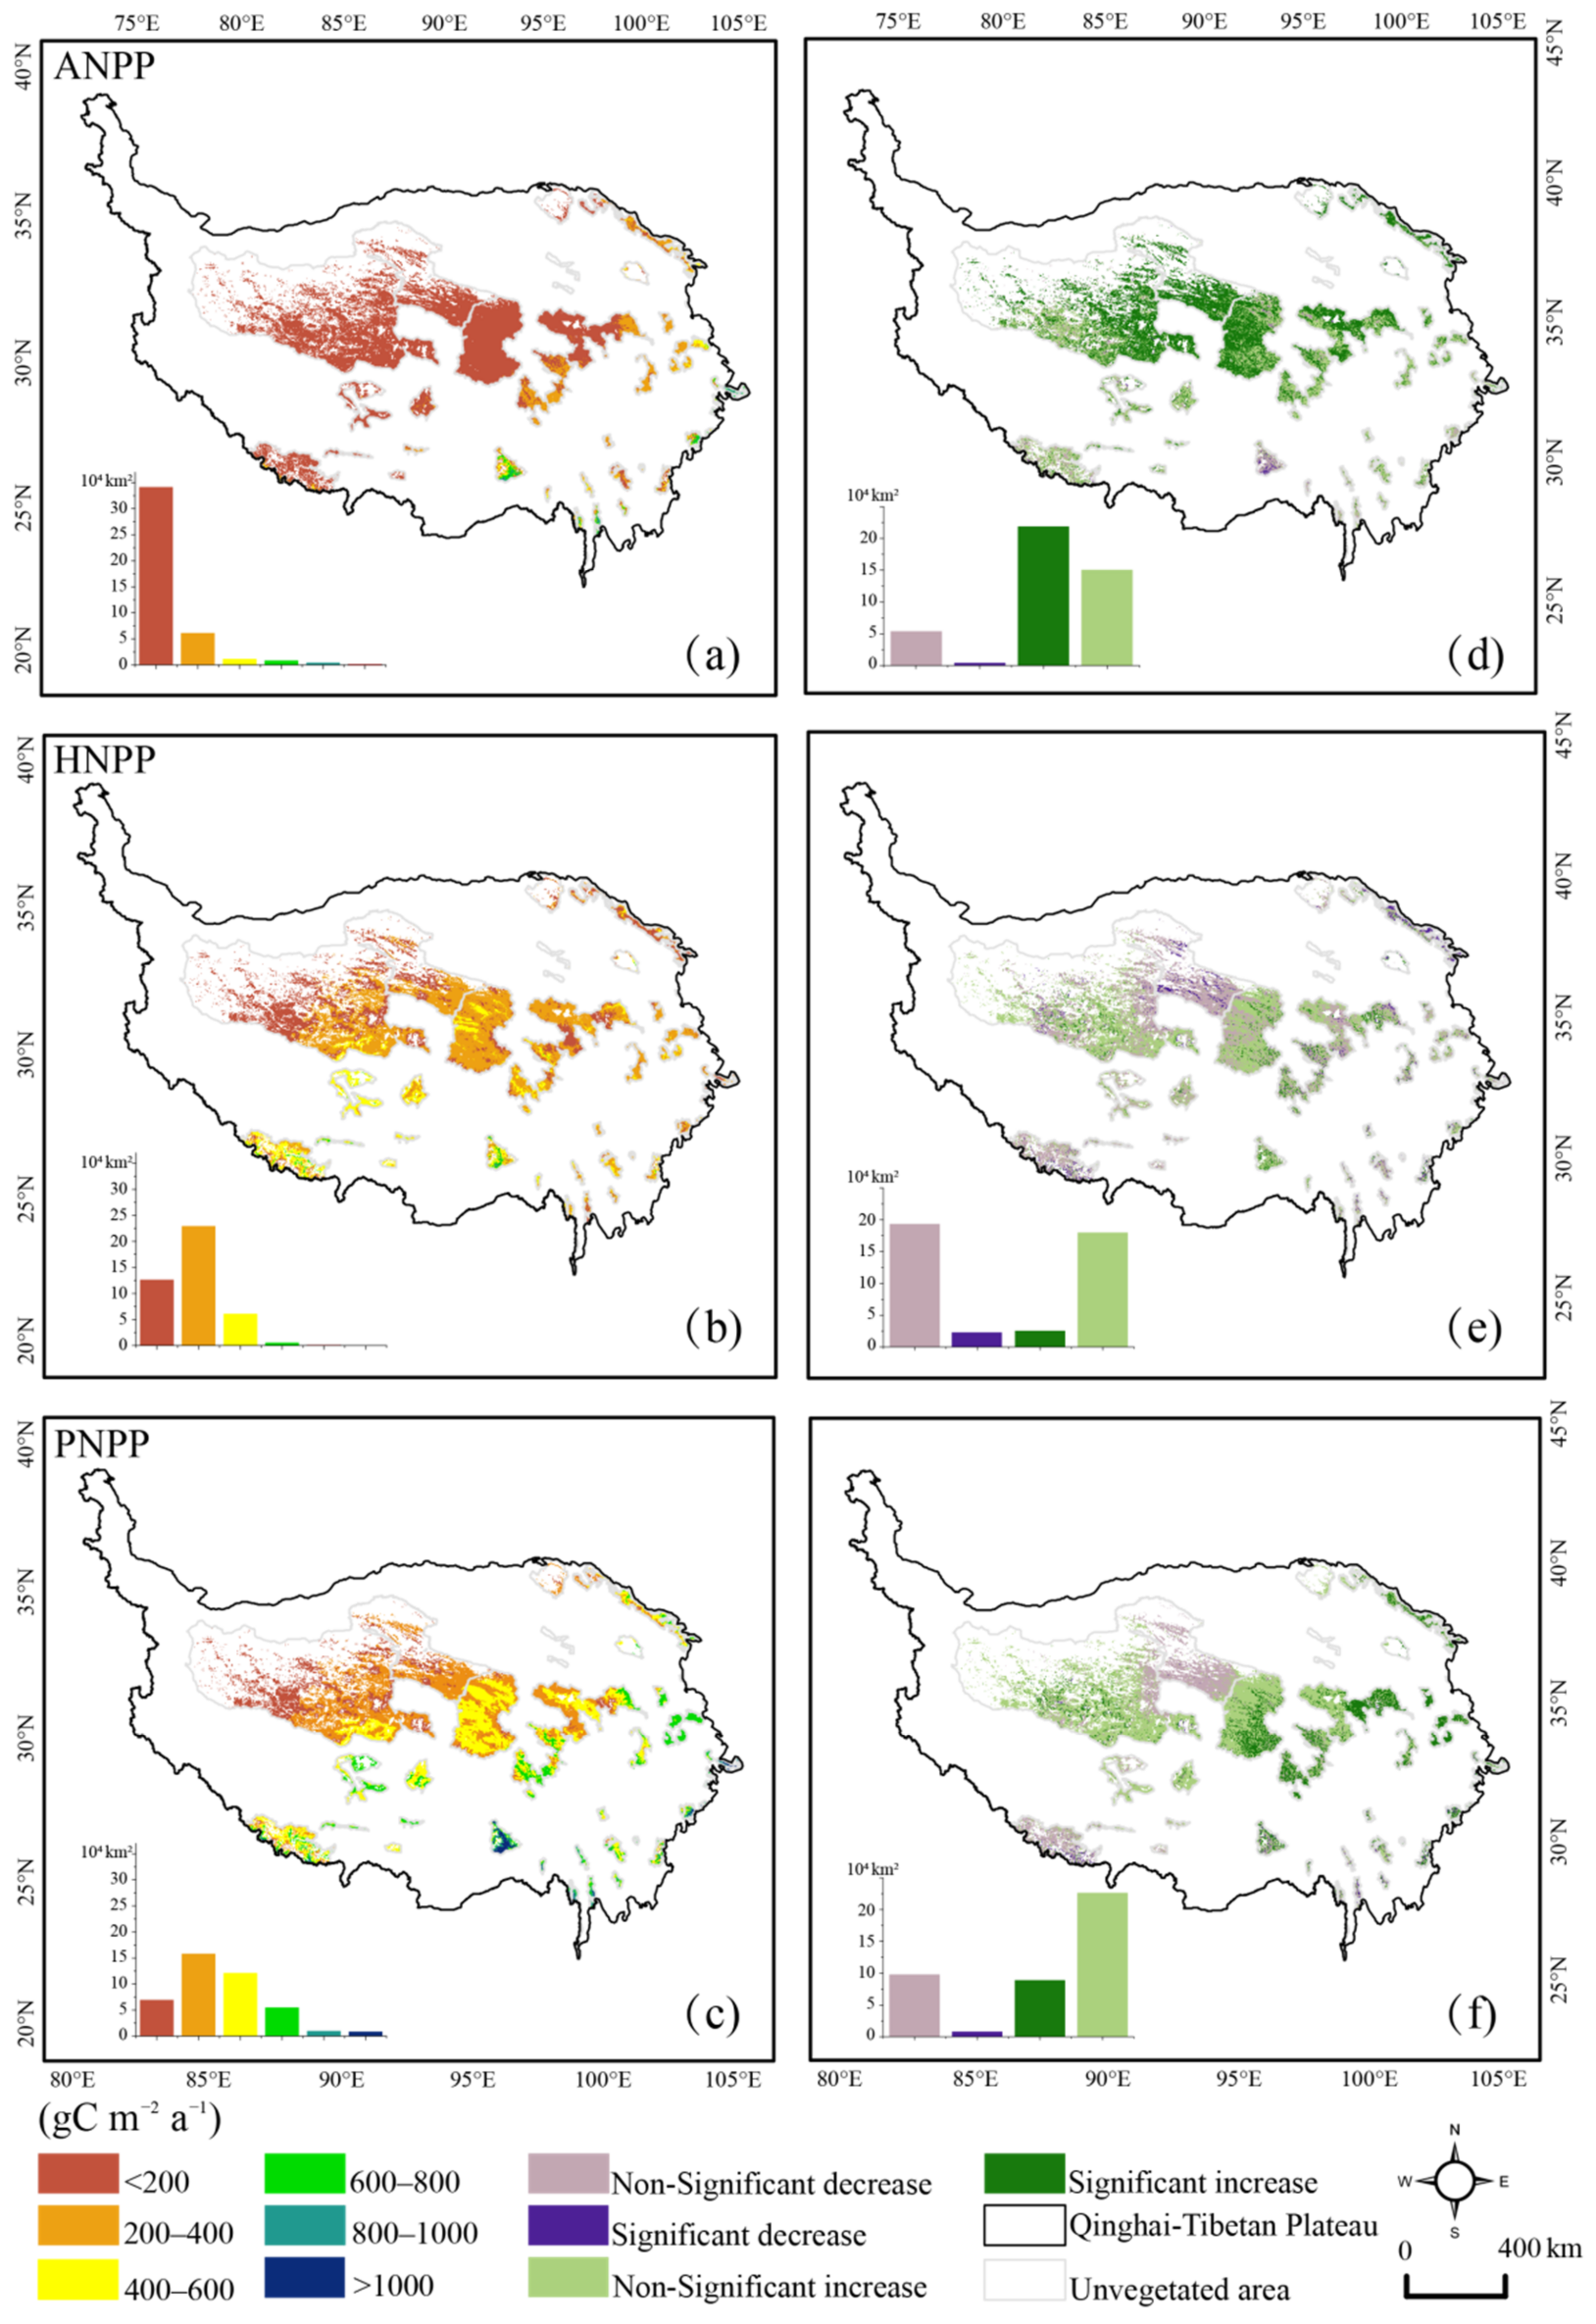
The trends of ANPP, PNPP, and HNPP in NNRs on the QTP showed apparent spatial heterogeneity from 2000 to 2020 (Figure 2). Overall, the three NPP types increased from northwest to southeast. From 2000 to 2020, the mean ANPP of vegetated areas was 133.59 gC m−2 a−1, and the areal proportions of different ANPP levels were 79.89% for <200 gC m−2 a−1, 14.30% for 200–400 gC m−2 a−1, and 5.81% for >400 gC m−2 a−1. The mean HNPP of vegetated areas was 273.9 gC m−2 a−1, and the areal proportions of different HNPP levels were 29.94% for <200 gC m−2 a−1, 54.27% for 200–400 gC m−2 a−1, and 15.79% for >400 gC m−2 a−1. The mean PNPP of vegetated areas was 407.97 gC m−2 a−1, and the areal proportions of different PNPP levels were 16.46% for <200 gC m−2 a−1, 37.48% for 200–400 gC m−2 a−1, and 46.06% for >400 gC m−2 a−1.
From 2000 to 2020, ANPP and PNPP of vegetated areas in the NNRs on the QTP increased at mean rates of 0.7 gC m−2 a−1 and 0.69 gC m−2 a−1, respectively (Figure 2d,f). ANPP significantly increased in 51.17% of the vegetated areas, mainly in the central and northeastern parts of the study area. ANPP showed a significantly decreasing trend only in 1.2% of the total vegetated area, mainly in the Yarlung Tsangpo Grand Canyon nature reserve (YLTGC). A total of 21.1% of the vegetated areas showed a significant increase in PNPP, also mainly in the central and northeastern regions of the QTP. Only 0.04% showed a significant decrease in PNPP, mainly on the southern edge of the Qomolangma national nature reserve (QMLM). The HNPP of vegetated areas showed an overall decreasing trend from 2000 to 2020, with a mean rate of −0.03 gC m−2 a−1 (Figure 2e). HNPP significantly decreased in 5.47% of the vegetated areas, mainly in the Hoh Xil nature reserve (HX) and Qilian Mountain nature reserve (QLM). HNPP showed a significantly increasing trend only in 12.44% of the total vegetated area, mainly YLTGC, HX, and some parts of the Three-River Headwater Region nature reserve (TRHR).

3.2. Contributions of Climate Change and Human Activities to ANPP Variation

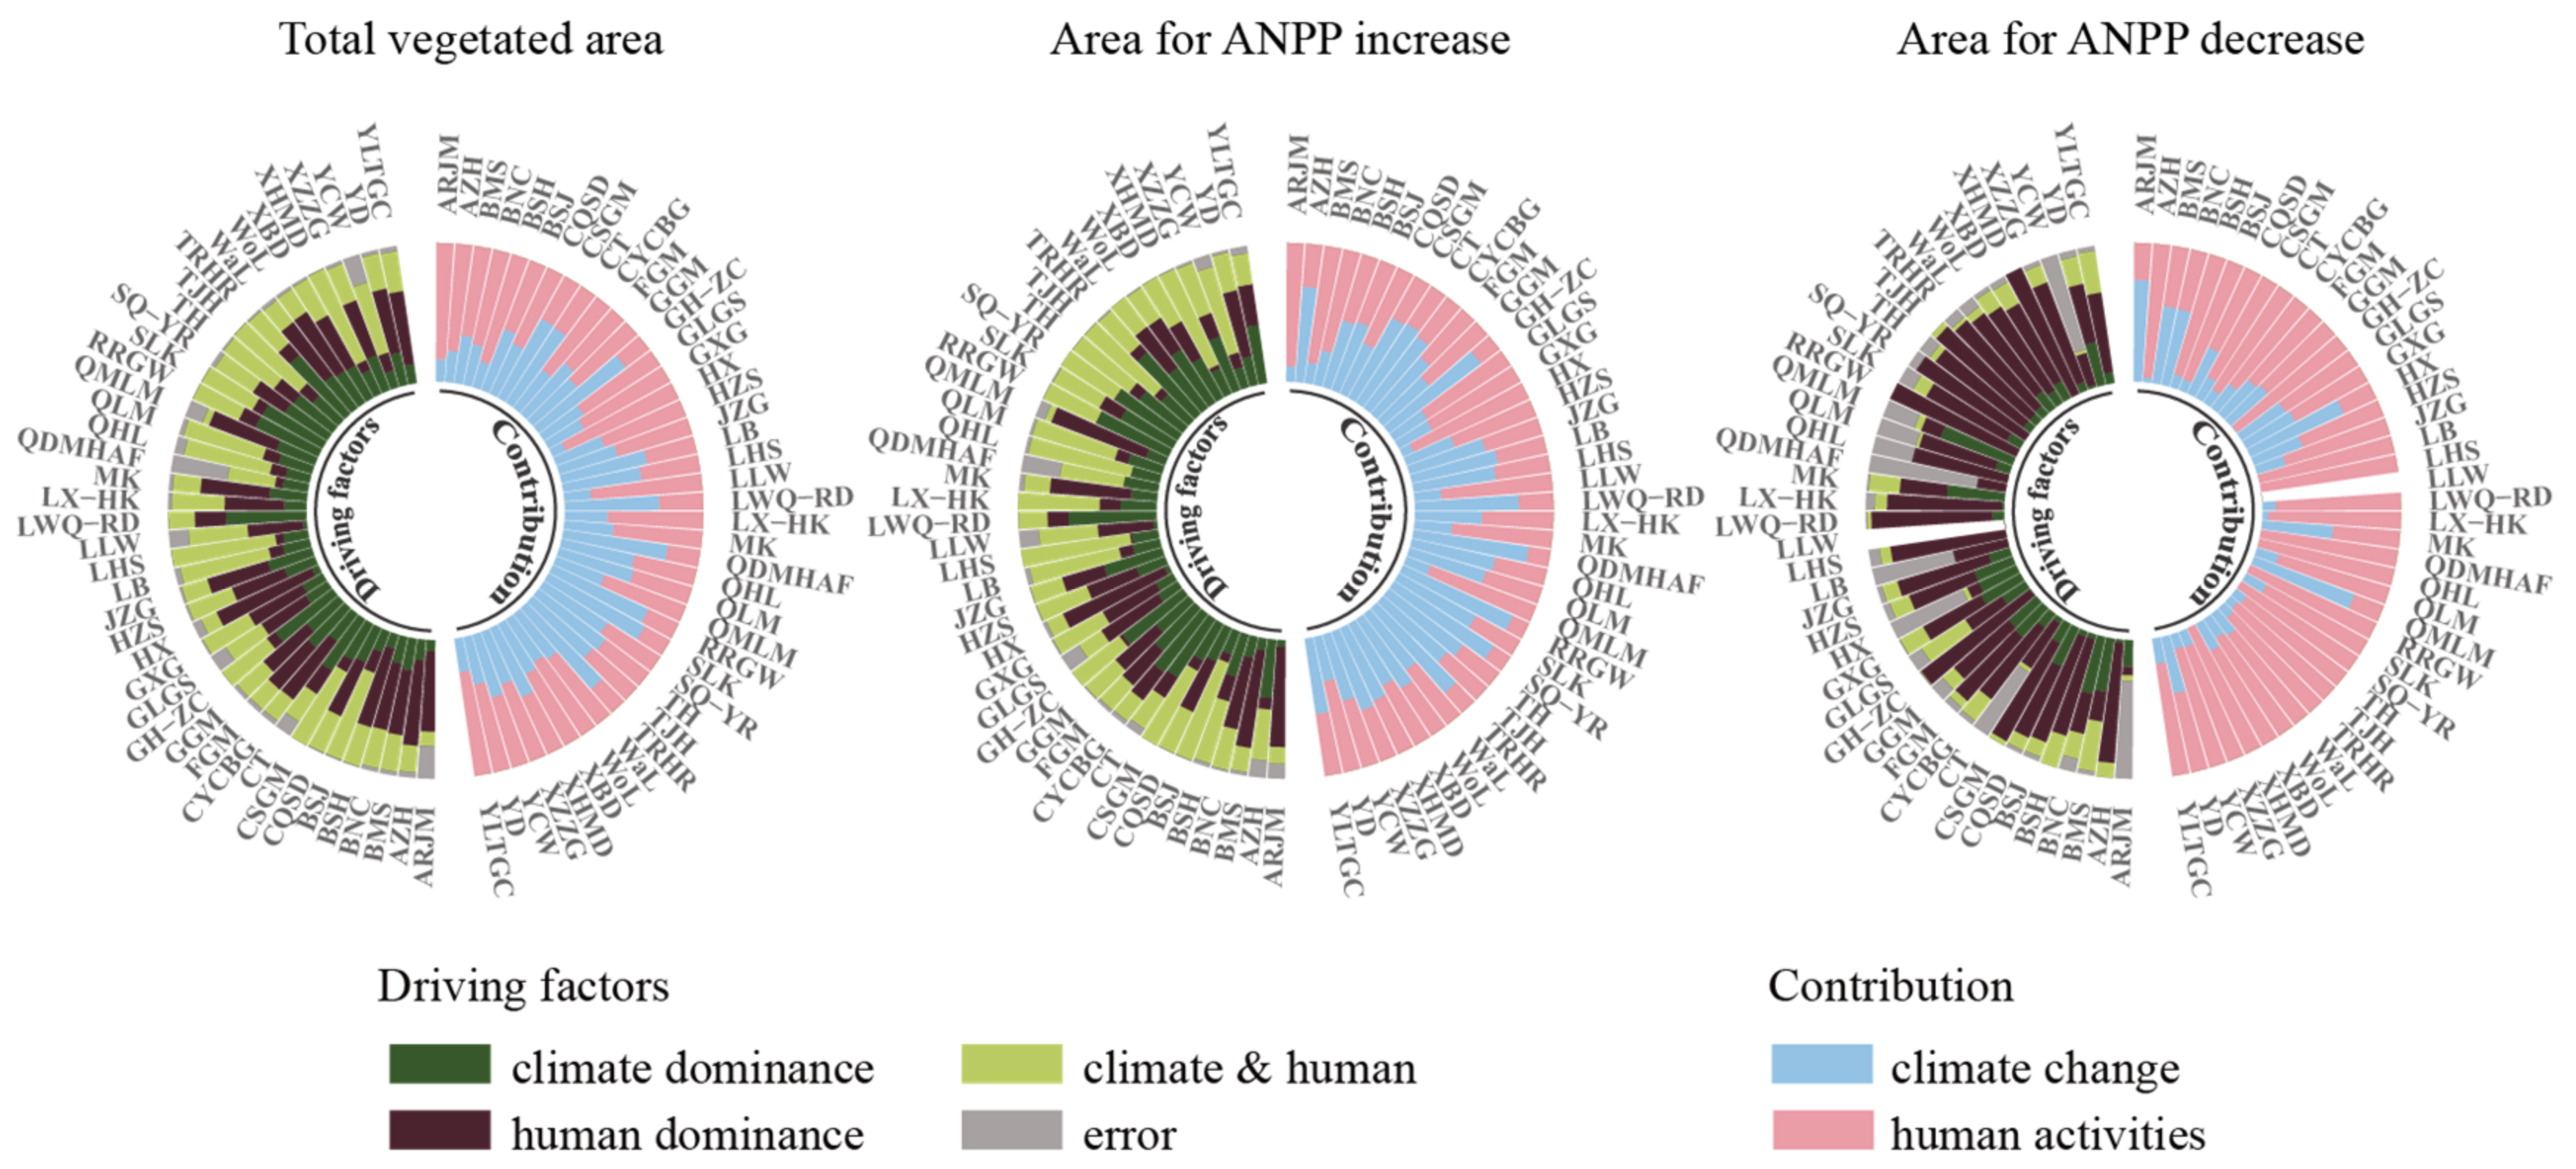
Climate factors (temperature and precipitation), human-related factors (such as grazing, agricultural expansion, infrastructure construction, and environmental protection projects), and their combined effects explained 40.38%, 25.22%, and 28.14% of the of ANPP variations, respectively. The dominant driving forces of ANPP variance differed among the 42 NNRs (Figure 3). Specifically, in 7 NNRs with 68.52% of the total vegetated area, ANPP variation was mainly due to climate change. In 23 NNRs with 23.49% percentage, human activities explained most of the ANPP variation. The ANPP variation of the remaining 12 NNRs with 7.99% percentage, was driven by the combined effects of climatic factors and human activities.
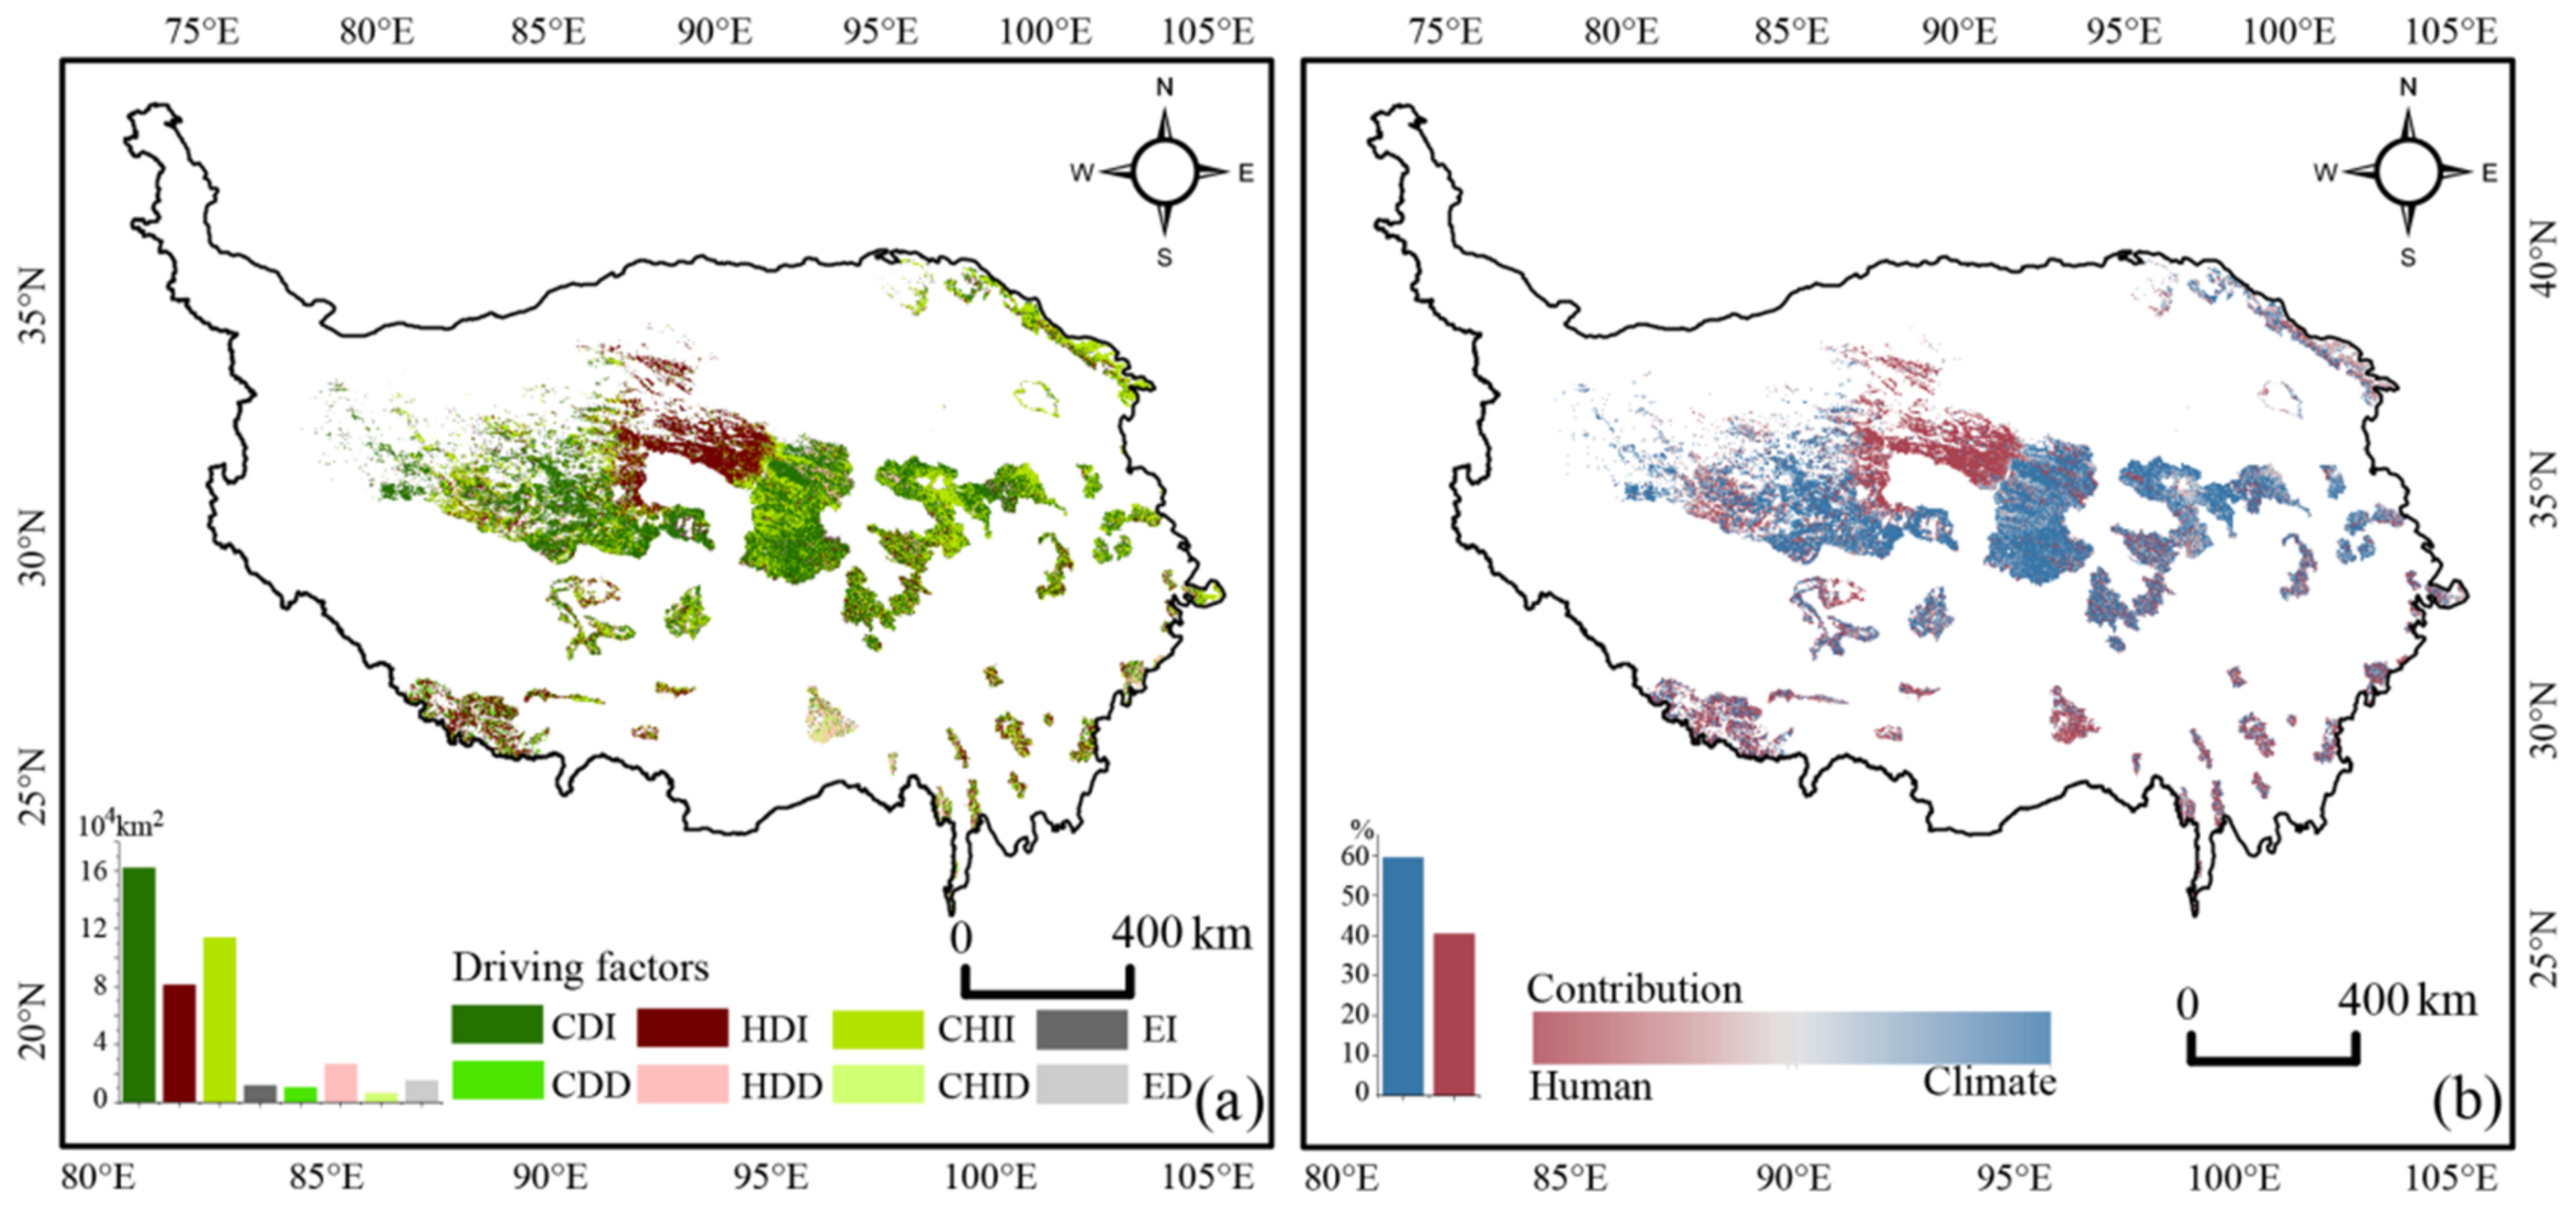
It also can be found in Figure 4 that in regions with increasing ANPP, the climate-dominated area, i.e., where ANPP variation was mainly due to climatic factors, was greater than the human-activity-dominated area (63.17 vs. 36.83%). In regions with decreasing ANPP, human-activity-dominated ANPP variation had a larger area than climate factors (70.6 vs. 29.4%).
Overall, climatic factors dominated ANPP variation in NNRs on the QTP. Statistically, the percentage of the climate-dominated area (59.53%) was 1.5 times higher than that of the human-activity-dominated area (Figure 4). The climate-dominated regions were mainly concentrated in the central and eastern parts of the QTP, such as the TRHR, Shouqu of the Yellow River (SQ-YR), and the Ruoergai wetland nature reserve (RRGW). On the other hand, the human-activity-dominated area was mainly in the HX, the YLTGC, and the Haizishan nature reserve (HZS).

3.3. Relationships between ANPP and Climatic Factors

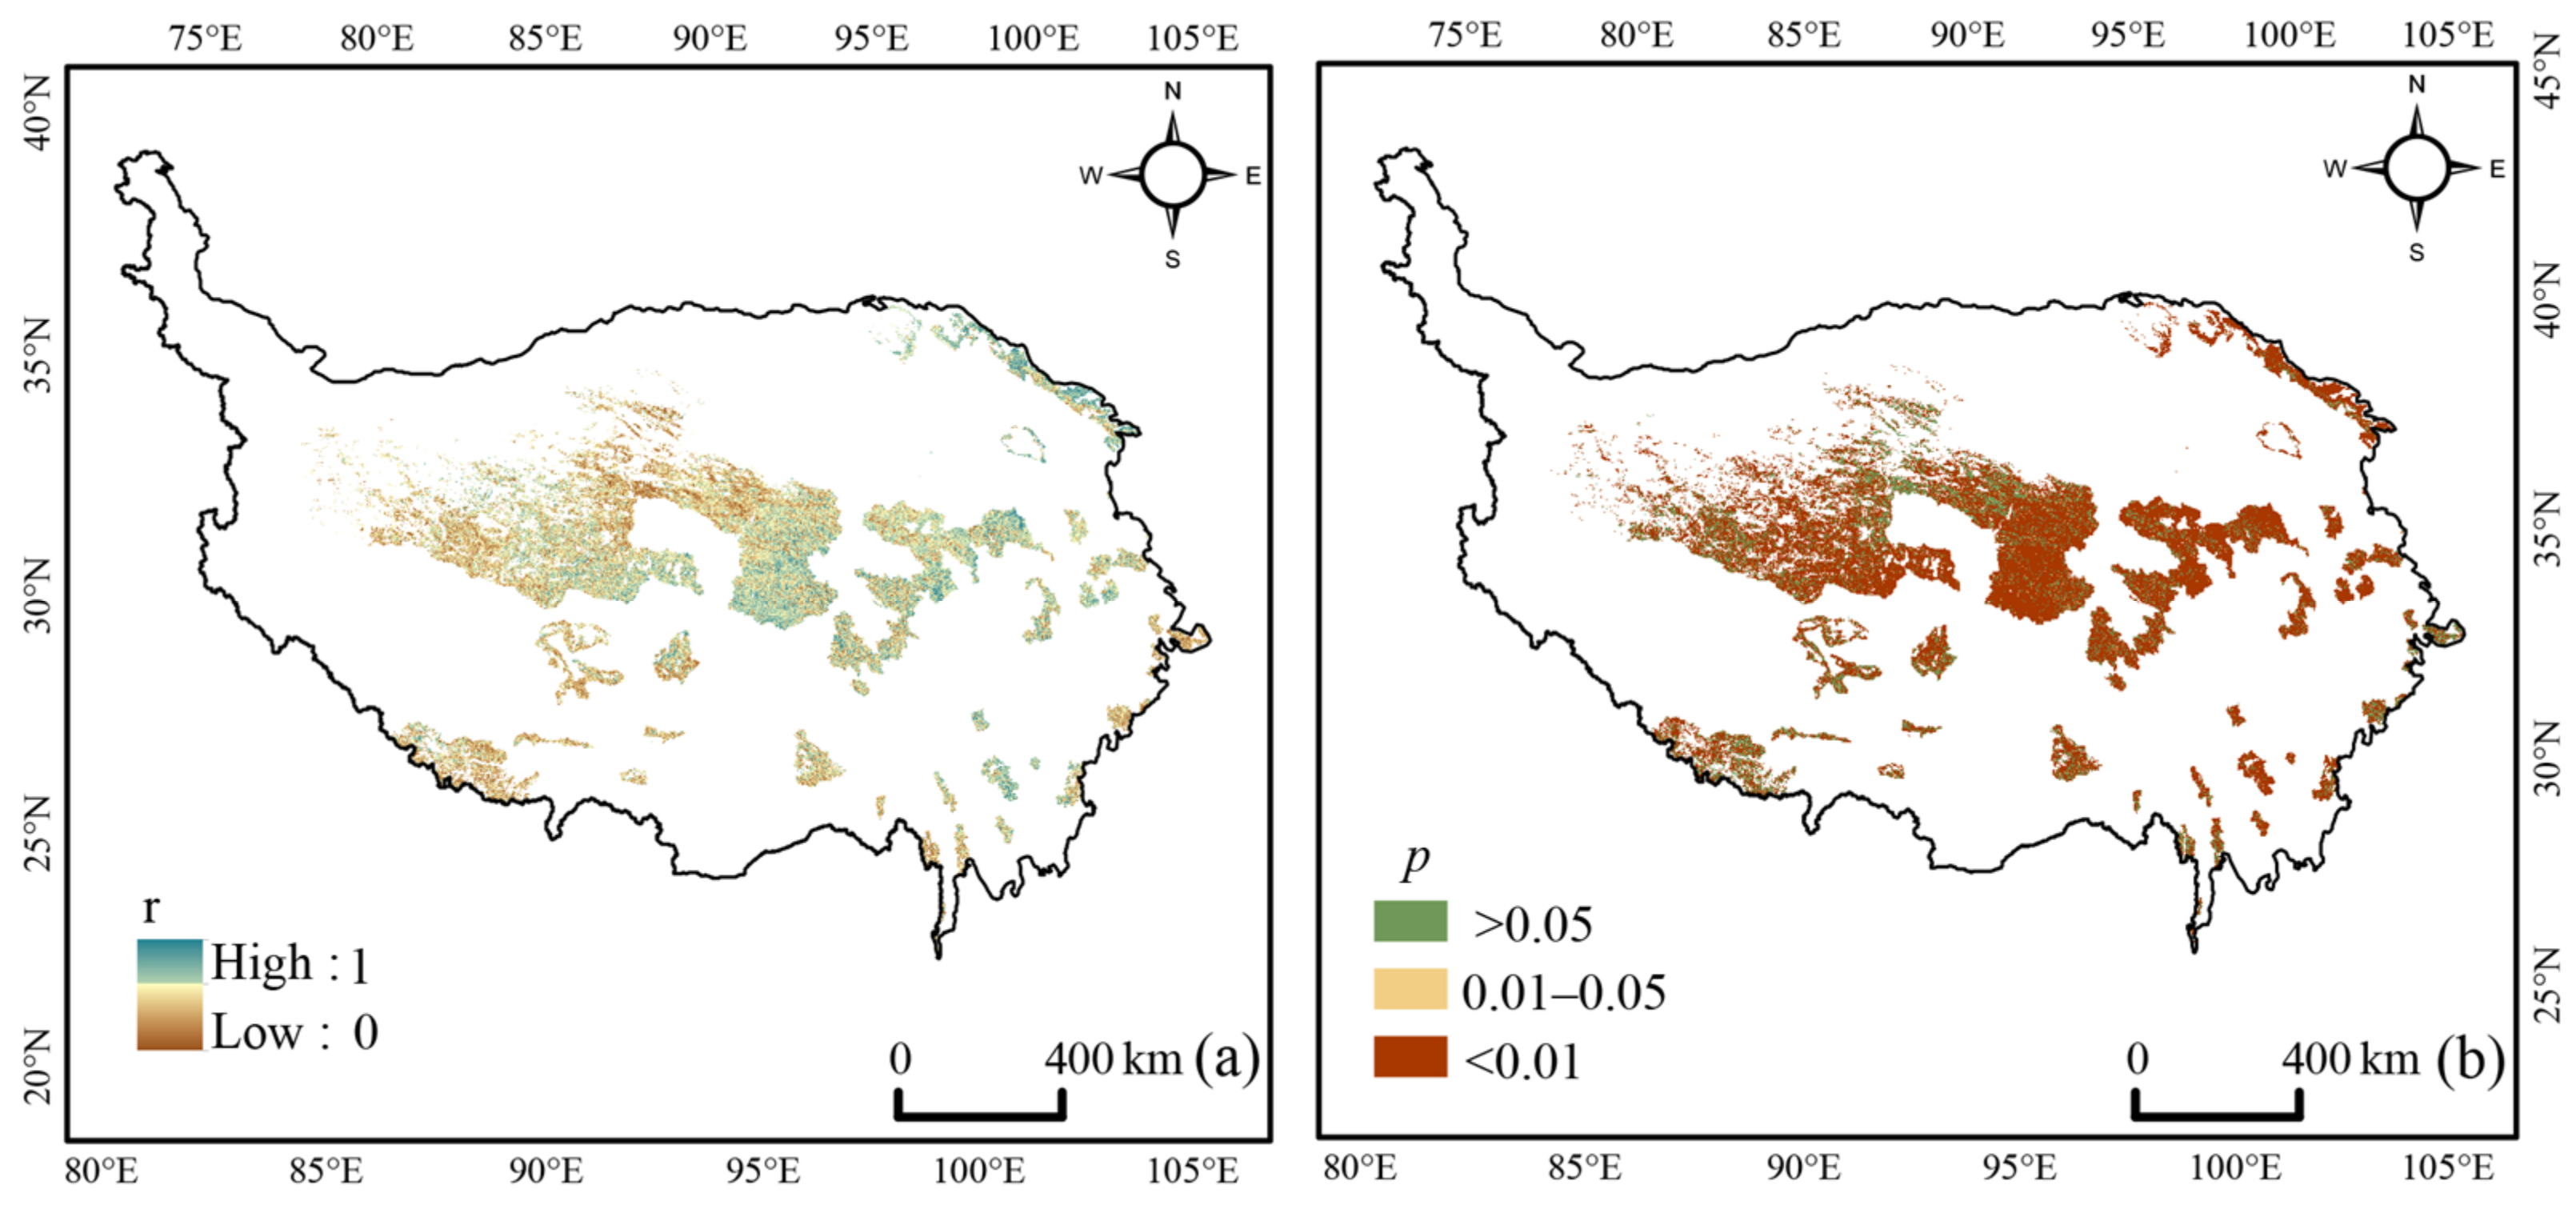
To better understand the influence of climatic factors on ANPP, the correlation coefficients between ANPP and temperature and precipitation were analyzed for all pixels. Interestingly, the area with highly significant correlation coefficients (Figure 5b) was generally consistent with the area of a high contribution of climatic factors to ANPP (Figure 5a), indicating a general and reliable relationship between ANPP variation and climate change.
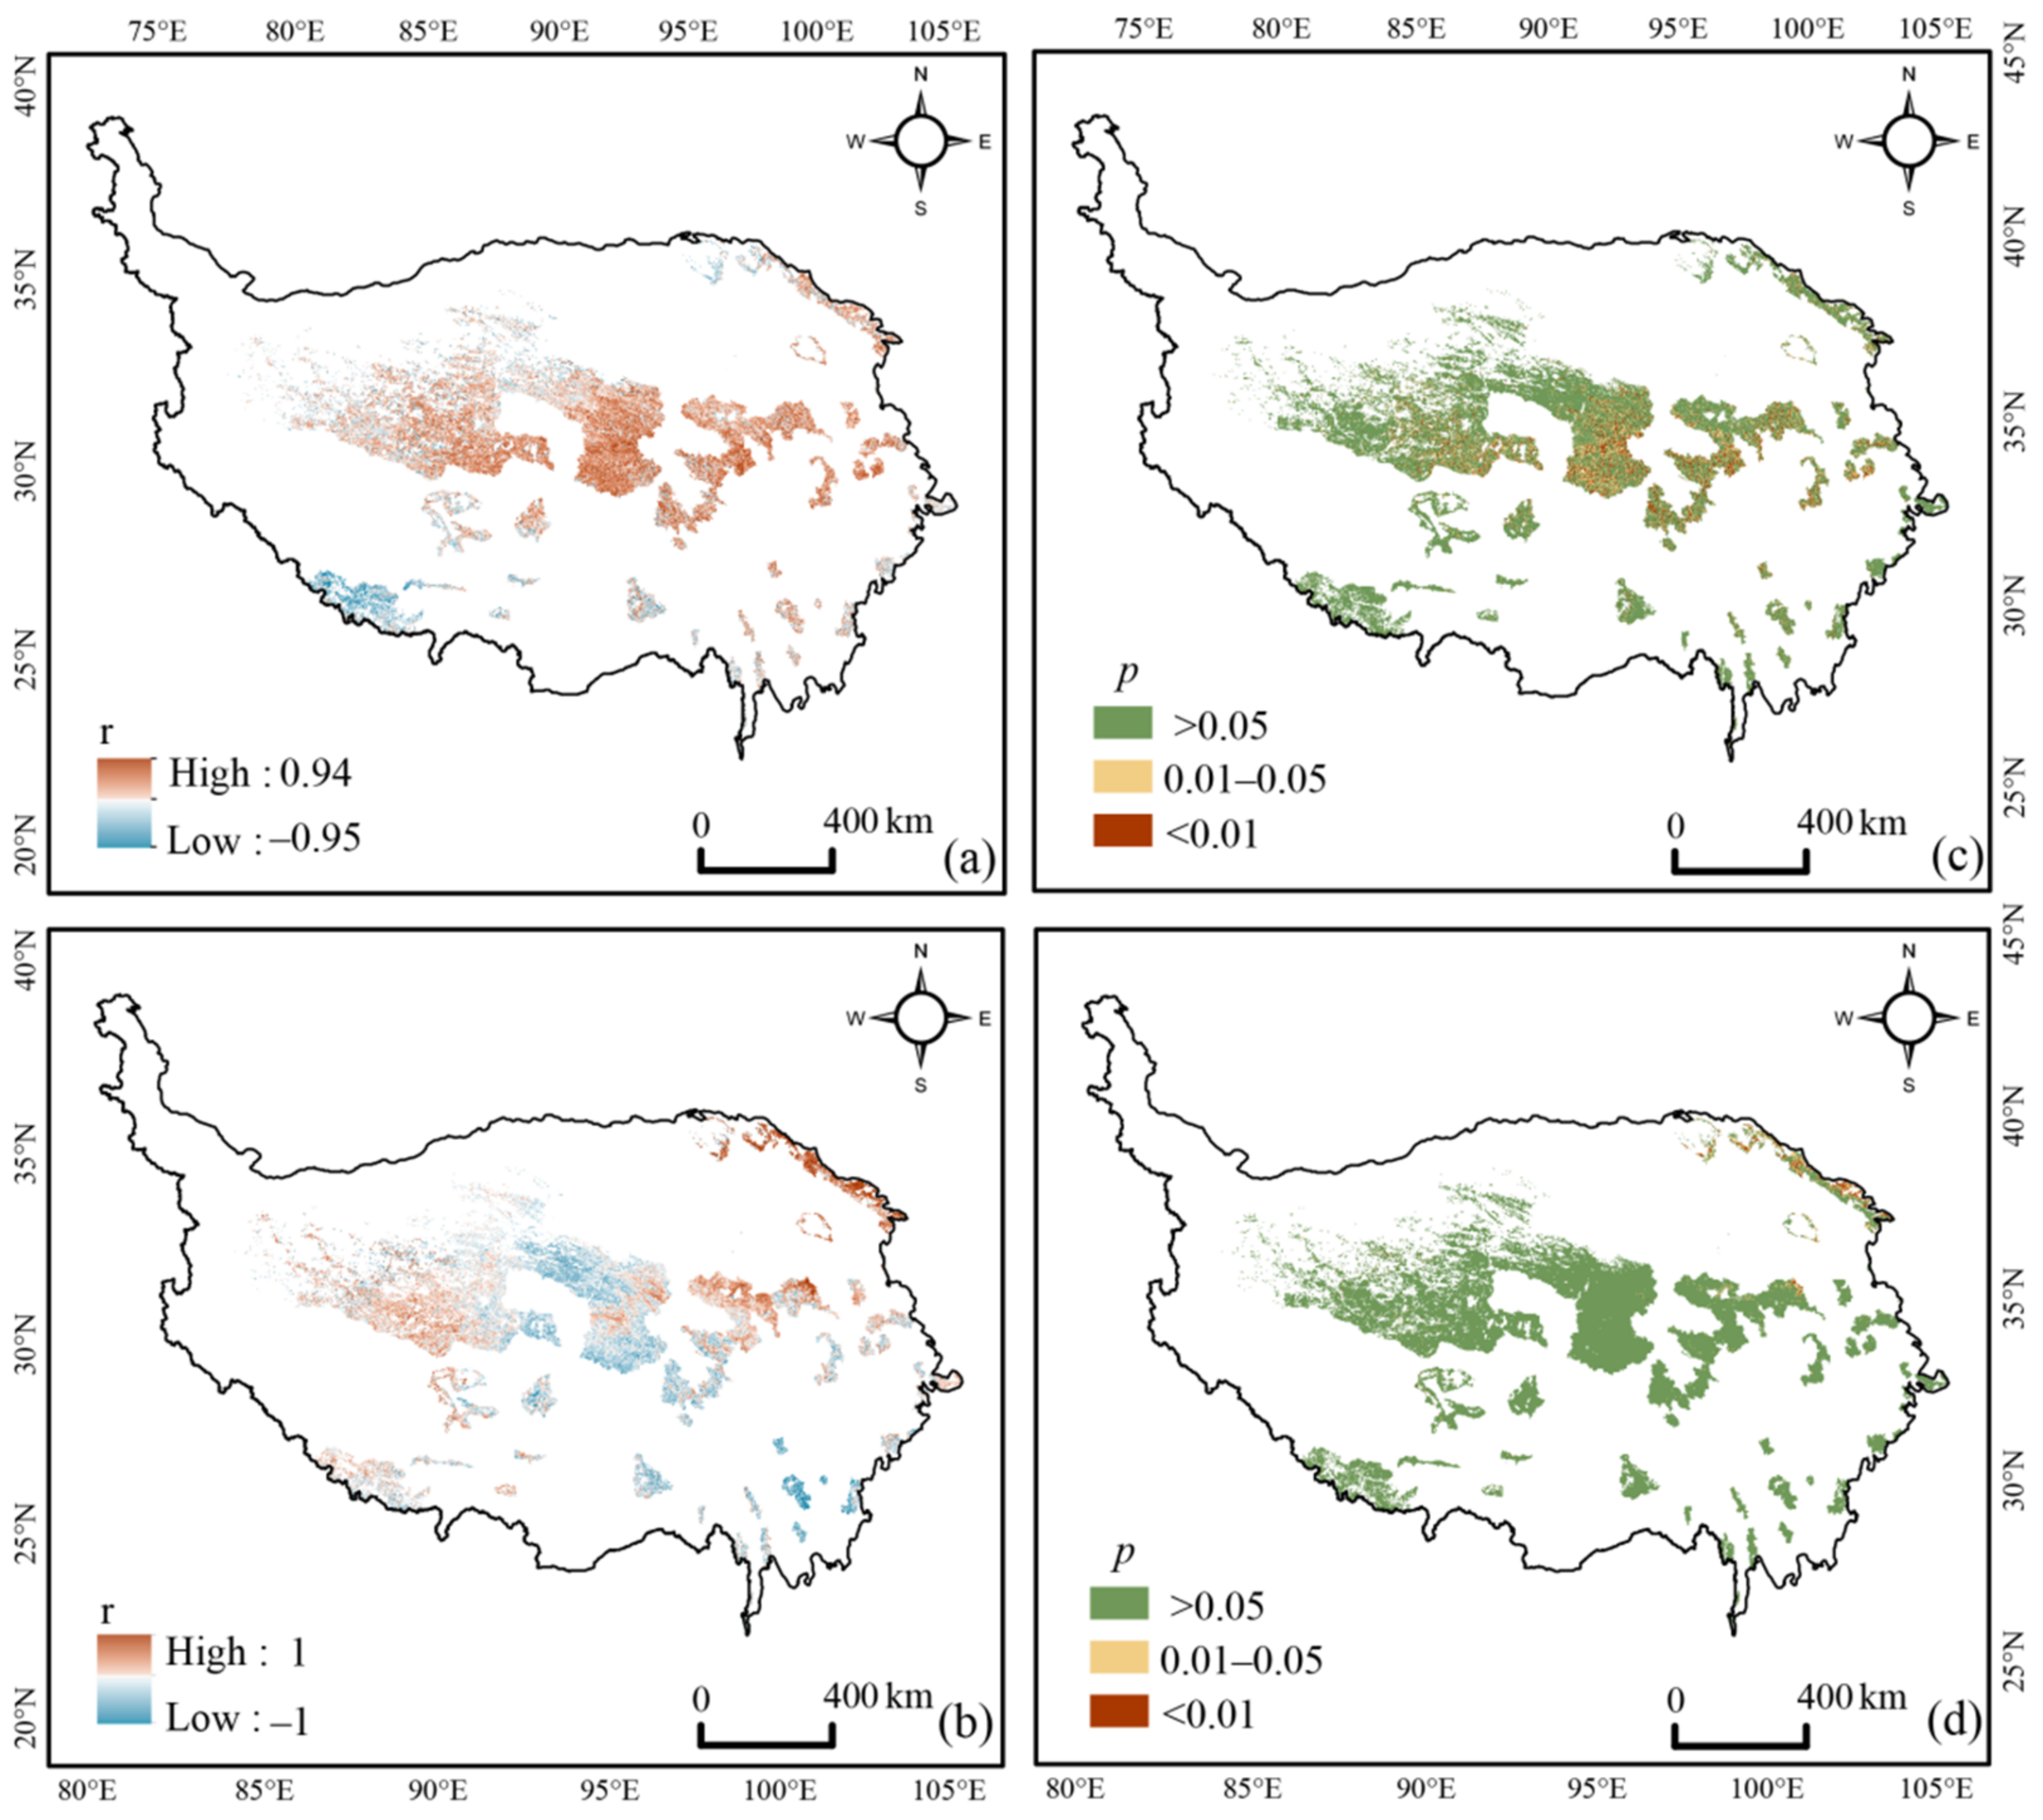
The mean values of partial correlation coefficients were 0.23 for ANPP and temperature, and 0.01 for ANPP and precipitation. In 81.48% of the total vegetated area, there was a positive correlation between ANPP and temperature (Figure 6a), and 25.66% of the area passed the significance test (Figure 6c), mainly in the TRHR. A negative correlation between ANPP and temperature occurred in the southern QTP, e.g., in the QMLM. In 50.24% of the total vegetated area, a positive correlation between ANPP and precipitation was found (Figure 6b), but only 3.94% passed the significance test (Figure 6d). Further, ANPP and precipitation were negatively correlated in 49.76% of the vegetated area (Figure 6b), and only 0.46% passed the significance test (p < 0.05; Figure 6d).

3.4. Prediction of Future ANPP Trends

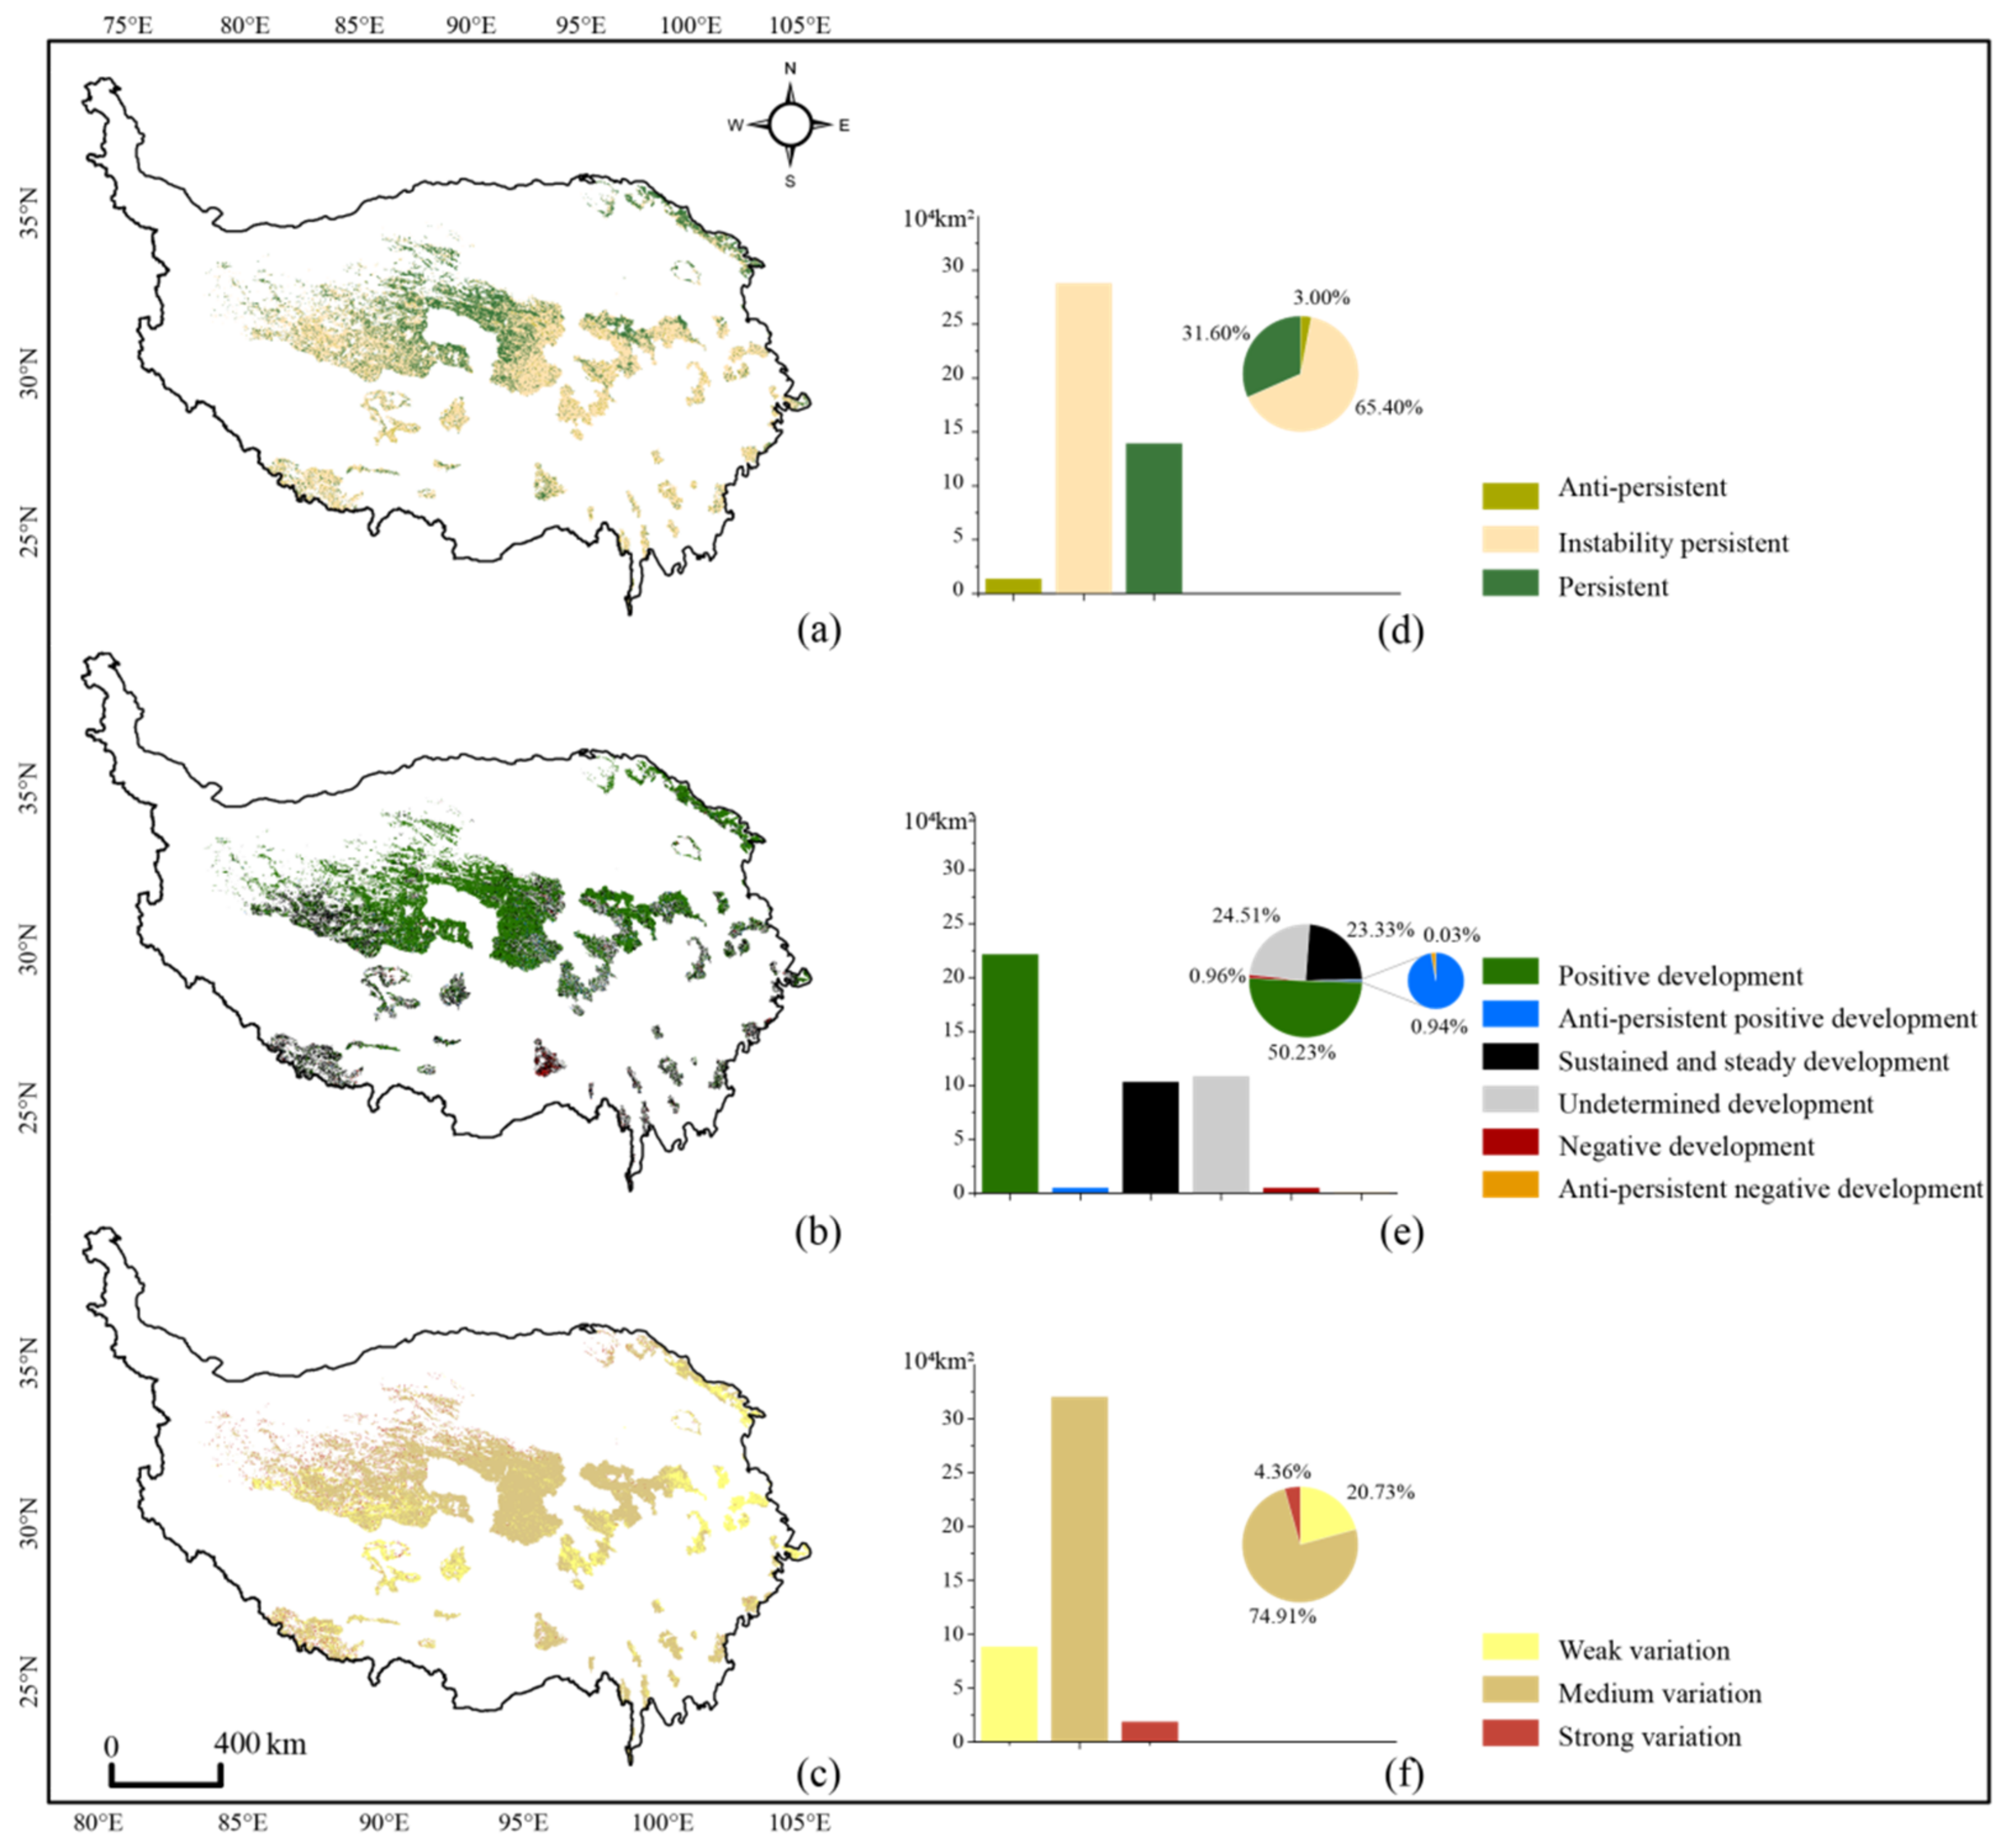
The Hurst exponent (H) of the ANPP in the 42 NNRs ranged between 0.19 and 0.76, with a mean value of 0.56, reflecting the same change in trend overall as the 2000–2020 period in the future. Pixels with H > 0.6 accounted for 31.60% of the total vegetation and were mainly distributed in the northwest region and central region, while pixels with H < 0.4 only accounted for 3.00% and were mainly distributed in the south region (Figure 7d), suggesting that future vegetation trends are likely to be consistent from those of the past 21 years. Moreover, 65.40% pixels of the H values were between 0.4 and 0.6 (Figure 7d), meaning that no consistent trend will exist in the future, and the ANPP variation was a stochastic series and was irrelated with that in the study period.
Combined with the Theil-Sen slopes, it showed that most of the vegetated areas in the NNRs on the QTP were projected to have persistent trends in the future, with 50.23% of the vegetated area belonging to the PD type (Table 2). There was 24.51% of pixels with undetermined future trends (UD). Regions with sustained and steady development (SSD) covered 23.33% of the vegetated area. Approximately 0.96% of the vegetated areas tended to maintain negative future trends (ND) and were mainly distributed in the southern regions of QTP. Vegetation showing anti-persistent positive development trends (APD) occupied 0.94% of the study area and were mainly distributed in the northwest and central regions of QTP. Areas with anti-persistent negative development trends (AND) only accounted for 0.03% of the vegetated areas.
To disentangle the relationships between historical stability and future vegetation ANPP trends, we assessed the stability of historical vegetation ANPP variations using the coefficient of variation (CV; Figure 7c). The mean CV of ANPP across the 42 NNRs was 32.62%, indicating changes with moderate fluctuations in general. Of the total vegetated areas, 95.64% indicated weak and medium variations, while strong variations only occurred in 4.36% areas. Most of the regions experiencing a weak variation corresponded to the areas with persistent trends (Figure 7c), while the regions with a strong variation were more likely to show non-persistent characteristics in the future.

4. Discussion

4.1. Effects of Climate Change and Human Activities on Vegetation

Temperature and precipitation largely determine the geographical distribution pattern of vegetation with high spatial and temporal heterogeneity [57]. The warming and humidification trend on the QTP in recent decades is considered to be the main factor for vegetation recovery [29,32,42]. However, conclusions about the effects of warming on vegetation productivity are inconsistent. Some studies concluded that temperature increases had adverse effects on vegetation growth [58], whereas others reported positive effects [29,43]. The present study is generally consistent with the finding that temperature positively affected vegetation ANPP, as ANPP correlated positively with temperature in 81.48% of the vegetated area. The main reason for this could be that higher temperatures increased the photosynthetic efficiency of vegetation, thus, allowing productivity to increase [59,60]. Another possible reason is that the warming led to an earlier phenological period and a longer growing season, thus, increasing organic matter accumulation [32]. However, adverse effects of increasing temperature also occurred in some NNRs in the present study. For example, temperature was negatively correlated with ANPP in most areas of the Qomolangma nature reserve. This phenomenon may be due to warming increasing the ecosystem evapotranspiration, which may exacerbate soil water deficits and consequently cause a decrease in vegetation productivity [20]. Additionally, most of the Qomolangma nature reserve is covered by snow and ice, and warming-induced melting may damage the root system of vegetation, resulting in reduced vegetation productivity [5,30,32,61]. Close relationships between precipitation and changes in vegetation dynamics have also been reported for the QTP [14,47,62]. In the present study, such relationships were mainly found in the NNRs of the northeastern QTP, where increases in precipitation were more pronounced than in other regions of the QTP [40,63,64]. There was no clear relationship between ANPP and precipitation in most other areas because either increases in precipitation were small or precipitation even decreased [30,49,65,66]. Accordingly, precipitation had positive and negative effects on vegetation ANPP in the present study. However, both effects generally could not pass the significance test in most areas of the NNRs.
The human-induced activities are the dominant factors affecting vegetation dynamics and may influence ecosystems both positively and negatively [33,67]. Most studies have concluded that climate change in arid and semi-arid regions plays a positive role in vegetation recovery, while human activities play a negative role [58,68,69]. For example, climatic factors mainly caused grassland NPP increases in arid regions of Central Asia, while human activities mainly caused grassland degradation [70]. It is also showed that vegetation recovery on the QTP from 2000 to 2015 was mainly caused by climate change, while human activities caused the degradation process [71]. In the 42 NNRs of this study, grazing is the most important type of human activities. Along with the booms of population and urbanization processes, the demands for animal husbandry and animal products are surging simultaneously, which could lead to chronic overstocking in pastoral areas of the NNRs [72]. The influences of grazing are particularly on alpine grassland and alpine meadow, which are located at the northwestern NNRs on QTP, such as Three-River Headwater Region nature reserve, Hoh Xil nature reserve, and Chang Tang nature reserve. Moreover, the developments of the tourism and tertiary industries in recent years are also the main types of human activities in the NNRs, especially in buffer regions of the NNRs. Additionally, mine extracting and energy exploitation are also existing in some NNRs, such as the QLM nature reserve. In this study, the effects of human activities on ANPP also showed significant spatial heterogeneity. Specifically, areas with a decline in ANPP mainly due to human activities accounted for 45.59% of the total vegetated area and mainly occurred in NNRs with high intensities of human activities, such as the Yarlung Tsangpo Grand Canyon nature reserve. However, in some other areas, such as the eastern region of the Hoh Xil nature reserve, human activities—i.e., strict conservation measures and the implementation of ecological projects—mainly caused the increase in ANPP [14,73,74]. Our results are generally consistent with most studies, which indicate that the impact of human activities on the vegetation of the QTP exhibits apparent spatial heterogeneity [32,42,43].
In this study, the PNPP, ANPP, and HNPP were used to establish public indicators to unify the effects of climate change and human activities on the vegetation variations to a comparable level in 42 NNRs on the QTP. The results showed that overall, the vegetation variations in the NNRs on the QTP were caused by climate change (59.53%) and human activities (40.47%), thus, indicating that the relative contribution of climate change to vegetation was almost 1.5 times higher than that of human activity. Furthermore, the relative contribution rate of human activities (40.47%) illustrates that the anthropogenic factors, such as grazing, infrastructure construction, and environmental protection projects, have also played an important (positive/negative) role in influencing vegetation variations. Actually, there has been considerable controversy over the relative roles of climate change and human activities in the vegetation variations on the QTP. Some studies suggested that climate change was the main cause of vegetation variations [29,33,48]. Nevertheless, other studies considered that the role of climate change was often overestimated, and human activities were the dominant factor for vegetation variations on the QTP [72,75]. For example, Huang et al. (2021) found that areas dominated by human activities are much smaller than those dominated by climate on the QTP [33]. On the other hand, it is reported that in the period of 2000–2019, the relative contribution of climate change to vegetation on the QTP was 34%, and that of human activities was 66% [75], which means that the relative contribution rate of human activities to vegetation was almost twice that of climatic factors. The contradiction may be due to the different research methods. In this research, we used a quantitative approach of ANPP, PNPP, and HNPP to obtain more quantitative findings. Through the analysis of all the possible scenarios based on the relationship between changes in NPP caused by climate change and human activities, it was possible to evaluate the relative roles of climate change and human activities on vegetation variations. In addition, the contradiction may also be due to the different management regimes within and outside the NNRs. For instance, protection is relatively strict in the NNRs on the QTP, which indicates that under the strictest regimes of natural reserve management, the human activities are generally excluded.

4.2. Limitations and Future Research Directions

The uncertainty of the quantitative assessment of this study was mainly manifested in the following aspects. Firstly, the MOD17A3HGF NPP data were used because they present spatiotemporal continuous NPP with much better quality and accuracy compared with other remote sensing products. However, this dataset still had accuracy limitations and uncertainties [76]. Thus, improving the accuracy of remote sensing products is still problematic.
Secondly, this study simplified the climatic factors that affect vegetation variations into temperature and precipitation, and attributed all non-natural factors to human activities. However, the factors affecting vegetation variation are highly complex and not limited to climate change or human activities [77,78]. Thus, the quantitative assessment for the contributions of climatic factors and human activities on vegetation variation had a lack of thoroughness. Therefore, other factors, such as soil properties, light conditions, fire, and specific vegetation types, should be considered in future studies [14]. In addition, this study only considered temperature and precipitation as climatic factors, but sunshine, evaporation, wind speed, and other factors are not included.
Thirdly, we used the Thornthwaite Memorial model to simulate the NPP for climate impacts in this study. Although this model has been widely used [14,58,79], fixed-model parameter values are a known shortcoming. Furthermore, these values are obtained from experience and do not consider differences among geographic environments. Additionally, the climate factors used in the Thornthwaite Memorial model only included temperature and precipitation, while other factors such as atmospheric humidity, air pressure, and solar radiation were not considered. Therefore, an improvement in the Thornthwaite Memorial model will be an important task in the future.
Finally, in this study, the nearest neighbor interpolation method was used to resample the spatial resolution of air temperature and precipitation. Although this method has been shown to perform well for interpolating climatic factors [43], uncertainties still exist in the assessments, which may lead to less reliable results. Therefore, considering the climate data situation and interpolation objectives, it is a particularly important consideration in the future to choose the most appropriate interpolation method.

5. Conclusions

In this study, we analyzed the dynamics of vegetation ANPP in 42 NNRs on the QTP from 2000 to 2020. Further, driving factors were determined by using an NPP-based scenario simulation. Future vegetation trends were also predicted. The main conclusions of this study were that ANPP was generally high in the southeast and low in the northwest. During the 21 years studied, 83.35% of the total area showed an overall increasing trend in ANPP. Climatic factors mainly drove ANPP variation with a contribution of 59.53%, which was 1.5 times higher than that of human activities. Furthermore, the annual average temperature contributed more to ANPP variation than annual average precipitation. Finally, we found generally persistent future vegetation trends for NNRs on the QTP, with 31.6% of the vegetated areas showing the same trends as the current trends.

Supplementary Materials

The following supporting information can be downloaded at: https://www.mdpi.com/article/10.3390/rs14184626/s1, Table S1: abbreviations of the name of national nature reserves.

Author Contributions

Software, formal analysis, investigation, resources, data curation, visualization, writing—original draft, J.Z.; Conceptualization, methodology, validation, writing—review and editing, supervision, project administration, funding acquisition, T.L. All authors have read and agreed to the published version of the manuscript.

Funding

This research was supported by the Second Tibetan Plateau Scientific Expedition and Research Program (STEP) (Grant No. 2019QZKK0402) and the National Natural Science Foundation of China (Grant No. 42071238).

Data Availability Statement

Not applicable.

Conflicts of Interest

The authors declare no conflict of interest.

References

  1. Liu, Y.Y.; Zhang, Z.Y.; Tong, L.J.; Khalifa, M.; Wang, Q.; Gang, C.C.; Wang, Z.Q.; Li, J.L.; Sun, Z.G. Assessing the Effects of Climate Variation and Human Activities on Grassland Degradation and Restoration Across the Globe. Ecol. Indic. 2019, 106, 105504. [Google Scholar] [CrossRef]
  2. Overpeck, J.T.; Breshears, D.D. The Growing Challenge of Vegetation Change. Science 2021, 372, 786–787. [Google Scholar] [CrossRef] [PubMed]
  3. Dawson, T.P.; Jackson, S.T.; House, J.I.; Prentice, I.C.; Mace, G.M. Beyond Predictions: Biodiversity Conservation in A Changing Climate. science 2011, 332, 53–58. [Google Scholar] [CrossRef] [PubMed]
  4. Wu, P.; Ding, Y.H.; Liu, Y.J.; Li, X.C. The Characteristics of Moisture Recycling and Its Impact on Regional Precipitation Against the Background of Climate Warming over Northwest China. Int. J. Climatol. 2019, 39, 5241–5255. [Google Scholar] [CrossRef]
  5. Ge, W.Y.; Deng, L.Q.; Wang, F.; Han, J.Q. Quantifying the Contributions of Human Activities and Climate Change to Vegetation Net Primary Productivity Dynamics in China from 2001 to 2016. Sci. Total Environ. 2021, 773, 145648. [Google Scholar] [CrossRef] [PubMed]
  6. Morecroft, M.D.; Duffield, S.; Harley, M.; Pearce-Higgins, J.W.; Stevens, N.; Watts, O.; Whitaker, J. Measuring the Success of Climate Change Adaptation and Mitigation in Terrestrial Ecosystems. Science 2019, 366, eaaw9256. [Google Scholar] [CrossRef] [PubMed]
  7. Hansen, A.J.; Defries, R. Ecologicl Mechanisms Linking Protected Areas to Surrounding Lands. Ecol. Appl. 2007, 17, 974–988. [Google Scholar] [CrossRef] [PubMed]
  8. Watson, J.E.; Dudley, N.; Segan, D.B.; Hockings, M. The Performance and Potential of Protected Areas. Nature 2014, 515, 67–73. [Google Scholar] [CrossRef]
  9. Jiang, L.L.; Guli, J.; Bao, A.M.; Guo, H.; Ndayisaba, F. Vegetation Dynamics and Responses to Climate Change and Human Activities in Central Asia. Sci. Total Environ. 2017, 599–600, 967–980. [Google Scholar] [CrossRef]
  10. Berdimbetov, T.; Ilyas, S.; Ma, Z.G.; Bilal, M.; Nietullaeva, S. Climatic Change and Human Activities Link to Vegetation Dynamics in the Aral Sea Basin Using NDVI. Earth Syst. Environ. 2021, 5, 303–318. [Google Scholar] [CrossRef]
  11. Zhao, S.; Pereira, P.; Wu, X.Q.; Zhou, J.X.; Cao, J.H.; Zhang, W.X. Global Karst Vegetation Regime and Its Response to Climate Change and Human Activities. Ecol. Indic. 2020, 113, 106208. [Google Scholar] [CrossRef]
  12. Zhang, Y.; Zhang, C.B.; Wang, Z.Q.; Chen, Y.Z.; Gang, C.C.; An, R.; Li, J.L. Vegetation Dynamics and Its Driving Forces from Climate Change and Human Activities in the Three-River Source Region, China from 1982 to 2012. Sci. Total Environ. 2016, 563–564, 210–220. [Google Scholar] [CrossRef] [PubMed]
  13. Cao, F.F.; Li, J.X.; Fu, X.; Wu, G. Impacts of Land Conversion and Management Measures on Net Primary Productivity in Semi-arid Grassland. Ecosyst. Health Sustain. 2020, 6, 1749010. [Google Scholar] [CrossRef]
  14. Naeem, S.; Zhang, Y.Q.; Tian, J.; Qamer, F.M.; Latif, A.; Paul, P.K. Quantifying the Impacts of Anthropogenic Activities and Climate Variations on Vegetation Productivity Changes in China from 1985 to 2015. Remote Sens. 2020, 12, 1113. [Google Scholar] [CrossRef]
  15. Cramer, W.; Field, C.B. Comparing Global Models of Terrestrial Net Primary Productivity (NPP): Introduction. Glob. Change Biol. 1999, 5, iii–iv. [Google Scholar] [CrossRef]
  16. Crabtree, R.; Potter, C.; Mullen, R.; Sheldon, J.; Huang, S.; Harmsen, J.; Rodman, A.; Jean, C. A Modeling and Spatio-temporal Analysis Framework for Monitoring Environmental Change Using NPP as an Ecosystem Indicator. Remote Sens. Environ. 2009, 113, 1486–1496. [Google Scholar] [CrossRef]
  17. Sun, J.; Yue, Y.; Niu, H. Evaluation of NPP Using Three Models Compared with MODIS-NPP Data over China. PLoS ONE 2021, 16, e0252149. [Google Scholar] [CrossRef]
  18. Liu, Z.J.; Liu, Y.S.; Wang, J.Y. A Global Analysis of Agricultural Productivity and Water Resource Consumption Changes over Cropland Expansion Regions. Agric. Ecosyst. Environ. 2021, 321, 107630. [Google Scholar] [CrossRef]
  19. Cleveland, C.C.; Taylor, P.; Chadwick, K.D.; Dahlin, K.; Doughty, C.E.; Malhi, Y.; Smith, W.K.; Sullivan, B.W.; Wieder, W.R.; Townsend, A.R. A Comparison of Plot-based Satellite and Earth System Model Estimates of Tropical Forest Net Primary Production. Glob. Biogeochem. Cycles 2015, 29, 626–644. [Google Scholar] [CrossRef]
  20. Zhao, M.; Running, S.W. Response to Comments on “Drought-Induced Reduction in Global Terrestrial Net Primary Production from 2000 Through 2009”. Science 2011, 333, 1093-e. [Google Scholar] [CrossRef] [Green Version]
  21. Dimitrakopoulos, P.G.; Koukoulas, S.; Michelaki, C.; Galanidis, A. Anthropogenic and Environmental Determinants of Alien Plant Species Spatial Distribution on An Island Scale. Sci. Total Environ. 2022, 805, 150314. [Google Scholar] [CrossRef] [PubMed]
  22. Gang, C.C.; Wang, Z.N.; You, Y.F.; Liu, Y.; Xu, R.T.; Bian, Z.H.; Pan, N.Q.; Gao, X.R.; Chen, M.X.; Zhang, M. Divergent Responses of Terrestrial Carbon Use Efficiency to Climate Variation from 2000 to 2018. Glob. Planet. Change 2022, 208, 103709. [Google Scholar] [CrossRef]
  23. Ibañez-Alvarez, M.; Baraza, E.; Serrano, E.; Romero-Munar, A.; Cardona, C.; Bartolome, J.; Krumins, J.A. Ungulates Alter Plant Cover without Consistent Effect on Soil Ecosystem Functioning. Agric. Ecosyst. Environ. 2022, 326, 107796. [Google Scholar] [CrossRef]
  24. Hu, J.N.; Nan, Z.T.; Ji, H.L. Spatiotemporal Characteristics of NPP Changes in Frozen Ground Areas of the Three-River Headwaters Region, China: A Regional Modeling Perspective. Front. Earth Sci. 2022, 10, 838558. [Google Scholar] [CrossRef]
  25. Su, X.K.; Shen, Y.; Zhou, W.; Liu, Y.Q.; Cheng, H.; Liu, G.H. Mapping Forest Disturbance and Recovery for Ecological Security Improvement on the Qinghai-Tibet Plateau: A Case Study from Three Parallel Rivers Region. Glob. Ecol. Conserv. 2022, 33, e01983. [Google Scholar] [CrossRef]
  26. Chen, X.; Su, Z.; Ma, Y.; Liu, S.; Yu, Q.; Xu, Z. Development of a 10-Year (2001–2010) 0.1° Data Set of Land-Surface Energy Balance for Mainland China. Atmos. Chem. Phys. 2014, 14, 13097–13117. [Google Scholar] [CrossRef]
  27. Cui, X.F.; Graf, H.F. Recent Land Cover Changes on the Tibetan Plateau: A Review. Clim. Change 2009, 94, 47–61. [Google Scholar] [CrossRef]
  28. Chen, H.; Zhu, Q.; Peng, C.H.; Wu, N.; Wang, Y.F.; Fang, X.Q.; Gao, Y.H.; Zhu, D.; Yang, G.; Tian, J.Q.; et al. The Impacts of Climate Change and Human Activities on Biogeochemical Cycles on the Qinghai-Tibetan Plateau. Glob. Change Biol. 2013, 19, 2940–2955. [Google Scholar] [CrossRef]
  29. Yu, H.L.; Ding, Q.N.; Meng, B.P.; Lv, Y.Y.; Liu, C.; Zhang, X.Y.; Sun, Y.; Li, M.; Yi, S.H. The Relative Contributions of Climate and Grazing on the Dynamics of Grassland NPP and PUE on the Qinghai-Tibet Plateau. Remote Sens. 2021, 13, 3424. [Google Scholar] [CrossRef]
  30. Gao, J.G.; Zhang, Y.L.; Liu, L.S.; Wang, Z.F. Climate Change as the Major Driver of Alpine Grasslands Expansion and Contraction: A Case Study in the Mt. Qomolangma (Everest) National Nature Preserve, southern Tibetan Plateau. Quat. Int. 2014, 336, 108–116. [Google Scholar] [CrossRef]
  31. Zhang, Y.; Ganjurjav, H.; Dong, S.K.; Gao, Q.Z. Excessive Plant Compensatory Growth: A Potential Endogenous Driver of Meadow Degradation on the Qinghai-Tibetan Plateau. Ecosyst. Health Sustain. 2020, 6, 1816500. [Google Scholar] [CrossRef]
  32. Xiong, Q.L.; Xiao, Y.; Liang, P.H.; Li, L.J.; Zhang, L.; Li, T.; Pan, K.W.; Liu, C.G. Trends in Climate Change and Human Interventions Indicate Grassland Productivity on the Qinghai–Tibetan Plateau from 1980 to 2015. Ecol. Indic. 2021, 129, 108010. [Google Scholar] [CrossRef]
  33. Huang, K.; Zhang, Y.J.; Zhu, J.T.; Liu, Y.J.; Zu, J.X.; Zhang, J. The Influences of Climate Change and Human Activities on Vegetation Dynamics in the Qinghai-Tibet Plateau. Remote Sens. 2016, 8, 876. [Google Scholar] [CrossRef]
  34. Wang, X.M.; Lang, L.L.; Yan, P.; Wang, G.T.; Li, H.; Ma, W.Y.; Hua, T. Aeolian Processes and Their Effect on Sandy Desertification of the Qinghai–Tibet Plateau: A Wind Tunnel Experiment. Soil Tillage Res. 2016, 158, 67–75. [Google Scholar] [CrossRef]
  35. Xiong, Q.L.; Xiao, Y.; Halmy, M.W.A.; Dakhil, M.A.; Liang, P.H.; Liu, C.G.; Zhang, L.; Pandey, B.; Pan, K.; El Kafraway, S.B.; et al. Monitoring the Impact of Climate Change and Human Activities on Grassland Vegetation Dynamics in the Northeastern Qinghai-Tibet Plateau of China during 2000–2015. J. Arid Land 2019, 11, 637–651. [Google Scholar] [CrossRef]
  36. Zhang, Y.L.; Wu, X.; Qi, W.; Li, S.C.; Bai, W.Q. Characteristics and Protection Effectiveness of Nature Reserves on the Tibetan Plateau, China. Resour. Sci. 2015, 37, 1455–1464. (In Chinese) [Google Scholar]
  37. Kienast, F.; Wildi, O.; Brzeziecki, B. Potemtial Impacts of Climate Change on Species Richness in Mountain Forests An Ecological Risk Assessment. Biol. Conserv. 1998, 83, 291–305. [Google Scholar] [CrossRef]
  38. González-Alcaraz, M.N.; Jiménez-Cárceles, F.J.; Álvarez, Y.; Álvarez-Rogel, J. Gradients of Soil Salinity and Moisture, and Plant Distribution, in a Mediterranean Semiarid Saline Watershed: A Model of Soil–plant Relationships for Contributing to the Management. Catena 2014, 115, 150–158. [Google Scholar] [CrossRef]
  39. García-Gil, G.; Sosa-Escalante, J.E.; Aguilar-Cordero, W.d.J.; Flores-Guido, J.S.; Martínez, y.Y.F. Change of Land Use in the Zone Subject to Ecological Conservation Cuxtal Reserve, Merida, Yucatan, Mexico. Investig. Geográficas 2020, 101, e59895. [Google Scholar]
  40. Zhang, X.C.; Jin, X.M. Vegetation Dynamics and Responses to Climate Change and Anthropogenic Activities in the Three-River Headwaters Region, China. Ecol. Indic. 2021, 131, 108223. [Google Scholar] [CrossRef]
  41. Yan, W.C.; Wang, Y.Y.; Chaudhary, P.; Ju, P.J.; Zhu, Q.; Kang, X.M.; Chen, H.; He, Y.X. Effects of Climate Change and Human Activities on Net Primary Production of Wetlands on the Zoige Plateau from 1990 to 2015. Glob. Ecol. Conserv. 2022, 35, e02052. [Google Scholar] [CrossRef]
  42. Qin, X.J.; Sun, J.; Liu, M.; Lu, X.Y. The Impact of Climate Change and Human Activity on Net Primary Production in Tibet. Pol. J. Environ. Stud. 2016, 25, 2113–2120. [Google Scholar] [CrossRef]
  43. Zhang, Y.; Hu, Q.W.; Zou, F.L. Spatio-Temporal Changes of Vegetation Net Primary Productivity and Its Driving Factors on the Qinghai-Tibetan Plateau from 2001 to 2017. Remote Sens. 2021, 13, 1566. [Google Scholar] [CrossRef]
  44. Ugbaje, S.U.; Odeh, I.O.A.; Bishop, T.F.A.; Li, J.L. Assessing the Spatio-Temporal Variability of Vegetation Productivity in Africa: Quantifying the Relative Roles of Climate Variability and Human Activities. Int. J. Digit. Earth 2016, 10, 879–900. [Google Scholar] [CrossRef]
  45. Jahelnabi, A.E.; Wu, W.C.; Boloorani, A.D.; Salem, H.M.; Nazeer, M.; Fadoul, S.M.; Khan, M.S. Assessment the Influence of Climate and Human Activities in Vegetation Degradation using GIS and Remote Sensing Techniques. Contemp. Probl. Ecol. 2020, 13, 685–693. [Google Scholar] [CrossRef]
  46. Wu, N.T.; Liu, A.J.; Ye, R.H.; Yu, D.S.; Du, W.L.; Chaolumeng, Q.; Liu, G.X.; Yu, S. Quantitative Analysis of Relative Impacts of Climate Change and Human Activities on Xilingol Grassland in Recent 40 years. Glob. Ecol. Conserv. 2021, 32, e01884. [Google Scholar] [CrossRef]
  47. Chen, T.; Bao, A.M.; Jiapaer, G.; Guo, H.; Zheng, G.X.; Jiang, L.L.; Chang, C.; Tuerhanjiang, L. Disentangling the Relative Impacts of Climate Change and Human Activities on Arid and Semiarid Grasslands in Central Asia during 1982–2015. Sci. Total Environ. 2019, 653, 1311–1325. [Google Scholar] [CrossRef]
  48. Chen, B.; Zhang, X.; Tao, J.; Wu, J.; Wang, J.; Shi, P.; Zhang, Y.; Yu, C. The impact of climate change and anthropogenic activities on alpine grassland over the Qinghai-Tibet Plateau. Agric. For. Meteorol. 2014, 189–190, 11–18. [Google Scholar] [CrossRef]
  49. Yin, L.; Dai, E.F.; Zheng, D.; Wang, Y.H.; Ma, L.; Tong, M. What Drives the Vegetation Dynamics in the Hengduan Mountain Region, Southwest China: Climate Change or Human Activity? Ecol. Indic. 2020, 112, 106013. [Google Scholar] [CrossRef]
  50. Zhou, J.; Lu, T. Long-Term Spatial and Temporal Variation of Near Surface Air Temperature in Southwest China During 1969–2018. Front. Earth Sci. 2021, 9, 753757. [Google Scholar] [CrossRef]
  51. Igbawua, T.; Zhang, J.H.; Yao, F.M.; Ali, S. Long Range Correlation in Vegetation over West Africa from 1982 to 2011. IEEE Access 2019, 7, 119151–119165. [Google Scholar] [CrossRef]
  52. Bashir, B.; Cao, C.X.; Naeem, S.; Joharestani, M.Z.; Bo, X.; Huma, A.; Jamal, K.; Mumtaz, F. Spatio-Temporal Vegetation Dynamic and Persistence under Climatic and Anthropogenic Factors. Remote Sens. 2020, 12, 2612. [Google Scholar] [CrossRef]
  53. Pal, S.; Dutta, S.; Nasrin, T.; Chattopadhyay, S. Hurst Exponent Approach Through Rescaled range Analysis to Study the Time Series of Summer Monsoon Rainfall over Northeast India. Theor. Appl. Climatol. 2020, 142, 581–587. [Google Scholar] [CrossRef]
  54. Sánchez Granero, M.A.; Trinidad Segovia, J.E.; García Pérez, J. Some Comments on Hurst Exponent and the Long Memory Processes on Capital Markets. Phys. A 2008, 387, 5543–5551. [Google Scholar] [CrossRef]
  55. Chen, J.H.; Yan, F.; Lu, Q. Spatiotemporal Variation of Vegetation on the Qinghai–Tibet Plateau and the Influence of Climatic Factors and Human Activities on Vegetation Trend (2000–2019). Remote Sens. 2020, 12, 3150. [Google Scholar] [CrossRef]
  56. Martínez, B.; Sánchez-Ruiz, S.; Campos-Taberner, M.; García-Haro, F.J.; Gilabert, M.A. Exploring Ecosystem Functioning in Spain with Gross and Net Primary Production Time Series. Remote Sens. 2022, 14, 1310. [Google Scholar] [CrossRef]
  57. Fibbi, L.; Moriondo, M.; Chiesi, M.; Bindi, M.; Maselli, F. Impacts of Climate Change on the Gross Primary Production of Italian Forests. Ann. For. Sci. 2019, 76, 59. [Google Scholar] [CrossRef]
  58. Wang, Y.M.; Zhang, Z.X.; Chen, X. The Dominant Driving Force of Forest Change in the Yangtze River Basin, China: Climate Variation or Anthropogenic Activities? Forests 2022, 13, 82. [Google Scholar] [CrossRef]
  59. Qian, H.F.; Joseph, R.; Zeng, N. Enhanced Terrestrial Carbon Uptake in the Northern High Latitudes in the 21st Century from the Coupled Carbon Cycle Climate Model Intercomparison Project Model projections. Glob. Change Biol. 2010, 16, 641–656. [Google Scholar] [CrossRef]
  60. Xu, L.; Myneni, R.B.; Chapin Iii, F.S.; Callaghan, T.V.; Pinzon, J.E.; Tucker, C.J.; Zhu, Z.; Bi, J.; Ciais, P.; Tømmervik, H.; et al. Temperature and Vegetation Seasonality Diminishment over Northern Lands. Nat. Clim. Change 2013, 3, 581–586. [Google Scholar] [CrossRef]
  61. Liu, W.G.; Ren, J.W.; Qin, X.; Liu, J.S.; Liu, Q.; Cui, X.Q.; Wang, Y.T. Hydrological Characteristics of the Rongbuk Glacier Catchment in Mt. Qomolangma Region in the Central Himalayas, China. J. Mt. Sci. 2010, 7, 146–156. [Google Scholar] [CrossRef]
  62. Teng, M.J.; Zeng, L.X.; Hu, W.J.; Wang, P.C.; Lin, H.Z.; Xiao, W.F. The Impacts of Climate Changes and Human Activities on Net Primary Productivity Vary Across An Ecotone Zone in Northwest China. Sci. Total Environ. 2020, 714, 136691. [Google Scholar] [CrossRef] [PubMed]
  63. Qin, X.; Liu, W.B.; Mao, R.C.; Song, J.X.; Chen, Y.N.; Ma, C.; Li, M.Y. Quantitative Assessment of Driving Factors Affecting Human Appropriation of Net primary Production (HANPP) in the Qilian Mountains, China. Ecol. Indic. 2021, 121, 106997. [Google Scholar] [CrossRef]
  64. Sun, C.; Xu, X.D.; Wang, P.J.; Yang, D.; Zhang, S.J.; Wang, C.Z.; Cai, W.Y. The Warming and Wetting Ecological Environment Changes over the Qinghai-Tibetan Plateau and the Driving Effect of the Asian Summer Monsoon. J. Trop. Meteorol. 2022, 28, 95–108. [Google Scholar]
  65. Ge, G.; Shi, Z.J.; Yang, X.H.; Hao, Y.G.; Guo, H.; Kossi, F.; Xin, Z.M.; Wei, W.; Zhang, Z.Y.; Zhang, X.; et al. Analysis of Precipitation Extremes in the Qinghai-Tibetan Plateau, China: Spatio-Temporal Characteristics and Topography Effects. Atmosphere 2017, 8, 127. [Google Scholar] [CrossRef]
  66. Ma, Z.Q.; Xu, Y.P.; Peng, J.; Chen, Q.X.; Wan, D.; He, K.; Shi, Z.; Li, H.Y. Spatial and Temporal Precipitation Patterns Characterized by TRMM TMPA over the Qinghai-Tibetan Plateau and Surroundings. Int. J. Remote Sens. 2018, 39, 3891–3907. [Google Scholar] [CrossRef]
  67. Qu, S.; Wang, L.C.; Lin, A.W.; Yu, D.Q.; Yuan, M.X.; Li, C.A. Distinguishing the Impacts of Climate Change and Anthropogenic Factors on Vegetation Dynamics in the Yangtze River Basin, China. Ecol. Indic. 2020, 108, 105724. [Google Scholar] [CrossRef]
  68. Qi, X.Z.; Jia, J.H.; Liu, H.Y.; Lin, Z.S. Relative Importance of Climate Change and Human Activities for Vegetation Changes on China’s Silk Road Economic Belt over Multiple Timescales. Catena 2019, 180, 224–237. [Google Scholar] [CrossRef]
  69. Yang, H.F.; Yao, L.; Wang, Y.B.; Li, J.L. Relative Contribution of Climate Change and Human Activities to Vegetation Degradation and Restoration in North Xinjiang, China. Rangel. J. 2017, 39, 289. [Google Scholar] [CrossRef]
  70. Bi, X.; Li, B.; Zhang, L.X.; Nan, B.; Zhang, X.S.; Yang, Z.H. Response of Grassland Productivity to Climate Change and Anthropogenic Activities in Arid Regions of Central Asia. PeerJ 2020, 8, e9797. [Google Scholar] [CrossRef]
  71. Guo, B.; Zang, W.Q.; Yang, F.; Han, B.M.; Chen, S.T.; Liu, Y.; Yang, X.; He, T.L.; Chen, X.; Liu, C.T.; et al. Spatial and Temporal Change Patterns of Net Primary Productivity and Its Response to Climate Change in the Qinghai-Tibet Plateau of China from 2000 to 2015. J. Arid Land 2019, 12, 1–17. [Google Scholar] [CrossRef]
  72. Wei, Y.Q.; Lu, H.Y.; Wang, J.N.; Wang, X.F.; Sun, J. Dual Influence of Climate Change and Anthropogenic Activities on the Spatiotemporal Vegetation Dynamics Over the Qinghai-Tibetan Plateau From 1981 to 2015. Easth’s Future 2022, 10, e2021EF002566. [Google Scholar] [CrossRef]
  73. Zhang, F.Y.; Zhang, Z.X.; Kong, R.; Chang, J.; Tian, J.X.; Zhu, B.; Jiang, S.S.; Chen, X.; Xu, C.Y. Changes in Forest Net Primary Productivity in the Yangtze River Basin and Its Relationship with Climate Change and Human Activities. Remote Sens. 2019, 11, 1451. [Google Scholar] [CrossRef] [Green Version]
  74. Liu, Y.Y.; Yang, P.Z.; Zhang, Z.X.; Zhang, W.; Wang, Z.Q.; Zhang, Z.Y.; Ren, H.Y.; Zhou, R.L.; Wen, Z.M.; Hu, T.M. Diverse Responses of Grassland Dynamics to Climatic and Anthropogenic Factors Across the Different Time Scale in China. Ecol. Indic. 2021, 132, 108341. [Google Scholar] [CrossRef]
  75. Huang, Y.; Xin, Z.; Dor-ji, T.; Wang, Y. Tibetan Plateau greening driven by warming-wetting climate change and ecological restoration in the 21st century. Land Degrad. Dev. 2022, 33, 2407–2422. [Google Scholar] [CrossRef]
  76. Lin, H.; Zhao, Y.; Kalhoro, G.M. Ecological Response of the Subsidy and Incentive System for Grassland Conservation in China. Land 2022, 11, 358. [Google Scholar] [CrossRef]
  77. Kim, J.H.; Fourcaud, T.; Jourdan, C.; Maeght, J.-L.; Mao, Z.; Metayer, J.; Meylan, L.; Pierret, A.; Rapidel, B.; Roupsard, O.; et al. Vegetation as A Driver of Temporal Variations in Slope Stability: The Impact of Hydrological Processes. Geophys. Res. Lett. 2017, 44, 4897–4907. [Google Scholar] [CrossRef]
  78. He, M.Z.; Zheng, J.G.; Li, X.R.; Qian, Y.L. Environmental Factors Affecting Vegetation Composition in the Alxa Plateau, China. J. Arid Environ. 2007, 69, 473–489. [Google Scholar] [CrossRef]
  79. Wang, R.J.; Feng, Q.S.; Jin, Z.R.; Liang, T.G. The Restoration Potential of the Grasslands on the Tibetan Plateau. Remote Sens. 2021, 14, 80. [Google Scholar] [CrossRef]
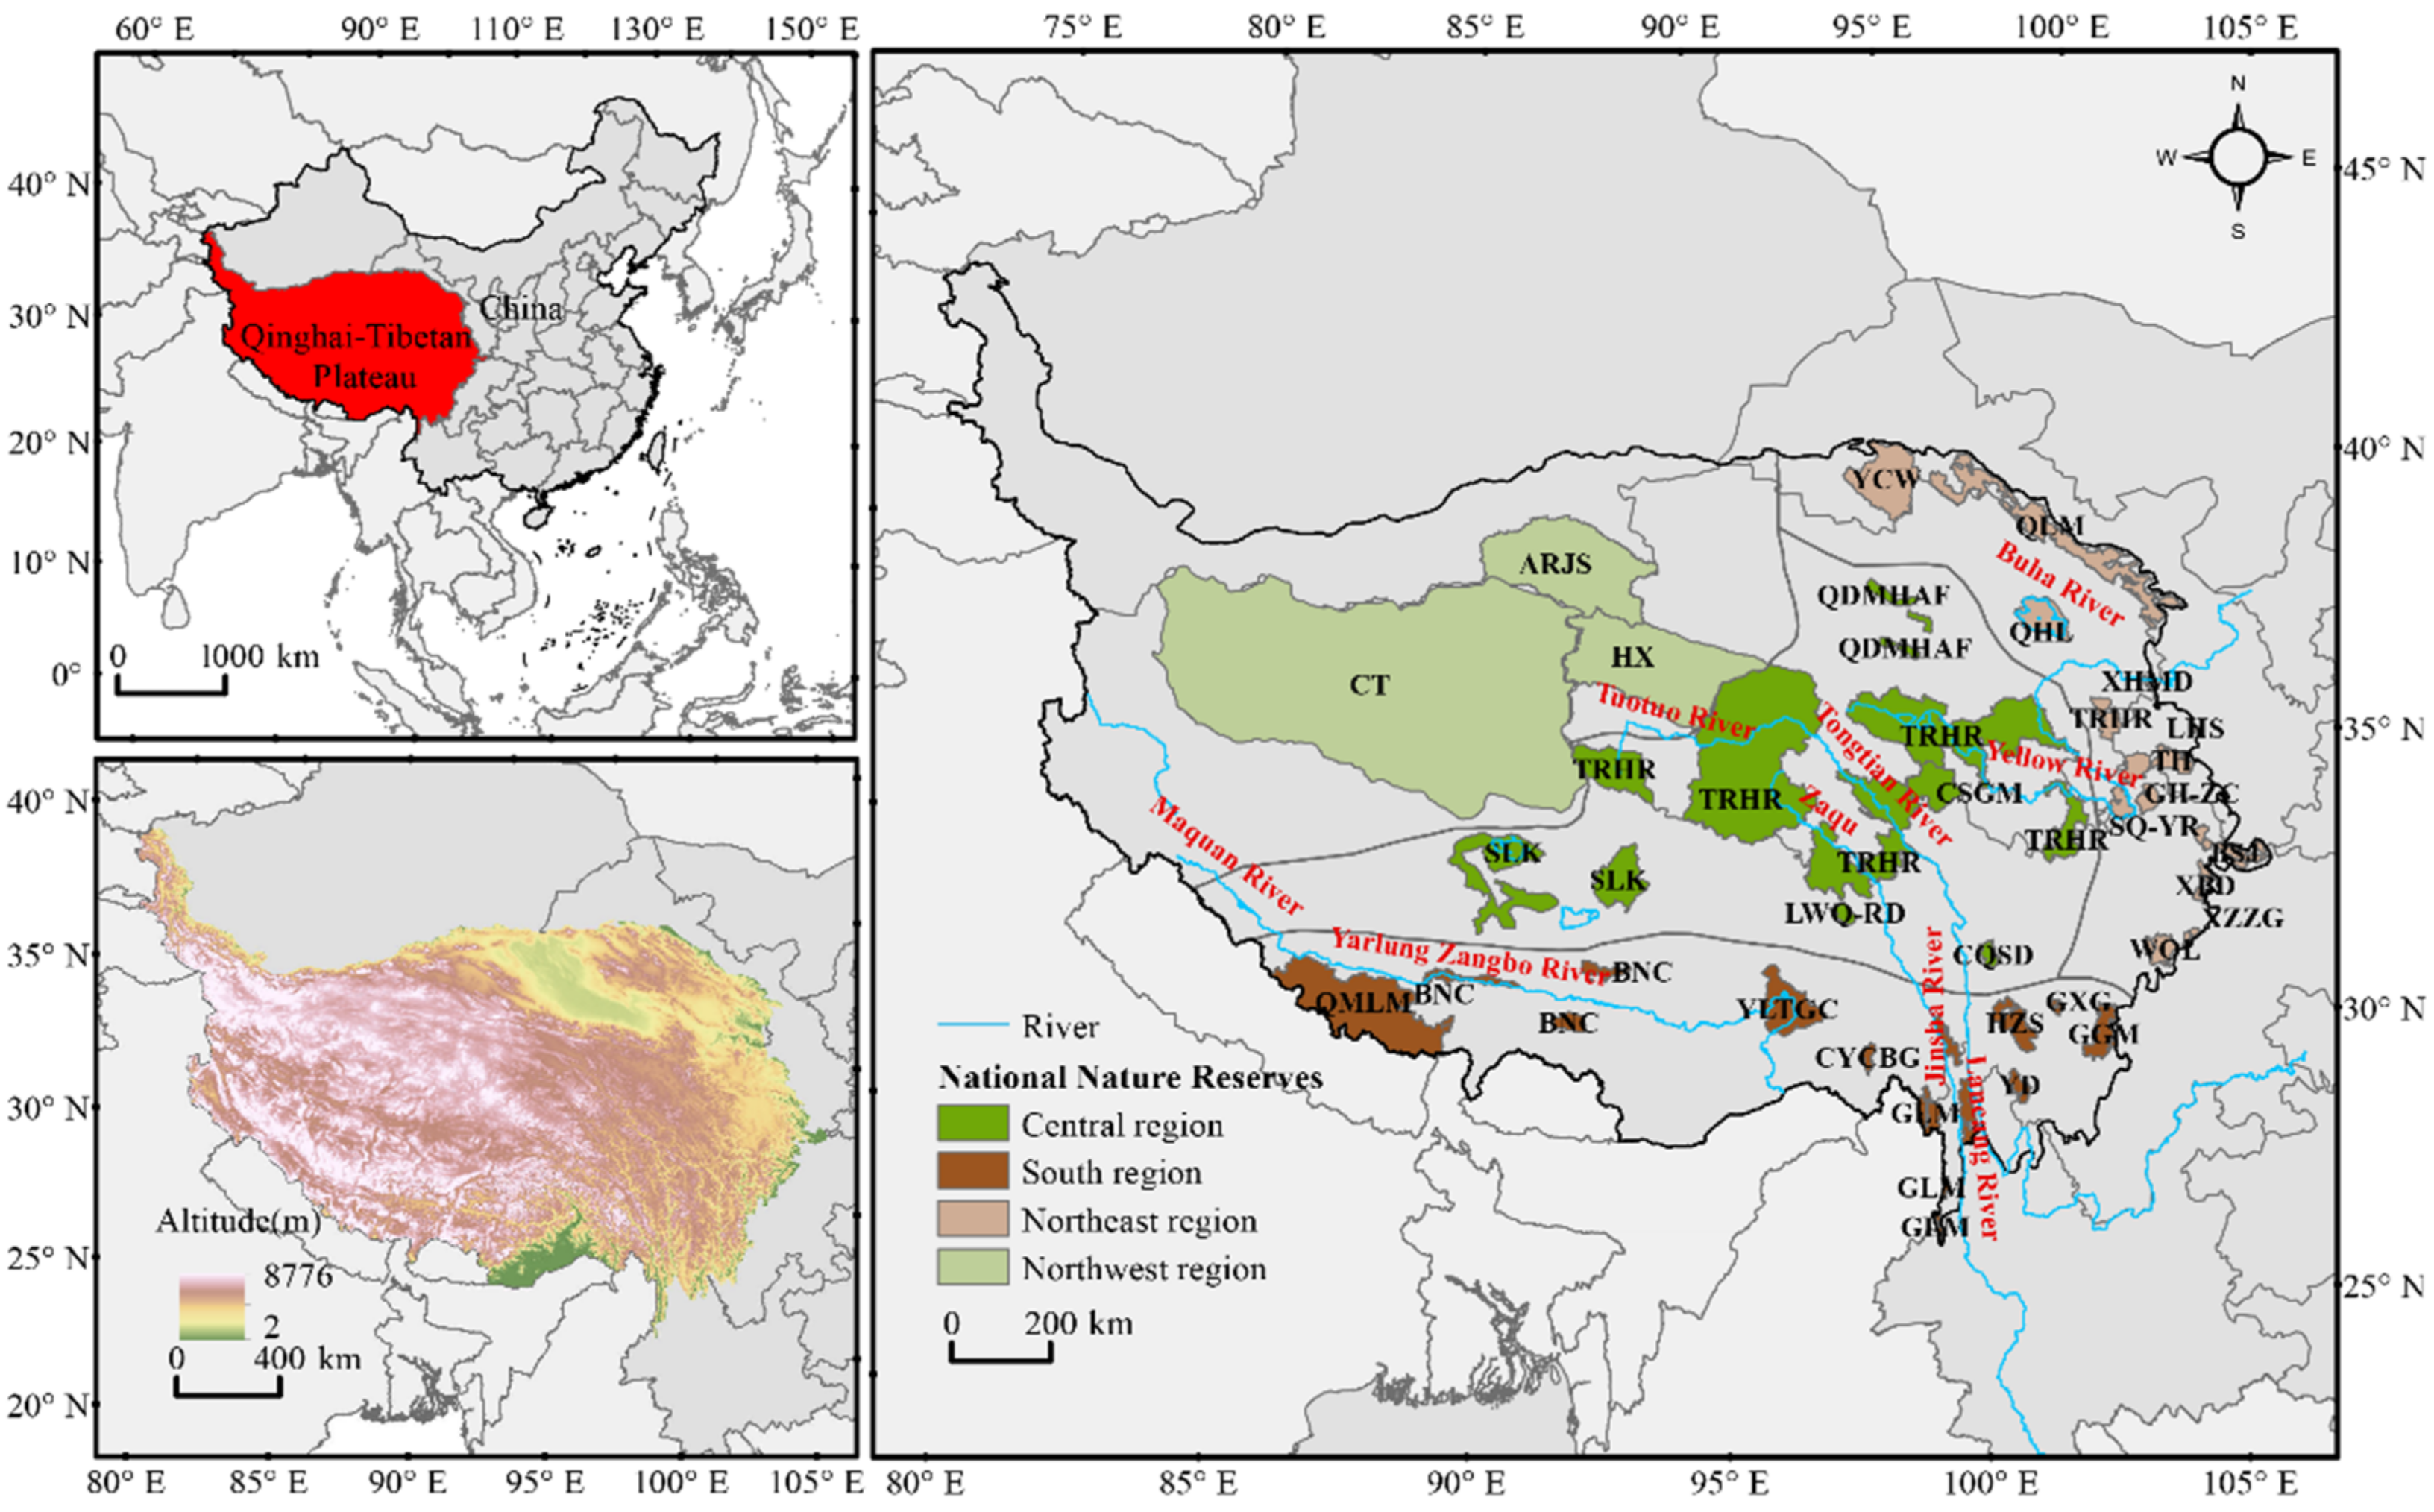
Figure 1. Geographical distribution of NNRs on the QTP (See Table S1 in Supplementary Materials for abbreviations of NNRs).
Remotesensing 14 04626 g001
Figure 2. Spatial patterns of ANPP, HNPP, and PNPP for NNRs on the QTP from 2000 to 2020. Subfigures (ac) show mean values, and subfigures (df) show the corresponding significance levels.
Remotesensing 14 04626 g002
Figure 3. Driving factors and their contributions to vegetation ANPP variation in NNRs on the QTP. NNR abbreviations are provided in Supplementary Table S1.
Remotesensing 14 04626 g003
Figure 4. Spatial distribution of the driving factors of vegetation ANPP changes (a) and their contributions (b) in 42 NNRs on the QTP. Scenario abbreviations are given in Table 1.
Remotesensing 14 04626 g004
Figure 5. Spatial patterns of the multiple correlation coefficient between ANPP and temperature and precipitation (a), and significance levels p (b).
Remotesensing 14 04626 g005
Figure 6. Spatial patterns of partial correlation coefficients between ANPP and temperature (a), ANPP and precipitation (b), and significant levels for temperature (c) and precipitation (d).
Remotesensing 14 04626 g006
Figure 7. Spatial patterns of the Hurst exponent (a), future vegetation trends (b), and coefficients of variation (c) derived from ANPP data (2000–2020). (df) are the absolute (bars) and relative (pie charts) area coverage in (ac).
Remotesensing 14 04626 g007
Table 1. Eight scenarios of effects of climate change and human activities on vegetation NPP.
SANPPScenarioSPNPPSHNPPContributionDriving FactorsAbbreviation
Climate (%)Human (%)
>01>0>01000ClimateCDI
2<0<00100HumanHDI
3>0<0 S PNPP   ×   100 S PNPP + S HNPP S HNPP   ×   100 P s + S HNPP Climate and HumanCHII
4<0>0 ErrorEI
<05<0<01000ClimateCDD
6>0>00100HumanHDD
7<0>0 S PNPP   ×   100 S PNPP + S HNPP S HNPP   ×   100 S PNPP + S HNPP Climate &HumanCHID
8>0<0 ErrorED
Table 2. Summary statistics for the six scenarios of future ANPP development based on Theil-Sen trend slopes and Hurst exponents. The abbreviations are the same as Figure 7b.
ANPP IncreaseStable ANPPANPP Decrease
PDAPDSSDUDNDAND
Area (km2)21,4650.504002.7599,696.75104,760.254093.25116.50
Percentage (%)50.23%0.94%23.33%24.51%0.96%0.03%
Publisher’s Note: MDPI stays neutral with regard to jurisdictional claims in published maps and institutional affiliations.