
Performance Analysis of GPS/BDS Broadcast Ionospheric Models in Standard Point Positioning during 2021 Strong Geomagnetic Storms


Abstract
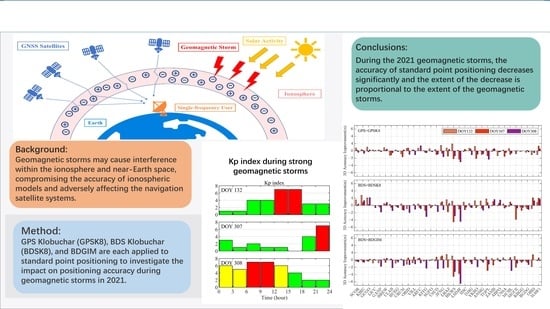
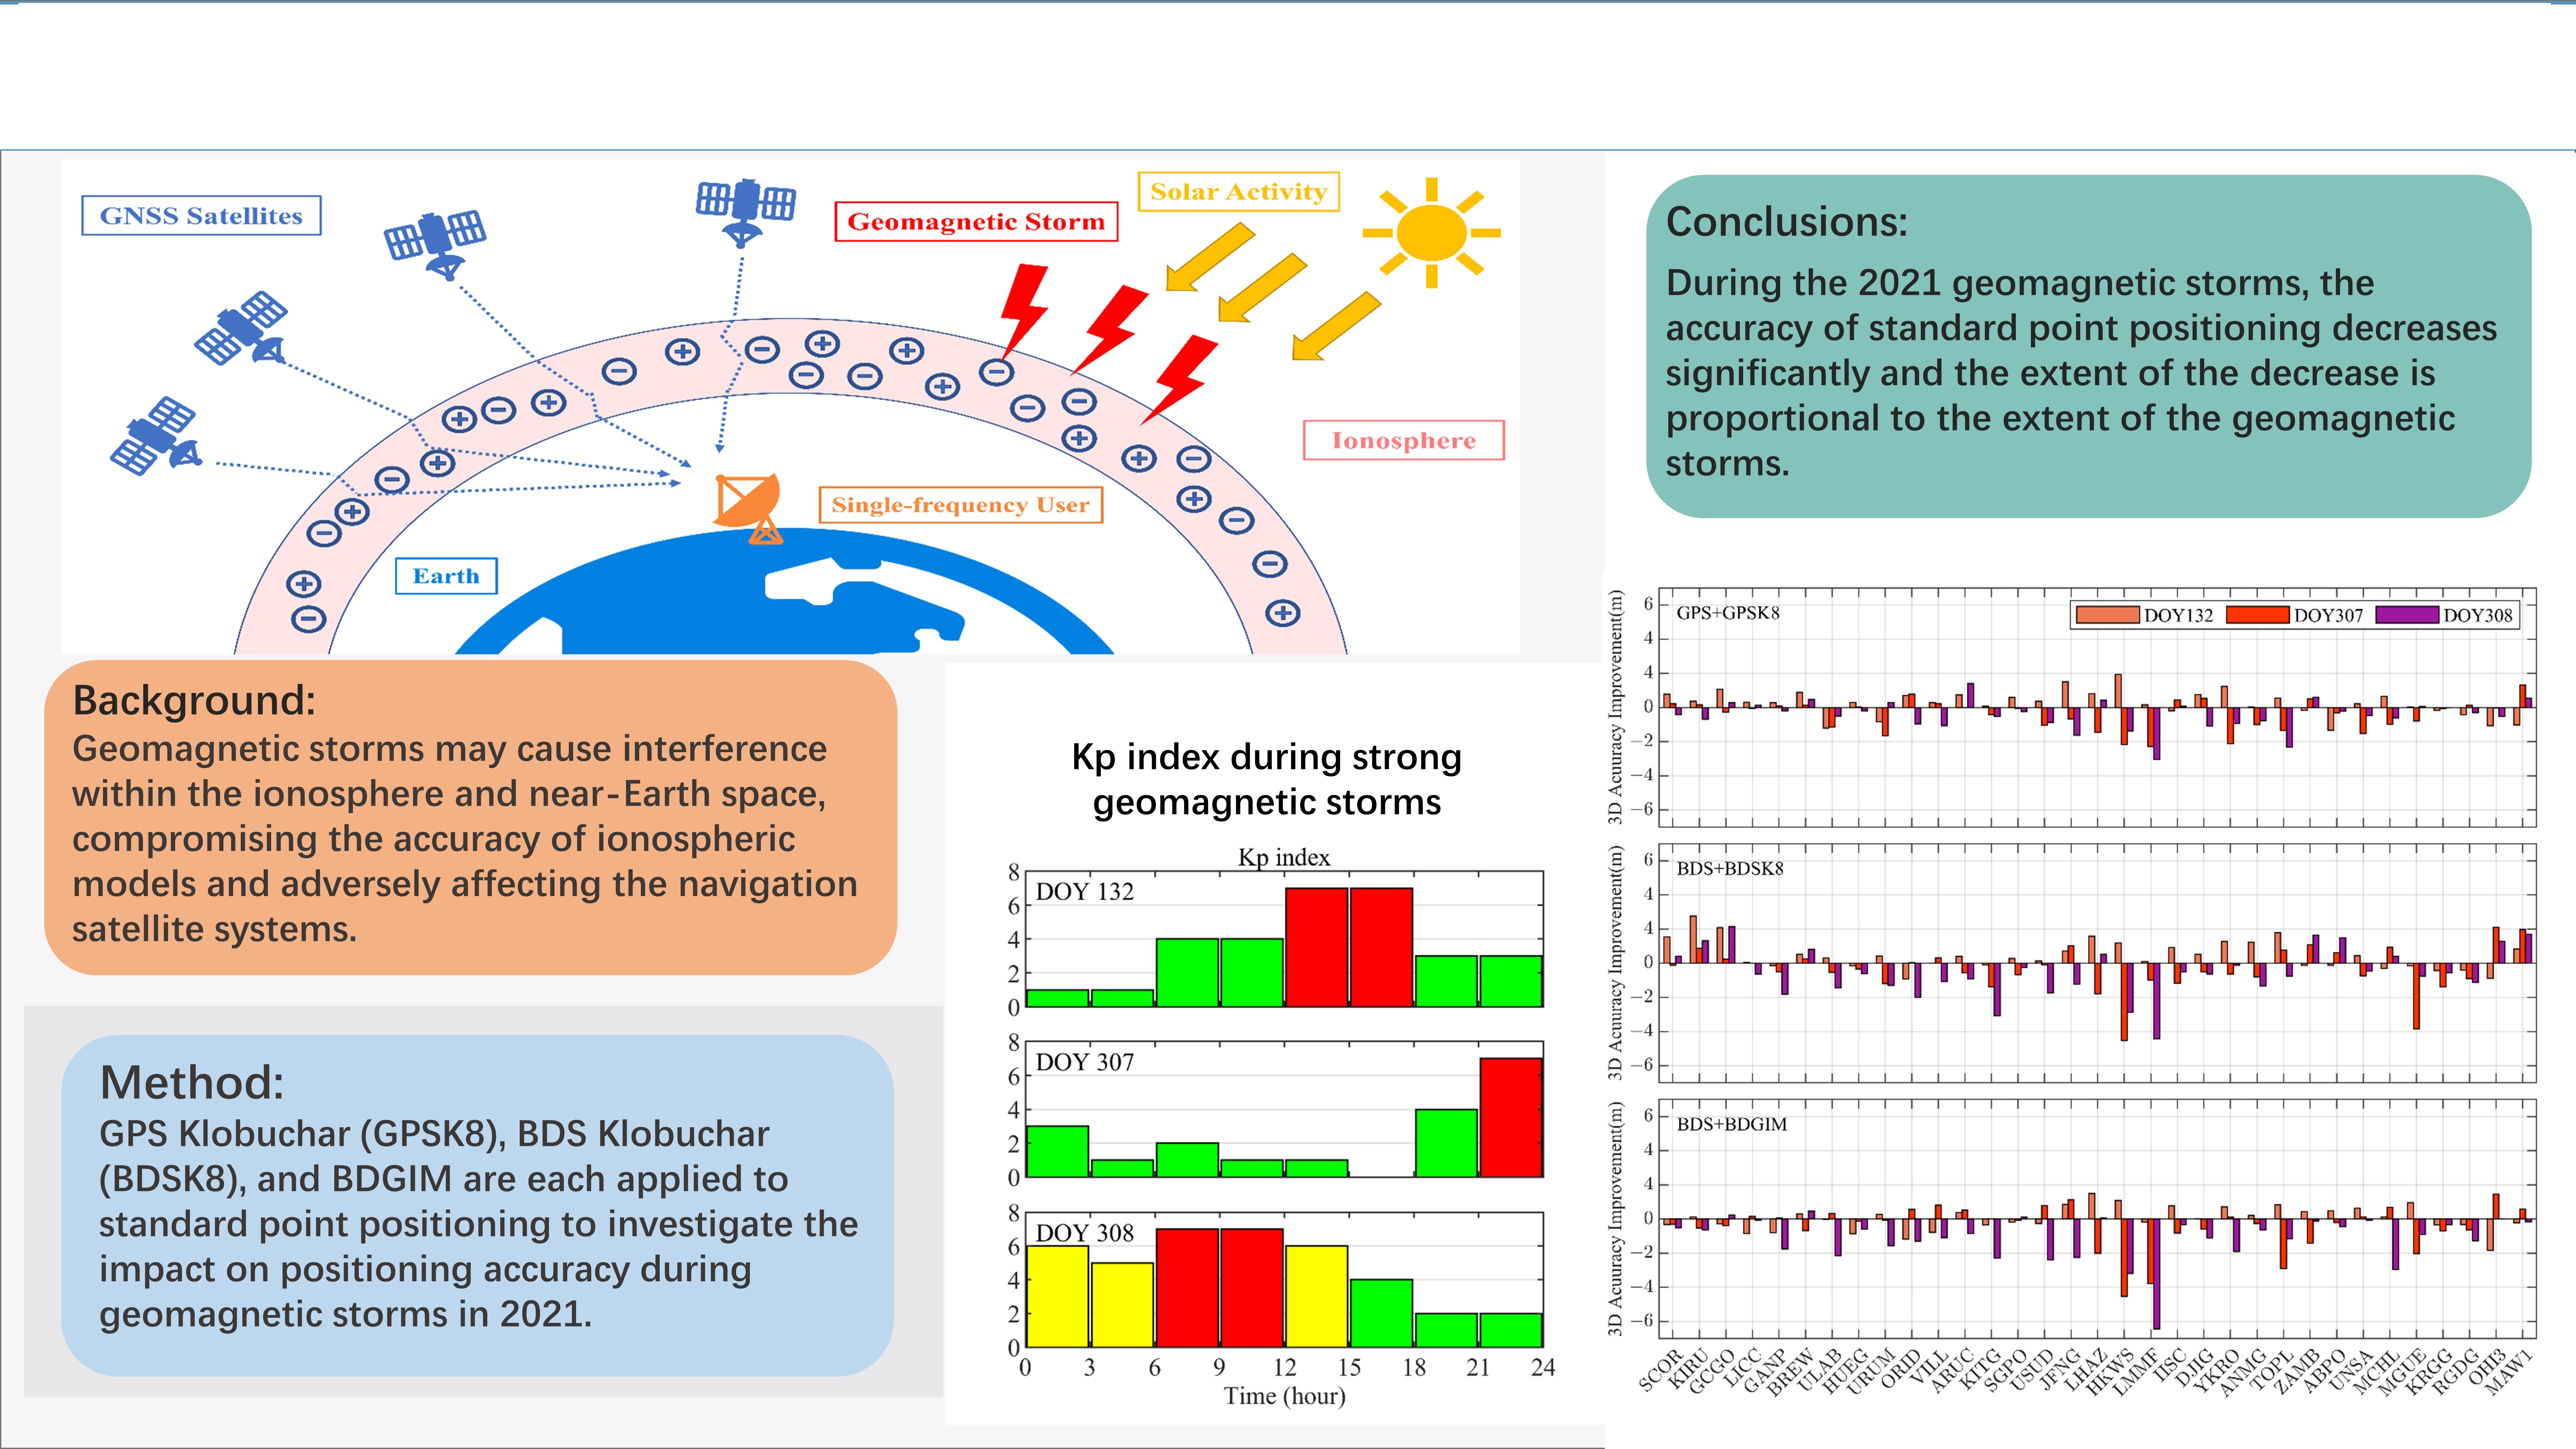
1. Introduction
2. Materials and Methods
2.1. Observation Equation of SPP
2.2. Broadcast Ionosphere Models
2.2.1. GPS Klobuchar Model (GPSK8)
2.2.2. BDS Klobuchar Model (BDSK8)
2.2.3. BeiDou Global Broadcast Ionospheric Delay Correction Model (BDGIM)
2.3. Experiment Process
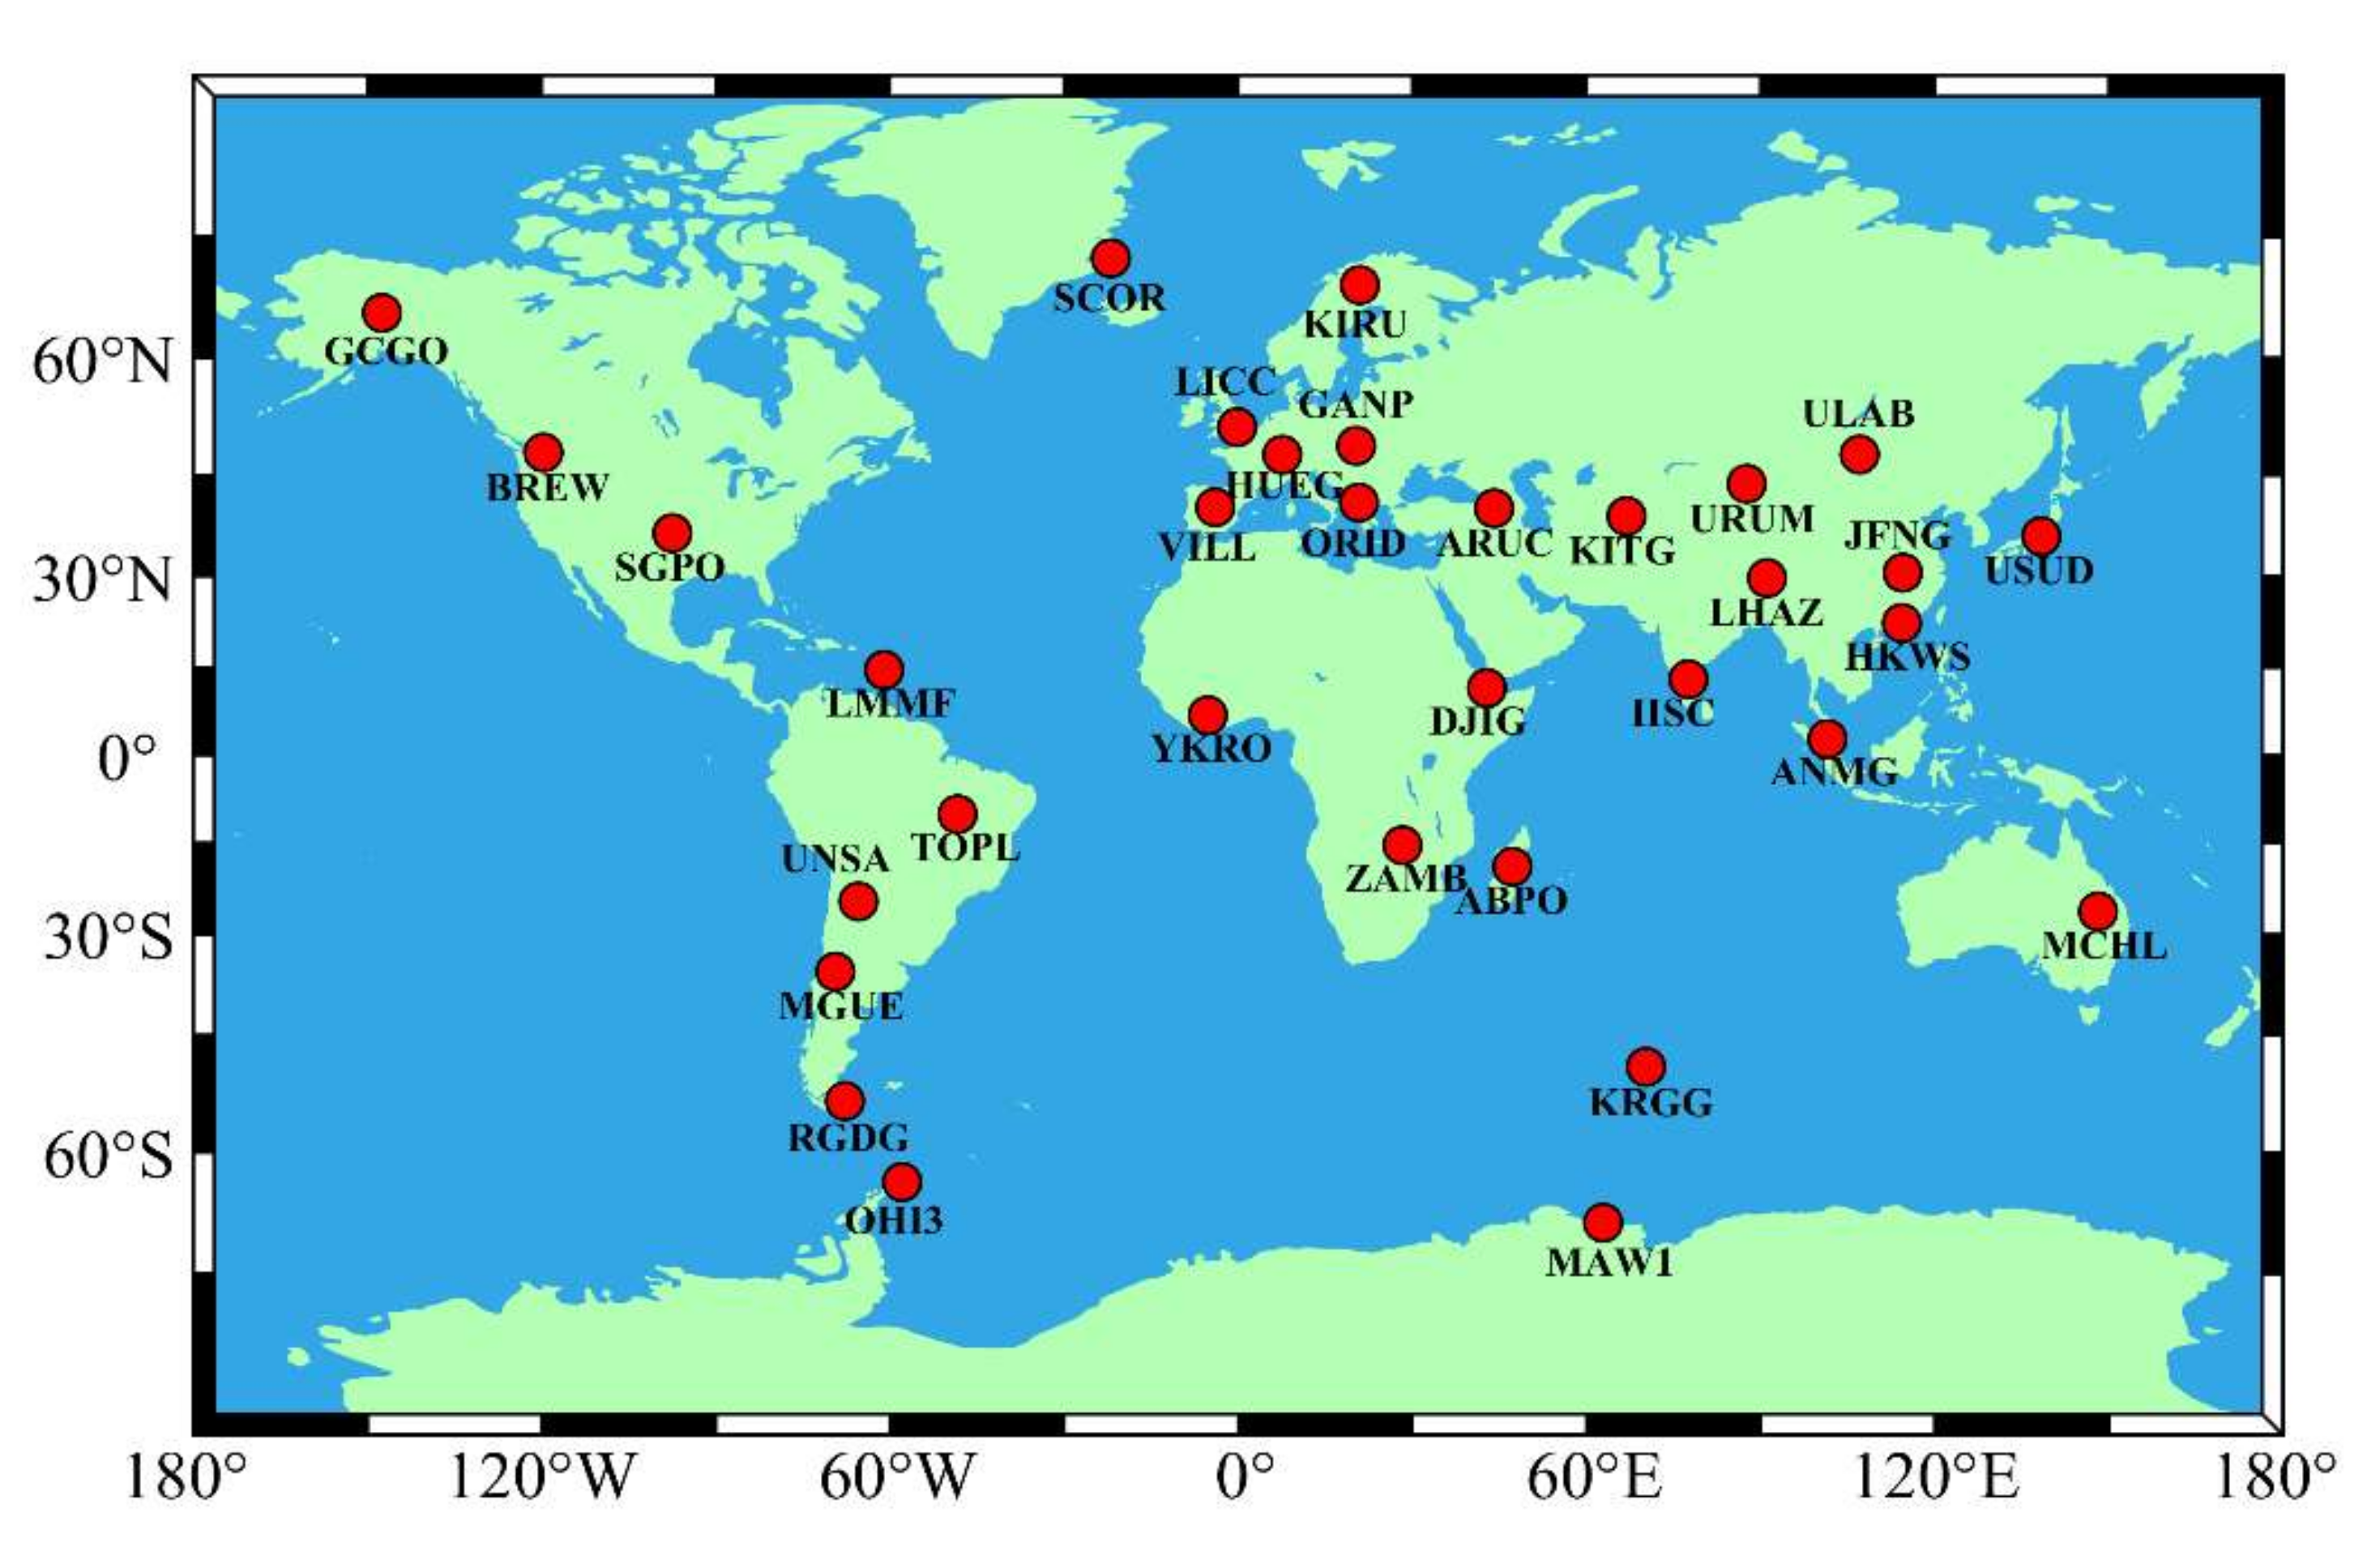
2.3.1. Data Selection
2.3.2. SPP Strategies
3. Results
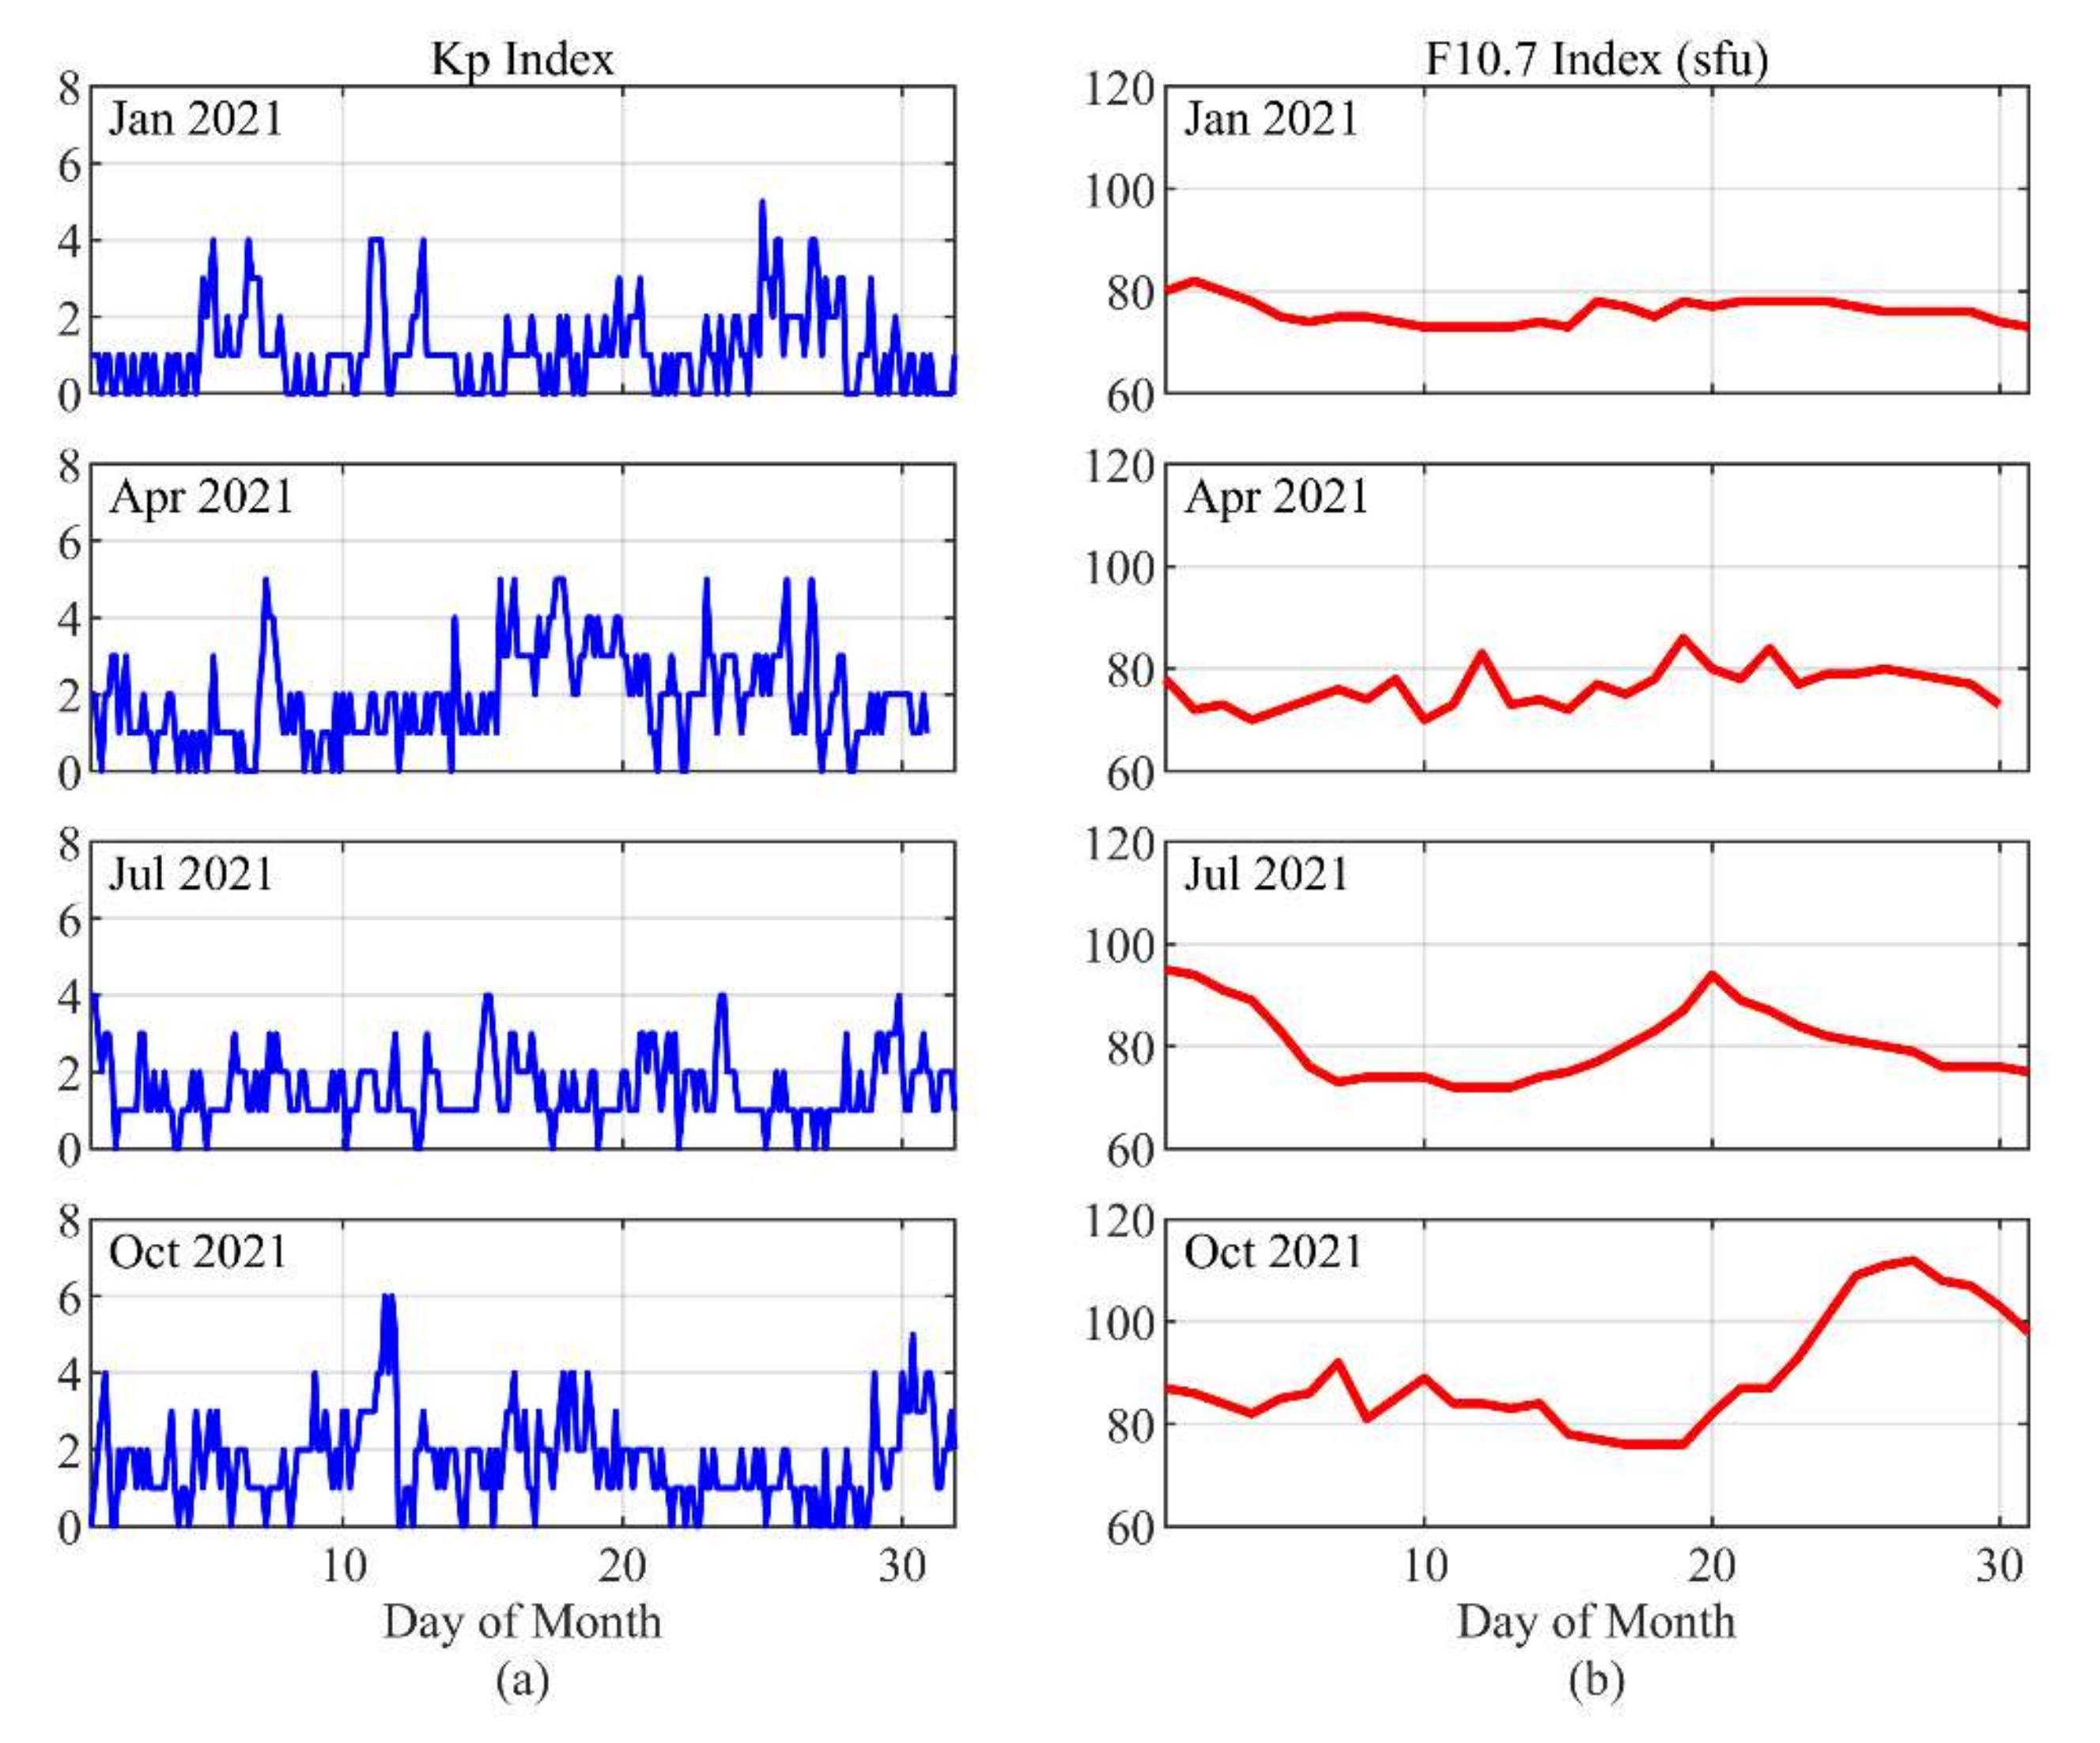
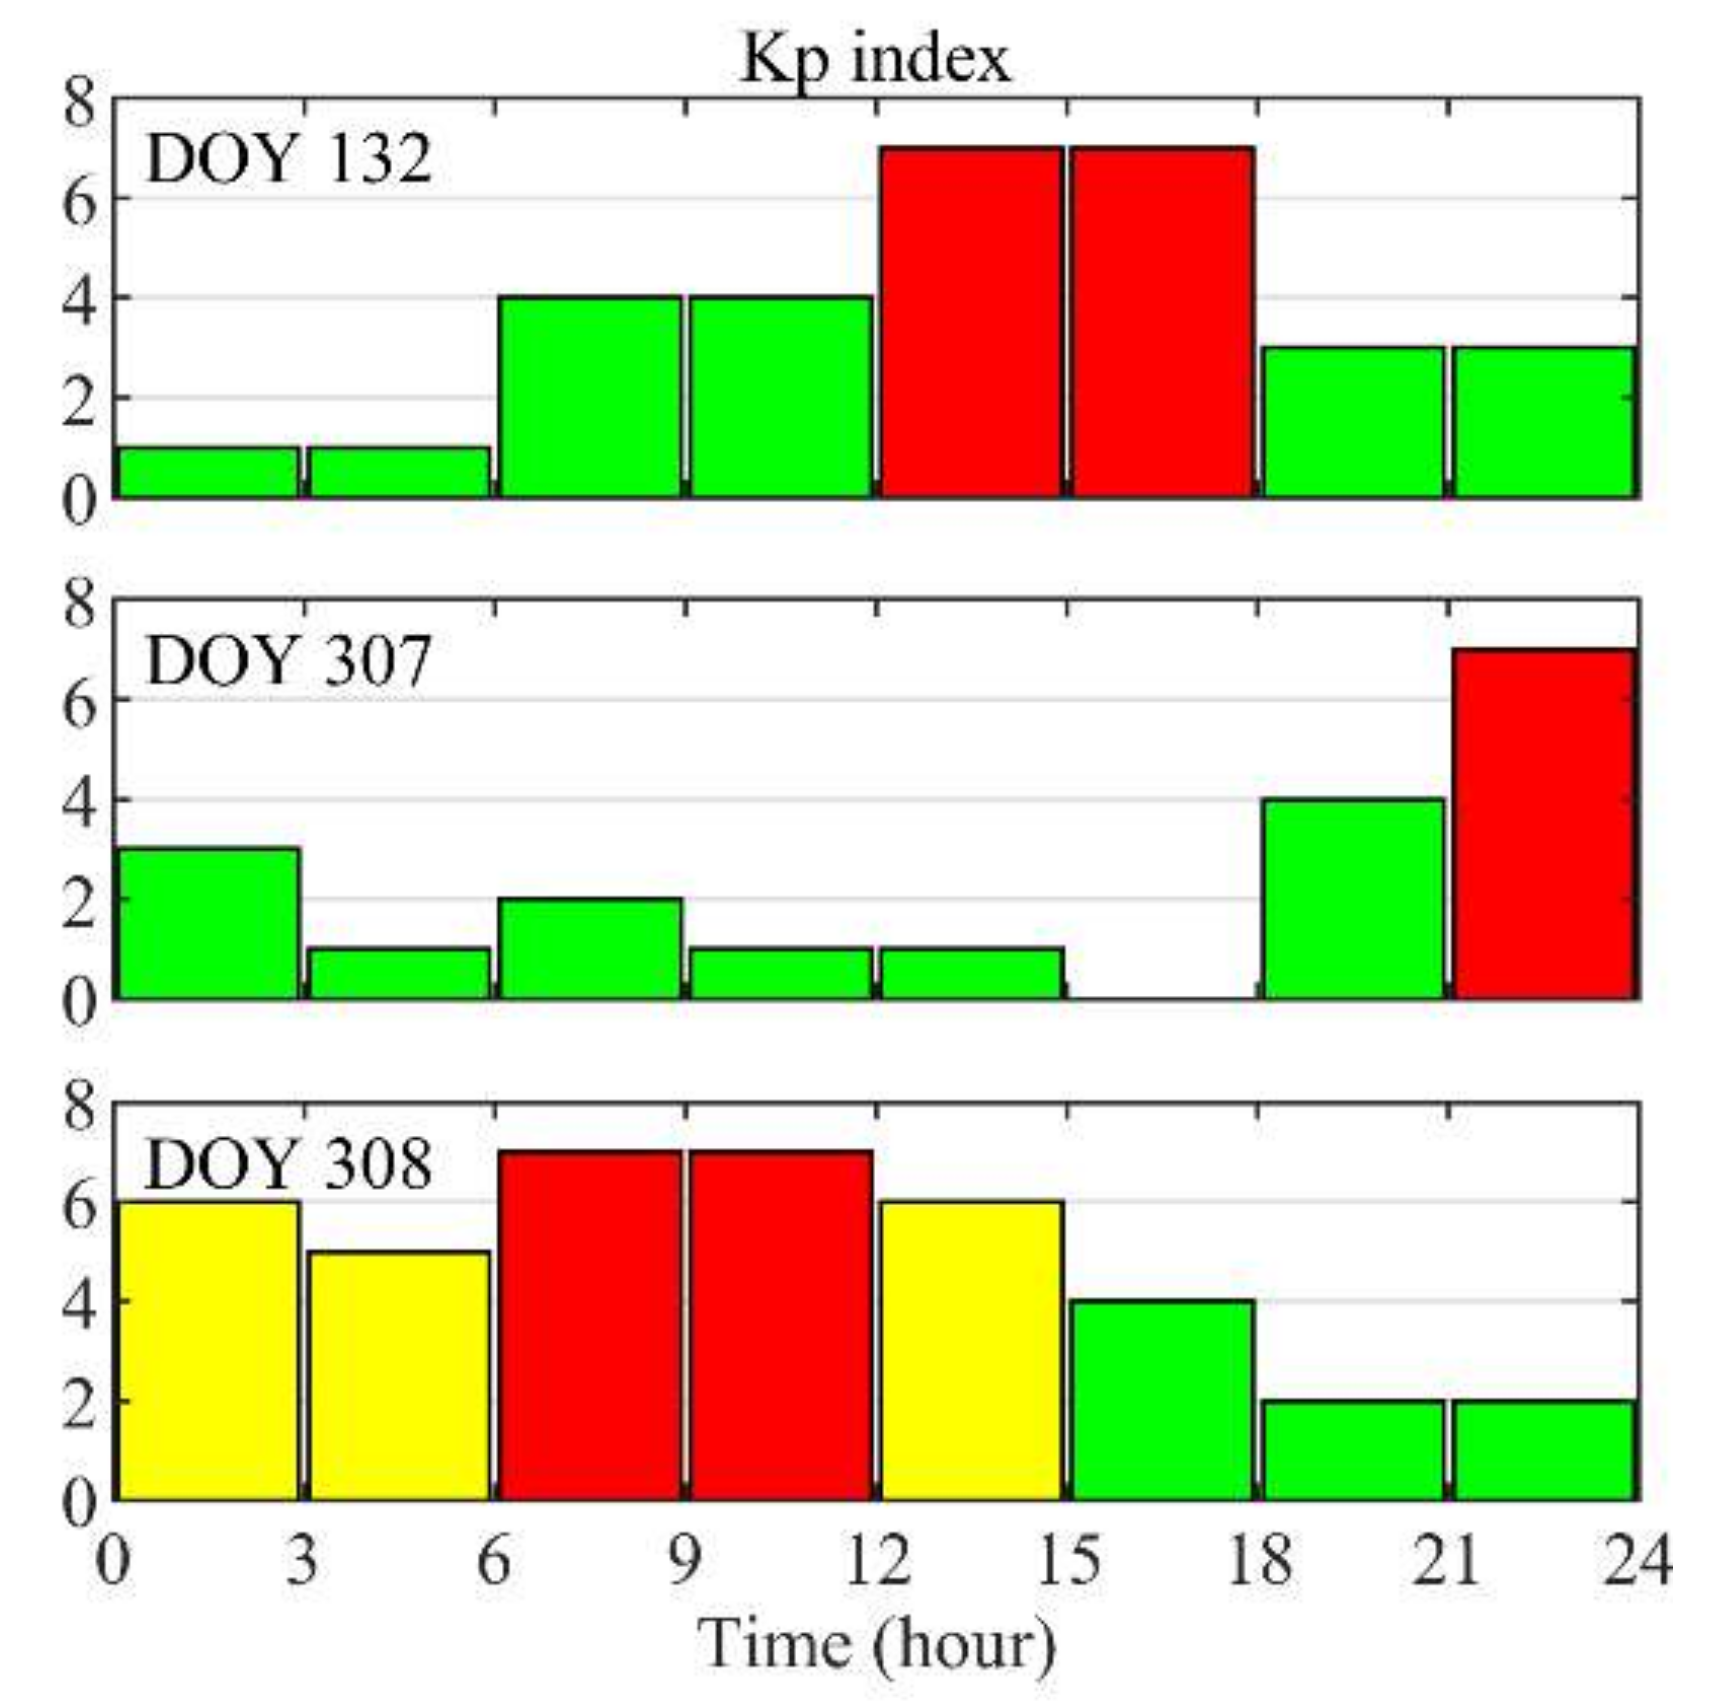
3.1. Solar and Geomagnetic Conditions
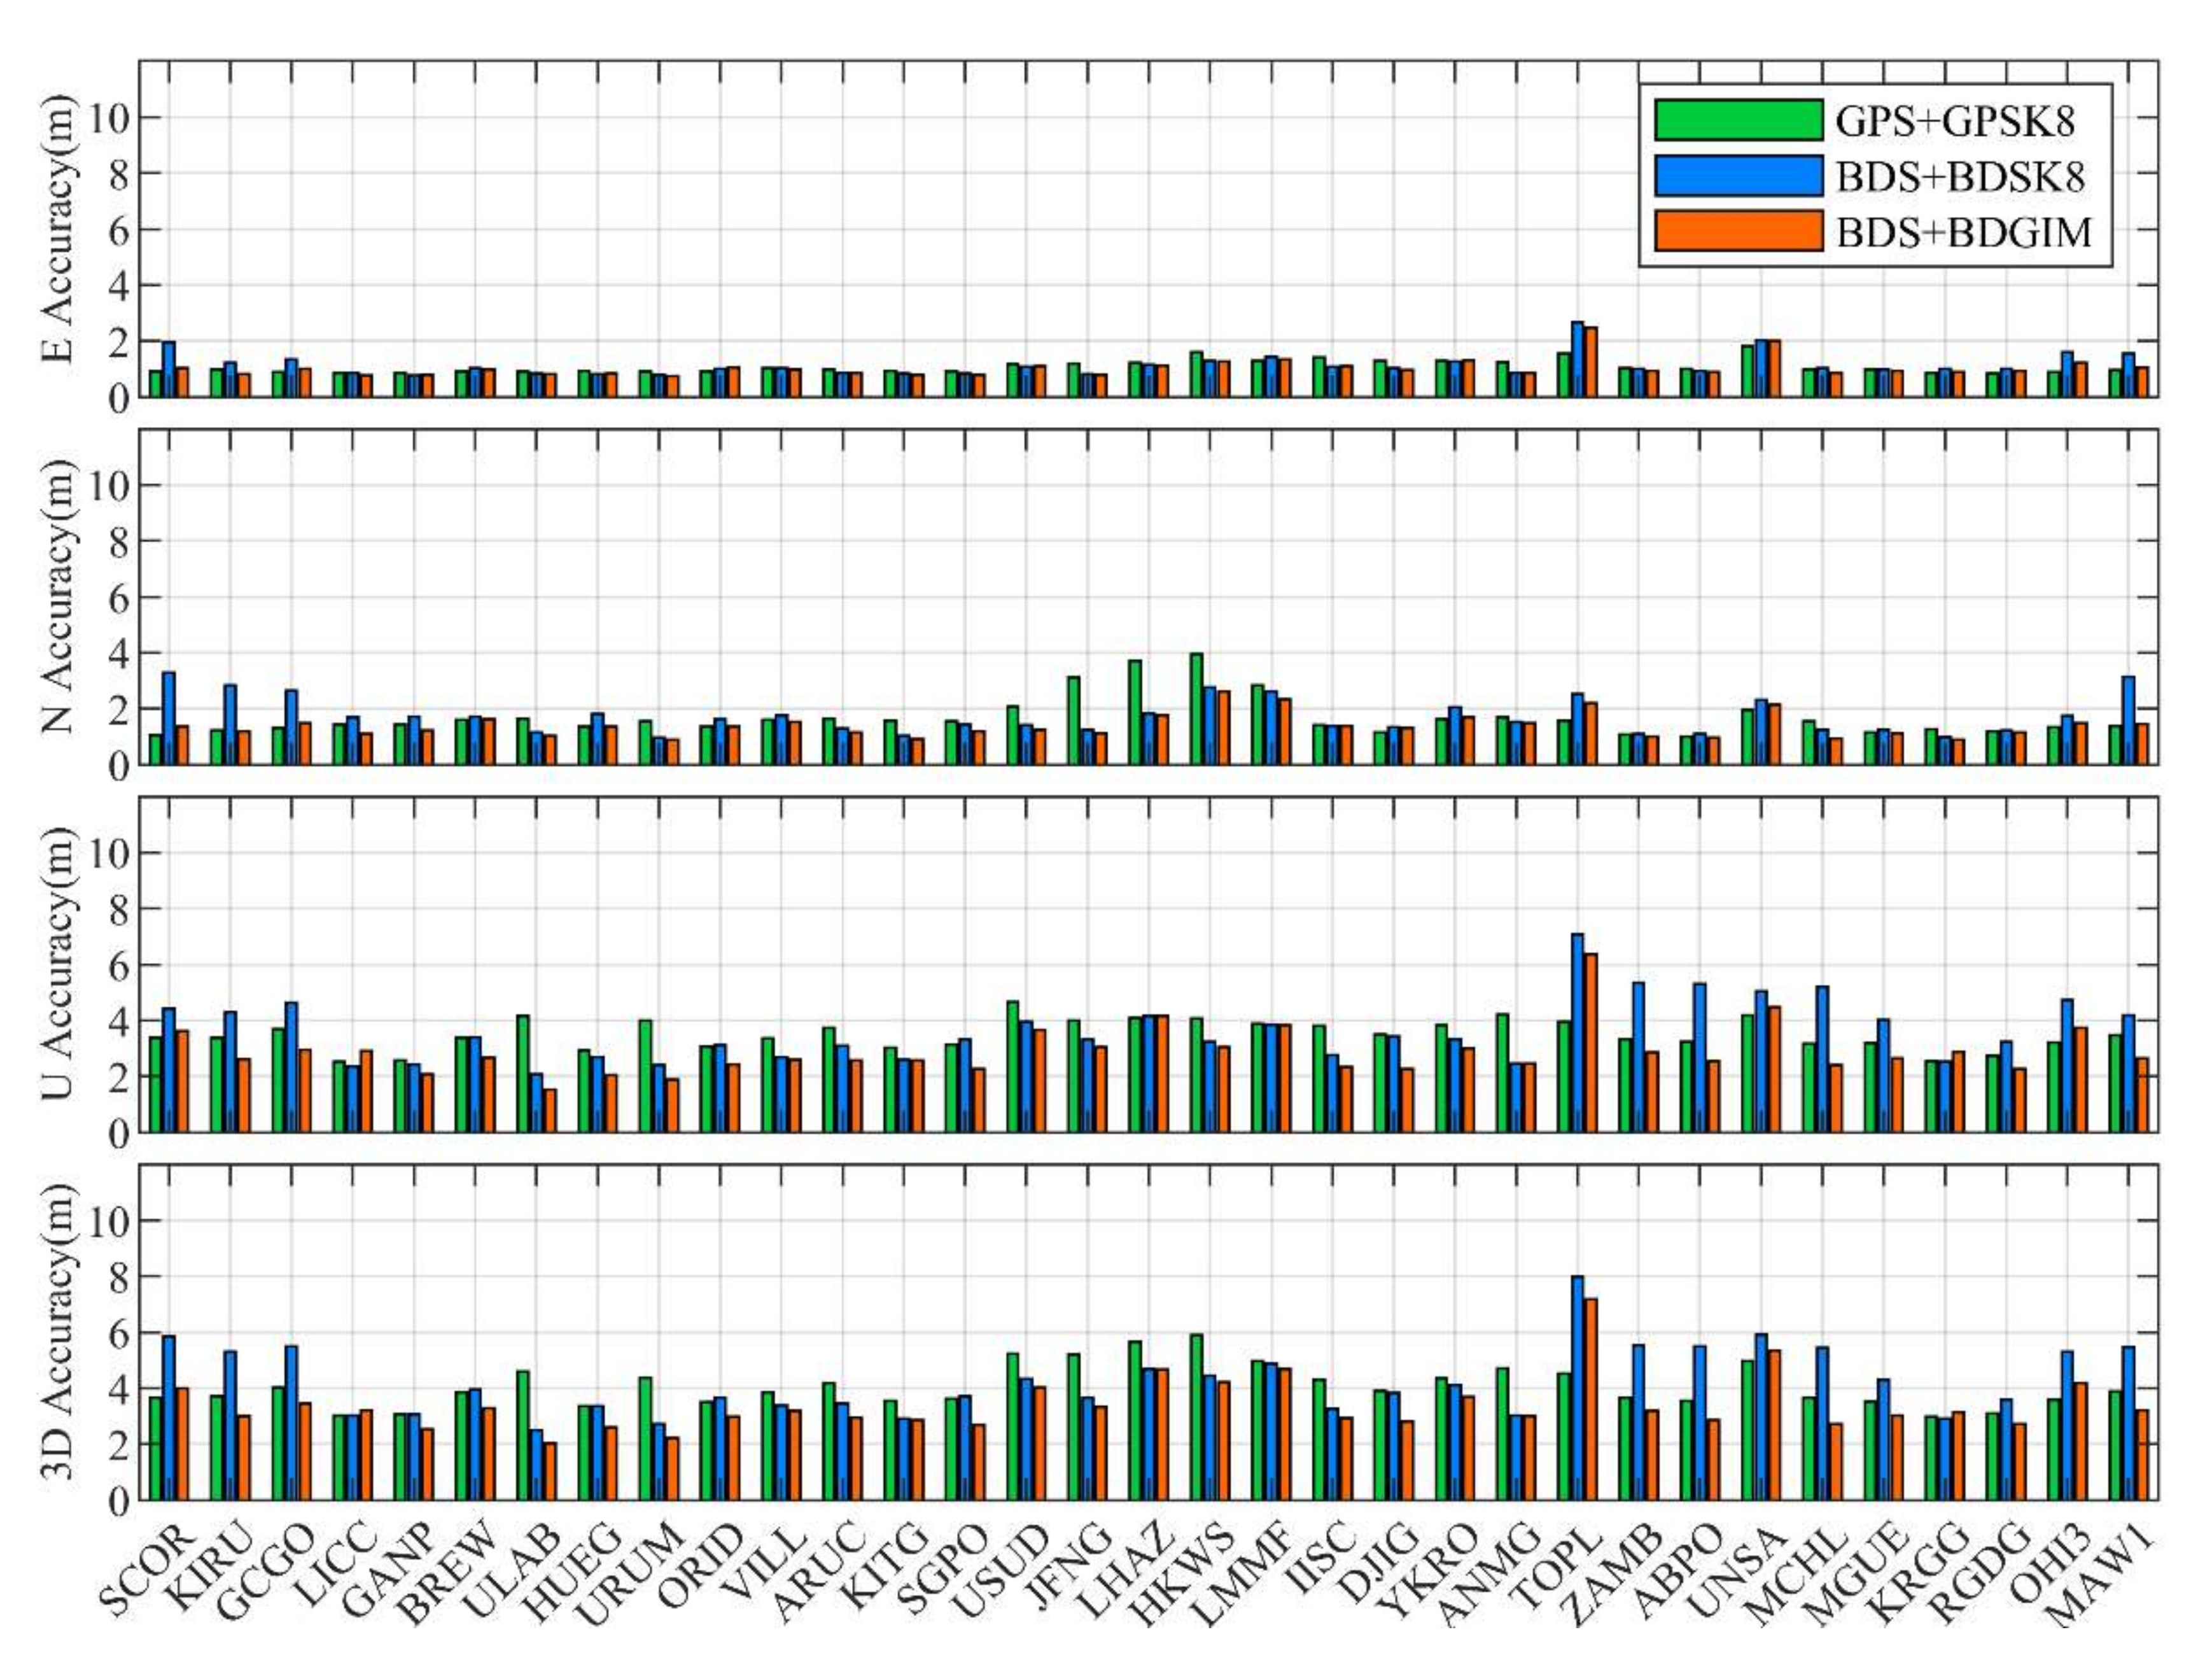
3.2. Global Positioning Accuracies
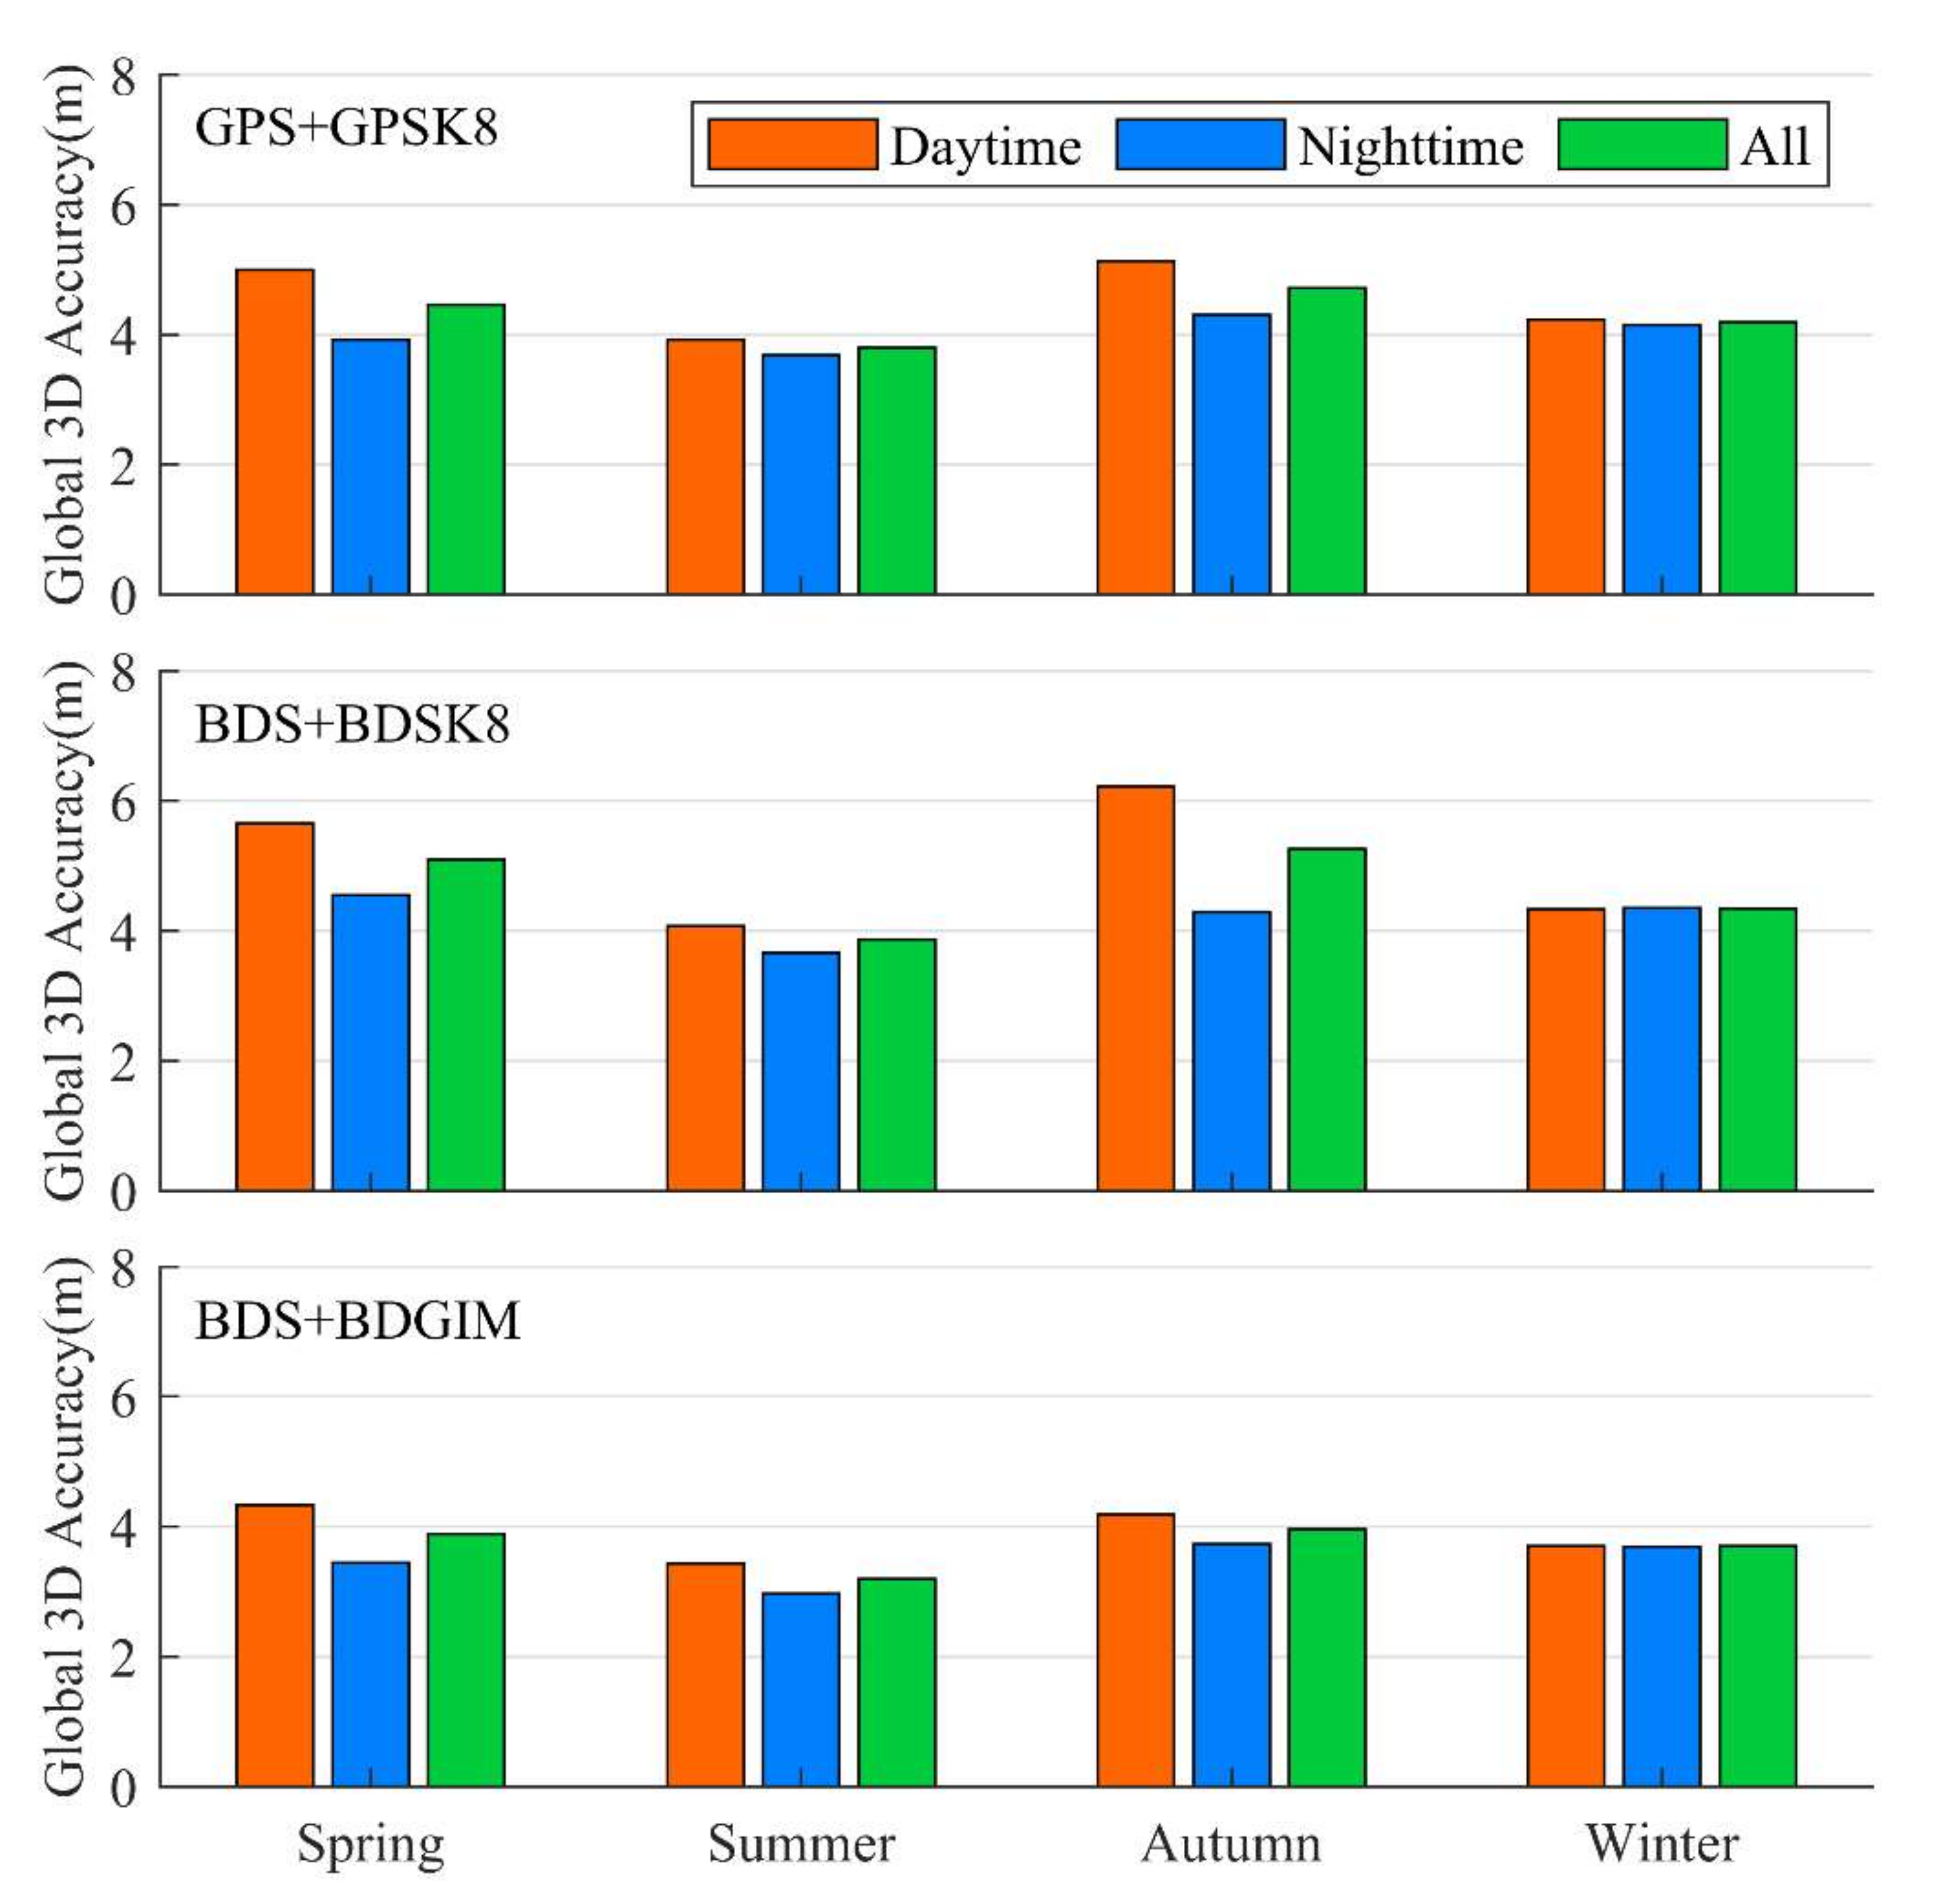
3.3. Positioning Accuracies in Different Seasons and Periods
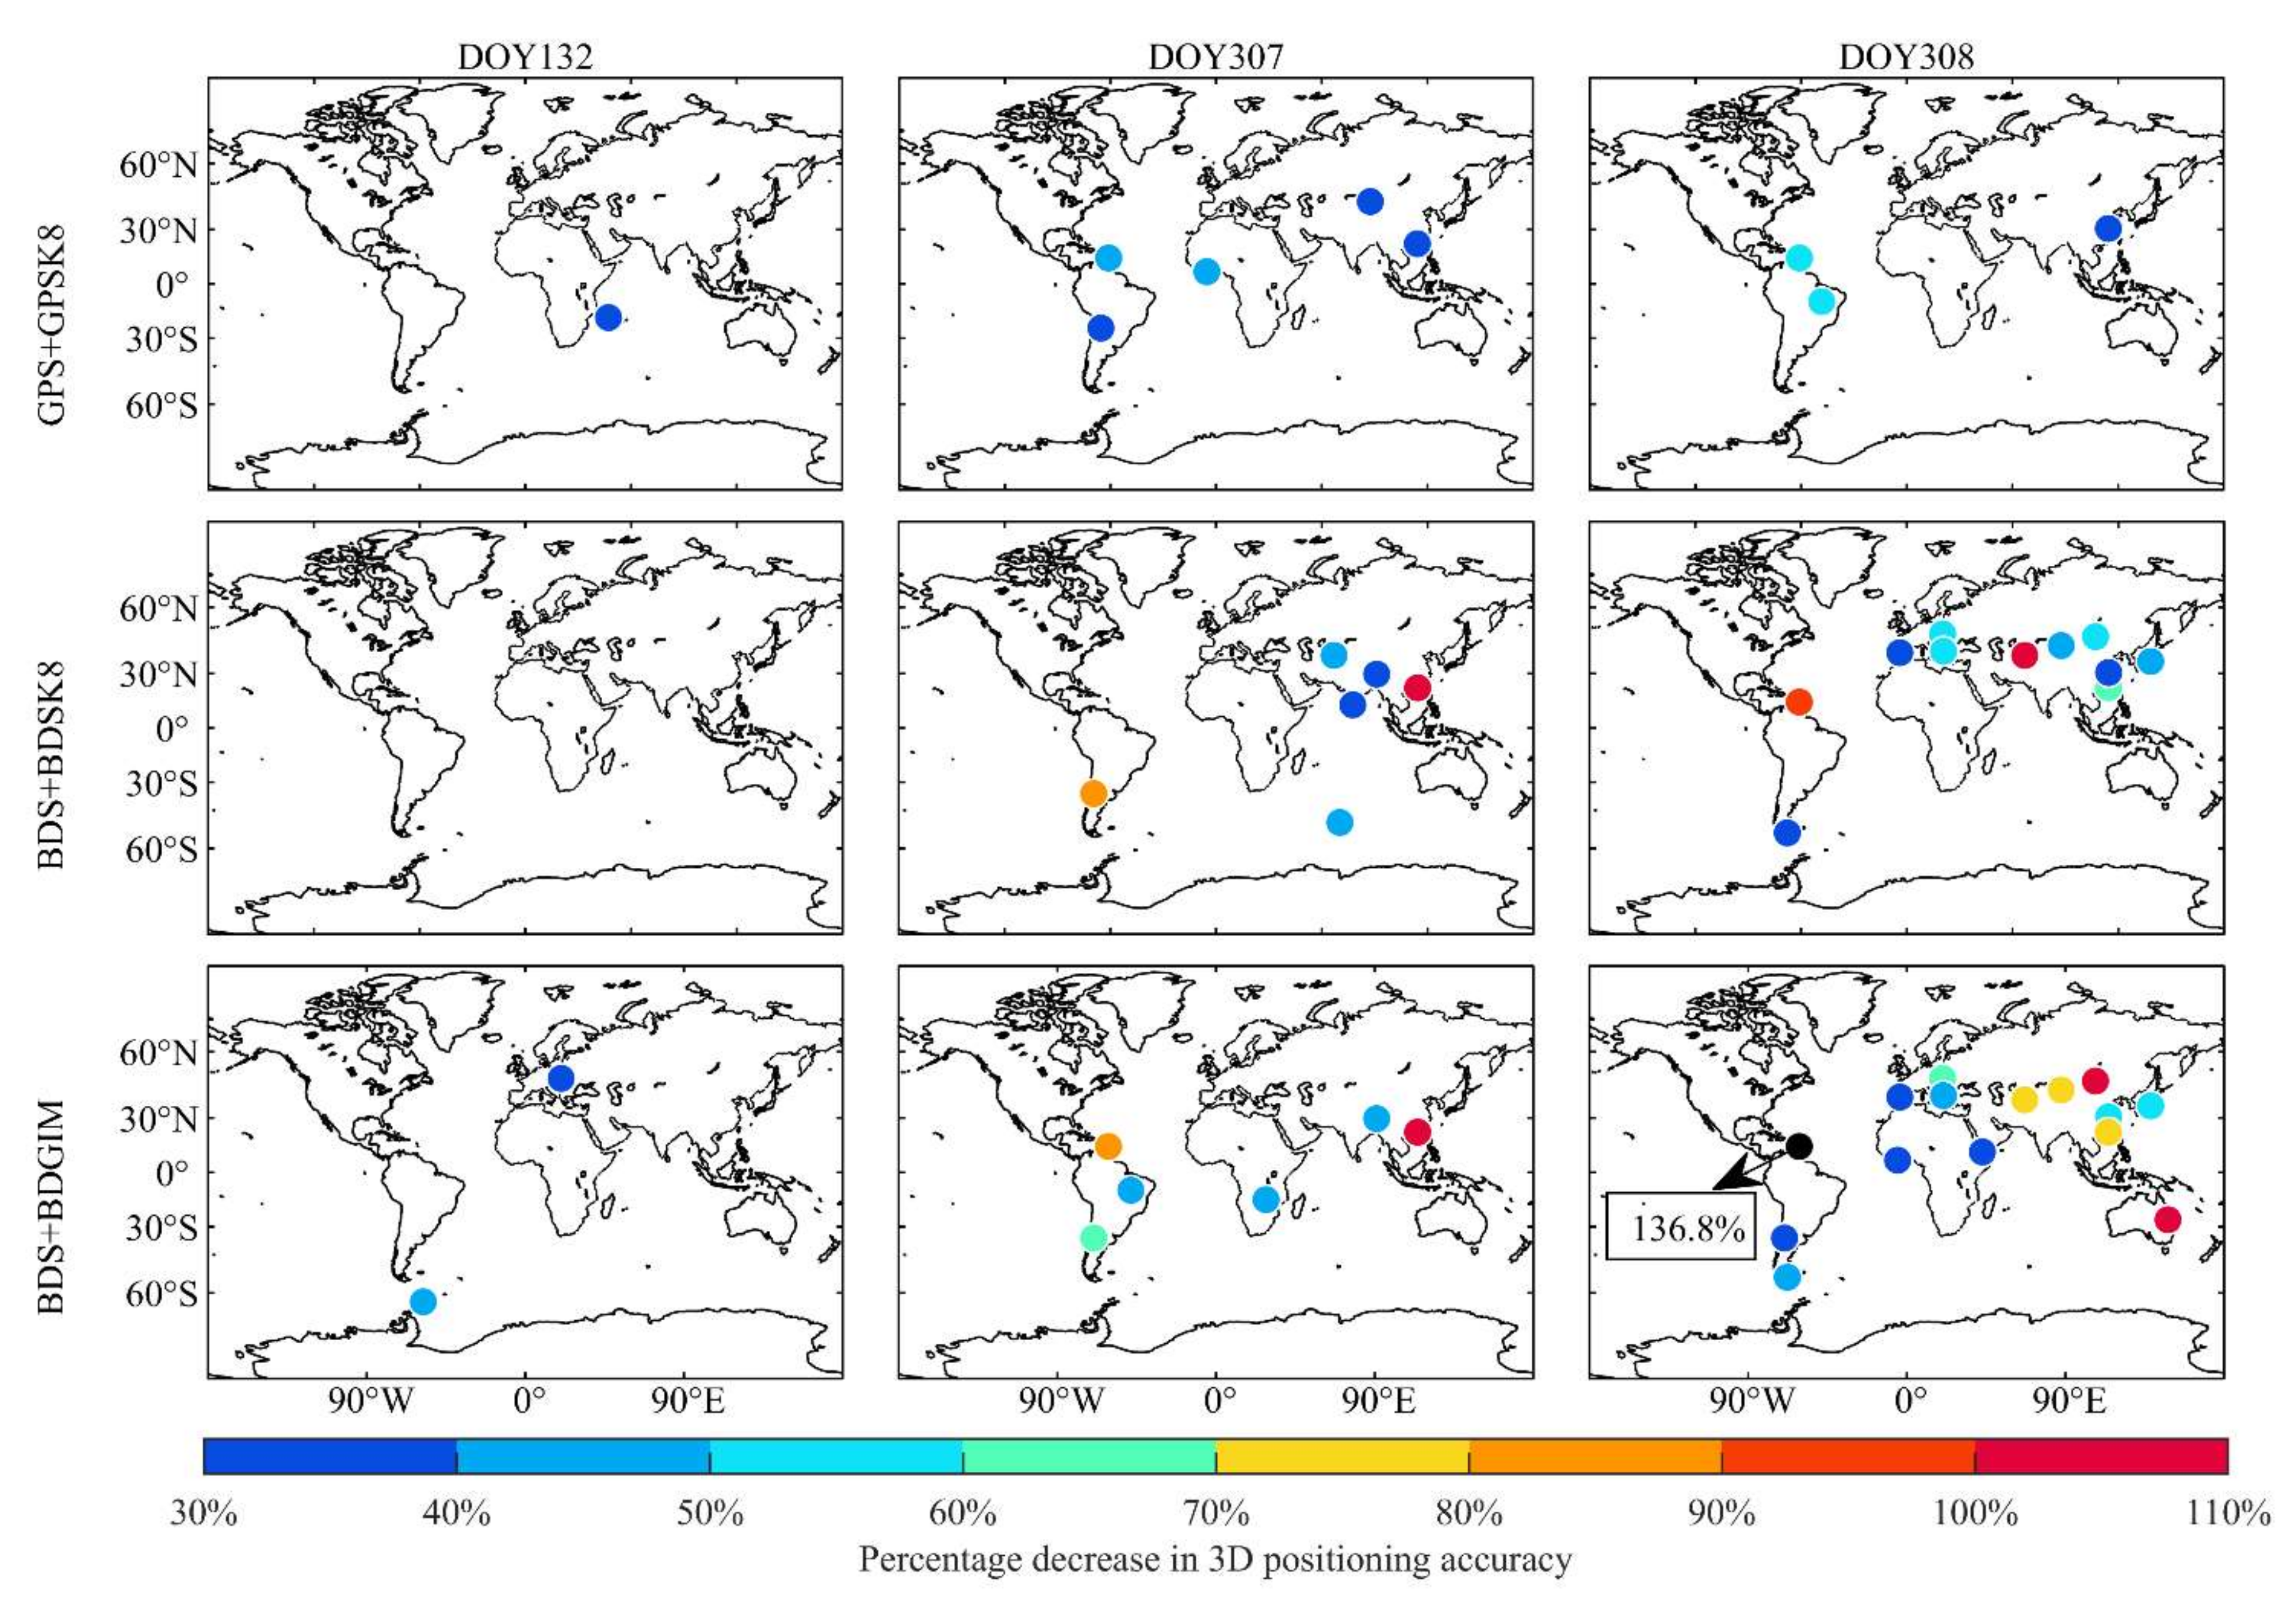
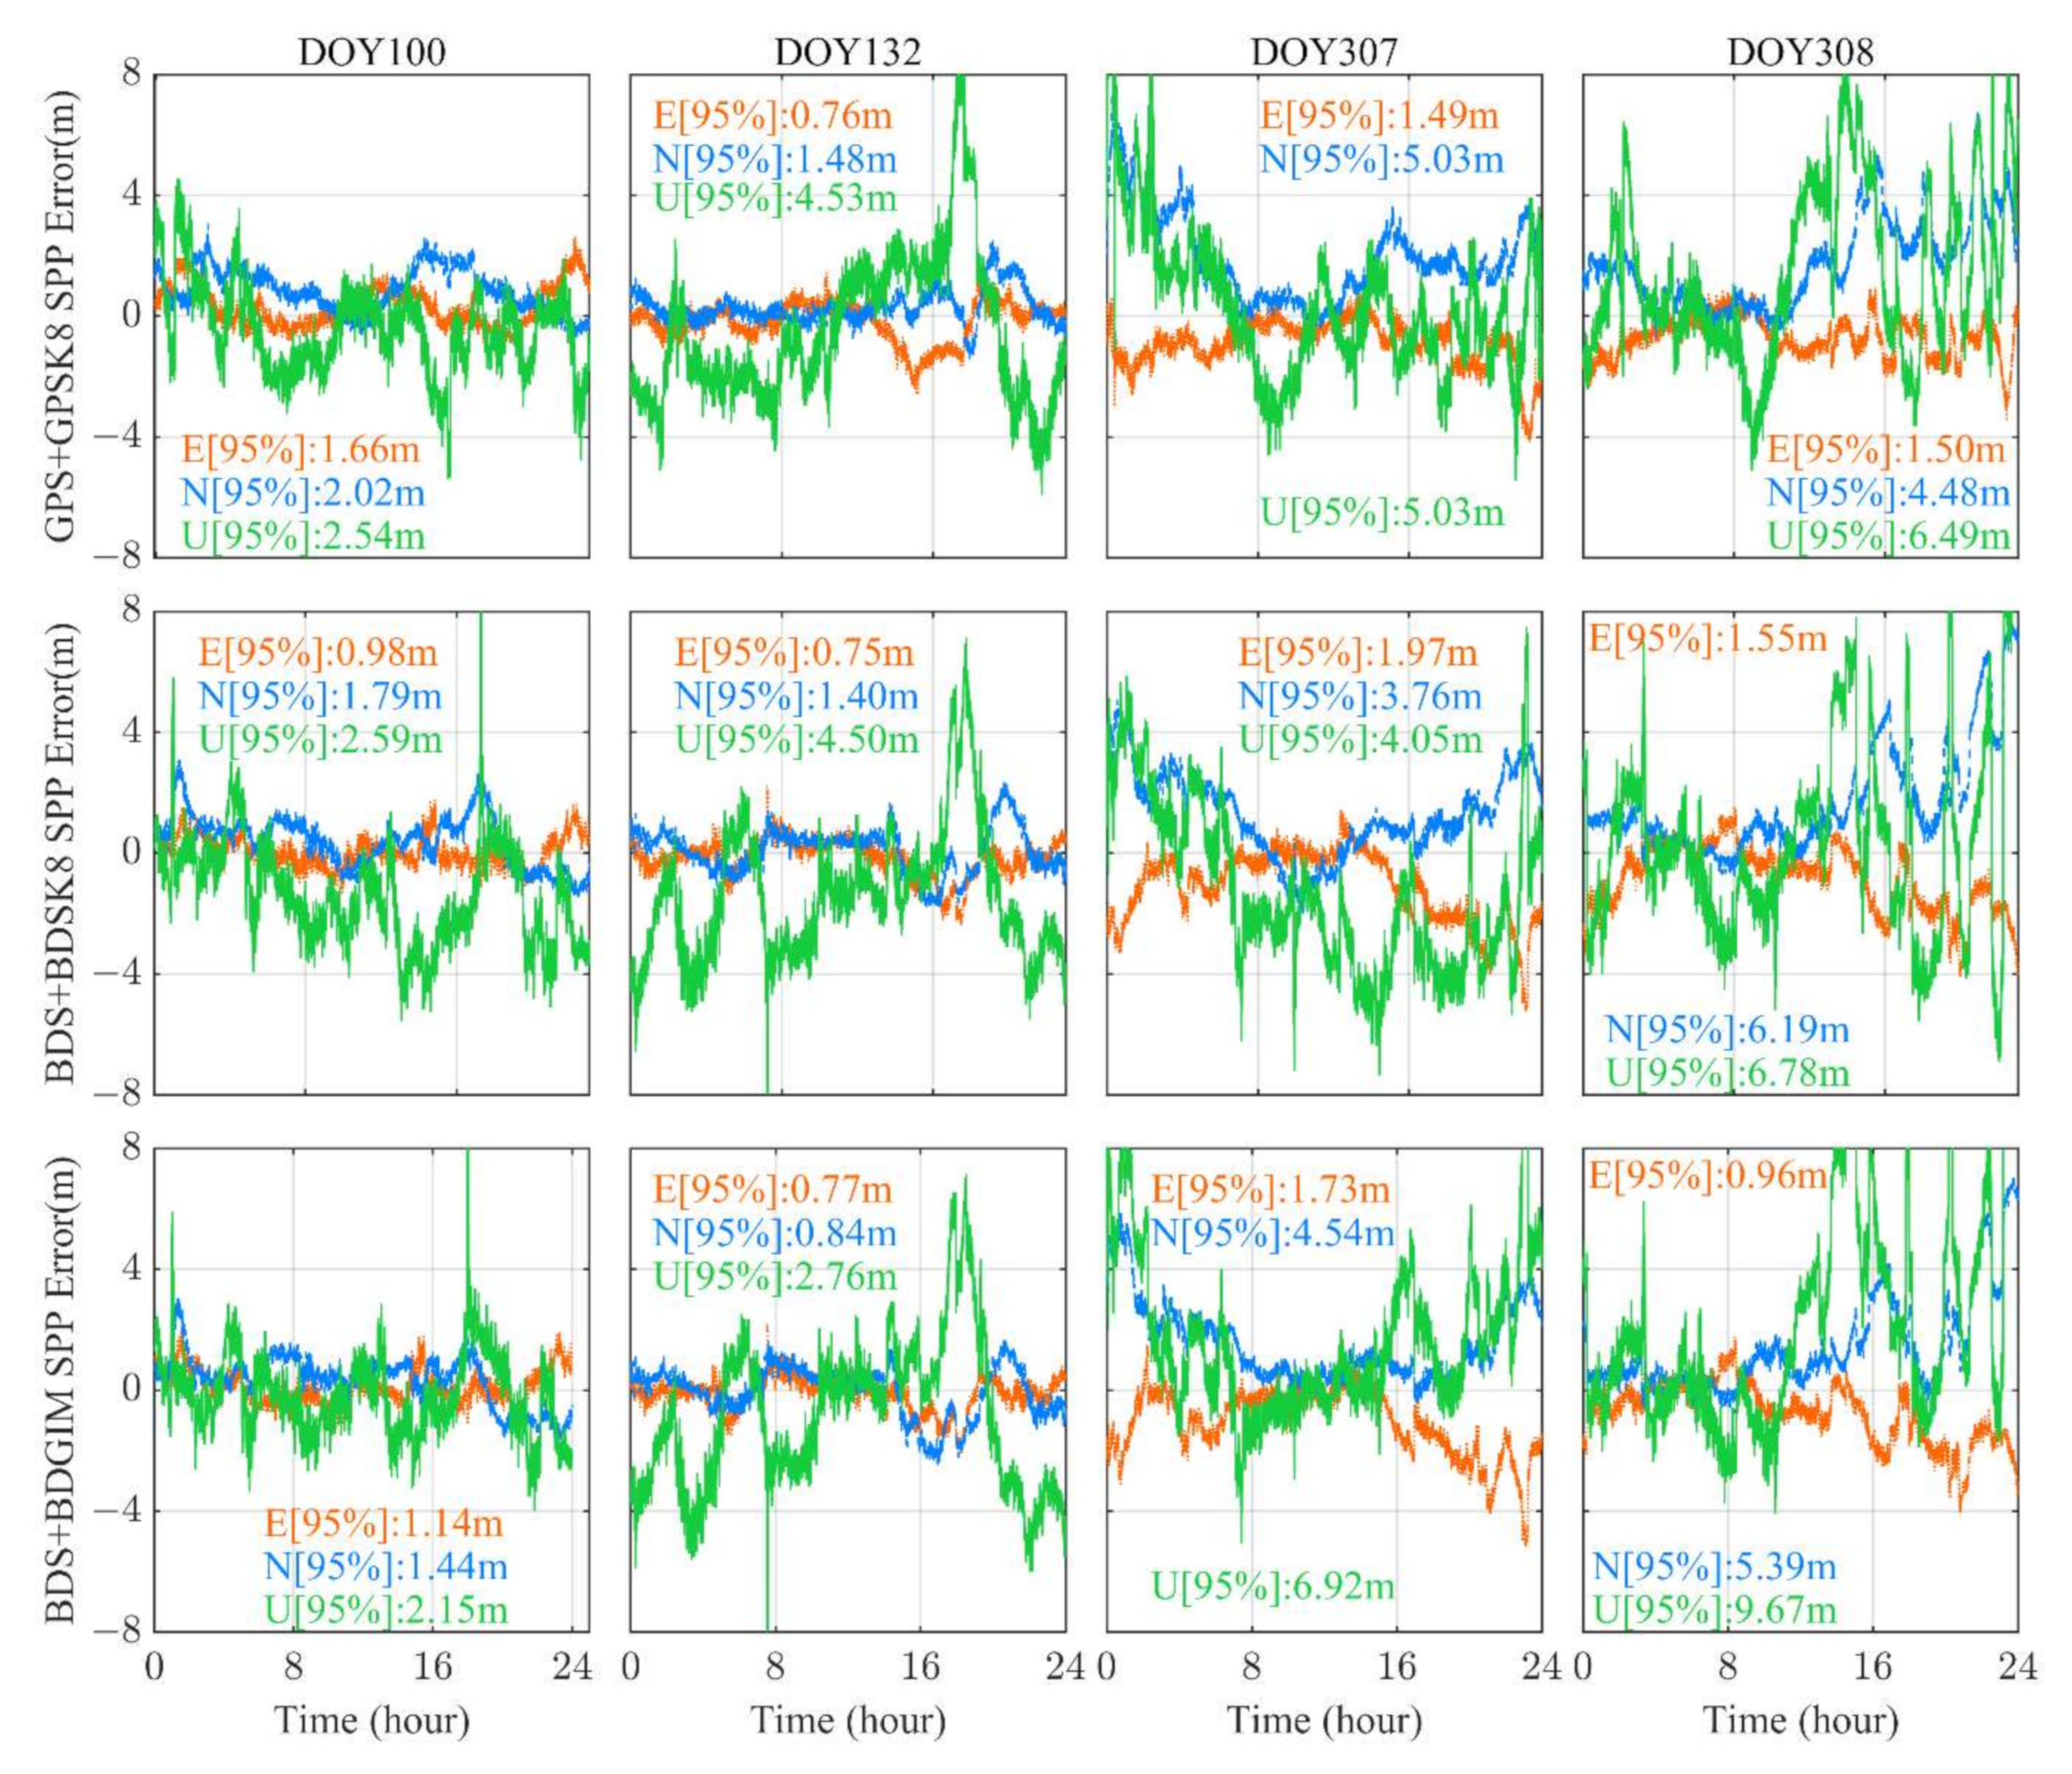
3.4. Positioning Accuracies during Strong Geomagnetic Storms
4. Discussion
5. Conclusions
Author Contributions
Funding
Data Availability Statement
Acknowledgments
Conflicts of Interest
References
- Ahmad, T.; Li, X.; Seet, B.-C. Parametric Loop Division for 3D Localization in Wireless Sensor Networks. Sensors 2017, 17, 1697. [Google Scholar] [CrossRef] [PubMed]
- Hu, J.; Li, P.; Zhang, X.; Bisnath, S.; Pan, L. Precise point positioning with BDS-2 and BDS-3 constellations: Ambiguity resolution and positioning comparison. Adv. Space Res. 2022, 70, 1830–1846. [Google Scholar] [CrossRef]
- Ma, H.; Verhagen, S. Precise Point Positioning on the Reliable Detection of Tropospheric Model Errors. Sensors 2020, 20, 1634. [Google Scholar] [CrossRef] [PubMed]
- Ma, H.; Psychas, D.; Xing, X.; Zhao, Q.; Verhagen, S.; Liu, X. Influence of the inhomogeneous troposphere on GNSS positioning and integer ambiguity resolution. Adv. Space Res. 2021, 67, 1914–1928. [Google Scholar] [CrossRef]
- Klobuchar, J.A. Ionospheric Time-Delay Algorithm for Single-Frequency GPS Users. IEEE Trans. Aerosp. Electron. Syst. 1987, AES-23, 325–331. [Google Scholar] [CrossRef]
- Akinyemi, G.A.; Kolawole, L.B.; Dairo, O.F.; Willoughby, A.A.; Abdulrahim, R.B.; Rabiu, A.B. The Response of the Equatorial Ionosphere over Nigeria to a Geomagnetic Storm Event. Geomagn. Aeron. 2021, 61, 647–657. [Google Scholar] [CrossRef]
- Prolss, G.W. Density perturbations in the upper atmosphere caused by the dissipation of solar wind energy. Surv. Geophys. 2011, 32, 101–195. [Google Scholar] [CrossRef]
- Cai, X.; Burns, A.G.; Wang, W.; Qian, L.; Solomon, S.C.; Eastes, R.W.; McClintock, W.E.; Laskar, F.I. Investigation of a neutral “tongue” observed by GOLD during the geomagnetic storm on May 11, 2019. J. Geophys. Res-Space Phys. 2021, 126, e2020JA028817. [Google Scholar] [CrossRef]
- Aa, E.; Zhang, S.-R.; Erickson, P.J.; Coster, A.J.; Goncharenko, L.P.; Varney, R.H.; Eastes, R. Salient midlatitude ionospherethermosphere disturbances associate with SAPS during a minor but geoeffective storm at deep solar minimum. J. Geophys. Res-Space Phys. 2021, 126, e2021JA029509. [Google Scholar] [CrossRef]
- Huang, C.-S. Long-lasting penetration electric fields during geomagnetic storms: Observations and mechanisms. J. Geophys. Res-Space Phys. 2019, 124, 9640–9664. [Google Scholar] [CrossRef]
- Valdés-Abreu, J.C.; Díaz, M.A.; Báez, J.C.; Stable-Sánchez, Y. Effects of the 12 May 2021 Geomagnetic Storm on Georeferencing Precision. Remote Sens. 2021, 14, 38. [Google Scholar] [CrossRef]
- Hernández-Pajares, M.; Juan, J.M.; Sanz, J.; Aragón-Àngel, À.; García-Rigo, A.; Salazar, D.; Escudero, M. The ionosphere: Effects, GPS modeling and the benefits for space geodetic techniques. J. Geod. 2011, 85, 887–907. [Google Scholar] [CrossRef]
- Krypiak-Gregorczyk, A. Ionosphere response to three extreme events occurring near spring equinox in 2012, 2013 and 2015, observed by regional GNSS-TEC model. J. Geod. 2018, 93, 931–951. [Google Scholar] [CrossRef]
- Bidaine, B.; Lonchay, M.; Warnant, R. Galileo single frequency ionospheric correction: Performances in terms of position. GPS Solut. 2012, 17, 63–73. [Google Scholar] [CrossRef][Green Version]
- European Union. The European GNSS (Galileo) Open Service Signal-In-Space Interface Control Document Issue 2.0. Available online: https://galileognss.eu/wp-content/uploads/2021/01/Galileo_OS_SIS_ICD_v2.0.pdf (accessed on 28 July 2022).
- Wang, N.; Li, Z.; Li, M.; Yuan, Y.; Huo, X. GPS, BDS and Galileo ionospheric correction models: An evaluation in range delay and position domain. J. Atmos. Sol.-Terr. Phys. 2018, 170, 83–91. [Google Scholar] [CrossRef]
- Wu, X.; Hu, X.; Wang, G.; Zhong, H.; Tang, C. Evaluation of COMPASS ionospheric model in GNSS positioning. Adv. Space Res. 2013, 51, 959–968. [Google Scholar] [CrossRef]
- Zhao, K.; Yan, W.; Yang, X.; Yang, H.; Wei, P. BDGIM performance evaluation based on iGMAS global tracking network. Adv. Space Res. 2020, 66, 2168–2178. [Google Scholar] [CrossRef]
- Yang, C.; Guo, J.; Geng, T.; Zhao, Q.; Jiang, K.; Xie, X.; Lv, Y. Assessment and Comparison of Broadcast Ionospheric Models: NTCM-BC, BDGIM, and Klobuchar. Remote Sens. 2020, 12, 1215. [Google Scholar] [CrossRef]
- Wang, G.; Yin, Z.; Hu, Z.; Chen, G.; Li, W.; Bo, Y. Analysis of the BDGIM Performance in BDS Single Point Positioning. Remote Sens. 2021, 13, 3888. [Google Scholar] [CrossRef]
- Wang, N.; Yuan, Y.; Li, Z.; Huo, X. Improvement of Klobuchar model for GNSS single-frequency ionospheric delay corrections. Adv. Space Res. 2016, 57, 1555–1569. [Google Scholar] [CrossRef]
- Bi, T.; An, J.; Yang, J.; Liu, S. A modified Klobuchar model for single-frequency GNSS users over the polar region. Adv. Space Res. 2017, 59, 833–842. [Google Scholar] [CrossRef]
- Zhang, Q.; Liu, Z.; Hu, Z.; Zhou, J.; Zhao, Q. A modified BDS Klobuchar model considering hourly estimated night-time delays. GPS Solut. 2022, 26, 49. [Google Scholar] [CrossRef]
- Liu, Z.; Yang, Z. Anomalies in broadcast ionospheric coefficients recorded by GPS receivers over the past two solar cycles (1992–2013). GPS Solut. 2015, 20, 23–37. [Google Scholar] [CrossRef]
- Li, Q.; Su, X.; Xie, X.; Tao, C.; Cui, J.; Chen, H.; Liu, Z. Accuracy Analysis of Error Compensation in the Ionospheric Model of BDS Broadcasting Based on ABC-BP Neural Network. In Proceedings of the China Satellite Navigation Conference (CSNC 2022) Proceedings, Beijing, China, 22–25 May 2022; Springer: Singapore; pp. 54–63. [Google Scholar] [CrossRef]
- Zhang, Q.; Zhao, Q. Analysis of the data processing strategies of spherical harmonic expansion model on global ionosphere mapping for moderate solar activity. Adv. Space Res. 2019, 63, 1214–1226. [Google Scholar] [CrossRef]
- Dabbakuti, J.R.K.K. Modeling and optimization of ionospheric model coefficients based on adjusted spherical harmonics function. Acta Astronaut. 2021, 182, 286–294. [Google Scholar] [CrossRef]
- Wang, C.; Zhang, T.; Fan, L.; Shi, C.; Jing, G. A Simplified Worldwide Ionospheric Model for Satellite Navigation. IEEE Trans. Aerosp. Electron. Syst. 2022, 58, 391–405. [Google Scholar] [CrossRef]
- Krishna, K.S.; Ratnam, D.V.; Sridhar, M.; Harsha, P.B.S.; Sivavaraprasad, G. Performance Evaluation of Adjusted Spherical Harmonics Ionospheric Model Over Indian Region. IEEE Access 2020, 8, 172610–172622. [Google Scholar] [CrossRef]
- Zheng, F.; Gu, S.; Gong, X.; Lou, Y.; Fan, L.; Shi, C. Real-time single-frequency pseudorange positioning in China based on regional satellite clock and ionospheric models. GPS Solut. 2019, 24, 6. [Google Scholar] [CrossRef]
- Zhbankov, G.A.; Danilkin, N.P.; Maltseva, O.A. Influence of the ionosphere on the accuracy of the satellite navigation system. Acta Astronaut. 2022, 190, 194–201. [Google Scholar] [CrossRef]
- Chen, H.; Niu, F.; Su, X.; Geng, T.; Liu, Z.; Li, Q. Initial Results of Modeling and Improvement of BDS-2/GPS Broadcast Ephemeris Satellite Orbit Based on BP and PSO-BP Neural Networks. Remote Sens. 2021, 13, 4801. [Google Scholar] [CrossRef]
- Geng, T.; Su, X.; Fang, R.; Xie, X.; Zhao, Q.; Liu, J. BDS Precise Point Positioning for Seismic Displacements Monitoring: Benefit from the High-Rate Satellite Clock Corrections. Sensors 2016, 16, 2192. [Google Scholar] [CrossRef] [PubMed]
- Su, M.; Su, X.; Zhao, Q.; Liu, J. BeiDou Augmented Navigation from Low Earth Orbit Satellites. Sensors 2019, 19, 198. [Google Scholar] [CrossRef] [PubMed]
- Luo, X.; Gu, S.; Lou, Y.; Xiong, C.; Chen, B.; Jin, X. Assessing the Performance of GPS Precise Point Positioning Under Different Geomagnetic Storm Conditions during Solar Cycle 24. Sensors 2018, 18, 1784. [Google Scholar] [CrossRef] [PubMed]
- Su, X.; Geng, T.; Li, W.; Zhao, Q.; Xie, X. Chang’E-5T Orbit Determination Using Onboard GPS Observations. Sensors 2017, 17, 1260. [Google Scholar] [CrossRef]
- Geng, J.; Chen, X.; Pan, Y.; Mao, S.; Li, C.; Zhou, J.; Zhang, K. PRIDE PPP-AR: An open-source software for GPS PPP ambiguity resolution. GPS Solut. 2019, 23, 91. [Google Scholar] [CrossRef]
- Ma, H.; Zhao, Q.; Verhagen, S.; Psychas, D.; Liu, X. Assessing the Performance of Multi-GNSS PPP-RTK in the Local Area. Remote Sens. 2020, 12, 3343. [Google Scholar] [CrossRef]
- Cherniak, I.; Zakharenkova, I. Dependence of the high-latitude plasma irregularities on the auroral activity indices: A case study of 17 March 2015 geomagnetic storm. Earth Planets Space 2015, 67, 151. [Google Scholar] [CrossRef]
- Zhang, Y.; Liu, Y.; Mei, J.; Zhang, C.; Wang, J. A Study on the Characteristics of the Ionospheric Gradient under Geomagnetic Perturbations. Sensors 2020, 20, 1805. [Google Scholar] [CrossRef]
- Liu, Y.; Fu, L.; Wang, J.; Zhang, C. Studying Ionosphere Responses to a Geomagnetic Storm in June 2015 with Multi-Constellation Observations. Remote Sens. 2018, 10, 666. [Google Scholar] [CrossRef]
- Li, X.; Cai, H.; Li, D.; Geng, C.; Chen, L.; Xu, J. Analysis of the Influence of Geomagnetic Storms on the Ionospheric Model of Beidou/GPS System. In Proceedings of the China Satellite Navigation Conference (CSNC 2016) Proceedings, Changsha, China, 18–20 May 2016; pp. 503–510. [Google Scholar] [CrossRef]
- Tariku, Y.A. The Geomagnetic Storm Time Response of the Mid Latitude Ionosphere During Solar Cycle 24. Radio Sci. 2021, 56, e2021RS007340. [Google Scholar] [CrossRef]
- Xue, J.; Veettil, S.V.; Aquino, M.; Hu, X.; Quan, L.; Liu, D.; Guo, P.; Wu, M. Performance of BDS B1 Frequency Standard Point Positioning during the Main Phase of Different Classified Geomagnetic Storms in China and the Surrounding Area. Remote Sens. 2022, 14, 1240. [Google Scholar] [CrossRef]
- Poniatowski, M.; Nykiel, G. Degradation of Kinematic PPP of GNSS Stations in Central Europe Caused by Medium-Scale Traveling Ionospheric Disturbances During the St. Patrick’s Day 2015 Geomagnetic Storm. Remote Sens. 2020, 12, 3582. [Google Scholar] [CrossRef]
- Alcay, S. Ionospheric response to extreme events and its effects on precise point positioning. Indian J. Phys. 2022, 1–14. [Google Scholar] [CrossRef]
- Quan, L.; Xue, J.; Hu, X.; Li, L.; Liu, D.; Wang, D. Performance of GPS single frequency standard point positioning in China during the main phase of different classified geomagnetic storms. Chin. J. Geophys. 2021, 64, 3030–3047. (In Chinese) [Google Scholar]
- Zhang, S.; He, L.; Wu, L. Statistical Study of Loss of GPS Signals Caused by Severe and Great Geomagnetic Storms. J. Geophys. Res. Space Phys. 2020, 125, e2019JA027749. [Google Scholar] [CrossRef]
- Space Weather Prediction Center, National Oceanic and Atmospheric Administration. NOAA Space Weather Scales. Available online: https://www.swpc.noaa.gov/sites/default/files/images/NOAAscales.pdf (accessed on 7 August 2022).
- Zhang, Q.; Liu, X.; Liu, Z.; Hu, Z.; Zhao, Q. Performance evaluation of BDS-3 ionospheric delay correction models (BDSK and BDGIM): First year for full operational capability of global service. Adv. Space Res. 2022, 70, 687–698. [Google Scholar] [CrossRef]
- Zhao, K. Research on the Method of Ionospheric Monitoring and Evaluation Based on iGMAS. Doctoral Thesis, University of Chinese Academy of Sciences, Beijing, China, September 2020. (In Chinese). [Google Scholar]
- Global Position System Directorate. Navistar GPS Space Segment/Navigation User Segment Interfaces. Available online: https://www.gps.gov/technical/icwg/IS-GPS-200G.pdf (accessed on 28 July 2022).
- China Satellite Navigation Office. BeiDou Navigation Satellite System Signal in Space Interface Control Document Open Service Signal B1I (Version 3.0). Available online: http://www.beidou.gov.cn/xt/gfxz/201902/P020190227593621142475.pdf (accessed on 28 July 2022).
- China Satellite Navigation Office. BeiDou Navigation Satellite System Signal in Space Interface Control Document Open Service Signal B1C (Version 1.0). Available online: http://www.beidou.gov.cn/xt/gfxz/201712/P020171226741342013031.pdf (accessed on 28 July 2022).


| GPSK8 | BDSK8 | BDGIM | |
|---|---|---|---|
| Mathematical method | Cosine function (Day) + Constant value (Night) | Spherical Harmonic function | |
| Reference frame | Geomagnetic frame | Geographical frame | Geomagnetic frame |
| Ionospheric height | 350 km | 375 km | 400 km |
| Mapping function | Klobuchar | SLM | SLM |
| Num of coefficients | 8 | 8 | 9 |
| Strategy Code | System | Sampling Interval | Elevation Cutoff | Orbits and Clocks | Ionospheric Delay | Tropospheric Delay |
|---|---|---|---|---|---|---|
| GPS + GPSK8 | GPS | 30s | 10° | Broadcast ephemeris | GPSK8 | Saastamoinen Model |
| BDS + BDSK8 | BDS-2 + BDS-3 | BDSK8 | ||||
| BDS + BDGIM | BDGIM |
| Region | Direction | GPS + GPSK8 | BDS + BDSK8 | BDS + BDGIM |
|---|---|---|---|---|
| NH | H | 1.52 | 3.29 | 1.65 |
| V | 3.49 | 4.46 | 3.07 | |
| 3D | 3.81 | 5.54 | 3.48 | |
| NM | H | 1.95 | 1.72 | 1.50 |
| V | 3.43 | 2.88 | 2.49 | |
| 3D | 3.95 | 3.36 | 2.91 | |
| NL | H | 2.75 | 2.27 | 2.14 |
| V | 3.92 | 3.32 | 3.02 | |
| 3D | 4.78 | 4.02 | 3.70 | |
| SL | H | 1.94 | 2.27 | 2.04 |
| V | 3.58 | 5.59 | 3.74 | |
| 3D | 4.07 | 6.04 | 4.26 | |
| SM | H | 1.51 | 1.53 | 1.40 |
| V | 2.83 | 3.26 | 2.61 | |
| 3D | 3.21 | 3.61 | 2.96 | |
| SH | H | 1.66 | 2.95 | 1.86 |
| V | 3.35 | 4.47 | 3.19 | |
| 3D | 3.74 | 5.35 | 3.70 | |
| N | H | 2.14 | 2.09 | 1.71 |
| V | 3.59 | 3.22 | 2.73 | |
| 3D | 4.18 | 3.84 | 3.22 | |
| S | H | 1.73 | 2.50 | 1.87 |
| V | 3.40 | 5.13 | 3.49 | |
| 3D | 3.81 | 5.70 | 3.96 | |
| Global | H | 1.89 | 2.34 | 1.77 |
| V | 3.43 | 4.00 | 3.02 | |
| 3D | 3.92 | 4.63 | 3.50 | |
| China | H | 3.32 | 1.99 | 1.89 |
| V | 4.04 | 3.28 | 3.04 | |
| 3D | 5.23 | 3.84 | 3.58 |
| Region | Station | Reference Period | DOY 132 | DOY 307 | DOY 308 |
|---|---|---|---|---|---|
| NH | SCOR | 3.67 | 2.90 | 3.45 | 4.11 |
| KIRU | 3.72 | 3.36 | 3.56 | 4.42 | |
| GCGO | 4.03 | 2.96 | 4.32 | 3.75 | |
| NM | LICC | 3.03 | 2.72 | 3.08 | 2.89 |
| GANP | 3.07 | 2.80 | 2.97 | 3.28 | |
| BREW | 3.86 | 2.98 | 3.74 | 3.39 | |
| ULAB | 4.59 | 5.80 | 5.74 | 5.09 | |
| HUEG | 3.36 | 3.07 | 3.33 | 3.56 | |
| URUM | 4.38 | 5.23 | 6.03 | 4.09 | |
| ORID | 3.50 | 2.79 | 2.73 | 4.46 | |
| VILL | 3.87 | 3.59 | 3.65 | 4.94 | |
| ARUC | 4.20 | 3.47 | 4.21 | 2.81 | |
| KITG | 3.54 | 3.47 | 3.95 | 4.06 | |
| SGPO | 3.62 | 3.05 | 3.67 | 3.87 | |
| USUD | 5.24 | 4.88 | 6.29 | 6.12 | |
| JFNG | 5.21 | 3.71 | 5.87 | 6.83 | |
| NL | LHAZ | 5.66 | 4.85 | 7.13 | 5.24 |
| HKWS | 5.89 | 3.95 | 8.07 | 7.26 | |
| LMMF | 4.98 | 4.83 | 7.27 | 8.03 | |
| IISC | 4.31 | 4.50 | 3.86 | 4.24 | |
| DJIG | 3.91 | 3.16 | 3.39 | 5.00 | |
| YKRO | 4.36 | 3.12 | 6.49 | 5.30 | |
| ANMG | 4.71 | 4.67 | 5.71 | 5.48 | |
| SL | TOPL | 4.53 | 3.99 | 5.87 | 6.85 |
| ZAMB | 3.66 | 3.82 | 3.16 | 3.06 | |
| ABPO | 3.54 | 4.88 | 3.85 | 3.75 | |
| UNSA | 4.98 | 4.77 | 6.51 | 5.46 | |
| MCHL | 3.68 | 3.01 | 4.67 | 4.28 | |
| SM | MGUE | 3.53 | 3.51 | 4.34 | 3.48 |
| KRGG | 2.99 | 3.17 | 3.08 | 3.00 | |
| RGDG | 3.10 | 3.54 | 2.97 | 3.40 | |
| SH | OHI3 | 3.61 | 4.68 | 3.63 | 4.12 |
| MAW1 | 3.88 | 4.90 | 2.56 | 3.33 | |
| Average | 4.07 | 3.82 | 4.52 | 4.51 |
| Region | Station | Reference Period | DOY 132 | DOY 307 | DOY 308 |
|---|---|---|---|---|---|
| NH | SCOR | 5.86 | 4.30 | 5.97 | 5.45 |
| KIRU | 5.30 | 2.55 | 4.42 | 4.00 | |
| GCGO | 5.51 | 3.42 | 5.27 | 3.36 | |
| NM | LICC | 3.03 | 2.97 | 3.03 | 3.67 |
| GANP | 3.08 | 3.22 | 3.58 | 4.89 | |
| BREW | 3.96 | 3.42 | 3.69 | 3.14 | |
| ULAB | 2.52 | 2.21 | 3.05 | 3.96 | |
| HUEG | 3.35 | 3.50 | 3.69 | 3.97 | |
| URUM | 2.71 | 2.29 | 3.90 | 4.01 | |
| ORID | 3.66 | 4.59 | 3.63 | 5.65 | |
| VILL | 3.39 | 3.40 | 3.07 | 4.48 | |
| ARUC | 3.46 | 3.06 | 4.02 | 4.37 | |
| KITG | 2.92 | 3.03 | 4.30 | 5.99 | |
| SGPO | 3.73 | 3.45 | 4.40 | 3.98 | |
| USUD | 4.33 | 4.20 | 4.44 | 6.08 | |
| JFNG | 3.66 | 2.93 | 2.63 | 4.88 | |
| NL | LHAZ | 4.70 | 3.12 | 6.49 | 4.17 |
| HKWS | 4.44 | 3.24 | 8.98 | 7.32 | |
| LMMF | 4.88 | 4.78 | 5.87 | 9.31 | |
| IISC | 3.28 | 2.35 | 4.44 | 3.80 | |
| DJIG | 3.83 | 3.31 | 4.35 | 4.47 | |
| YKRO | 4.12 | 2.85 | 4.76 | 4.24 | |
| ANMG | 3.02 | 1.79 | 3.82 | 4.36 | |
| SL | TOPL | 7.97 | 6.19 | 7.19 | 8.73 |
| ZAMB | 5.55 | 5.67 | 4.46 | 3.89 | |
| ABPO | 5.49 | 5.61 | 4.86 | 4.00 | |
| UNSA | 5.92 | 5.47 | 6.66 | 6.37 | |
| MCHL | 5.45 | 5.76 | 4.51 | 5.06 | |
| SM | MGUE | 4.32 | 4.46 | 8.16 | 5.08 |
| KRGG | 2.91 | 3.33 | 4.30 | 3.46 | |
| RGDG | 3.61 | 4.02 | 4.51 | 4.72 | |
| SH | OHI3 | 5.31 | 6.20 | 3.20 | 4.03 |
| MAW1 | 5.47 | 4.62 | 3.49 | 3.77 | |
| Average | 4.27 | 3.80 | 4.64 | 4.81 |
| Region | Station | Reference Period | DOY 132 | DOY 307 | DOY 308 |
|---|---|---|---|---|---|
| NH | SCOR | 3.99 | 4.31 | 4.31 | 4.51 |
| KIRU | 3.00 | 2.88 | 3.53 | 3.65 | |
| GCGO | 3.46 | 3.73 | 3.85 | 3.21 | |
| NM | LICC | 3.22 | 4.07 | 3.07 | 3.30 |
| GANP | 2.54 | 3.33 | 2.46 | 4.29 | |
| BREW | 3.29 | 2.99 | 3.97 | 2.83 | |
| ULAB | 2.03 | 2.06 | 1.72 | 4.18 | |
| HUEG | 2.61 | 3.48 | 2.74 | 3.20 | |
| URUM | 2.23 | 1.96 | 2.32 | 3.79 | |
| ORID | 2.99 | 4.17 | 2.43 | 4.28 | |
| VILL | 3.18 | 3.97 | 2.37 | 4.28 | |
| ARUC | 2.96 | 2.58 | 2.44 | 3.80 | |
| KITG | 2.86 | 3.20 | 2.85 | 5.14 | |
| SGPO | 2.69 | 2.88 | 2.77 | 2.57 | |
| USUD | 4.03 | 4.29 | 3.25 | 6.41 | |
| JFNG | 3.34 | 2.49 | 2.21 | 5.60 | |
| NL | LHAZ | 4.66 | 3.16 | 6.66 | 4.60 |
| HKWS | 4.21 | 3.14 | 8.74 | 7.41 | |
| LMMF | 4.69 | 4.86 | 8.46 | 11.11 | |
| IISC | 2.94 | 2.17 | 3.76 | 3.27 | |
| DJIG | 2.81 | 2.80 | 3.41 | 3.93 | |
| YKRO | 3.70 | 2.99 | 3.60 | 5.60 | |
| ANMG | 3.00 | 2.79 | 3.26 | 3.64 | |
| SL | TOPL | 7.18 | 6.34 | 10.09 | 8.35 |
| ZAMB | 3.19 | 2.75 | 4.60 | 3.30 | |
| ABPO | 2.87 | 2.37 | 3.07 | 3.32 | |
| UNSA | 5.35 | 4.72 | 5.23 | 5.41 | |
| MCHL | 2.73 | 2.61 | 2.04 | 5.67 | |
| SM | MGUE | 3.03 | 2.07 | 5.06 | 3.95 |
| KRGG | 3.16 | 3.51 | 3.87 | 3.49 | |
| RGDG | 2.72 | 3.04 | 3.35 | 3.99 | |
| SH | OHI3 | 4.20 | 6.04 | 2.73 | 4.19 |
| MAW1 | 3.21 | 3.42 | 2.63 | 3.36 | |
| Average | 3.40 | 3.37 | 3.84 | 4.53 |
Publisher’s Note: MDPI stays neutral with regard to jurisdictional claims in published maps and institutional affiliations. |
© 2022 by the authors. Licensee MDPI, Basel, Switzerland. This article is an open access article distributed under the terms and conditions of the Creative Commons Attribution (CC BY) license (https://creativecommons.org/licenses/by/4.0/).
Share and Cite
Li, Q.; Su, X.; Xu, Y.; Ma, H.; Liu, Z.; Cui, J.; Geng, T. Performance Analysis of GPS/BDS Broadcast Ionospheric Models in Standard Point Positioning during 2021 Strong Geomagnetic Storms. Remote Sens. 2022, 14, 4424. https://doi.org/10.3390/rs14174424
Li Q, Su X, Xu Y, Ma H, Liu Z, Cui J, Geng T. Performance Analysis of GPS/BDS Broadcast Ionospheric Models in Standard Point Positioning during 2021 Strong Geomagnetic Storms. Remote Sensing. 2022; 14(17):4424. https://doi.org/10.3390/rs14174424
Chicago/Turabian StyleLi, Qiang, Xing Su, Yan Xu, Hongyang Ma, Zhimin Liu, Jianhui Cui, and Tao Geng. 2022. "Performance Analysis of GPS/BDS Broadcast Ionospheric Models in Standard Point Positioning during 2021 Strong Geomagnetic Storms" Remote Sensing 14, no. 17: 4424. https://doi.org/10.3390/rs14174424
APA StyleLi, Q., Su, X., Xu, Y., Ma, H., Liu, Z., Cui, J., & Geng, T. (2022). Performance Analysis of GPS/BDS Broadcast Ionospheric Models in Standard Point Positioning during 2021 Strong Geomagnetic Storms. Remote Sensing, 14(17), 4424. https://doi.org/10.3390/rs14174424