Abstract
Wildfires play a critical role in re-shaping boreal ecosystems and climate. It was projected that, owing to the Arctic amplification, boreal wildfires would become more frequent and severe in the coming decades. Although provoking concern, the spatiotemporal changes in boreal wildfires remain unclear, and there are substantial inconsistencies among previous findings. In this study, we performed a comprehensive analysis to determine the spatiotemporal changes in wildfires over Northern Eurasia (NEA) from 2003 to 2020 using a reconstructed Moderate Resolution Imaging Spectroradiometer (MODIS) active fire product. We found that wildfires in NEA exhibited contrasting changes in different latitudinal zones, land cover types, and seasons from 2003 to 2020. Cropland wildfires, mainly distributed at low latitudes (50–60°N), considerably decreased by 81% during the study period. Whereas forest wildfires ignited at high latitudes (north of 60°N) have nearly tripled (increasing at rate of 11~13% per year) during the past two decades. The southwestern and northeastern NEA regions exhibited contrasting patterns of wildfire changes. The active fire counts in the southwestern NEA decreased by 90% at a rate of 0.29(±0.12) × 105 per year, with cropland fires contributing to ~66% of the decrease. However, the fire counts in the northeastern NEA increased by 292% at a rate of 0.23(±0.12) × 105 per year, with boreal forests contributing to ~97% of the increase. It is worth noting that the contrasting changes in wildfires during the past two decades have led to significant structural alternation in the NEA wildfire composition. Forest fires, contributing over 60% of the total fire counts in NEA nowadays, have become the predominant component of the NEA wildfires. The contrasting changes in NEA wildfires imply that more forest fires may emerge in far northern regions of the North Hemisphere as the Arctic becomes progressively warmer in the coming decades. As wildfires continue to increase, more gases and aerosols would be released to the atmosphere and cause considerable feedback to the Arctic climate. The increased wildfire-related climate feedbacks should, therefore, be seriously considered in climate models and projections.
1. Introduction
Boreal ecosystems are the largest terrestrial organic carbon reservoir, containing approximately 2–5 times the aboveground biomass of tropical and temperate forests [1], and even higher belowground permafrost carbon storage [2]. Wildfires are the predominant driving forces of disturbances in boreal landscapes [3], playing an important role in re-shaping boreal ecosystems by altering vegetation composition, structures, and resilience [4,5,6]. Large-scale wildfires can also profoundly influence the boreal climate system by changing the carbon budgets of both the aboveground biomass [7,8,9] and belowground permafrost [2,10,11], and by releasing gases and aerosols that disturb atmospheric stability [12,13,14,15]. Owing to their potentially massive and widespread impacts, boreal wildfires have attracted increasing concerns in recent years.
Northern Eurasia (NEA) presents widely distributed taiga forest and tundra in the boreal ecosystem, facilitating the emergence of severe wildfires. The enhanced warming and drying climate [16,17,18], potentially increasing lighting activities [2,19], and growing fuel availability from the greening boreal forest and tundra [20,21,22], have been suggested to increase wildfire risks in NEA over the past decades [23]. The wildfire risk in NEA is projected to continually increase in the future under all types of climate-forcing scenarios [24]. Such warming-induced increases in NEA wildfires would produce substantial feedbacks in Arctic ecosystems and climate [24,25,26,27]. Given the importance of wildfires in shaping boreal ecosystems, it is critical to determine the changes in NEA wildfires to understand future ecosystem and climatic changes throughout the Arctic.
In recent years, satellite observation products have been used to determine the changes in wildfires in the NEA. However, there is still a considerable lack in understanding of the active fire variability. Major inconsistencies are present among different studies. Some studies have suggested that, driven by increased human activity (i.e., agricultural expansion and increased grazing), burned areas in NEA decreased dramatically over the past two decades [28,29,30]. For example, Andela et al., highlighted that the declining fire activity driven by agricultural expansion and intensification was very common in the cropland zones in the south of NEA [28]; Hao et al. suggested that the increased grazing combined wetter climate has reduced the wildfires in NEA [29,30]. These reports are not consistent with the expected increasing wildfire risk in this region. Other studies have argued that the wildfires in NEA increased dramatically over the past decades [31,32,33]. Ponomarev et al. found that both the number of forest fires and the size of the burned area increased during recent decades in Siberia [33]. Kharuk et al., found that the warming climate has not only resulted in significant increasing trends in wildfires, but also led to northward migrating of the Siberia wildfires to the Arctic Ocean shore [31,32]. In addition, recent wildfires in the Arctic have revived concerns related to the potential for increased numbers of wildfires in the future [34,35,36]. Thus, it is necessary to comprehensively determine the changes in the number of wildfires in NEA and reconcile the differences among these findings of previous studies.
In this study, we systematically analyzed spatiotemporal changes in wildfires in NEA from 2003 to 2020 using a reconstructed Moderate Resolution Imaging Spectroradiometer (MODIS) active fire product. With the assistance of land cover product, we determined the wildfires changes in different latitudinal zones, land cover types, and seasons from 2003 to 2020. Two typical sub-regions were further extracted and compared in detailed wildfire changes during the past two decades.
2. Materials and Methods
2.1. Study Area
As shown in Figure 1, the study area of NEA in this work refers to the boreal continental areas of Eurasia located at high latitudes of the northern hemisphere (from 10°W to 180°E, 50°N to the coast of the Arctic Ocean). The NEA presents extensive taiga forests, with a continuously distributed tundra steppe zone on the northern fringe, and some discrete dry steppes and meadows over the southern area. There are also some fractions of shrublands distributed in western Siberia. Croplands are mainly distributed at the southwestern part of NEA. Most of the population of NEA mainly lives in Europe and the agricultural areas over southwestern Siberia. A vast area of eastern NEA is inaccessible and sparsely populated, which strongly limits the ability and efficiency of wildfire suppression [37]. Both satellite observed and atmospheric reanalysis land surface temperature products show that NEA was experiencing distinctive warming at rate of 2.5–2.8 times the global average in the past two decades, with the warming rates in some sub-regions even reaching over 2 °C per decade [38].
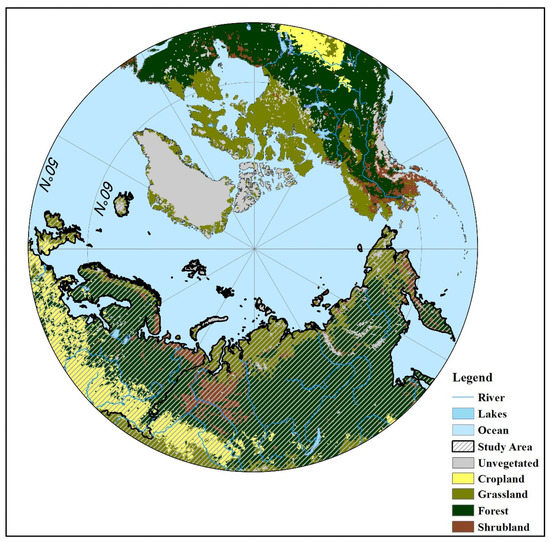
Figure 1.
The study area and spatial distribution of land cover types of NEA. The land cover dataset was collected from the European Space Agency Climate Change Initiative Land Cover project and introduced in detail at the following section.
2.2. Data
2.2.1. MODIS Active Fire Product
The Collection 6 MODIS 14A1 daily active fire (thermal anomaly) product, which is onboard the Terra (MOD) and Aqua (MYD) satellite platforms from 2003 to 2020, was used in this study [39]. Active fire detection accuracy in the MODIS Collection 6 product was improved significantly, by addressing the limitations in previous collection products, including false alarms caused by small forest clearings and large fire omissions masked by thick smoke [40]. The MODIS 14A1 product provided a 1 km gridded active fire mask detected by the MODIS instruments on the Terra and Aqua satellites. The fire mask scientific data set (SDS) was stored as a three-dimensional matrix of 8 bit unsigned integer values, and was the key component of the active fire product that identifies thermal anomalies, with a composite day/night algorithm. The MODIS 14A1 active fire product had been validated using high spatial resolution satellite observations and agency records, and had a high success rate for detecting large-scale biomass burning events [41,42,43].
2.2.2. Land Cover Product
To analyze wildfire changes on different land cover types, we obtained the global land cover maps from the European Space Agency Climate Change Initiative Land Cover (ESA CCI-LC) project [44]. The ESA CCI-LC dataset, produced with a series of satellite observations, is a global land cover product with 300 m spatial resolution, and available at https://www.esa-landcover-cci.org/ (accessed on 1 August 2022). The ESA CCI-LC v2.0.7 land cover map of 2015 was used in this study. The pixel-level land cover class of ESA CCI-LC was defined based on the UN Land Cover Classification System (LCCS). The ESA CCI-LC is a popular product that has been extensively validated with high resolution satellite observations and surface investigations, and is regarded with higher accuracy among datasets with similar resolution [45,46,47]. To analyze the changes in NEA wildfires at different vegetation ecosystems, the original vegetated land cover types were reclassified to four major types: forest, cropland, grassland, and shrubland, to represent the four different typical terrestrial ecosystems (Figure 1).
2.3. Method
2.3.1. Dual-Platform Synthesis of Daily Active Fire Points
As the MODIS daily active fire product retrieved by either the Terra or Aqua satellite platforms can only capture the instantaneous land surface state and serious omission issues with respect to ongoing biomass burning [38], this product is not feasible for directly analyzing large-scale wildfires. Synthesizing the active fire products from both platforms can reduce omission issues related to active fire detection that result from smoke/cloud masking, as well as addressing the instantaneous nature of single-platform observations. We developed a dual-platform composition scheme to synthesize the fire mask SDS from the MOD14A1 (Terra) and MYD14A1 (Aqua) datasets. A simple but effective maximum composition algorithm (MCA) was designed, as shown in Formula (1). The MCA method can cover most potential situations and recodes the fire mask values with the highest confidence at each pixel.
where and are the fire mask values of a given pixel from the MOD14A1 and MYD14A1 products, respectively, and is the MODIS dual-platform combined dataset. The composite daily active fire mask dataset in the sinusoidal equal-area projection was then aggregated to obtain monthly active fire counts on a 1 km grid, and was further re-projected to the geographic coordinate system and aggregated using a 1° spatial grid.
2.3.2. Characterization of Spatiotemporal Changes in Wildfires
To determine the long-term changes in the spatiotemporally aggregated fire counts, we performed linear regression analyses to estimate the annual and long-term changes in fire counts during the study period. The 95% confidence intervals of the linear trends were calculated and used as uncertainties. The significance test conducted in this study was based on the standard two-tailed Student’s t test. To depict pixel-level wildfire changes in NEA, we further used the Mann-Kendell test model to determine the changes in total active fire counts on a 1° spatial resolution grid.
3. Results
3.1. Wildfire Climatology Analysis
Using the daily active fire datasets from the two MODIS platforms (MOD and MYD) and the dual-platform fusion dataset, we obtained the seasonal cycle of wildfires in NEA (Figure 2).
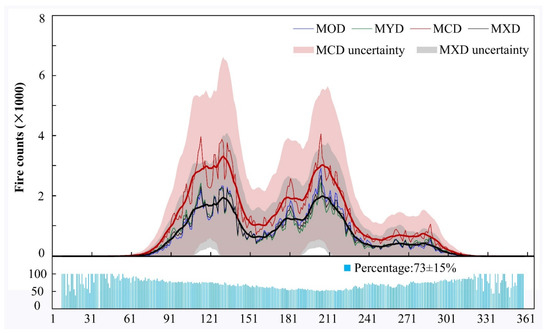
Figure 2.
Seasonal cycle of multi-year mean daily active fire counts in Northern Eurasia (NEA). Colored lines represent the daily fire counts from single satellites (blue-MOD, green-MYD), the average of both datasets (black-MXD), and the combined dataset (red-MCD).
The dual-platform synthesis method dramatically reduced the omission problems present in the single satellite platform data. Compared to the mean fire counts from a single platform, the fire detection ability was improved by 73 ± 15% using the combined daily active fire dataset. The dual-platform synthesis method could help to more accurately determine seasonal and long-term wildfire variations in NEA. The results shown in Figure 2 demonstrated that wildfires varied seasonally, with a typical bimodal pattern. Most of the fires occurred during the spring and summer, accounting for ~43% and ~46% of the annual fire counts, respectively. These bimodal seasonal variations implied that these fires ignited in different locations in NEA.
Using the combined MODIS active fire dataset, we further calculated and mapped the multi-year mean fire counts from 2003 to 2020 on a 1° grid to obtain the spatial distribution of wildfire climatology in the study area. The spatial distributions of NEA wildfire climatology during the spring, summer, autumn, and the entire year are shown in Figure 3.
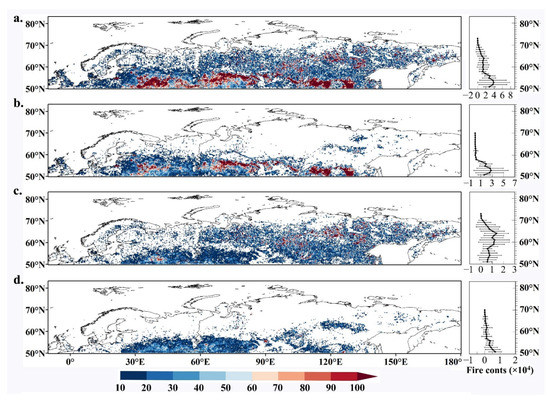
Figure 3.
Observed multi-year mean active fire counts in NEA from 2003 to 2020. Panel (a–d) show the spatial distribution of multi-year mean active fire counts for annual (a), spring (b), summer (c), and autumn (d), respectively.
In general, wildfire occurrence in this study area exhibited contrasting latitudinal and seasonal patterns. Most of the annually cumulative active fires were distributed at lower latitudes (50–60°N) and peaked at ~53°N. In northern areas (above 60°N), the dense active fires were mainly located in eastern Siberia (Figure 3a). Seasonally, severe wildfires south of 60°N occurred mainly in the spring and were associated with the dry weather caused by a prolonged lack of rain and high fuel availability that resulted from dry branches, leaves, and other natural fuels, which accumulated due to the prevailing windy weather [48]. However, during the summer months, severe wildfires spread northward to high latitude zones and peaked at ~65°N. Most of the severe summer fires were located in eastern Siberia, unlike the scattered distribution of fires throughout northern Europe. These summer wildfires at high latitudes may have produced considerable local or remote impacts on the Arctic climate [14,49]. In the autumn, the wildfires were mainly located in southern Europe and western Siberia, which were covered by widespread temperate grasslands and cropland [48]. The observed seasonal and latitudinal contrasts in active fire patterns indicated that these variations were driven by different mechanisms in different locations.
Given the importance of fuel availability in controlling the severity of boreal wildfires, we separated the NEA wildfires based on four land cover types (forest, grassland, shrubland, and cropland) and analyzed their latitudinal and seasonal variations (Figure 4). Figure 4a illustrates that the wildfires in NEA were ignited mainly in forests and croplands, contributing to 55% and 32% of the annual fire counts, respectively. Cropland fires were mainly located at lower latitudes (50–60°N), which is consistent with previous findings that large fires in Central Asia were caused mainly by agricultural activity [49,50]. Although forest fires were distributed in all latitudinal zones, higher latitudes contained more biomass burning events. This suggested that forest fires contributed to over 79% of the total fire counts occurring north of 60°N. Seasonally (Figure 4b), cropland forest fires dominated (90%) the spring wildfire counts in NEA. During the summer, wildfires in NEA mainly occurred in boreal forests, accounting for 73% of the total fire counts. These frequently occurring summer boreal forest wildfires were likely associated with severe convective weather (i.e., thunderstorms) during this season [2,19].
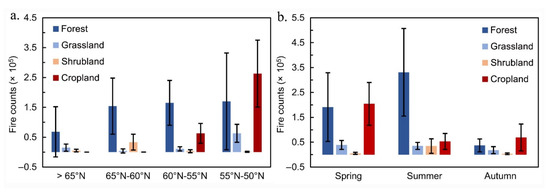
Figure 4.
Zonal (a) and seasonal (b) variations in wildfire climatology on different land cover types in NEA.
3.2. Decadal Wildfire Changes in NEA
In order to explore the spatiotemporal changes in wildfires in the study area during the past two decades, we divided the study period into two epochs (P1: 2003–2011, P2: 2012–2020), generated maps of the multi-year average fire counts, and calculated the statistical changes in fire counts between the epochs. (Figure 5 and Table 1).
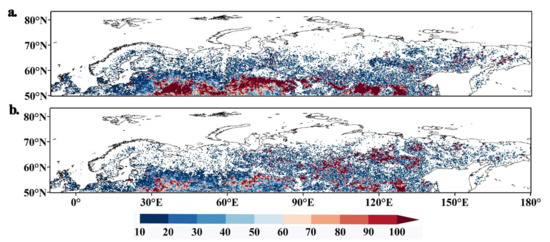
Figure 5.
Multi-year mean active fire counts in NEA for 2003–2011 (P1) and 2012–2020 (P2). Panel (a,b) show the spatial patterns of multi-year mean fire count in NEA during the two epochs.

Table 1.
Decadal changes of fire counts in different land cover types, latitudinal zones, and seasons during the two epochs.
Overall, the active fire counts decreased by ~16% to 9.42(±2.55) × 105 during the past two decades. However, the inter-decadal changes in wildfire counts contained considerable spatial heterogeneity. During 2003–2011 (Figure 5a), most of the intense fires were concentrated at lower latitudes (south of 60°N), while the high latitudes were only sporadically dotted with some small fires. However, during 2012–2020, high intensity fire pixels disappeared at low latitudes and more fire points appeared at high latitudes. In eastern Siberia, numerous intense fire spots spread to far northern areas within the Arctic Circle.
The detailed decadal wildfire changes in NEA were analyzed further (Table 1). The data suggested that cropland fires decreased significantly both latitudinally and seasonally during 2003–2020. Compared to 2003–2011, fire counts on cropland decreased by ~50% during 2012–2020 (varying from 40% to 65% in different latitudinal zones and seasons). Forest wildfires exhibited contrasting zonal and seasonal changes during the past two decades. Similar to the cropland fires, low latitude forest fires also decreased (but not significantly) during 2012–2020. However, the number of forest fires at high latitudes (north of 60°N) increased dramatically (Figure 5). Compared to 2003–2011, forest fire counts doubled (increasing by ~118%) from 60 to 65°N, and tripled (increasing by ~241%) north of 65°N during 2012–2020. This increase occurred mainly in the summer. Grassland fires at low and high latitudes also exhibited contrasting changes, with significant decreases of 45% at 50–55°N and 63% at 55–60°N, and a significant increase of 175% north of 65°N. The significant decrease in grassland fires occurred mainly during the spring and autumn.
3.3. Long-Term Wildfire Trends in NEA
The long-term fire count trend is critical for understanding the changing characteristics of wildfires in the NEA. Using the Mann-Kendall test method, we determined and mapped the pixel-level non-parametric trends of fire counts from 2003 to 2020. Figure 6 shows the pixel-level Z scores of the Mann-Kendall tests on aggregated annual and seasonal fire counts from 2003 to 2020. The percentages of pixels with over 90% confidence levels on different land cover types were also calculated (shown on the right in Figure 6).
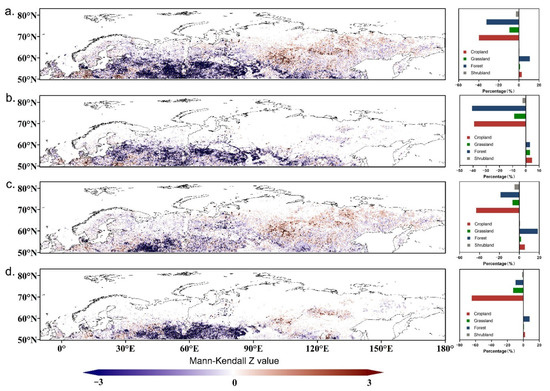
Figure 6.
Spatial distributions of annual (a), spring (b), summer (c), and autumn (d) non-parametric statistical trends in fire count from 2003 to 2020. Pixels marked with black dots indicate trends with 90% confidence levels. Percentages of pixels with 90% confidence levels are shown on the right.
Overall, the satellite observations illustrate that wildfires in NEA changed in a differentiated spatial pattern over the past 20 years (Figure 6a). Decreases in wildfires accounted for 85% of the areas with significant statistical trends, and only 15% had significant increasing trends. Most of the significant wildfire decreases occurred in the southwestern part of NEA, with 40% in croplands and 32% in boreal forests. This significant decrease in cropland fires is somewhat consistent with previous findings stating that increased anthropogenic activity led to a dramatic decline in burned areas in this region during the past two decades [28,29,30]. The decrease in cropland fires were significant throughout all fire seasons (Figure 6b–d). The dramatic reduction in forest fires also made a considerable contribution to the overall decrease in wildfires throughout the southwestern NEA. The significant decrease in forest fires mainly occurred during the spring and early summer (Figure 6b,c). However, widespread areas of the northeastern NEA exhibited significant increase in fire counts, which were concentrated on the Central Siberia Plateau and extended northward to the Arctic Ocean. Forest fires play a predominant role in the increasing number of wildfires in the southwestern NEA, and contribute 72% of the total area with significant increasing trends throughout the entire NEA. Increased wildfire counts in boreal forests mainly occurred during the summer and early autumn (Figure 6c,d). The significant increase in fire counts in far northern Siberia indicate that wildfires shifted northward during the past two decades, which confirms the simulated increased wildfire risk in this region [23].
The detailed time series and linear changes in NEA wildfires in different land cover types, latitudinal zones, and seasons were further analyzed, and shown in Figure 7 and Table 2. The long-term changes in NEA fire counts agreed with the results of decadal wildfire changes, suggesting that cropland fires decreased significantly at rate of 4.52% per year (3.93–5.33% in different zones or seasons) during 2003 to 2020. In compassion to that in the early 21st century (mean fire counts from 2003 to 2005), the cropland wildfires in NEA decreased by 81%. Further, the reductions in cropland fires during the spring and autumn were crucial for the total decrease in NEA wildfires. The spatially contrasting changes in NEA wildfires can be attributed mainly to the opposing forest fire trends in different latitudinal zones and seasons. The statistical results demonstrated that forest fires over north of 60°N increased by 200% at significant rates of over 10% per year, but decreased steadily at lower latitudes (50–60°N). The forest fires also exhibited contrasting changes during the spring and summer. In comparison to that in the early 21st century, the NEA forest fire decreased by 84% in spring, but increased by 122% in summer during 2003 to 2020. Similar to boreal forests, grassland fires also showed significant contrasting spatial changes at high and low latitudes and seasonal changes during the spring and summer. It is worth noting that the contrasting changes in wildfires during the past two decades have led to significant structural adjustments in NEA wildfire composition. As shown in Figure 7a, in the early 21st century, forest fires and cropland fires contributed almost as such (~40%) to the NEA wildfires. Whereas in the recent years, forest fires, contributing over 60% of the total fire counts, have become the predominant component of the NEA wildfires. Cropland fires only account for about 20% of the total fire counts in NEA.
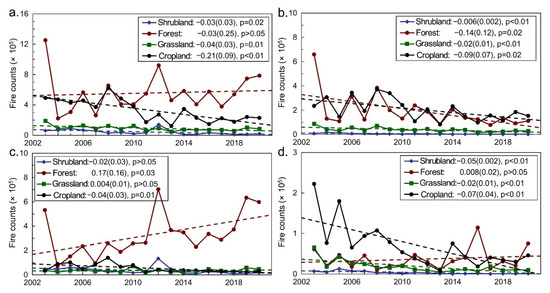
Figure 7.
Time series and linear trends of NEA fire counts ignited on different land covers from 2003 to 2020. Panel (a) is the total annual fire counts; (b–d) are the fire counts occurred in spring, summer, and autumn, respectively.

Table 2.
Statistical linear trends of fire counts in different land cover types, latitudinal zones, and seasons during 2003 to 2020.
3.4. Contrasting Changes in Wildfires in Two Specific Sub-Regions
Based on the spatial distribution of wildfire changes, the southwestern (50–60°N, 35–95°E) and northeastern (55–70°N, 95–155°E) NEA were selected as representative regions to explore their contrasting statistical changes (Figure 8 and Table 3). The statistical results demonstrate that the fire counts in the southwestern NEA decreased by ~90% from 2003 to 2020 at a significant rate of −0.29(±0.12) × 105 per year, and with significant negative linear trends for all seasons and land cover types. Cropland fires contributed over 66% of the total fire count decreases with an arboreal proportion of ~32% in the southwestern NEA. In addition, nearly half of the decreased wildfire counts occurred during the spring. Whereas in northeastern NEA, fire counts increased significantly at a rate of 0.23(±0.12) × 105 per year, which means in compassion to that in the early 21st century (1.40 × 10⁵, mean fire counts from 2003 to 2005), about 292% more fire counts were newly ignited from 2003 to 2020. And the newly ignited wildfires mainly occurred in boreal forests, which contributed ~97% of the total increased fire counts in northeastern NEA. This increased number of wildfires may have led to serious environmental, ecological, and atmospheric consequences in NEA [2,8,10,51,52,53].
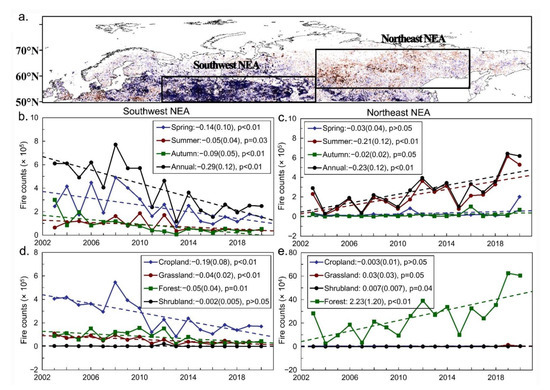
Figure 8.
Statistical variations in wildfire counts in the southwestern and northeastern NEA. (a) Locations of the two sub-regions. (b,d) inter-annual variations in active fire counts in southwestern NEA for different seasors and land cover types, respectively; (c,e) Inter-annual variations in active fire counts in northeastern NEA for different seasons and land cover types, respectively.

Table 3.
Proportions of land cover types and changes in fire counts in southwestern and northeastern NEA.
4. Discussion
The contrasting changes in NEA wildfires during the past two decades have led to considerable structural alternation in the wildfire composition in the Arctic. Cropland fire counts in NEA decreased by 81% during 2003 to 2020, which in turn resulted in the reduction of the proportion of cropland wildfire in NEA from ~40% in early 21st century to less than 20% in recent years. But meanwhile, more forest fires have begun to emerge in the far north area of Eurasia, the fire counts in northeastern NEA even increased by ~292% during 2003 to 2020. As a result, forest fires have become the predominant component of the NEA wildfires recently, contributing over 60% of the total fire counts. The contrasting changes in NEA fire counts also indicated that wildfires in Eurasia were shifting northward, which is consistent with the simulated increase of wildfire risk in the Arctic [23].
These findings also demonstrated that human-driven wildfires in boreal ecosystems decreased dramatically, which was conductive to reduce carbon and aerosol emissions in NEA. However, the increased forest fires in the far north would release large amounts of extra emissions to the atmosphere. These emissions might be further transported to the Arctic Ocean and cause considerable feedbacks to Arctic climate [8,14,49,52,53,54]. It has been suggested that Arctic amplification may promote a more favorable environment for wildfires [16,17,18], increase the fuel availability [20,21], and lead to more ignition activity [2,19] in the Arctic Circle. This implies that the number of wildfires in the Arctic would continue to increase in the coming decades. Thus, increasing wildfire-derived feedbacks to Arctic climate should be seriously considered in climate models and projections.
Regarding the driving forces of the contrasting changes in NEA wildfires, there are series of potential factors refers to wildfire-bearing environment, fuel availability and ignition sources, play certain roles in the variation of wildfires. Based on the recent studies, the dramatical decrease in cropland fires over the southwest NEA is high likely related to the increased anthropogenic activities (such as agricultural expansion and increased grazing) during the past two decades [28,29,30]. But the distinctive increase and northward shifting of the forest fires in the sparsely populated east Siberia are more likely to be related to anomalies of natural forces. Although there is no direct evidence yet, the enhanced warming and drying climate [16,17,18,38], potentially increasing lighting activities [2,19,55,56], and growing fuel availability [20,21,22], are all underlying important driving forces of the observed increase of forest wildfires in northeast NEA. More observational and simulated in-depth studies are needed to uncover the predominant driving forces of this phenomenon.
5. Conclusions
Wildfires play a predominant role in disturbing and reshaping the boreal ecosystem and climate system by altering the vegetation coverage, carbon budget and atmospheric stability. It was suggested that, driven by the enhanced warming and drying climate, the potentially increasing lighting activities, and the growing fuel availability, wildfire risks in NEA have dramatically increased over the past decades, and was projected to continually increase in the coming decades under all kinds of climate-forcing scenarios. Given the potentially considerable and widespread impacts, boreal wildfires have become an increasing concern to the science community in recent years. Although some efforts have been taken to uncover the changes in wildfires over NEA, there are still significant inconsistencies existing in understanding of these issues among different studies. Thus, it’s necessary to perform a comprehensive study to determine the factual changes in wildfires in NEA, and reconcile the differences among different studies.
In this study, we systematically determined the spatiotemporal changes in wildfire counts in NEA from 2003 to 2020 using a reconstructed MODIS active fire product. We found that wildfires in NEA changed with contrasting modes for different latitudes, land cover types, and seasons. The main results of this our analysis can be summarized as follows:
- (1)
- Wildfires ignited on cropland at low latitudes (50–60°N), considerably decreased by 81% from 2003 to 2020. Whereas forest wildfires ignited at high latitudes (north of 60°N) have nearly tripled (increasing at rate of 11~13% per year) during the study period.
- (2)
- Two specific sub-regions, the southwestern and northeastern NEA, were further selected and analyzed to determine the detailed contrasting changes in fire counts throughout NEA. The fire counts in southwestern NEA decreased by approximately 90% at a significant rate of −0.29(±0.12) × 105 per year, of which over 66% were cropland fires. However, the fire counts in northeastern NEA increased significantly at a rate of 0.23(±0.12) × 105 per year, of which ~97% occurred in boreal forests. In compassion to that in the early 21st century, nearly three times (~292%) more fire counts were newly ignited in northeastern NEA during the past two decades.
- (3)
- As a result, the wildfire structure in NEA changed fundamentally. With a proportion of over 60%, forest fires have become the leading component in NEA wildfires in recent years. The structural alternation of NEA wildfires may have profound implications on the Arctic ecosystem and climate.
Author Contributions
Y.C. designed and led the study; J.T., Y.C., X.C. and F.C. carried out the data analysis, Y.C., J.T. and X.C. wrote the manuscript. All authors have read and agreed to the published version of the manuscript.
Funding
This study is partially supported by the National Key Research and Development Program of China (Grant No. 2021YFE0117700-2, and 2020YFC1511601).
Data Availability Statement
The MODIS Thermal Anomalies/Fire products are openly available in NASA’s Land Processes Distributed Active Archive Center (LP DAAC) located at the USGS Earth Resources Observation and Science (EROS) Center at https://earthdata.nasa.gov/ (accessed on 1 August 2022). The land cover product was provided by the ESA CCI-LC (Climate Change Initiative Land Cover) project at https://www.esa-landcover-cci.org/ (accessed on 1 August 2022).
Conflicts of Interest
The authors declare no conflict of interest.
References
- García-Lázaro, J.; Moreno-Ruiz, J.; Riaño, D.; Arbelo, M. Estimation of Burned Area in the Northeastern Siberian Boreal Forest from a Long-Term Data Record (LTDR) 1982–2015 Time Series. Remote Sens. 2018, 10, 940. [Google Scholar] [CrossRef]
- Chen, Y.; Romps, D.M.; Seeley, J.T.; Veraverbeke, S.; Riley, W.J.; Mekonnen, Z.A.; Randerson, J.T. Future increases in Arctic lightning and fire risk for permafrost carbon. Nat. Clim. Chang. 2021, 11, 404–410. [Google Scholar] [CrossRef]
- Walker, X.J.; Baltzer, J.L.; Cumming, S.G.; Day, N.J.; Ebert, C.; Goetz, S.; Johnstone, J.F.; Potter, S.; Rogers, B.M.; Schuur, E.A.G.; et al. Increasing wildfires threaten historic carbon sink of boreal forest soils. Nature 2019, 572, 520–523. [Google Scholar] [CrossRef] [PubMed]
- Davis, K.T.; Dobrowski, S.Z.; Higuera, P.E.; Holden, Z.A.; Veblen, T.T.; Rother, M.T.; Parks, S.A.; Sala, A.; Maneta, M.P. Wildfires and climate change push low-elevation forests across a critical climate threshold for tree regeneration. Proc. Natl. Acad. Sci. USA 2019, 116, 6193–6198. [Google Scholar] [CrossRef]
- Hoy, E.E.; Turetsky, M.R.; Kasischke, E.S. More frequent burning increases vulnerability of Alaskan boreal black spruce forests. Environ. Res. Lett. 2016, 11, 095001. [Google Scholar] [CrossRef]
- Stevens-Rumann, C.S.; Kemp, K.B.; Higuera, P.E.; Harvey, B.J.; Rother, M.T.; Donato, D.C.; Morgan, P.; Veblen, T.T. Evidence for declining forest resilience to wildfires under climate change. Ecol. Lett. 2018, 21, 243–252. [Google Scholar] [CrossRef]
- Loehman, R.A. Drivers of wildfire carbon emissions. Nat. Clim. Chang. 2020, 10, 1070–1071. [Google Scholar] [CrossRef]
- Mack, M.C.; Bret-Harte, M.S.; Hollingsworth, T.N.; Jandt, R.R.; Schuur, E.A.; Shaver, G.R.; Verbyla, D.L. Carbon loss from an unprecedented Arctic tundra wildfire. Nature 2011, 475, 489–492. [Google Scholar] [CrossRef]
- Mack, C.M.; Walker, J.X.; Johnstone, F.J.; Alexander, D.H. Carbon loss from boreal forest wildfires offset by increased dominance of deciduous trees. Science 2021, 372, 280–283. [Google Scholar] [CrossRef]
- Gibson, C.M.; Chasmer, L.E.; Thompson, D.K.; Quinton, W.L.; Flannigan, M.D.; Olefeldt, D. Wildfire as a major driver of recent permafrost thaw in boreal peatlands. Nat. Commun. 2018, 9, 3041. [Google Scholar] [CrossRef] [Green Version]
- Schuur, E.A.; McGuire, A.D.; Schadel, C.; Grosse, G.; Harden, J.W.; Hayes, D.J.; Hugelius, G.; Koven, C.D.; Kuhry, P.; Lawrence, D.M.; et al. Climate change and the permafrost carbon feedback. Nature 2015, 520, 171–179. [Google Scholar] [CrossRef]
- Bonan, G.B. Forests and climate change: Forcings, feedbacks, and the climate benefits of forests. Science 2008, 320, 1444–1449. [Google Scholar] [CrossRef]
- Liu, Z.; Ballantyne, A.P.; Cooper, L.A. Biophysical feedback of global forest fires on surface temperature. Nat. Commun. 2019, 10, 214. [Google Scholar] [CrossRef]
- Schmale, J.; Zieger, P.; Ekman, A.M.L. Aerosols in current and future Arctic climate. Nat. Clim. Chang. 2021, 11, 95–105. [Google Scholar] [CrossRef]
- Winiger, P.; Andersson, A.; Eckhardt, S.; Stohl, A. Siberian Arctic black carbon sources constrained by model and observation. Proc. Natl. Acad. Sci. USA 2017, 114, E1054–E1061. [Google Scholar] [CrossRef]
- Cao, Y.; Liang, S. Recent advances in driving mechanisms of the Arctic amplification: A review. Chin. Sci. Bull. 2018, 63, 2757–2774. [Google Scholar] [CrossRef]
- Post, E.; Alley, R.B.; Christensen, T.R.; Macias-Fauria, M.; Forbes, B.C.; Gooseff, M.N.; Iler, A.; Kerby, J.T.; Laidre, K.L.; Mann, M.E.; et al. The polar regions in a 2 °C warmer world. Sci. Adv. 2019, 5, eaaw9883. [Google Scholar] [CrossRef]
- Yuan, W.; Zheng, Y.; Piao, S.; Ciais, P.; Lombardozzi, D.; Wang, Y.; Ryu, Y.; Chen, G.; Dong, W.; Hu, Z.; et al. Increased atmospheric vapor pressure deficit reduces global vegetation growth. Sci. Adv. 2019, 5, eaax1396. [Google Scholar] [CrossRef]
- Veraverbeke, S.; Rogers, B.M.; Goulden, M.L.; Jandt, R.R.; Miller, C.E.; Wiggins, E.B.; Randerson, J.T. Lightning as a major driver of recent large fire years in North American boreal forests. Nat. Clim. Chang. 2017, 7, 529–534. [Google Scholar] [CrossRef]
- Park, H.; Jeong, S.; Penuelas, J. Accelerated rate of vegetation green-up related to warming at northern high latitudes. Glob. Change Biol. 2020, 26, 6190–6202. [Google Scholar] [CrossRef]
- Walker, X.J.; Rogers, B.M.; Veraverbeke, S.; Johnstone, J.F.; Baltzer, J.L.; Barrett, K.; Bourgeau-Chavez, L.; Day, N.J.; de Groot, W.J.; Dieleman, C.M.; et al. Fuel availability not fire weather controls boreal wildfire severity and carbon emissions. Nat. Clim. Chang. 2020, 10, 1130–1136. [Google Scholar] [CrossRef]
- Park, W.; Latif, M. Multidecadal and multicentennial variability of the meridional overturning circulation. Geophys. Res. Lett. 2008, 35, L22703. [Google Scholar] [CrossRef]
- Justino, F.; Bromwich, D.; Wilson, A.; Silva, A.; Avila-Diaz, A.; Fernandez, A.; Rodrigues, J. Estimates of temporal-spatial variability of wildfire danger across the Pan-Arctic and extra-tropics. Environ. Res. Lett. 2021, 16, 044060. [Google Scholar] [CrossRef]
- de Groot, W.J.; Flannigan, M.D.; Cantin, A.S. Climate change impacts on future boreal fire regimes. For. Ecol. Manag. 2013, 294, 35–44. [Google Scholar] [CrossRef]
- Flannigan, D.M.; Krawchuk, A.M.; de Groot, W.J.; Wotton, B.M.; Gowman, M.L. Implications of changing climate for global wildland fire. Int. J. Wildland Fire 2009, 18, 483–507. [Google Scholar] [CrossRef]
- Liu, Z.; Yang, J.; Chang, Y.; Weisberg, P.J.; He, H.S. Spatial patterns and drivers of fire occurrence and its future trend under climate change in a boreal forest of Northeast China. Glob. Chang. Biol. 2012, 18, 2041–2056. [Google Scholar] [CrossRef]
- Young, A.M.; Higuera, P.E.; Duffy, P.A.; Hu, F.S. Climatic thresholds shape northern high-latitude fire regimes and imply vulnerability to future climate change. Ecography 2017, 40, 606–617. [Google Scholar] [CrossRef]
- Andela, N.; Morton, D.C.; Giglio, L.; Chen, Y.; van der Werf, G.R.; Kasibhatla, P.S.; DeFries, R.S.; Collatz, G.J.; Hantson, S.; Kloster, S.; et al. A human-driven decline in global burned area. Science 2017, 356, 1356–1362. [Google Scholar] [CrossRef]
- Hao, W.M.; Petkov, A.; Nordgren, B.L.; Corley, R.E.; Silverstein, R.P.; Urbanski, S.P.; Evangeliou, N.; Balkanski, Y.; Kinder, B.L. Daily black carbon emissions from fires in northern Eurasia for 2002–2015. Geosci. Model Dev. 2016, 9, 4461–4474. [Google Scholar] [CrossRef]
- Hao, W.M.; Reeves, M.C.; Baggett, L.S.; Balkanski, Y.; Ciais, P.; Nordgren, B.L.; Petkov, A.; Corley, R.E.; Mouillot, F.; Urbanski, S.P.; et al. Wetter environment and increased grazing reduced the area burned in northern Eurasia from 2002 to 2016. Biogeosciences 2021, 18, 2559–2572. [Google Scholar] [CrossRef]
- Kharuk, V.I.; Ponomarev, E.I. Spatiotemporal characteristics of wildfire frequency and relative area burned in larch-dominated forests of Central Siberia. Russ. J. Ecol. 2017, 48, 507–512. [Google Scholar] [CrossRef]
- Kharuk, V.I.; Ponomarev, E.I.; Ivanova, G.A.; Dvinskaya, M.L.; Coogan, S.C.P.; Flannigan, M.D. Wildfires in the Siberian taiga. Ambio 2021, 50, 1953–1974. [Google Scholar] [CrossRef]
- Ponomarev, E.; Kharuk, V.; Ranson, K. Wildfires Dynamics in Siberian Larch Forests. Forests 2016, 7, 125. [Google Scholar] [CrossRef]
- Bondur, V.G.; Mokhov, I.I.; Voronova, O.S.; Sitnov, S.A. Satellite Monitoring of Siberian Wildfires and Their Effects: Features of 2019 Anomalies and Trends of 20-Year Changes. Dokl. Earth Sci. 2020, 492, 370–375. [Google Scholar] [CrossRef]
- Gonard, S.G.; Ponomarev, E. Fire in the North: The 2020 Siberian fire season. Wildfire 2020, 29, 26–32. [Google Scholar]
- McCarty, J.L.; Smith, T.E.; Turetsky, M.R. Arctic fires re-emerging. Nat. Geosci. 2020, 13, 658–660. [Google Scholar] [CrossRef]
- Tomshin, O.; Solovyev, V. Spatio-temporal patterns of wildfires in Siberia during 2001–2020. Geocarto Int. 2021, 1–19. [Google Scholar] [CrossRef]
- Wang, Y.-R.; Hessen, D.O.; Samset, B.H.; Stordal, F. Evaluating global and regional land warming trends in the past decades with both MODIS and ERA5-Land land surface temperature data. Remote Sens. Environ. 2022, 280, 113181. [Google Scholar] [CrossRef]
- Justice, C.O.; Giglio, L.; Korontzi, S.; Owens, J.; Morisette, J.T.; Roy, D.; Descloitres, J.; Alleaume, S.; Petitcolin, F.; Kaufman, Y. The MODIS fire products. Remote Sens. Environ. 2002, 83, 244–262. [Google Scholar] [CrossRef]
- Giglio, L.; Schroeder, W.; Justice, C.O. The collection 6 MODIS active fire detection algorithm and fire products. Remote Sens. Environ. 2016, 178, 31–41. [Google Scholar] [CrossRef]
- Csiszar, I.A.; Morisette, J.T.; Giglio, L. Validation of active fire detection from moderate-resolution satellite sensors: The MODIS example in northern eurasia. IEEE Trans. Geosci. Remote Sens. 2006, 44, 1757–1764. [Google Scholar] [CrossRef]
- Fusco, E.J.; Finn, J.T.; Abatzoglou, J.T.; Balch, J.K.; Dadashi, S.; Bradley, B.A. Detection rates and biases of fire observations from MODIS and agency reports in the conterminous United States. Remote Sens. Environ. 2019, 220, 30–40. [Google Scholar] [CrossRef]
- Schroeder, W.; Prins, E.; Giglio, L.; Csiszar, I.; Schmidt, C.; Morisette, J.; Morton, D. Validation of GOES and MODIS active fire detection products using ASTER and ETM+ data. Remote Sens. Environ. 2008, 112, 2711–2726. [Google Scholar] [CrossRef]
- ESA. Land Cover CCI Product User Guide Version 2; ESA: Paris, France, 2017. [Google Scholar]
- Pekel, J.-F.; Cottam, A.; Gorelick, N.; Belward, A.S. High-resolution mapping of global surface water and its long-term changes. Nature 2016, 540, 418–422. [Google Scholar] [CrossRef]
- Reinhart, V.; Fonte, C.C.; Hoffmann, P.; Bechtel, B.; Rechid, D.; Boehner, J. Comparison of ESA climate change initiative land cover to CORINE land cover over Eastern Europe and the Baltic States from a regional climate modeling perspective. Int. J. Appl. Earth Obs. Geoinf. 2021, 94, 102221. [Google Scholar] [CrossRef]
- Yang, Y.; Xiao, P.; Feng, X.; Li, H. Accuracy assessment of seven global land cover datasets over China. ISPRS J. Photogramm. Remote Sens. 2017, 125, 156–173. [Google Scholar] [CrossRef]
- Glushkov, I.; Zhuravleva, I.; McCarty, J.L.; Komarova, A.; Drozdovsky, A.; Drozdovskaya, M.; Lupachik, V.; Yaroshenko, A.; Stehman, S.V.; Prishchepov, A.V. Spring fires in Russia: Results from participatory burned area mapping with Sentinel-2 imagery. Environ. Res. Lett. 2021, 16, 125005. [Google Scholar] [CrossRef]
- Warneke, C.; Bahreini, R.; Brioude, J.; Brock, C.A.; de Gouw, J.A.; Fahey, D.W.; Froyd, K.D.; Holloway, J.S.; Middlebrook, A.; Miller, L.; et al. Biomass burning in Siberia and Kazakhstan as an important source for haze over the Alaskan Arctic in April 2008. Geophys. Res. Lett. 2009, 36, L02813. [Google Scholar] [CrossRef]
- Kim, J.-S.; Kug, J.-S.; Jeong, S.-J.; Park, H.; Gabriela, S.-S. Extensive fires in southeastern Siberian permafrost linked to preceding Arctic Oscillation. Sci. Adv. 2020, 6, eaax3308. [Google Scholar] [CrossRef]
- Heim, R.J.; Bucharova, A.; Rieker, D.; Yurtaev, A.; Kamp, J.; Hölzel, N. Long-term effects of fire on Arctic tundra vegetation in Western Siberia. bioRxiv 2019, 756163. [Google Scholar] [CrossRef]
- Kukavskaya, E.A.; Buryak, L.V.; Shvetsov, E.G.; Conard, S.G.; Kalenskaya, O.P. The impact of increasing fire frequency on forest transformations in southern Siberia. For. Ecol. Manag. 2016, 382, 225–235. [Google Scholar] [CrossRef]
- Law, K.S.; Stohl, A.; Quinn, P.K.; Brock, C.A.; Burkhart, J.F.; Paris, J.-D.; Ancellet, G.; Singh, H.B.; Roiger, A.; Schlager, H.; et al. Arctic Air Pollution: New Insights from POLARCAT-IPY. Bull. Am. Meteorol. Soc. 2014, 95, 1873–1895. [Google Scholar] [CrossRef]
- Liu, Z.; Ballantyne, A.P.; Cooper, L.A. Increases in Land Surface Temperature in Response to Fire in Siberian Boreal Forests and Their Attribution to Biophysical Processes. Geophys. Res. Lett. 2018, 45, 6485–6494. [Google Scholar] [CrossRef]
- Coogan, S.C.P.; Cai, X.; Jain, P.; Flannigan, M.D. Seasonality and trends in human- and lightning-caused wildfires ≥ 2 ha in Canada, 1959–2018. Int. J. Wildland Fire 2020, 29, 473. [Google Scholar] [CrossRef]
- Hessilt, T.D.; Abatzoglou, J.T.; Chen, Y.; Randerson, J.T.; Scholten, R.C.; van der Werf, G.; Veraverbeke, S. Future increases in lightning ignition efficiency and wildfire occurrence expected from drier fuels in boreal forest ecosystems of western North America. Environ. Res. Lett. 2022, 17, 054008. [Google Scholar] [CrossRef]
Publisher’s Note: MDPI stays neutral with regard to jurisdictional claims in published maps and institutional affiliations. |
© 2022 by the authors. Licensee MDPI, Basel, Switzerland. This article is an open access article distributed under the terms and conditions of the Creative Commons Attribution (CC BY) license (https://creativecommons.org/licenses/by/4.0/).