Technical Note

Modeling Evapotranspiration at Larger Temporal Scales: Effects of Temporal Aggregation and Data Gaps

1
Department of Civil Engineering, Indian Institute of Technology Bombay, Mumbai 400076, India
2
Interdisciplinary Program in Climate Studies, Indian Institute of Technology Bombay, Mumbai 400076, India
3
CESBIO, Université de Toulouse, CNES, CNRS, IRD, UPS, INRAE, 31401 Toulouse, France
4
Space Applications Centre (ISRO), Ahmedabad 380015, India
*
Author to whom correspondence should be addressed.
Remote Sens. 2022, 14(17), 4142; https://doi.org/10.3390/rs14174142
Submission received: 9 July 2022 / Revised: 27 July 2022 / Accepted: 19 August 2022 / Published: 23 August 2022
(This article belongs to the Special Issue Remote Sensing-Based Evapotranspiration Models)

Abstract

:
Evapotranspiration (ET) at weekly and monthly time scales is often needed for various applications. When using remote sensing (RS)-based models, this can be achieved either by averaging all the required input variables to the intended time scale and simulating ET using models (input aggregation), or by estimating daily ET from the models and averaging to weekly or monthly ET (output aggregation). It is not clear if both these aggregation approaches yield the same outcome when using RS-based models for the estimation of ET. Another issue in obtaining ET at longer time scales is the lack of enough satellite observations to estimate ET with reasonable accuracy. This study aimed to compare the input and output aggregation approaches to obtain ET at weekly and monthly time scales using three RS ET models, namely, Priestley–Taylor Jet Propulsion Lab (PT-JPL), Soil Plant Atmosphere and Remote Sensing Evapotranspiration (SPARSE), and Surface Temperature Initiated Closure (STIC) models. The study was conducted using in situ data over six sites of different agro-climatic conditions in India, Tunisia, and France. The results indicate that the input aggregation provided relatively better results for monthly and weekly ET values than the output aggregation, having a lower RMSE (1–40%). Further, it was found that at least seven to eight satellite observations per month are required to obtain reliable ET estimate when using RS-based models.

1. Introduction

In recent times, many evapotranspiration (ET) models have been developed that use remote sensing (RS) data for modeling ET over large regions [1]. The RS-based models can be broadly classified into land surface temperature (LST)-based ET models and conductance-based models [2], which are primarily based on the Penman–Monteith (PM) equation and its variations. The difficulties in estimating the surface and aerodynamic conductance (or resistance) have led to the development of simpler Priestley–Taylor (PT) equation-based models. Models based on PM and PT equations primarily use meteorological inputs and vegetation information obtained from visible, Near Infrared (NIR) and Shortwave Infrared bands (SWIR). The LST-based models provide instantaneous values of ET (or latent heat flux, λE, i.e., ET expressed in energy units, W m−2) estimated at the time of satellite observation. This instantaneous ET is converted into daily ET using the self-preservation of the ratio of ET to a reference variable [3].
The commonly used reference variables are the net available energy (the difference between net radiation, Rn, and soil heat flux, G), incoming surface solar radiation (Rg), solar radiation at the top of the atmosphere, reference evapotranspiration, etc. The literature is rich with studies that compare different scaling factors to convert this instantaneous ET into daily ET [4,5,6,7,8,9,10,11,12,13]. Ryu et al. [5] developed scaling equations to obtain 8-day averaged ET by combining the multiple instantaneous ET in an 8-day period. For many applications, ET measured at weekly and monthly temporal scales are required. When LST-based models are used, often the daily ET is estimated first and then averaged to the required longer time scales. During this temporal averaging of ET, different gap filling or interpolation techniques may also be used to reduce the effect of lost data due to cloud cover [8,10]. This approach, where ET is estimated at a shorter time scale and then aggregated to longer time scales, is referred in this paper as ‘output aggregation’.
From the PM/PT based models, it is possible to estimate ET at various time scales (from instantaneous to monthly) by aggregating the input datasets and then simulating ET at the necessary temporal scale. For example, the Priestley–Taylor Jet Propulsion Lab (PT-JPL) model has been used to estimate ET at both instantaneous [14] and monthly time scales [15]. The approach where all the independent input variables are aggregated to the required time scale and then model simulations are carried out to estimate ET is referred to as ‘input aggregation’. It is not clear if there are any differences in the ET estimated using the two temporal aggregation approaches when using different models. The issue of aggregation in the spatial domain (i.e., upscaling ET from finer to coarser spatial resolutions) has been discussed in detail in previous studies [16,17,18]. There exists a plethora of studies that compared different scaling factors for upscaling instantaneous ET to daily ET. However, it is hard to determine from the literature if input or output aggregation should be used to estimate ET at weekly or monthly scales (i.e., temporal aggregation). The major aim of this study is to compare the input and output aggregation approaches to determine which yields better results in modeling ET at weekly and monthly scales using different remote sensing models.
Three ET models, namely, the Soil Plant Atmosphere and Remote Sensing Evapotranspiration (SPARSE, [19]), PT-JPL, [15], and Surface Temperature Initiated Closure (STIC, [20]) models, were evaluated over six sites under different agro-climatic conditions. Of these, SPARSE is a surface energy balance-based model in which LST is the primary input. The SPARSE model has two variants—layer and patch—corresponding to series and parallel configurations of surface resistances, respectively. Both the layer and the patch configurations are tested in this study. The STIC model solves the Penman–Monteith equation using LST, indicating its hybrid nature that integrates the principles of both conductance-based and LST-based models. Finally, the PT-JPL model was selected as it is one of the most widely used model, with input data requirements that are similar to those of conductance-based models.
Another issue in RS-based ET modeling is the non-availability of data due to cloud cover. Alfieri et al. [9] and Guillevic et al. [10] demonstrated that errors in ET will increase with the increasing number of days in which data is not available. These studies have used ground observations for the analysis. During practical applications, remote sensing models are used for ET estimation and each model may respond differently to missing data. Hence, the second objective of the work is to understand the effect of the lack of data on the accuracy of ET simulated by these three models.

2. Materials and Methods

2.1. Study Area

The study was conducted over six sites: one site in North Africa, two sites in France, and three in India, as shown in Figure 1. The sites have different crops, such as wheat, millet, rice, and grass, and belong to different climatic zones. The data used for each site had a duration of at least six months. The details of the sites are given in Table 1.

2.2. Description of Datasets

Over the site in Tunisia, the surface radiometric temperature was measured using a nadir-looking Apogee thermal radiometer and the energy fluxes were measured with Campbell™ CSAT sonic anemometers and Krypton fast-response hygrometers. The energy budget closure was forced, and λE was estimated as the residual [19]. In the Auradé site, surface radiometric temperature was measured using a precision infrared temperature sensor (IRTS-P, Campbell Scientific Inc., Logan, UT, USA) at 2.8 m above the ground. In Lamasquère, it was estimated from upwelling longwave radiation measured by a 4-component net radiometer at 3.65 m above the ground [21]. The Eddy Covariance system in both Auradé and Lamasquère sites consisted of a three-dimensional sonic anemometer (CSAT 3, Campbell Scientific Inc, Logan, UT, USA) and an open-path infrared gas analyzer (LI 7500, LiCor, Lincoln, NE, USA) [23]. For the Auradé and Lamasquère sites, the energy budget closure was about 78–94% and 71% respectively (Dare-Idowu et al., 2021, [24]. For the three sites given above, LAI was estimated using hemispherical photography every 2 to 3 weeks depending on the phenological cycle and validated by destructive measurements during different stages. The crop height was also measured during the same days as those of LAI observations [25]. Over the three sites in India, the EC150 IRGASON system (Campbell Scientific Inc., Logan, UT, USA) was installed at 8 m above the ground for observing CO2 and H2O fluxes and the net radiation was measured using Kipp & Zonen CNR4 net radiometers. Over these sites, the soil heat flux was not measured and, thus, it was computed as the residual of the surface energy balance (i.e., Rn–λE–H). Surface radiometric temperature was estimated from the net radiometer observations. From the IRGASON system, raw data were archived at 20 Hz and processed using EddyPro® Flux Software with an averaging time interval of 15 min for all EC flux calculations [22]. Over the three sites in India, crop height was observed once every 15 days and was used in the study. Field-measured LAI was not available over these three sites, and hence it was obtained from MODIS data. In all the sites except Tunisia, observed λE uncorrected for energy budget closure was used in this study.

2.3. Brief Description of the Models

2.3.1. Priestley–Taylor Jet Propulsion Lab (PT-JPL)

Fisher et al. [15] developed a three-source model that partitions ET into canopy transpiration (λEv), soil evaporation (λEs), and interception evaporation (λEi) based on the PT equation. First, the PT equation is used to estimate the potential value of each component and then, based on plant physiological status and soil moisture availability, the potential ET is reduced to actual ET. The model requires five inputs: net radiation (Rn), Normalized Difference Vegetation Index (NDVI), Soil Adjusted Vegetation Index (SAVI), maximum air temperature, and vapor pressure. The plant physiological factors that are used to reduce potential canopy transpiration to the actual value are LAI, actively transpiring green fraction of canopy (fg), plant temperature constraint (fT), and plant moisture constraint (fM). LAI is calculated from fractional vegetation cover (fc), which is assumed to be equal to the light intercepted by vegetation fraction (fIPAR), which in turn is estimated as a linear function of NDVI. fg is calculated as the ratio of light absorbed by vegetation fraction (fAPAR) to fIPAR, by estimating fAPAR as a linear function of SAVI. fT is estimated from maximum air temperature. fM is estimated as the relative change in light absorptance assuming that light absorptance varies with moisture stress. Potential soil evaporation is constrained by the soil water deficit index (fSM), calculated from the vapor pressure deficit and relative humidity at midday. The potential value of interception is multiplied by the fraction of time when the surface is wet (fwet), calculated as a power function of relative humidity. The total ET is calculated as the sum of three components. The final equations that are used for the computation are given below:
λ E s = f w e t + f S M   1 f w e t   α   Δ Δ + γ   R n s G
λ E v = 1 f w e t   f g   f T   f M   α   Δ Δ + γ   R n c
λ E i = f w e t   α   Δ Δ + γ   R n c
where λEs, λEv, and λEi are all expressed in W m−2. Rns is net radiation to the soil in W m−2, Rnc is net radiation to the canopy in W m−2, Δ is the slope of the saturation-to-vapor pressure curve, γ is the psychrometric constant (∼0.066 kPa °C−1), and α is the PT coefficient with a value of 1.26 [26].

2.3.2. Soil Plant Atmosphere and Remote Sensing Evapotranspiration (SPARSE)

SPARSE [19] is based on the Two Source Energy Balance (TSEB) model. In TSEB models, it is assumed initially that there is enough water in the root zone for the plant to transpire, and then the model corrects the soil evaporation and transpiration processes iteratively. The model has both layer and patch configurations. In the layer approach, it is assumed that the canopy covers the soil completely and thus there is no direct interaction between the soil surface and the atmospheric reference level, and soil and vegetation fluxes are connected in series. In the patch approach, it is assumed that there is no interaction between soil and vegetation, and that both interact directly with the atmosphere. Five equations, one for each of latent heat flux as the summation of soil and vegetation components, sensible heat flux (H, W m−2) as the summation of soil and vegetation components, energy budget for soil and vegetation, and the link between radiative surface temperature and soil and vegetation temperature, are solved simultaneously to obtain latent heat flux for soil and vegetation. The important equations for the SPARSE-Layer model are given below:
λ E s = ρ a C p γ β S e s a t T S e 0 r a s
λ E v = ρ a C p γ β V e s a t T V e 0 r v v
where βS and βV are the soil evaporation and canopy transpiration efficiencies, respectively; e s a t is the saturation vapor pressure (kPa); r a s and r v v are the soil surface resistance and canopy resistance to latent heat transfer, respectively (m s−1); ρ a is the air density (kg m−3); and Cp is the specific heat capacity of air at constant pressure (J kg−1 K−1). Similarly for the SPARSE-Patch model, the equations are as follows, where r a is aerodynamic resistance:
λ E S = ρ a C p γ β S e s a t T S e 0 r a s + r a
λ E v = ρ a C p γ β V e s a t T V e 0 r v v + r a

2.3.3. Surface Temperature Initiated Closure (STIC)

The STIC [20] model integrates LST into the Penman–Monteith equation for the estimation of H and λE without the need of knowledge of the conductance terms. A set of four equations with four unknowns, aerodynamic conductance ( g B ), stomatal conductance ( g S ), difference between aerodynamic temperature and air temperature ( Δ T ), and evaporative fraction (EF) are solved analytically. Moisture availability (M) is estimated taking into consideration the relationship between temperature and vapor pressure and is used in partitioning ET into its components. The equations given below are solved simultaneously to estimate λE:
g B = R n G   ρ   C p   Δ T + e s e a γ
g S = g B   e s e a   e s * e s
Δ T = e s e a   γ 1 EF EF
EF = 2   α   s   2 s + γ   2 + g B g s
λ E = Δ R n G + ρ a C p g a D a Δ + γ 1 + g a g c

2.4. Methodology

2.4.1. Temporal Aggregation

The in situ data were available at intervals of half an hour; however, to mimic satellite observations, in situ data at two instances (10:30 a.m. and 1:30 p.m.) were only used to force the models. The temporal aggregation experiment was carried out for estimating λE at both weekly and monthly scales. For this study, we used data only during clear-sky days. This was to avoid any effect of intermittent clouds on the aggregation results. Further, this helped in realistically simulating the satellite-based λE estimation as closely as possible. The screening of data for cloudy days is explained in Section 2.4.2.
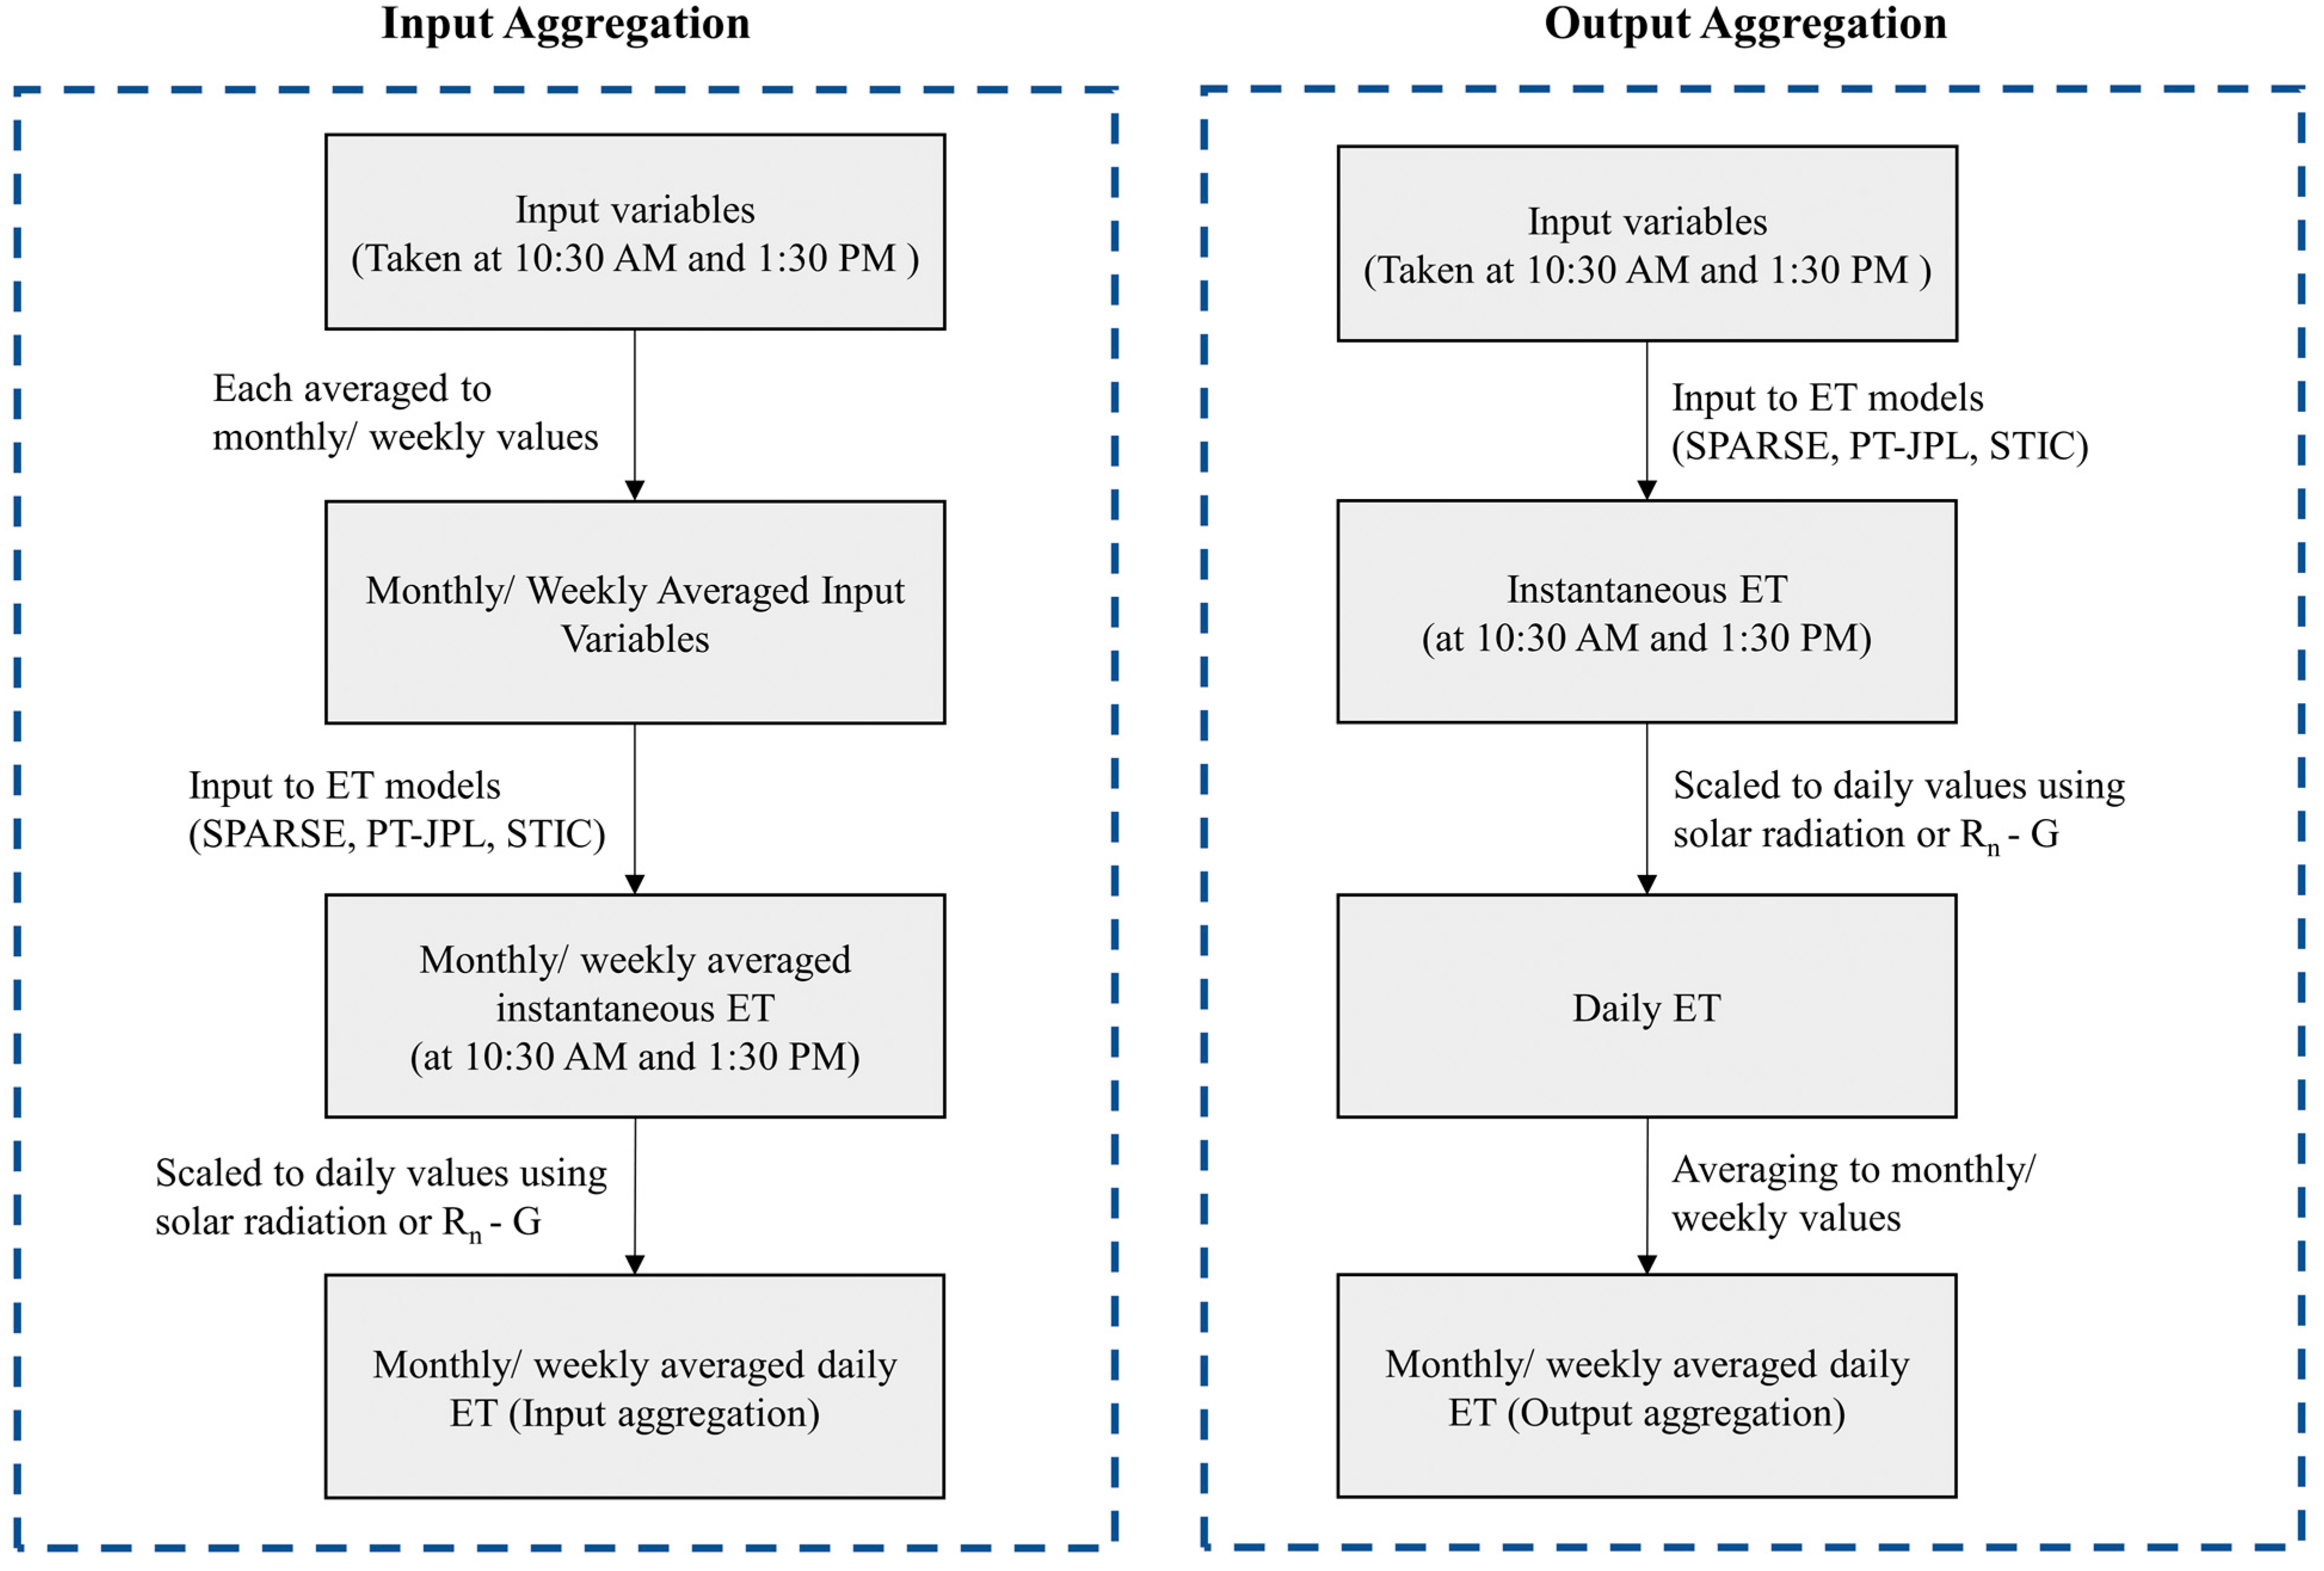
For the input temporal aggregation, all the inputs required by each model that were observed at 10:30 a.m. and 1:30 p.m. were averaged to weekly or monthly scales. Thus, we had two sets of input values per week or month: one corresponding to 10:30 a.m. and another corresponding to 1:30 p.m. These averaged inputs were then passed as inputs to the models to estimate λE corresponding to these two times. For the output temporal aggregation, the model inputs were fed into the model each day to obtain instantaneous λE corresponding to 10:30 a.m. and 1:30 p.m. The obtained outputs were then averaged over a week or month to obtain the corresponding averaged λE. The multi-day averaged instantaneous λE values obtained from both the aggregation approaches were converted to weekly and monthly averaged ET using scaling variables, as presented in Section 2.4.3. The detailed methodology followed for aggregation is illustrated in Figure 2.
The estimated λE values from input and output temporal aggregation were then compared to the reference data. The reference data were obtained by averaging the half-hourly values of in situ λE. First, the in situ observations were averaged to obtain daytime λE, and then this was further averaged to weekly or monthly temporal scales. Daytime was defined as sunlit hours where the incoming solar radiation was greater than zero. The input and output aggregated λE values were compared with the reference data, and results of the comparison were estimated in terms of Root Mean Square Error (RMSE). The aggregation approach having the smaller RMSE was chosen as the better performing one. The SPARSE and PT-JPL models used in this study are multi-source models, which first estimate the components such as soil evaporation and transpiration for calculating the total λE. We also analyzed how the values of individual components change due to different aggregation approaches. No in situ observations were available on the partitioned components of λE. Hence, the ratio of each component of λE to total λE (simulated by the corresponding model), i.e., the ratio of soil evaporation to total λE and transpiration to total λE, were computed using both aggregation approaches. The PT-JPL model is a three-source model and has an interception component. To simplify this, the evaporation component of the PT-JPL model was considered as the sum of interception and evaporation. The ratios obtained from both input and output aggregation were then compared with each other to see if there were any differences in partitioning due to the aggregation approach followed.

2.4.2. Identifying Clear-Sky Days

The clear-sky days were determined based on the ratio of incoming solar radiation measured to the extra-terrestrial solar radiation (Ra), which was computed as per FAO 56 [27]:
R a = 12   60   π   G s c d r ω 2 ω 1 s i n φ s i n δ + c o s φ c o s δ s i n ω 2 s i n   ω 1
where Ra is extra-terrestrial radiation in any given hour (MJ m–2 h−1), Gsc is the solar constant (0.0820 MJ m–2 min−1), dr is the inverse of the relative distance between the Earth and the Sun, δ is the solar declination (rad), φ is latitude in (rad), ω 1 is the solar time angle at the beginning of the hour (rad), and ω 2 is the solar time angle at end of the hour (rad). Ra computed as MJ m–2 h−1 was converted to W m−2 to use it with in situ observed solar radiation. Theoretically, clear-sky radiation was considered to be 75% of Ra as per FAO 56 [27], and Delogu et al. [4] mentioned that, if the measured solar radiation is higher than 85% of the theoretical clear-sky solar radiation, it can be considered to be clear sky. Based on this, data corresponding to days when the ratio of incoming solar radiation to Ra was less than 0.63 (0.75 × 0.85) were considered cloudy and omitted from the dataset and further use.

2.4.3. Instantaneous to Daily ET

In this study, net available energy (Rn–G) and Rg were used as scaling variables to convert instantaneous values of λE into weekly or monthly averaged values. These two scaling factors were adopted as they are two of the most widely used variables in the literature. First, the ratio of multi-day averaged instantaneous λE was divided by multi-day averaged (for the corresponding temporal duration, i.e., weekly or monthly) instantaneous net available energy (Rn–G) or Rg (observed at the corresponding time, i.e., 10:30 a.m. or 1:30 p.m.) to obtain the evaporative fraction (EF) or solar radiation fraction (SR), respectively. Two values of EF and SR were estimated, corresponding to before noon and afternoon conditions. Then, the EF was multiplied with weekly or monthly averaged daytime (Rn–G) and SR was multiplied with weekly or monthly averaged Rg to obtain corresponding temporally aggregated λE.

2.4.4. Effect of Missing Data

As the next part of the analysis, the effect of missing data on the monthly averaged λE was studied. For this, only the best performing temporal aggregation method was used. The number of days in a month for which the data was available was varied between a minimum of 1 day and a maximum of 28 days. It is to be noted that all the months did not have 28 days of data due to the cloudy day screening approach adopted. For such months, the maximum number of days is limited by the actual days of data availability. Of the n days for which data are available in a given month, x number of days (x varied between 1 and n) were selected randomly to estimate ET using the three models. Multiple iterations (50) were carried out to select different combination of x days out of n days. After selecting the data, monthly averaged λE was estimated as given in previous sections and the RMSE was computed. Then, the variation in RMSE with respect to the number of days was analyzed.

3. Results and Discussions

3.1. Temporal Aggregation

The main objective of this study is to understand the difference between the two aggregation approaches for estimating ET at larger temporal scales. Hence, we focused on the relative difference between the accuracy of ET simulated by these two approaches by the different models. We did not compare the accuracy of ET by different models in this study as that may have taken the focus away from the main objective.
Input and output temporally aggregated λE values from the three models were compared with the reference values from the field for all the six sites. The results corresponding to the two time instances (10:30 a.m. and 1:30 p.m.) and two scaling variables (EF and SR) were analyzed separately. The difference in RMSE of the monthly ET (expressed in mm/month) estimated using output and input aggregation (RMSEoutput – RMSEinput) methods by each of the three models and for each site are given in Table 2. Further, in the table, the RMSE difference is also expressed as a percentage of in situ observed monthly ET. This indicates the level of improvement in the model-simulated ET when compared with in situ observations. From the table, it can be observed that the RMSE in ET estimated using output aggregation was always higher than that of input aggregation (leading to a positive difference) for all the sites and for all the models, except the PT-JPL model over Jaisalmer and Samastipur sites. This was true for both the scaling variables and both morning and afternoon time instances. Similar results were also obtained when temporally aggregating to weekly timescales (Table 3).
The correlation coefficient (r) between observed ET and modeled ET using input aggregation at monthly time scale was 0.64, 0.76, 0.57, and 0.64 from the SPARSE-Layer, SPARSE-Patch, PT-JPL, and STIC models, respectively. The r values were 0.61, 0.75, 0.53 and 0.51 from the four models in the same order when output aggregation was used to estimate monthly ET. Similarly, at a weekly scale, the r value was 0.58 and 0.51 for input and output aggregation, respectively, using the SPARSE-Layer model. For the SPARSE-Patch model, it was 0.67 and 0.60; for the PT-JPL model, r values were 0.30 and 0.24; and finally, for the STIC model, it was 0.49 and 0.35, respectively, for the input and output aggregation. In all cases, the r value was better for input aggregation than for output aggregation at both monthly and weekly scales. The scatter plots of observed and SPARSE-Layer model ET values at monthly and weekly scales are presented in Figure 3.
The difference in RMSE of ET estimated using input and output aggregation approaches varied with models and sites. The patch version of the SPARSE model had the least difference in ET simulated by the two approaches across the six sites. The difference was less than 1% for most of the sites, indicating that the SPARSE-Patch model is relatively insensitive to the temporal aggregation method for estimating ET at longer time scales. By comparison, the PT-JPL model exhibited higher sensitivity to the temporal aggregation method with the input aggregation performing better at four of the six sites (except Jaisalmer and Samastipur). Among the six sites used here, Samastipur is characterized by relatively higher rainfall (~1100 mm year−1) and higher ET (~950 mm year−1). The observed EF at the site remained around 0.8 during both the major cropping seasons (January to March and May to September) and around 0.5 for the rest of the months [22], indicating a larger fraction of net available energy being converted into latent heat flux over the site. Jaisalmer, in contrast, is an arid site with an annual rainfall of around 210 mm. These results indicate that, for the PT-JPL model, output aggregation may be a better approach when working over sites that are either relatively wet with a humid climate, or over drier, arid sites. However, this needs to be tested further over other such sites.
ET from the STIC model was also found to be sensitive to the aggregation method. Specifically, over the arid Jaisalmer site, the daily simulated ET often had large outliers, which translated into higher RMSE in calculating monthly ET using the output aggregation method. When using the input aggregation approach, the process of averaging the inputs and running the model at weekly or monthly scales resulted in improved ET estimation by the model, leading to a significant reduction in RMSE (Table 2 and Table 3). The SPARSE-Layer model exhibited minor improvements, varying between one and ten percent in most of the sites when input aggregation was used. Here, significant changes were also observed in the model simulated ET over the Jaisalmer site when using the two aggregation approaches. Similar results were observed in different seasons for all the models. Although the improvement in accuracy in weekly and monthly ET varied for different models and different sites, the input aggregation method helps in obtaining temporally aggregated ET with relatively better accuracy than the output aggregation approach (except for the PT-JPL model over wet and arid sites). Further, the results remain the same irrespective of the accuracy of the ET models used in this study.
The individual components of ET simulated by the SPARSE and PT-JPL models estimated using the two aggregation approaches were compared with each other. Both the models estimated different values of E and T when using input and output aggregation approaches, leading to differences in the total ET simulated. The ratio of monthly E/ET estimated using solar radiation as the scaling variable is presented in Table 4. From the values given in the table, the ratio T/ET can be estimated as 1 – (E/ET). As expected, the E/ET ratios estimated at 10:30 a.m. and 1:30 p.m. differ from each other, which may either be due to the diurnal variation in the land surface processes or model physics. The ratio also varied with the temporal aggregation that was used to obtain monthly ET. The SPARSE-Layer model seems to be relatively stable, with the E/ET ratio varying less than 20% between the input and output aggregations, except for the Lamasquère site. This was followed by the SPARSE-Patch model in terms of variation in E/ET ratios. Sites with relatively higher rainfall, such as Samastipur and Lamasquère, exhibited higher variation in the E/ET ratios estimated by the two aggregation approaches (Table 4). The PT-JPL model exhibited significant differences in the E/ET ratio when different aggregation approaches were used. When using output aggregation, the model predicted E/ET to be 1 (i.e., zero transpiration) over Auradé, Lamasquère, and Jaisalmer, but the E/ET ratio was less than one when using input aggregation. The difference between input and output aggregation was larger at 1:30 p.m. than 10:30 a.m. for most of the cases. Although we cannot check the individual ET components due to lack of in situ data, the differences in model simulations of E and T due to different temporal averaging procedures highlight the uncertainties in ET partitioning by remote sensing models.

3.2. Effect of Missing Data

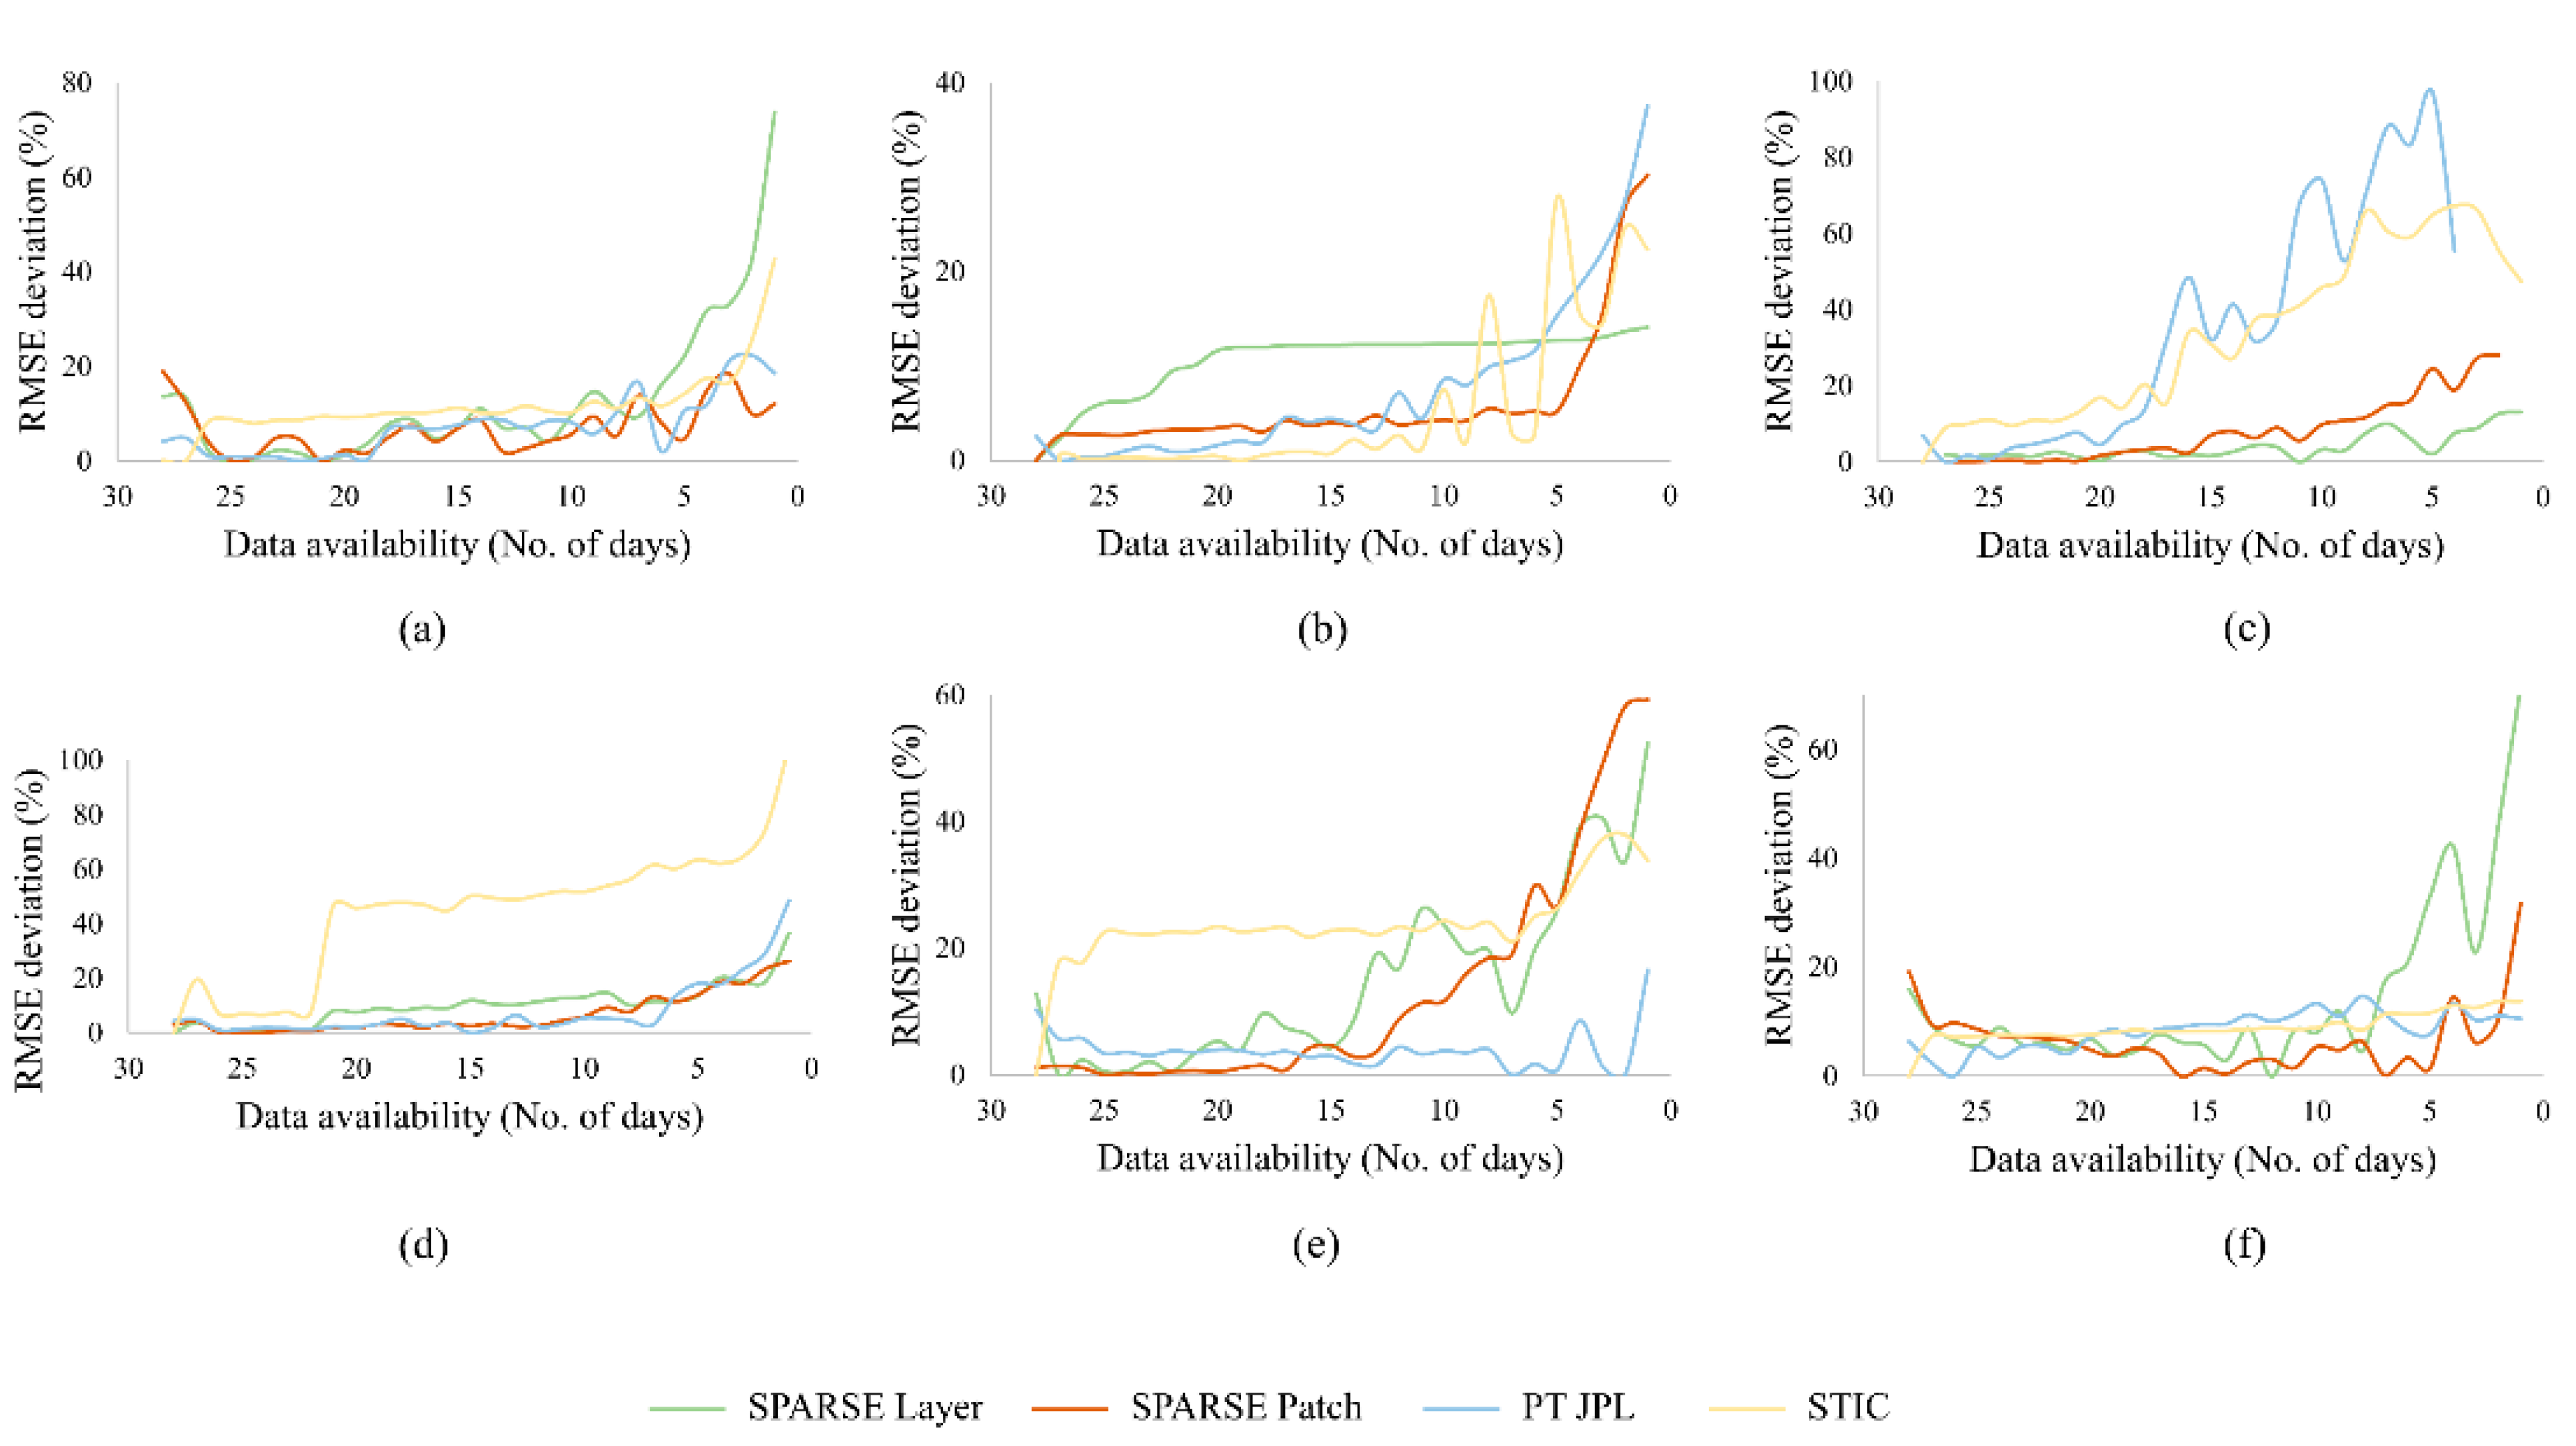
To understand the effect of missing data, monthly ET was estimated through the input aggregation approach using different models by continuously reducing the number of days from 28 to 1. For all the models, the lowest RMSE in monthly ET was observed when the data were available for 25 to 28 days. When the number of days reduced, the RMSE in monthly ET generally increased, as reported in previous studies [10]. The change in RMSE with the decreasing number of days of data availability for all the models and sites is presented in Figure 4. In the figure, the percentage increase in RMSE with respect to the lowest RMSE observed is plotted. For example, in the Samastipur site, the lowest RMSE in monthly averaged ET simulated by the SPARSE-Layer model was 0.9 mm day−1 when data were available for 25 days. Taking this lowest RMSE as the base value, the percentage change in RMSE for a decreasing number of days is plotted in the figure. The RMSE in monthly ET varied within 10% of the lowest value when at least 15 days of data are available in a month for all the models. For the Samastipur site, a 10% increase in RMSE from the base value leads to an increase of about 2.8 mm month−1 in RMSE, which translates to 3.5% of the average monthly ET observed at the site. The increase in error in simulated monthly ET varied with site and model. In general, when the data were available for 5 to 10 days in a month, the RMSE of ET from models increased by about 20%, and this varied anywhere between 7% and 30% of the in situ observed ET for different sites and models. However, for the sites with irrigated agriculture (e.g., Nawagam and Samastipur), a 20% increase in RMSE was observed even when the data were available for 10 days (Figure 4d,e). The STIC model exhibited a higher increase in RMSE than other models at the Lamasquère, Nawagam, and Samastipur sites, which might suggest that the model is sensitive to a lack of data. Guillevic et al. [10] reported an increase in uncertainty in monthly ET by 31% for a 16-day revisit cycle (i.e., two observations are available) using AmeriFlux data. However, when simulating ET using models, we observed an increase in RMSE by 30% of the in situ observed ET even when five to eight observations were available per month. Anderson et al. [28] also recommended a constellation of high spatial resolution satellites providing a combined revisit cycle of 4 days, thus providing seven to eight observations per month for successful ET retrieval across most parts of the globe.

4. Conclusions

Temporal aggregation of ET into weekly and monthly values is considered one of the trivial tasks using remote sensing models. However, this study demonstrated that the selected aggregation approach can alter the ET simulated from the models. In general, input aggregation was found to yield ET values closer to in situ observations when using the surface energy balance-based SPARSE model and the PM equation-based STIC model. However, for the PT-JPL model, output aggregation worked better for humid and arid sites and input aggregation worked for sites with semi-arid and temperate climates. The individual components of E and T simulated by these models also varied, indicating that the models are sensitive to the way they are forced with datasets.
In addition to the temporal aggregation approach, continuous data availability plays a major role in determining the accuracy of the modeled ET. When using remote sensing models, at least seven to eight observations are needed in a month to retrieve ET with limited errors, and any further decrease in data availability significantly increases the RMSE in ET. The model error due to a lack of data can be much higher than the improvement obtained by selecting the appropriate temporal aggregation approach. This result is significant, especially for the models that use LST as a primary input (e.g., SPARSE and STIC). Currently, LST data at the required temporal frequency are provided only by satellites having coarser spatial resolutions (≥1 km). For modeling ET at high spatial resolution (~100 m) using LST-based models, it is necessary to have a revisit period of 4 days as planned for the upcoming Indo-French TRISHNA mission. In addition, for the PM/PT equation-based models, modeling ET with finer spatial resolutions is generally limited by the grid size of the numerical models that provide meteorological data. It is necessary to develop numerical models with finer spatial resolution, which can then be combined with vegetation information obtained from a suite of visible, NIR, and SWIR data available from multiple sensors.

Author Contributions

Conceptualization, R.E.; methodology, K.V.A., R.E. and G.B.; software, K.V.A. and G.B.; validation, K.V.A., R.E., G.B., R.N., B.K.B.; formal analysis, K.V.A., R.E., G.B., R.N., B.K.B.; investigation, K.V.A., R.E., G.B., R.N., B.K.B.; resources, R.E., G.B., R.N., B.K.B.; data curation, K.V.A.; writing—original draft preparation, K.V.A.; writing—review and editing, R.E., G.B., R.N., B.K.B.; visualization, K.V.A., R.E., G.B.; supervision, R.E., G.B.; project administration, R.E., R.N., B.K.B.; funding acquisition, R.E., G.B., R.N., B.K.B. All authors have read and agreed to the published version of the manuscript.

Funding

The first two authors acknowledge the funding and support from Space Applications Centre, Ahmedabad under the SHRESTI program (Project code: RD/0119-ISRO000-001). The authors acknowledge the funding by CNES TOSCA program for the TRISHNA project. The first author acknowledges the travel grant provided by IRP CEFIRSE towards a visit to CESBIO lab.

Data Availability Statement

Data used in this study may be obtained on reasonable request from G.B. and B.K.B. The data is not made available publicly due to the data sharing agreement accepted by the corresponding author.

Acknowledgments

The authors acknowledge the data acquired within the framework of ICOS France, NAILA IRD international laboratory and the SNO Observatoire Spatial Regional.

Conflicts of Interest

The authors declare no conflict of interest.

References

  1. Zhang, K.; Kimball, J.S.; Running, S.W. A Review of Remote Sensing Based Actual Evapotranspiration Estimation. WIREs Water 2016, 3, 834–853. [Google Scholar] [CrossRef]
  2. Chen, J.M.; Liu, J. Evolution of Evapotranspiration Models Using Thermal and Shortwave Remote Sensing Data. Remote Sens. Environ. 2020, 237, 111594. [Google Scholar] [CrossRef]
  3. Crago, R.; Brutsaert, W. Daytime Evaporation and the Self-Preservation of the Evaporative Fraction and the Bowen Ratio. J. Hydrol. 1996, 178, 241–255. [Google Scholar] [CrossRef]
  4. Delogu, E.; Boulet, G.; Olioso, A.; Coudert, B.; Chirouze, J.; Ceschia, E.; Le Dantec, V.; Marloie, O.; Chehbouni, G.; Lagouarde, J.-P. Reconstruction of Temporal Variations of Evapotranspiration Using Instantaneous Estimates at the Time of Satellite Overpass. Hydrol. Earth Syst. Sci. 2012, 16, 2995–3010. [Google Scholar] [CrossRef] [Green Version]
  5. Ryu, Y.; Baldocchi, D.D.; Black, T.A.; Detto, M.; Law, B.E.; Leuning, R.; Miyata, A.; Reichstein, M.; Vargas, R.; Ammann, C.; et al. On the Temporal Upscaling of Evapotranspiration from Instantaneous Remote Sensing Measurements to 8-Day Mean Daily-Sums. Agric. For. Meteorol. 2012, 152, 212–222. [Google Scholar] [CrossRef] [Green Version]
  6. Van Niel, T.G.; McVicar, T.R.; Roderick, M.L.; van Dijk, A.I.J.M.; Beringer, J.; Hutley, L.B.; van Gorsel, E. Upscaling Latent Heat Flux for Thermal Remote Sensing Studies: Comparison of Alternative Approaches and Correction of Bias. J. Hydrol. 2012, 468–469, 35–46. [Google Scholar] [CrossRef]
  7. Cammalleri, C.; Anderson, M.C.; Kustas, W.P. Upscaling of Evapotranspiration Fluxes from Instantaneous to Daytime Scales for Thermal Remote Sensing Applications. Hydrol. Earth Syst. Sci. 2014, 18, 1885–1894. [Google Scholar] [CrossRef] [Green Version]
  8. Xu, T.; Liu, S.; Xu, L.; Chen, Y.; Jia, Z.; Xu, Z.; Nielson, J. Temporal Upscaling and Reconstruction of Thermal Remotely Sensed Instantaneous Evapotranspiration. Remote Sens. 2015, 7, 3400–3425. [Google Scholar] [CrossRef] [Green Version]
  9. Alfieri, J.G.; Anderson, M.C.; Kustas, W.P.; Cammalleri, C. Effect of the Revisit Interval and Temporal Upscaling Methods on the Accuracy of Remotely Sensed Evapotranspiration Estimates. Hydrol. Earth Syst. Sci. 2017, 21, 83–98. [Google Scholar] [CrossRef] [Green Version]
  10. Guillevic, P.; Olioso, A.; Hook, S.; Fisher, J.; Lagouarde, J.-P.; Vermote, E. Impact of the Revisit of Thermal Infrared Remote Sensing Observations on Evapotranspiration Uncertainty—A Sensitivity Study Using AmeriFlux Data. Remote Sens. 2019, 11, 573. [Google Scholar] [CrossRef] [Green Version]
  11. Tang, R.; Li, Z.L.; Huo, X.; Jiang, Y.; Tang, B.; Wu, H. A re-examination of two methods for estimating daily evapotranspiration from remotely sensed instantaneous observations. Int. J. Remote Sens. 2019, 40, 1981–1995. [Google Scholar] [CrossRef]
  12. Liu, Z. The Accuracy of Temporal Upscaling of Instantaneous Evapotranspiration to Daily Values with Seven Upscaling Methods. Hydrol. Earth Syst. Sci. 2021, 25, 4417–4433. [Google Scholar] [CrossRef]
  13. Jiang, L.; Zhang, B.; Han, S.; Chen, H.; Wei, Z. Upscaling Evapotranspiration from the Instantaneous to the Daily Time Scale: Assessing Six Methods Including an Optimized Coefficient Based on Worldwide Eddy Covariance Flux Network. J. Hydrol. 2021, 596, 126135. [Google Scholar] [CrossRef]
  14. Fisher, J.B.; Lee, B.; Purdy, A.J.; Halverson, G.H.; Dohlen, M.B.; Cawse-Nicholson, K.; Wang, A.; Anderson, R.G.; Aragon, B.; Arain, M.A.; et al. ECOSTRESS: NASA’s Next Generation Mission to Measure Evapotranspiration from the International Space Station. Water Resour. Res. 2020, 56, e2019WR026058. [Google Scholar] [CrossRef]
  15. Fisher, J.B.; Tu, K.P.; Baldocchi, D.D. Global Estimates of the Land–Atmosphere Water Flux Based on Monthly AVHRR and ISLSCP-II Data, Validated at 16 FLUXNET Sites. Remote Sens. Environ. 2008, 112, 901–919. [Google Scholar] [CrossRef]
  16. Hong, S.; Hendrickx, J.M.H.; Borchers, B. Up-Scaling of SEBAL Derived Evapotranspiration Maps from Landsat (30 m) to MODIS (250m) Scale. J. Hydrol. 2009, 370, 122–138. [Google Scholar] [CrossRef]
  17. Ershadi, A.; McCabe, M.F.; Evans, J.P.; Walker, J.P. Effects of Spatial Aggregation on the Multi-Scale Estimation of Evapotranspiration. Remote Sens. Environ. 2013, 131, 51–62. [Google Scholar] [CrossRef]
  18. Sharma, V.; Kilic, A.; Irmak, S. Impact of Scale/Resolution on Evapotranspiration from Landsat and MODIS Images. Water Resour. Res. 2016, 52, 1800–1819. [Google Scholar] [CrossRef] [Green Version]
  19. Boulet, G.; Mougenot, B.; Lhomme, J.-P.; Fanise, P.; Lili-Chabaane, Z.; Olioso, A.; Bahir, M.; Rivalland, V.; Jarlan, L.; Merlin, O.; et al. The SPARSE Model for the Prediction of Water Stress and Evapotranspiration Components from Thermal Infra-Red Data and Its Evaluation over Irrigated and Rainfed Wheat. Hydrol. Earth Syst. Sci. 2015, 19, 4653–4672. [Google Scholar] [CrossRef] [Green Version]
  20. Mallick, K.; Jarvis, A.J.; Boegh, E.; Fisher, J.B.; Drewry, D.T.; Tu, K.P.; Hook, S.J.; Hulley, G.; Ardö, J.; Beringer, J.; et al. A Surface Temperature Initiated Closure (STIC) for Surface Energy Balance Fluxes. Remote Sens. Environ. 2014, 141, 243–261. [Google Scholar] [CrossRef]
  21. Delogu, E.; Olioso, A.; Alliès, A.; Demarty, J.; Boulet, G. Evaluation of Multiple Methods for the Production of Continuous Evapotranspiration Estimates from TIR Remote Sensing. Remote Sens. 2021, 13, 1086. [Google Scholar] [CrossRef]
  22. Bhat, G.S.; Morrison, R.; Taylor, C.M.; Bhattacharya, B.K.; Paleri, S.; Desai, D.; Evans, J.G.; Pattnaik, S.; Sekhar, M.; Nigam, R.; et al. Spatial and Temporal Variability in Energy and Water Vapour Fluxes Observed at Seven Sites on the Indian Subcontinent during 2017. Q. J. R. Meteorol. Soc. 2020, 146, 2853–2866. [Google Scholar] [CrossRef] [Green Version]
  23. Béziat, P.; Ceschia, E.; Dedieu, G. Carbon Balance of a Three Crop Succession over Two Cropland Sites in South West France. Agric. For. Meteorol. 2009, 149, 1628–1645. [Google Scholar] [CrossRef] [Green Version]
  24. Dare-Idowu, O.; Brut, A.; Cuxart, J.; Tallec, T.; Rivalland, V.; Zawilski, B.; Ceschia, E.; Jarlan, L. Surface Energy Balance and Flux Partitioning of Annual Crops in Southwestern France. Agric. For. Meteorol. 2021, 308–309, 108529. [Google Scholar] [CrossRef]
  25. Boulet, G.; Olioso, A.; Ceschia, E.; Marloie, O.; Coudert, B.; Rivalland, V.; Chirouze, J.; Chehbouni, G. An Empirical Expression to Relate Aerodynamic and Surface Temperatures for Use within Single-Source Energy Balance Models. Agric. For. Meteorol. 2012, 161, 148–155. [Google Scholar] [CrossRef] [Green Version]
  26. Priestley, C.H.B.; Taylor, R.J. On the Assessment of Surface Heat Flux and Evaporation Using Large-Scale Parameters. Mon. Weather Rev. 1972, 100, 81–92. [Google Scholar] [CrossRef]
  27. Allen, R.G.; Pereira, L.S.; Raes, D.; Smith, M. FAO Irrigation and Drainage Paper No. 56; Food and Agriculture Organization of the United Nations: Rome, Italy, 1998.
  28. Anderson, M.C.; Allen, R.G.; Morse, A.; Kustas, W.P. Use of Landsat Thermal Imagery in Monitoring Evapotranspiration and Managing Water Resources. Remote Sens. Environ. 2012, 122, 50–65. [Google Scholar] [CrossRef]
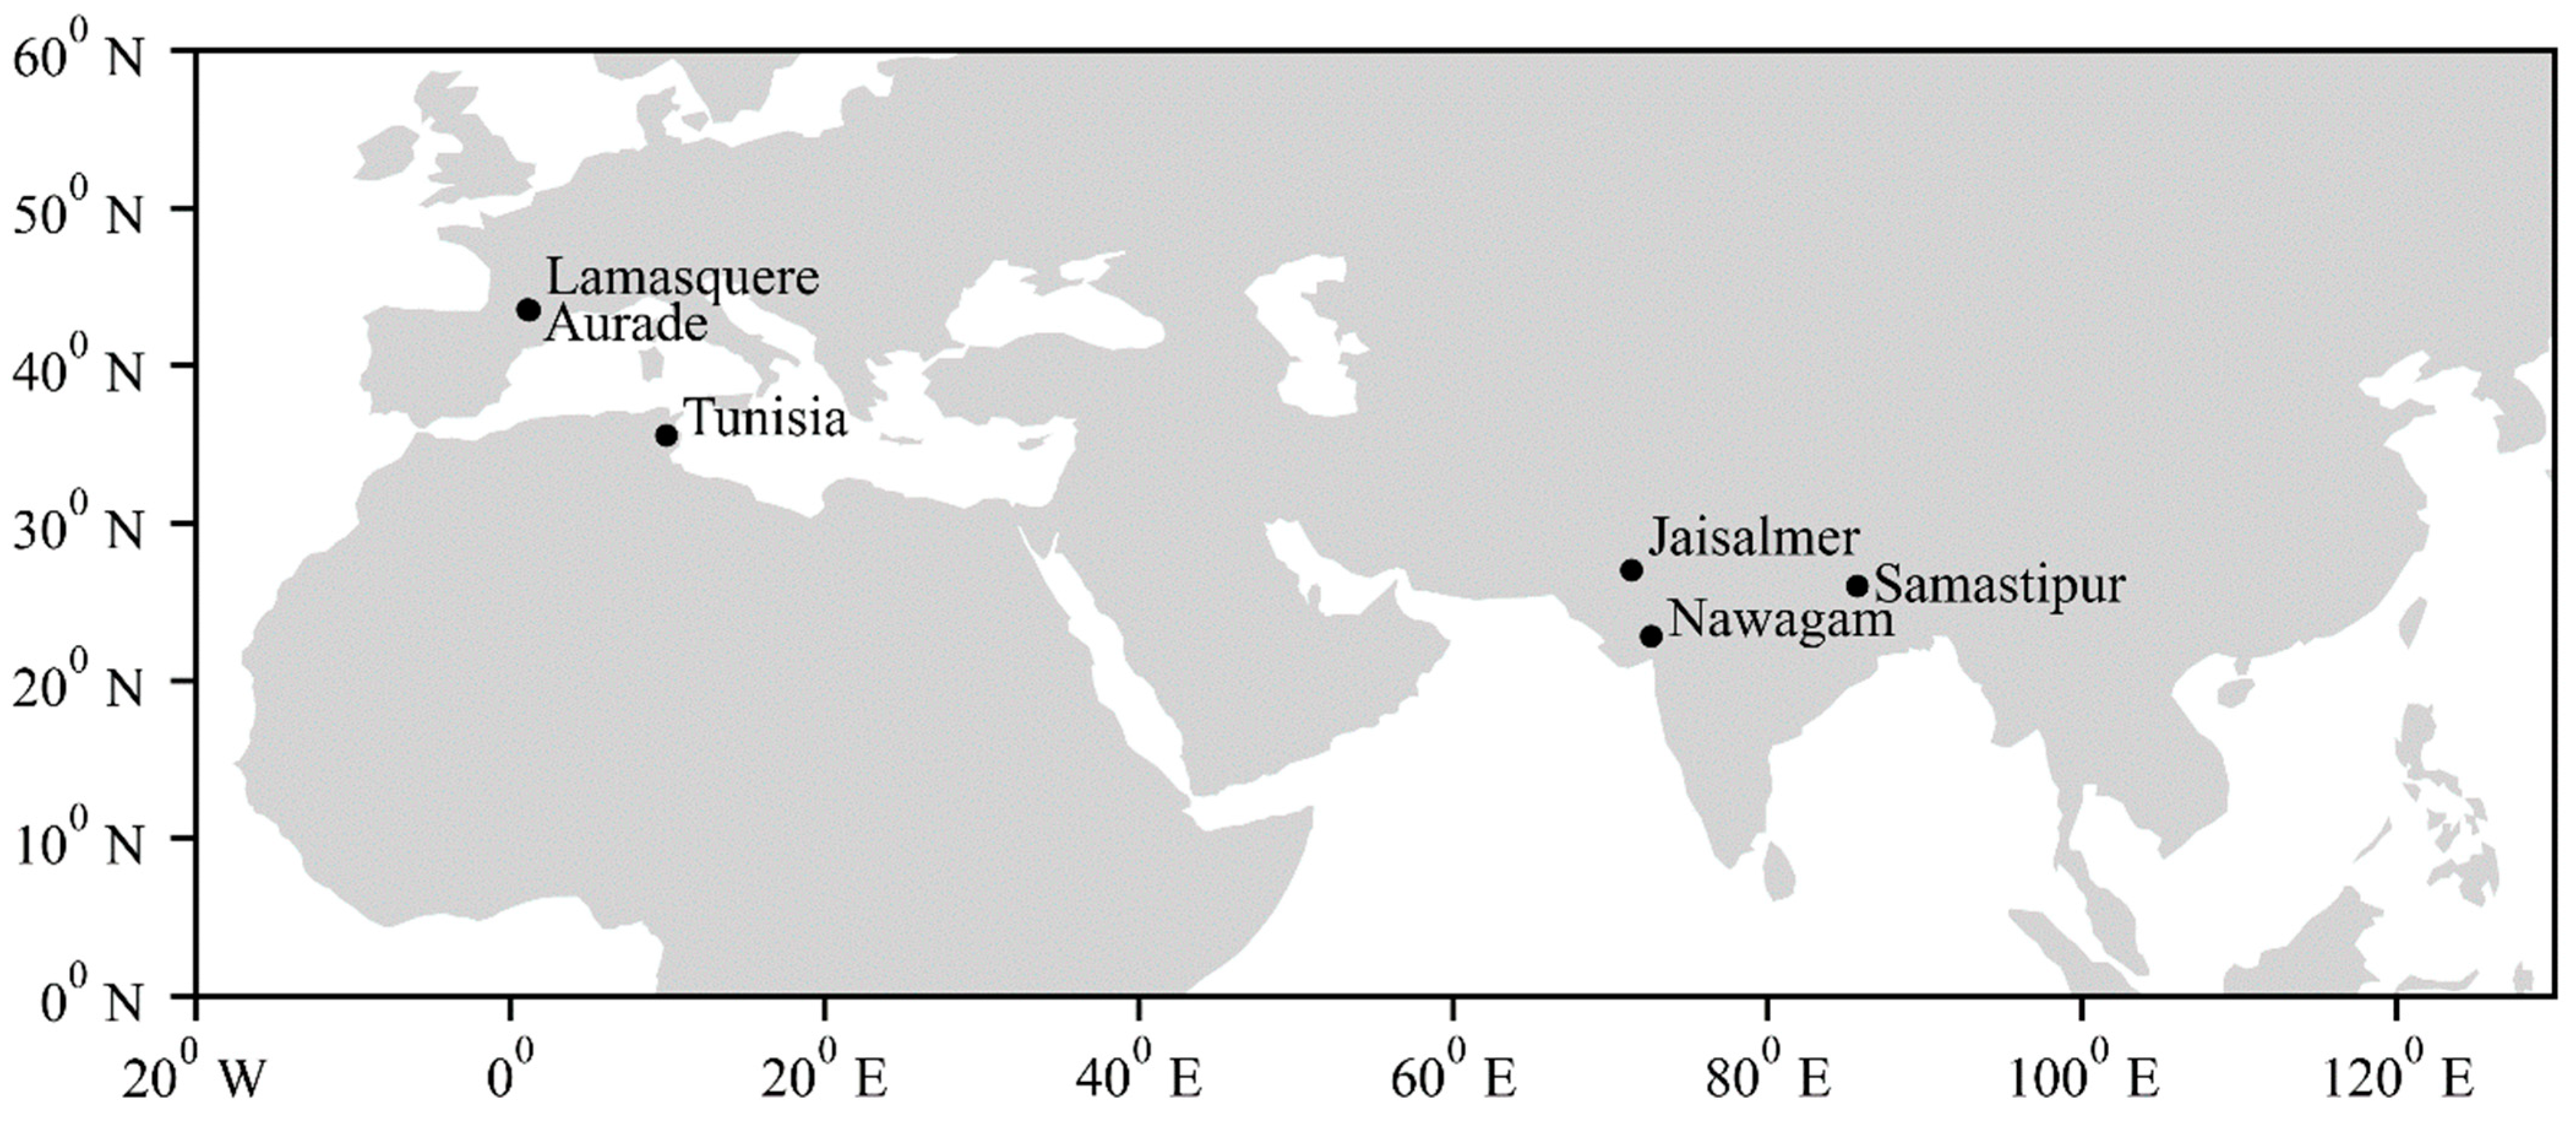
Figure 1. Study sites.
Remotesensing 14 04142 g001
Figure 2. Methodology flowchart.
Remotesensing 14 04142 g002
Figure 3. Plots of observed vs. SPARSE-Layer model estimated ET values for: (a) monthly input aggregation; (b) monthly output aggregation; (c) weekly input aggregation; (d) weekly output aggregation.
Remotesensing 14 04142 g003
Figure 4. Plots of percentage increase in RMSE with respect to the minimum RMSE against number of days of data availability for the sites in: (a) Tunisia; (b) Auradé; (c) Lamasquère; (d) Nawagam; (e) Samastipur; and (f) Jaisalmer.
Remotesensing 14 04142 g004
Table 1. Details of the sites used in the study.
SiteLocationCropClimateData DurationReferences
Tunisia, North Africa35.56°N, 9.94°EWheatTropical semi-aridJanuary 2012–June 2012[19]
Auradé, France43.55°N, 1.11°EWheatTemperateJanuary 2009–December 2010[21]
Lamasquère, France43.50°N, 1.24°EWheatTemperateJanuary 2013–July 2013[21]
Nawagam, India22.80°N, 72.57°ERiceSemi-aridAugust 2017–November 2018[22]
Samastipur, India26.00°N, 85.67°ERice and WheatSub-humidJanuary 2018–September 2018[22]
Jaisalmer, India26.99°N, 71.34°ENatural sewan grassAridJanuary 2018–December 2018[22]
Table 2. The difference in RMSE between output and input aggregation (mm/month). Numbers in brackets express this RMSE difference as a percentage of in situ observed monthly ET. In the header, Evaporative Fraction and Solar Radiation indicate the scaling variable used to convert instantaneous ET (at 10:30 a.m. or 1:30 p.m.) to daily ET.
SiteEvaporative FractionSolar Radiation
10:30 a.m.1:30 p.m.10:30 a.m.1:30 p.m.
SPARSE-LayerTunisia2.39 (4.45)1.64 (3.05)2.77 (5.16)1.23 (2.3)
Auradé1.37 (3.16)1.92 (4.43)1.76 (4.08)2.48 (5.74)
Lamasquère11.14 (9.83)3.26 (2.88)10.62 (9.37)4.84 (4.27)
Nawagam1.11 (1.37)0.03 (0.03)0.22 (0.27)0.63 (0.78)
Samastipur5.45 (5.81)5.03 (5.36)6.06 (6.46)4.9 (5.22)
Jaisalmer4.49 (26.26)4.84 (28.32)4.2 (24.56)4.75 (27.81)
SPARSE-PatchTunisia0.04 (0.07)0.72 (1.35)0.14 (0.26)2.53 (4.72)
Auradé0.04 (0.09)0.29 (0.66)0.78 (1.8)0.91 (2.1)
Lamasquère0.96 (0.85)0.28 (0.24)0.3 (0.26)0.94 (0.83)
Nawagam4.54 (5.63)1.73 (2.15)3.76 (4.66)0.3 (0.38)
Samastipur0.13 (0.14)1.29 (1.38)0.31 (0.33)1.32 (1.41)
Jaisalmer0.15 (0.86)0.12 (0.7)0.16 (0.95)0.13 (0.78)
PT-JPLTunisia4.8 (8.96)6.08 (11.34)3.84 (7.16)3.52 (6.57)
Auradé4.43 (10.24)6.72 (15.53)4.05 (9.36)7.19 (16.61)
Lamasquère40.01 (35.31)38.58 (34.05)48.08 (42.44)38.08 (33.61)
Nawagam35.32 (43.78)30.35 (37.62)19.4 (24.04)31.07 (38.51)
Samastipur–18.14 (19.35)–10.79 (11.5)–22.11 (23.57)–13.17 (14.04)
Jaisalmer–6.01 (35.16)–26.43 (154.72)–6.09 (35.67)–26.98 (157.95)
STICTunisia0.34 (0.64)0.66 (1.23)0.63 (1.18)0.67 (1.24)
Auradé18.23 (42.13)0.18 (0.41)13.99 (32.33)0.73 (1.68)
Lamasquère67.88 (59.9)22.19 (19.58)51.72 (45.65)21.21 (18.72)
Nawagam2.83 (3.5)1.45 (1.79)2.51 (3.11)0.87 (1.08)
Samastipur1.44 (1.54)1.83 (1.96)0.38 (0.41)2.33 (2.49)
Jaisalmer16 (93.65)32.07 (187.77)17.89 (104.74)33.49 (196.1)
Table 3. Same as Table 2 but for weekly ET values. RMSE differences are expressed in mm/week.
SiteEvaporative FractionSolar Radiation
10:30 a.m.1:30 p.m.10:30 a.m.1:30 p.m.
SPARSE-LayerTunisia0.35 (2.74)0.13 (0.99)0.43 (3.41)0.02 (0.15)
Auradé0.87 (9.83)0.81 (9.23)0.56 (6.32)0.1 (1.09)
Lamasquère0.91 (3.48)1.4 (5.38)0.72 (2.75)0.63 (2.42)
Nawagam0.33 (1.85)0.6 (3.38)0.17 (0.97)0.63 (3.52)
Samastipur0.96 (4.42)0.74 (3.39)1.06 (4.87)0.8 (3.67)
Jaisalmer0.24 (6.53)0.6 (16.46)0.19 (5.18)0.57 (15.38)
SPARSE-PatchTunisia0.04 (0.29)0.16 (1.26)0.01 (0.06)0.04 (0.32)
Auradé0.49 (5.56)0.5 (5.7)0.18 (2.06)0.09 (1.01)
Lamasquère1.88 (7.23)0.07 (0.25)0.03 (0.12)0.03 (0.1)
Nawagam0.02 (0.09)0.48 (2.71)0.02 (0.14)0.14 (0.77)
Samastipur0.33 (1.54)0.44 (2.04)0.31 (1.43)0.48 (2.2)
Jaisalmer0.01 (0.32)0.03 (0.85)0.02 (0.42)0.02 (0.64)
PT-JPLTunisia1.83 (14.5)2 (15.83)1.74 (13.78)1.28 (10.19)
Auradé0.44 (4.98)0.88 (9.96)0.24 (2.72)0.87 (9.9)
Lamasquère3.24 (12.44)8.75 (33.57)3.58 (13.72)0.67 (2.57)
Nawagam7.9 (44.19)6.28 (35.15)3.12 (17.48)4.82 (26.97)
Samastipur–3.46 (15.91)1.22 (5.59)–4.05 (18.61)0.84 (3.87)
Jaisalmer–3.02 (82.08)–3.59 (97.78)–3.18 (86.65)–3.73 (101.61)
STICTunisia0.05 (0.37)0.13 (1.02)0.05 (0.37)0.09 (0.69)
Auradé1.56 (17.67)0.37 (4.21)1.36 (15.44)0.42 (4.8)
Lamasquère4.45 (17.08)2.1 (8.07)4.47 (17.15)15.94 (61.15)
Nawagam0.61 (3.4)0.17 (0.96)0.37 (2.05)0.03 (0.19)
Samastipur1.74 (7.99)5.61 (25.79)1.1 (5.08)5.69 (26.17)
Jaisalmer2.4 (65.39)2.63 (71.65)2.72 (74.08)2.7 (73.55)
Table 4. E/ET ratio estimated with the SPARSE and PT-JPL models using the two aggregation approaches.
ModelSite10:30 a.m.1:30 p.m.
InputOutputInputOutput
SPARSE-LayerTunisia0.110.120.30.2
Auradé0.350.40.310.36
Lamasquère0.090.190.090.15
Nawagam0.150.150.180.21
Samastipur0.060.060.10.09
Jaisalmer0.530.420.710.58
SPARSE-PatchTunisia0.470.310.280.32
Auradé0.690.680.670.71
Lamasquère0.120.090.10.04
Nawagam0.420.330.350.31
Samastipur0.030.050.040.06
Jaisalmer0.880.940.870.93
PT-JPLTunisia0.540.650.630.79
Auradé0.8910.831
Lamasquère0.530.950.361
Nawagam0.140.650.350.66
Samastipur0.630.890.560.9
Jaisalmer0.9210.940.91
Publisher’s Note: MDPI stays neutral with regard to jurisdictional claims in published maps and institutional affiliations.