
Characteristics and Applications of Summer Season Raindrop Size Distributions Based on a PARSIVEL2 Disdrometer in the Western Tianshan Mountains (China)

 ,
,
Abstract
:1. Introduction
2. Data and Methodology
2.1. Data and Instruments
2.2. Raindrop Size Distribution
2.3. Classification of Precipitation Types
2.4. Calculated Polarimetric Radar Variables
3. Results
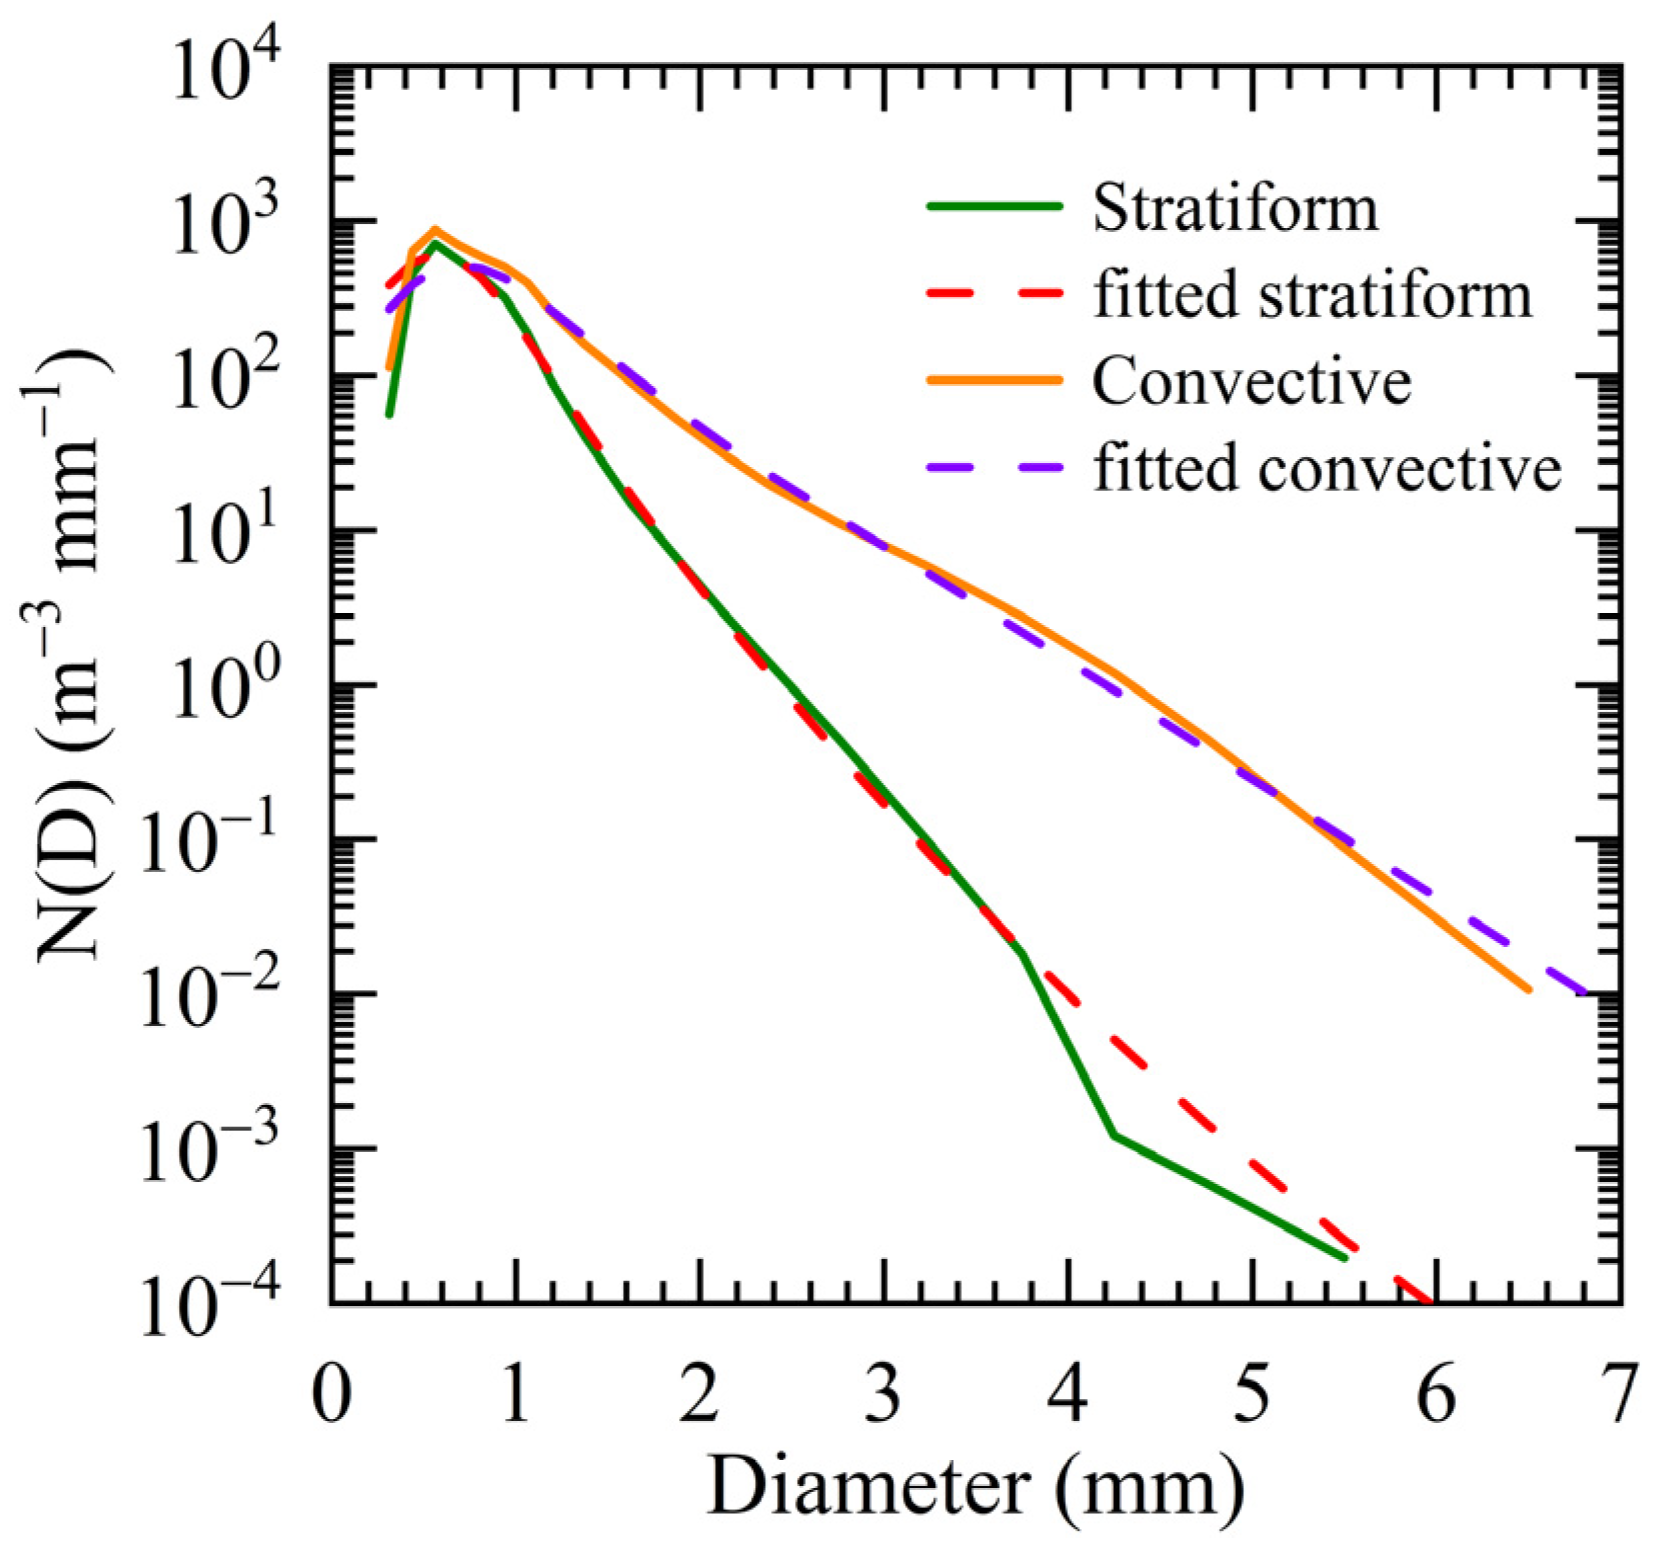
3.1. DSD in Stratiform and Convective Rainfall
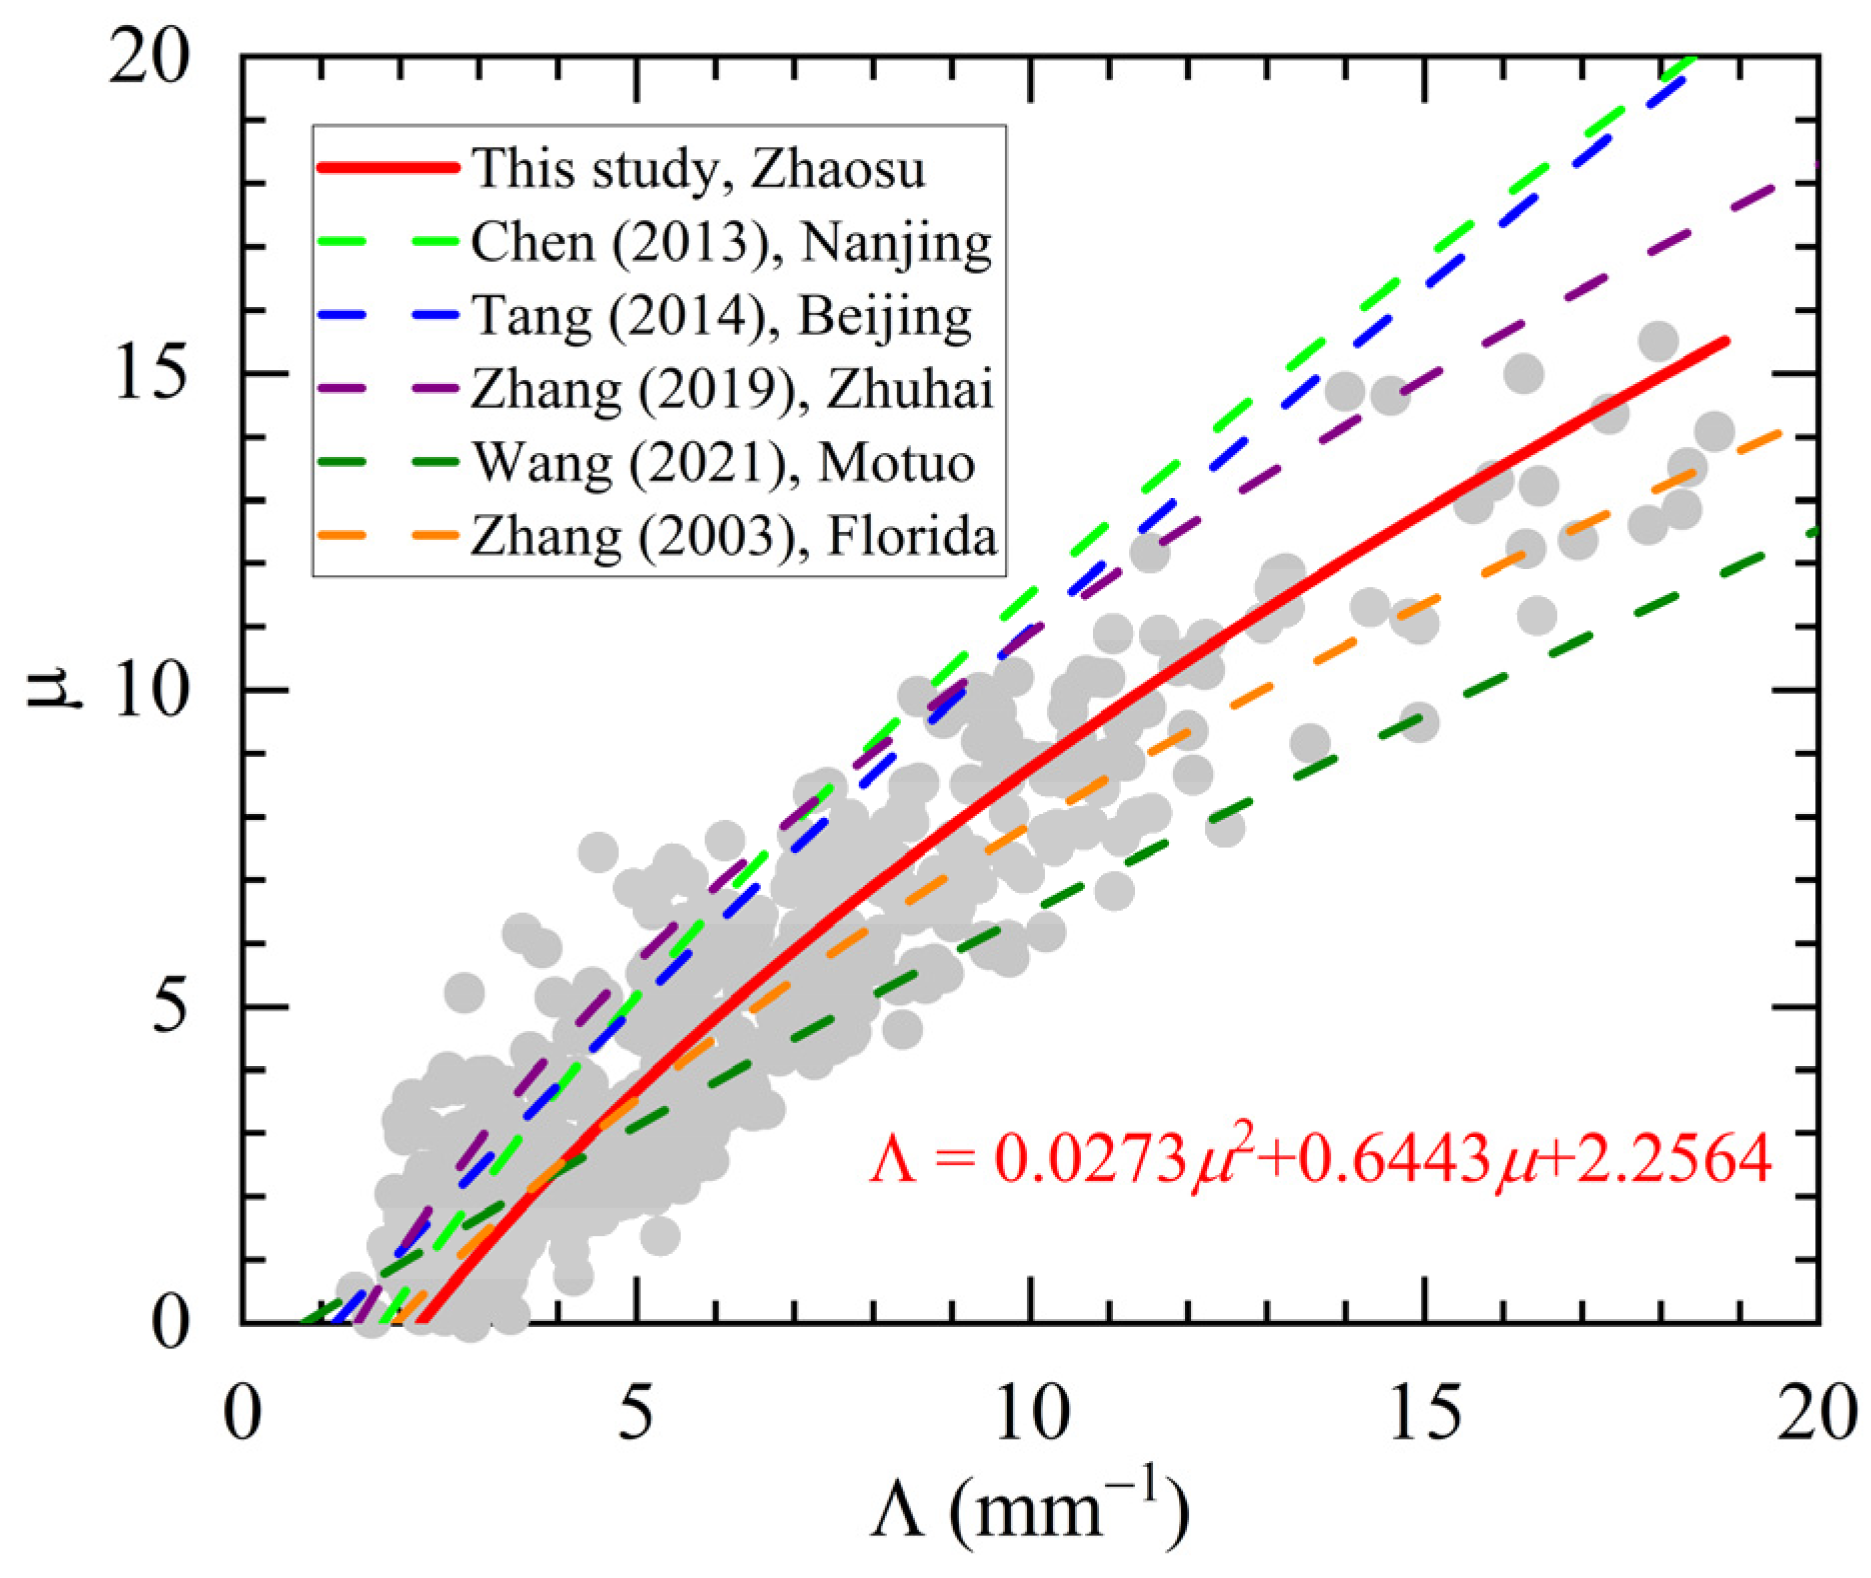
3.2. Gamma Distribution Parameters
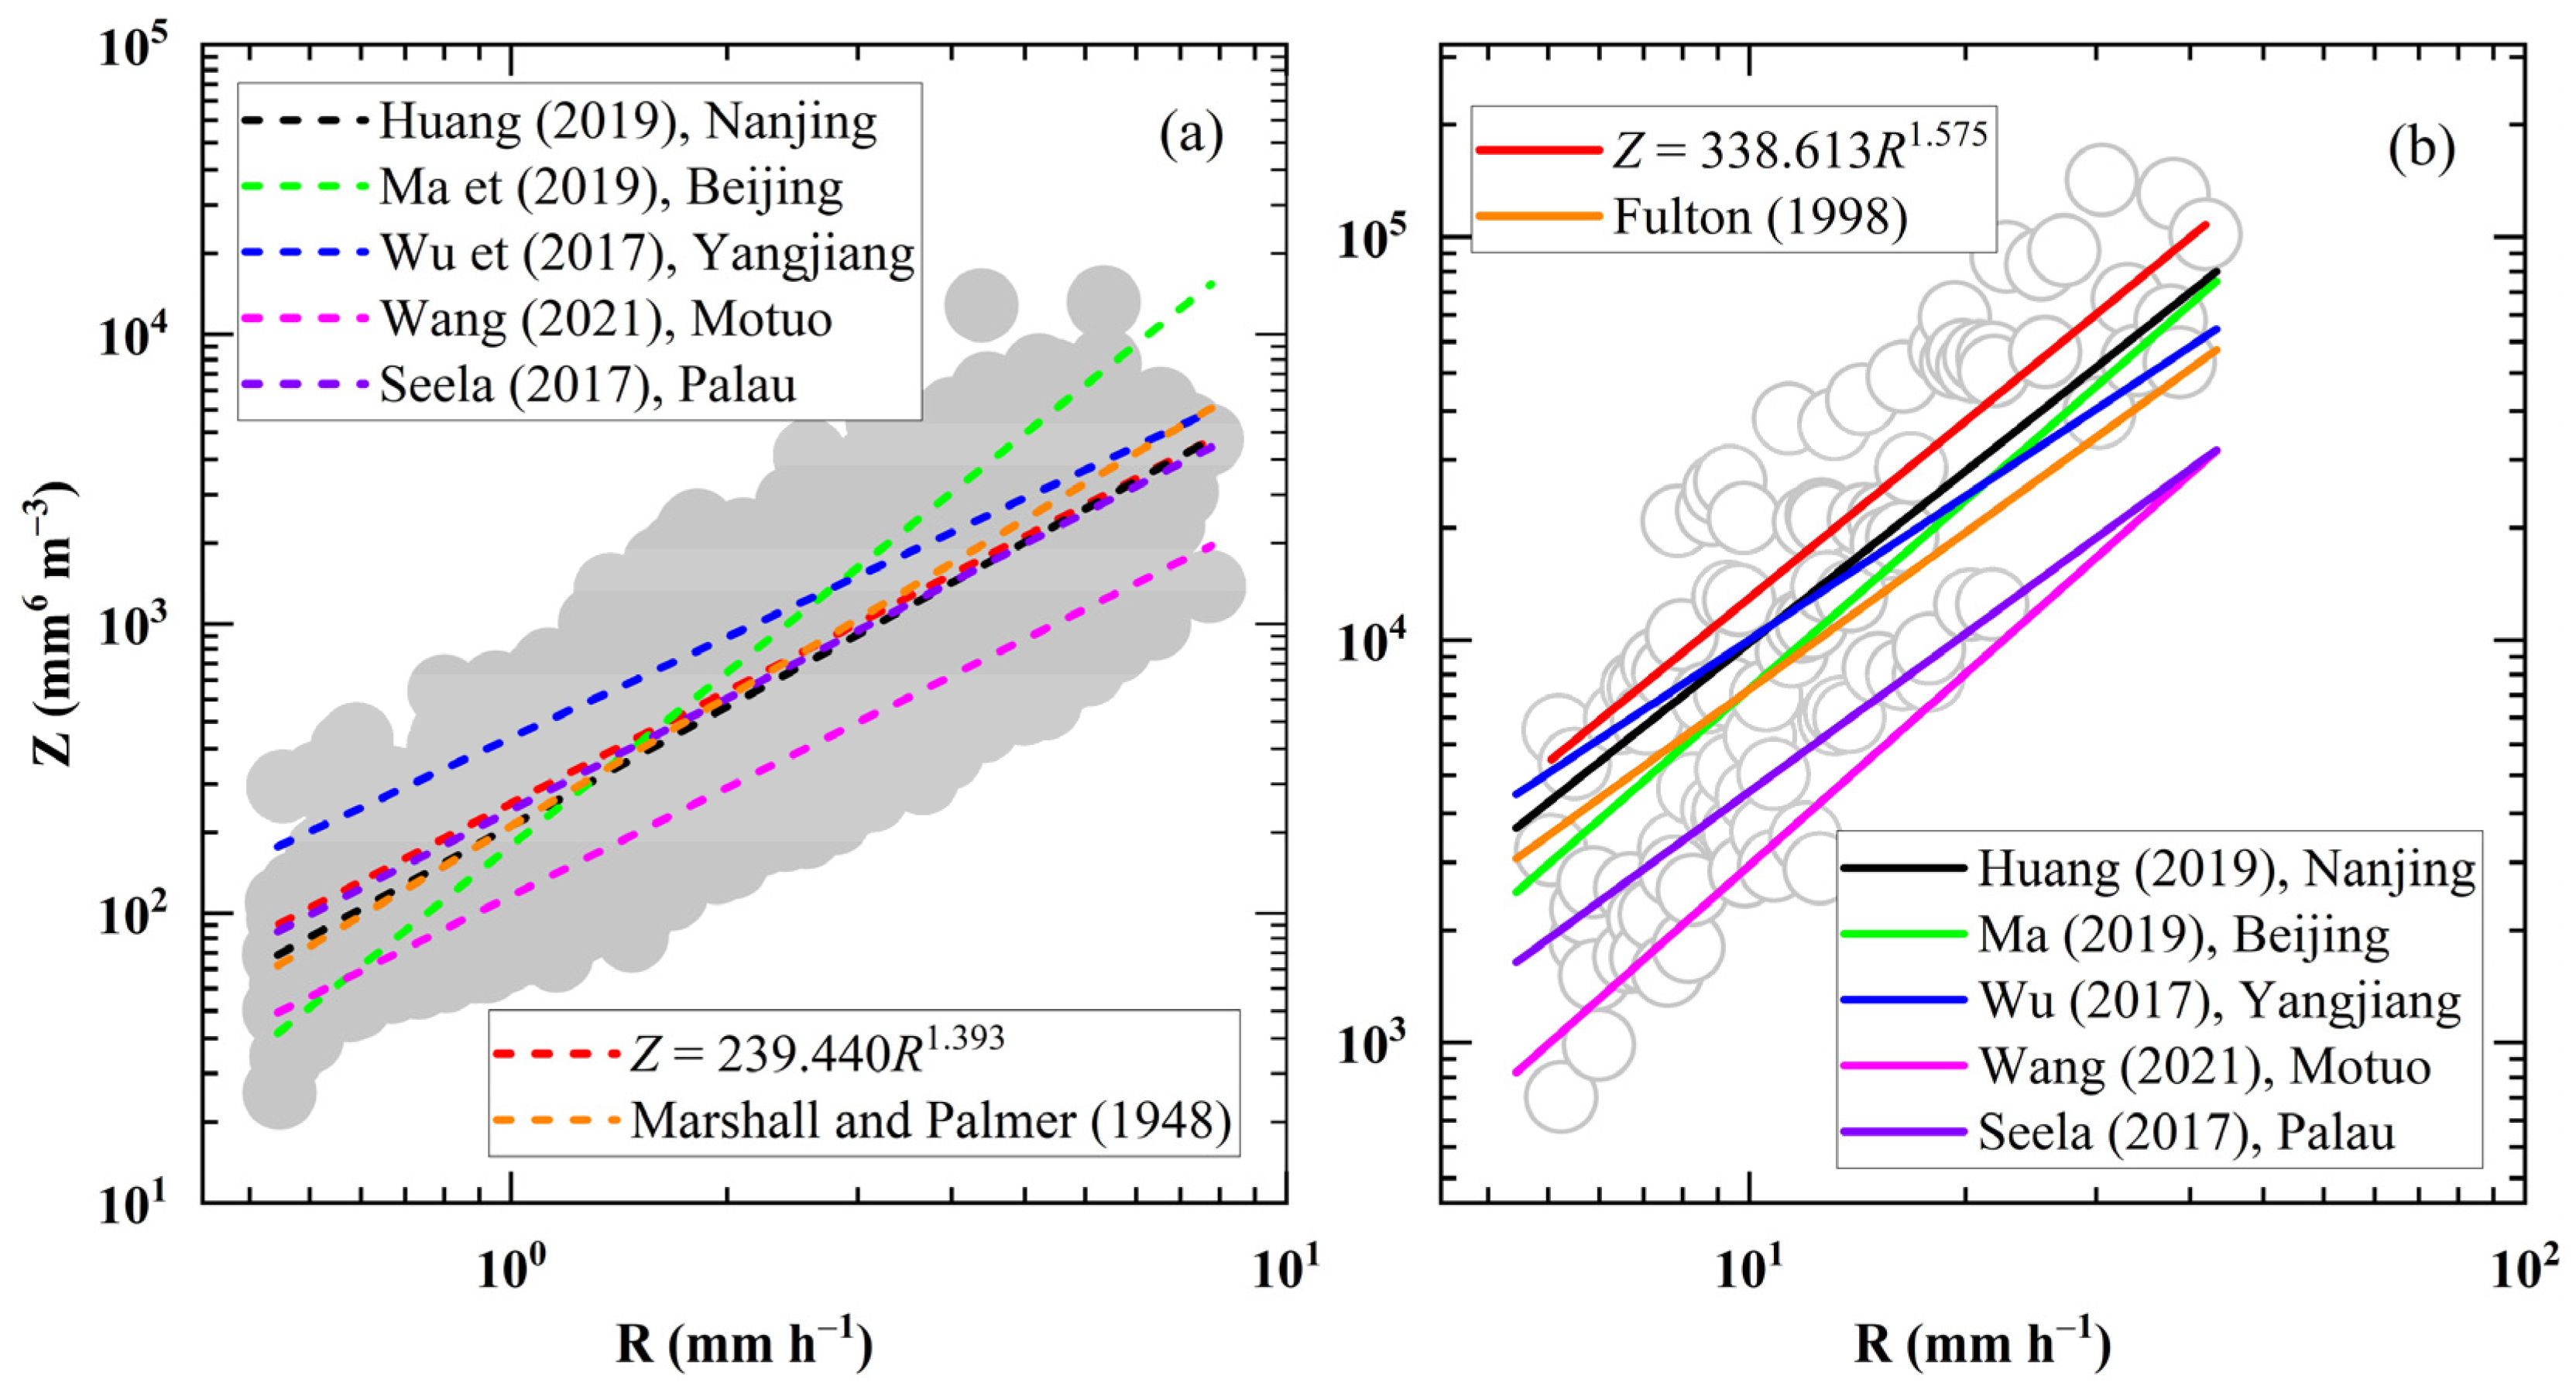
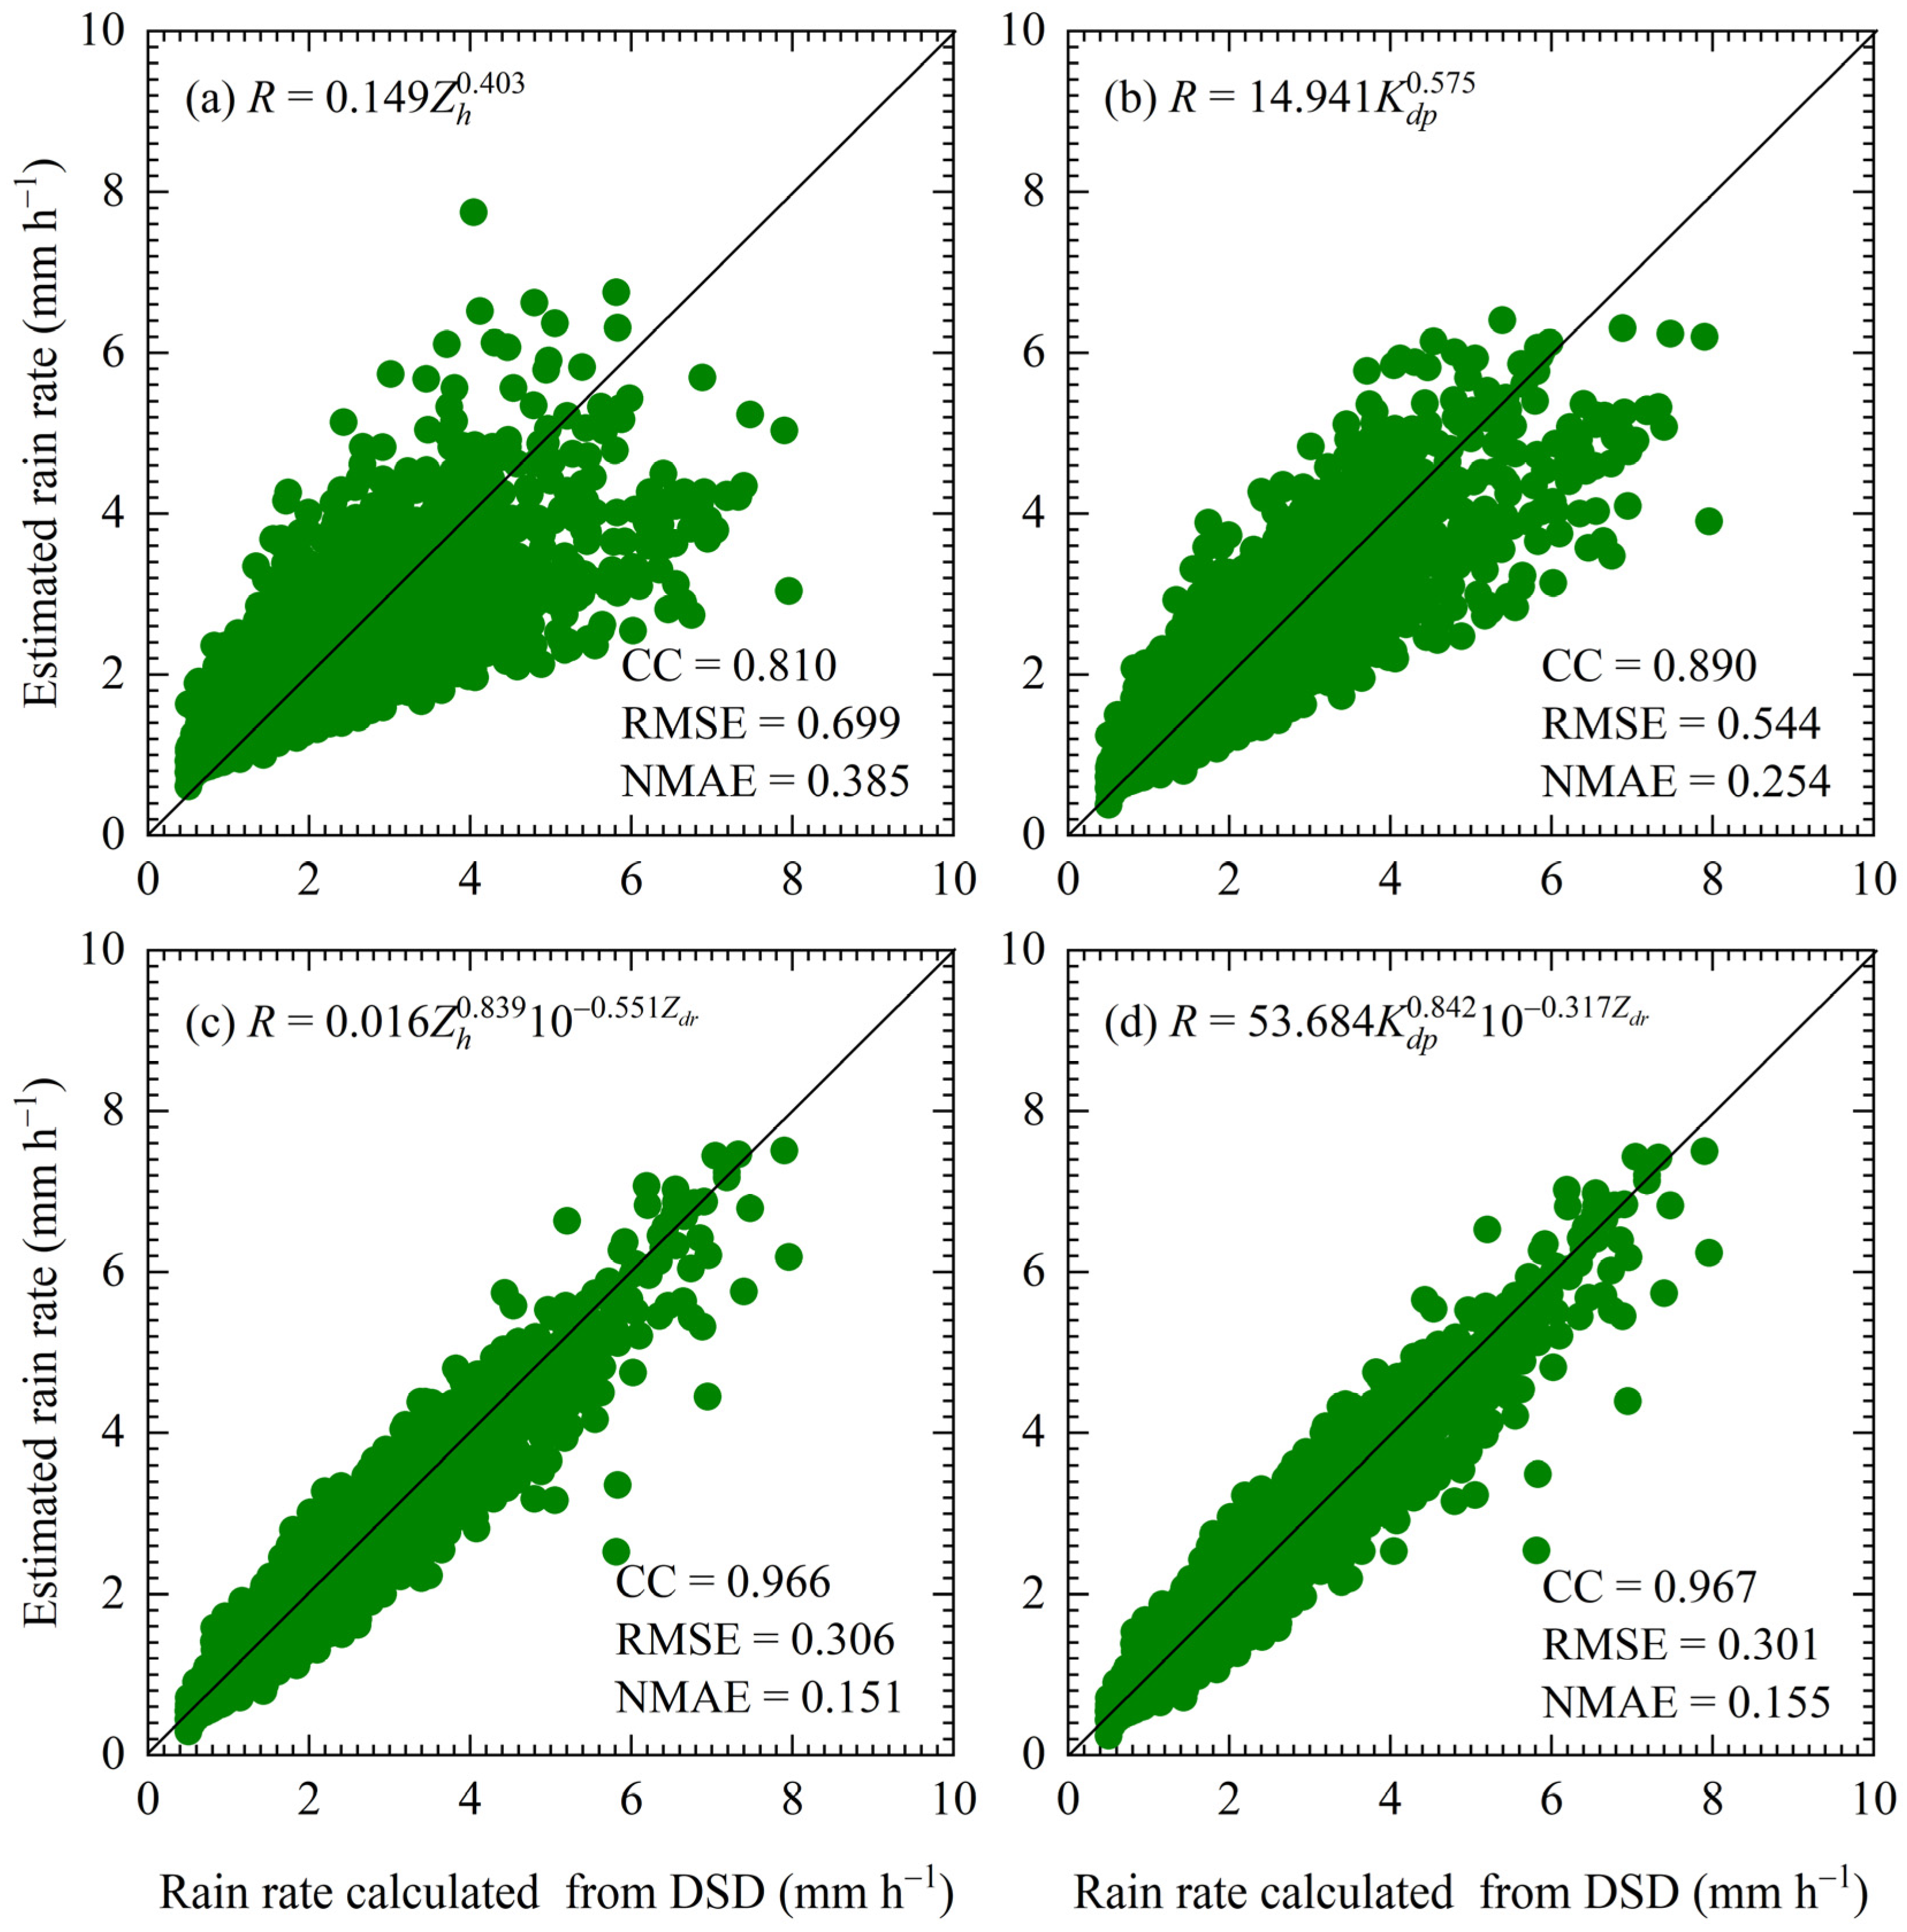
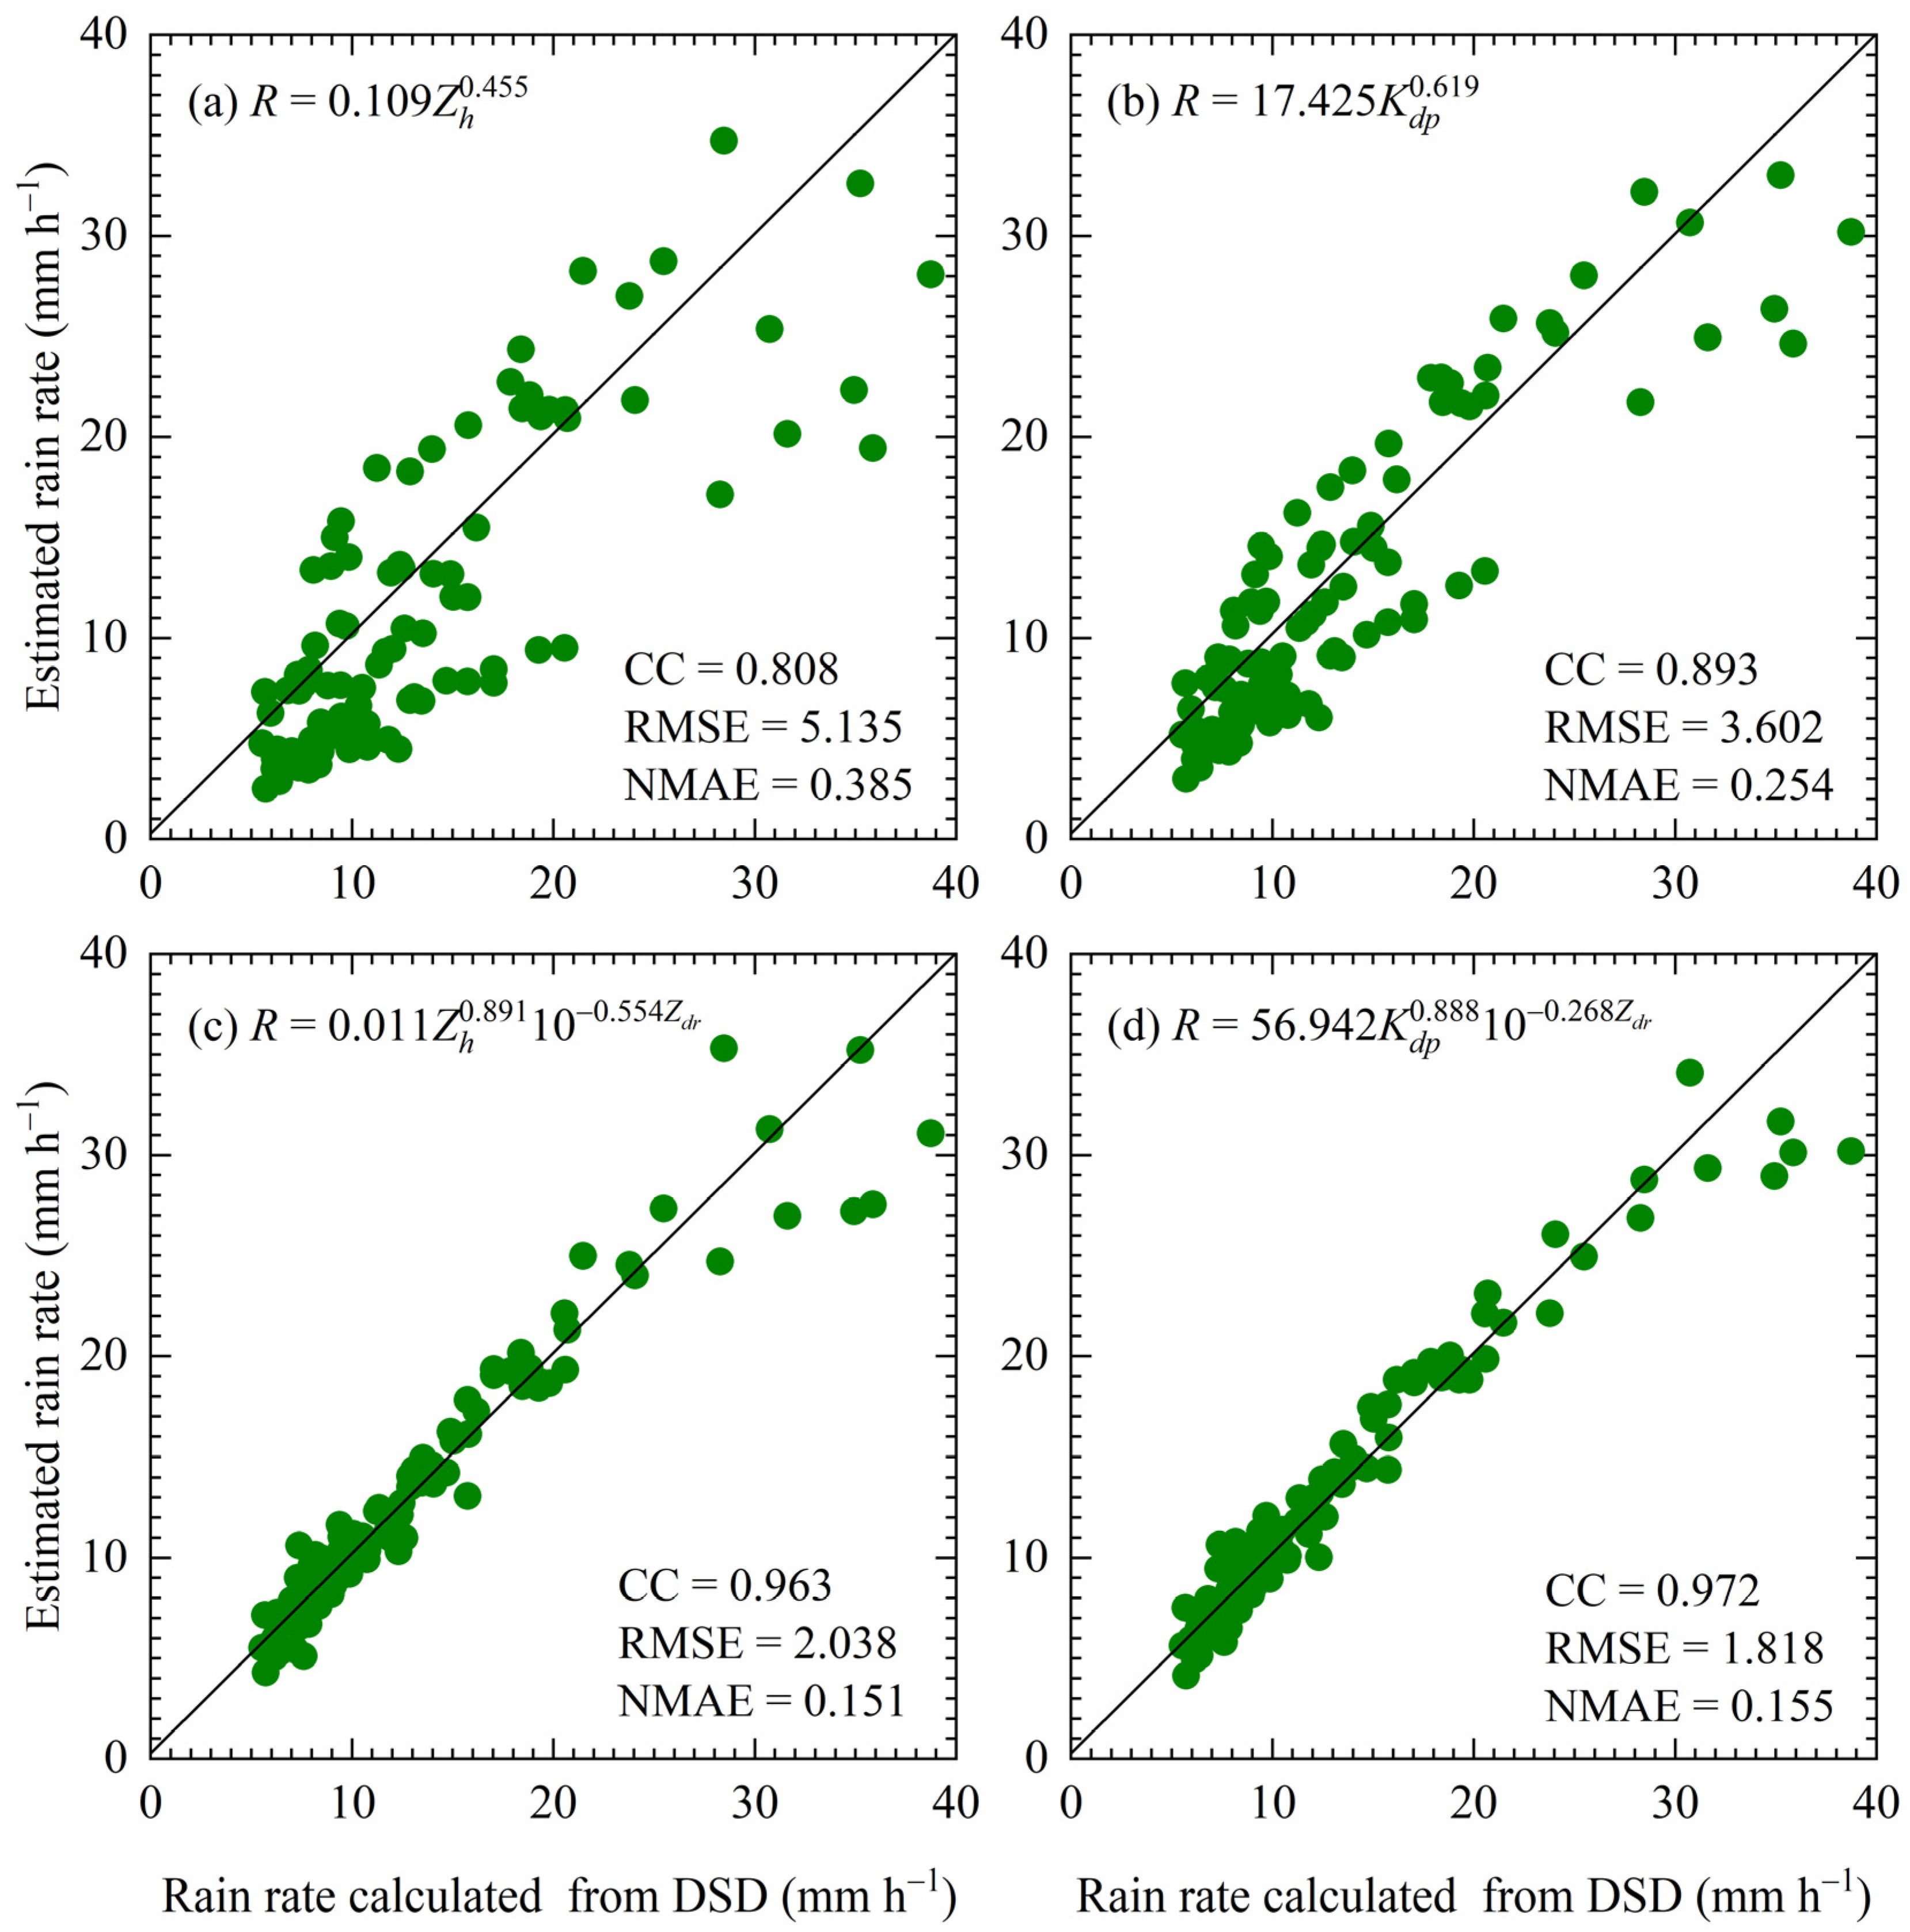
3.3. Quantitative Precipitation Estimation
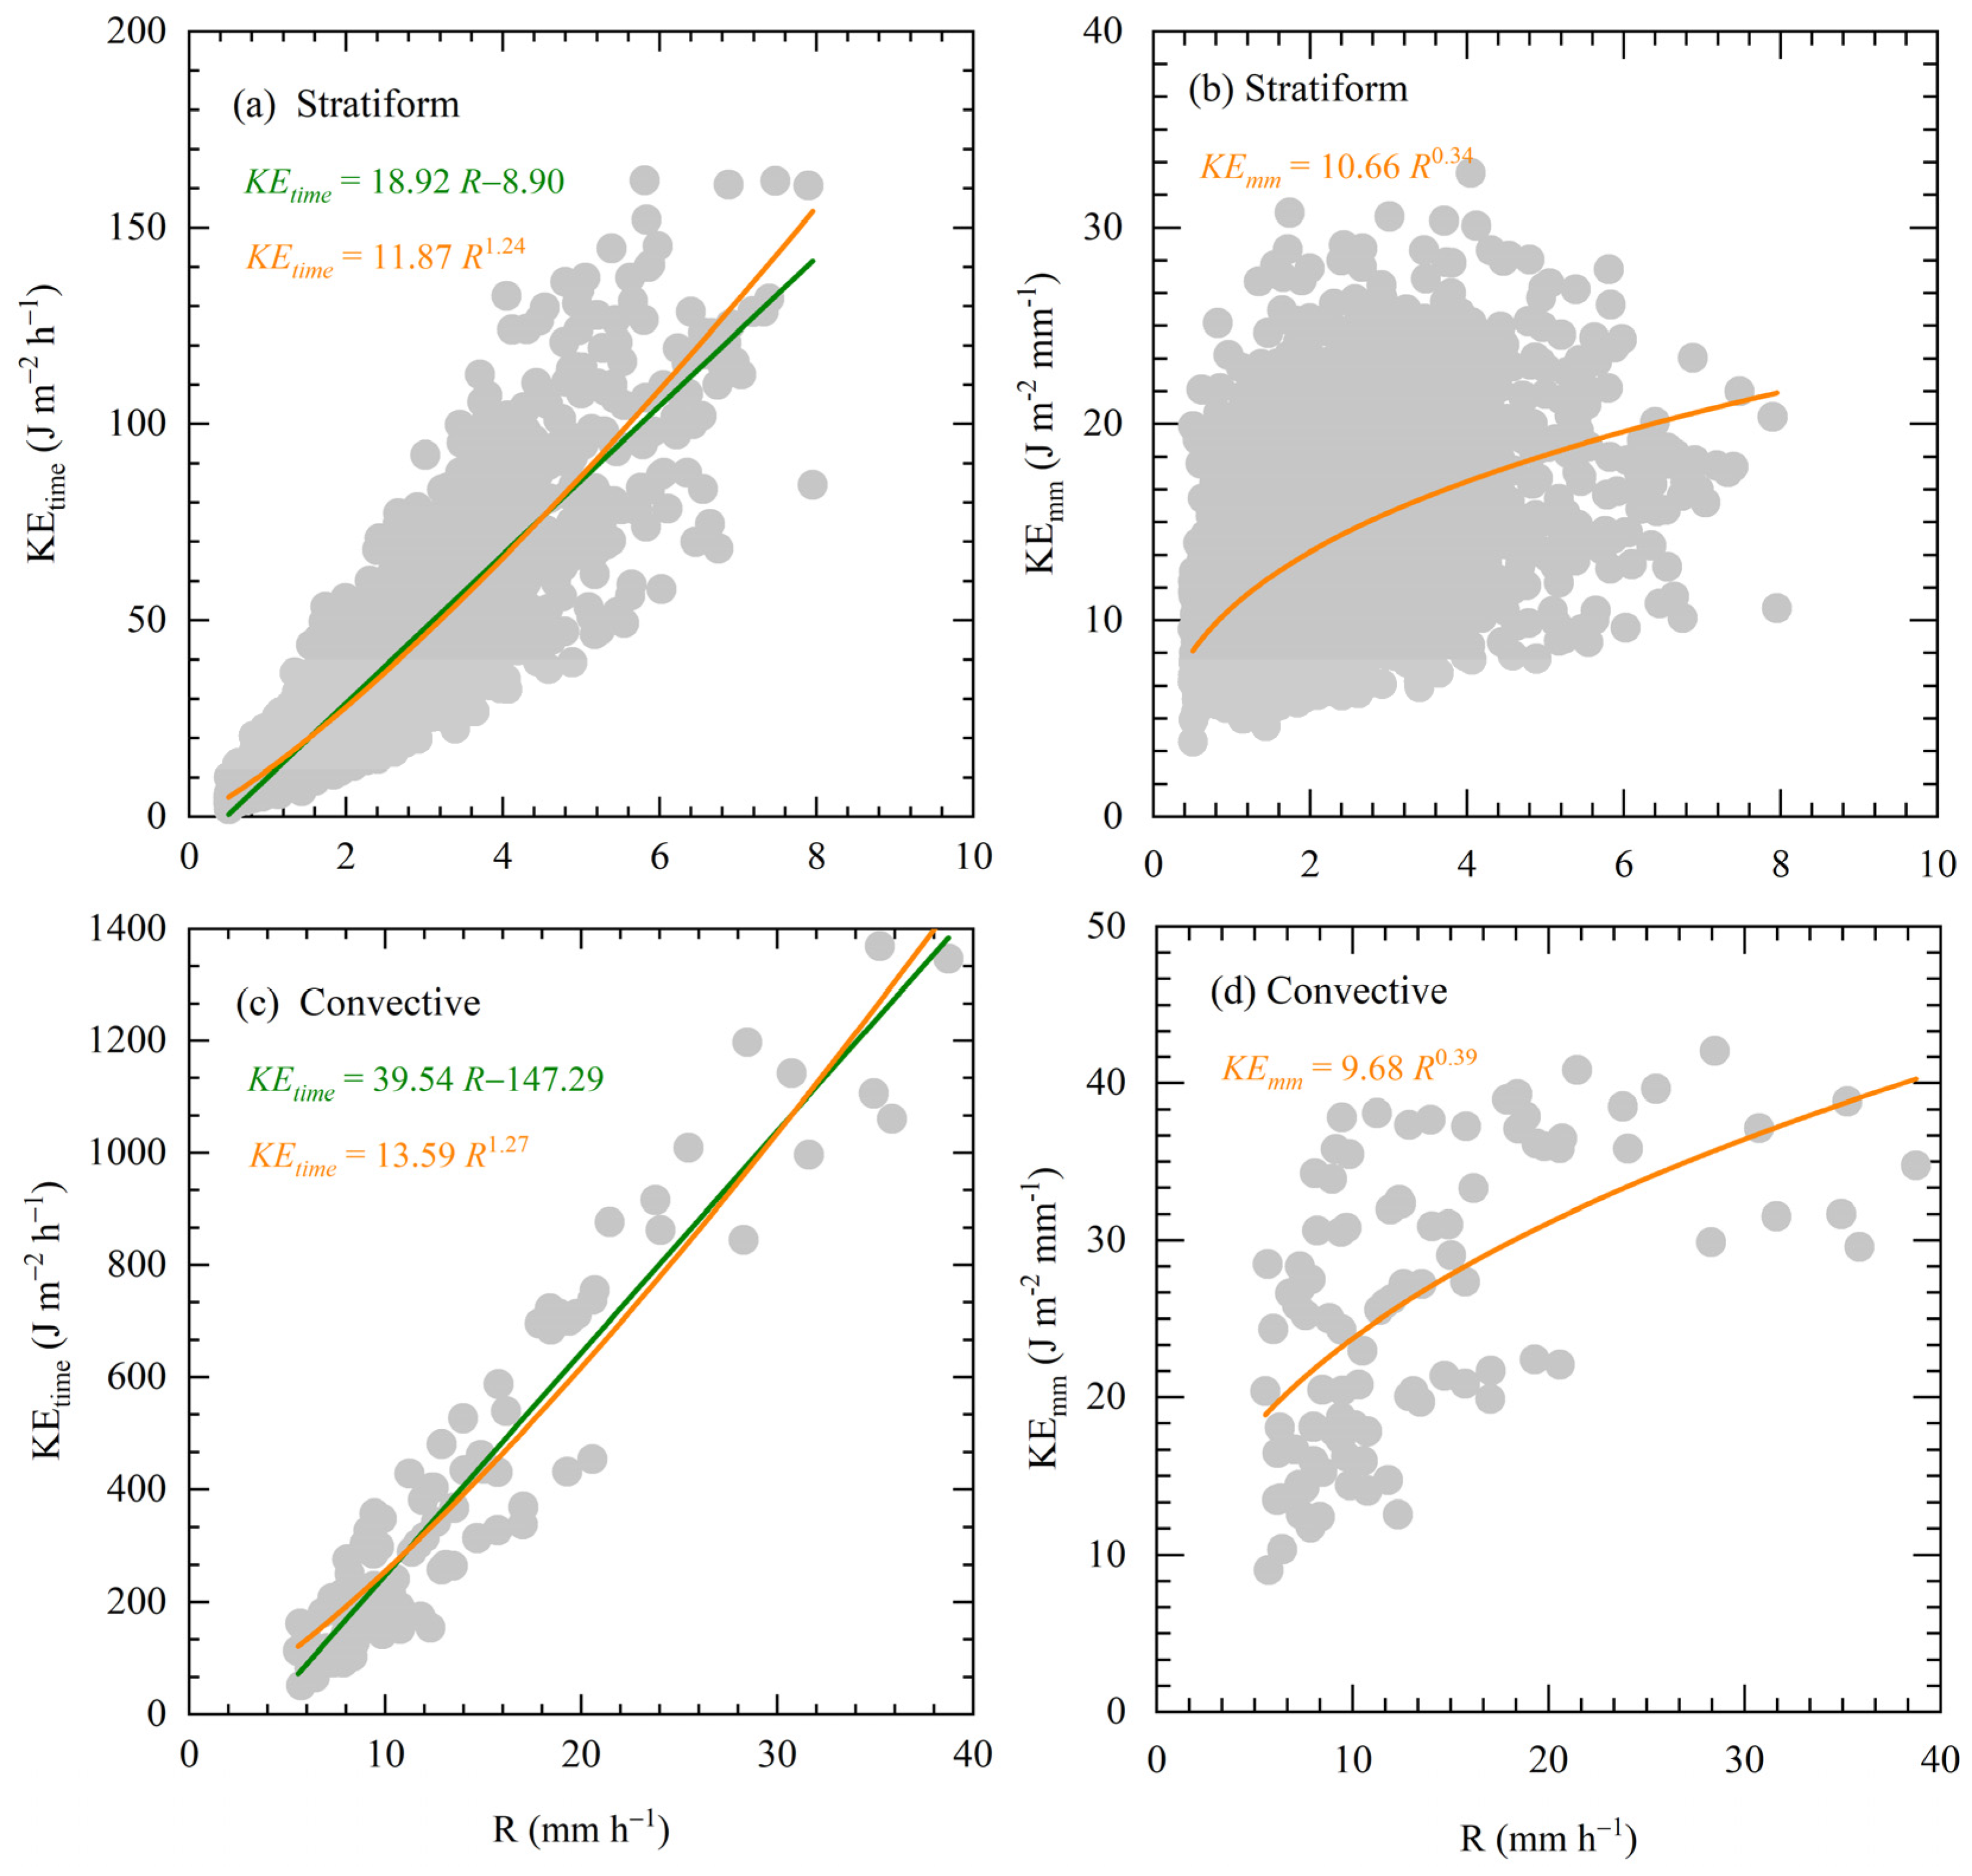
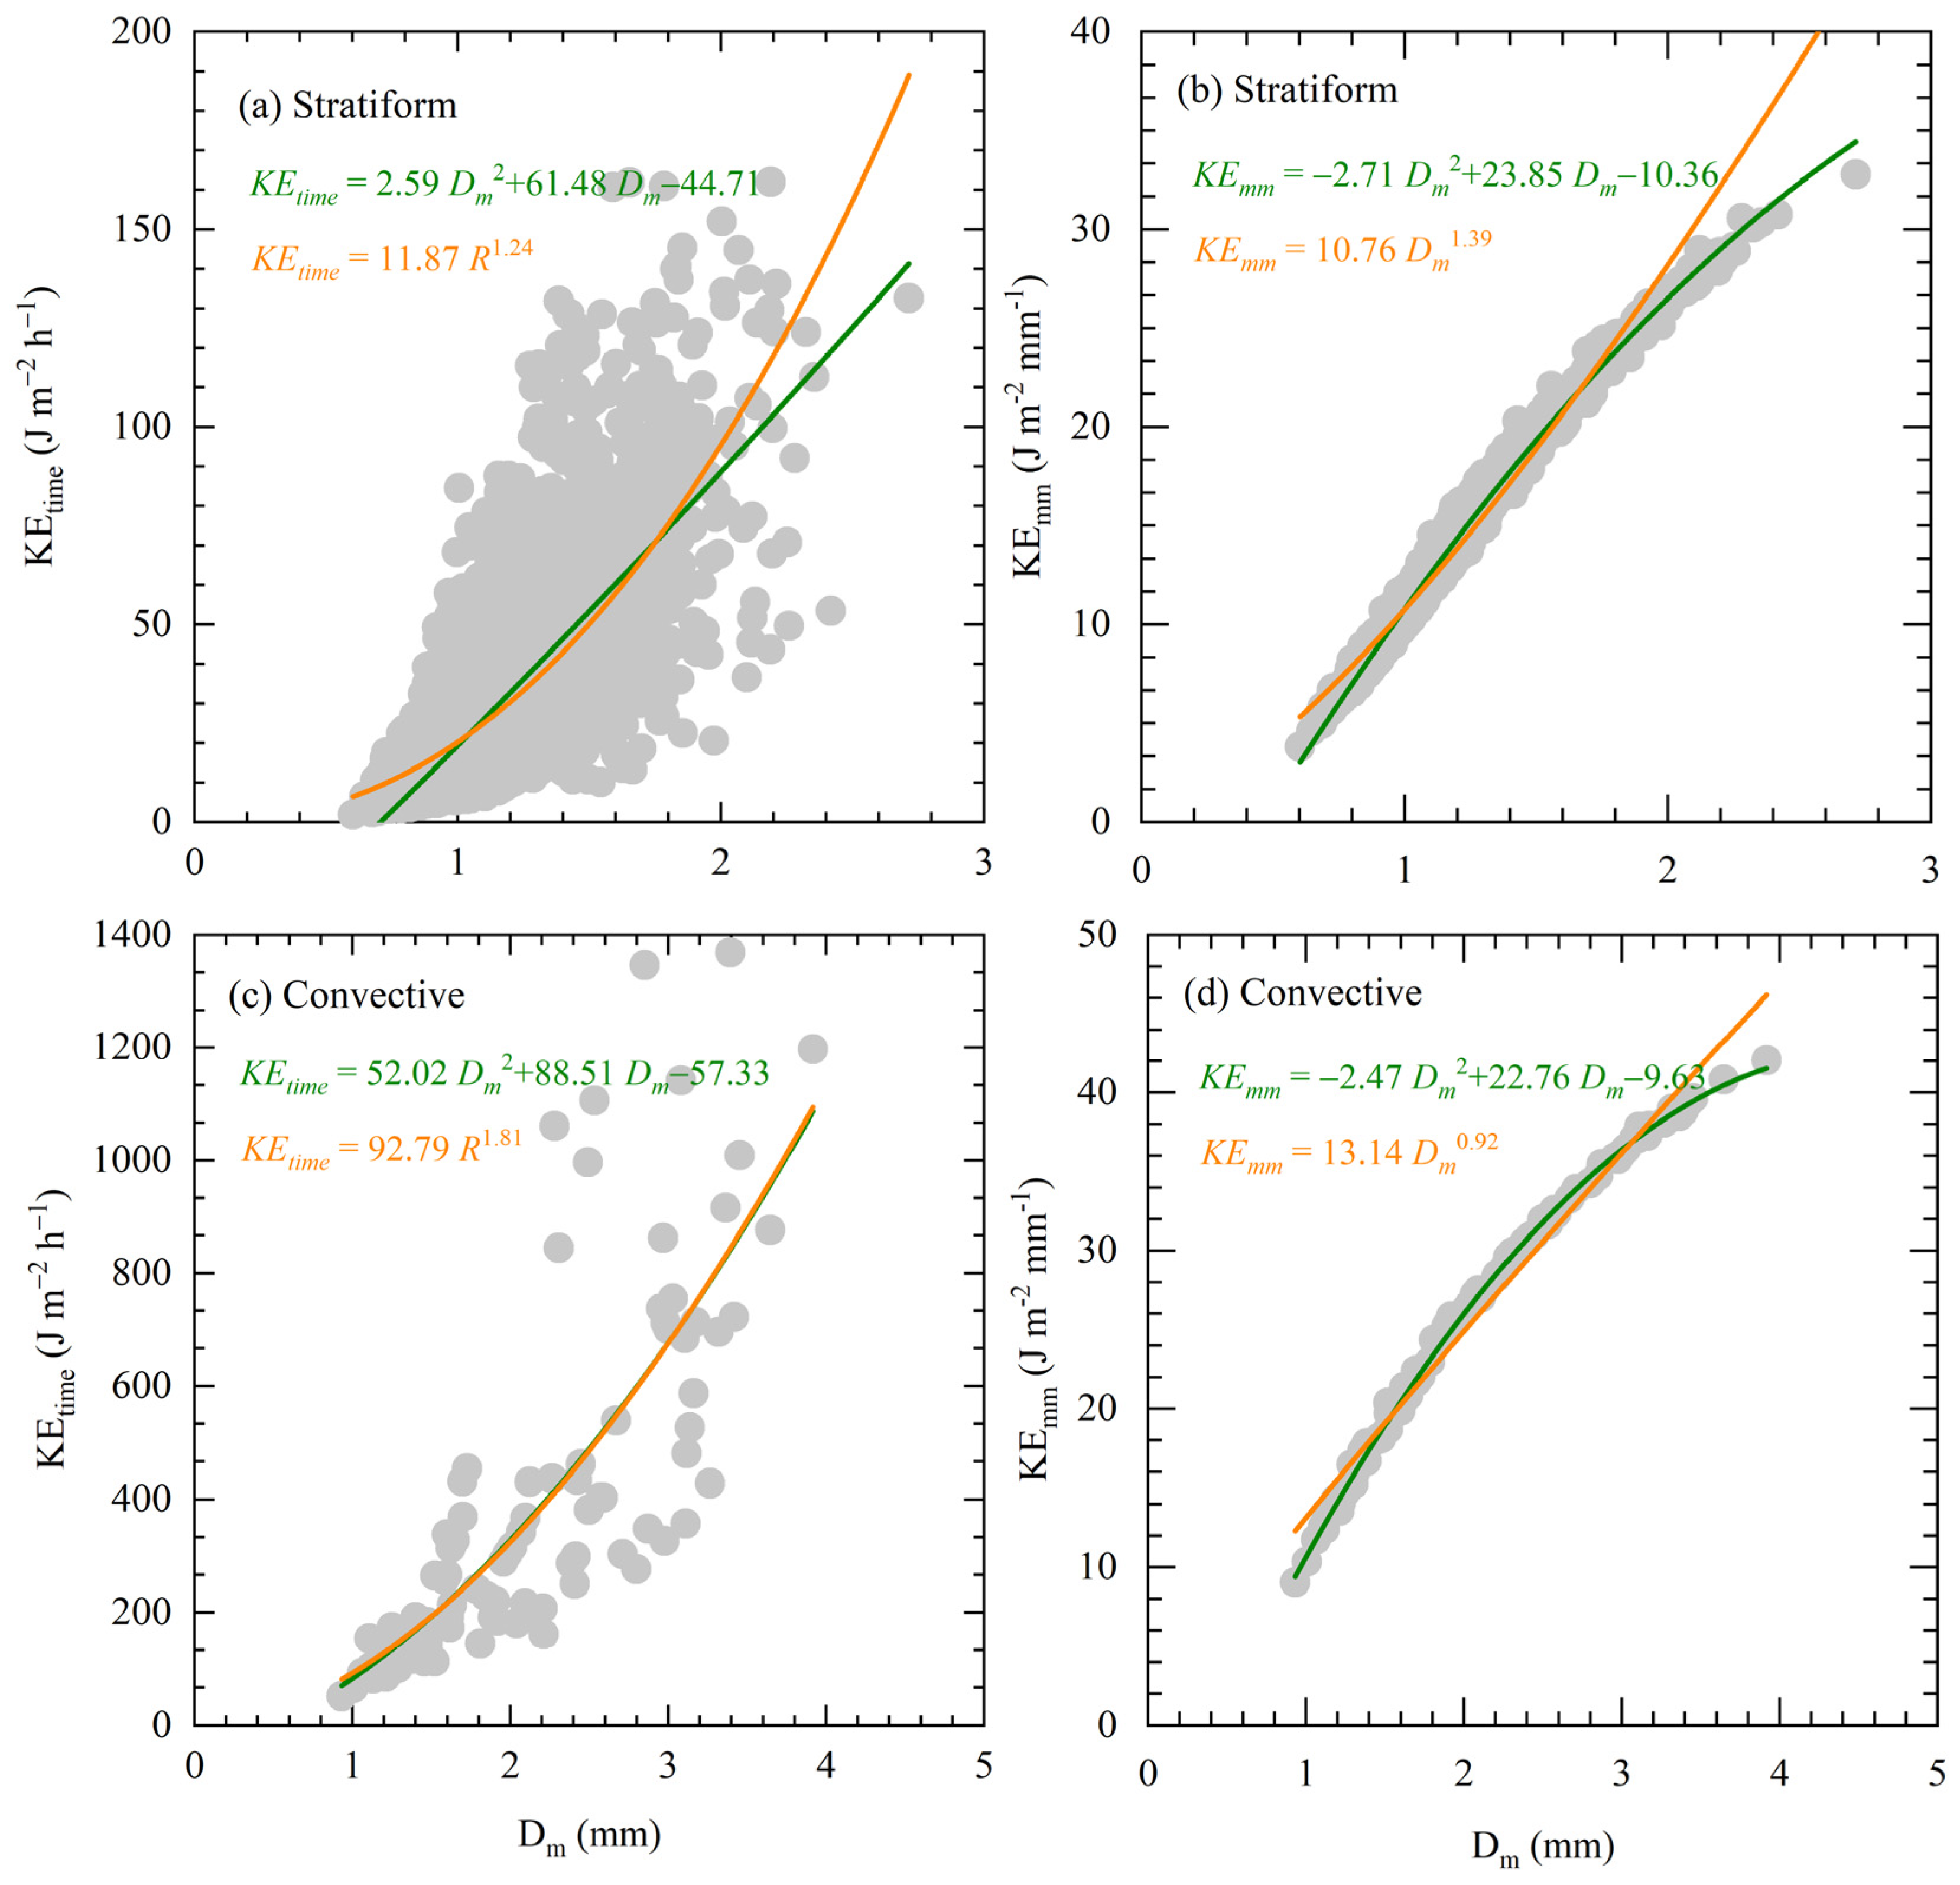
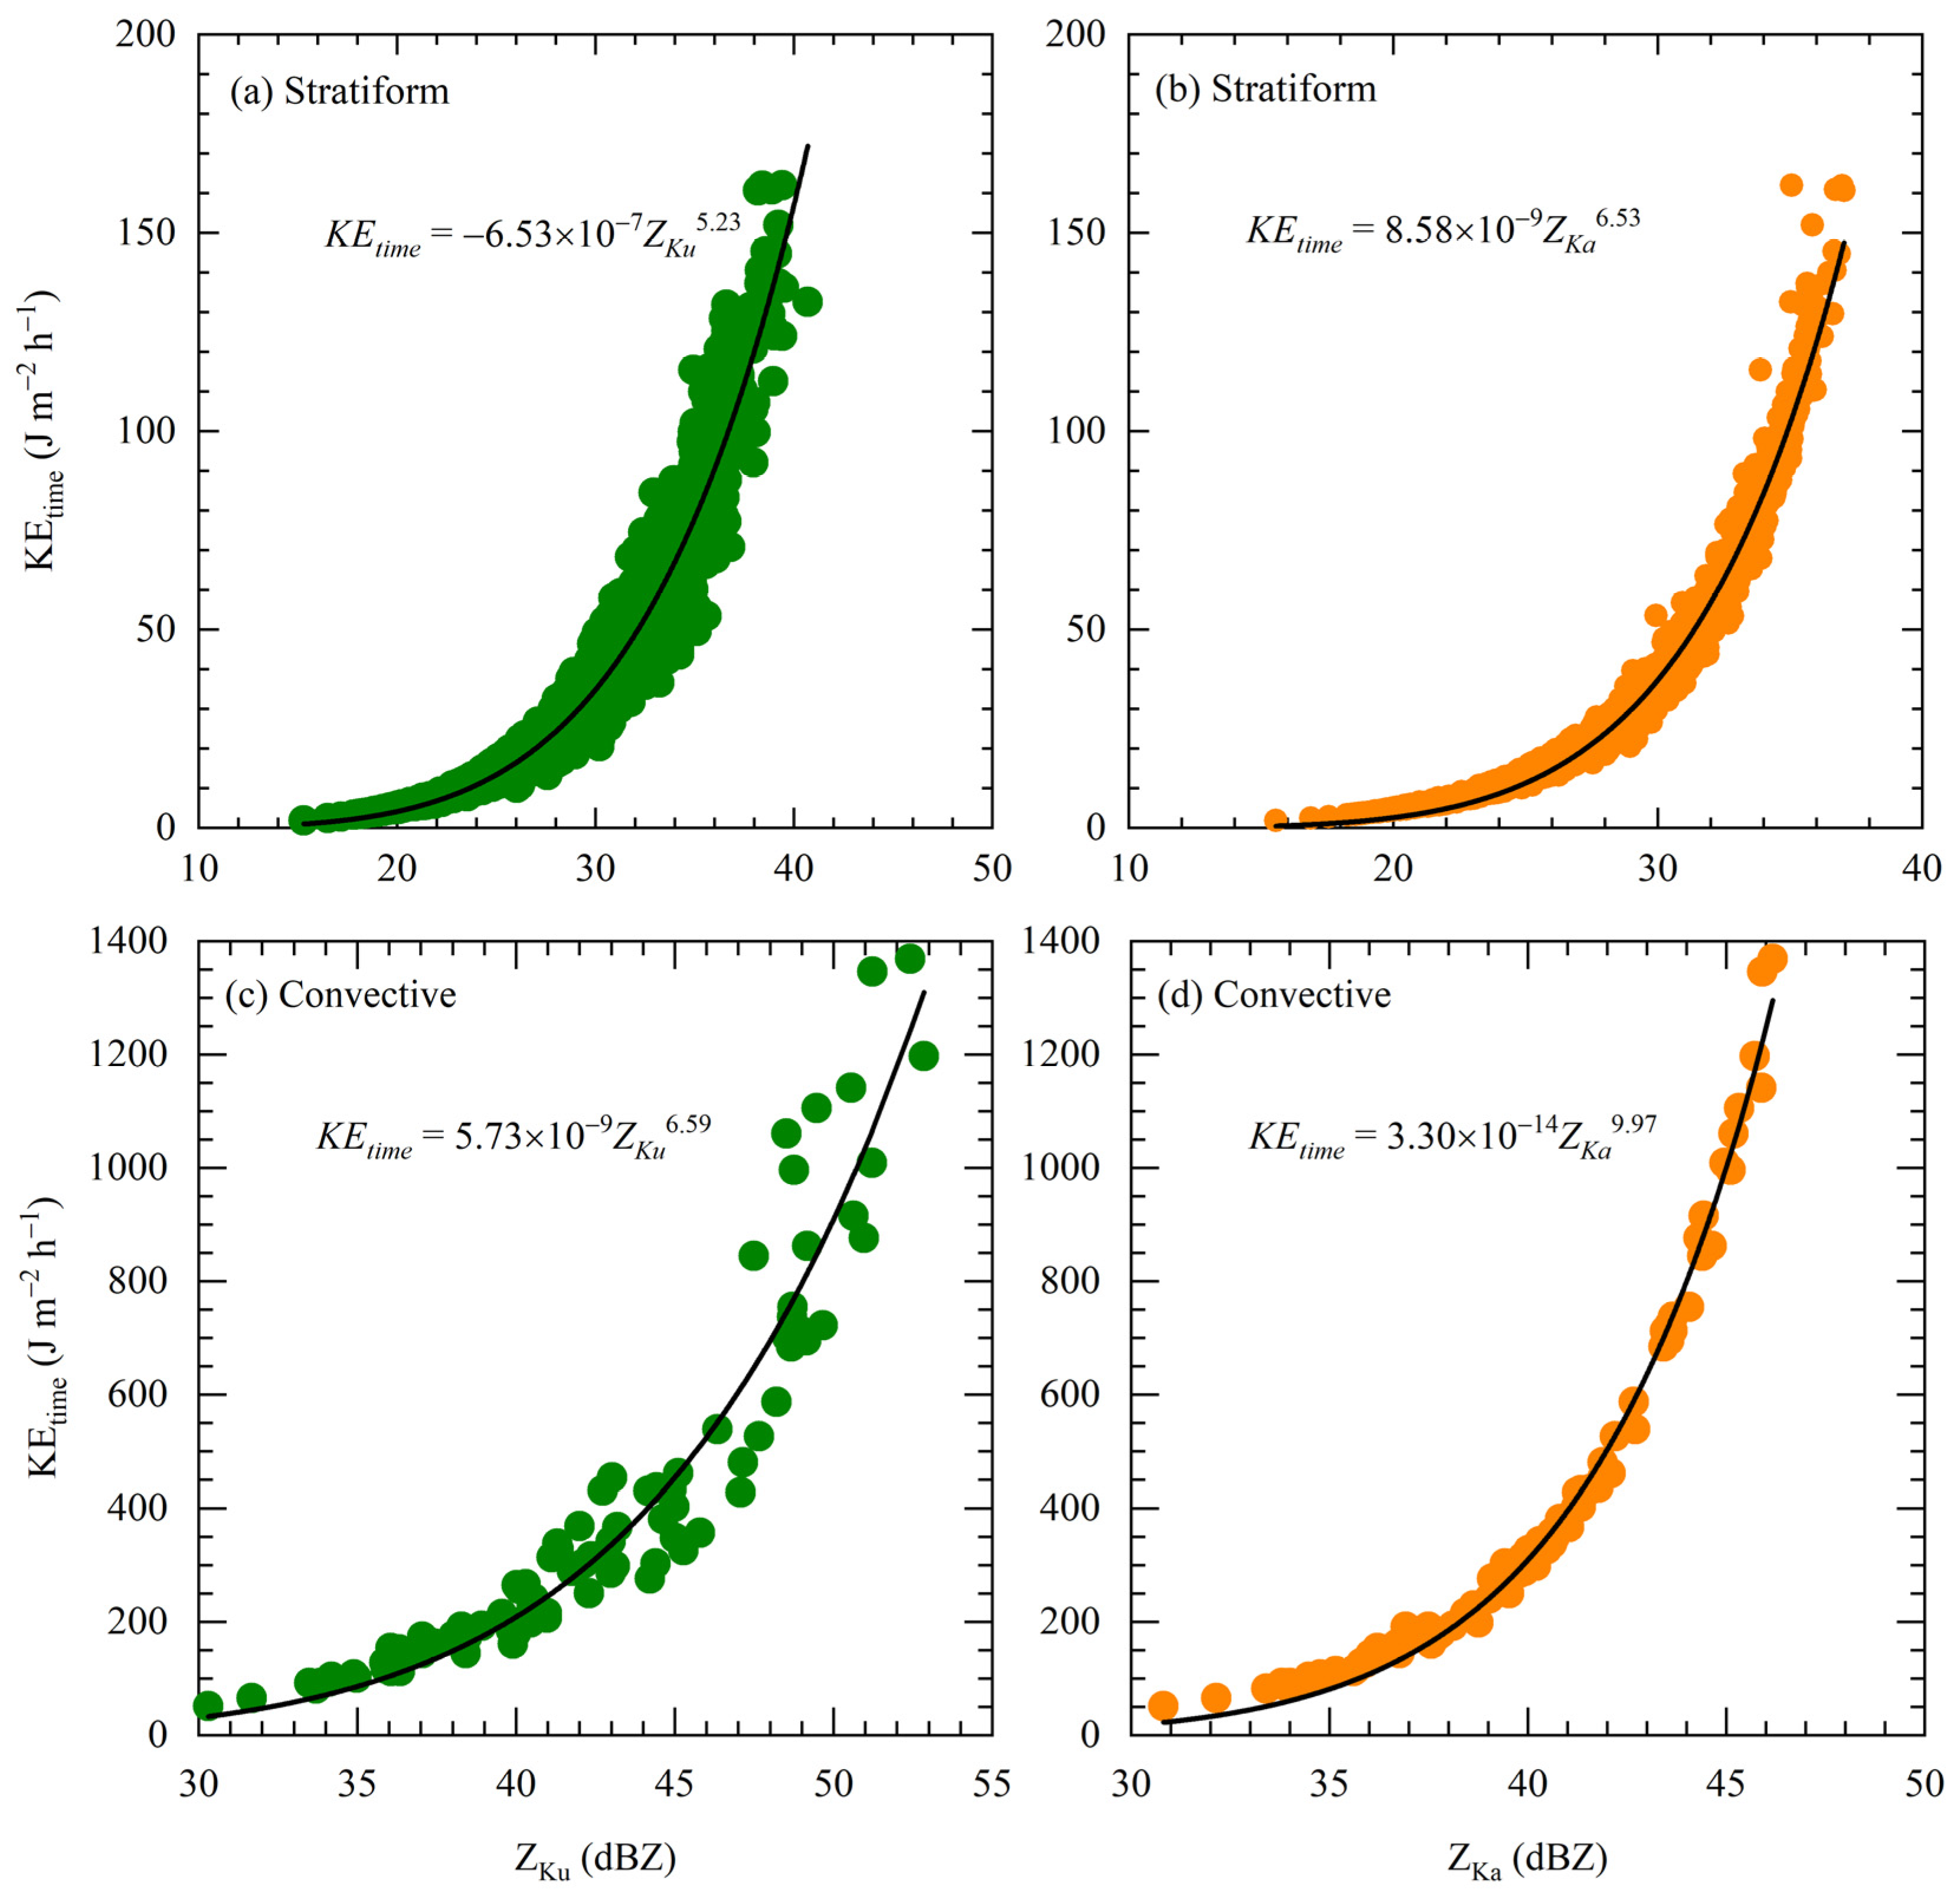
3.4. Rainfall Kinetic Energy Relations
4. Discussion
5. Conclusions
Author Contributions
Funding
Data Availability Statement
Acknowledgments
Conflicts of Interest
References
- Rosenfeld, D.; Ulbrich, C.W. Cloud microphysical properties, processes, and rainfall estimation opportunities. Meteorol. Monogr. 2003, 30, 237–258. [Google Scholar] [CrossRef]
- Zhang, G.; Sun, J.; Brandes, E.A. Improving parameterization of rain microphysics with disdrometer and radar observations. J. Atmos. Sci. 2006, 63, 1273–1290. [Google Scholar] [CrossRef]
- Battan, L.J. Radar Observation of the Atmosphere; University of Chicago Press: Chicago, CA, USA, 1973; p. 324. [Google Scholar]
- Ryzhkov, A.V.; Zrnic, D.S. Comparison of dual polarization radar estimators of rain. J. Atmos. Ocean. Technol. 1995, 12, 249–256. [Google Scholar] [CrossRef]
- Uijlenhoet, R.; Stricker, J.N.M. A consistent rainfall parameterization based on the exponential raindrop size distribution. J. Hydrol. 1999, 218, 101–127. [Google Scholar] [CrossRef]
- Iguchi, T.; Kozu, T.; Meneghini, R.; Awaka, J.; Okamoto, K. Rain-profiling algorithm for the TRMM precipitation radar. J. Appl. Meteorol. 2000, 39, 2038–2052. [Google Scholar] [CrossRef]
- Hou, A.Y.; Kakar, R.K.; Neeck, S.; Azarbarzin, A.A.; Kummerow, C.D.; Kojima, M.; Oki, R.; Nakamura, K.; Iguchi, T. The Global Precipitation Measurement Mission. B. Am. Meteorol. Soc. 2014, 95, 701–722. [Google Scholar] [CrossRef]
- Liao, L.; Meneghini, R.; Tokay, A. Uncertainties of GPM DPR rain estimates caused by DSD parameterizations. J. Appl. Meteor. Climatol. 2014, 53, 2524–2537. [Google Scholar] [CrossRef]
- Ryu, J.; Song, H.-J.; Sohn, B.-J. Global distribution of three types of drop size distribution representing heavy rainfall from GPM/DPR measurements. Geophys. Res. Lett. 2021, 48, e2020GL090871. [Google Scholar] [CrossRef]
- Milbrandt, J.A.; Yau, M.K. A multimoment bulk microphysics parameterization. Part I: Analysis of the role of the spectral shape parameter. J. Atmos. Sci. 2005, 62, 3051–3064. [Google Scholar] [CrossRef]
- Zhang, G.; Xue, M.; Cao, Q. Diagnosing the intercept parameter for exponential raindrop size distribution based on video disdrometer observations: Model development. J. Appl. Meteorol. Climatol. 2008, 47, 2983–2992. [Google Scholar] [CrossRef]
- Wainwright, C.E.; Dawson, D.T.I.; Xue, M.; Zhang, G. Diagnosing the intercept parameters of the exponential drop size distributions in a single-moment microphysics scheme and impact on supercell storm simulations. J. Appl. Meteorol. Climatol. 2014, 53, 2072–2090. [Google Scholar] [CrossRef]
- McFarquhar, G.M.; Hsieh, T.-L.; Freer, M.; Mascio, J.; Jewett, B.F. The characterization of ice hydrometeor gamma size distributions asvolumes in N0–λ–μ phase space: Implications for microphysical process modeling. J. Atmos. Sci. 2015, 72, 892–909. [Google Scholar] [CrossRef]
- Kinnell, P.I.A. Rainfall Intensity-Kinetic Energy Relationships for Soil Loss Prediction1. Soil Sci. Soc. Am. J. 1981, 45, 153. [Google Scholar] [CrossRef]
- Steiner, M.; Smith, J.A. Reflectivity, Rain Rate, and Kinetic Energy Flux Relationships Based on Raindrop Spectra. J. Appl. Meteorol. 2000, 39, 1923–1940. [Google Scholar] [CrossRef]
- Fornis, R.L.; Vermeulen, H.R.; Nieuwenhuis, J.D. Kinetic energy–rainfall intensity relationship for Central Cebu, Philippines for soil erosion studies. J. Hydrol. 2005, 300, 20–32. [Google Scholar] [CrossRef]
- Janapati, J.; Seela, B.K.; Lin, P.-L. An assessment of tropical cyclones rainfall erosivity for Taiwan. Sci. Rep. 2019, 9, 15862–15864. [Google Scholar] [CrossRef] [PubMed]
- Ulbrich, C.W. Natural variations in the analytical form of the raindrop size distribution. J. Clim. Appl. Meteorol. 1983, 22, 1764–1775. [Google Scholar] [CrossRef]
- Tokay, A.; Short, D.A. Evidence from tropical raindrop spectra of the origin of rain from stratiform versus convective clouds. J. Appl. Meteorol. 1996, 35, 355–371. [Google Scholar] [CrossRef]
- Bringi, V.N.; Chandrasekar, V.; Hubbert, J.; Gorgucci, E.; Randeu, W.L.; Schoenhuber, M. Raindrop size distribution in different climatic regimes from disdrometer and dual-polarized radar analysis. J. Atmos. Sci. 2003, 60, 354–365. [Google Scholar] [CrossRef]
- Konwar, M.; Das, S.K.; Deshpande, S.M.; Chakravarty, K.; Goswami, B.N. Microphysics of clouds and rain over the Western Ghat. J. Geophys. Res. Atmos. 2014, 119, 6140–6159. [Google Scholar] [CrossRef]
- Chen, B.; Hu, Z.; Liu, L.; Zhang, G. Raindrop Size Distribution Measurements at 4,500 m on the Tibetan Plateau During TIPEX-III. J. Geophys. Res. Atmos. 2017, 12211, 11092–12006. [Google Scholar] [CrossRef]
- Pu, K.; Liu, X.; Wu, Y.; Hu, S.; Liu, L.; Gao, T. A comparison study of raindrop size distribution among five sites at the urban scale during the East Asian rainy season. J. Hydrol. 2020, 590, 125500. [Google Scholar] [CrossRef]
- Seela, B.K.; Janapati, J.; Lin, P.-L.; Reddy, K.K.; Shirooka, R.; Wang, P.K. A Comparison Study of Summer Season Raindrop Size Distribution Between Palau and Taiwan, Two Islands in Western Pacific. J. Geophys. Res. Atmos. 2017, 122, 11–787. [Google Scholar] [CrossRef]
- Seela, B.K.; Janapati, J.; Kalath Unnikrishnan, C.; Lin, P.-L.; Le Loh, J.; Chang, W.-Y.; Kumar, U.; Reddy, K.K.; Lee, D.-I.; Venkatrami Reddy, M. Raindrop Size Distributions of North Indian Ocean Tropical Cyclones Observed at the Coastal and Inland Stations in South India. Remote Sens. 2021, 13, 3178. [Google Scholar] [CrossRef]
- Suh, S.-H.; You, C.-H.; Lee, D.-I. Climatological characteristics of raindrop size distributions in Busan, Republic of Korea. Hydrol. Earth Syst. Sci. 2016, 20, 193–207. [Google Scholar] [CrossRef]
- Tokay, A.; Short, D.A.; Williams, C.R.; Ecklund, W.L.; Gage, K.S. Tropical Rainfall Associated with Convective and Stratiform Clouds: Intercomparison of Disdrometer and Profiler Measurements. J. Appl. Meteorol. 1999, 38, 302–320. [Google Scholar] [CrossRef]
- Tokay, A.; Bashor, P.G.; Habib, E.; Kasparis, T. Raindrop size distribution measurements in tropical cyclones. Mon. Weather. Rev. 2008, 136, 1669–1685. [Google Scholar] [CrossRef]
- Chen, B.; Yang, J.; Pu, J. Statistical characteristics of raindrop size distribution in the Meiyu season observed in eastern China. J. Meteorol. Soc. Jpn. 2013, 91, 215–227. [Google Scholar] [CrossRef]
- Wen, L.; Zhao, K.; Chen, G. Drop size distribution characteristics of seven typhoons in China. J. Geophys. Res. Atmos. 2018, 123, 6529–6548. [Google Scholar] [CrossRef]
- Fu, Z.; Dong, X.; Zhou, L.; Cui, W.; Wang, J.; Wan, R.; Leng, L.; Xi, B. Statistical characteristics of raindrop size distributions and parameters in Central China during the Meiyu seasons. J. Geophys. Res. Atmos. 2020, 125, e2019JD031954. [Google Scholar] [CrossRef]
- Janapati, J.; Seela, B.K.; Lin, P.-L. Raindrop size distribution characteristics of Indian and Pacific Ocean tropical cyclones observed at India and Taiwan sites. J. Meteor. Soc. Jpn. 2020, 98, 299–317. [Google Scholar] [CrossRef]
- Janapati, J.; Seela, B.K.; Lin, P.-L.; Lee, M.-T.; Joseph, E. Microphysical features of typhoon and non-typhoon rainfall observed in Taiwan, an island in the northwestern Pacific. Hydrol. Earth Syst. Sci. 2021, 25, 4025–4040. [Google Scholar] [CrossRef]
- Wang, G.; Zhou, R.; Zhaxi, S.; Liu, S. Raindrop size distribution measurements on the Southeast Tibetan Plateau during the STEP project. Atmos. Res. 2021, 249, 105311. [Google Scholar] [CrossRef]
- Sumesh, R.K.; Resmi, E.A.; Unnikrishnan, C.K. Signatures of shallow and deep clouds inferred from precipitation microphysics over windward side of Western Ghats. J. Geophys. Res. Atmos. 2021, 126, e2020JD034312. [Google Scholar] [CrossRef]
- Seela, B.K.; Janapati, J.; Lin, P.-L. Raindrop size distribution characteristics of the western Pacific tropical cyclones measured in the Palau islands. Remote Sens. 2022, 14, 470. [Google Scholar] [CrossRef]
- Seela, B.K.; Janapati, J.; Lin, P.-L.; Wang, P.K.; Lee, M.-T. Raindrop Size Distribution Characteristics of Summer and Winter Season Rainfall Over North Taiwan. J. Geophys. Res. Atmos. 2018, 123, 11–602. [Google Scholar] [CrossRef]
- Zheng, J.; Liu, L.; Chen, H. Characteristics of warm clouds and precipitation in South China during the pre-flood season using datasets from a cloud radar, a ceilometer, and a disdrometer. Remote Sens. 2019, 11, 3045. [Google Scholar] [CrossRef]
- Wen, L.; Zhao, K.; Wang, M. Seasonal variations of observed raindrop size distribution in East China. Adv. Atmos. Sci. 2019, 36, 346–362. [Google Scholar] [CrossRef]
- Ramadhan, R.; Marzuki, M.; Harmadi, H. Diurnal variation in the vertical profile of the raindrop size distribution for stratiform rain as inferred from micro rain radar observations in Sumatra. Adv. Atmos. Sci. 2020, 37, 832–846. [Google Scholar] [CrossRef]
- Xie, Z.; Yang, H.; Lv, H. Seasonal characteristics of disdrometer-observed raindrop size distributions and their applications on radar calibration and erosion mechanism in a semi-arid area of China. Remote Sens. 2020, 12, 262. [Google Scholar] [CrossRef]
- Luo, L.; Guo, J.; Chen, H. Microphysical characteristics of rainfall observed by a 2DVD disdrometer during different seasons in Beijing, China. Remote Sens. 2021, 13, 2303. [Google Scholar] [CrossRef]
- Ma, Y.; Ni, G.; Chandra, C.V. Statistical characteristics of raindrop size distribution during rainy seasons in the Beijing urban area and implications for radar rainfall estimation. Hydrol. Earth Syst. Sci. 2019, 23, 4153–4170. [Google Scholar] [CrossRef]
- Wang, G.L.; Li, R.; Sun, J. Comparative analysis of the characteristics of rainy season raindrop size distributions in two typical regions of the Tibetan Plateau. Adv. Atmos. Sci. 2022, 39, 1062–1078. [Google Scholar] [CrossRef]
- Sorg, A.; Bolch, T.; Stoffel, M. Climate change impacts on glaciers and runoff in Tien Shan (Central Asia). Nat. Clim. Change 2012, 10, 725–731. [Google Scholar] [CrossRef]
- Zhang, J.B.; Deng, Z.F. A Generality of Rainfall in Xinjiang; Meteorological Press: Beijing, China, 1987; pp. 1–10. (In Chinese) [Google Scholar]
- Yang, L.M.; Li, X.; Zhang, G.X. Some advances and problems in the study of heavy rain in Xinjiang. Clim. Environ. Res. 2011, 16, 188–198. (In Chinese) [Google Scholar]
- Chen, Y.; Li, W.; Deng, H.; Fang, G.; Li, Z. Changes in Central Asia’s Water Tower: Past, present and future. Sci. Rep. 2016, 6, 35458. [Google Scholar] [CrossRef]
- Zeng, Y.; Yang, L. Triggering mechanism of an extreme rainstorm process near the Tianshan Mountains in Xinjiang, an arid region in China, based on a numerical simulation. Adv. Meteorol. 2020, 2020, 8828060. [Google Scholar] [CrossRef]
- Huang, X.; Zhou, Y.; Ran, L. Analysis of the environmental field and unstable conditions on a rainstorm Event in the Ili Valley of Xinjiang. Chin. J. Atmos. Sci. 2021, 45, 148–164. (In Chinese) [Google Scholar]
- Zeng, Y.; Yang, L.; Zhang, Z.; Tong, Z.; Li, J.; Liu, F.; Zhang, J.; Jiang, Y. Characteristics of clouds and raindrop size distribution in Xinjiang, using cloud radar datasets and a disdrometer. Atmosphere 2020, 11, 1382. [Google Scholar] [CrossRef]
- Zeng, Y.; Yang, L.; Tong, Z.; Jiang, Y.; Zhang, Z.; Zhang, J.; Zhou, Y.; Li, J.; Liu, F.; Liu, J. Statistical characteristics of raindrop size distribution during rainy seasons in Northwest China. Adv. Meteorol. 2021, 2021, 6667786. [Google Scholar] [CrossRef]
- Löffler-Mang, M.; Joss, J. An optical disdrometer for measuring size and velocity of hydrometeors. J. Atmos. Ocean. Technol. 2000, 17, 130–139. [Google Scholar] [CrossRef]
- Yuter, S.E.; Kingsmill, D.E.; Nance, L.B.; Löffler-Mang, M. Observations of precipitation size and fall speed characteristics within coexisting rain and wet snow. J. Appl. Meteorol. 2006, 45, 1450–1464. [Google Scholar] [CrossRef]
- Friedrich, K.; Higgins, S.; Masters, F.J.; Lopez, C.R. Articulating and stationary PARSIVEL disdrometer measurements in conditions with strong Winds and heavy rainfall. J. Atmos. Oceanic Technol. 2013, 30, 2063–2080. [Google Scholar] [CrossRef]
- Atlas, D.; Srivastava, R.C.; Sekhon, R.S. Doppler radar characteristics of precipitation at vertical incidence. Rev. Geophys. 1973, 11, 1–35. [Google Scholar] [CrossRef]
- Jaffrain, J.; Berne, A. Experimental quantification of the sampling uncertainty associated with measurements from PARSIVEL disdrometers. J. Hydrometeor. 2011, 12, 352–370. [Google Scholar] [CrossRef]
- Tokay, A.; Petersen, W.A.; Gatlin, P.; Wingo, M. Comparison of raindrop size distribution measurements by collocated disdrometers. J. Atmos. Ocean. Technol. 2013, 30, 1672–1690. [Google Scholar] [CrossRef]
- Tokay, A.; Wolff, D.B.; Petersen, W.A. Evaluation of the new version of the laser-optical disdrometer, OTT Parsivel2. J. Atmos. Ocean. Technol. 2014, 31, 1276–1288. [Google Scholar] [CrossRef]
- Battaglia, A.; Rustemeier, E.; Tokay, A. PARSIVEL snow observations: A critical assessment. J. Atmos. Oceanic Technol. 2010, 27, 333–344. [Google Scholar] [CrossRef]
- Gunn, R.; Kinzer, D.G. The terminal velocity of fall for water droplets in stagnant air. J. Meteor. 1949, 6, 243–248. [Google Scholar] [CrossRef]
- Ulbrich, C.W.; Atlas, D. Rainfall microphysics and radar properties: Analysis methods for drop size spectra. J. Appl. Meteorol. 1998, 37, 912–923. [Google Scholar] [CrossRef]
- Zhang, G.; Vivekanandan, J.; Brandes, E.A.; Meneghini, R.; Kozu, T. The shape-slope relation in observed gamma raindrop size distributions: Statistical error or useful information? J. Atmos. Ocean. Technol. 2003, 20, 1106–1119. [Google Scholar] [CrossRef]
- Willis, P.T. Functional fits to some observed drop size distributions and parameterization of rain. J. Atmos. Sci. 1984, 41, 1648–1661. [Google Scholar] [CrossRef]
- Sempere Torres, D.; Porrà, J.M.; Creutin, J.D. A general formulation for raindrop size distribution. J. Appl. Meteorol. 1994, 33, 1494–1502. [Google Scholar] [CrossRef]
- Sempere Torres, D.; Porrà, J.M.; Creutin, J.D. Experimental evidence of a general description for raindrop size distribution properties. J. Geophys. Res. 1998, 103, 1785–1797. [Google Scholar] [CrossRef]
- Testud, J.; Oury, S.; Amayenc, P.; Black, R.A. The concept of “normalized” distributions to describe raindrop spectra: A tool for cloud physics and cloud remote sensing. J. Appl. Meteorol. 2001, 40, 1118–1140. [Google Scholar] [CrossRef]
- Bringi, V.N.; Chandrasekar, V. Polarimetric Doppler Weather Radar: Principles and Applications; Cambridge University Press: Cambridge, UK, 2001; p. 636. [Google Scholar]
- Salles, C.; Poesen, J.; Sempere-Torres, D. Kinetic energy of rain and its functional relationship with intensity. J. Hydrol. 2002, 257, 256–270. [Google Scholar] [CrossRef]
- Van Dijk, A.; Bruijnzeel, L.A.; Rosewell, C.J. Rainfall intensity–kinetic energy relationships: A critical literature appraisal. J. Hydrol. 2002, 261, 1–23. [Google Scholar] [CrossRef]
- Bringi, V.N.; Williams, C.R.; Thurai, M. Using dual- polarized radar and dual-frequency profiler for DSD characterization: A case study from Darwin, Australia. J. Atmos. Oceanic Technol. 2009, 26, 2107–2122. [Google Scholar] [CrossRef]
- Zhang, H.; Zhang, Y.; He, H. Comparison of Raindrop Size Distributions in a Midlatitude Continental Squall Line during Different Stages as Measured by Parsivel over East China. J. Appl. Meteorol. Climatol. 2017, 56, 2097–2111. [Google Scholar] [CrossRef]
- Wu, Z.; Zhang, Y.; Zhang, L.; Lei, H.; Xie, Y.; Wen, L.; Yang, J. Characteristics of summer season raindrop size distribution in three typical regions of western Pacific. J. Geophys. Res. Atmos. 2019, 124, 4054–4073. [Google Scholar] [CrossRef]
- Ji, L.; Chen, H.N.; Li, L.; Chen, B.J.; Xiao, X.; Chen, M.; Zhang, G.F. Raindrop Size Distributions and Rain Characteristics Observed by a PARSIVEL Disdrometer in Beijing, Northern China. Remote Sens. 2019, 11, 1479. [Google Scholar] [CrossRef]
- Mishchenko, M.I. Calculation of the amplitude matrix for a nonspherical particle in a fixed orientation. Appl. Opt. 2000, 39, 1026–1031. [Google Scholar] [CrossRef] [PubMed]
- Kalogiros, J.; Anagnostou, M.N.; Anagnostou, E.N. Optimum estimation of rain microphysical parameters from X-band dual-polarization radar observables. IEEE Trans. Geosci. Remote Sens. 2013, 51, 3063–3076. [Google Scholar] [CrossRef]
- Leinonen, J. High-level interface to T-matrix scattering calculations: Architecture, capabilities and limitations. Opt. Express 2014, 22, 1655–1660. [Google Scholar] [CrossRef]
- Brandes, E.A.; Zhang, G.; Vivekanandan, J. Experiments in rainfall estimation with a polarimetric radar in a subtropical environment. J. Appl. Meteorol. 2002, 41, 674–685. [Google Scholar] [CrossRef]
- Zhang, A.; Hu, J.; Chen, S. Statistical characteristics of raindrop size distribution in the monsoon season observed in southern China. Remote Sens. 2019, 11, 432. [Google Scholar] [CrossRef]
- Zhang, G.; Vivekanandan, J.; Brandes, E. A method for estimating rain rate and drop size distribution from polarimetric radar measurements. IEEE Trans. Geosci. Remote Sens. 2001, 39, 830–841. [Google Scholar] [CrossRef]
- Vivekanandan, J.; Zhang, G.; Brandes, E. Polarimetric radar estimators based on a constrained gamma drop size distribution model. J. Hydrometeorol. 2004, 43, 217–230. [Google Scholar] [CrossRef]
- Cao, Q.; Zhang, G.; Brandes, E. Analysis of video disdrometer and polarimetric radar data to characterize rain microphysics in Oklahoma. J. Appl. Meteorol. Climatol. 2008, 47, 2238–2255. [Google Scholar] [CrossRef]
- Tang, Q.; Xiao, H.; Guo, C. Characteristics of the raindrop size distributions and their retrieved polarimetric radar parameters in northern and southern China. Atmos. Res. 2014, 135–136, 59–75. [Google Scholar] [CrossRef]
- Atlas, D.; Ulbrich, C.W.; Marks, F.D. Systematic variation of drop size and radar-rainfall relations. J. Geophys. Res. 1999, 104, 6155–6169. [Google Scholar] [CrossRef]
- Ulbrich, C.W.; Atlas, D. Microphysics of raindrop size spectra: Tropical continental and maritime storms. J. Appl. Meteor. Climatol. 2007, 46, 1777–1791. [Google Scholar] [CrossRef]
- Huang, X.Y.; Yin, J.; Ma, L. Comprehensive statistical analysis of rain drop size distribution parameters and their application to weather radar measurement in Nanjin. Chin. J. Atmos. Sci. 2019, 43, 691–704. (In Chinese) [Google Scholar]
- Wu, Y.; Liu, L. Statistical characteristics of raindrop size distribution in the Tibetan Plateau and southern China. Adv. Atmos. Sci. 2017, 34, 727–736. [Google Scholar] [CrossRef]
- Marshall, J.S.; Palmer, W.M. The distribution of raindrops with size. J. Meteor. 1948, 5, 165–166. [Google Scholar] [CrossRef]
- Fulton, R.A.; Breidenbach, J.P.; Seo, D.-J. The WSR-88D Rainfall Algorithm. Weather. Forecast. 1998, 13, 377–395. [Google Scholar] [CrossRef]
- Cao, Q.; Zhang, G.; Brandes, E.A. Polarimetric radar rain estimation through retrieval of drop size distribution using a Bayesian approach. J. Appl. Meteorol. Climatol. 2010, 49, 973–990. [Google Scholar] [CrossRef]
- You, C.H.; Kang, M.; Lee, D. Rainfall estimation by S-band polarimetric radar in Korea. Part I: Preprocessing and preliminary results. Meteorol. Appl. 2014, 21, 975–983. [Google Scholar] [CrossRef]
- Wen, L.; Zhao, K.; Zhang, G. Statistical characteristics of raindrop size distributions observed in East China during the Asian summer monsoon season using 2-D video disdrometer and Micro Rain Radar data. J. Geophys. Res. Atmos. 2016, 121, 2265–2282. [Google Scholar] [CrossRef]
- Grecu, M.; Olson, W.S.; Munchak, S.J. The GPM combined algorithm. J. Atmos. Ocean. Technol. 2016, 33, 2225–2245. [Google Scholar] [CrossRef]
- Mardiana, R.; Iguchi, T.; Takahashi, N. A dual-frequency rain profiling algorithm without the use of the surface reference technique. IEEE Trans. Geosci. Remote Sens. 2004, 42, 2214–2225. [Google Scholar] [CrossRef]
- Liao, L.; Meneghini, R. A study of air/space-borne dual-wavelength radar for estimation of rain profiles. Adv. Atmos. Sci. 2005, 22, 841–851. [Google Scholar] [CrossRef]
- Le, M.; Chandrasekar, V. An algorithm for drop-size distribution retrieval from GPM dual-frequency precipitation radar. IEEE Trans. Geosci. Remote Sens. 2014, 52, 7170–7185. [Google Scholar] [CrossRef]
- Chandrasekar, V.; Biswas, S.K.; Le, M.; Chen, H.N. Cross validation of raindrop size distribution retrievals from GPM dual-frequency precipitation radar using ground-based polarimetric radar. In Proceedings of the IGARSS 2018-2018 IEEE International Geoscience and Remote Sensing Symposium, Valencia, Spain, 23–27 July 2018. [Google Scholar]
- Battaglia, A.; Kollias, P.; Dhillon, R.; Roy, R.; Tanelli, S.; Lamer, K. Spaceborne cloud and precipitation radars: Status, challenges, and ways forward. Rev. Geophys. 2020, 58, e2019RG000686. [Google Scholar] [CrossRef]
- Wischmeier, W.H.; Smith, D.D. Rainfall energy and its relationship to soil loss. Trans. Am. Geophys. Union 1958, 39, 285–291. [Google Scholar] [CrossRef]
- Fernández-Raga, M.; Fraile, R.; Keizer, J.J. The kinetic energy of rain measured with an optical disdrometer: An application to splash erosion. Atmos. Res. 2010, 96, 225–240. [Google Scholar] [CrossRef]
- Angulo-Martinez, M.; Barros, A.P. Measurement uncertainty in rainfall kinetic energy and intensity relationships for soil erosion studies: An evaluation using PARSIVEL disdrometers in the Southern Appalachian Mountains. Geomorphology 2015, 228, 28–40. [Google Scholar] [CrossRef]
- Nanko, K.; Moskalski, S.M.; Torres, R. Rainfall erosivity–intensity relationships for normal rainfall events and a tropical cyclone on the US southeast coast. J. Hydrol. 2016, 534, 440–450. [Google Scholar] [CrossRef]
- Carollo, F.G.; Serio, M.A.; Ferro, V.; Cerdà, A. Characterizing rainfall erosivity by kinetic power–Median volume diameter relationship. Catena 2018, 165, 12–21. [Google Scholar] [CrossRef]
- Skofronick-Jackson, G.; Petersen, W.A.; Berg, W.; Kidd, C.; Stocker, E.F.; Kirschbaum, D.B.; Kakar, R.; Braun, S.A.; Huffman, G.J.; Iguchi, T.; et al. The Global Precipitation Measurement (GPM) Mission for Science and Society. Bull. Am. Meteorol. Soc. 2017, 98, 1679–1695. [Google Scholar] [CrossRef]
- Zeng, Y.; Zhou, Y.S.; Yang, L.M. A preliminary analysis of the formation mechanism for a heavy rainstorm in western Xinjiang by numerical simulation. Chin. J. Atmos. Sci. 2019, 43, 372–388. (In Chinese) [Google Scholar]
- Huang, C.; Chen, S.; Zhang, A.; Pang, Y. Statistical characteristics of raindrop size distribution in monsoon season over South China Sea. Remote Sens. 2021, 13, 2878. [Google Scholar] [CrossRef]
- Raupach, T.H.; Thurai, M.; Bringi, V.N.; Berne, A. Reconstructing the drizzle mode of the raindrop size distribution using double-moment normalization. J. Appl. Meteorol. Clim. 2018, 58, 145–164. [Google Scholar] [CrossRef]
- Raupach, T.H.; Berne, A. Correction of raindrop size distributions measured by Parsivel disdrometers, using a two-dimensional video disdrometer as a reference. Atmos. Meas. Tech. 2015, 8, 343–365. [Google Scholar] [CrossRef]
- Thurai, M.; Gatlin, P.; Bringi, V.N.; Petersen, W.; Kennedy, P.; Notaroš, B.; Carey, L. Toward Completing the Raindrop Size Spectrum: Case Studies Involving 2D-Video Disdrometer, Droplet Spectrometer, and Polarimetric Radar Measurements. J. Appl. Meteorol. Climatol. 2017, 56, 877–896. [Google Scholar] [CrossRef]


| Parameters | R (mm h−1) | log10Nw (m−3 mm−1) | Dm (mm) | W (g m−3) | Z (dBZ) | μ | Λ (mm−1) |
|---|---|---|---|---|---|---|---|
| Mean | 1.61 | 3.48 | 1.13 | 0.09 | 21.52 | 9.58 | 14.34 |
| STD | 2.96 | 0.52 | 0.45 | 0.12 | 7.92 | 7.54 | 10.35 |
| Parameters | R (mm h−1) | log10Nw (m−3 mm−1) | Dm (mm) | W (g m−3) | Z (dBZ) | μ | Λ (mm−1) | |
|---|---|---|---|---|---|---|---|---|
| Convective | Mean | 13.57 | 3.44 | 2.11 | 0.56 | 40.22 | 4.75 | 4.85 |
| SD | 7.57 | 0.62 | 0.75 | 0.25 | 5.51 | 2.52 | 2.81 | |
| Stratiform | Mean | 1.97 | 3.77 | 1.13 | 0.12 | 25.67 | 5.90 | 9.84 |
| SD | 1.19 | 0.40 | 0.28 | 0.06 | 4.54 | 4.51 | 6.10 |
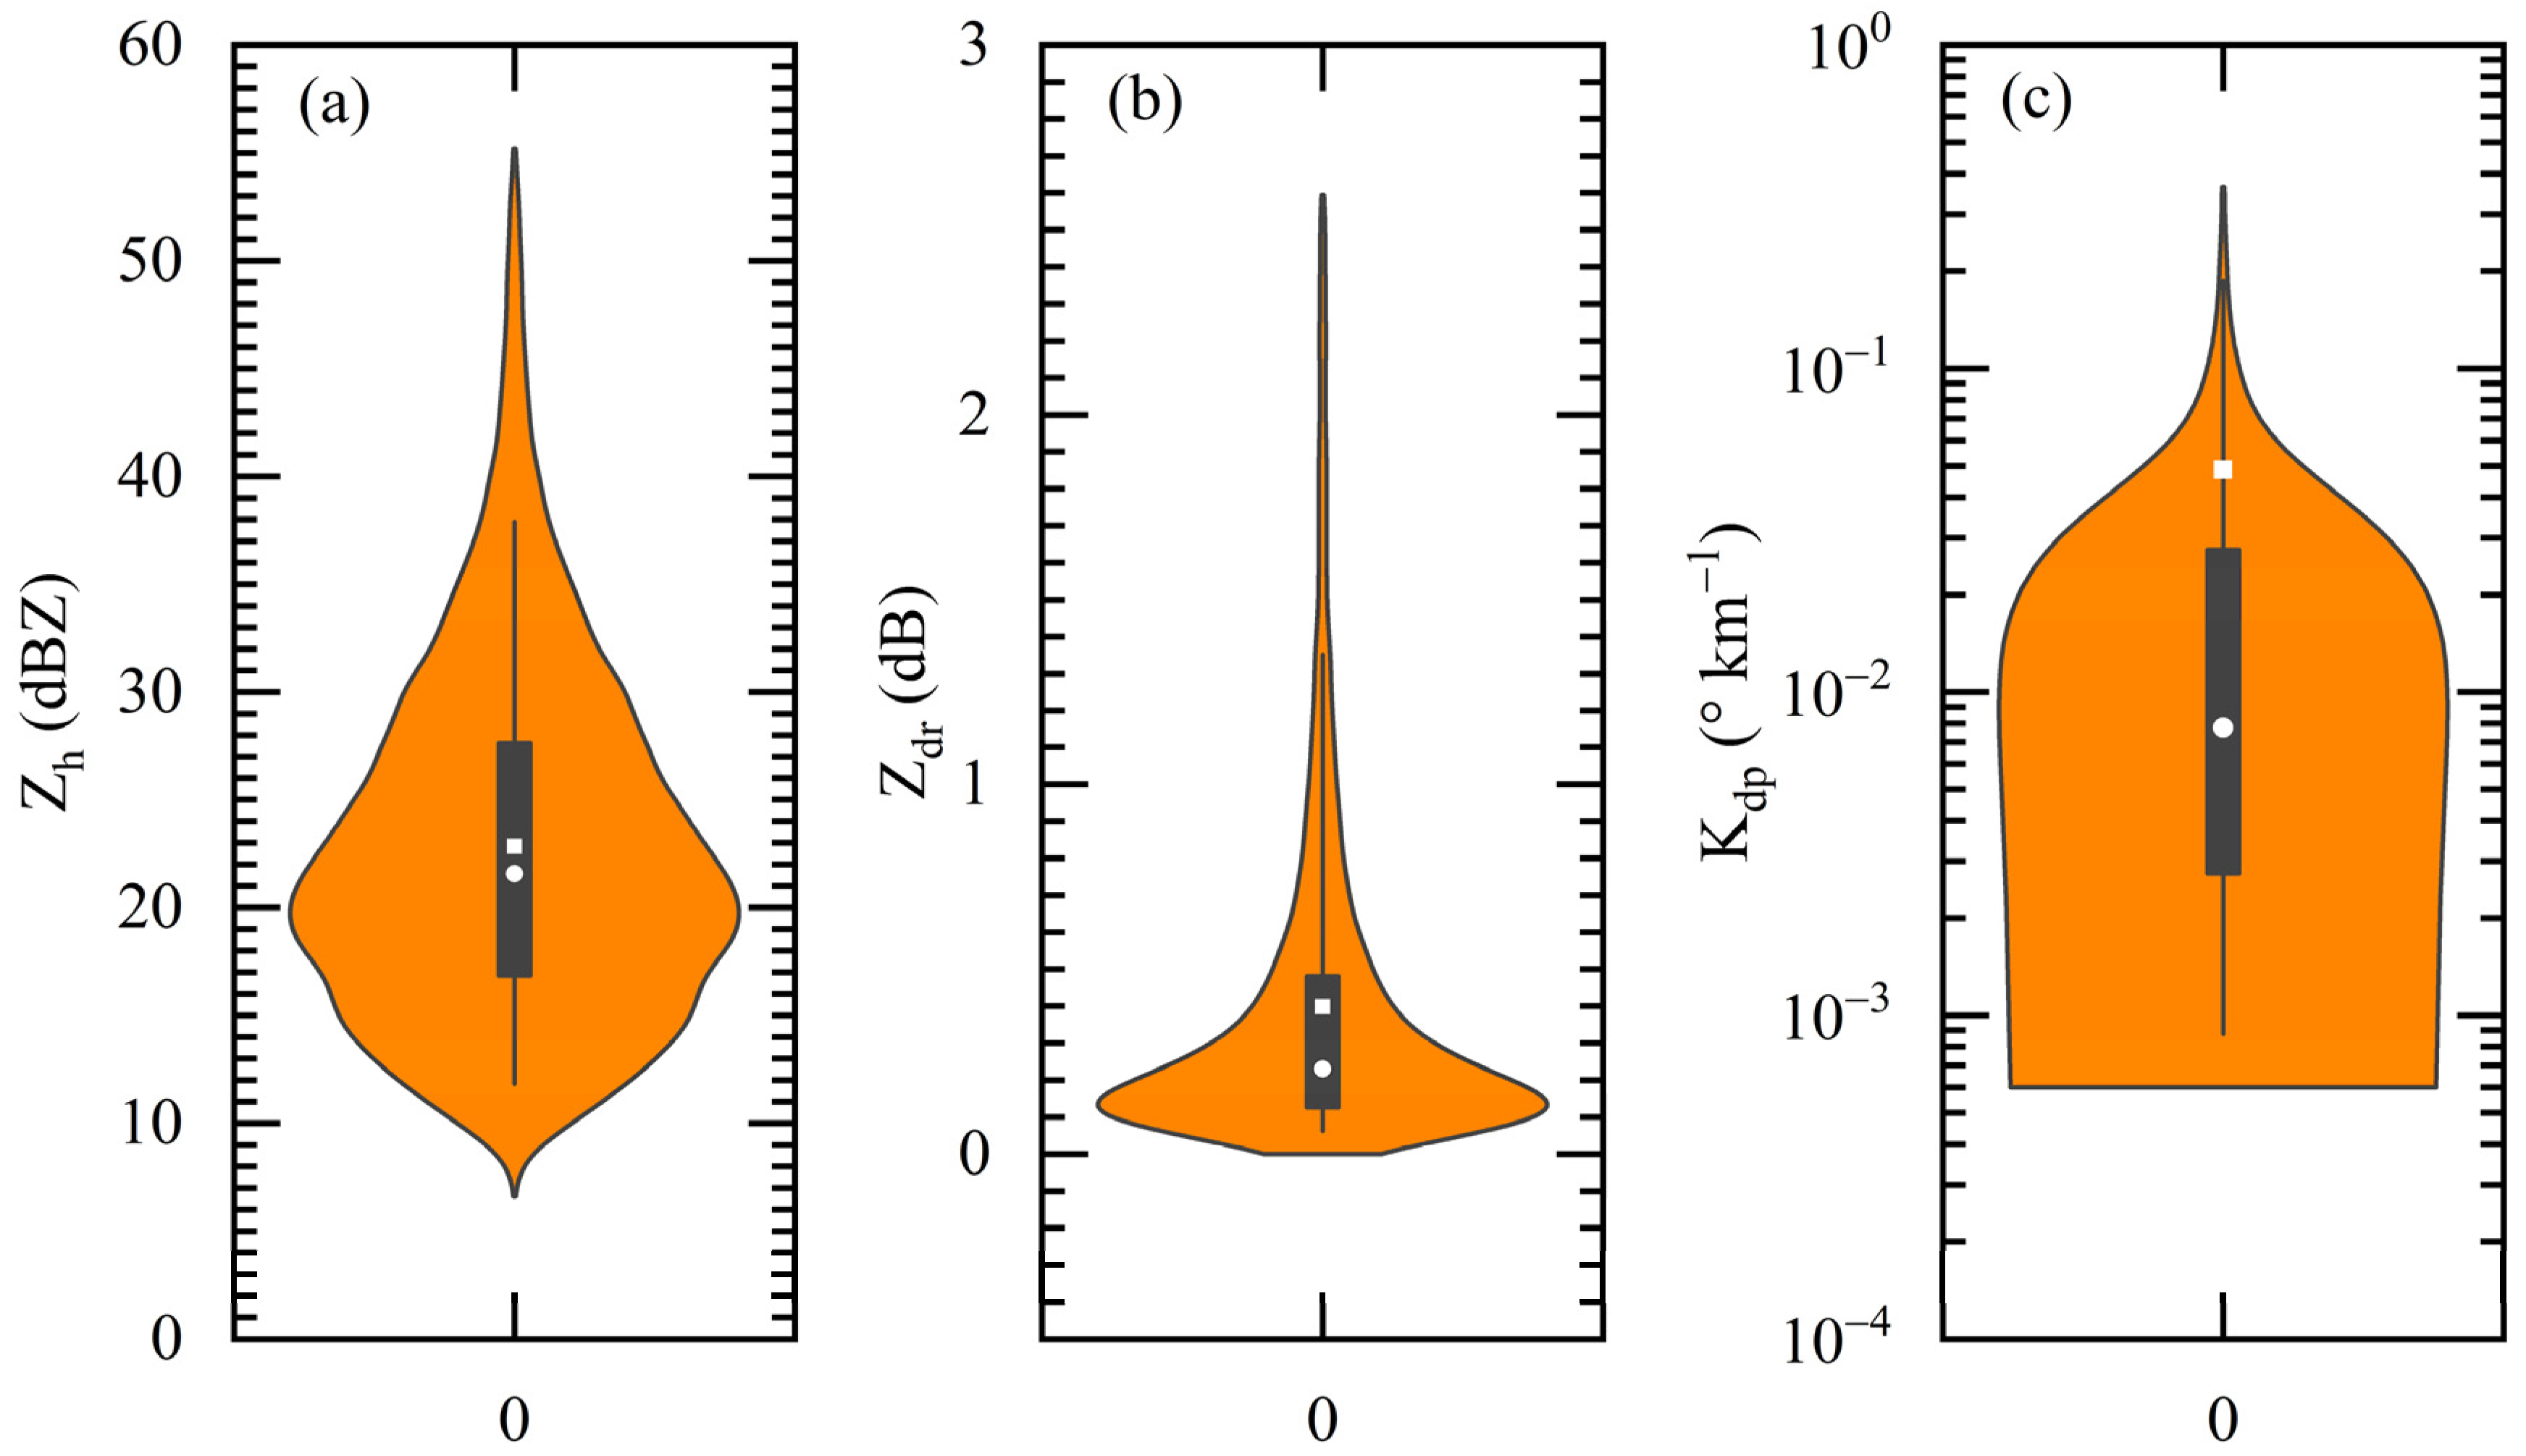
| Parameters | 5% | 25% | Median | 75% | 95% | Mean |
|---|---|---|---|---|---|---|
| Zh | 11.84 | 16.85 | 21.56 | 27.63 | 37.89 | 22.84 |
| Zdr | 0.06 | 0.13 | 0.23 | 0.48 | 1.35 | 0.40 |
| Kdp | 8.77 × 10⁻⁴ | 2.75 × 10⁻³ | 7.77 × 10⁻³ | 2.76 × 10⁻² | 1.86 × 10⁻¹ | 4.86 × 10⁻² |
Publisher’s Note: MDPI stays neutral with regard to jurisdictional claims in published maps and institutional affiliations. |
© 2022 by the authors. Licensee MDPI, Basel, Switzerland. This article is an open access article distributed under the terms and conditions of the Creative Commons Attribution (CC BY) license (https://creativecommons.org/licenses/by/4.0/).
Share and Cite
Zeng, Y.; Yang, L.; Tong, Z.; Jiang, Y.; Chen, P.; Zhou, Y. Characteristics and Applications of Summer Season Raindrop Size Distributions Based on a PARSIVEL2 Disdrometer in the Western Tianshan Mountains (China). Remote Sens. 2022, 14, 3988. https://doi.org/10.3390/rs14163988
Zeng Y, Yang L, Tong Z, Jiang Y, Chen P, Zhou Y. Characteristics and Applications of Summer Season Raindrop Size Distributions Based on a PARSIVEL2 Disdrometer in the Western Tianshan Mountains (China). Remote Sensing. 2022; 14(16):3988. https://doi.org/10.3390/rs14163988
Chicago/Turabian StyleZeng, Yong, Lianmei Yang, Zepeng Tong, Yufei Jiang, Ping Chen, and Yushu Zhou. 2022. "Characteristics and Applications of Summer Season Raindrop Size Distributions Based on a PARSIVEL2 Disdrometer in the Western Tianshan Mountains (China)" Remote Sensing 14, no. 16: 3988. https://doi.org/10.3390/rs14163988
APA StyleZeng, Y., Yang, L., Tong, Z., Jiang, Y., Chen, P., & Zhou, Y. (2022). Characteristics and Applications of Summer Season Raindrop Size Distributions Based on a PARSIVEL2 Disdrometer in the Western Tianshan Mountains (China). Remote Sensing, 14(16), 3988. https://doi.org/10.3390/rs14163988